Embed Size (px)
Citation preview
PALAEOZOIC PORPHYRY
MOLYBDENUM-TUNGSTEN DEPOSIT
IN THE MYSZKÓW AREA,
SOUTHERN POLAND
Scientific Editor: Maciej Podemski
Polish Geological Institute Special Papers, 6
WARSZAWA 2001

CONTENTS
Introduction — Maciej Podemski . . . . . . . . . . . . . . . . . . . . . . . . . . . . . . . . . . . . . . . . . . . . . . . . . . . . . . . 6
Geographic location — Maciej Podemski . . . . . . . . . . . . . . . . . . . . . . . . . . . . . . . . . . . . . . . . . . . . . . . . . . . 7
History of investigations — Maciej Podemski . . . . . . . . . . . . . . . . . . . . . . . . . . . . . . . . . . . . . . . . . . . . . . . . . 8
Results of the gravity and magnetic surveys — El¿bieta Cieœla, Stanis³aw Wybraniec . . . . . . . . . . . . . . . . . . . . . . . . . . . . 10
Regional gravity field . . . . . . . . . . . . . . . . . . . . . . . . . . . . . . . . . . . . . . . . . . . . . . . . . . . . . . . . . . 10
Regional magnetic field . . . . . . . . . . . . . . . . . . . . . . . . . . . . . . . . . . . . . . . . . . . . . . . . . . . . . . . . . 12
The Myszków–Wolbrom Zone . . . . . . . . . . . . . . . . . . . . . . . . . . . . . . . . . . . . . . . . . . . . . . . . . . . . . 12
Geologic setting — Zbigniew Bu³a, Marek Markowiak . . . . . . . . . . . . . . . . . . . . . . . . . . . . . . . . . . . . . . . . . . . 14
Precambrian and early Palaeozoic . . . . . . . . . . . . . . . . . . . . . . . . . . . . . . . . . . . . . . . . . . . . . . . . . . . 17Upper Silesian Block . . . . . . . . . . . . . . . . . . . . . . . . . . . . . . . . . . . . . . . . . . . . . . . . . . . . . . . . 17Ma³opolska Block . . . . . . . . . . . . . . . . . . . . . . . . . . . . . . . . . . . . . . . . . . . . . . . . . . . . . . . . . . 17
Late Palaeozoic . . . . . . . . . . . . . . . . . . . . . . . . . . . . . . . . . . . . . . . . . . . . . . . . . . . . . . . . . . . . . 18
Structural evolution of the Precambrian–Palaeozoic along the contact zone betweenUpper Silesian and Ma³opolska blocks — Jerzy ¯aba . . . . . . . . . . . . . . . . . . . . . . . . . . . . . . . . . . . . . . . . . 20
Tectonic deformation events . . . . . . . . . . . . . . . . . . . . . . . . . . . . . . . . . . . . . . . . . . . . . . . . . . . . . 20Structural evolution . . . . . . . . . . . . . . . . . . . . . . . . . . . . . . . . . . . . . . . . . . . . . . . . . . . . . . . . . 20Periods of increased strike-slip activity . . . . . . . . . . . . . . . . . . . . . . . . . . . . . . . . . . . . . . . . . . . . . . . 24Effects of tectonics on rocks in the Myszków area — Marek Markowiak . . . . . . . . . . . . . . . . . . . . . . . . . . . . . . 24
Metamorphic rocks — Ma³gorzata Truszel . . . . . . . . . . . . . . . . . . . . . . . . . . . . . . . . . . . . . . . . . . . . . . . . . 26
Effects of regional metamorphism . . . . . . . . . . . . . . . . . . . . . . . . . . . . . . . . . . . . . . . . . . . . . . . . . . . 26Phyllites and schists . . . . . . . . . . . . . . . . . . . . . . . . . . . . . . . . . . . . . . . . . . . . . . . . . . . . . . . . . 26Metapsammites . . . . . . . . . . . . . . . . . . . . . . . . . . . . . . . . . . . . . . . . . . . . . . . . . . . . . . . . . . . 28Chemical content of the regionally metamorphosed rocks . . . . . . . . . . . . . . . . . . . . . . . . . . . . . . . . . . . . . . 29
Effects of thermal and thermal-metasomatic metamorphism . . . . . . . . . . . . . . . . . . . . . . . . . . . . . . . . . . . . . . 30Hornfelses . . . . . . . . . . . . . . . . . . . . . . . . . . . . . . . . . . . . . . . . . . . . . . . . . . . . . . . . . . . . . . 30Skarns . . . . . . . . . . . . . . . . . . . . . . . . . . . . . . . . . . . . . . . . . . . . . . . . . . . . . . . . . . . . . . . . 30Metasomatites . . . . . . . . . . . . . . . . . . . . . . . . . . . . . . . . . . . . . . . . . . . . . . . . . . . . . . . . . . . . 31
Magmatic rock — Jolanta Markiewicz. . . . . . . . . . . . . . . . . . . . . . . . . . . . . . . . . . . . . . . . . . . . . . . . . . . . 31
Granitoids and dacitoids. . . . . . . . . . . . . . . . . . . . . . . . . . . . . . . . . . . . . . . . . . . . . . . . . . . . . . . . . 32
Trachyandesites and lamprophyres . . . . . . . . . . . . . . . . . . . . . . . . . . . . . . . . . . . . . . . . . . . . . . . . . . . 38
Magmatic and postmagmatic fluids — £ukasz Karwowski . . . . . . . . . . . . . . . . . . . . . . . . . . . . . . . . . . . . . . . 38Magmatic fluids . . . . . . . . . . . . . . . . . . . . . . . . . . . . . . . . . . . . . . . . . . . . . . . . . . . . . . . . . . . 39Postmagmatic fluids . . . . . . . . . . . . . . . . . . . . . . . . . . . . . . . . . . . . . . . . . . . . . . . . . . . . . . . . . 40Pressure conditions . . . . . . . . . . . . . . . . . . . . . . . . . . . . . . . . . . . . . . . . . . . . . . . . . . . . . . . . . 42
Mineralogical characteristics of the mineralisation — Jadwiga Œlósarz . . . . . . . . . . . . . . . . . . . . . . . . . . . . . . . . . . . 43
Period I — early, skarn forming . . . . . . . . . . . . . . . . . . . . . . . . . . . . . . . . . . . . . . . . . . . . . . . . . . . . 44
Period II — main, hydrothermal . . . . . . . . . . . . . . . . . . . . . . . . . . . . . . . . . . . . . . . . . . . . . . . . . . . . 44Feldspar-molybdenite veins, with biotite. . . . . . . . . . . . . . . . . . . . . . . . . . . . . . . . . . . . . . . . . . . . . . . 46Quartz-feldspathic, pegmatitic veins . . . . . . . . . . . . . . . . . . . . . . . . . . . . . . . . . . . . . . . . . . . . . . . . . 46Quartz veins, with molybdenite and scheelite . . . . . . . . . . . . . . . . . . . . . . . . . . . . . . . . . . . . . . . . . . . . 46Black quartz veins, with molybdenite . . . . . . . . . . . . . . . . . . . . . . . . . . . . . . . . . . . . . . . . . . . . . . . . 46Quartz-polymetallic veins . . . . . . . . . . . . . . . . . . . . . . . . . . . . . . . . . . . . . . . . . . . . . . . . . . . . . . 47
Period III — late, post-mineralisation. . . . . . . . . . . . . . . . . . . . . . . . . . . . . . . . . . . . . . . . . . . . . . . . . . 47
Geochemical characteristics of the principal ore minerals . . . . . . . . . . . . . . . . . . . . . . . . . . . . . . . . . . . . . . . 50
Geochemical characteristics of the mineralised area — Maurice A. Chaffee, Krzysztof Lasoñ, Robert Eppinger . . . . . . . . . . . . . . . 53
Collection, preparation, and analyses of geochemical samples . . . . . . . . . . . . . . . . . . . . . . . . . . . . . . . . . . . . . 53
Statistical evaluation of the analyses . . . . . . . . . . . . . . . . . . . . . . . . . . . . . . . . . . . . . . . . . . . . . . . . . . 54Factor analyses . . . . . . . . . . . . . . . . . . . . . . . . . . . . . . . . . . . . . . . . . . . . . . . . . . . . . . . . . . . 54Discussion of variables related to the Myszków mineralisation . . . . . . . . . . . . . . . . . . . . . . . . . . . . . . . . . . . 58
Distributions of selected variables on cross-sections . . . . . . . . . . . . . . . . . . . . . . . . . . . . . . . . . . . . . . . . . . 59Factor 1 — elements related to lithology. . . . . . . . . . . . . . . . . . . . . . . . . . . . . . . . . . . . . . . . . . . . . . . 59Factor 2 — elements related to major sulphide mineralisation . . . . . . . . . . . . . . . . . . . . . . . . . . . . . . . . . . . . 59Factor 3 — elements related to potassic metasomatism . . . . . . . . . . . . . . . . . . . . . . . . . . . . . . . . . . . . . . . 59Factor 4 — elements related to base-metal mineralisation . . . . . . . . . . . . . . . . . . . . . . . . . . . . . . . . . . . . . . 59Factor 5 — elements related to felsic intrusive rock-associated mineralisation. . . . . . . . . . . . . . . . . . . . . . . . . . . . 66Factor 6 — elements of largely undefined affinity . . . . . . . . . . . . . . . . . . . . . . . . . . . . . . . . . . . . . . . . . . 66
Distribution of selected variables on the 300-m and 700-m levels . . . . . . . . . . . . . . . . . . . . . . . . . . . . . . . . . . . 68
Geochemical patterns and path-finders of the Myszków mineralisation — Krzysztof Lasoñ . . . . . . . . . . . . . . . . . . . . . 69
The spatial distribution of the mineralisation — Marek Markowiak, Ryszard Habryn . . . . . . . . . . . . . . . . . . . . . . . . . . . . 71
Sampling and chemical analyses of cores from boreholes . . . . . . . . . . . . . . . . . . . . . . . . . . . . . . . . . . . . . . . 71
Vertical zoning of the mineralisation . . . . . . . . . . . . . . . . . . . . . . . . . . . . . . . . . . . . . . . . . . . . . . . . . . 72
Lateral zoning of the mineralisation . . . . . . . . . . . . . . . . . . . . . . . . . . . . . . . . . . . . . . . . . . . . . . . . . . 76
Model and genesis of the mineralisation — Marek Markowiak, Maurice A. Chaffee, £ukasz Karwowski, Jolanta Markiewicz . . . . . . . 77
Age of the mineralisation — Marek Markowiak, Lawrence W. Snee, Maurice A. Chaffee, £ukasz Karwowski. . . . . . . . . . . . . . . . 78
Comparison of the Myszków deposit to other porphyry deposits — Marek Markowiak, Maurice A. Chaffee, £ukasz Karwowski,Jolanta Markiewicz . . . . . . . . . . . . . . . . . . . . . . . . . . . . . . . . . . . . . . . . . . . . . . . . . . . . . . . . . . . . . 80
Recommendations for further studies — Marek Markowiak, Maurice A. Chaffee, Maciej Podemski. . . . . . . . . . . . . . . . . . . . . 81
Summary and conclusions — Marek Markowiak, Maurice A. Chaffee, Maciej Podemski, Ma³gorzata Truszel . . . . . . . . . . . . . . . 81
References . . . . . . . . . . . . . . . . . . . . . . . . . . . . . . . . . . . . . . . . . . . . . . . . . . . . . . . . . . . . . . . . . . 82
4
Podemski M. Ed., 2001 — Palaeozoic porphyry molybdenum–tungsten deposit in the Myszków area, southern Poland. Polish Geologi-
cal Institute Special Papers, 6: 1–88.
Maciej Podemski, Polish Geological Institute, Rakowiecka 4, PL-00-975 Warszawa, Poland. E-mail: [email protected]
Abstract. The Myszków porphyry molybdenum-tungsten deposit is one of several porphyry copper-type deposits that havebeen identified within a poorly defined belt of Precambrian to Palaeozoic rocks in south-central Poland. It is in a complex ofProterozoic (Vendian) to early Palaeozoic (Early Cambrian)-aged metasedimentary rocks that was intruded by a predomi-nantly granodioritic pluton. The intrusive rocks and associated mineralisation phases are Late Carboniferous age, a time ofporphyry-copper deposit formation not known to be present elsewhere in Europe.
The chemistry, mineralogy, and vein morphology of the Myszków mineralisation are similar to calc-alkaline-associatedporphyry copper deposits. The deposit at Myszków consists mainly of stockwork veins; skarn minerals are uncommon. Sev-eral substages of mineral deposition have been identified in the Myszków area, five of which are closely related to formationof this porphyry deposit. The results of a factor analyses determined for analyses run on samples of drill core support the con-cept of multiple stages of mineralisation at Myszków.
The Myszków deposit is strongly enriched in Cu and Mo but contains very little gold. In comparison to other calc-alka-line-type porphyry Cu deposits, this deposit also contains an unusually high concentration of tungsten, particularly in the min-eralised part of the stock. Therefore, the Myszków mineralisation can best be described as representing a rather unique,porphyry molybdenum-tungsten type of deposit.
Overall, the mineralisation at Myszków exhibits typical mineralogy for the deeper parts of a porphyry Cu system. Thus, itmay be concluded that the upper (perhaps significant) part of this deposit was removed by rapid erosion that was followed byrapid burial of the erosion surface by a sequence of Triassic marine rocks. More complete deposits of this type which might alsocontain supergene enrichment zones, could be present in down-faulted blocks in other parts of the Kraków–Lubliniec region.
Key words: porphyry molybdenum-tungsten deposit, Palaeozoic porphyry copper-type deposit, magmatic and postmagmatic fluids, mineralzoning, geochemical zoning, factor analyses, mineralisation model, genesis of mineralisation.
Abstrakt. Porfirowe z³o¿e molibdenowo-wolframowe w Myszkowie jest jednym z szeregu z³ó¿ miedziowo-porfiro-wych odkrytych w po³udniowej Polsce, w s³abo rozpoznanej strefie ska³ prekambryjsko-paleozoicznych obszaru Kraków–Lub-liniec. Z³o¿e myszkowskie wystêpuje w kompleksie s³abo zmetamorfizowanych ska³ proterozoiczno (wend)–dolnopaleo-zoicznych (dolny kambr), intrudowanych przez ska³y magmowe, g³ównie granodiorytowe. Wiek ska³ magmowych oraz mi-neralizacji kruszcowej okreœlony zosta³ na górny karbon. Warto podkreœliæ, i¿ w Europie nie s¹ znane inne z³o¿amiedziowo-porfirowe tego wieku.
Zarówno sk³ad chemiczny i mineralogiczny mineralizacji kruszcowej z³o¿a w Myszkowie, jak i wystêpuj¹ce w nim ro-dzaje u¿ylenia, s¹ charakterystyczne dla z³ó¿ miedziowo-porfirowych, zwi¹zanych z wapniowo-alkalicznymi masywamimagmowymi. Z³o¿e myszkowskie zbudowane jest g³ównie z ¿y³ o charakterze sztokwerku. Rzadsze s¹ minera³y skarnowe.Wyró¿niono w nim kilka stadiów mineralizacji kruszcowej. Piêæ z nich zwi¹zanych jest œciœle z powstaniem z³o¿a porfirowe-go. Hipoteza wielostadialnej genezy mineralizacji myszkowskiej wsparta zosta³a wynikami analizy czynnikowej danych po-chodz¹cych z badañ geochemicznych wybranych rdzeni wiertniczych.
Z³o¿e w Myszkowie jest wzbogacone w Cu i Mo, natomiast jest bardzo ubogie w Au. W porównaniu z innymi z³o¿amimiedziowo-porfirowymi, zwi¹zanymi z masywami wapniowo-alkalicznymi, z³o¿e w Myszkowie jest niezwykle wzbogaco-
Polish Geological Institute Special Papers, 6 (2001): 1–88
ne w wolfram. Dlatego uznano, ¿e reprezentuje ono unikatowy typ z³o¿a porfirowego: molibdenowo-wolframowy.Ogólnie bior¹c, sk³ad mineralny oraz mineralizacja kruszcowa z³o¿a myszkowskiego s¹ charakterystyczne dla g³êbszych
partii z³ó¿ miedziowo-porfirowych. Nie mo¿na wiêc wykluczyæ, ¿e górna czêœæ z³o¿a myszkowskiego, byæ mo¿e najbogat-sza w mineralizacjê kruszcow¹, zosta³a miêdzy górnym karbonem a triasem usuniêta przez erozjê. W obni¿onych czêœciachobszaru Kraków–Lubliniec mog³y jednak zachowaæ siê inne, pe³niejsze z³o¿a typu myszkowskiego, byæ mo¿e posiadaj¹cenawet wzbogacon¹ strefê wietrzeniow¹.
S³owa kluczowe: porfirowe z³o¿e molibdenowo-wolframowe, paleozoiczne z³o¿e typu miedziowo-porfirowego, fluidy magmowe i pomag-mowe, strefowoœæ mineralna, strefowoœæ geochemiczna, analiza czynnikowa, model mineralizacji, geneza mineralizacji.
INTRODUCTION
Metallic ores have been mined for centuries along thenorth-eastern border of the Upper Silesian Coal Basin, alsoknown as the Kraków–Lubliniec region. Until the late 1950’s,prospecting for and mining of these ores were primarily done inshallow, Mesozoic-aged rocks. Deposits mined in these rocksincluded siderite ores in Jurassic host rocks and silver-rich,Pb-Zn sulphide ores in Triassic host rocks.
After the World War II, intensive prospecting for TriassicPb-Zn ore deposits was conducted in Poland. In the mid 1950’s,subeconomic mineralisation was discovered in locally meta-morphosed, Precambrian to early Palaeozoic rocks below athick sequence of flat-lying, Mesozoic rocks. In some areas,these metamorphosed, sedimentary rocks were intruded by fel-sic igneous magmatic rocks.
The increasing amount of geological information on thesePrecambrian to Palaeozoic mineralised rocks along the north--eastern border of the Upper Silesian Coal Basin has graduallyencouraged an interest by both the Polish geological commu-nity and the State authorities in the mineral potential of that re-gion, especially near areas intruded by magmatic rocks. In thesecond half of the 1970’s, prospecting began in this region fol-lowed in the 1980’s by intensive exploration.
Numerous geophysical and geological investigations wereconducted, first by the Polish Geological Institute (PañstwowyInstytut Geologiczny), which at that time was called the Geo-logical Institute of the Central Geological Board (InstytutGeologiczny Centralnego Urzêdu Geologii), and by the Geo-logical Enterprise in Kraków (Przedsiêbiorstwo Geologicznew Krakowie), which in the 1970’s was also monitored by theCentral Geological Board. Those intensive investigations pro-duced discoveries of polymetallic (copper, molybdenum, tung-sten, lead and zinc) mineralisation in several areas (Myszków,Zawiercie, Pilica, Dolina Bêdkowska) along the north-easternborder of the Upper Silesian Coal Basin. These discoverieswere regarded as being partly porphyry-copper-type minerali-sation and partly skarn-type. In the course of the investigations,the possible sedimentary-remobilization origin of these depos-its was also suggested.
The mineralisation found in the vicinity of Myszków wasregarded as the most interesting discovery. The presence ofa substantial amount of molybdenite suggested the occurrence
of a Mo deposit at a time when molybdenum was in high de-mand and no deposits of this type were known to exist in Po-land. Therefore, in the second half of the 1980’s, explorationactivities were concentrated in the Myszków area.
Those activities abruptly stopped at the end of eighties,caused both by a sharp drop in Mo, W, and Cu prices on theworld market and by the dramatic change in 1989 of the politi-cal system in Poland. The geological data and economic as-pects of the exploration work carried out in Myszków area weresummarised in 1993 in a prefeasibility-type report that in-cluded a preliminary ore reserves estimate classed in the PolishC2 category.
This publication summarises the results of investigations ofthe polymetallic mineralisation found in the Myszków area. In-formation to date has been contained only in numerous unpub-lished reports and/or in publications (mostly in Polish) thatcovered selected geological aspects only.
This publication also contains a discussion of the geologyof the Kraków–Lubliniec region (the north-eastern border ofthe Upper Silesian Coal Basin), and, in particular, the geologyof the contact zone between two Precambrian to Palaeozoicgeotectonic blocks: the Upper Silesian Block and the Ma³o-polska Block. Knowledge of the geology of this zone is essen-tial for understanding the genesis and spatial distribution of theMyszków mineralisation.
This publication includes also results of new research on thegeochemistry and age of the Myszków deposit, conducted in themid 1990’s by a team of scientists from the Polish Geological In-stitute and the United States Geological Survey, under a Pol-ish-American, Maria Sk³odowska-Curie Fund II project.
The Myszków deposit, classified as a porphyry molybde-num-tungsten type, is probably unique for European depositsboth for its type of mineralisation and for its Late Carbonifer-ous age.
The frequent occurrence in the Kraków–Lubliniec region,in the Precambrian (Vendian) to early Palaeozoic (Early Cam-brian) sedimentary rocks, of intrusive rocks and associatedpolymetallic mineralisation, suggests the possibility of the ex-istence of additional porphyry Myszków-type deposits in thecontact zone between the Upper Silesian and Ma³opolskablocks.
6 Introduction
GEOGRAPHIC LOCATION
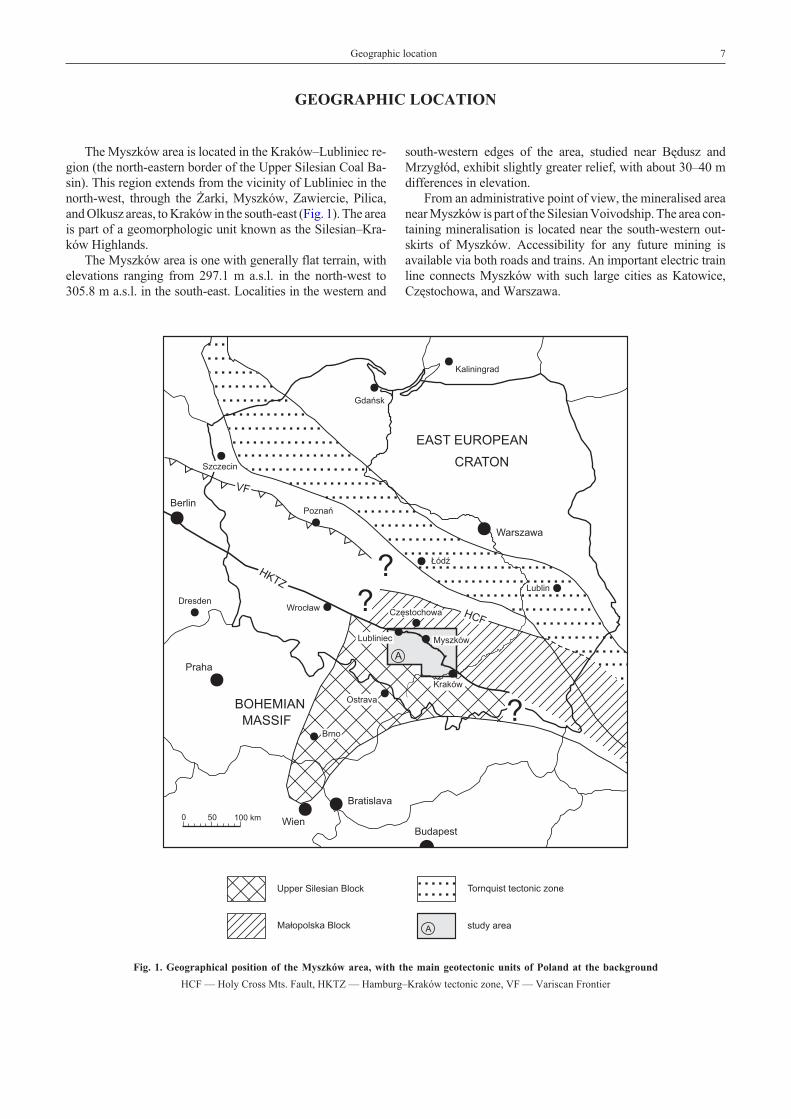
The Myszków area is located in the Kraków–Lubliniec re-gion (the north-eastern border of the Upper Silesian Coal Ba-sin). This region extends from the vicinity of Lubliniec in thenorth-west, through the ¯arki, Myszków, Zawiercie, Pilica,and Olkusz areas, to Kraków in the south-east (Fig. 1). The areais part of a geomorphologic unit known as the Silesian–Kra-ków Highlands.
The Myszków area is one with generally flat terrain, withelevations ranging from 297.1 m a.s.l. in the north-west to305.8 m a.s.l. in the south-east. Localities in the western and
south-western edges of the area, studied near Bêdusz andMrzyg³ód, exhibit slightly greater relief, with about 30–40 mdifferences in elevation.
From an administrative point of view, the mineralised areanear Myszków is part of the Silesian Voivodship. The area con-taining mineralisation is located near the south-western out-skirts of Myszków. Accessibility for any future mining isavailable via both roads and trains. An important electric trainline connects Myszków with such large cities as Katowice,Czêstochowa, and Warszawa.
Geographic location 7
Fig. 1. Geographical position of the Myszków area, with the main geotectonic units of Poland at the background
HCF — Holy Cross Mts. Fault, HKTZ — Hamburg–Kraków tectonic zone, VF — Variscan Frontier
HISTORY OF INVESTIGATIONS
The first studies of the polymetallic mineralisation in thePalaeozoic rocks along the north-eastern border of the UpperSilesian Coal Basin (the Kraków–Lubliniec region) wereconducted between 1954 and 1957 by the Polish GeologicalInstitute (formerly the Geological Institute of the CentralGeological Board). At that time, boreholes were drilled nearMrzyg³ód and Kotowice. The boreholes were drilled to investi-gate the regional geological structures, including the source ofthe Mrzyg³ód, Krzywop³oty, and Bêb³o magnetic anomaliesthat were discovered during a regional geophysical survey(Skorupa, 1953).
Several of these early boreholes penetrated below the Tri-assic sequence and found, for the first time, at depths of288–500 m, a complex of dark, slightly metamorphosed schiststhat were cut by numerous apophyses and dikes of porphyries,diabases, and keratophyres, all of which contained weak pyriticmineralisation with traces of copper, lead and zinc minerals.The age of that complex was at that time considered to be EarlyCarboniferous (Ekiert, 1957), and the mineral showings werenot considered to be of economic interest.
The discovery in borehole M-9 Mrzyg³ód of Siluriangraptolite fauna within the metamorphic schists (Siedlecki,1962) was very important because it demonstrated that theschists were, in fact, early Palaeozoic in age. Based on that dis-covery, Siedlecki confirmed that, in addition to already knownthe Devonian hypothetical Dêbnik–Siewierz ridge, there ex-isted another zone of the early Palaeozoic rocks. He named thezone: Kraków–Mrzyg³ód zone.
The differences of opinion about the geological structureof the Palaeozoic basement in the Kraków–Lubliniec regiongenerally continue to this day. Several geologists (Bukowy,1964a, b, 1984, 1994; Ekiert, 1971; Harañczyk, 1982a, b;Piekarski, 1982b; Znosko, 1965, 1983) regarded the Palaeo-zoic complex as a lateral extension of the Variscan orogen(Kraków branch of the Variscides) or as a part of the Caledo-nian orogen (so-called Krakovides). On the other hand, Po¿a-ryski and Kotañski (1979) considered the complex to be theCaledonian–Variscan Kraków aulacogen, and Harañczyk(1994a, b) considered it a part of the Lubliniec–Zawier-cie–Wieluñ terrane.
Other authors (Bogacz, 1980; Brochwicz-Lewiñski et al.,1983; Harañczyk, 1988; Kotas, 1982, 1985; Po¿aryski, 1990;Po¿aryski et al., 1992) suggested that a wide deep fracturezone might be present in the Kraków–Lubliniec region andthat this zone forms a boundary between the Upper Silesianand Ma³opolska blocks (? massifs, terranes). This view hasbeen confirmed by the latest lithostratigraphic and tectonicstudies of the Precambrian to early Palaeozoic formations inthe area, as well as by gravity and magnetic data (Bu³a, 1994,2000; Bu³a and Jachowicz, 1996; Bu³a et al., 1997; Bu³a et al.,unpubl. report, 1996; ¯aba, 1995, 1996b, 1999). These authorshave supported the hypothesis that there is a major structuralcontact that is present between the Upper Silesian and Ma³o-polska blocks, along the Kraków–Lubliniec tectonic zone, andis about 0.5 km wide (Fig. 1).
Znosko (1964) was the first to report that subvolcanicrocks, encountered in the Mrzyg³ód area and their associatedhydrothermal mineralisation, were the end products of mag-matic processes resulted from a deep seated, hidden, granitoidbatholith. This author also suggested that prospecting drillingin the apical part of the hypothetical batholith be done.
In 1965, borehole 1-P was drilled to a depth of 1003.4 m inorder to test Znosko’s hypothesis. This hole penetrated a thickseries of Silurian (?) and probable Ordovician schists that werecut by numerous porphyritic and microgranitic dikes contain-ing traces of pyrite and copper mineralisation that were gener-ally similar to other mineral occurrences in the Mrzyg³ód area.Information from borehole 1-P and other deep holes, drilled atthe same time in that area, generally confirmed the sub-economic mineral potential of the early Palaeozoic meta-morphic rocks in the Silesian–Kraków region (Bukowy andŒlósarz, 1968). The mineral potential of the Devonian andEarly Carboniferous carbonate rocks was regarded more opti-mistically.
Piekarski (Piekarski, 1971a; Banaœ et al., 1972) describeda different view of the mineral potential of the early Palaeozoicrocks in the Silesian–Kraków region. As a result of the discov-ery in 1968 and 1969, in a borehole near Lubliniec, of thesyngenetic copper and siderite-manganese intercalations in theclayey Silurian sedimentary rocks (Piekarski, 1971b), and theadditional discovery in 1969 of copper and molybdenum min-eralisation in metamorphic schist and granitoid intrusions inthe Myszków area, Piekarski concluded that a high economicpotential might be present for deposits of these types. He fur-ther concluded that an older, syngenetic, disseminated form ofmineralisation existed in the clayey sedimentary rocks, and thatthis mineralisation was remobilized during metamorphic pro-cesses, primarily by meteoric water, and redeposited in theneighbouring magmatic rocks. However, at the time Piekarskiwrote this report, the limited available geological data was in-sufficient to solve the issue of the origin of all the types of ob-served mineralisation.
In 1972, the Central Geological Board approved a drillingprogram for the Myszków area that consisted of seven bore-holes to test Piekarski’s hypotheses (Piekarski, unpubl. report,1970). These boreholes were drilled between 1972 and 1975.Several horizons of dark schists containing traces of pyrite andcopper minerals, as well as polymetallic mineralisation, wereidentified within the early Palaeozoic sequence. Numerousporphyry and granitoid intrusions were encountered in bore-hole Pz-5, at a depth of 701 m. Several intervals at this depthcontained copper, molybdenum, and tungsten minerals inmineralised zones that were as much as a few metres thick.Analyses for these mineralised zones yielded 0.15–3.5% Cu,0.02–0.95% Mo, and 0.05–0.3% W. These results confirmedthe value of systematic prospecting in the Myszków area.
Poor knowledge of the basement geology of the entireKraków–Lubliniec region was at one point the main obstacle toany prospecting activity in that area. Therefore, to better delin-eate favourable mineralised formations and areas, a program
8 History of investigations
that included complementary basic research on early Palaeozoiclithology, stratigraphy and geologic structure was undertakenbetween 1975 and 1978. At the same time, some surface mag-netic and gravity geophysical surveys were conducted in thePoraj–Mrzyg³ód area, and 12 shallow boreholes were alsodrilled (Piekarski et al., unpubl. report, 1979).
The results of those investigations produced a new geologi-cal model of the Mesozoic basement in the Myszków–Mrzy-g³ód area. For the first time, Ordovician and earliest Siluriandeposits in that region could be separated by using new palae-ontologic and lithologic data (Piekarski and Siewniak-Witruk,1978). That knowledge was crucial for more precisely deter-mining the stratigraphic position of various mineral discoveries.
After 1978, several new mineralised areas, with differentmineral suites and probably also with different sources, werediscovered. A new Pb-Zn ore association was also identified(Piekarski et al., 1982). However, two different hypothesesconcerning genesis of the Cu-Mo mineralisation still existed.The first one regarded the Myszków deposit as being a por-phyry copper type because the hydrothermal alteration andzonal distribution seemed to be typical for this type of deposit(Œlósarz, 1982). The second one suggested that all of the miner-alisation resulted from sedimentary-remobilization processes(Piekarski, 1982a).
In his 1982 paper, Piekarski (1982a) suggested that the hy-drothermal solutions had a greater influence on the genesis ofore mineral concentrations than previously believed becausehis new investigations proved that ore elements did not showany signs of remobilization in the metamorphosed schists.Piekarski also thought that the hydrothermal solutions leachedsome metals (mainly Cu and Mo) from the schists, and concen-trated them in the magmatic rocks and in the feldspathic veinmetasomatites. That process helped to explain the concentra-tions of molybdenum veins in those parts of the granitoids andporphyries that had cut the early Palaeozoic schists, and thelack of molybdenum veins in the rhyodacite or micrograniticporphyries that do not occur in the schists.
In the 1980’s, prospecting and exploration was conductedin the vicinity of Myszków for Pb-Zn mineralisation in Triassicstrata. This work produced much new information about geo-logical structure in the Precambrian to early Palaeozoic rocksin the area. Boreholes drilled for Triassic Pb-Zn deposits werealso designed to provide information on the pre-Triassic base-ment. As a result, these holes penetrated basement for distancesbetween several metres and a few hundred metres. Some ofthese holes encountered polymetallic mineralisation in thebasement rocks (Wielgomas et al., unpubl. reports, 1986,1988).
The ore-bearing granite and porphyry intrusions still re-mained the most important prospecting targets. Within theearly Palaeozoic sedimentary rocks, the important ore-bearingformations include the Early Silurian (Llandoverian–EarlyLudlovian) sequence of dark, clayey and clayey-carbonaticschists, which contain weak, Cu-pyrite and Cu-Mo mineral-isation, and the Middle and Late Ordovician clayey andcarbonatic sedimentary rocks, which contain Cu-pyrite andpolymetallic skarn mineralisation.
By the end of the 1970’s, the large, positive magneticanomalies were thought to identify areas where the ore-bearing
formations occurred at very shallow depth and, therefore, wereconsidered to be promising targets for mineral prospecting.The Myszków, Bêb³o, and Krzywop³oty anomalies were re-garded as the most favourable locations for potential mineraldeposits. In addition, most of the ore-bearing granite and por-phyry intrusions were found to be located within uplifted Cal-edonian structures.
In 1979, a new mineral prospecting program began. Thisprogram concentrated on the early Palaeozoic rocks in thePoraj–Mrzyg³ód area (Piekarski et al., unpubl. report, 1979)and included detailed exploration of the Mrzyg³ód geophysicalanomaly, and reconnaissance work over the smaller Poraj andKotowice magnetic anomalies. As part of this program, sixboreholes were drilled to depths of 1200 m in the Mysz-ków–Mrzyg³ód area.
Information derived from cores from those six boreholes,which were drilled between 1982 and 1987, proved to be veryinteresting. Several zones of polymetallic mineralisation wereencountered. Five of the holes contained the thickest and therichest zones of ore minerals found to date along the north-east-ern border of the Upper Silesian Coal Basin (Piekarski, 1988).Copper, molybdenum, and tungsten mineralisation was foundin the metamorphic schists, metasomatites, porphyries, andgranites. Boreholes Pz-17, Pz-28, Pz-29, and Pz-31 were espe-cially interesting. The highest concentrations of metals (2.55%Cu, 0.89% Mo, and 1.12% W) were encountered in those bore-holes. All these boreholes were stopped at depths of 1250 m,being still in the mineralised granitoid rocks.
Using the new data from the six boreholes, Piekarski(1988) was able to distinguish several different types of min-eralisation. He recognised that the Cu-pyrite and Cu-Mo min-eralisation that occurred in the dark, metamorphic schistcomplex, was probably syngenetic, sedimentary in origin.The weak, chalcopyrite-pyrite mineralisation that was dis-seminated in the porphyries and granitoids, was judged to beof magmatic origin, and classified as a porphyry copper-typedeposit. The Cu-pyrite mineralisation, which is sometimesassociated with molybdenite and magnetite and is located inthe older quartz-chlorite veins that cut dark metamorphicschists and graywackes, he recognised as associated with re-gional and/or contact metamorphic events, as is the Cu-pyriteskarn mineralisation (Piekarski, 1988).
The Cu-Mo-W mineralisation associated with stockworkquartz or quartz-feldspar veins, Piekarski (1988) acknowl-edged as hydrothermal in origin, overprinting the older types ofmineralisation. The Cu-Mo-W mineralisation was developed(1) in intensively, tectonically altered sedimentary rocks, (2) ingranitoids and diabases, and (3) occasionally in the smallerporphyry apophyses. Piekarski (1988) concluded that Cu-py-rite and Cu-Mo-W stockwork deposits probably had the high-est economic potential and that porphyry copper-type depositshad less potential.
However, Œlósarz (1988) suggested that the main Mysz-ków mineralisation was really a porphyry Cu-Mo deposit thatwas produced by low fluorine magmatic complexes. Œlósarzconsidered this type of deposit as having a high potential foreconomic polymetallic mineralisation.
An extensive addition to the 1979 program was prepared in1987 to follow on the results of previous programs (Piekarski
History of investigations 9
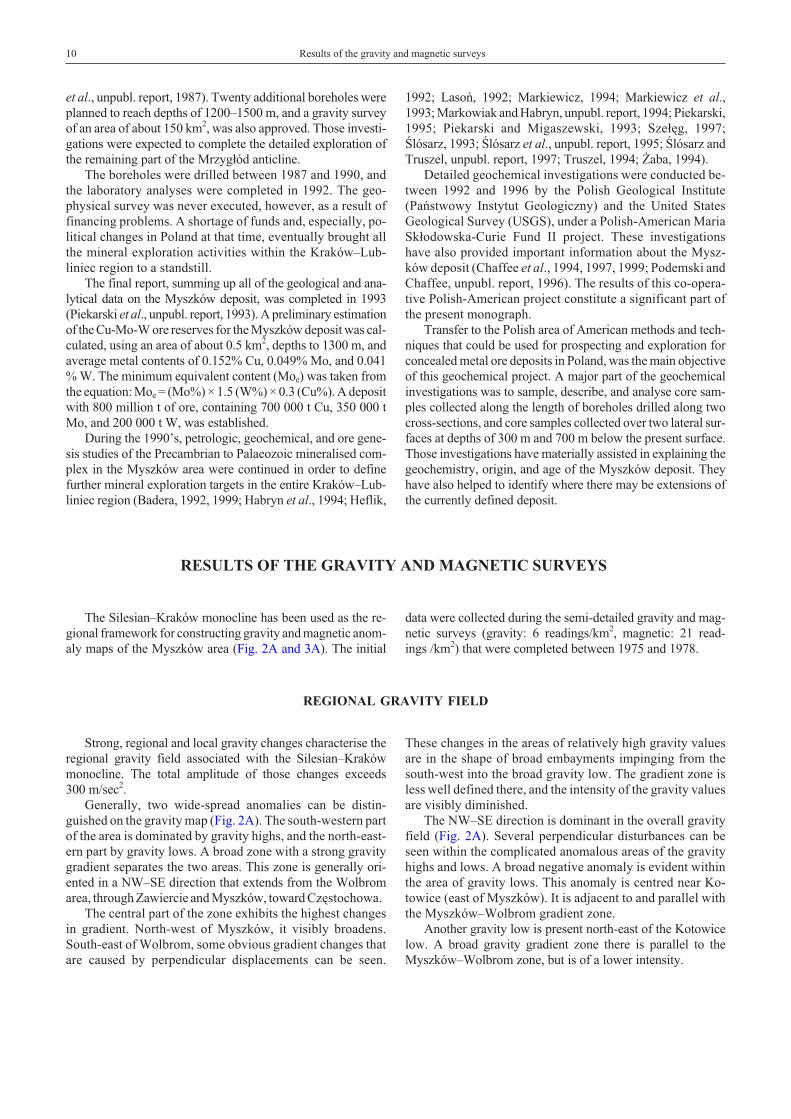
et al., unpubl. report, 1987). Twenty additional boreholes wereplanned to reach depths of 1200–1500 m, and a gravity surveyof an area of about 150 km2, was also approved. Those investi-gations were expected to complete the detailed exploration ofthe remaining part of the Mrzyg³ód anticline.
The boreholes were drilled between 1987 and 1990, andthe laboratory analyses were completed in 1992. The geo-physical survey was never executed, however, as a result offinancing problems. A shortage of funds and, especially, po-litical changes in Poland at that time, eventually brought allthe mineral exploration activities within the Kraków–Lub-liniec region to a standstill.
The final report, summing up all of the geological and ana-lytical data on the Myszków deposit, was completed in 1993(Piekarski et al., unpubl. report, 1993). A preliminary estimationof the Cu-Mo-W ore reserves for the Myszków deposit was cal-culated, using an area of about 0.5 km2, depths to 1300 m, andaverage metal contents of 0.152% Cu, 0.049% Mo, and 0.041% W. The minimum equivalent content (Moe) was taken fromthe equation: Moe = (Mo%) × 1.5 (W%) × 0.3 (Cu%). A depositwith 800 million t of ore, containing 700 000 t Cu, 350 000 tMo, and 200 000 t W, was established.
During the 1990’s, petrologic, geochemical, and ore gene-sis studies of the Precambrian to Palaeozoic mineralised com-plex in the Myszków area were continued in order to definefurther mineral exploration targets in the entire Kraków–Lub-liniec region (Badera, 1992, 1999; Habryn et al., 1994; Heflik,
1992; Lasoñ, 1992; Markiewicz, 1994; Markiewicz et al.,1993; Markowiak and Habryn, unpubl. report, 1994; Piekarski,1995; Piekarski and Migaszewski, 1993; Sze³êg, 1997;Œlósarz, 1993; Œlósarz et al., unpubl. report, 1995; Œlósarz andTruszel, unpubl. report, 1997; Truszel, 1994; ¯aba, 1994).
Detailed geochemical investigations were conducted be-tween 1992 and 1996 by the Polish Geological Institute(Pañstwowy Instytut Geologiczny) and the United StatesGeological Survey (USGS), under a Polish-American MariaSk³odowska-Curie Fund II project. These investigationshave also provided important information about the Mysz-ków deposit (Chaffee et al., 1994, 1997, 1999; Podemski andChaffee, unpubl. report, 1996). The results of this co-opera-tive Polish-American project constitute a significant part ofthe present monograph.
Transfer to the Polish area of American methods and tech-niques that could be used for prospecting and exploration forconcealed metal ore deposits in Poland, was the main objectiveof this geochemical project. A major part of the geochemicalinvestigations was to sample, describe, and analyse core sam-ples collected along the length of boreholes drilled along twocross-sections, and core samples collected over two lateral sur-faces at depths of 300 m and 700 m below the present surface.Those investigations have materially assisted in explaining thegeochemistry, origin, and age of the Myszków deposit. Theyhave also helped to identify where there may be extensions ofthe currently defined deposit.
RESULTS OF THE GRAVITY AND MAGNETIC SURVEYS
The Silesian–Kraków monocline has been used as the re-gional framework for constructing gravity and magnetic anom-aly maps of the Myszków area (Fig. 2A and 3A). The initial
data were collected during the semi-detailed gravity and mag-netic surveys (gravity: 6 readings/km2, magnetic: 21 read-ings /km2) that were completed between 1975 and 1978.
REGIONAL GRAVITY FIELD
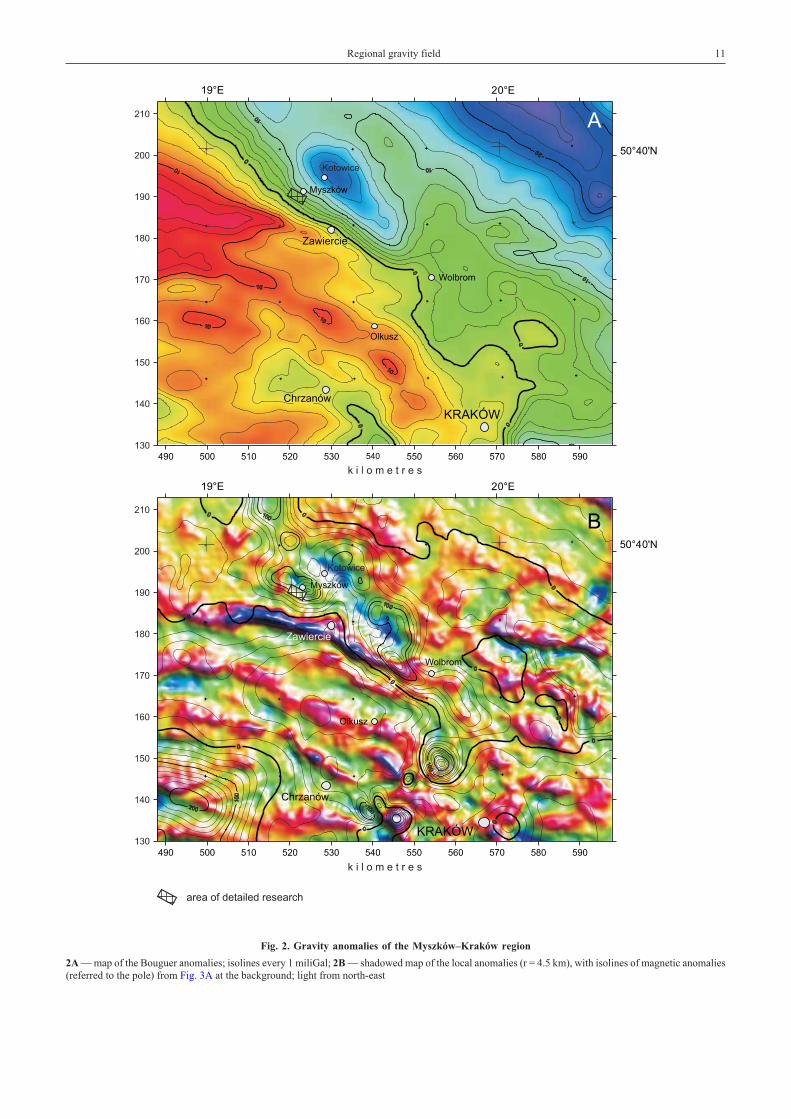
Strong, regional and local gravity changes characterise theregional gravity field associated with the Silesian–Krakówmonocline. The total amplitude of those changes exceeds300 m/sec2.
Generally, two wide-spread anomalies can be distin-guished on the gravity map (Fig. 2A). The south-western partof the area is dominated by gravity highs, and the north-east-ern part by gravity lows. A broad zone with a strong gravitygradient separates the two areas. This zone is generally ori-ented in a NW–SE direction that extends from the Wolbromarea, through Zawiercie and Myszków, toward Czêstochowa.
The central part of the zone exhibits the highest changesin gradient. North-west of Myszków, it visibly broadens.South-east of Wolbrom, some obvious gradient changes thatare caused by perpendicular displacements can be seen.
These changes in the areas of relatively high gravity valuesare in the shape of broad embayments impinging from thesouth-west into the broad gravity low. The gradient zone isless well defined there, and the intensity of the gravity valuesare visibly diminished.
The NW–SE direction is dominant in the overall gravityfield (Fig. 2A). Several perpendicular disturbances can beseen within the complicated anomalous areas of the gravityhighs and lows. A broad negative anomaly is evident withinthe area of gravity lows. This anomaly is centred near Ko-towice (east of Myszków). It is adjacent to and parallel withthe Myszków–Wolbrom gradient zone.
Another gravity low is present north-east of the Kotowicelow. A broad gravity gradient zone there is parallel to theMyszków–Wolbrom zone, but is of a lower intensity.
10 Results of the gravity and magnetic surveys
Regional gravity field 11
Fig. 2. Gravity anomalies of the Myszków–Kraków region
2A — map of the Bouguer anomalies; isolines every 1 miliGal; 2B — shadowed map of the local anomalies (r = 4.5 km), with isolines of magnetic anomalies(referred to the pole) from Fig. 3A at the background; light from north-east
REGIONAL MAGNETIC FIELD
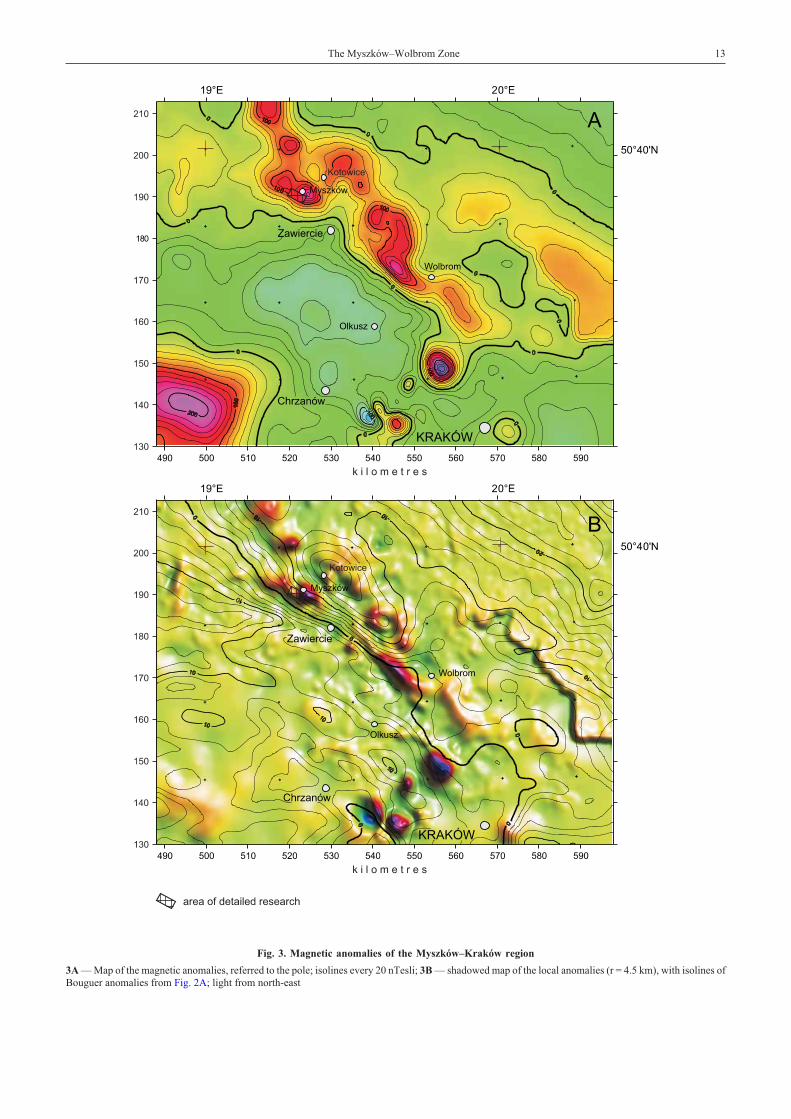
The regional magnetic patterns are roughly similar to theregional gravity field patterns. In detail, the area of the dis-turbed magnetic field is spatially a fairly close equivalent ofgravity lows area, especially in the Kotowice gravity low. Else-where, weak magnetic field changes and low magnetic valuescan be seen in the areas of gravity highs (Fig. 3A).
A magnetic high that contains several local anomalies is thedominant regional feature (Fig. 3A). There are three significantlocal anomalies. The Myszków and Krzywop³oty anomalies,
west of Wolbrom, are oriented NW–SE and have readings ex-ceeding 260 nT. The Kozieg³owy anomaly, north-west ofMyszków, has a slightly lower amplitude (Fig. 3A, B).
Along the Myszków–Wolbrom gravity gradient zone(Fig. 2A), there is a zone composed of high magnetic gradi-ents closing from the south-west a magnetic highs zone (Fig.3A). The strong, local, Myszków and Krzywop³oty magnetichighs are located within that zone or on its north-easternslope (Fig. 3B).
THE MYSZKÓW–WOLBROM ZONE
The Myszków–Wolbrom strong gravity gradient zone isthe most important gravity unit in that area. Its importance hasalready been noted by authors of a geophysical interpretation(Cieœla et al., unpubl. report, 1984). This gravity gradient isthought to be caused by a considerable density contrast be-tween various rock units present at the depths from 1.5 km toseveral km. The contact between these units is most probablystrongly dipping toward the north-east; that is, toward the lessdense rock masses, which may be a granitoid intrusion. Thecontact is probably tectonic in character and represents a tec-tonic zone that extends to a considerable depth. The strongmagnetic anomalies near Myszków and Krzywop³oty are lo-cated within and are parallel to that strong gradient zone(Fig. 3B). That may prove inter-connection of their origin.
Measurements of magnetic properties in core samples fromboreholes drilled in the Myszków area show that the porphyriesand some of the Palaeozoic schists are the most magnetic rocktypes. The combined magnetic levels in the porphyries and“magnetic” schists, however, are small in comparison to the re-gional values (Cieœla et al., unpubl. report, 1984).
Modelling completed since 1984 suggests that the top ofthe rock mass, regarded as the source of the magnetic anomalyat Myszków must be at a depth greater than 1500 m. Modellingof the Krzywop³oty magnetic anomaly suggests a very similardepth. This depth is in agreement with the depth of the upperboundary of the Myszków–Wolbrom tectonic contact zonerepresented by the mentioned above Myszków–Wolbromgravity gradient. This coincidence suggests a genetic connec-tion between the two magnetic anomalies, and especially be-tween the anomaly at Myszków and the Myszków–Wolbromtectonic zone.
Most of the positive magnetic anomalies identified in thenorth-eastern part of the study area, north-east of the sug-gested Myszków–Wolbrom deep tectonic zone, are locatedwithin or near to the local gravity low found near Kotowice(Fig. 2B and 3B).
There are no clear equivalents on the gravity map formost the local magnetic anomalies. The only exception isthe magnetic anomaly near Myszków, which overlaps a lo-cal gravity low (Fig. 2B). Generally, local dominant anoma-lies extend in two main directions: NW–SE and NE–SW
(Fig. 3B). There is no privileged direction for local gravityanomalies (Fig. 2B).
South-west of the inferred Myszków–Wolbrom tectoniczone, in the south-eastern part of the study area, both geophysicalmethods exhibit different patterns than those north of the zone.Bands of strong local gravity anomalies, which are generally ori-ented WNW–ESE, can be seen on the gravity map (Fig. 2B).Those anomalies are associated with steeply dipping, Devonianand Early Carboniferous series, cropping out under the Meso-zoic cover. The substantial differences in density of these units(the Middle Devonian rocks are especially dense) produced al-ternating bands of local gravity highs in the Devonian rocks andlocal gravity lows in the Carboniferous rocks. Faulting perpen-dicular to the orientation of these bands, is expressed as localbreaks and displacements in the dominant bands.
The dominant magnetic pattern of the area south of thezone is, for the most part, only slightly disrupted (Fig. 3A, B).Disruptions in the intensive magnetic field can be seensouth-east of the Olkusz–Chrzanów line (Fig. 3A, B). Sev-eral anomalies can be distinguished in that area, including anextensive anomaly at Bêb³o (south-east of Olkusz), which iscomplex but roughly circular; another positive anomaly atDêbnik (south-west of the anomaly at Bêb³o); and two addi-tional anomalies that are south-west of the first two. The firstis a positive anomaly at Regulice, and the second, just tosouth-west, is a very strong, complex, circular, positiveanomaly at Zalas–Rybna.
The magnetic highs at Dêbnik and Zalas–Rybna havecounterparts on the gravity map. A local gravity low corre-sponds to the magnetic high at Dêbnik. These coincident anom-alies are caused by a porphyry intrusion that was intercepted inborehole Dêbnik IG 1. The porphyry rocks are characterised bya high magnetic susceptibility (4 × 10⁻³SI) and by a very lowdensity (2.45 g/cm3).
The magnetic anomaly at Zalas–Rybna correlates well witha strong gravity high. This coincidence of anomalies is un-doubtedly caused by rocks of high magnetic susceptibility andhigh density, which may be diabase or another type of mafic in-trusion. The high values of gravity anomalies suggest the exis-tence of substantial thickness of rocks that disrupt the gravityfield.
12 Results of the gravity and magnetic surveys
The Myszków–Wolbrom Zone 13
Fig. 3. Magnetic anomalies of the Myszków–Kraków region
3A — Map of the magnetic anomalies, referred to the pole; isolines every 20 nTesli; 3B — shadowed map of the local anomalies (r = 4.5 km), with isolines ofBouguer anomalies from Fig. 2A; light from north-east
GEOLOGIC SETTING
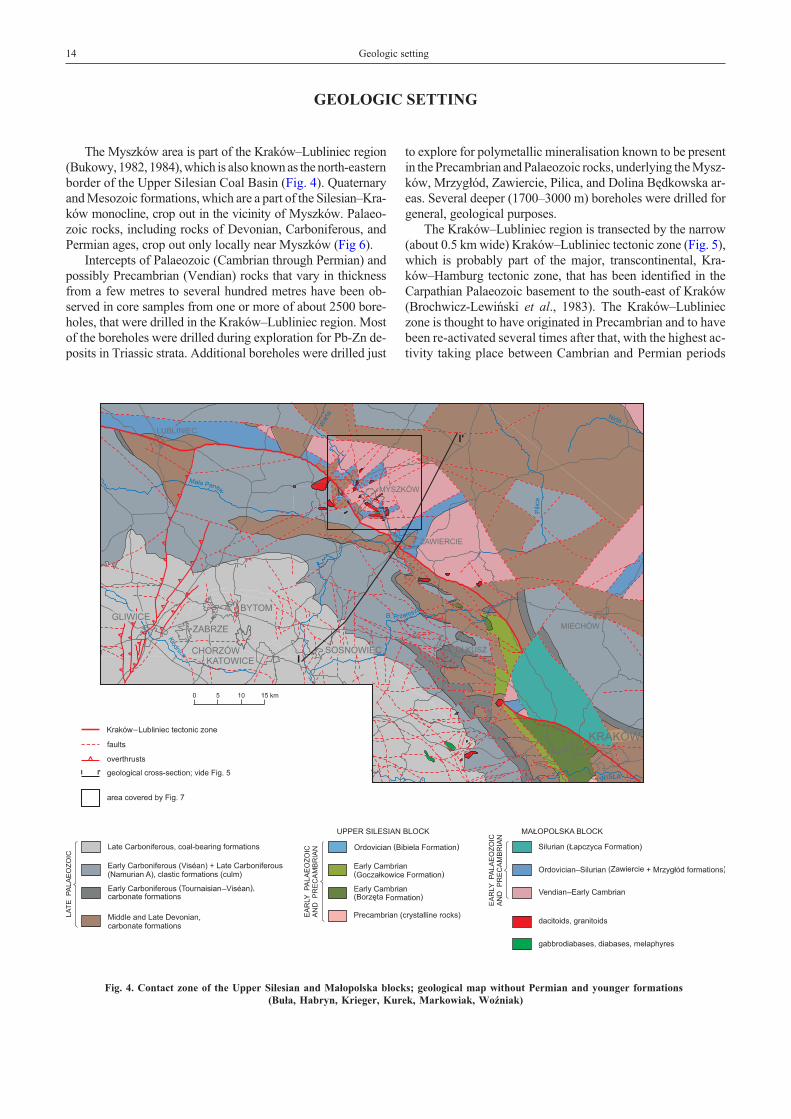
The Myszków area is part of the Kraków–Lubliniec region(Bukowy, 1982, 1984), which is also known as the north-easternborder of the Upper Silesian Coal Basin (Fig. 4). Quaternaryand Mesozoic formations, which are a part of the Silesian–Kra-ków monocline, crop out in the vicinity of Myszków. Palaeo-zoic rocks, including rocks of Devonian, Carboniferous, andPermian ages, crop out only locally near Myszków (Fig 6).
Intercepts of Palaeozoic (Cambrian through Permian) andpossibly Precambrian (Vendian) rocks that vary in thicknessfrom a few metres to several hundred metres have been ob-served in core samples from one or more of about 2500 bore-holes, that were drilled in the Kraków–Lubliniec region. Mostof the boreholes were drilled during exploration for Pb-Zn de-posits in Triassic strata. Additional boreholes were drilled just
to explore for polymetallic mineralisation known to be presentin the Precambrian and Palaeozoic rocks, underlying the Mysz-ków, Mrzyg³ód, Zawiercie, Pilica, and Dolina Bêdkowska ar-eas. Several deeper (1700–3000 m) boreholes were drilled forgeneral, geological purposes.
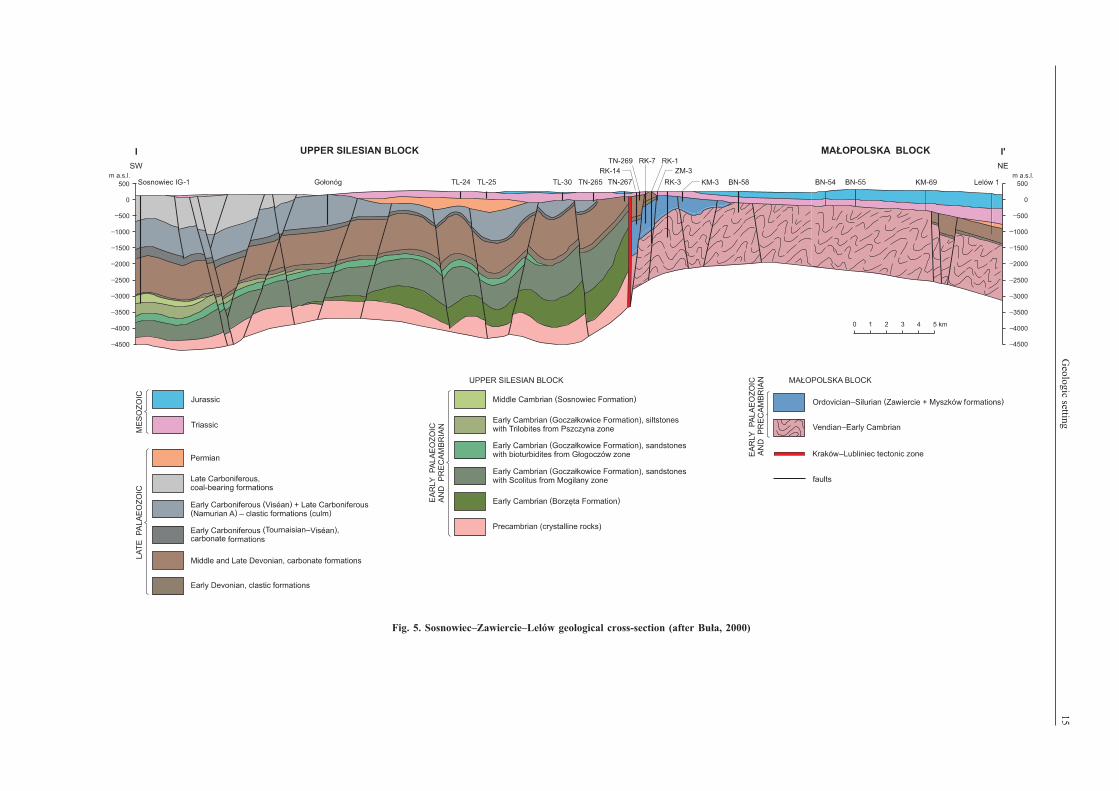
The Kraków–Lubliniec region is transected by the narrow(about 0.5 km wide) Kraków–Lubliniec tectonic zone (Fig. 5),which is probably part of the major, transcontinental, Kra-ków–Hamburg tectonic zone, that has been identified in theCarpathian Palaeozoic basement to the south-east of Kraków(Brochwicz-Lewiñski et al., 1983). The Kraków–Lublinieczone is thought to have originated in Precambrian and to havebeen re-activated several times after that, with the highest ac-tivity taking place between Cambrian and Permian periods
14 Geologic setting
Fig. 4. Contact zone of the Upper Silesian and Ma³opolska blocks; geological map without Permian and younger formations(Bu³a, Habryn, Krieger, Kurek, Markowiak, WoŸniak)
Geologic
setting15
Fig. 5. Sosnowiec–Zawiercie–Lelów geological cross-section (after Bu³a, 2000)
16 Geologic setting
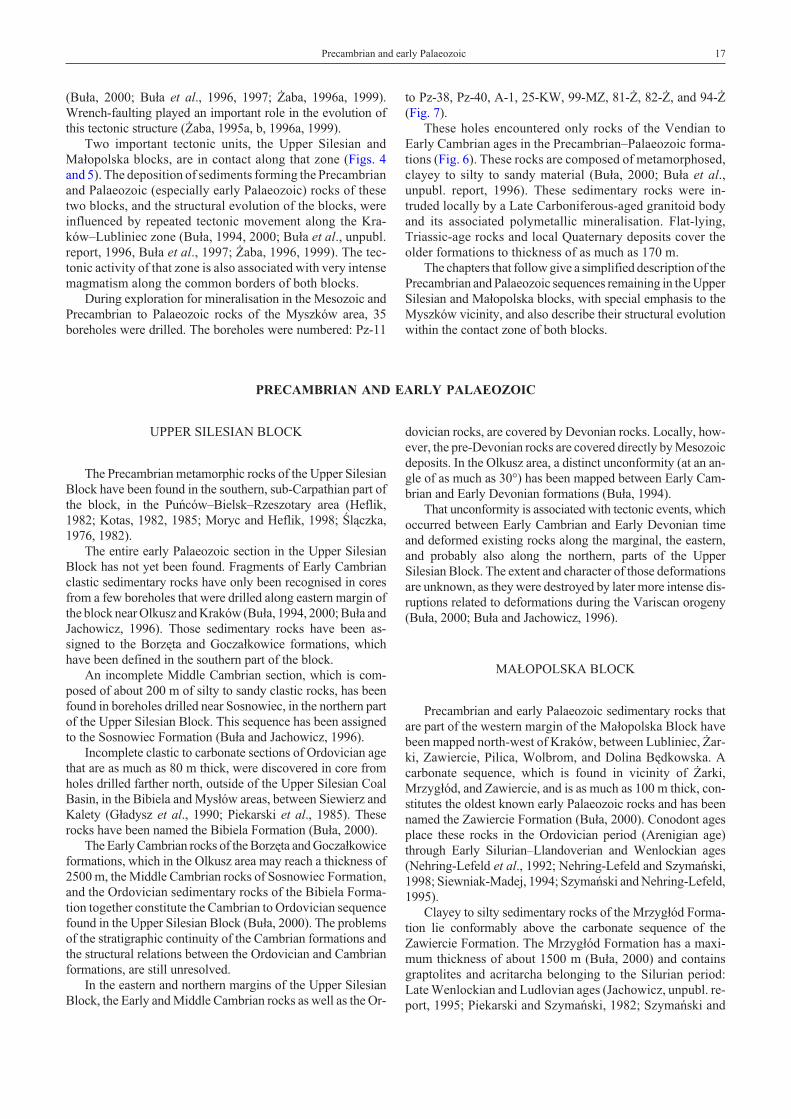
Fig. 7. Location of boreholes in the Myszków area
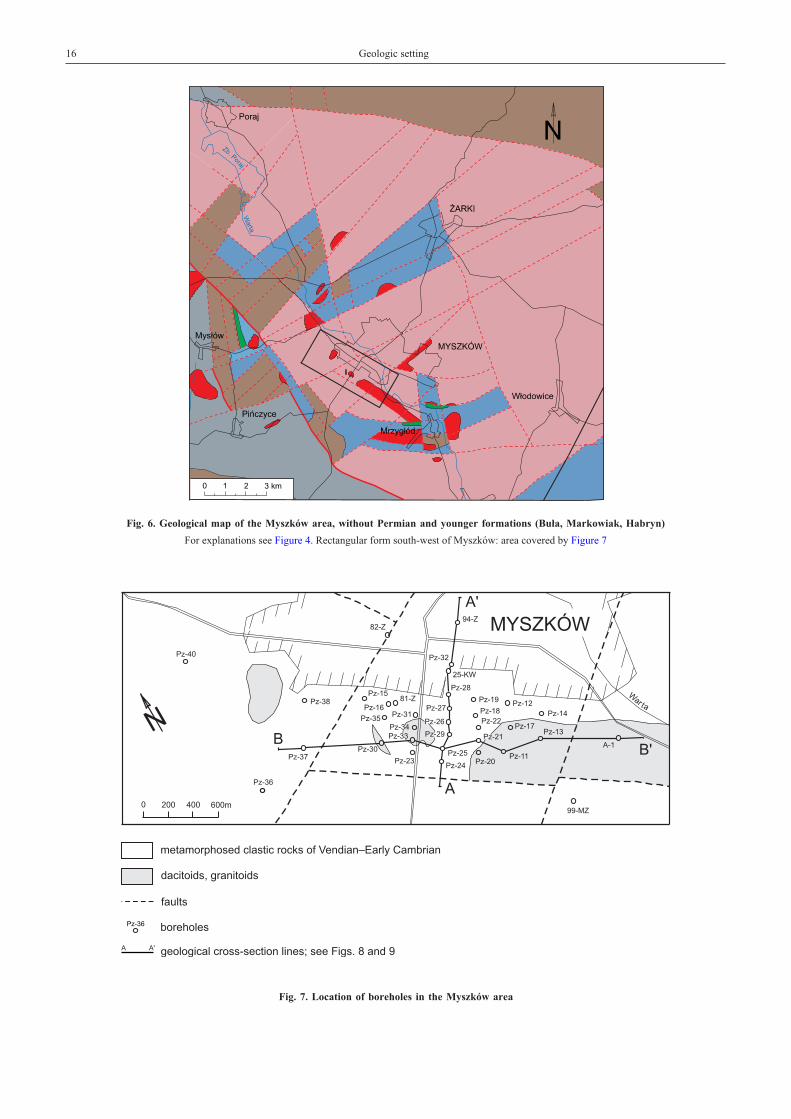
Fig. 6. Geological map of the Myszków area, without Permian and younger formations (Bu³a, Markowiak, Habryn)
For explanations see Figure 4. Rectangular form south-west of Myszków: area covered by Figure 7
(Bu³a, 2000; Bu³a et al., 1996, 1997; ¯aba, 1996a, 1999).Wrench-faulting played an important role in the evolution ofthis tectonic structure (¯aba, 1995a, b, 1996a, 1999).
Two important tectonic units, the Upper Silesian andMa³opolska blocks, are in contact along that zone (Figs. 4and 5). The deposition of sediments forming the Precambrianand Palaeozoic (especially early Palaeozoic) rocks of thesetwo blocks, and the structural evolution of the blocks, wereinfluenced by repeated tectonic movement along the Kra-ków–Lubliniec zone (Bu³a, 1994, 2000; Bu³a et al., unpubl.report, 1996, Bu³a et al., 1997; ¯aba, 1996, 1999). The tec-tonic activity of that zone is also associated with very intensemagmatism along the common borders of both blocks.
During exploration for mineralisation in the Mesozoic andPrecambrian to Palaeozoic rocks of the Myszków area, 35boreholes were drilled. The boreholes were numbered: Pz-11
to Pz-38, Pz-40, A-1, 25-KW, 99-MZ, 81-¯, 82-¯, and 94-¯(Fig. 7).
These holes encountered only rocks of the Vendian toEarly Cambrian ages in the Precambrian–Palaeozoic forma-tions (Fig. 6). These rocks are composed of metamorphosed,clayey to silty to sandy material (Bu³a, 2000; Bu³a et al.,unpubl. report, 1996). These sedimentary rocks were in-truded locally by a Late Carboniferous-aged granitoid bodyand its associated polymetallic mineralisation. Flat-lying,Triassic-age rocks and local Quaternary deposits cover theolder formations to thickness of as much as 170 m.
The chapters that follow give a simplified description of thePrecambrian and Palaeozoic sequences remaining in the UpperSilesian and Ma³opolska blocks, with special emphasis to theMyszków vicinity, and also describe their structural evolutionwithin the contact zone of both blocks.
PRECAMBRIAN AND EARLY PALAEOZOIC
UPPER SILESIAN BLOCK
The Precambrian metamorphic rocks of the Upper SilesianBlock have been found in the southern, sub-Carpathian part ofthe block, in the Puñców–Bielsk–Rzeszotary area (Heflik,1982; Kotas, 1982, 1985; Moryc and Heflik, 1998; Œl¹czka,1976, 1982).
The entire early Palaeozoic section in the Upper SilesianBlock has not yet been found. Fragments of Early Cambrianclastic sedimentary rocks have only been recognised in coresfrom a few boreholes that were drilled along eastern margin ofthe block near Olkusz and Kraków (Bu³a, 1994, 2000; Bu³a andJachowicz, 1996). Those sedimentary rocks have been as-signed to the Borzêta and Gocza³kowice formations, whichhave been defined in the southern part of the block.
An incomplete Middle Cambrian section, which is com-posed of about 200 m of silty to sandy clastic rocks, has beenfound in boreholes drilled near Sosnowiec, in the northern partof the Upper Silesian Block. This sequence has been assignedto the Sosnowiec Formation (Bu³a and Jachowicz, 1996).
Incomplete clastic to carbonate sections of Ordovician agethat are as much as 80 m thick, were discovered in core fromholes drilled farther north, outside of the Upper Silesian CoalBasin, in the Bibiela and Mys³ów areas, between Siewierz andKalety (G³adysz et al., 1990; Piekarski et al., 1985). Theserocks have been named the Bibiela Formation (Bu³a, 2000).
The Early Cambrian rocks of the Borzêta and Gocza³kowiceformations, which in the Olkusz area may reach a thickness of2500 m, the Middle Cambrian rocks of Sosnowiec Formation,and the Ordovician sedimentary rocks of the Bibiela Forma-tion together constitute the Cambrian to Ordovician sequencefound in the Upper Silesian Block (Bu³a, 2000). The problemsof the stratigraphic continuity of the Cambrian formations andthe structural relations between the Ordovician and Cambrianformations, are still unresolved.
In the eastern and northern margins of the Upper SilesianBlock, the Early and Middle Cambrian rocks as well as the Or-
dovician rocks, are covered by Devonian rocks. Locally, how-ever, the pre-Devonian rocks are covered directly by Mesozoicdeposits. In the Olkusz area, a distinct unconformity (at an an-gle of as much as 30°) has been mapped between Early Cam-brian and Early Devonian formations (Bu³a, 1994).
That unconformity is associated with tectonic events, whichoccurred between Early Cambrian and Early Devonian timeand deformed existing rocks along the marginal, the eastern,and probably also along the northern, parts of the UpperSilesian Block. The extent and character of those deformationsare unknown, as they were destroyed by later more intense dis-ruptions related to deformations during the Variscan orogeny(Bu³a, 2000; Bu³a and Jachowicz, 1996).
MA£OPOLSKA BLOCK
Precambrian and early Palaeozoic sedimentary rocks thatare part of the western margin of the Ma³opolska Block havebeen mapped north-west of Kraków, between Lubliniec, ¯ar-ki, Zawiercie, Pilica, Wolbrom, and Dolina Bêdkowska. Acarbonate sequence, which is found in vicinity of ¯arki,Mrzyg³ód, and Zawiercie, and is as much as 100 m thick, con-stitutes the oldest known early Palaeozoic rocks and has beennamed the Zawiercie Formation (Bu³a, 2000). Conodont agesplace these rocks in the Ordovician period (Arenigian age)through Early Silurian–Llandoverian and Wenlockian ages(Nehring-Lefeld et al., 1992; Nehring-Lefeld and Szymañski,1998; Siewniak-Madej, 1994; Szymañski and Nehring-Lefeld,1995).
Clayey to silty sedimentary rocks of the Mrzyg³ód Forma-tion lie conformably above the carbonate sequence of theZawiercie Formation. The Mrzyg³ód Formation has a maxi-mum thickness of about 1500 m (Bu³a, 2000) and containsgraptolites and acritarcha belonging to the Silurian period:Late Wenlockian and Ludlovian ages (Jachowicz, unpubl. re-port, 1995; Piekarski and Szymañski, 1982; Szymañski and
Precambrian and early Palaeozoic 17
Nehring-Lefeld, 1995; Szymañski and Teller, 1998; Tomczykand Tomczykowa, 1983). The stratigraphy of the Mrzyg³ódFormation was compiled from incomplete sections mapped inthe Lubliniec–Dolina Bêdkowska area.
The £apczyca Formation, which consists of conglomer-atic to sandy to silty rocks that are about 300 m thick (Bu³a,2000), is regarded as the youngest Silurian unit found in theMa³opolska Block. This formation has been recognised inseveral localities, including the areas near Zawiercie, DolinaBêdkowska, Batowice, and £apczyca.
The Ordovician to Silurian carbonate and clastic rocks ofthe Zawiercie, Mrzyg³ód, and £apczyca formations uncon-formably overlie tectonically a sequence of clayey to silty tosandy rocks, containing intercalations of sandy gravels andsmall pebble-sized conglomerates. These sequence is charac-terised by various colours that range from green, throughdark-grey with green or willow-green tint, to cherry-brown,ashen-grey, and violet-grey. These rocks are strongly induratedand, locally, exhibit steeply-dipping (40–80°) cleavage andvarying degrees of metamorphism (greenschist facies) that hasformed phyllites.
The stratigraphic position of these metamorphosed rocks isstill not precisely known and can only be indirectly defined. Par-tial sections with this sequence have been encountered in morethan 230 boreholes drilled between ¯arki and Dolina Bêd-kowska. Although these rocks have been found most commonlybelow Ordovician, Silurian or Devonian sequences, they aresometimes also found directly beneath Mesozoic-aged rocks.
These rocks have been tentatively assigned a Precambrian(Vendian) to Early Cambrian age (Bu³a, 1994, 2000; Bu³a et
al., 1997) based on their comparison with rocks recognised inthe Nida Depression, which are older than Ordovician, arelithologically similar, are metamorphosed to the same degree,and exhibit the same tectonic deformation.
At this time, reconstructing the complete Vendian to EarlyCambrian stratigraphy is not possible because of an incompleteknowledge of those lithologically differentiated rocks, includ-ing a lack of information on the full thickness of each measuredsection and on the general absence of an identified lower con-tact for this sequence.
In conclusion, two structural complexes can be recognisedin the Ma³opolska Block: the older, Vendian to Early Cambriancomplex, which is present in the western part of the block, andthe younger one of Ordovician to Silurian age, which consistsof rocks belonging to the Zawiercie, Mrzyg³ód, and £apczycaformations (Bu³a, 2000) that overlie the older complex.
In the Myszków area, which is located on the south-westernmargin of the Ma³opolska Block, the Vendian to Early Cam-brian rocks are the only pre-Mesozoic sedimentary rocks pres-ent (Fig. 6). In this area, the lack of any correlatable horizons, aswell as the partial metamorphism of the rocks, and intense tec-tonic deformation precludes any clear reconstruction of thecomplete stratigraphic profile. Piekarski (1985) regarded thissequence at Myszków as being metamorphosed Caledonian--aged rocks associated with early geosynclinal formation.
In the Myszków area, the Vendian to Early Cambrian com-plex is intruded by a Late Carboniferous, granitoid body. Neartheir contact with the intrusion, the Vendian to Early Cambrianrocks exhibit contact metamorphism and hydrothermal alter-ation (Karwowski, 1988; Ryka, 1978; Truszel, 1994).
LATE PALAEOZOIC
Lithologically similar Devonian and Carboniferous (earlyNamurian A included) rocks are present in the marginal parts ofboth structural blocks. These sequences consist of clastic orclastic-carbonate rocks of Early Devonian age, carbonate de-posits of Middle to Late Devonian, and Early Carboniferousages, and non-marine culm deposits of middle and lateViséan to early Namurian A ages (Bojkowski and Bukowy,1966; Bukowy, 1984; Kotas, 1982, 1985; Narkiewicz, 1978;Narkiewicz and Racki, 1984; Pajchlowa et al., unpubl. report,1983; Paszkowski, 1988; Siewniak-Madej, 1994). Toward thecentre of the Upper Silesian Block, the late Palaeozoic is repre-sented by a Late Carboniferous, coal-bearing sedimentary se-quence (Fig. 4).
Although no real differences have been observed betweenthe nature of the late Palaeozoic sedimentary rocks on eitherside of the Kraków–Lubliniec tectonic zone, one can see sig-nificantly different tectonic style. In the eastern and northernmargins of the Upper Silesian Block, the thin, folded blockstructures dominate. On the other hand, in the western part ofthe Ma³opolska Block, the Devonian to Carboniferous rocksare only found in large, block-type structures (Fig. 4).
The Permian deposits of the eastern and northern marginsof the Upper Silesian Block have been recognised in two
elongated tectonic structures: the S³awków Graben and theNieporaz-Brod³o Trough (Kiersnowski, 1991). Their longeraxes are parallel to the Kraków–Lubliniec tectonic zone. In theMa³opolska Block, the predominantly clastic Permian rocksare located north and east of the Lubliniec–¯arki–S³omnikiarea and in the Miechów Depression (Jurkiewicz, 1975).
No late Palaeozoic-aged sedimentary rocks have beenfound in the Myszków area (Fig. 6). However, the granitoidrocks that intruded the Vendian to Early Cambrian-aged rockshave been assigned to the Late Carboniferous. The intrusion iselongated in a NW–SE direction (see the perpendicular cross--section A–A’; Fig. 8) and has been explored by a network ofboreholes for a distance of about 7 km, from Mrzyg³ód area(Pz-10), through Myszków, to Nowa Wieœ (60-¯). Locally, theintrusion was exposed on the pre-Mesozoic erosion surface(Pz-30, Pz-33, Pz-34 and 60-¯).
This granitoid intrusion formed in several stages that arecharacterised by complicated structure and varying mineralcontent. Numerous apophyses have been identified around themain mass of the intrusion. Faults have offset the main intru-sion in many places (Fig. 9). It has been suggested that theuppermost part of the intrusion contains the strongest con-centrations of Cu-Mo-W mineralisation and that later tectonic
18 Geologic setting
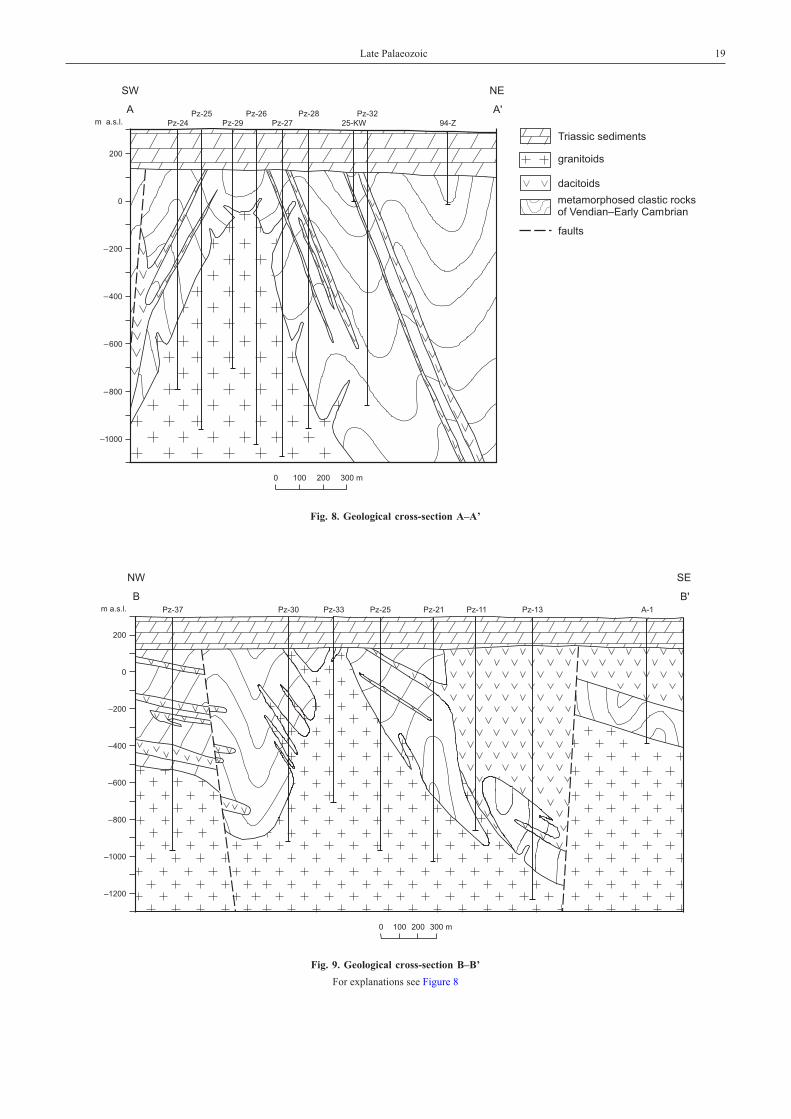
Late Palaeozoic 19
Fig. 8. Geological cross-section A–A’
Fig. 9. Geological cross-section B–B’
For explanations see Figure 8
movements down-faulted that part of the intrusion into a tec-tonic depression.
Multistage porphyry intrusions are also important in thegeological evolution of the Myszków area, as seen in core fromborehole Pz-13 and the neighbouring boreholes (cross-sectionB–B’, Fig. 9). These intrusions were probably associated withthe faulting that offset the granitoid intrusion into blocks.
Two main types of porphyritic rocks have been identi-fied: rhyolites and dacites. The quartz porphyry intrusion inMyszków area is shaped something like a lopolith and reachesa maximum thickness of 848 m in borehole Pz-13. In some lo-calities, this intrusion is dike-like in form, with a true thick-ness of about 400 m. This porphyry intrusion is located abovethe granitoid intrusion and extends for as much as 3.5 km asseen in borehole A-3 near Mrzyg³ód.
Dacite porphyries are very common in the area and formthin dikes that are usually steeply inclined (around 70°) andvery rarely exceed 20 m in thickness. The dacites are probablyolder than the rhyolites; however, their age relation with thegranitoids has not yet been defined.
The contact between the pre-Mesozoic rocks (the Vendianto Early Cambrian sedimentary rocks and the Late Carbonif-erous granitoid massif), and the overlying Mesozoic–Caino-zoic rocks is an erosional surface of varying relief. Theoverall surface is gently inclined, generally toward the north--east, and varies from 144.3 m a.s.l. (hole 99-MZ) in south--east, to 107.9 m a.s.l. (hole 82-¯), and 108.8 m a.s.l. (holePz-40) in the north and north-west. The surface is higher lo-cally (155.2 m a.s.l.; hole Pz-13) near pre-Mesozoic expo-sures of the rhyolites.
STRUCTURAL EVOLUTION OF THE PRECAMBRIAN–PALAEOZOIC ALONG THE CONTACT ZONEBETWEEN UPPER SILESIAN AND MA£OPOLSKA BLOCKS
TECTONIC DEFORMATION EVENTS
In the Palaeozoic (and Vendian) stratigraphic sections alongthe contact between the Upper Silesian and Ma³opolska blocks(Fig. 4), the effects of four distinct deformations (D1 to D4) thatproduced fold macrostructures have been recognised. Each ofthe events ended with a distinct extensional episode.
The oldest deformation event, D1, affected only themetasedimentary rocks of the Vendian to Early Cambrian se-quence found in the Ma³opolska Block. This sequence wasfolded and regionally metamorphosed, probably after EarlyCambrian time (¯aba, 1995), but possibly as late as the transi-tion time between the Cambrian and Ordovician periods (Jur-kiewicz, 1975; Po¿aryski and Tomczyk, 1968; Znosko, 1996).This deformation event has not been observed in the sedimen-tary rocks of the Early Cambrian and Ordovician sections nearthe contact within the Upper Silesian Block.
Deformation event D2 affected both the Cambrian and Or-dovician sedimentary rocks found near the contact zone of theUpper Silesian Block, and the Vendian to Early Cambrian, andOrdovician to Silurian rocks found near the contact zone in theMa³opolska Block.
The D2 deformation occurred in several phases during theLate Silurian, as much as the Silurian/Devonian transition time(¯aba, 1994). During the Devonian to Carboniferous period ofsubhorizontal extension (locally, until the early Namurian A),which terminated the D2 events, intense vertical movementswere active in the contact zone between the Upper Silesian andMa³opolska blocks. These movements most probably occurredat the end of the Devonian period and/or during the transitionbetween Devonian and Early Carboniferous times (¯aba,1996b, 1997a, b), and were accompanied by intrusions ofdiabases and older porphyries.
Deformation event D3 occurred after Namurian A time(¯aba, 1996a) and affected diabases and certain porphyries, theDevonian to Carboniferous sedimentary rocks as well as all
older rock complexes. Faulting styles included first thrusting,then, transpression and locally, strike-slip.
The D3 deformation event had the greatest influence on thestructure of the Palaeozoic rocks along the contact betweenboth blocks and dominates the present-day tectonic style of thiszone. After Westphalian B time, vertical displacements tookplace and granitoid intrusions, together with accompanyingporphyries, were emplaced near the contact zone but only in theMa³opolska Block.
Deformation event D4 affected the contact zones of boththe Upper Silesian and Ma³opolska blocks, as well as thegranitoid bodies and related porphyries. This event took placeduring the transition between Westphalian and Stephanianages and possibly, also during early Stephanian time (¯aba,1996a), before deposition of the overlying Permo-Mesozoicrocks.
STRUCTURAL EVOLUTION
Several stages of structural development of the Palaeozoicrocks were identified in the contact zone between the UpperSilesian and Ma³opolska blocks.
Stage 1. Along the south-western margin of the Ma³o-polska Block, sedimentation and diagenesis of flysch-typeclastic rocks of Vendian to Early Cambrian age occurred(Fig. 10). This sedimentation may have continued into MiddleCambrian time, because the rocks of that age, which have beenidentified in other regions of the Ma³opolska Block, may havebeen entirely eroded in the study area. Sedimentation anddiagenesis processes were accompanied by development ofvarious synsedimentary deformational structures.
Stage 2. It is related to the oldest deformation event D1,which occurred exclusively in the contact zone in the Ma³o-polska Block, within the Vendian to Early Cambrian sequence.Folding of these rocks created recumbent, or — less frequently
20 Geologic setting
— inclined, open to tight flexural macrofolds that are oftentransitional to shear folds.
The D1 deformation produced disjunctive (fracture) cleav-age and, in many areas, a penetrative, continuous S1 slaty cleav-age. The folding processes were accompanied by epizonal,regional alteration that produced either zeolite or lower to mid-dle-greenschist facies metamorphism. The D1 deformationsprobably occurred between the Cambrian and Ordovician peri-ods (the Sandomierz orogeny?) but did not affect the EarlyCambrian clastic sedimentary rocks near the contact zone ofthe Upper Silesian Block (Fig. 10).
The folded Vendian to Early Cambrian metasedimentaryrocks underwent later denudation processes, probably duringthe earliest Ordovician and possibly also during Late Cambriantime. These processes led to the formation of an erosional-de-nudation-abrasional palaeosurface (Fig. 10).
Stage 3. In this stage, sedimentation of the clastic rocks(Cambrian) and of the clastic carbonates rocks (Ordovician)may have continued until Silurian time along the contact zoneof the Upper Silesian Block (Fig. 10). This sedimentation wasaccompanied by numerous depositional and deformationalstructures. Some of these processes occurred synchronouslywith the events of Stages 1 and 2, which have taken place in thecontact zone of the Ma³opolska Block, only.
Following deformation D1, metamorphism and partial de-nudation of the Vendian to Early Cambrian sequence (and pos-sibly, also rocks of Middle Cambrian age) occurred in thecontact zone of the Ma³opolska Block. Following the denuda-tion phase, sedimentation and diagenesis of the Ordovician toSilurian rocks occurred (Fig. 10). These rocks consist of car-bonate deposits of the Zawiercie Formation and clastic depositsof the Mrzyg³ód Formation (Bu³a, 2000).
Stage 4. This stage includes all the processes associatedwith deformations of the D2 event in the contact zones of boththe Upper Silesian and Ma³opolska blocks. The deformationsmost likely occurred under recurrent sinistral transpressionconditions from Late Silurian time until its transition into theDevonian period (the late Caledonian orogeny). The D2 foldingwas not accompanied by metamorphism.
At the beginning of Stage 4, the deformations occurred un-der thrusting (compressional) conditions that led to folding ofall of the rock sequences formed to that time. The limbs of theflexural macrofolds that formed at that time exhibit dip anglesof as much as 15–20°. The folding was accompanied by the for-mation of fracture cleavage.
In close proximity to the Kraków–Lubliniec fault zone (inthe region of Mys³ów), the “fold” deformation was muchmore intense, and created asymmetrical, inclined, flexuralmacrofolds that show well developed, continuous slatycleavage.
The Ordovician to Silurian sedimentary sequence and theVendian to Early Cambrian metasedimentary sequence werefolded in the contact zone of the Ma³opolska Block. In the Or-dovician to Silurian rocks, open to tight, asymmetrical flexuralfolds formed. These folds were usually inclined, occasionallyrecumbent, and showed well developed, often penetrative,continuous cleavage.
The D2 deformations also affected the rocks of the Vendianto Early Cambrian sequence that had already been folded dur-
ing the D1 event and created non-penetrative S2 foliation. Thoseprocesses were terminated by short-term, subhorizontal exten-sion that is weakly expressed in the marginal zones of bothblocks.
The later deformations of D2 event were solely related tothe transpressional activity of the Kraków–Lubliniec fault. Inthe structural border zone between the Upper Silesian andMa³opolska blocks, positive flower structures developed(Fig. 11A). These structures were accompanied by numer-ous minor deformational structures that contained bothstrike-slip and dip-slip displacement components. Followingthe cessation of tectonic compression, various extensionalstructures formed, including tension gashes, open fractures,and normal faults.
The D2 deformations were terminated by subhorizontalcompression that produced structural compressional wedges,pop-up structures, “tectonic” stylolites, reverse faults, andother features in the contact zone of the Ma³opolska Blockonly, and mainly in the Ordovician to Silurian rocks. Thefolded early Palaeozoic rocks subsequently underwent denu-dation, which led to the formation of erosional-denudation--abrasional palaeosurface (Fig. 10).
Stage 5. During this stage, sedimentation and diagenesis ofthe Devonian rocks occurred, along the contact zone betweenthe Upper Silesian and Ma³opolska blocks (Fig. 10). In thecontact zone of both blocks, distinct vertical movements tookplace at the end of Devonian and/or at the transition from De-vonian to Early Carboniferous time (the Bretonic orogeny).The displacements, which usually show a normal fault style(subhorizontal extension), took place under ductile or brit-tle-ductile conditions.
At the end of Stage 5, diabase bodies and certain porphy-ries intruded the sedimentary wall rocks and produced weak,mostly thermal, contact metamorphic changes. The intrusionsfollowed fault-related zones of mylonites, cataclasites, and tec-tonic breccias.
Stage 6. During this stage, sedimentation and diagenesisof Early Carboniferous carbonate and clastic rocks occurredalong the contact zone between the Upper Silesian andMa³opolska blocks. This events continued locally until earlyNamurian time (Fig. 10), during which various sedimentarystructures were formed.
Stage 7. During this pre-intrusive stage (¯aba, 1996a),which post-dated Namurian A time, the deformations of phaseD3 took place. They occurred under dextral transpressionalconditions during which the maximum compressional axischanged from north-east–south-west to north–south, and pro-duced intense folding and faulting of the Palaeozoic sequences.These processes were not accompanied by metamorphic alter-ation.
During the Stage 7, regional anticlinal macrostructuresformed, including flexural folds and cleavage-type structures,particularly in slates. Brittle-ductile to brittle shear zones of re-verse-slip kinetics and medium dip angles were commonlyformed in sedimentary and metasedimentary rocks as well as indiabases and porphyries. Those structures are often penetrativein nature.
During the Stage 7, some rather insignificant thrustingalso occurred that was mostly oriented north or north-east but
Structural Evolution of the Precambrian–Palaeozoic... 21
22 Geologic setting
Tertiary and Quaternarysediments
claystones
siltstones
sandstones
conglomerates
limestones
dolomites
metasediments (anchimetamorphism or regionalmetamorphism of greenschist facies)
crystalline rocks of the Upper Silesian Block basementand hypothetical Ma³opolska Block basement
principal structural discordances and stratigraphical gaps
stratigraphical gaps and suspected or secondarystructural discordances
maximum vertical range of contact metamorphism(thermal and metasomatic)
600
900
0
300
[m]
Upper Silesian Block Ma³opolska Block
Pla
tfo
rmco
ve
r
Pla
tfo
rmco
ve
r
Pla
tfo
rmb
ase
me
nt
Pla
tfo
rmb
ase
me
nt
Crystallinebasement
Crystallinebasement
Pr(??)
Cra
co
w–
Lu
blin
iec
fau
ltzo
ne
(Ha
mb
urg
–C
raco
wfa
ult
zo
ne
)
COMPLEXES COMPLEXESS W NE
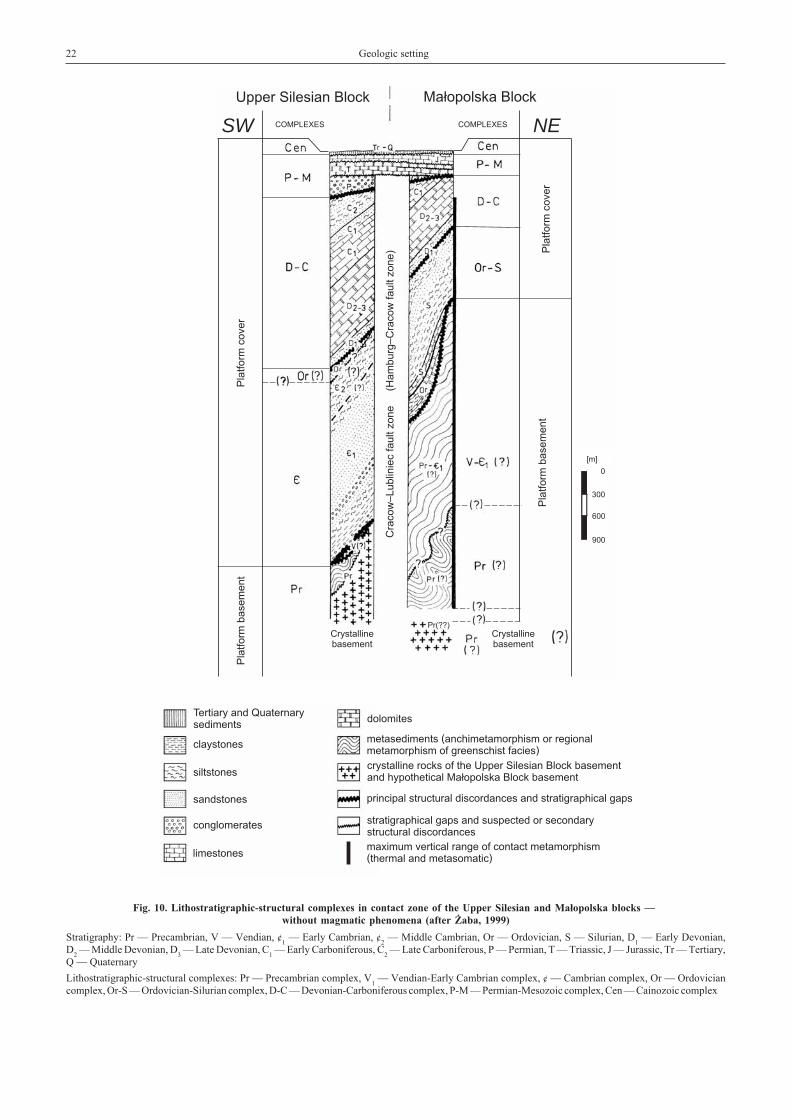
Fig. 10. Lithostratigraphic-structural complexes in contact zone of the Upper Silesian and Ma³opolska blocks —without magmatic phenomena (after ¯aba, 1999)
Stratigraphy: Pr — Precambrian, V — Vendian, ¢1
— Early Cambrian, ¢2
— Middle Cambrian, Or — Ordovician, S — Silurian, D1
— Early Devonian,D
2— Middle Devonian, D
3— Late Devonian, C
1— Early Carboniferous, C
2— Late Carboniferous, P — Permian, T — Triassic, J — Jurassic, Tr — Tertiary,
Q — Quaternary
Lithostratigraphic-structural complexes: Pr — Precambrian complex, V1
— Vendian-Early Cambrian complex, ¢ — Cambrian complex, Or — Ordoviciancomplex, Or-S — Ordovician-Silurian complex, D-C — Devonian-Carboniferous complex, P-M — Permian-Mesozoic complex, Cen — Cainozoic complex
much less frequently south to south-west. These faults tookadvantage of existing structural and sedimentary contacts(Fig. 11B). During the D3 deformations, granitoid magmawas presumably generated. At the end of this stage, intenseerosion began, leading to the formation of another erosional--denudation-abrasional palaeosurface (Fig. 10).
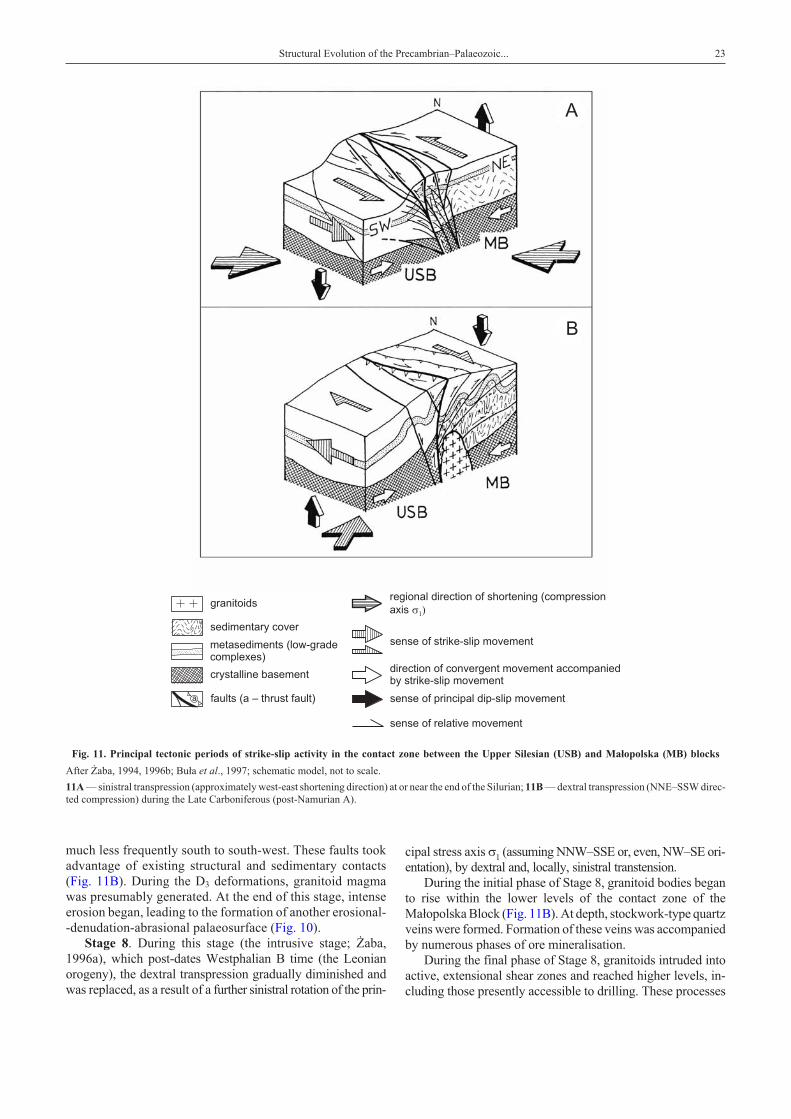
Stage 8. During this stage (the intrusive stage; ¯aba,1996a), which post-dates Westphalian B time (the Leonianorogeny), the dextral transpression gradually diminished andwas replaced, as a result of a further sinistral rotation of the prin-
cipal stress axis �1 (assuming NNW–SSE or, even, NW–SE ori-entation), by dextral and, locally, sinistral transtension.
During the initial phase of Stage 8, granitoid bodies beganto rise within the lower levels of the contact zone of theMa³opolska Block (Fig. 11B). At depth, stockwork-type quartzveins were formed. Formation of these veins was accompaniedby numerous phases of ore mineralisation.
During the final phase of Stage 8, granitoids intruded intoactive, extensional shear zones and reached higher levels, in-cluding those presently accessible to drilling. These processes
Structural Evolution of the Precambrian–Palaeozoic... 23
a
granitoids
sedimentary cover
metasediments (low-gradecomplexes)
crystalline basement
faults (a – thrust fault)
regional direction of shortening (compression
axis � ��
sense of strike-slip movement
direction of convergent movement accompaniedby strike-slip movement
sense of principal dip-slip movement
sense of relative movement
A
B
Fig. 11. Principal tectonic periods of strike-slip activity in the contact zone between the Upper Silesian (USB) and Ma³opolska (MB) blocks
After ¯aba, 1994, 1996b; Bu³a et al., 1997; schematic model, not to scale.
11A — sinistral transpression (approximately west-east shortening direction) at or near the end of the Silurian; 11B — dextral transpression (NNE–SSW direc-ted compression) during the Late Carboniferous (post-Namurian A).
created widespread contact metasomatic and thermal alterationzones. The granitoids, sedimentary wall rocks, and the diabasebodies were subsequently cut by veins, which were formed inseveral stages.
Stage 9. Stage 9 (the post-intrusive stage; ¯aba, 1996a)occurred during the transition between Westphalian andStephanian times and, also possibly during early Stephaniantime (the Asturian orogeny). During this stage, the deforma-tions recurred under dextral transpression conditions. Asa result of dextral rotation, the compression axis, which ini-tially had a nearly north-south orientation, changed to aNNE–SSW or NE–SW orientation.
All of the rock sequences formed by the time of Stage 9along the contact zone between the Upper Silesian andMa³opolska blocks were affected by deformations of phaseD4. In the granitoids found near the Ma³opolska Block con-tact zone, a number of structural features associated with thisstage have been observed. In the entire area, folds, reversefaults, and minor thrusts formed but generally on a more re-stricted scale. These structures formed parallel to similarstructures developed during phase D3.
Stage 10. This stage has been dated as occurring at theend of the Late Carboniferous, and during Permian andEarly Triassic times. During this stage, sedimentation anddiagenesis of Permian and Lower Triassic deposits tookplace under extensional conditions that were characterisedby a vertically positioned axis that had the least principalstress and, partly, under sinistral transtension conditions (�1
oriented approximately NW–SE).The structures formed during the Stage 10 time are associ-
ated with normal-slip or normal-oblique faulting that occurredunder brittle and, locally, brittle-ductile conditions. The defor-mations were, to a high degree, related to an intense verticalmovement of the entire area. Numerous normal faults werenewly formed or were reactivated, as were pre-existing grabens,horsts and fault blocks. Fault zones were accompanied by tec-tonic breccias, kakirites, lenticular structures and en échelonextensional joints that are sometimes transitional to sigmoidalfractures. This stage was also accompanied by numerous mag-matic phases that produced quartz porphyries, lamprophyres,diabases, and ore mineralisation.
PERIODS OF INCREASED STRIKE-SLIP ACTIVITY
Strike-slip faulting plays a dominant part in the multi-stage structural evolution of the contact zone between theUpper Silesian and Ma³opolska blocks that constitutes theKraków–Lubliniec fault zone. This faulting was particularlyactive during two main periods.
Period I was associated with the sinistral transpression thatoccurred at the end of the Silurian period or at the transition be-tween the Silurian and Devonian periods (Fig. 11A). Duringperiod I, the early Palaeozoic sequences along the contact zonebetween the Upper Silesia and Ma³opolska blocks were folded.This process was accompanied by minor magmatic activitythat produced discordant mafic and felsic dikes.
As a result of east-west compression, sinistral strike-slipfaulting occurred along the Kraków–Lubliniec fault zone. Thisfaulting was accompanied by a synchronous, relative upliftingof the Ma³opolska Block along that zone and a relative subsi-dence of the Upper Silesian Block (¯aba, 1994). In these areas,positive flower structures formed. These features were, pre-sumably, related to an oblique collision of two distinct, rigidcrustal blocks.
The left-lateral displacements along the Kraków–Lublinieczone probably took place between Early Ordovician and EarlyDevonian times (Brochwicz-Lewiñski et al., 1983). These dis-placements are partly consistent with the sinistral movementsalong the Teisseyre-Tornquist Line (Po¿aryski et al., 1982) thatoccurred between Middle Ordovician and Late Silurian time.However, according to Paszkowski (1988), the left-lateral dis-placements must have occurred in the Kraków–Lubliniec zonesomewhat later, probably during Devonian period, betweenGeddinian and Frasnian ages.
Period II was related to Late Carboniferous dextral trans-pression, which was repeated twice and led to the second fold-ing of the early Palaeozoic rocks and the first folding of the LatePalaeozoic rocks that existed at the time of Period II. These pro-cesses were accompanied by intense magmatism, that contin-ued until Early Permian times.
Late Carboniferous transpression (compression in a north--south direction that subsequently changed to a NE–SW orien-tation) took place after Namurian A time. This transpressioncaused the north-eastern margin of the Upper Silesian Block tobe thrust over the Ma³opolska Block along a high-angle reversefault (¯aba, 1996a). This movement produced numerous re-verse faults and minor thrust faults, mostly along the contactzone in the Ma³opolska Block (Fig. 11B).
During Period II, granitoid magma was formed and accu-mulated at depth. Subsequently, after Westphalian B time,magma intruded into the more disrupted, marginal zone of theMa³opolska Block (Fig. 11B). The granitoid intrusions wereemplaced under conditions of a dextral (locally also sinistral)transtension that was associated with sinistral rotation of theprincipal stress axes. During the transition from Westphalian toStephanian time, the granitoids of the marginal part of theMa³opolska Block underwent a series of deformations thatwere related to the recurrence of dextral transpressional condi-tions (¯aba, 1996a).
EFFECTS OF TECTONICS ON ROCKSIN THE MYSZKÓW AREA
Rocks from the Myszków area were subjected to re-gional, multistage stresses of varying types and orientations.The most commonly observed tectonic structures include(Badera, unpubl. report, 1999):
• fractures — open or closed (barren or mineralised);
• veins — fissure infilling, metasomatic, and brecciatypes. These include veins (sensu stricto) that are greater than10 cm, veinlets that are 1 mm to 10 cm thick, and microveinletsthat are less than 1 mm thick;
24 Geologic setting
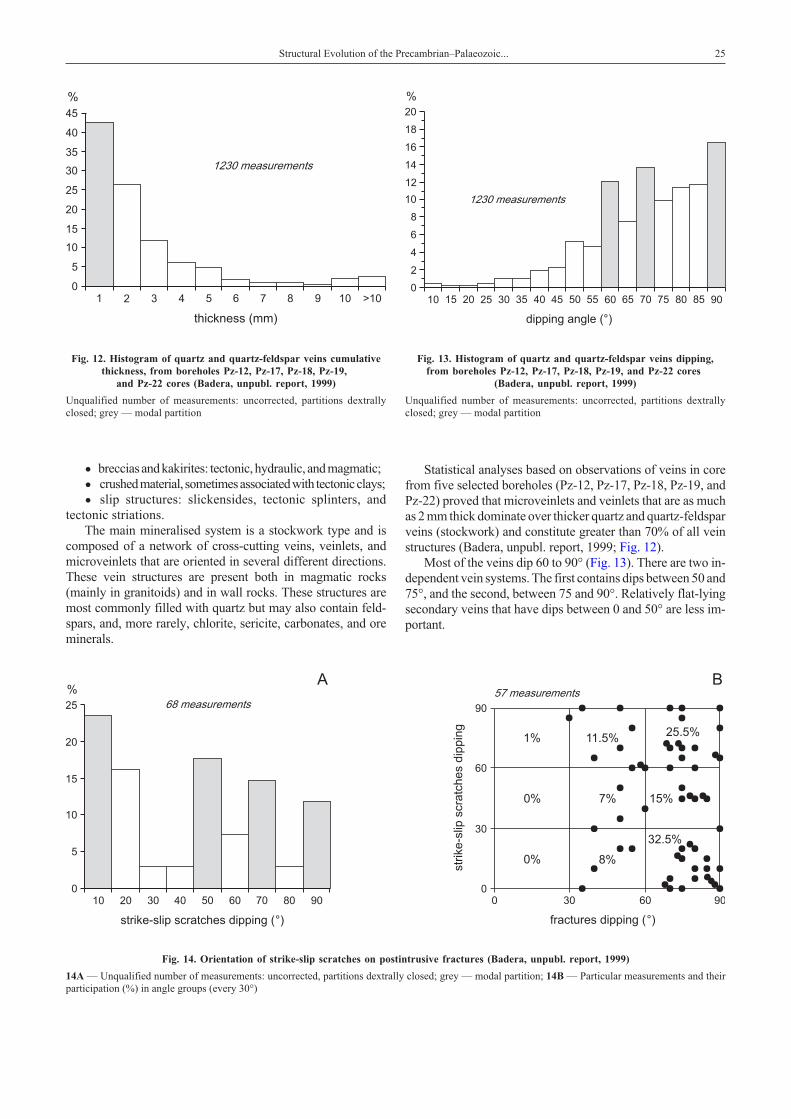
• breccias and kakirites: tectonic, hydraulic, and magmatic;
• crushedmaterial, sometimesassociatedwith tectonicclays;
• slip structures: slickensides, tectonic splinters, andtectonic striations.
The main mineralised system is a stockwork type and iscomposed of a network of cross-cutting veins, veinlets, andmicroveinlets that are oriented in several different directions.These vein structures are present both in magmatic rocks(mainly in granitoids) and in wall rocks. These structures aremost commonly filled with quartz but may also contain feld-spars, and, more rarely, chlorite, sericite, carbonates, and oreminerals.
Statistical analyses based on observations of veins in corefrom five selected boreholes (Pz-12, Pz-17, Pz-18, Pz-19, andPz-22) proved that microveinlets and veinlets that are as muchas 2 mm thick dominate over thicker quartz and quartz-feldsparveins (stockwork) and constitute greater than 70% of all veinstructures (Badera, unpubl. report, 1999; Fig. 12).
Most of the veins dip 60 to 90° (Fig. 13). There are two in-dependent vein systems. The first contains dips between 50 and75°, and the second, between 75 and 90°. Relatively flat-lyingsecondary veins that have dips between 0 and 50° are less im-portant.
Structural Evolution of the Precambrian–Palaeozoic... 25
Fig. 12. Histogram of quartz and quartz-feldspar veins cumulativethickness, from boreholes Pz-12, Pz-17, Pz-18, Pz-19,
and Pz-22 cores (Badera, unpubl. report, 1999)
Unqualified number of measurements: uncorrected, partitions dextrallyclosed; grey — modal partition
Fig. 13. Histogram of quartz and quartz-feldspar veins dipping,from boreholes Pz-12, Pz-17, Pz-18, Pz-19, and Pz-22 cores
(Badera, unpubl. report, 1999)
Unqualified number of measurements: uncorrected, partitions dextrallyclosed; grey — modal partition
Fig. 14. Orientation of strike-slip scratches on postintrusive fractures (Badera, unpubl. report, 1999)
14A — Unqualified number of measurements: uncorrected, partitions dextrally closed; grey — modal partition; 14B — Particular measurements and theirparticipation (%) in angle groups (every 30°)
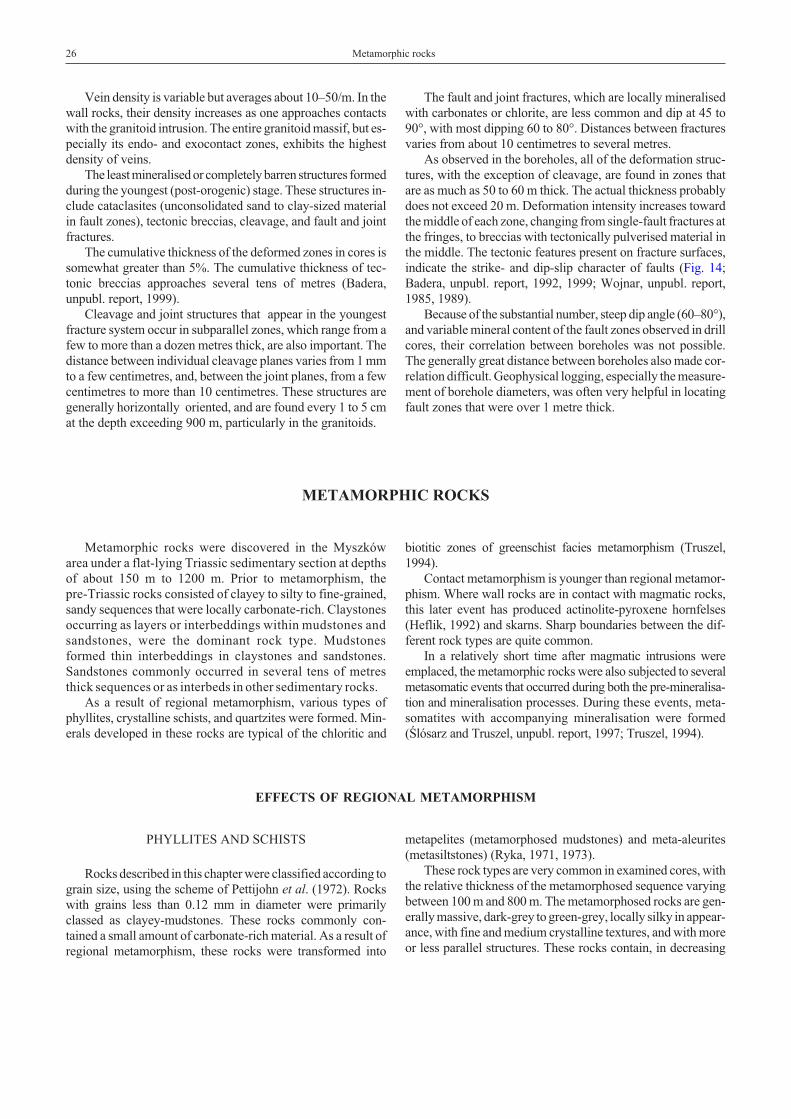
Vein density is variable but averages about 10–50/m. In thewall rocks, their density increases as one approaches contactswith the granitoid intrusion. The entire granitoid massif, but es-pecially its endo- and exocontact zones, exhibits the highestdensity of veins.
The least mineralised or completely barren structures formedduring the youngest (post-orogenic) stage. These structures in-clude cataclasites (unconsolidated sand to clay-sized materialin fault zones), tectonic breccias, cleavage, and fault and jointfractures.
The cumulative thickness of the deformed zones in cores issomewhat greater than 5%. The cumulative thickness of tec-tonic breccias approaches several tens of metres (Badera,unpubl. report, 1999).
Cleavage and joint structures that appear in the youngestfracture system occur in subparallel zones, which range from afew to more than a dozen metres thick, are also important. Thedistance between individual cleavage planes varies from 1 mmto a few centimetres, and, between the joint planes, from a fewcentimetres to more than 10 centimetres. These structures aregenerally horizontally oriented, and are found every 1 to 5 cmat the depth exceeding 900 m, particularly in the granitoids.
The fault and joint fractures, which are locally mineralisedwith carbonates or chlorite, are less common and dip at 45 to90°, with most dipping 60 to 80°. Distances between fracturesvaries from about 10 centimetres to several metres.
As observed in the boreholes, all of the deformation struc-tures, with the exception of cleavage, are found in zones thatare as much as 50 to 60 m thick. The actual thickness probablydoes not exceed 20 m. Deformation intensity increases towardthe middle of each zone, changing from single-fault fractures atthe fringes, to breccias with tectonically pulverised material inthe middle. The tectonic features present on fracture surfaces,indicate the strike- and dip-slip character of faults (Fig. 14;Badera, unpubl. report, 1992, 1999; Wojnar, unpubl. report,1985, 1989).
Because of the substantial number, steep dip angle (60–80°),and variable mineral content of the fault zones observed in drillcores, their correlation between boreholes was not possible.The generally great distance between boreholes also made cor-relation difficult. Geophysical logging, especially the measure-ment of borehole diameters, was often very helpful in locatingfault zones that were over 1 metre thick.
METAMORPHIC ROCKS
Metamorphic rocks were discovered in the Myszkówarea under a flat-lying Triassic sedimentary section at depthsof about 150 m to 1200 m. Prior to metamorphism, thepre-Triassic rocks consisted of clayey to silty to fine-grained,sandy sequences that were locally carbonate-rich. Claystonesoccurring as layers or interbeddings within mudstones andsandstones, were the dominant rock type. Mudstonesformed thin interbeddings in claystones and sandstones.Sandstones commonly occurred in several tens of metresthick sequences or as interbeds in other sedimentary rocks.
As a result of regional metamorphism, various types ofphyllites, crystalline schists, and quartzites were formed. Min-erals developed in these rocks are typical of the chloritic and
biotitic zones of greenschist facies metamorphism (Truszel,1994).
Contact metamorphism is younger than regional metamor-phism. Where wall rocks are in contact with magmatic rocks,this later event has produced actinolite-pyroxene hornfelses(Heflik, 1992) and skarns. Sharp boundaries between the dif-ferent rock types are quite common.
In a relatively short time after magmatic intrusions wereemplaced, the metamorphic rocks were also subjected to severalmetasomatic events that occurred during both the pre-mineralisa-tion and mineralisation processes. During these events, meta-somatites with accompanying mineralisation were formed(Œlósarz and Truszel, unpubl. report, 1997; Truszel, 1994).
EFFECTS OF REGIONAL METAMORPHISM
PHYLLITES AND SCHISTS
Rocks described in this chapter were classified according tograin size, using the scheme of Pettijohn et al. (1972). Rockswith grains less than 0.12 mm in diameter were primarilyclassed as clayey-mudstones. These rocks commonly con-tained a small amount of carbonate-rich material. As a result ofregional metamorphism, these rocks were transformed into
metapelites (metamorphosed mudstones) and meta-aleurites(metasiltstones) (Ryka, 1971, 1973).
These rock types are very common in examined cores, withthe relative thickness of the metamorphosed sequence varyingbetween 100 m and 800 m. The metamorphosed rocks are gen-erally massive, dark-grey to green-grey, locally silky in appear-ance, with fine and medium crystalline textures, and with moreor less parallel structures. These rocks contain, in decreasing
26 Metamorphic rocks
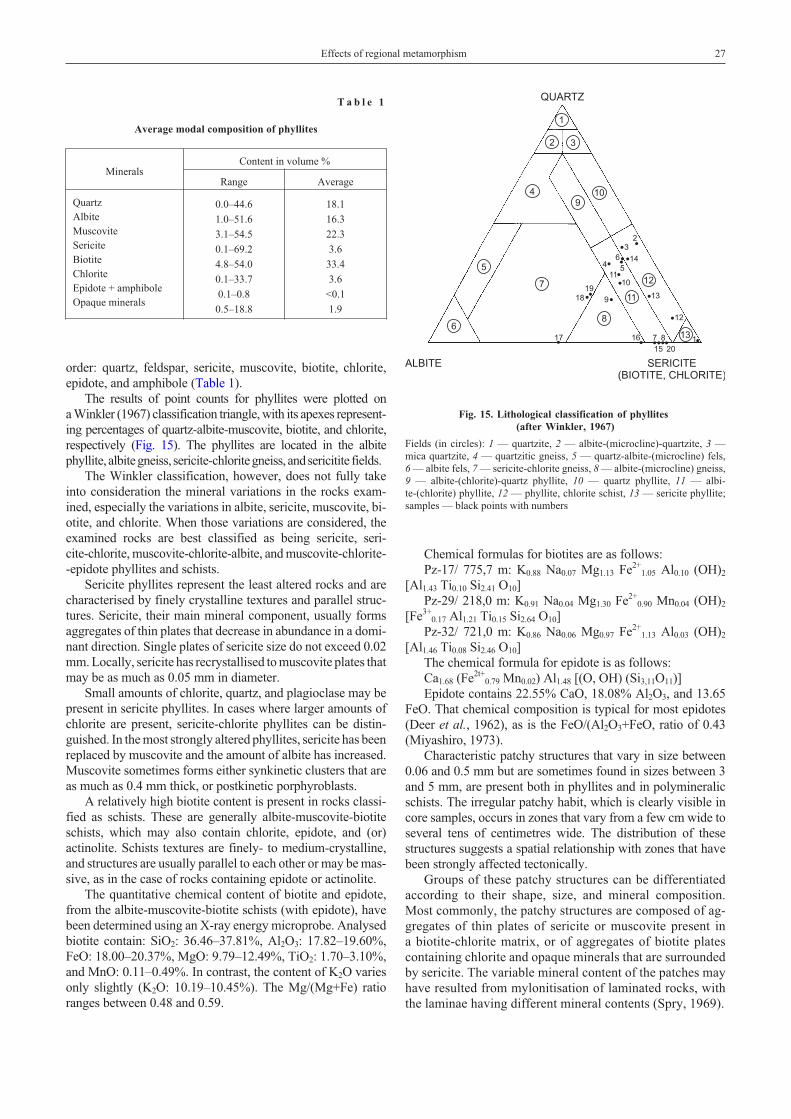
order: quartz, feldspar, sericite, muscovite, biotite, chlorite,epidote, and amphibole (Table 1).
The results of point counts for phyllites were plotted ona Winkler (1967) classification triangle, with its apexes represent-ing percentages of quartz-albite-muscovite, biotite, and chlorite,respectively (Fig. 15). The phyllites are located in the albitephyllite, albitegneiss, sericite-chloritegneiss, andsericitite fields.
The Winkler classification, however, does not fully takeinto consideration the mineral variations in the rocks exam-ined, especially the variations in albite, sericite, muscovite, bi-otite, and chlorite. When those variations are considered, theexamined rocks are best classified as being sericite, seri-cite-chlorite, muscovite-chlorite-albite, and muscovite-chlorite--epidote phyllites and schists.
Sericite phyllites represent the least altered rocks and arecharacterised by finely crystalline textures and parallel struc-tures. Sericite, their main mineral component, usually formsaggregates of thin plates that decrease in abundance in a domi-nant direction. Single plates of sericite size do not exceed 0.02mm. Locally, sericite has recrystallised to muscovite plates thatmay be as much as 0.05 mm in diameter.
Small amounts of chlorite, quartz, and plagioclase may bepresent in sericite phyllites. In cases where larger amounts ofchlorite are present, sericite-chlorite phyllites can be distin-guished. In the most strongly altered phyllites, sericite has beenreplaced by muscovite and the amount of albite has increased.Muscovite sometimes forms either synkinetic clusters that areas much as 0.4 mm thick, or postkinetic porphyroblasts.
A relatively high biotite content is present in rocks classi-fied as schists. These are generally albite-muscovite-biotiteschists, which may also contain chlorite, epidote, and (or)actinolite. Schists textures are finely- to medium-crystalline,and structures are usually parallel to each other or may be mas-sive, as in the case of rocks containing epidote or actinolite.
The quantitative chemical content of biotite and epidote,from the albite-muscovite-biotite schists (with epidote), havebeen determined using an X-ray energy microprobe. Analysedbiotite contain: SiO2: 36.46–37.81%, Al2O3: 17.82–19.60%,FeO: 18.00–20.37%, MgO: 9.79–12.49%, TiO2: 1.70–3.10%,and MnO: 0.11–0.49%. In contrast, the content of K2O variesonly slightly (K2O: 10.19–10.45%). The Mg/(Mg+Fe) ratioranges between 0.48 and 0.59.
Chemical formulas for biotites are as follows:Pz-17/ 775,7 m: K0.88 Na0.07 Mg1.13 Fe2+
1.05 Al0.10 (OH)2
[Al1.43 Ti0.10 Si2.41 O10]Pz-29/ 218,0 m: K0.91 Na0.04 Mg1.30 Fe2+
0.90 Mn0.04 (OH)2
[Fe3+0.17 Al1.21 Ti0.15 Si2.64 O10]
Pz-32/ 721,0 m: K0.86 Na0.06 Mg0.97 Fe2+1.13 Al0.03 (OH)2
[Al1.46 Ti0.08 Si2.46 O10]The chemical formula for epidote is as follows:Ca1.68 (Fe2t+
0.79 Mn0.02) Al1.48 [(O, OH) (Si3,11O11)]Epidote contains 22.55% CaO, 18.08% Al2O3, and 13.65
FeO. That chemical composition is typical for most epidotes(Deer et al., 1962), as is the FeO/(Al2O3+FeO, ratio of 0.43(Miyashiro, 1973).
Characteristic patchy structures that vary in size between0.06 and 0.5 mm but are sometimes found in sizes between 3and 5 mm, are present both in phyllites and in polymineralicschists. The irregular patchy habit, which is clearly visible incore samples, occurs in zones that vary from a few cm wide toseveral tens of centimetres wide. The distribution of thesestructures suggests a spatial relationship with zones that havebeen strongly affected tectonically.
Groups of these patchy structures can be differentiatedaccording to their shape, size, and mineral composition.Most commonly, the patchy structures are composed of ag-gregates of thin plates of sericite or muscovite present ina biotite-chlorite matrix, or of aggregates of biotite platescontaining chlorite and opaque minerals that are surroundedby sericite. The variable mineral content of the patches mayhave resulted from mylonitisation of laminated rocks, withthe laminae having different mineral contents (Spry, 1969).
Effects of regional metamorphism 27
T a b l e 1
Average modal composition of phyllites
MineralsContent in volume %
Range Average
QuartzAlbiteMuscoviteSericiteBiotiteChloriteEpidote + amphiboleOpaque minerals
0.0–44.6
1.0–51.6
3.1–54.5
0.1–69.2
4.8–54.0
0.1–33.7
0.1–0.8
0.5–18.8
18.1
16.3
22.3
3.6
33.4
3.6
<0.1
1.9
1
13
12
11
8
7
1
2 3
4
5
6
910
23
45
6
7 8
9
1011
12
13
14
15
1617
1819
20
QUARTZ
ALBITE SERICITE(BIOTITE, CHLORITE)
Fig. 15. Lithological classification of phyllites(after Winkler, 1967)
Fields (in circles): 1 — quartzite, 2 — albite-(microcline)-quartzite, 3 —mica quartzite, 4 — quartzitic gneiss, 5 — quartz-albite-(microcline) fels,6 — albite fels, 7 — sericite-chlorite gneiss, 8 — albite-(microcline) gneiss,9 — albite-(chlorite)-quartz phyllite, 10 — quartz phyllite, 11 — albi-te-(chlorite) phyllite, 12 — phyllite, chlorite schist, 13 — sericite phyllite;samples — black points with numbers
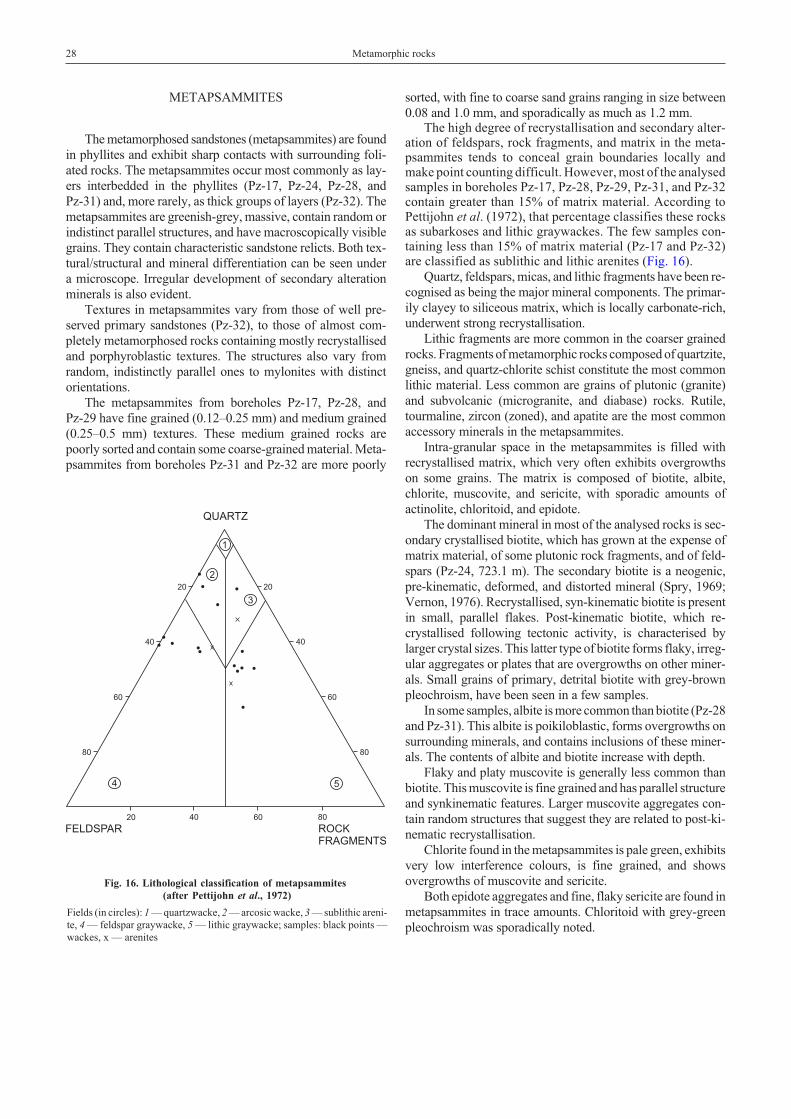
METAPSAMMITES
The metamorphosed sandstones (metapsammites) are foundin phyllites and exhibit sharp contacts with surrounding foli-ated rocks. The metapsammites occur most commonly as lay-ers interbedded in the phyllites (Pz-17, Pz-24, Pz-28, andPz-31) and, more rarely, as thick groups of layers (Pz-32). Themetapsammites are greenish-grey, massive, contain random orindistinct parallel structures, and have macroscopically visiblegrains. They contain characteristic sandstone relicts. Both tex-tural/structural and mineral differentiation can be seen undera microscope. Irregular development of secondary alterationminerals is also evident.
Textures in metapsammites vary from those of well pre-served primary sandstones (Pz-32), to those of almost com-pletely metamorphosed rocks containing mostly recrystallisedand porphyroblastic textures. The structures also vary fromrandom, indistinctly parallel ones to mylonites with distinctorientations.
The metapsammites from boreholes Pz-17, Pz-28, andPz-29 have fine grained (0.12–0.25 mm) and medium grained(0.25–0.5 mm) textures. These medium grained rocks arepoorly sorted and contain some coarse-grained material. Meta-psammites from boreholes Pz-31 and Pz-32 are more poorly
sorted, with fine to coarse sand grains ranging in size between0.08 and 1.0 mm, and sporadically as much as 1.2 mm.
The high degree of recrystallisation and secondary alter-ation of feldspars, rock fragments, and matrix in the meta-psammites tends to conceal grain boundaries locally andmake point counting difficult. However, most of the analysedsamples in boreholes Pz-17, Pz-28, Pz-29, Pz-31, and Pz-32contain greater than 15% of matrix material. According toPettijohn et al. (1972), that percentage classifies these rocksas subarkoses and lithic graywackes. The few samples con-taining less than 15% of matrix material (Pz-17 and Pz-32)are classified as sublithic and lithic arenites (Fig. 16).
Quartz, feldspars, micas, and lithic fragments have been re-cognised as being the major mineral components. The primar-ily clayey to siliceous matrix, which is locally carbonate-rich,underwent strong recrystallisation.
Lithic fragments are more common in the coarser grainedrocks. Fragments of metamorphic rocks composed of quartzite,gneiss, and quartz-chlorite schist constitute the most commonlithic material. Less common are grains of plutonic (granite)and subvolcanic (microgranite, and diabase) rocks. Rutile,tourmaline, zircon (zoned), and apatite are the most commonaccessory minerals in the metapsammites.
Intra-granular space in the metapsammites is filled withrecrystallised matrix, which very often exhibits overgrowthson some grains. The matrix is composed of biotite, albite,chlorite, muscovite, and sericite, with sporadic amounts ofactinolite, chloritoid, and epidote.
The dominant mineral in most of the analysed rocks is sec-ondary crystallised biotite, which has grown at the expense ofmatrix material, of some plutonic rock fragments, and of feld-spars (Pz-24, 723.1 m). The secondary biotite is a neogenic,pre-kinematic, deformed, and distorted mineral (Spry, 1969;Vernon, 1976). Recrystallised, syn-kinematic biotite is presentin small, parallel flakes. Post-kinematic biotite, which re-crystallised following tectonic activity, is characterised bylarger crystal sizes. This latter type of biotite forms flaky, irreg-ular aggregates or plates that are overgrowths on other miner-als. Small grains of primary, detrital biotite with grey-brownpleochroism, have been seen in a few samples.
In some samples, albite is more common than biotite (Pz-28and Pz-31). This albite is poikiloblastic, forms overgrowths onsurrounding minerals, and contains inclusions of these miner-als. The contents of albite and biotite increase with depth.
Flaky and platy muscovite is generally less common thanbiotite. This muscovite is fine grained and has parallel structureand synkinematic features. Larger muscovite aggregates con-tain random structures that suggest they are related to post-ki-nematic recrystallisation.
Chlorite found in the metapsammites is pale green, exhibitsvery low interference colours, is fine grained, and showsovergrowths of muscovite and sericite.
Both epidote aggregates and fine, flaky sericite are found inmetapsammites in trace amounts. Chloritoid with grey-greenpleochroism was sporadically noted.
28 Metamorphic rocks
Fig. 16. Lithological classification of metapsammites(after Pettijohn et al., 1972)
Fields (in circles): 1 — quartzwacke, 2 — arcosic wacke, 3 — sublithic areni-te, 4 — feldspar graywacke, 5 — lithic graywacke; samples: black points —wackes, x — arenites
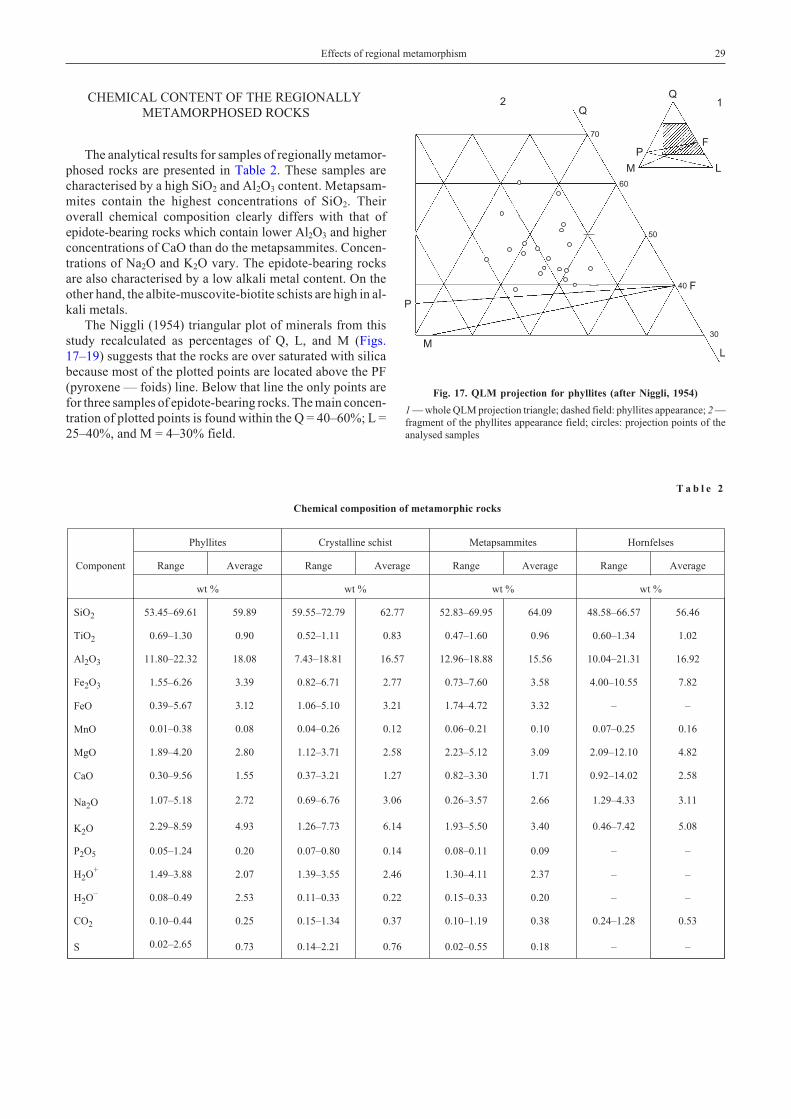
CHEMICAL CONTENT OF THE REGIONALLYMETAMORPHOSED ROCKS
The analytical results for samples of regionally metamor-phosed rocks are presented in Table 2. These samples arecharacterised by a high SiO2 and Al2O3 content. Metapsam-mites contain the highest concentrations of SiO2. Theiroverall chemical composition clearly differs with that ofepidote-bearing rocks which contain lower Al2O3 and higherconcentrations of CaO than do the metapsammites. Concen-trations of Na2O and K2O vary. The epidote-bearing rocksare also characterised by a low alkali metal content. On theother hand, the albite-muscovite-biotite schists are high in al-kali metals.
The Niggli (1954) triangular plot of minerals from thisstudy recalculated as percentages of Q, L, and M (Figs.17–19) suggests that the rocks are over saturated with silicabecause most of the plotted points are located above the PF(pyroxene — foids) line. Below that line the only points arefor three samples of epidote-bearing rocks. The main concen-tration of plotted points is found within the Q = 40–60%; L =25–40%, and M = 4–30% field.
Effects of regional metamorphism 29
T a b l e 2
Chemical composition of metamorphic rocks
Component
Phyllites Crystalline schist Metapsammites Hornfelses
Range Average Range Average Range Average Range Average
wt % wt % wt % wt %
SiO2 53.45–69.61 59.89 59.55–72.79 62.77 52.83–69.95 64.09 48.58–66.57 56.46
TiO2 0.69–1.30 0.90 0.52–1.11 0.83 0.47–1.60 0.96 0.60–1.34 1.02
Al2O3 11.80–22.32 18.08 7.43–18.81 16.57 12.96–18.88 15.56 10.04–21.31 16.92
Fe2O3 1.55–6.26 3.39 0.82–6.71 2.77 0.73–7.60 3.58 4.00–10.55 7.82
FeO 0.39–5.67 3.12 1.06–5.10 3.21 1.74–4.72 3.32 – –
MnO 0.01–0.38 0.08 0.04–0.26 0.12 0.06–0.21 0.10 0.07–0.25 0.16
MgO 1.89–4.20 2.80 1.12–3.71 2.58 2.23–5.12 3.09 2.09–12.10 4.82
CaO 0.30–9.56 1.55 0.37–3.21 1.27 0.82–3.30 1.71 0.92–14.02 2.58
Na2O 1.07–5.18 2.72 0.69–6.76 3.06 0.26–3.57 2.66 1.29–4.33 3.11
K2O 2.29–8.59 4.93 1.26–7.73 6.14 1.93–5.50 3.40 0.46–7.42 5.08
P2O5 0.05–1.24 0.20 0.07–0.80 0.14 0.08–0.11 0.09 – –
H2O+ 1.49–3.88 2.07 1.39–3.55 2.46 1.30–4.11 2.37 – –
H2O– 0.08–0.49 2.53 0.11–0.33 0.22 0.15–0.33 0.20 – –
CO2 0.10–0.44 0.25 0.15–1.34 0.37 0.10–1.19 0.38 0.24–1.28 0.53
S 0.02–2.65 0.73 0.14–2.21 0.76 0.02–0.55 0.18 – –
Fig. 17. QLM projection for phyllites (after Niggli, 1954)
1 — whole QLM projection triangle; dashed field: phyllites appearance; 2 —fragment of the phyllites appearance field; circles: projection points of theanalysed samples
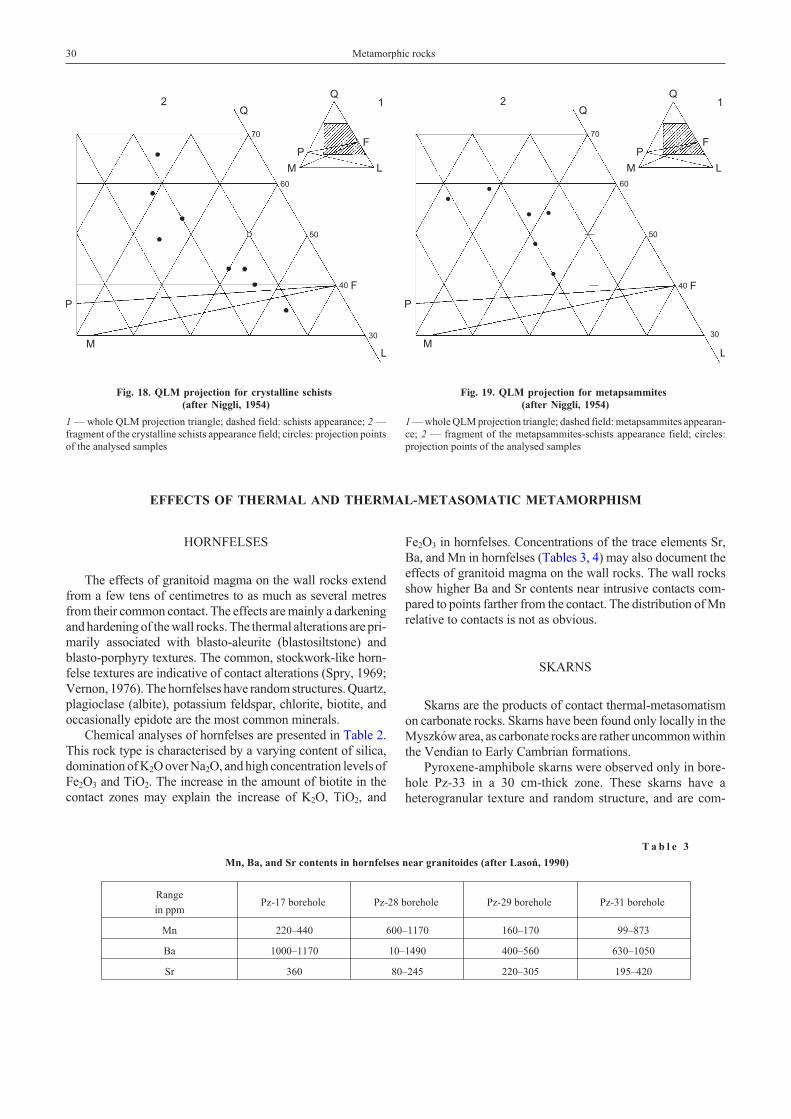
EFFECTS OF THERMAL AND THERMAL-METASOMATIC METAMORPHISM
HORNFELSES
The effects of granitoid magma on the wall rocks extendfrom a few tens of centimetres to as much as several metresfrom their common contact. The effects are mainly a darkeningand hardening of the wall rocks. The thermal alterations are pri-marily associated with blasto-aleurite (blastosiltstone) andblasto-porphyry textures. The common, stockwork-like horn-felse textures are indicative of contact alterations (Spry, 1969;Vernon, 1976). The hornfelses have random structures. Quartz,plagioclase (albite), potassium feldspar, chlorite, biotite, andoccasionally epidote are the most common minerals.
Chemical analyses of hornfelses are presented in Table 2.This rock type is characterised by a varying content of silica,domination of K2O over Na2O, and high concentration levels ofFe2O3 and TiO2. The increase in the amount of biotite in thecontact zones may explain the increase of K2O, TiO2, and
Fe2O3 in hornfelses. Concentrations of the trace elements Sr,Ba, and Mn in hornfelses (Tables 3, 4) may also document theeffects of granitoid magma on the wall rocks. The wall rocksshow higher Ba and Sr contents near intrusive contacts com-pared to points farther from the contact. The distribution of Mnrelative to contacts is not as obvious.
SKARNS
Skarns are the products of contact thermal-metasomatismon carbonate rocks. Skarns have been found only locally in theMyszków area, as carbonate rocks are rather uncommon withinthe Vendian to Early Cambrian formations.
Pyroxene-amphibole skarns were observed only in bore-hole Pz-33 in a 30 cm-thick zone. These skarns have aheterogranular texture and random structure, and are com-
30 Metamorphic rocks
Fig. 18. QLM projection for crystalline schists(after Niggli, 1954)
1 — whole QLM projection triangle; dashed field: schists appearance; 2 —fragment of the crystalline schists appearance field; circles: projection pointsof the analysed samples
Fig. 19. QLM projection for metapsammites(after Niggli, 1954)
1 — whole QLM projection triangle; dashed field: metapsammites appearan-ce; 2 — fragment of the metapsammites-schists appearance field; circles:projection points of the analysed samples
T a b l e 3
Mn, Ba, and Sr contents in hornfelses near granitoides (after Lasoñ, 1990)
Range
in ppmPz-17 borehole Pz-28 borehole Pz-29 borehole Pz-31 borehole
Mn 220–440 600–1170 160–170 99–873
Ba 1000–1170 10–1490 400–560 630–1050
Sr 360 80–245 220–305 195–420
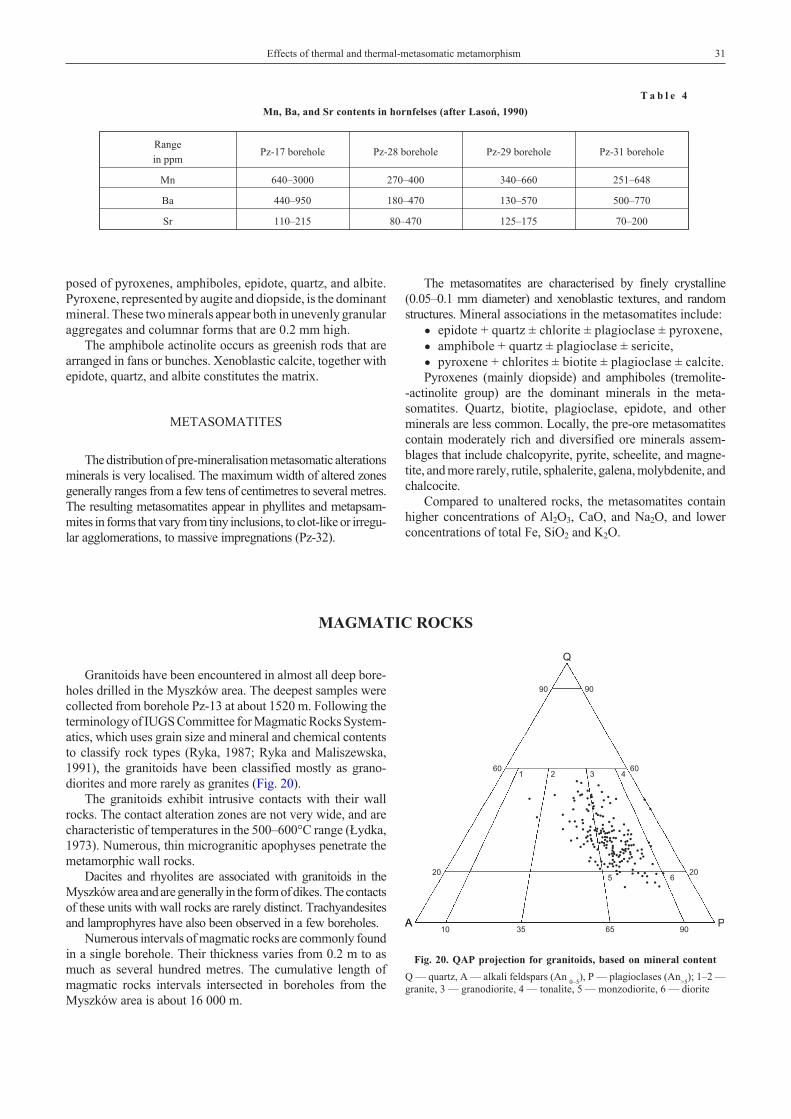
posed of pyroxenes, amphiboles, epidote, quartz, and albite.Pyroxene, represented by augite and diopside, is the dominantmineral. These two minerals appear both in unevenly granularaggregates and columnar forms that are 0.2 mm high.
The amphibole actinolite occurs as greenish rods that arearranged in fans or bunches. Xenoblastic calcite, together withepidote, quartz, and albite constitutes the matrix.
METASOMATITES
The distribution of pre-mineralisation metasomatic alterationsminerals is very localised. The maximum width of altered zonesgenerally ranges from a few tens of centimetres to several metres.The resulting metasomatites appear in phyllites and metapsam-mites in forms that vary from tiny inclusions, to clot-like or irregu-lar agglomerations, to massive impregnations (Pz-32).
The metasomatites are characterised by finely crystalline(0.05–0.1 mm diameter) and xenoblastic textures, and randomstructures. Mineral associations in the metasomatites include:
• epidote + quartz ± chlorite ± plagioclase ± pyroxene,
• amphibole + quartz ± plagioclase ± sericite,
• pyroxene + chlorites ± biotite ± plagioclase ± calcite.Pyroxenes (mainly diopside) and amphiboles (tremolite-
-actinolite group) are the dominant minerals in the meta-somatites. Quartz, biotite, plagioclase, epidote, and otherminerals are less common. Locally, the pre-ore metasomatitescontain moderately rich and diversified ore minerals assem-blages that include chalcopyrite, pyrite, scheelite, and magne-tite, and more rarely, rutile, sphalerite, galena, molybdenite, andchalcocite.
Compared to unaltered rocks, the metasomatites containhigher concentrations of Al2O3, CaO, and Na2O, and lowerconcentrations of total Fe, SiO2 and K2O.
MAGMATIC ROCKS
Granitoids have been encountered in almost all deep bore-holes drilled in the Myszków area. The deepest samples werecollected from borehole Pz-13 at about 1520 m. Following theterminology of IUGS Committee for Magmatic Rocks System-atics, which uses grain size and mineral and chemical contentsto classify rock types (Ryka, 1987; Ryka and Maliszewska,1991), the granitoids have been classified mostly as grano-diorites and more rarely as granites (Fig. 20).
The granitoids exhibit intrusive contacts with their wallrocks. The contact alteration zones are not very wide, and arecharacteristic of temperatures in the 500–600°C range (£ydka,1973). Numerous, thin microgranitic apophyses penetrate themetamorphic wall rocks.
Dacites and rhyolites are associated with granitoids in theMyszków area and are generally in the form of dikes. The contactsof these units with wall rocks are rarely distinct. Trachyandesitesand lamprophyres have also been observed in a few boreholes.
Numerous intervals of magmatic rocks are commonly foundin a single borehole. Their thickness varies from 0.2 m to asmuch as several hundred metres. The cumulative length ofmagmatic rocks intervals intersected in boreholes from theMyszków area is about 16 000 m.
Effects of thermal and thermal-metasomatic metamorphism 31
T a b l e 4
Mn, Ba, and Sr contents in hornfelses (after Lasoñ, 1990)
Range
in ppmPz-17 borehole Pz-28 borehole Pz-29 borehole Pz-31 borehole
Mn 640–3000 270–400 340–660 251–648
Ba 440–950 180–470 130–570 500–770
Sr 110–215 80–470 125–175 70–200
A P
Q
10 35 65 90
2020
6060
9090
1 2 3 4
A
5 6
Fig. 20. QAP projection for granitoids, based on mineral content
Q — quartz, A — alkali feldspars (An0–5
), P — plagioclases (An>5
); 1–2 —granite, 3 — granodiorite, 4 — tonalite, 5 — monzodiorite, 6 — diorite
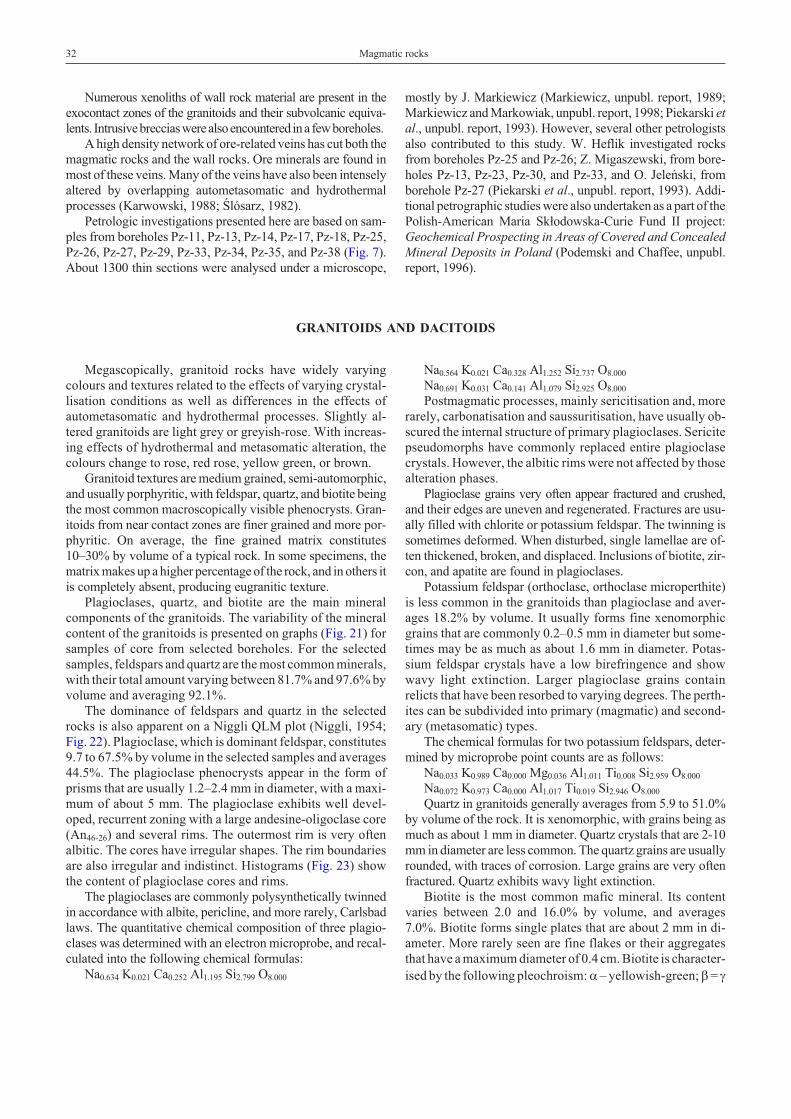
Numerous xenoliths of wall rock material are present in theexocontact zones of the granitoids and their subvolcanic equiva-lents. Intrusivebrecciaswerealsoencountered ina fewboreholes.
A high density network of ore-related veins has cut both themagmatic rocks and the wall rocks. Ore minerals are found inmost of these veins. Many of the veins have also been intenselyaltered by overlapping autometasomatic and hydrothermalprocesses (Karwowski, 1988; Œlósarz, 1982).
Petrologic investigations presented here are based on sam-ples from boreholes Pz-11, Pz-13, Pz-14, Pz-17, Pz-18, Pz-25,Pz-26, Pz-27, Pz-29, Pz-33, Pz-34, Pz-35, and Pz-38 (Fig. 7).About 1300 thin sections were analysed under a microscope,
mostly by J. Markiewicz (Markiewicz, unpubl. report, 1989;Markiewicz and Markowiak, unpubl. report, 1998; Piekarski et
al., unpubl. report, 1993). However, several other petrologistsalso contributed to this study. W. Heflik investigated rocksfrom boreholes Pz-25 and Pz-26; Z. Migaszewski, from bore-holes Pz-13, Pz-23, Pz-30, and Pz-33, and O. Jeleñski, fromborehole Pz-27 (Piekarski et al., unpubl. report, 1993). Addi-tional petrographic studies were also undertaken as a part of thePolish-American Maria Sk³odowska-Curie Fund II project:Geochemical Prospecting in Areas of Covered and Concealed
Mineral Deposits in Poland (Podemski and Chaffee, unpubl.report, 1996).
GRANITOIDS AND DACITOIDS
Megascopically, granitoid rocks have widely varyingcolours and textures related to the effects of varying crystal-lisation conditions as well as differences in the effects ofautometasomatic and hydrothermal processes. Slightly al-tered granitoids are light grey or greyish-rose. With increas-ing effects of hydrothermal and metasomatic alteration, thecolours change to rose, red rose, yellow green, or brown.
Granitoid textures are medium grained, semi-automorphic,and usually porphyritic, with feldspar, quartz, and biotite beingthe most common macroscopically visible phenocrysts. Gran-itoids from near contact zones are finer grained and more por-phyritic. On average, the fine grained matrix constitutes10–30% by volume of a typical rock. In some specimens, thematrix makes up a higher percentage of the rock, and in others itis completely absent, producing eugranitic texture.
Plagioclases, quartz, and biotite are the main mineralcomponents of the granitoids. The variability of the mineralcontent of the granitoids is presented on graphs (Fig. 21) forsamples of core from selected boreholes. For the selectedsamples, feldspars and quartz are the most common minerals,with their total amount varying between 81.7% and 97.6% byvolume and averaging 92.1%.
The dominance of feldspars and quartz in the selectedrocks is also apparent on a Niggli QLM plot (Niggli, 1954;Fig. 22). Plagioclase, which is dominant feldspar, constitutes9.7 to 67.5% by volume in the selected samples and averages44.5%. The plagioclase phenocrysts appear in the form ofprisms that are usually 1.2–2.4 mm in diameter, with a maxi-mum of about 5 mm. The plagioclase exhibits well devel-oped, recurrent zoning with a large andesine-oligoclase core(An46-26) and several rims. The outermost rim is very oftenalbitic. The cores have irregular shapes. The rim boundariesare also irregular and indistinct. Histograms (Fig. 23) showthe content of plagioclase cores and rims.
The plagioclases are commonly polysynthetically twinnedin accordance with albite, pericline, and more rarely, Carlsbadlaws. The quantitative chemical composition of three plagio-clases was determined with an electron microprobe, and recal-culated into the following chemical formulas:
Na0.634 K0.021 Ca0.252 Al1.195 Si2.799 O8.000
Na0.564 K0.021 Ca0.328 Al1.252 Si2.737 O8.000
Na0.691 K0.031 Ca0.141 Al1.079 Si2.925 O8.000
Postmagmatic processes, mainly sericitisation and, morerarely, carbonatisation and saussuritisation, have usually ob-scured the internal structure of primary plagioclases. Sericitepseudomorphs have commonly replaced entire plagioclasecrystals. However, the albitic rims were not affected by thosealteration phases.
Plagioclase grains very often appear fractured and crushed,and their edges are uneven and regenerated. Fractures are usu-ally filled with chlorite or potassium feldspar. The twinning issometimes deformed. When disturbed, single lamellae are of-ten thickened, broken, and displaced. Inclusions of biotite, zir-con, and apatite are found in plagioclases.
Potassium feldspar (orthoclase, orthoclase microperthite)is less common in the granitoids than plagioclase and aver-ages 18.2% by volume. It usually forms fine xenomorphicgrains that are commonly 0.2–0.5 mm in diameter but some-times may be as much as about 1.6 mm in diameter. Potas-sium feldspar crystals have a low birefringence and showwavy light extinction. Larger plagioclase grains containrelicts that have been resorbed to varying degrees. The perth-ites can be subdivided into primary (magmatic) and second-ary (metasomatic) types.
The chemical formulas for two potassium feldspars, deter-mined by microprobe point counts are as follows:
Na0.033 K0.989 Ca0.000 Mg0.036 Al1.011 Ti0.008 Si2.959 O8.000
Na0.072 K0.973 Ca0.000 Al1.017 Ti0.019 Si2.946 O8.000
Quartz in granitoids generally averages from 5.9 to 51.0%by volume of the rock. It is xenomorphic, with grains being asmuch as about 1 mm in diameter. Quartz crystals that are 2-10mm in diameter are less common. The quartz grains are usuallyrounded, with traces of corrosion. Large grains are very oftenfractured. Quartz exhibits wavy light extinction.
Biotite is the most common mafic mineral. Its contentvaries between 2.0 and 16.0% by volume, and averages7.0%. Biotite forms single plates that are about 2 mm in di-ameter. More rarely seen are fine flakes or their aggregatesthat have a maximum diameter of 0.4 cm. Biotite is character-ised by the following pleochroism: � – yellowish-green; � = �
32 Magmatic rocks
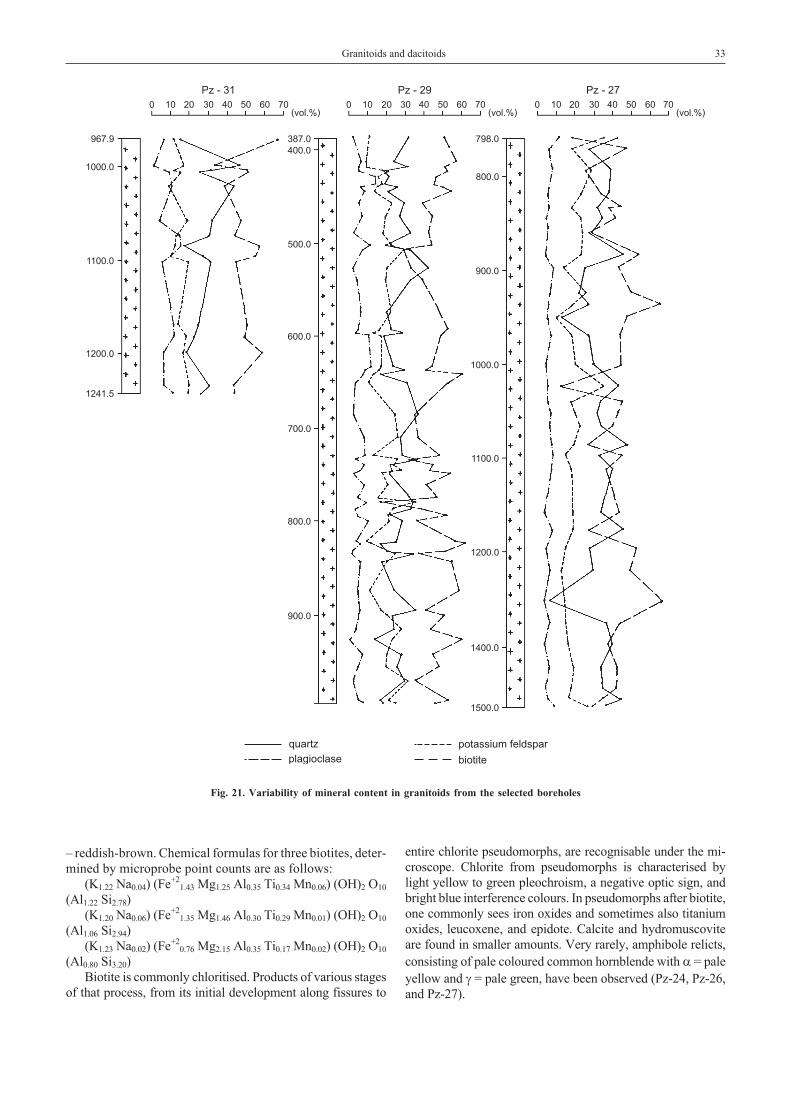
– reddish-brown. Chemical formulas for three biotites, deter-mined by microprobe point counts are as follows:
(K1.22 Na0.04) (Fe+21.43 Mg1.25 Al0.35 Ti0.34 Mn0.06) (OH)2 O10
(Al1.22 Si2.78)(K1.20 Na0.06) (Fe+2
1.35 Mg1.46 Al0.30 Ti0.29 Mn0.01) (OH)2 O10
(Al1.06 Si2.94)(K1.23 Na0.02) (Fe+2
0.76 Mg2.15 Al0.35 Ti0.17 Mn0.02) (OH)2 O10
(Al0.80 Si3.20)Biotite is commonly chloritised. Products of various stages
of that process, from its initial development along fissures to
entire chlorite pseudomorphs, are recognisable under the mi-croscope. Chlorite from pseudomorphs is characterised bylight yellow to green pleochroism, a negative optic sign, andbright blue interference colours. In pseudomorphs after biotite,one commonly sees iron oxides and sometimes also titaniumoxides, leucoxene, and epidote. Calcite and hydromuscoviteare found in smaller amounts. Very rarely, amphibole relicts,consisting of pale coloured common hornblende with � = paleyellow and � = pale green, have been observed (Pz-24, Pz-26,and Pz-27).
Granitoids and dacitoids 33
Fig. 21. Variability of mineral content in granitoids from the selected boreholes
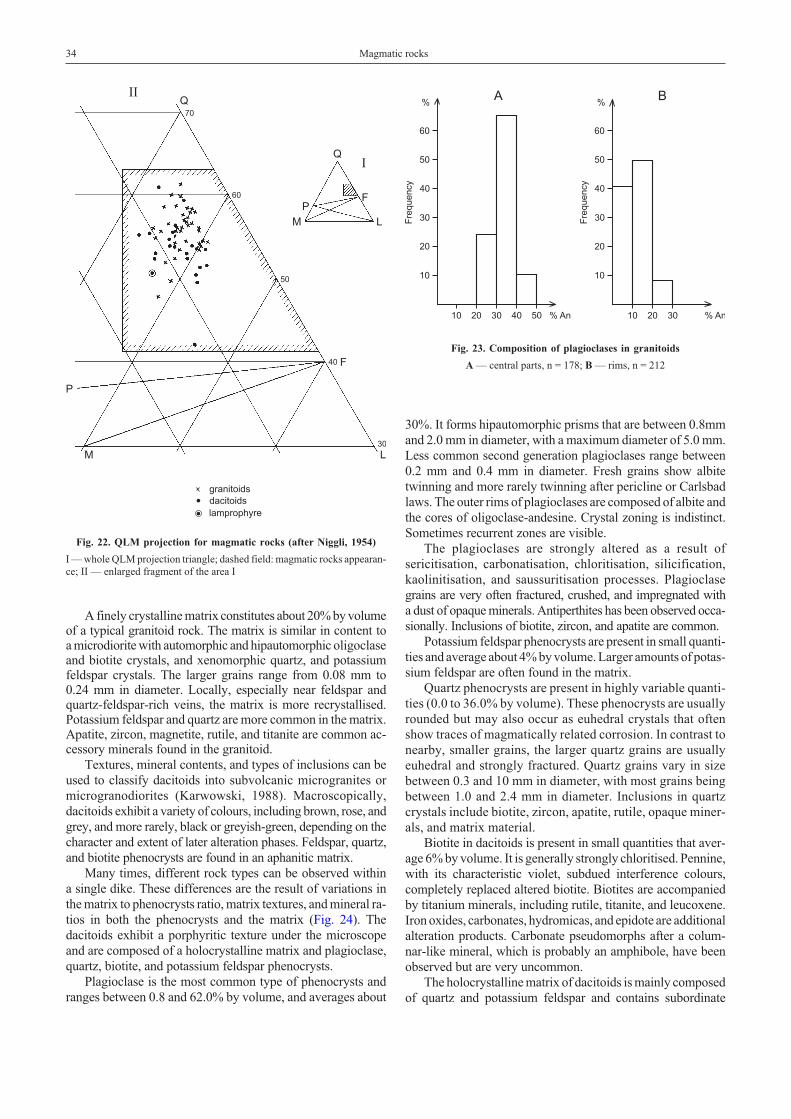
A finely crystalline matrix constitutes about 20% by volumeof a typical granitoid rock. The matrix is similar in content toa microdiorite with automorphic and hipautomorphic oligoclaseand biotite crystals, and xenomorphic quartz, and potassiumfeldspar crystals. The larger grains range from 0.08 mm to0.24 mm in diameter. Locally, especially near feldspar andquartz-feldspar-rich veins, the matrix is more recrystallised.Potassium feldspar and quartz are more common in the matrix.Apatite, zircon, magnetite, rutile, and titanite are common ac-cessory minerals found in the granitoid.
Textures, mineral contents, and types of inclusions can beused to classify dacitoids into subvolcanic microgranites ormicrogranodiorites (Karwowski, 1988). Macroscopically,dacitoids exhibit a variety of colours, including brown, rose, andgrey, and more rarely, black or greyish-green, depending on thecharacter and extent of later alteration phases. Feldspar, quartz,and biotite phenocrysts are found in an aphanitic matrix.
Many times, different rock types can be observed withina single dike. These differences are the result of variations inthe matrix to phenocrysts ratio, matrix textures, and mineral ra-tios in both the phenocrysts and the matrix (Fig. 24). Thedacitoids exhibit a porphyritic texture under the microscopeand are composed of a holocrystalline matrix and plagioclase,quartz, biotite, and potassium feldspar phenocrysts.
Plagioclase is the most common type of phenocrysts andranges between 0.8 and 62.0% by volume, and averages about
30%. It forms hipautomorphic prisms that are between 0.8mmand 2.0 mm in diameter, with a maximum diameter of 5.0 mm.Less common second generation plagioclases range between0.2 mm and 0.4 mm in diameter. Fresh grains show albitetwinning and more rarely twinning after pericline or Carlsbadlaws. The outer rims of plagioclases are composed of albite andthe cores of oligoclase-andesine. Crystal zoning is indistinct.Sometimes recurrent zones are visible.
The plagioclases are strongly altered as a result ofsericitisation, carbonatisation, chloritisation, silicification,kaolinitisation, and saussuritisation processes. Plagioclasegrains are very often fractured, crushed, and impregnated witha dust of opaque minerals. Antiperthites has been observed occa-sionally. Inclusions of biotite, zircon, and apatite are common.
Potassium feldspar phenocrysts are present in small quanti-ties and average about 4% by volume. Larger amounts of potas-sium feldspar are often found in the matrix.
Quartz phenocrysts are present in highly variable quanti-ties (0.0 to 36.0% by volume). These phenocrysts are usuallyrounded but may also occur as euhedral crystals that oftenshow traces of magmatically related corrosion. In contrast tonearby, smaller grains, the larger quartz grains are usuallyeuhedral and strongly fractured. Quartz grains vary in sizebetween 0.3 and 10 mm in diameter, with most grains beingbetween 1.0 and 2.4 mm in diameter. Inclusions in quartzcrystals include biotite, zircon, apatite, rutile, opaque miner-als, and matrix material.
Biotite in dacitoids is present in small quantities that aver-age 6% by volume. It is generally strongly chloritised. Pennine,with its characteristic violet, subdued interference colours,completely replaced altered biotite. Biotites are accompaniedby titanium minerals, including rutile, titanite, and leucoxene.Iron oxides, carbonates, hydromicas, and epidote are additionalalteration products. Carbonate pseudomorphs after a colum-nar-like mineral, which is probably an amphibole, have beenobserved but are very uncommon.
The holocrystalline matrix of dacitoids is mainly composedof quartz and potassium feldspar and contains subordinate
34 Magmatic rocks
70
60
50
40 F
30
LM
P
QII
IQ
F
LM
P
granitoids
dacitoids
lamprophyre
Fig. 22. QLM projection for magmatic rocks (after Niggli, 1954)
I — whole QLM projection triangle; dashed field: magmatic rocks appearan-ce; II — enlarged fragment of the area I
Fig. 23. Composition of plagioclases in granitoids
A — central parts, n = 178; B — rims, n = 212
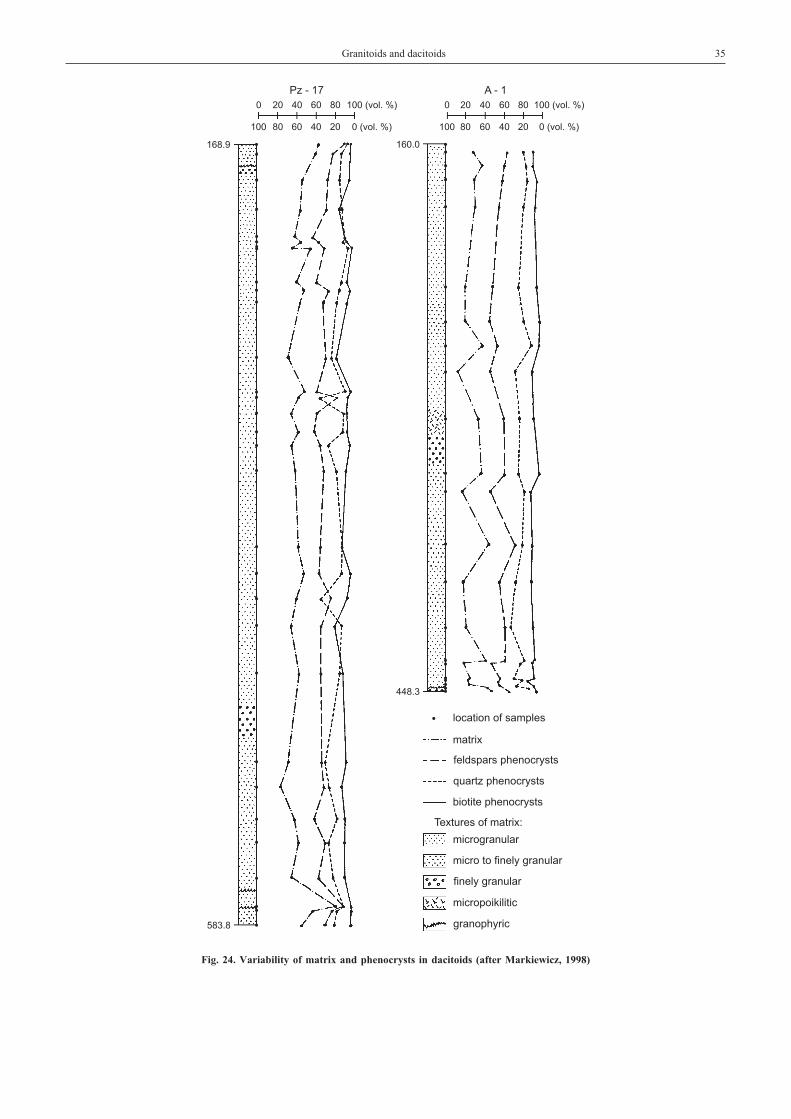
Granitoids and dacitoids 35
Fig. 24. Variability of matrix and phenocrysts in dacitoids (after Markiewicz, 1998)
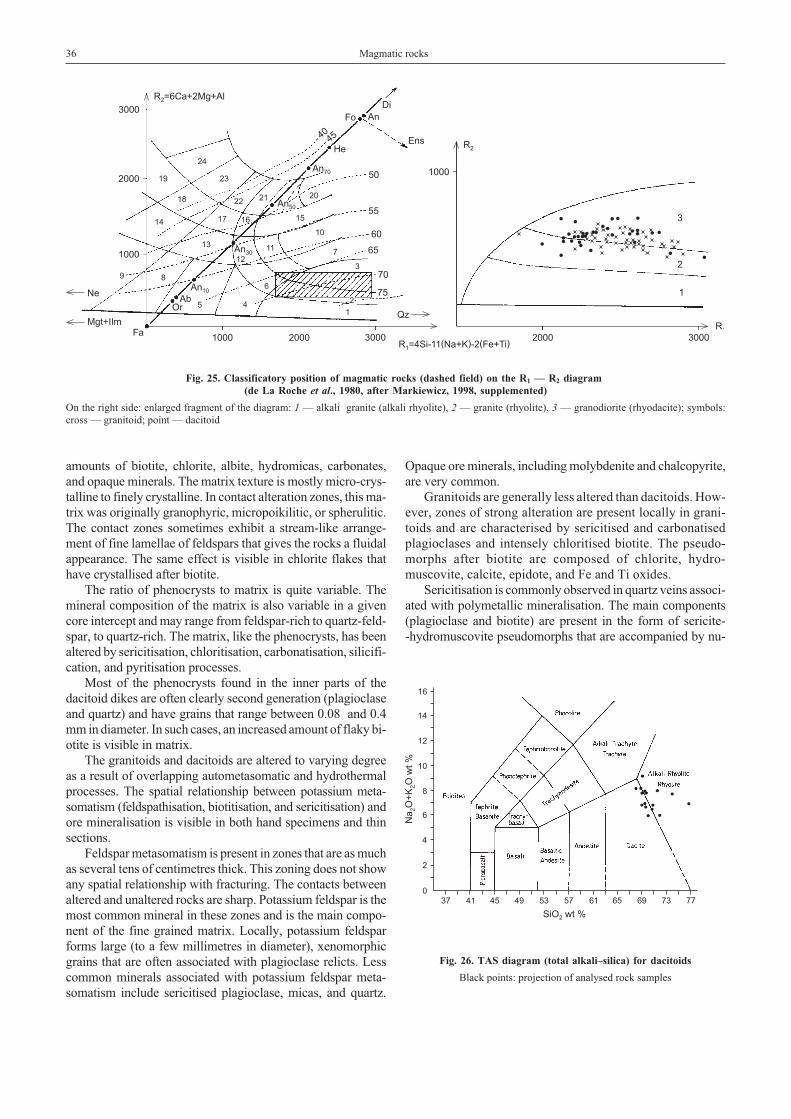
amounts of biotite, chlorite, albite, hydromicas, carbonates,and opaque minerals. The matrix texture is mostly micro-crys-talline to finely crystalline. In contact alteration zones, this ma-trix was originally granophyric, micropoikilitic, or spherulitic.The contact zones sometimes exhibit a stream-like arrange-ment of fine lamellae of feldspars that gives the rocks a fluidalappearance. The same effect is visible in chlorite flakes thathave crystallised after biotite.
The ratio of phenocrysts to matrix is quite variable. Themineral composition of the matrix is also variable in a givencore intercept and may range from feldspar-rich to quartz-feld-spar, to quartz-rich. The matrix, like the phenocrysts, has beenaltered by sericitisation, chloritisation, carbonatisation, silicifi-cation, and pyritisation processes.
Most of the phenocrysts found in the inner parts of thedacitoid dikes are often clearly second generation (plagioclaseand quartz) and have grains that range between 0.08 and 0.4mm in diameter. In such cases, an increased amount of flaky bi-otite is visible in matrix.
The granitoids and dacitoids are altered to varying degreeas a result of overlapping autometasomatic and hydrothermalprocesses. The spatial relationship between potassium meta-somatism (feldspathisation, biotitisation, and sericitisation) andore mineralisation is visible in both hand specimens and thinsections.
Feldspar metasomatism is present in zones that are as muchas several tens of centimetres thick. This zoning does not showany spatial relationship with fracturing. The contacts betweenaltered and unaltered rocks are sharp. Potassium feldspar is themost common mineral in these zones and is the main compo-nent of the fine grained matrix. Locally, potassium feldsparforms large (to a few millimetres in diameter), xenomorphicgrains that are often associated with plagioclase relicts. Lesscommon minerals associated with potassium feldspar meta-somatism include sericitised plagioclase, micas, and quartz.
Opaque ore minerals, including molybdenite and chalcopyrite,are very common.
Granitoids are generally less altered than dacitoids. How-ever, zones of strong alteration are present locally in grani-toids and are characterised by sericitised and carbonatisedplagioclases and intensely chloritised biotite. The pseudo-morphs after biotite are composed of chlorite, hydro-muscovite, calcite, epidote, and Fe and Ti oxides.
Sericitisation is commonly observed in quartz veins associ-ated with polymetallic mineralisation. The main components(plagioclase and biotite) are present in the form of sericite--hydromuscovite pseudomorphs that are accompanied by nu-
36 Magmatic rocks
Fig. 25. Classificatory position of magmatic rocks (dashed field) on the R1 — R2 diagram(de La Roche et al., 1980, after Markiewicz, 1998, supplemented)
On the right side: enlarged fragment of the diagram: 1 — alkali granite (alkali rhyolite), 2 — granite (rhyolite), 3 — granodiorite (rhyodacite); symbols:cross — granitoid; point — dacitoid
Fig. 26. TAS diagram (total alkali–silica) for dacitoids
Black points: projection of analysed rock samples
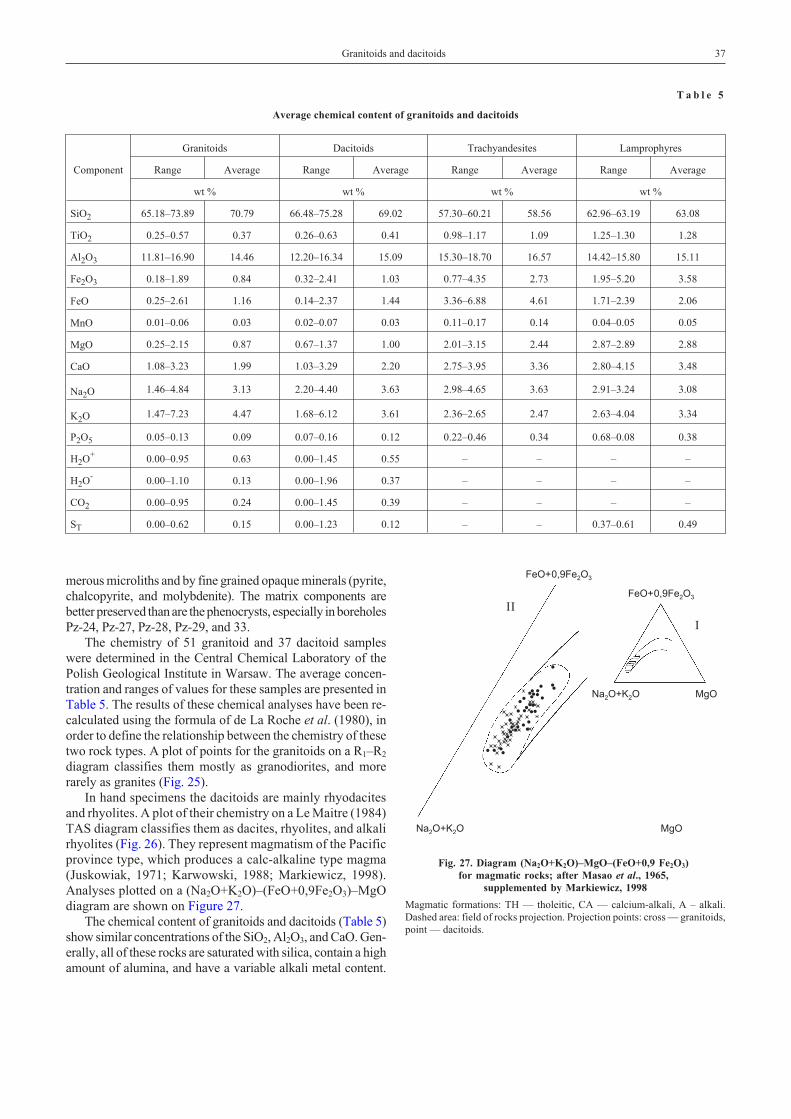
merous microliths and by fine grained opaque minerals (pyrite,chalcopyrite, and molybdenite). The matrix components arebetter preserved than are the phenocrysts, especially in boreholesPz-24, Pz-27, Pz-28, Pz-29, and 33.
The chemistry of 51 granitoid and 37 dacitoid sampleswere determined in the Central Chemical Laboratory of thePolish Geological Institute in Warsaw. The average concen-tration and ranges of values for these samples are presented inTable 5. The results of these chemical analyses have been re-calculated using the formula of de La Roche et al. (1980), inorder to define the relationship between the chemistry of thesetwo rock types. A plot of points for the granitoids on a R1–R2
diagram classifies them mostly as granodiorites, and morerarely as granites (Fig. 25).
In hand specimens the dacitoids are mainly rhyodacites
and rhyolites. A plot of their chemistry on a Le Maitre (1984)
TAS diagram classifies them as dacites, rhyolites, and alkalirhyolites (Fig. 26). They represent magmatism of the Pacificprovince type, which produces a calc-alkaline type magma(Juskowiak, 1971; Karwowski, 1988; Markiewicz, 1998).Analyses plotted on a (Na2O+K2O)–(FeO+0,9Fe2O3)–MgOdiagram are shown on Figure 27.
The chemical content of granitoids and dacitoids (Table 5)show similar concentrations of the SiO2, Al2O3, and CaO. Gen-erally, all of these rocks are saturated with silica, contain a highamount of alumina, and have a variable alkali metal content.
Granitoids and dacitoids 37
T a b l e 5
Average chemical content of granitoids and dacitoids
Component
Granitoids Dacitoids Trachyandesites Lamprophyres
Range Average Range Average Range Average Range Average
wt % wt % wt % wt %
SiO2 65.18–73.89 70.79 66.48–75.28 69.02 57.30–60.21 58.56 62.96–63.19 63.08
TiO2 0.25–0.57 0.37 0.26–0.63 0.41 0.98–1.17 1.09 1.25–1.30 1.28
Al2O3 11.81–16.90 14.46 12.20–16.34 15.09 15.30–18.70 16.57 14.42–15.80 15.11
Fe2O3 0.18–1.89 0.84 0.32–2.41 1.03 0.77–4.35 2.73 1.95–5.20 3.58
FeO 0.25–2.61 1.16 0.14–2.37 1.44 3.36–6.88 4.61 1.71–2.39 2.06
MnO 0.01–0.06 0.03 0.02–0.07 0.03 0.11–0.17 0.14 0.04–0.05 0.05
MgO 0.25–2.15 0.87 0.67–1.37 1.00 2.01–3.15 2.44 2.87–2.89 2.88
CaO 1.08–3.23 1.99 1.03–3.29 2.20 2.75–3.95 3.36 2.80–4.15 3.48
Na2O 1.46–4.84 3.13 2.20–4.40 3.63 2.98–4.65 3.63 2.91–3.24 3.08
K2O 1.47–7.23 4.47 1.68–6.12 3.61 2.36–2.65 2.47 2.63–4.04 3.34
P2O5 0.05–0.13 0.09 0.07–0.16 0.12 0.22–0.46 0.34 0.68–0.08 0.38
H2O+ 0.00–0.95 0.63 0.00–1.45 0.55 – – – –
H2O- 0.00–1.10 0.13 0.00–1.96 0.37 – – – –
CO2 0.00–0.95 0.24 0.00–1.45 0.39 – – – –
ST 0.00–0.62 0.15 0.00–1.23 0.12 – – 0.37–0.61 0.49
Fig. 27. Diagram (Na2O+K2O)–MgO–(FeO+0,9 Fe2O3)for magmatic rocks; after Masao et al., 1965,
supplemented by Markiewicz, 1998
Magmatic formations: TH — tholeitic, CA — calcium-alkali, A – alkali.Dashed area: field of rocks projection. Projection points: cross — granitoids,point — dacitoids.
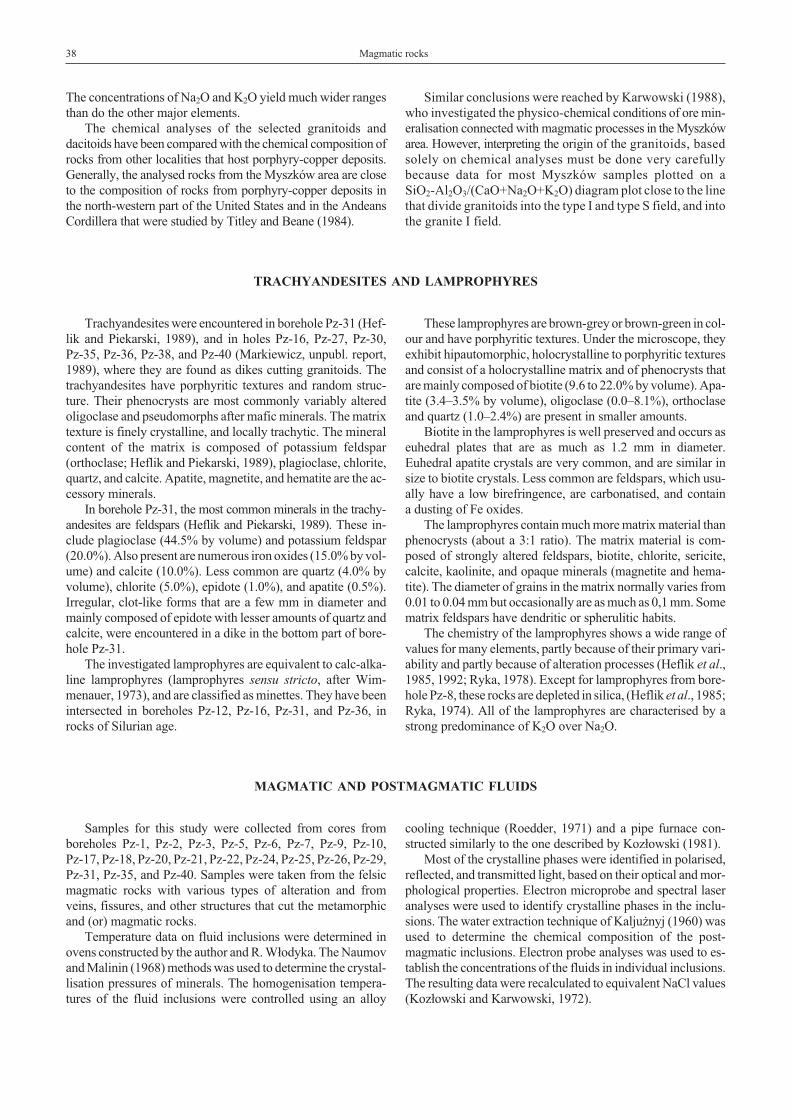
The concentrations of Na2O and K2O yield much wider rangesthan do the other major elements.
The chemical analyses of the selected granitoids anddacitoids have been compared with the chemical composition ofrocks from other localities that host porphyry-copper deposits.Generally, the analysed rocks from the Myszków area are closeto the composition of rocks from porphyry-copper deposits inthe north-western part of the United States and in the AndeansCordillera that were studied by Titley and Beane (1984).
Similar conclusions were reached by Karwowski (1988),who investigated the physico-chemical conditions of ore min-eralisation connected with magmatic processes in the Myszkówarea. However, interpreting the origin of the granitoids, basedsolely on chemical analyses must be done very carefullybecause data for most Myszków samples plotted on aSiO2-Al2O3/(CaO+Na2O+K2O) diagram plot close to the linethat divide granitoids into the type I and type S field, and intothe granite I field.
TRACHYANDESITES AND LAMPROPHYRES
Trachyandesites were encountered in borehole Pz-31 (Hef-lik and Piekarski, 1989), and in holes Pz-16, Pz-27, Pz-30,Pz-35, Pz-36, Pz-38, and Pz-40 (Markiewicz, unpubl. report,1989), where they are found as dikes cutting granitoids. Thetrachyandesites have porphyritic textures and random struc-ture. Their phenocrysts are most commonly variably alteredoligoclase and pseudomorphs after mafic minerals. The matrixtexture is finely crystalline, and locally trachytic. The mineralcontent of the matrix is composed of potassium feldspar(orthoclase; Heflik and Piekarski, 1989), plagioclase, chlorite,quartz, and calcite. Apatite, magnetite, and hematite are the ac-cessory minerals.
In borehole Pz-31, the most common minerals in the trachy-andesites are feldspars (Heflik and Piekarski, 1989). These in-clude plagioclase (44.5% by volume) and potassium feldspar(20.0%). Also present are numerous iron oxides (15.0% by vol-ume) and calcite (10.0%). Less common are quartz (4.0% byvolume), chlorite (5.0%), epidote (1.0%), and apatite (0.5%).Irregular, clot-like forms that are a few mm in diameter andmainly composed of epidote with lesser amounts of quartz andcalcite, were encountered in a dike in the bottom part of bore-hole Pz-31.
The investigated lamprophyres are equivalent to calc-alka-line lamprophyres (lamprophyres sensu stricto, after Wim-menauer, 1973), and are classified as minettes. They have beenintersected in boreholes Pz-12, Pz-16, Pz-31, and Pz-36, inrocks of Silurian age.
These lamprophyres are brown-grey or brown-green in col-our and have porphyritic textures. Under the microscope, theyexhibit hipautomorphic, holocrystalline to porphyritic texturesand consist of a holocrystalline matrix and of phenocrysts thatare mainly composed of biotite (9.6 to 22.0% by volume). Apa-tite (3.4–3.5% by volume), oligoclase (0.0–8.1%), orthoclaseand quartz (1.0–2.4%) are present in smaller amounts.
Biotite in the lamprophyres is well preserved and occurs aseuhedral plates that are as much as 1.2 mm in diameter.Euhedral apatite crystals are very common, and are similar insize to biotite crystals. Less common are feldspars, which usu-ally have a low birefringence, are carbonatised, and containa dusting of Fe oxides.
The lamprophyres contain much more matrix material thanphenocrysts (about a 3:1 ratio). The matrix material is com-posed of strongly altered feldspars, biotite, chlorite, sericite,calcite, kaolinite, and opaque minerals (magnetite and hema-tite). The diameter of grains in the matrix normally varies from0.01 to 0.04 mm but occasionally are as much as 0,1 mm. Somematrix feldspars have dendritic or spherulitic habits.
The chemistry of the lamprophyres shows a wide range ofvalues for many elements, partly because of their primary vari-ability and partly because of alteration processes (Heflik et al.,1985, 1992; Ryka, 1978). Except for lamprophyres from bore-hole Pz-8, these rocks are depleted in silica, (Heflik et al., 1985;Ryka, 1974). All of the lamprophyres are characterised by astrong predominance of K2O over Na2O.
MAGMATIC AND POSTMAGMATIC FLUIDS
Samples for this study were collected from cores fromboreholes Pz-1, Pz-2, Pz-3, Pz-5, Pz-6, Pz-7, Pz-9, Pz-10,Pz-17, Pz-18, Pz-20, Pz-21, Pz-22, Pz-24, Pz-25, Pz-26, Pz-29,Pz-31, Pz-35, and Pz-40. Samples were taken from the felsicmagmatic rocks with various types of alteration and fromveins, fissures, and other structures that cut the metamorphicand (or) magmatic rocks.
Temperature data on fluid inclusions were determined inovens constructed by the author and R. W³odyka. The Naumovand Malinin (1968) methods was used to determine the crystal-lisation pressures of minerals. The homogenisation tempera-tures of the fluid inclusions were controlled using an alloy
cooling technique (Roedder, 1971) and a pipe furnace con-structed similarly to the one described by Koz³owski (1981).
Most of the crystalline phases were identified in polarised,reflected, and transmitted light, based on their optical and mor-phological properties. Electron microprobe and spectral laseranalyses were used to identify crystalline phases in the inclu-sions. The water extraction technique of Kalju¿nyj (1960) wasused to determine the chemical composition of the post-magmatic inclusions. Electron probe analyses was used to es-tablish the concentrations of the fluids in individual inclusions.The resulting data were recalculated to equivalent NaCl values(Koz³owski and Karwowski, 1972).
38 Magmatic rocks
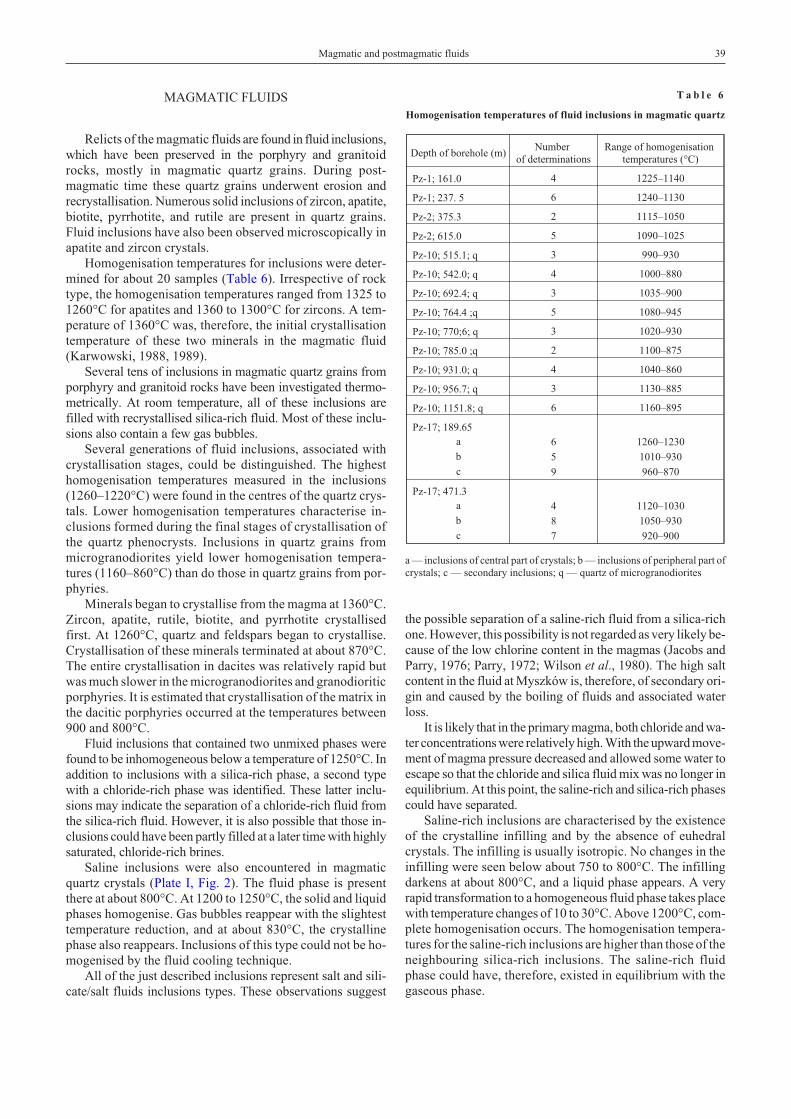
MAGMATIC FLUIDS
Relicts of the magmatic fluids are found in fluid inclusions,which have been preserved in the porphyry and granitoidrocks, mostly in magmatic quartz grains. During post-magmatic time these quartz grains underwent erosion andrecrystallisation. Numerous solid inclusions of zircon, apatite,biotite, pyrrhotite, and rutile are present in quartz grains.Fluid inclusions have also been observed microscopically inapatite and zircon crystals.
Homogenisation temperatures for inclusions were deter-mined for about 20 samples (Table 6). Irrespective of rocktype, the homogenisation temperatures ranged from 1325 to1260°C for apatites and 1360 to 1300°C for zircons. A tem-perature of 1360°C was, therefore, the initial crystallisationtemperature of these two minerals in the magmatic fluid(Karwowski, 1988, 1989).
Several tens of inclusions in magmatic quartz grains fromporphyry and granitoid rocks have been investigated thermo-metrically. At room temperature, all of these inclusions arefilled with recrystallised silica-rich fluid. Most of these inclu-sions also contain a few gas bubbles.
Several generations of fluid inclusions, associated withcrystallisation stages, could be distinguished. The highesthomogenisation temperatures measured in the inclusions(1260–1220°C) were found in the centres of the quartz crys-tals. Lower homogenisation temperatures characterise in-clusions formed during the final stages of crystallisation ofthe quartz phenocrysts. Inclusions in quartz grains frommicrogranodiorites yield lower homogenisation tempera-tures (1160–860°C) than do those in quartz grains from por-phyries.
Minerals began to crystallise from the magma at 1360°C.Zircon, apatite, rutile, biotite, and pyrrhotite crystallisedfirst. At 1260°C, quartz and feldspars began to crystallise.Crystallisation of these minerals terminated at about 870°C.The entire crystallisation in dacites was relatively rapid butwas much slower in the microgranodiorites and granodioriticporphyries. It is estimated that crystallisation of the matrix inthe dacitic porphyries occurred at the temperatures between900 and 800°C.
Fluid inclusions that contained two unmixed phases werefound to be inhomogeneous below a temperature of 1250°C. Inaddition to inclusions with a silica-rich phase, a second typewith a chloride-rich phase was identified. These latter inclu-sions may indicate the separation of a chloride-rich fluid fromthe silica-rich fluid. However, it is also possible that those in-clusions could have been partly filled at a later time with highlysaturated, chloride-rich brines.
Saline inclusions were also encountered in magmaticquartz crystals (Plate I, Fig. 2). The fluid phase is presentthere at about 800°C. At 1200 to 1250°C, the solid and liquidphases homogenise. Gas bubbles reappear with the slightesttemperature reduction, and at about 830°C, the crystallinephase also reappears. Inclusions of this type could not be ho-mogenised by the fluid cooling technique.
All of the just described inclusions represent salt and sili-cate/salt fluids inclusions types. These observations suggest
the possible separation of a saline-rich fluid from a silica-richone. However, this possibility is not regarded as very likely be-cause of the low chlorine content in the magmas (Jacobs andParry, 1976; Parry, 1972; Wilson et al., 1980). The high saltcontent in the fluid at Myszków is, therefore, of secondary ori-gin and caused by the boiling of fluids and associated waterloss.
It is likely that in the primary magma, both chloride and wa-ter concentrations were relatively high. With the upward move-ment of magma pressure decreased and allowed some water toescape so that the chloride and silica fluid mix was no longer inequilibrium. At this point, the saline-rich and silica-rich phasescould have separated.
Saline-rich inclusions are characterised by the existenceof the crystalline infilling and by the absence of euhedralcrystals. The infilling is usually isotropic. No changes in theinfilling were seen below about 750 to 800°C. The infillingdarkens at about 800°C, and a liquid phase appears. A veryrapid transformation to a homogeneous fluid phase takes placewith temperature changes of 10 to 30°C. Above 1200°C, com-plete homogenisation occurs. The homogenisation tempera-tures for the saline-rich inclusions are higher than those of theneighbouring silica-rich inclusions. The saline-rich fluidphase could have, therefore, existed in equilibrium with thegaseous phase.
Magmatic and postmagmatic fluids 39
T a b l e 6
Homogenisation temperatures of fluid inclusions in magmatic quartz
Depth of borehole (m)Number
of determinations
Range of homogenisation
temperatures (°C)
Pz-1; 161.0 4 1225–1140
Pz-1; 237. 5 6 1240–1130
Pz-2; 375.3 2 1115–1050
Pz-2; 615.0 5 1090–1025
Pz-10; 515.1; q 3 990–930
Pz-10; 542.0; q 4 1000–880
Pz-10; 692.4; q 3 1035–900
Pz-10; 764.4 ;q 5 1080–945
Pz-10; 770;6; q 3 1020–930
Pz-10; 785.0 ;q 2 1100–875
Pz-10; 931.0; q 4 1040–860
Pz-10; 956.7; q 3 1130–885
Pz-10; 1151.8; q 6 1160–895
Pz-17; 189.65
a
b
c
6
5
9
1260–1230
1010–930
960–870
Pz-17; 471.3
a
b
c
4
8
7
1120–1030
1050–930
920–900
a — inclusions of central part of crystals; b — inclusions of peripheral part ofcrystals; c — secondary inclusions; q — quartz of microgranodiorites
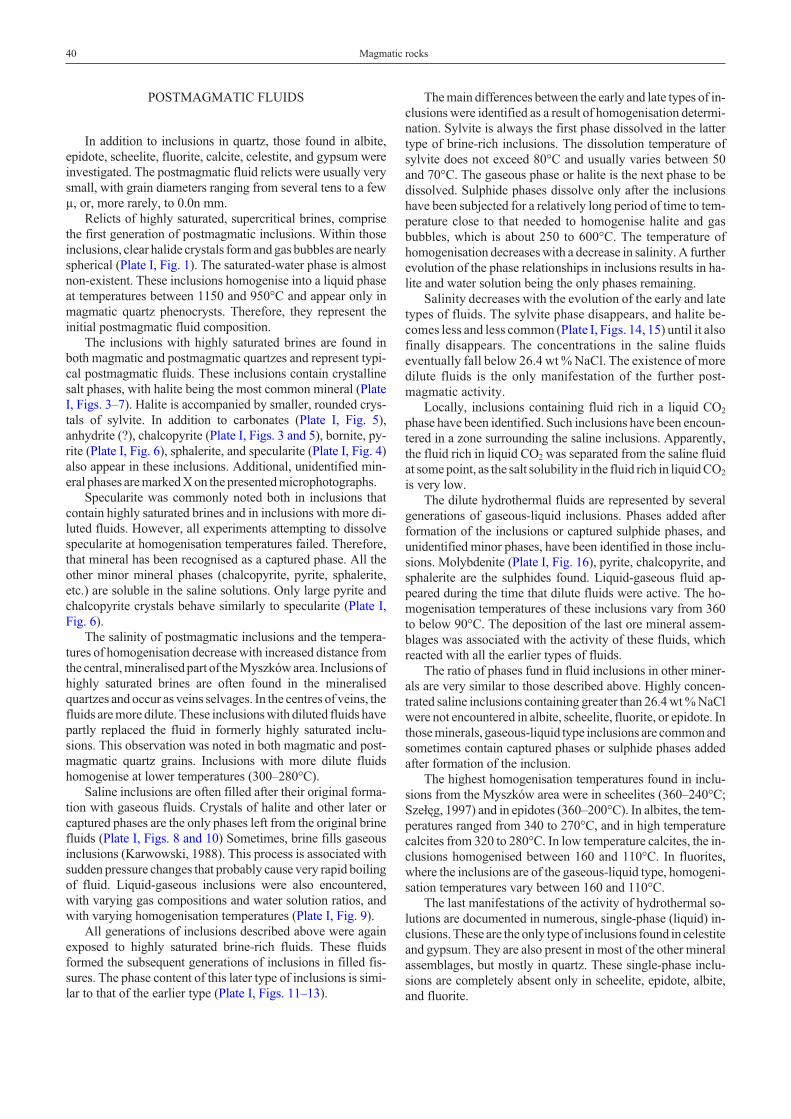
POSTMAGMATIC FLUIDS
In addition to inclusions in quartz, those found in albite,epidote, scheelite, fluorite, calcite, celestite, and gypsum wereinvestigated. The postmagmatic fluid relicts were usually verysmall, with grain diameters ranging from several tens to a fewµ, or, more rarely, to 0.0n mm.
Relicts of highly saturated, supercritical brines, comprisethe first generation of postmagmatic inclusions. Within thoseinclusions, clear halide crystals form and gas bubbles are nearlyspherical (Plate I, Fig. 1). The saturated-water phase is almostnon-existent. These inclusions homogenise into a liquid phaseat temperatures between 1150 and 950°C and appear only inmagmatic quartz phenocrysts. Therefore, they represent theinitial postmagmatic fluid composition.
The inclusions with highly saturated brines are found inboth magmatic and postmagmatic quartzes and represent typi-cal postmagmatic fluids. These inclusions contain crystallinesalt phases, with halite being the most common mineral (PlateI, Figs. 3–7). Halite is accompanied by smaller, rounded crys-tals of sylvite. In addition to carbonates (Plate I, Fig. 5),anhydrite (?), chalcopyrite (Plate I, Figs. 3 and 5), bornite, py-rite (Plate I, Fig. 6), sphalerite, and specularite (Plate I, Fig. 4)also appear in these inclusions. Additional, unidentified min-eral phases are marked X on the presented microphotographs.
Specularite was commonly noted both in inclusions thatcontain highly saturated brines and in inclusions with more di-luted fluids. However, all experiments attempting to dissolvespecularite at homogenisation temperatures failed. Therefore,that mineral has been recognised as a captured phase. All theother minor mineral phases (chalcopyrite, pyrite, sphalerite,etc.) are soluble in the saline solutions. Only large pyrite andchalcopyrite crystals behave similarly to specularite (Plate I,Fig. 6).
The salinity of postmagmatic inclusions and the tempera-tures of homogenisation decrease with increased distance fromthe central, mineralised part of the Myszków area. Inclusions ofhighly saturated brines are often found in the mineralisedquartzes and occur as veins selvages. In the centres of veins, thefluids are more dilute. These inclusions with diluted fluids havepartly replaced the fluid in formerly highly saturated inclu-sions. This observation was noted in both magmatic and post-magmatic quartz grains. Inclusions with more dilute fluidshomogenise at lower temperatures (300–280°C).
Saline inclusions are often filled after their original forma-tion with gaseous fluids. Crystals of halite and other later orcaptured phases are the only phases left from the original brinefluids (Plate I, Figs. 8 and 10) Sometimes, brine fills gaseousinclusions (Karwowski, 1988). This process is associated withsudden pressure changes that probably cause very rapid boilingof fluid. Liquid-gaseous inclusions were also encountered,with varying gas compositions and water solution ratios, andwith varying homogenisation temperatures (Plate I, Fig. 9).
All generations of inclusions described above were againexposed to highly saturated brine-rich fluids. These fluidsformed the subsequent generations of inclusions in filled fis-sures. The phase content of this later type of inclusions is simi-lar to that of the earlier type (Plate I, Figs. 11–13).
The main differences between the early and late types of in-clusions were identified as a result of homogenisation determi-nation. Sylvite is always the first phase dissolved in the lattertype of brine-rich inclusions. The dissolution temperature ofsylvite does not exceed 80°C and usually varies between 50and 70°C. The gaseous phase or halite is the next phase to bedissolved. Sulphide phases dissolve only after the inclusionshave been subjected for a relatively long period of time to tem-perature close to that needed to homogenise halite and gasbubbles, which is about 250 to 600°C. The temperature ofhomogenisation decreases with a decrease in salinity. A furtherevolution of the phase relationships in inclusions results in ha-lite and water solution being the only phases remaining.
Salinity decreases with the evolution of the early and latetypes of fluids. The sylvite phase disappears, and halite be-comes less and less common (Plate I, Figs. 14, 15) until it alsofinally disappears. The concentrations in the saline fluidseventually fall below 26.4 wt % NaCl. The existence of moredilute fluids is the only manifestation of the further post-magmatic activity.
Locally, inclusions containing fluid rich in a liquid CO2
phase have been identified. Such inclusions have been encoun-tered in a zone surrounding the saline inclusions. Apparently,the fluid rich in liquid CO2 was separated from the saline fluidat some point, as the salt solubility in the fluid rich in liquid CO2
is very low.The dilute hydrothermal fluids are represented by several
generations of gaseous-liquid inclusions. Phases added afterformation of the inclusions or captured sulphide phases, andunidentified minor phases, have been identified in those inclu-sions. Molybdenite (Plate I, Fig. 16), pyrite, chalcopyrite, andsphalerite are the sulphides found. Liquid-gaseous fluid ap-peared during the time that dilute fluids were active. The ho-mogenisation temperatures of these inclusions vary from 360to below 90°C. The deposition of the last ore mineral assem-blages was associated with the activity of these fluids, whichreacted with all the earlier types of fluids.
The ratio of phases fund in fluid inclusions in other miner-als are very similar to those described above. Highly concen-trated saline inclusions containing greater than 26.4 wt % NaClwere not encountered in albite, scheelite, fluorite, or epidote. Inthose minerals, gaseous-liquid type inclusions are common andsometimes contain captured phases or sulphide phases addedafter formation of the inclusion.
The highest homogenisation temperatures found in inclu-sions from the Myszków area were in scheelites (360–240°C;Sze³êg, 1997) and in epidotes (360–200°C). In albites, the tem-peratures ranged from 340 to 270°C, and in high temperaturecalcites from 320 to 280°C. In low temperature calcites, the in-clusions homogenised between 160 and 110°C. In fluorites,where the inclusions are of the gaseous-liquid type, homogeni-sation temperatures vary between 160 and 110°C.
The last manifestations of the activity of hydrothermal so-lutions are documented in numerous, single-phase (liquid) in-clusions. These are the only type of inclusions found in celestiteand gypsum. They are also present in most of the other mineralassemblages, but mostly in quartz. These single-phase inclu-sions are completely absent only in scheelite, epidote, albite,and fluorite.
40 Magmatic rocks
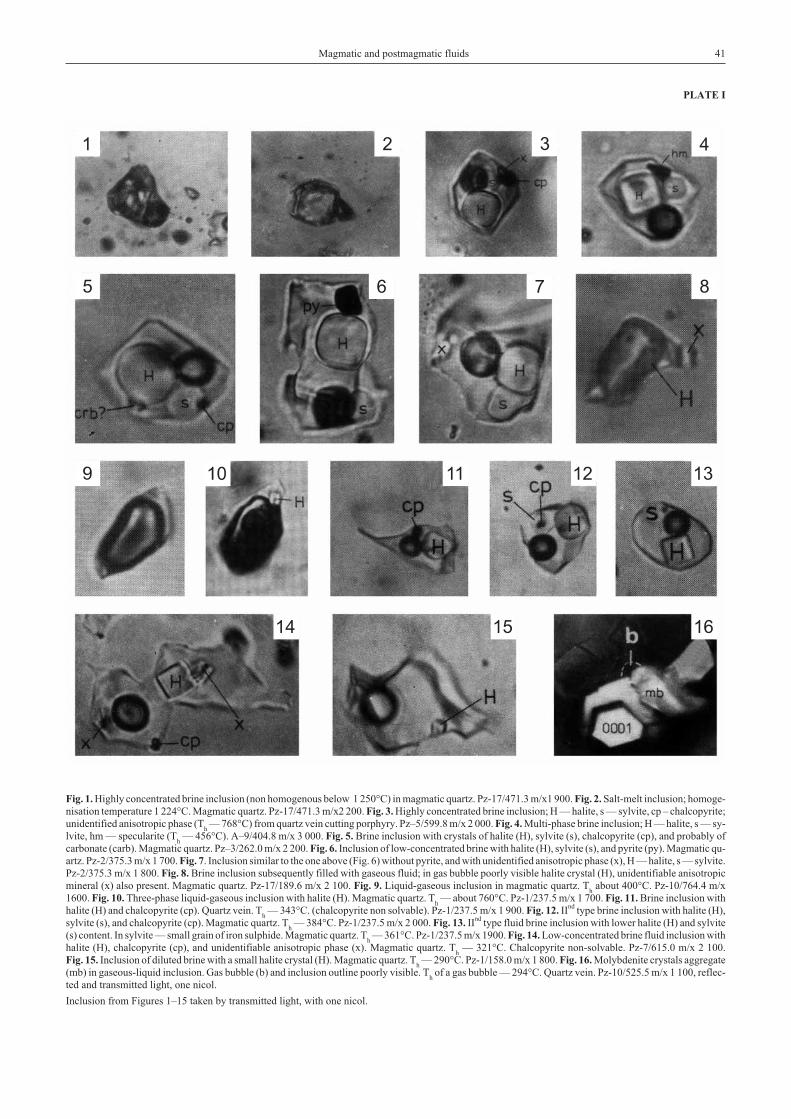
PLATE I
Magmatic and postmagmatic fluids 41
Fig. 1. Highly concentrated brine inclusion (non homogenous below 1 250°C) in magmatic quartz. Pz-17/471.3 m/x1 900. Fig. 2. Salt-melt inclusion; homoge-nisation temperature 1 224°C. Magmatic quartz. Pz-17/471.3 m/x2 200. Fig. 3. Highly concentrated brine inclusion; H — halite, s — sylvite, cp – chalcopyrite;unidentified anisotropic phase (T
h— 768°C) from quartz vein cutting porphyry. Pz–5/599.8 m/x 2 000. Fig. 4. Multi-phase brine inclusion; H — halite, s — sy-
lvite, hm — specularite (Th
— 456°C). A–9/404.8 m/x 3 000. Fig. 5. Brine inclusion with crystals of halite (H), sylvite (s), chalcopyrite (cp), and probably ofcarbonate (carb). Magmatic quartz. Pz–3/262.0 m/x 2 200. Fig. 6. Inclusion of low-concentrated brine with halite (H), sylvite (s), and pyrite (py). Magmatic qu-artz. Pz-2/375.3 m/x 1 700. Fig. 7. Inclusion similar to the one above (Fig. 6) without pyrite, and with unidentified anisotropic phase (x), H — halite, s — sylvite.Pz-2/375.3 m/x 1 800. Fig. 8. Brine inclusion subsequently filled with gaseous fluid; in gas bubble poorly visible halite crystal (H), unidentifiable anisotropicmineral (x) also present. Magmatic quartz. Pz-17/189.6 m/x 2 100. Fig. 9. Liquid-gaseous inclusion in magmatic quartz. T
habout 400°C. Pz-10/764.4 m/x
1600. Fig. 10. Three-phase liquid-gaseous inclusion with halite (H). Magmatic quartz. Th— about 760°C. Pz-1/237.5 m/x 1 700. Fig. 11. Brine inclusion with
halite (H) and chalcopyrite (cp). Quartz vein. Th— 343°C. (chalcopyrite non solvable). Pz-1/237.5 m/x 1 900. Fig. 12. IInd type brine inclusion with halite (H),
sylvite (s), and chalcopyrite (cp). Magmatic quartz. Th— 384°C. Pz-1/237.5 m/x 2 000. Fig. 13. IInd type fluid brine inclusion with lower halite (H) and sylvite
(s) content. In sylvite — small grain of iron sulphide. Magmatic quartz. Th— 361°C. Pz-1/237.5 m/x 1900. Fig. 14. Low-concentrated brine fluid inclusion with
halite (H), chalcopyrite (cp), and unidentifiable anisotropic phase (x). Magmatic quartz. Th
— 321°C. Chalcopyrite non-solvable. Pz-7/615.0 m/x 2 100.Fig. 15. Inclusion of diluted brine with a small halite crystal (H). Magmatic quartz. T
h— 290°C. Pz-1/158.0 m/x 1 800. Fig. 16. Molybdenite crystals aggregate
(mb) in gaseous-liquid inclusion. Gas bubble (b) and inclusion outline poorly visible. Thof a gas bubble — 294°C. Quartz vein. Pz-10/525.5 m/x 1 100, reflec-
ted and transmitted light, one nicol.
Inclusion from Figures 1–15 taken by transmitted light, with one nicol.
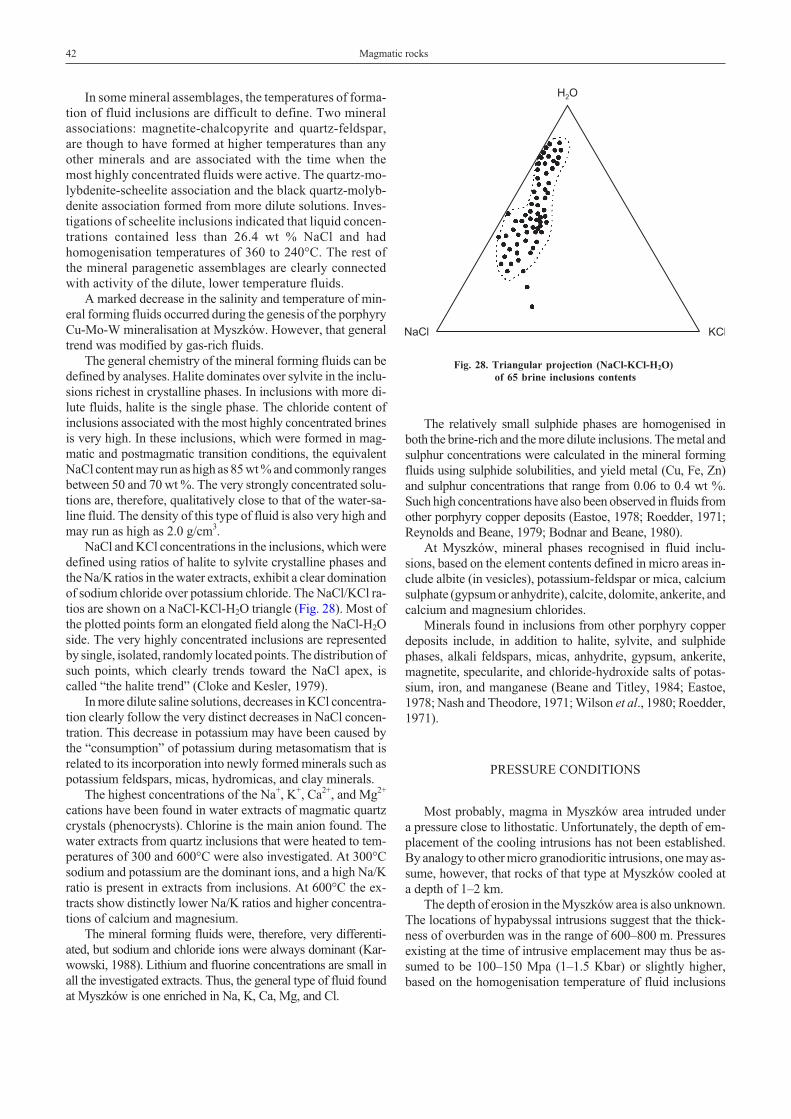
In some mineral assemblages, the temperatures of forma-tion of fluid inclusions are difficult to define. Two mineralassociations: magnetite-chalcopyrite and quartz-feldspar,are though to have formed at higher temperatures than anyother minerals and are associated with the time when themost highly concentrated fluids were active. The quartz-mo-lybdenite-scheelite association and the black quartz-molyb-denite association formed from more dilute solutions. Inves-tigations of scheelite inclusions indicated that liquid concen-trations contained less than 26.4 wt % NaCl and hadhomogenisation temperatures of 360 to 240°C. The rest ofthe mineral paragenetic assemblages are clearly connectedwith activity of the dilute, lower temperature fluids.
A marked decrease in the salinity and temperature of min-eral forming fluids occurred during the genesis of the porphyryCu-Mo-W mineralisation at Myszków. However, that generaltrend was modified by gas-rich fluids.
The general chemistry of the mineral forming fluids can bedefined by analyses. Halite dominates over sylvite in the inclu-sions richest in crystalline phases. In inclusions with more di-lute fluids, halite is the single phase. The chloride content ofinclusions associated with the most highly concentrated brinesis very high. In these inclusions, which were formed in mag-matic and postmagmatic transition conditions, the equivalentNaCl content may run as high as 85 wt % and commonly rangesbetween 50 and 70 wt %. The very strongly concentrated solu-tions are, therefore, qualitatively close to that of the water-sa-line fluid. The density of this type of fluid is also very high andmay run as high as 2.0 g/cm3.
NaCl and KCl concentrations in the inclusions, which weredefined using ratios of halite to sylvite crystalline phases andthe Na/K ratios in the water extracts, exhibit a clear dominationof sodium chloride over potassium chloride. The NaCl/KCl ra-tios are shown on a NaCl-KCl-H2O triangle (Fig. 28). Most ofthe plotted points form an elongated field along the NaCl-H2Oside. The very highly concentrated inclusions are representedby single, isolated, randomly located points. The distribution ofsuch points, which clearly trends toward the NaCl apex, iscalled “the halite trend” (Cloke and Kesler, 1979).
In more dilute saline solutions, decreases in KCl concentra-tion clearly follow the very distinct decreases in NaCl concen-tration. This decrease in potassium may have been caused bythe “consumption” of potassium during metasomatism that isrelated to its incorporation into newly formed minerals such aspotassium feldspars, micas, hydromicas, and clay minerals.
The highest concentrations of the Na+, K+, Ca2+, and Mg2+
cations have been found in water extracts of magmatic quartzcrystals (phenocrysts). Chlorine is the main anion found. Thewater extracts from quartz inclusions that were heated to tem-peratures of 300 and 600°C were also investigated. At 300°Csodium and potassium are the dominant ions, and a high Na/Kratio is present in extracts from inclusions. At 600°C the ex-tracts show distinctly lower Na/K ratios and higher concentra-tions of calcium and magnesium.
The mineral forming fluids were, therefore, very differenti-ated, but sodium and chloride ions were always dominant (Kar-wowski, 1988). Lithium and fluorine concentrations are small inall the investigated extracts. Thus, the general type of fluid foundat Myszków is one enriched in Na, K, Ca, Mg, and Cl.
The relatively small sulphide phases are homogenised inboth the brine-rich and the more dilute inclusions. The metal andsulphur concentrations were calculated in the mineral formingfluids using sulphide solubilities, and yield metal (Cu, Fe, Zn)and sulphur concentrations that range from 0.06 to 0.4 wt %.Such high concentrations have also been observed in fluids fromother porphyry copper deposits (Eastoe, 1978; Roedder, 1971;Reynolds and Beane, 1979; Bodnar and Beane, 1980).
At Myszków, mineral phases recognised in fluid inclu-sions, based on the element contents defined in micro areas in-clude albite (in vesicles), potassium-feldspar or mica, calciumsulphate (gypsum or anhydrite), calcite, dolomite, ankerite, andcalcium and magnesium chlorides.
Minerals found in inclusions from other porphyry copperdeposits include, in addition to halite, sylvite, and sulphidephases, alkali feldspars, micas, anhydrite, gypsum, ankerite,magnetite, specularite, and chloride-hydroxide salts of potas-sium, iron, and manganese (Beane and Titley, 1984; Eastoe,1978; Nash and Theodore, 1971; Wilson et al., 1980; Roedder,1971).
PRESSURE CONDITIONS
Most probably, magma in Myszków area intruded undera pressure close to lithostatic. Unfortunately, the depth of em-placement of the cooling intrusions has not been established.By analogy to other micro granodioritic intrusions, one may as-sume, however, that rocks of that type at Myszków cooled ata depth of 1–2 km.
The depth of erosion in the Myszków area is also unknown.The locations of hypabyssal intrusions suggest that the thick-ness of overburden was in the range of 600–800 m. Pressuresexisting at the time of intrusive emplacement may thus be as-sumed to be 100–150 Mpa (1–1.5 Kbar) or slightly higher,based on the homogenisation temperature of fluid inclusions
42 Magmatic rocks
Fig. 28. Triangular projection (NaCl-KCl-H2O)of 65 brine inclusions contents
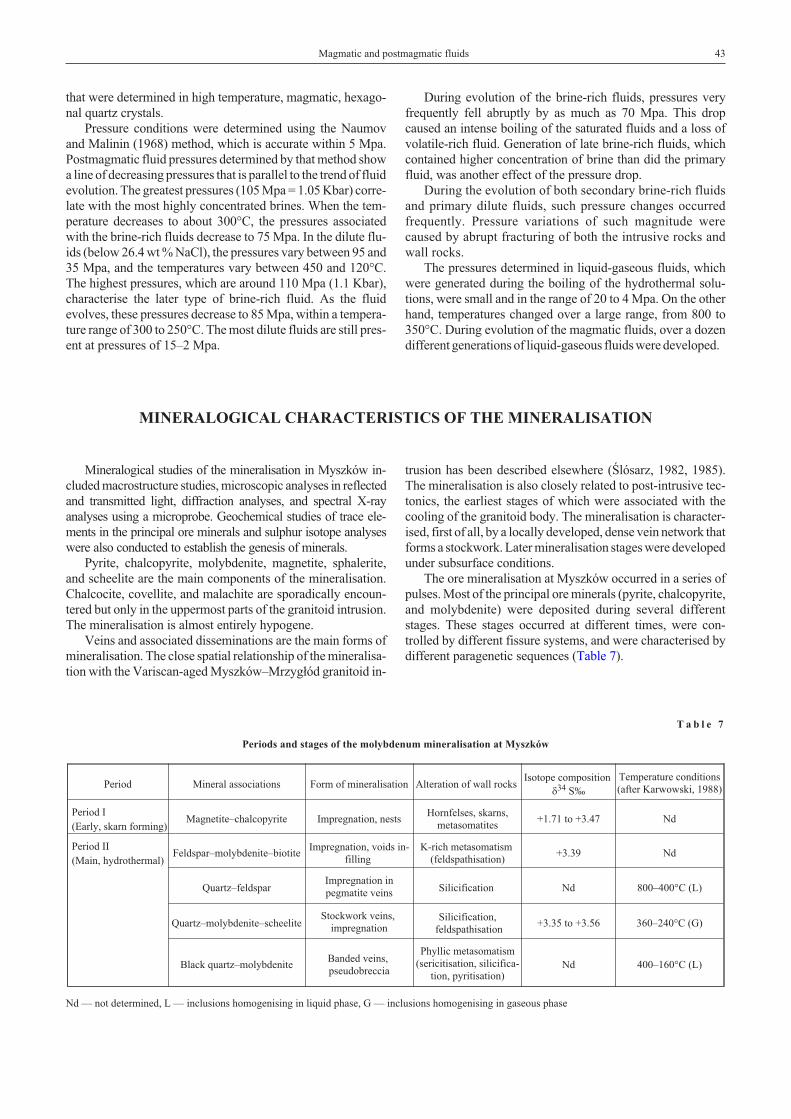
that were determined in high temperature, magmatic, hexago-nal quartz crystals.
Pressure conditions were determined using the Naumovand Malinin (1968) method, which is accurate within 5 Mpa.Postmagmatic fluid pressures determined by that method showa line of decreasing pressures that is parallel to the trend of fluidevolution. The greatest pressures (105 Mpa = 1.05 Kbar) corre-late with the most highly concentrated brines. When the tem-perature decreases to about 300°C, the pressures associatedwith the brine-rich fluids decrease to 75 Mpa. In the dilute flu-ids (below 26.4 wt % NaCl), the pressures vary between 95 and35 Mpa, and the temperatures vary between 450 and 120°C.The highest pressures, which are around 110 Mpa (1.1 Kbar),characterise the later type of brine-rich fluid. As the fluidevolves, these pressures decrease to 85 Mpa, within a tempera-ture range of 300 to 250°C. The most dilute fluids are still pres-ent at pressures of 15–2 Mpa.
During evolution of the brine-rich fluids, pressures veryfrequently fell abruptly by as much as 70 Mpa. This dropcaused an intense boiling of the saturated fluids and a loss ofvolatile-rich fluid. Generation of late brine-rich fluids, whichcontained higher concentration of brine than did the primaryfluid, was another effect of the pressure drop.
During the evolution of both secondary brine-rich fluidsand primary dilute fluids, such pressure changes occurredfrequently. Pressure variations of such magnitude werecaused by abrupt fracturing of both the intrusive rocks andwall rocks.
The pressures determined in liquid-gaseous fluids, whichwere generated during the boiling of the hydrothermal solu-tions, were small and in the range of 20 to 4 Mpa. On the otherhand, temperatures changed over a large range, from 800 to350°C. During evolution of the magmatic fluids, over a dozendifferent generations of liquid-gaseous fluids were developed.
MINERALOGICAL CHARACTERISTICS OF THE MINERALISATION
Mineralogical studies of the mineralisation in Myszków in-cluded macrostructure studies, microscopic analyses in reflectedand transmitted light, diffraction analyses, and spectral X-rayanalyses using a microprobe. Geochemical studies of trace ele-ments in the principal ore minerals and sulphur isotope analyseswere also conducted to establish the genesis of minerals.
Pyrite, chalcopyrite, molybdenite, magnetite, sphalerite,and scheelite are the main components of the mineralisation.Chalcocite, covellite, and malachite are sporadically encoun-tered but only in the uppermost parts of the granitoid intrusion.The mineralisation is almost entirely hypogene.
Veins and associated disseminations are the main forms ofmineralisation. The close spatial relationship of the mineralisa-tion with the Variscan-aged Myszków–Mrzyg³ód granitoid in-
trusion has been described elsewhere (Œlósarz, 1982, 1985).The mineralisation is also closely related to post-intrusive tec-tonics, the earliest stages of which were associated with thecooling of the granitoid body. The mineralisation is character-ised, first of all, by a locally developed, dense vein network thatforms a stockwork. Later mineralisation stages were developedunder subsurface conditions.
The ore mineralisation at Myszków occurred in a series ofpulses. Most of the principal ore minerals (pyrite, chalcopyrite,and molybdenite) were deposited during several differentstages. These stages occurred at different times, were con-trolled by different fissure systems, and were characterised bydifferent paragenetic sequences (Table 7).
Magmatic and postmagmatic fluids 43
T a b l e 7
Periods and stages of the molybdenum mineralisation at Myszków
Period Mineral associations Form of mineralisation Alteration of wall rocksIsotope composition
�34 S‰
Temperature conditions(after Karwowski, 1988)
Period I(Early, skarn forming)
Magnetite–chalcopyrite Impregnation, nestsHornfelses, skarns,
metasomatites+1.71 to +3.47 Nd
Period II(Main, hydrothermal)
Feldspar–molybdenite–biotiteImpregnation, voids in-
fillingK-rich metasomatism
(feldspathisation)+3.39 Nd
Quartz–feldsparImpregnation inpegmatite veins Silicification Nd 800–400°C (L)
Quartz–molybdenite–scheeliteStockwork veins,
impregnationSilicification,
feldspathisation+3.35 to +3.56 360–240°C (G)
Black quartz–molybdeniteBanded veins,pseudobreccia
Phyllic metasomatism(sericitisation, silicifica-
tion, pyritisation)Nd 400–160°C (L)
Nd — not determined, L — inclusions homogenising in liquid phase, G — inclusions homogenising in gaseous phase
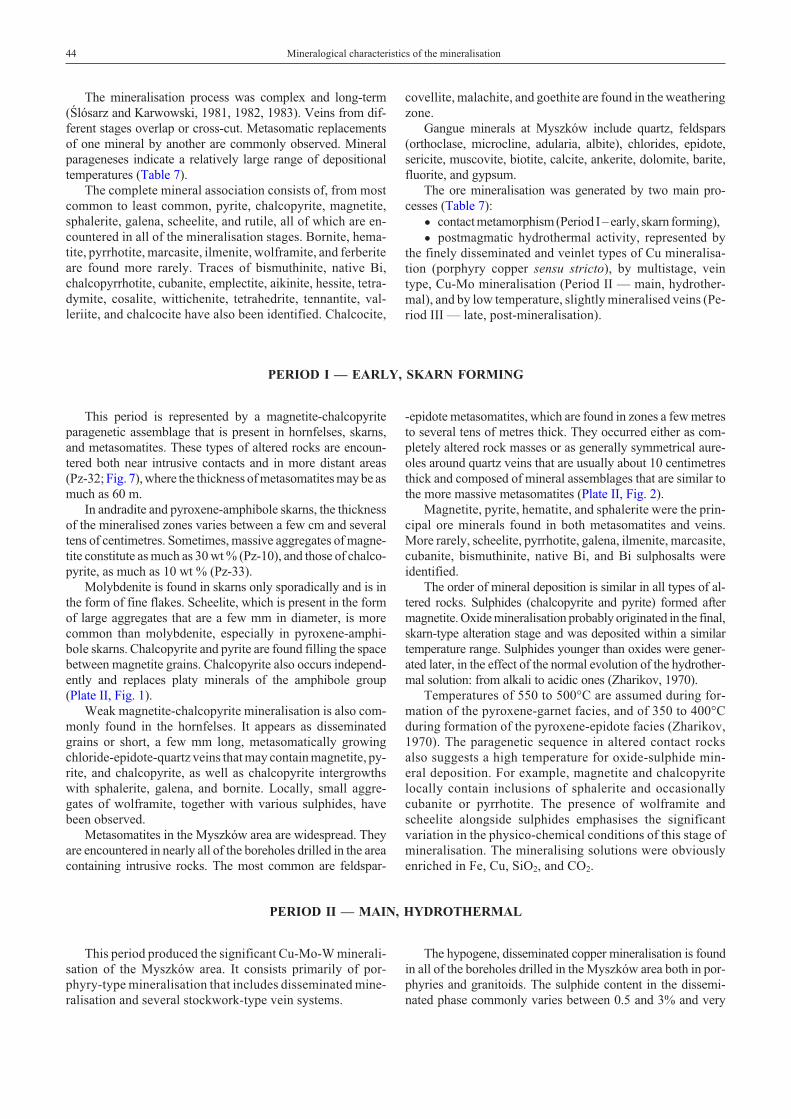
The mineralisation process was complex and long-term(Œlósarz and Karwowski, 1981, 1982, 1983). Veins from dif-ferent stages overlap or cross-cut. Metasomatic replacementsof one mineral by another are commonly observed. Mineralparageneses indicate a relatively large range of depositionaltemperatures (Table 7).
The complete mineral association consists of, from mostcommon to least common, pyrite, chalcopyrite, magnetite,sphalerite, galena, scheelite, and rutile, all of which are en-countered in all of the mineralisation stages. Bornite, hema-tite, pyrrhotite, marcasite, ilmenite, wolframite, and ferberiteare found more rarely. Traces of bismuthinite, native Bi,chalcopyrrhotite, cubanite, emplectite, aikinite, hessite, tetra-dymite, cosalite, wittichenite, tetrahedrite, tennantite, val-leriite, and chalcocite have also been identified. Chalcocite,
covellite, malachite, and goethite are found in the weatheringzone.
Gangue minerals at Myszków include quartz, feldspars(orthoclase, microcline, adularia, albite), chlorides, epidote,sericite, muscovite, biotite, calcite, ankerite, dolomite, barite,fluorite, and gypsum.
The ore mineralisation was generated by two main pro-cesses (Table 7):
• contact metamorphism (Period I – early, skarn forming),
• postmagmatic hydrothermal activity, represented bythe finely disseminated and veinlet types of Cu mineralisa-tion (porphyry copper sensu stricto), by multistage, veintype, Cu-Mo mineralisation (Period II — main, hydrother-mal), and by low temperature, slightly mineralised veins (Pe-riod III — late, post-mineralisation).
PERIOD I — EARLY, SKARN FORMING
This period is represented by a magnetite-chalcopyriteparagenetic assemblage that is present in hornfelses, skarns,and metasomatites. These types of altered rocks are encoun-tered both near intrusive contacts and in more distant areas(Pz-32; Fig. 7), where the thickness of metasomatites may be asmuch as 60 m.
In andradite and pyroxene-amphibole skarns, the thicknessof the mineralised zones varies between a few cm and severaltens of centimetres. Sometimes, massive aggregates of magne-tite constitute as much as 30 wt % (Pz-10), and those of chalco-pyrite, as much as 10 wt % (Pz-33).
Molybdenite is found in skarns only sporadically and is inthe form of fine flakes. Scheelite, which is present in the formof large aggregates that are a few mm in diameter, is morecommon than molybdenite, especially in pyroxene-amphi-bole skarns. Chalcopyrite and pyrite are found filling the spacebetween magnetite grains. Chalcopyrite also occurs independ-ently and replaces platy minerals of the amphibole group(Plate II, Fig. 1).
Weak magnetite-chalcopyrite mineralisation is also com-monly found in the hornfelses. It appears as disseminatedgrains or short, a few mm long, metasomatically growingchloride-epidote-quartz veins that may contain magnetite, py-rite, and chalcopyrite, as well as chalcopyrite intergrowthswith sphalerite, galena, and bornite. Locally, small aggre-gates of wolframite, together with various sulphides, havebeen observed.
Metasomatites in the Myszków area are widespread. Theyare encountered in nearly all of the boreholes drilled in the areacontaining intrusive rocks. The most common are feldspar-
-epidote metasomatites, which are found in zones a few metresto several tens of metres thick. They occurred either as com-pletely altered rock masses or as generally symmetrical aure-oles around quartz veins that are usually about 10 centimetresthick and composed of mineral assemblages that are similar tothe more massive metasomatites (Plate II, Fig. 2).
Magnetite, pyrite, hematite, and sphalerite were the prin-cipal ore minerals found in both metasomatites and veins.More rarely, scheelite, pyrrhotite, galena, ilmenite, marcasite,cubanite, bismuthinite, native Bi, and Bi sulphosalts wereidentified.
The order of mineral deposition is similar in all types of al-tered rocks. Sulphides (chalcopyrite and pyrite) formed aftermagnetite. Oxide mineralisation probably originated in the final,skarn-type alteration stage and was deposited within a similartemperature range. Sulphides younger than oxides were gener-ated later, in the effect of the normal evolution of the hydrother-mal solution: from alkali to acidic ones (Zharikov, 1970).
Temperatures of 550 to 500°C are assumed during for-mation of the pyroxene-garnet facies, and of 350 to 400°Cduring formation of the pyroxene-epidote facies (Zharikov,1970). The paragenetic sequence in altered contact rocksalso suggests a high temperature for oxide-sulphide min-eral deposition. For example, magnetite and chalcopyritelocally contain inclusions of sphalerite and occasionallycubanite or pyrrhotite. The presence of wolframite andscheelite alongside sulphides emphasises the significantvariation in the physico-chemical conditions of this stage ofmineralisation. The mineralising solutions were obviouslyenriched in Fe, Cu, SiO2, and CO2.
PERIOD II — MAIN, HYDROTHERMAL
This period produced the significant Cu-Mo-W minerali-sation of the Myszków area. It consists primarily of por-phyry-type mineralisation that includes disseminated mine-ralisation and several stockwork-type vein systems.
The hypogene, disseminated copper mineralisation is foundin all of the boreholes drilled in the Myszków area both in por-phyries and granitoids. The sulphide content in the dissemi-nated phase commonly varies between 0.5 and 3% and very
44 Mineralogical characteristics of the mineralisation
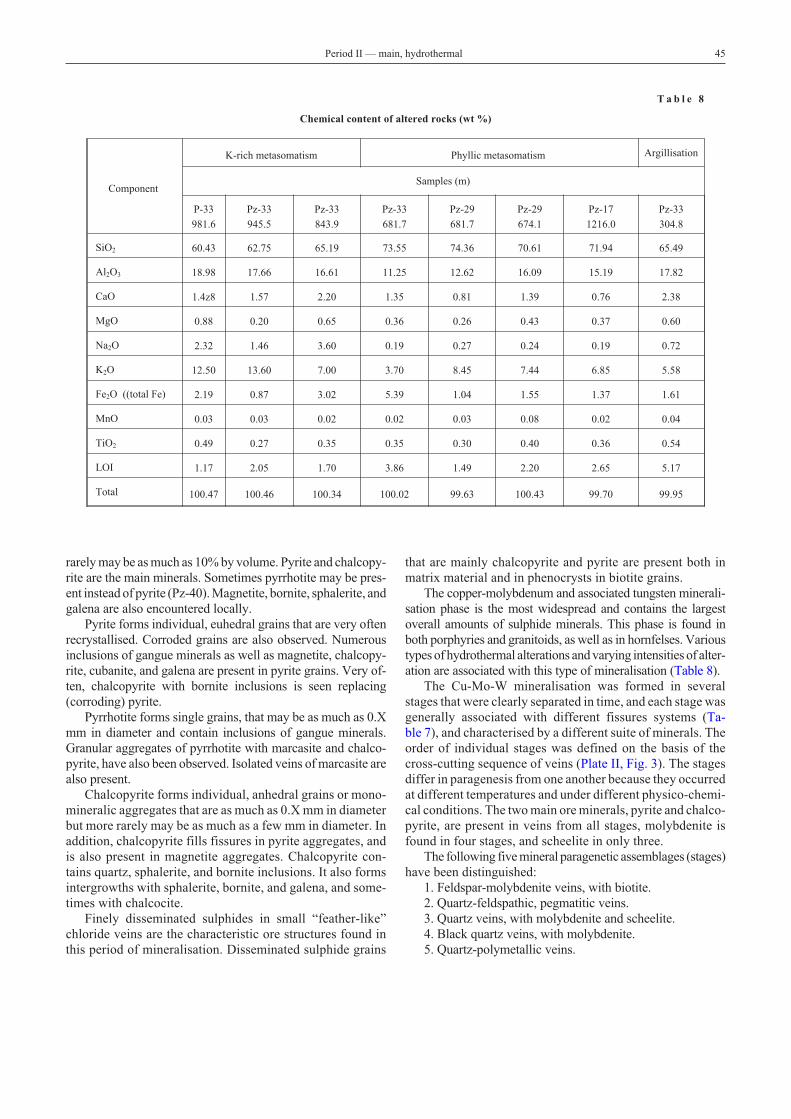
rarely may be as much as 10% by volume. Pyrite and chalcopy-rite are the main minerals. Sometimes pyrrhotite may be pres-ent instead of pyrite (Pz-40). Magnetite, bornite, sphalerite, andgalena are also encountered locally.
Pyrite forms individual, euhedral grains that are very oftenrecrystallised. Corroded grains are also observed. Numerousinclusions of gangue minerals as well as magnetite, chalcopy-rite, cubanite, and galena are present in pyrite grains. Very of-ten, chalcopyrite with bornite inclusions is seen replacing(corroding) pyrite.
Pyrrhotite forms single grains, that may be as much as 0.Xmm in diameter and contain inclusions of gangue minerals.Granular aggregates of pyrrhotite with marcasite and chalco-pyrite, have also been observed. Isolated veins of marcasite arealso present.
Chalcopyrite forms individual, anhedral grains or mono-mineralic aggregates that are as much as 0.X mm in diameterbut more rarely may be as much as a few mm in diameter. Inaddition, chalcopyrite fills fissures in pyrite aggregates, andis also present in magnetite aggregates. Chalcopyrite con-tains quartz, sphalerite, and bornite inclusions. It also formsintergrowths with sphalerite, bornite, and galena, and some-times with chalcocite.
Finely disseminated sulphides in small “feather-like”chloride veins are the characteristic ore structures found inthis period of mineralisation. Disseminated sulphide grains
that are mainly chalcopyrite and pyrite are present both inmatrix material and in phenocrysts in biotite grains.
The copper-molybdenum and associated tungsten minerali-sation phase is the most widespread and contains the largestoverall amounts of sulphide minerals. This phase is found inboth porphyries and granitoids, as well as in hornfelses. Varioustypes of hydrothermal alterations and varying intensities of alter-ation are associated with this type of mineralisation (Table 8).
The Cu-Mo-W mineralisation was formed in severalstages that were clearly separated in time, and each stage wasgenerally associated with different fissures systems (Ta-ble 7), and characterised by a different suite of minerals. Theorder of individual stages was defined on the basis of thecross-cutting sequence of veins (Plate II, Fig. 3). The stagesdiffer in paragenesis from one another because they occurredat different temperatures and under different physico-chemi-cal conditions. The two main ore minerals, pyrite and chalco-pyrite, are present in veins from all stages, molybdenite isfound in four stages, and scheelite in only three.
The following five mineral paragenetic assemblages (stages)have been distinguished:
1. Feldspar-molybdenite veins, with biotite.2. Quartz-feldspathic, pegmatitic veins.3. Quartz veins, with molybdenite and scheelite.4. Black quartz veins, with molybdenite.5. Quartz-polymetallic veins.
Period II — main, hydrothermal 45
T a b l e 8
Chemical content of altered rocks (wt %)
Component
K-rich metasomatism Phyllic metasomatism Argillisation
Samples (m)
P-33
981.6
Pz-33
945.5
Pz-33
843.9
Pz-33
681.7
Pz-29
681.7
Pz-29
674.1
Pz-17
1216.0
Pz-33
304.8
SiO2 60.43 62.75 65.19 73.55 74.36 70.61 71.94 65.49
Al2O3 18.98 17.66 16.61 11.25 12.62 16.09 15.19 17.82
CaO 1.4z8 1.57 2.20 1.35 0.81 1.39 0.76 2.38
MgO 0.88 0.20 0.65 0.36 0.26 0.43 0.37 0.60
Na2O 2.32 1.46 3.60 0.19 0.27 0.24 0.19 0.72
K2O 12.50 13.60 7.00 3.70 8.45 7.44 6.85 5.58
Fe2O ((total Fe) 2.19 0.87 3.02 5.39 1.04 1.55 1.37 1.61
MnO 0.03 0.03 0.02 0.02 0.03 0.08 0.02 0.04
TiO2 0.49 0.27 0.35 0.35 0.30 0.40 0.36 0.54
LOI 1.17 2.05 1.70 3.86 1.49 2.20 2.65 5.17
Total 100.47 100.46 100.34 100.02 99.63 100.43 99.70 99.95
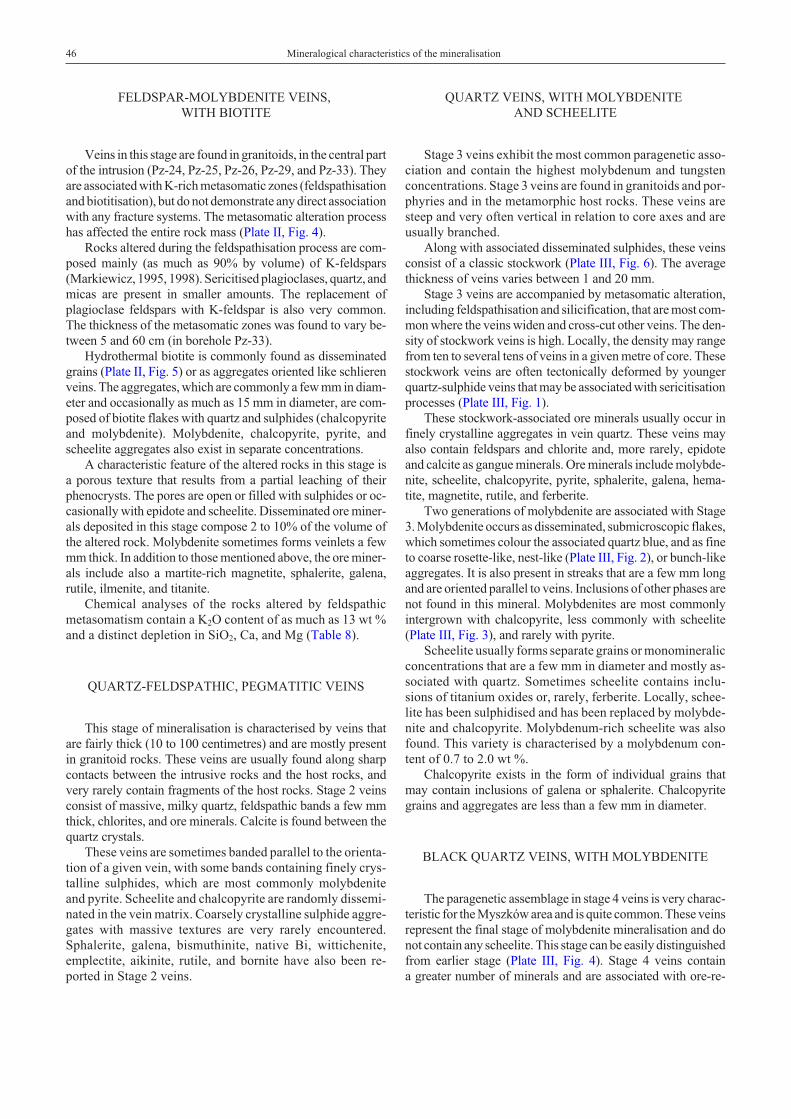
FELDSPAR-MOLYBDENITE VEINS,WITH BIOTITE
Veins in this stage are found in granitoids, in the central partof the intrusion (Pz-24, Pz-25, Pz-26, Pz-29, and Pz-33). Theyare associated with K-rich metasomatic zones (feldspathisationand biotitisation), but do not demonstrate any direct associationwith any fracture systems. The metasomatic alteration processhas affected the entire rock mass (Plate II, Fig. 4).
Rocks altered during the feldspathisation process are com-posed mainly (as much as 90% by volume) of K-feldspars(Markiewicz, 1995, 1998). Sericitised plagioclases, quartz, andmicas are present in smaller amounts. The replacement ofplagioclase feldspars with K-feldspar is also very common.The thickness of the metasomatic zones was found to vary be-tween 5 and 60 cm (in borehole Pz-33).
Hydrothermal biotite is commonly found as disseminatedgrains (Plate II, Fig. 5) or as aggregates oriented like schlierenveins. The aggregates, which are commonly a few mm in diam-eter and occasionally as much as 15 mm in diameter, are com-posed of biotite flakes with quartz and sulphides (chalcopyriteand molybdenite). Molybdenite, chalcopyrite, pyrite, andscheelite aggregates also exist in separate concentrations.
A characteristic feature of the altered rocks in this stage isa porous texture that results from a partial leaching of theirphenocrysts. The pores are open or filled with sulphides or oc-casionally with epidote and scheelite. Disseminated ore miner-als deposited in this stage compose 2 to 10% of the volume ofthe altered rock. Molybdenite sometimes forms veinlets a fewmm thick. In addition to those mentioned above, the ore miner-als include also a martite-rich magnetite, sphalerite, galena,rutile, ilmenite, and titanite.
Chemical analyses of the rocks altered by feldspathicmetasomatism contain a K2O content of as much as 13 wt %and a distinct depletion in SiO2, Ca, and Mg (Table 8).
QUARTZ-FELDSPATHIC, PEGMATITIC VEINS
This stage of mineralisation is characterised by veins thatare fairly thick (10 to 100 centimetres) and are mostly presentin granitoid rocks. These veins are usually found along sharpcontacts between the intrusive rocks and the host rocks, andvery rarely contain fragments of the host rocks. Stage 2 veinsconsist of massive, milky quartz, feldspathic bands a few mmthick, chlorites, and ore minerals. Calcite is found between thequartz crystals.
These veins are sometimes banded parallel to the orienta-tion of a given vein, with some bands containing finely crys-talline sulphides, which are most commonly molybdeniteand pyrite. Scheelite and chalcopyrite are randomly dissemi-nated in the vein matrix. Coarsely crystalline sulphide aggre-gates with massive textures are very rarely encountered.Sphalerite, galena, bismuthinite, native Bi, wittichenite,emplectite, aikinite, rutile, and bornite have also been re-ported in Stage 2 veins.
QUARTZ VEINS, WITH MOLYBDENITEAND SCHEELITE
Stage 3 veins exhibit the most common paragenetic asso-ciation and contain the highest molybdenum and tungstenconcentrations. Stage 3 veins are found in granitoids and por-phyries and in the metamorphic host rocks. These veins aresteep and very often vertical in relation to core axes and areusually branched.
Along with associated disseminated sulphides, these veinsconsist of a classic stockwork (Plate III, Fig. 6). The averagethickness of veins varies between 1 and 20 mm.
Stage 3 veins are accompanied by metasomatic alteration,including feldspathisation and silicification, that are most com-mon where the veins widen and cross-cut other veins. The den-sity of stockwork veins is high. Locally, the density may rangefrom ten to several tens of veins in a given metre of core. Thesestockwork veins are often tectonically deformed by youngerquartz-sulphide veins that may be associated with sericitisationprocesses (Plate III, Fig. 1).
These stockwork-associated ore minerals usually occur infinely crystalline aggregates in vein quartz. These veins mayalso contain feldspars and chlorite and, more rarely, epidoteand calcite as gangue minerals. Ore minerals include molybde-nite, scheelite, chalcopyrite, pyrite, sphalerite, galena, hema-tite, magnetite, rutile, and ferberite.
Two generations of molybdenite are associated with Stage3. Molybdenite occurs as disseminated, submicroscopic flakes,which sometimes colour the associated quartz blue, and as fineto coarse rosette-like, nest-like (Plate III, Fig. 2), or bunch-likeaggregates. It is also present in streaks that are a few mm longand are oriented parallel to veins. Inclusions of other phases arenot found in this mineral. Molybdenites are most commonlyintergrown with chalcopyrite, less commonly with scheelite(Plate III, Fig. 3), and rarely with pyrite.
Scheelite usually forms separate grains or monomineralicconcentrations that are a few mm in diameter and mostly as-sociated with quartz. Sometimes scheelite contains inclu-sions of titanium oxides or, rarely, ferberite. Locally, schee-lite has been sulphidised and has been replaced by molybde-nite and chalcopyrite. Molybdenum-rich scheelite was alsofound. This variety is characterised by a molybdenum con-tent of 0.7 to 2.0 wt %.
Chalcopyrite exists in the form of individual grains thatmay contain inclusions of galena or sphalerite. Chalcopyritegrains and aggregates are less than a few mm in diameter.
BLACK QUARTZ VEINS, WITH MOLYBDENITE
The paragenetic assemblage in stage 4 veins is very charac-teristic for the Myszków area and is quite common. These veinsrepresent the final stage of molybdenite mineralisation and donot contain any scheelite. This stage can be easily distinguishedfrom earlier stage (Plate III, Fig. 4). Stage 4 veins containa greater number of minerals and are associated with ore-re-
46 Mineralogical characteristics of the mineralisation
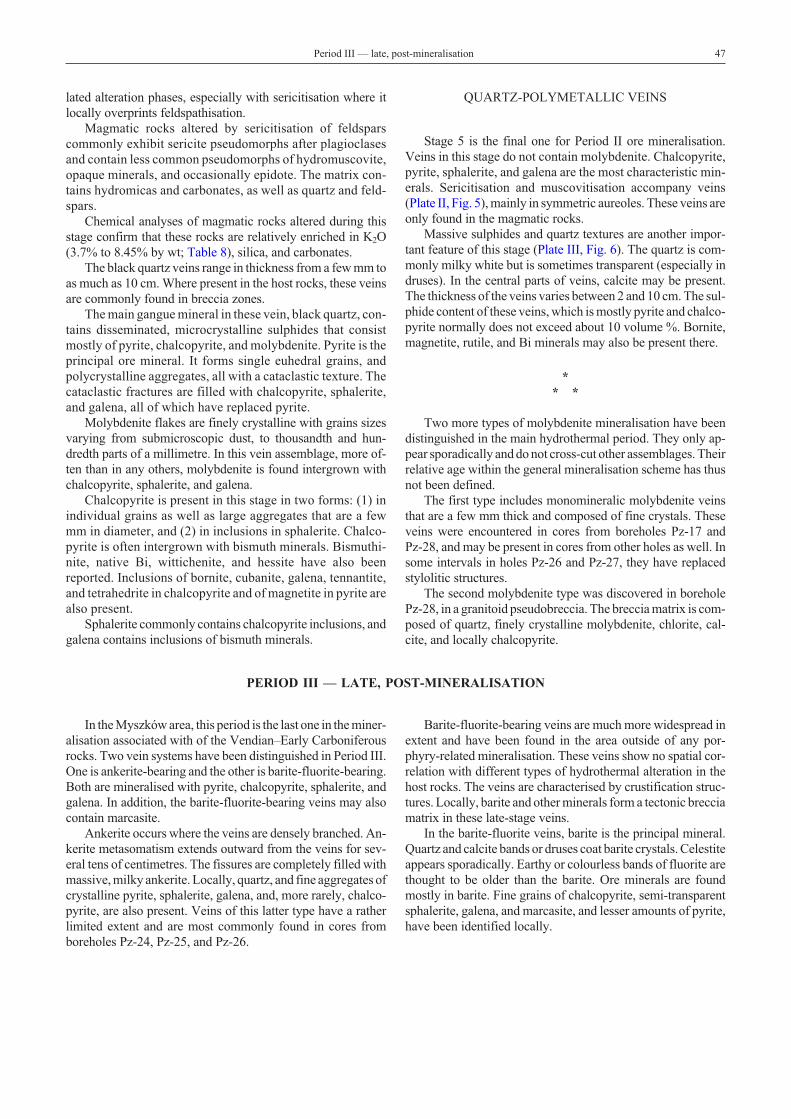
lated alteration phases, especially with sericitisation where itlocally overprints feldspathisation.
Magmatic rocks altered by sericitisation of feldsparscommonly exhibit sericite pseudomorphs after plagioclasesand contain less common pseudomorphs of hydromuscovite,opaque minerals, and occasionally epidote. The matrix con-tains hydromicas and carbonates, as well as quartz and feld-spars.
Chemical analyses of magmatic rocks altered during thisstage confirm that these rocks are relatively enriched in K2O(3.7% to 8.45% by wt; Table 8), silica, and carbonates.
The black quartz veins range in thickness from a few mm toas much as 10 cm. Where present in the host rocks, these veinsare commonly found in breccia zones.
The main gangue mineral in these vein, black quartz, con-tains disseminated, microcrystalline sulphides that consistmostly of pyrite, chalcopyrite, and molybdenite. Pyrite is theprincipal ore mineral. It forms single euhedral grains, andpolycrystalline aggregates, all with a cataclastic texture. Thecataclastic fractures are filled with chalcopyrite, sphalerite,and galena, all of which have replaced pyrite.
Molybdenite flakes are finely crystalline with grains sizesvarying from submicroscopic dust, to thousandth and hun-dredth parts of a millimetre. In this vein assemblage, more of-ten than in any others, molybdenite is found intergrown withchalcopyrite, sphalerite, and galena.
Chalcopyrite is present in this stage in two forms: (1) inindividual grains as well as large aggregates that are a fewmm in diameter, and (2) in inclusions in sphalerite. Chalco-pyrite is often intergrown with bismuth minerals. Bismuthi-nite, native Bi, wittichenite, and hessite have also beenreported. Inclusions of bornite, cubanite, galena, tennantite,and tetrahedrite in chalcopyrite and of magnetite in pyrite arealso present.
Sphalerite commonly contains chalcopyrite inclusions, andgalena contains inclusions of bismuth minerals.
QUARTZ-POLYMETALLIC VEINS
Stage 5 is the final one for Period II ore mineralisation.Veins in this stage do not contain molybdenite. Chalcopyrite,pyrite, sphalerite, and galena are the most characteristic min-erals. Sericitisation and muscovitisation accompany veins(Plate II, Fig. 5), mainly in symmetric aureoles. These veins areonly found in the magmatic rocks.
Massive sulphides and quartz textures are another impor-tant feature of this stage (Plate III, Fig. 6). The quartz is com-monly milky white but is sometimes transparent (especially indruses). In the central parts of veins, calcite may be present.The thickness of the veins varies between 2 and 10 cm. The sul-phide content of these veins, which is mostly pyrite and chalco-pyrite normally does not exceed about 10 volume %. Bornite,magnetite, rutile, and Bi minerals may also be present there.
** *
Two more types of molybdenite mineralisation have beendistinguished in the main hydrothermal period. They only ap-pear sporadically and do not cross-cut other assemblages. Theirrelative age within the general mineralisation scheme has thusnot been defined.
The first type includes monomineralic molybdenite veinsthat are a few mm thick and composed of fine crystals. Theseveins were encountered in cores from boreholes Pz-17 andPz-28, and may be present in cores from other holes as well. Insome intervals in holes Pz-26 and Pz-27, they have replacedstylolitic structures.
The second molybdenite type was discovered in boreholePz-28, in a granitoid pseudobreccia. The breccia matrix is com-posed of quartz, finely crystalline molybdenite, chlorite, cal-cite, and locally chalcopyrite.
PERIOD III — LATE, POST-MINERALISATION
In the Myszków area, this period is the last one in the miner-alisation associated with of the Vendian–Early Carboniferousrocks. Two vein systems have been distinguished in Period III.One is ankerite-bearing and the other is barite-fluorite-bearing.Both are mineralised with pyrite, chalcopyrite, sphalerite, andgalena. In addition, the barite-fluorite-bearing veins may alsocontain marcasite.
Ankerite occurs where the veins are densely branched. An-kerite metasomatism extends outward from the veins for sev-eral tens of centimetres. The fissures are completely filled withmassive, milky ankerite. Locally, quartz, and fine aggregates ofcrystalline pyrite, sphalerite, galena, and, more rarely, chalco-pyrite, are also present. Veins of this latter type have a ratherlimited extent and are most commonly found in cores fromboreholes Pz-24, Pz-25, and Pz-26.
Barite-fluorite-bearing veins are much more widespread inextent and have been found in the area outside of any por-phyry-related mineralisation. These veins show no spatial cor-relation with different types of hydrothermal alteration in thehost rocks. The veins are characterised by crustification struc-tures. Locally, barite and other minerals form a tectonic brecciamatrix in these late-stage veins.
In the barite-fluorite veins, barite is the principal mineral.Quartz and calcite bands or druses coat barite crystals. Celestiteappears sporadically. Earthy or colourless bands of fluorite arethought to be older than the barite. Ore minerals are foundmostly in barite. Fine grains of chalcopyrite, semi-transparentsphalerite, galena, and marcasite, and lesser amounts of pyrite,have been identified locally.
Period III — late, post-mineralisation 47
PLATE II
48 Mineralogical characteristics of the mineralisation
Fig. 1. Metasomatic replacement of amphiboles by chalcopyrite (cp), magnetite (mt), and hematite (hem). Pz-33/218.2 m/1N.
Fig. 2. Feldspar-epidote metasomatite with quartz-feldspar-chalcopyrite veins. Pz-32/673.7 m.
Fig. 3. Quartz stockwork cut by a vein composed of black quartz pseudobreccia with disseminated sulphides. Pz-29/747.1 m.
Fig. 4. Feldspar metasomatite. Unaltered parts of granodiorite — dark grey. Pz-33/986.2 m.
Fig. 5. Impregnation of secondary biotite in metasomatic feldspar mass. Pz-33/847.1 m.
Fig. 6. Two generations of quartz veins: (1) stockwork type — older, (2) black quartz with sericite and sulphides — younger. Pz-33/512.4 m.
PLATE III
Period III — late, post-mineralisation 49
Fig. 1. Dark grey sericitised zone overlapping a deformed quartz vein. Pz-29/640.0 m.
Fig. 2. Monomineralic concentration of molybdenite (mo). Reflected light. Pz-17/1000.3 m/XN.
Fig. 3. Aggregate of molybdenite (mo) and scheelite (sch) in quartz. Reflected light. Pz-29/667.0 m/1N.
Fig. 4. Black quartz veins with sulphides overlapping a stockwork system of quartz veins with molybdenite. Pz-33/470.2 m.
Fig. 5. Granodiorite altered in phyllic metasomatism, impregnated by pyrite and chalcopyrite. Pz-26/526.6 m.
Fig. 6. Massive concentration of sphalerite, galena, chalcopyrite, and pyrite in quartz. Pz-10/756.5.
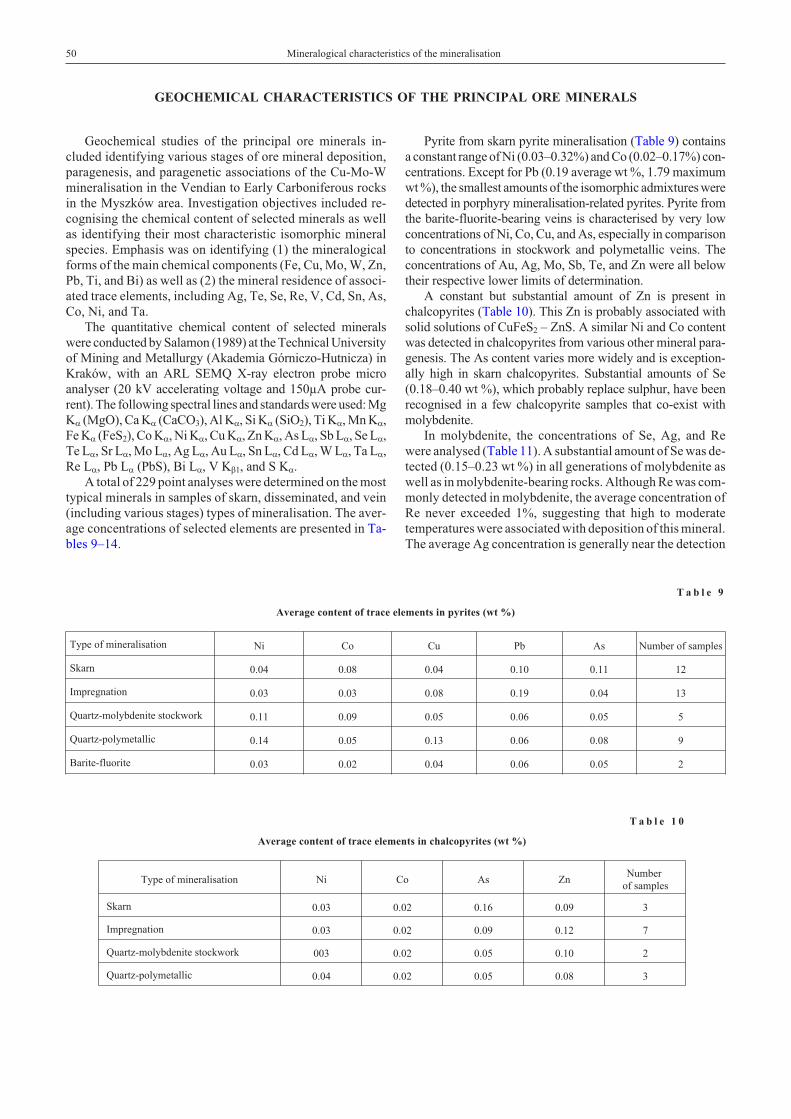
GEOCHEMICAL CHARACTERISTICS OF THE PRINCIPAL ORE MINERALS
Geochemical studies of the principal ore minerals in-cluded identifying various stages of ore mineral deposition,paragenesis, and paragenetic associations of the Cu-Mo-Wmineralisation in the Vendian to Early Carboniferous rocksin the Myszków area. Investigation objectives included re-cognising the chemical content of selected minerals as wellas identifying their most characteristic isomorphic mineralspecies. Emphasis was on identifying (1) the mineralogicalforms of the main chemical components (Fe, Cu, Mo, W, Zn,Pb, Ti, and Bi) as well as (2) the mineral residence of associ-ated trace elements, including Ag, Te, Se, Re, V, Cd, Sn, As,Co, Ni, and Ta.
The quantitative chemical content of selected mineralswere conducted by Salamon (1989) at the Technical Universityof Mining and Metallurgy (Akademia Górniczo-Hutnicza) inKraków, with an ARL SEMQ X-ray electron probe microanalyser (20 kV accelerating voltage and 150µA probe cur-rent). The following spectral lines and standards were used: MgK� (MgO), Ca K� (CaCO3), Al K�, Si K� (SiO2), Ti K�, Mn K�,Fe K� (FeS2), Co K�, Ni K�, Cu K�, Zn K�, As L�, Sb L�, Se L�,Te L�, Sr L�, Mo L�, Ag L�, Au L�, Sn L�, Cd L�, W L�, Ta L�,Re L�, Pb L� (PbS), Bi L�, V K�1, and S K�.
A total of 229 point analyses were determined on the mosttypical minerals in samples of skarn, disseminated, and vein(including various stages) types of mineralisation. The aver-age concentrations of selected elements are presented in Ta-bles 9–14.
Pyrite from skarn pyrite mineralisation (Table 9) containsa constant range of Ni (0.03–0.32%) and Co (0.02–0.17%) con-centrations. Except for Pb (0.19 average wt %, 1.79 maximumwt %), the smallest amounts of the isomorphic admixtures weredetected in porphyry mineralisation-related pyrites. Pyrite fromthe barite-fluorite-bearing veins is characterised by very lowconcentrations of Ni, Co, Cu, and As, especially in comparisonto concentrations in stockwork and polymetallic veins. Theconcentrations of Au, Ag, Mo, Sb, Te, and Zn were all belowtheir respective lower limits of determination.
A constant but substantial amount of Zn is present inchalcopyrites (Table 10). This Zn is probably associated withsolid solutions of CuFeS2 – ZnS. A similar Ni and Co contentwas detected in chalcopyrites from various other mineral para-genesis. The As content varies more widely and is exception-ally high in skarn chalcopyrites. Substantial amounts of Se(0.18–0.40 wt %), which probably replace sulphur, have beenrecognised in a few chalcopyrite samples that co-exist withmolybdenite.
In molybdenite, the concentrations of Se, Ag, and Rewere analysed (Table 11). A substantial amount of Se was de-tected (0.15–0.23 wt %) in all generations of molybdenite aswell as in molybdenite-bearing rocks. Although Re was com-monly detected in molybdenite, the average concentration ofRe never exceeded 1%, suggesting that high to moderatetemperatures were associated with deposition of this mineral.The average Ag concentration is generally near the detection
50 Mineralogical characteristics of the mineralisation
T a b l e 9
Average content of trace elements in pyrites (wt %)
Type of mineralisation Ni Co Cu Pb As Number of samples
Skarn 0.04 0.08 0.04 0.10 0.11 12
Impregnation 0.03 0.03 0.08 0.19 0.04 13
Quartz-molybdenite stockwork 0.11 0.09 0.05 0.06 0.05 5
Quartz-polymetallic 0.14 0.05 0.13 0.06 0.08 9
Barite-fluorite 0.03 0.02 0.04 0.06 0.05 2
T a b l e 1 0
Average content of trace elements in chalcopyrites (wt %)
Type of mineralisation Ni Co As ZnNumber
of samples
Skarn 0.03 0.02 0.16 0.09 3
Impregnation 0.03 0.02 0.09 0.12 7
Quartz-molybdenite stockwork 003 0.02 0.05 0.10 2
Quartz-polymetallic 0.04 0.02 0.05 0.08 3
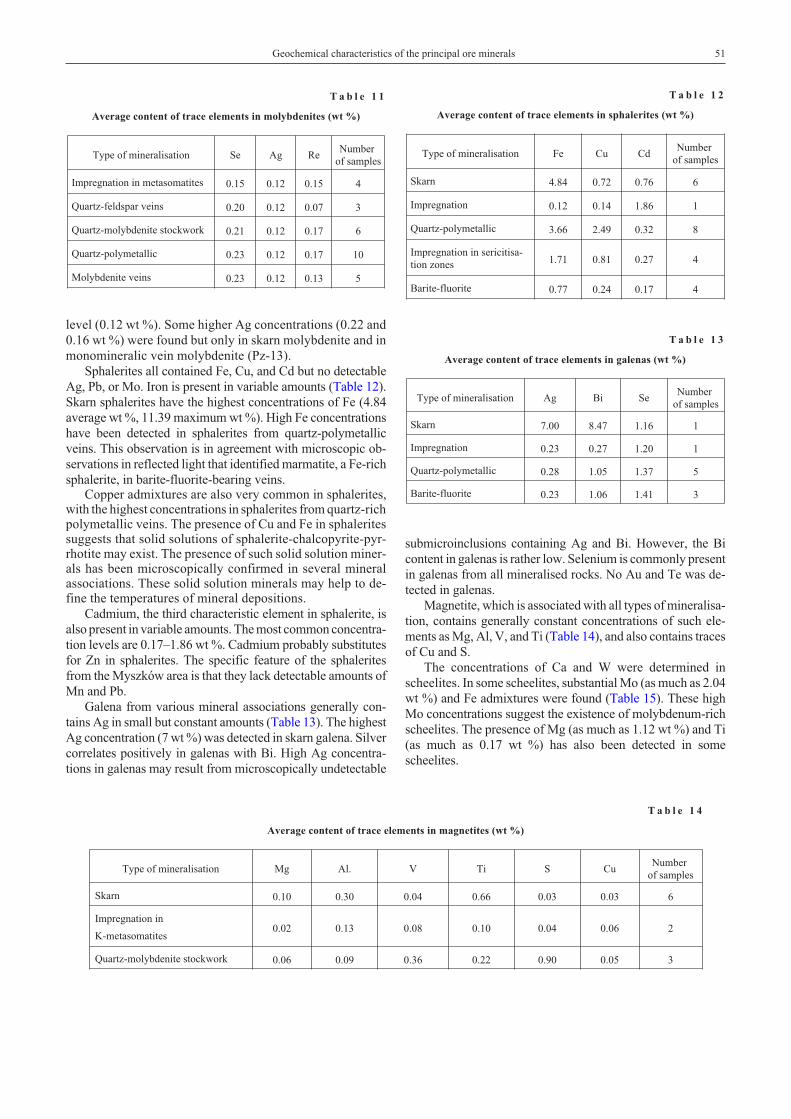
level (0.12 wt %). Some higher Ag concentrations (0.22 and0.16 wt %) were found but only in skarn molybdenite and inmonomineralic vein molybdenite (Pz-13).
Sphalerites all contained Fe, Cu, and Cd but no detectableAg, Pb, or Mo. Iron is present in variable amounts (Table 12).Skarn sphalerites have the highest concentrations of Fe (4.84average wt %, 11.39 maximum wt %). High Fe concentrationshave been detected in sphalerites from quartz-polymetallicveins. This observation is in agreement with microscopic ob-servations in reflected light that identified marmatite, a Fe-richsphalerite, in barite-fluorite-bearing veins.
Copper admixtures are also very common in sphalerites,with the highest concentrations in sphalerites from quartz-richpolymetallic veins. The presence of Cu and Fe in sphaleritessuggests that solid solutions of sphalerite-chalcopyrite-pyr-rhotite may exist. The presence of such solid solution miner-als has been microscopically confirmed in several mineralassociations. These solid solution minerals may help to de-fine the temperatures of mineral depositions.
Cadmium, the third characteristic element in sphalerite, isalso present in variable amounts. The most common concentra-tion levels are 0.17–1.86 wt %. Cadmium probably substitutesfor Zn in sphalerites. The specific feature of the sphaleritesfrom the Myszków area is that they lack detectable amounts ofMn and Pb.
Galena from various mineral associations generally con-tains Ag in small but constant amounts (Table 13). The highestAg concentration (7 wt %) was detected in skarn galena. Silvercorrelates positively in galenas with Bi. High Ag concentra-tions in galenas may result from microscopically undetectable
submicroinclusions containing Ag and Bi. However, the Bicontent in galenas is rather low. Selenium is commonly presentin galenas from all mineralised rocks. No Au and Te was de-tected in galenas.
Magnetite, which is associated with all types of mineralisa-tion, contains generally constant concentrations of such ele-ments as Mg, Al, V, and Ti (Table 14), and also contains tracesof Cu and S.
The concentrations of Ca and W were determined inscheelites. In some scheelites, substantial Mo (as much as 2.04wt %) and Fe admixtures were found (Table 15). These highMo concentrations suggest the existence of molybdenum-richscheelites. The presence of Mg (as much as 1.12 wt %) and Ti(as much as 0.17 wt %) has also been detected in somescheelites.
Geochemical characteristics of the principal ore minerals 51
T a b l e 1 1
Average content of trace elements in molybdenites (wt %)
Type of mineralisation Se Ag ReNumber
of samples
Impregnation in metasomatites 0.15 0.12 0.15 4
Quartz-feldspar veins 0.20 0.12 0.07 3
Quartz-molybdenite stockwork 0.21 0.12 0.17 6
Quartz-polymetallic 0.23 0.12 0.17 10
Molybdenite veins 0.23 0.12 0.13 5
T a b l e 1 2
Average content of trace elements in sphalerites (wt %)
Type of mineralisation Fe Cu CdNumber
of samples
Skarn 4.84 0.72 0.76 6
Impregnation 0.12 0.14 1.86 1
Quartz-polymetallic 3.66 2.49 0.32 8
Impregnation in sericitisa-
tion zones1.71 0.81 0.27 4
Barite-fluorite 0.77 0.24 0.17 4
T a b l e 1 3
Average content of trace elements in galenas (wt %)
Type of mineralisation Ag Bi SeNumber
of samples
Skarn 7.00 8.47 1.16 1
Impregnation 0.23 0.27 1.20 1
Quartz-polymetallic 0.28 1.05 1.37 5
Barite-fluorite 0.23 1.06 1.41 3
T a b l e 1 4
Average content of trace elements in magnetites (wt %)
Type of mineralisation Mg Al. V Ti S CuNumber
of samples
Skarn 0.10 0.30 0.04 0.66 0.03 0.03 6
Impregnation in
K-metasomatites0.02 0.13 0.08 0.10 0.04 0.06 2
Quartz-molybdenite stockwork 0.06 0.09 0.36 0.22 0.90 0.05 3
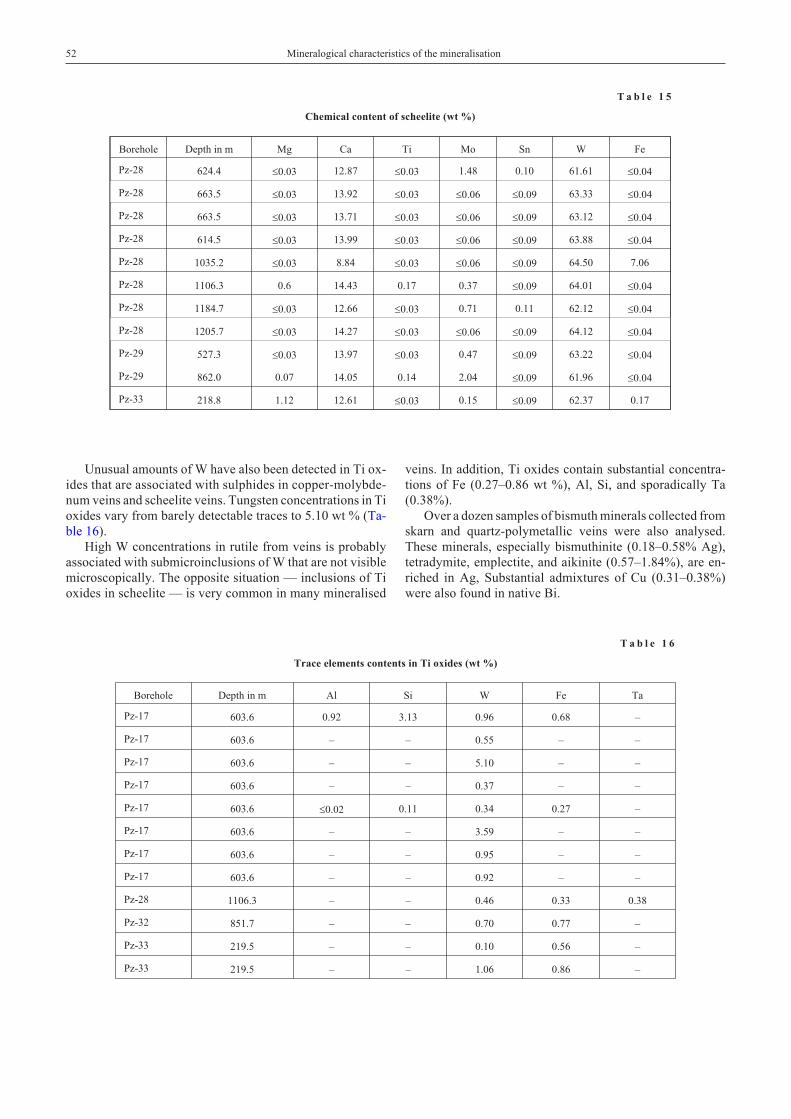
Unusual amounts of W have also been detected in Ti ox-ides that are associated with sulphides in copper-molybde-num veins and scheelite veins. Tungsten concentrations in Tioxides vary from barely detectable traces to 5.10 wt % (Ta-ble 16).
High W concentrations in rutile from veins is probablyassociated with submicroinclusions of W that are not visiblemicroscopically. The opposite situation — inclusions of Tioxides in scheelite — is very common in many mineralised
veins. In addition, Ti oxides contain substantial concentra-tions of Fe (0.27–0.86 wt %), Al, Si, and sporadically Ta(0.38%).
Over a dozen samples of bismuth minerals collected fromskarn and quartz-polymetallic veins were also analysed.These minerals, especially bismuthinite (0.18–0.58% Ag),tetradymite, emplectite, and aikinite (0.57–1.84%), are en-riched in Ag, Substantial admixtures of Cu (0.31–0.38%)were also found in native Bi.
52 Mineralogical characteristics of the mineralisation
T a b l e 1 5
Chemical content of scheelite (wt %)
Borehole Depth in m Mg Ca Ti Mo Sn W Fe
Pz-28 624.4 �0.03 12.87 �0.03 1.48 0.10 61.61 �0.04
Pz-28 663.5 �0.03 13.92 �0.03 �0.06 �0.09 63.33 �0.04
Pz-28 663.5 �0.03 13.71 �0.03 �0.06 �0.09 63.12 �0.04
Pz-28 614.5 �0.03 13.99 �0.03 �0.06 �0.09 63.88 �0.04
Pz-28 1035.2 �0.03 8.84 �0.03 �0.06 �0.09 64.50 7.06
Pz-28 1106.3 0.6 14.43 0.17 0.37 �0.09 64.01 �0.04
Pz-28 1184.7 �0.03 12.66 �0.03 0.71 0.11 62.12 �0.04
Pz-28 1205.7 �0.03 14.27 �0.03 �0.06 �0.09 64.12 �0.04
Pz-29 527.3 �0.03 13.97 �0.03 0.47 �0.09 63.22 �0.04
Pz-29 862.0 0.07 14.05 0.14 2.04 �0.09 61.96 �0.04
Pz-33 218.8 1.12 12.61 �0.03 0.15 �0.09 62.37 0.17
T a b l e 1 6
Trace elements contents in Ti oxides (wt %)
Borehole Depth in m Al Si W Fe Ta
Pz-17 603.6 0.92 3.13 0.96 0.68 –
Pz-17 603.6 – – 0.55 – –
Pz-17 603.6 – – 5.10 – –
Pz-17 603.6 – – 0.37 – –
Pz-17 603.6 �0.02 0.11 0.34 0.27 –
Pz-17 603.6 – – 3.59 – –
Pz-17 603.6 – – 0.95 – –
Pz-17 603.6 – – 0.92 – –
Pz-28 1106.3 – – 0.46 0.33 0.38
Pz-32 851.7 – – 0.70 0.77 –
Pz-33 219.5 – – 0.10 0.56 –
Pz-33 219.5 – – 1.06 0.86 –
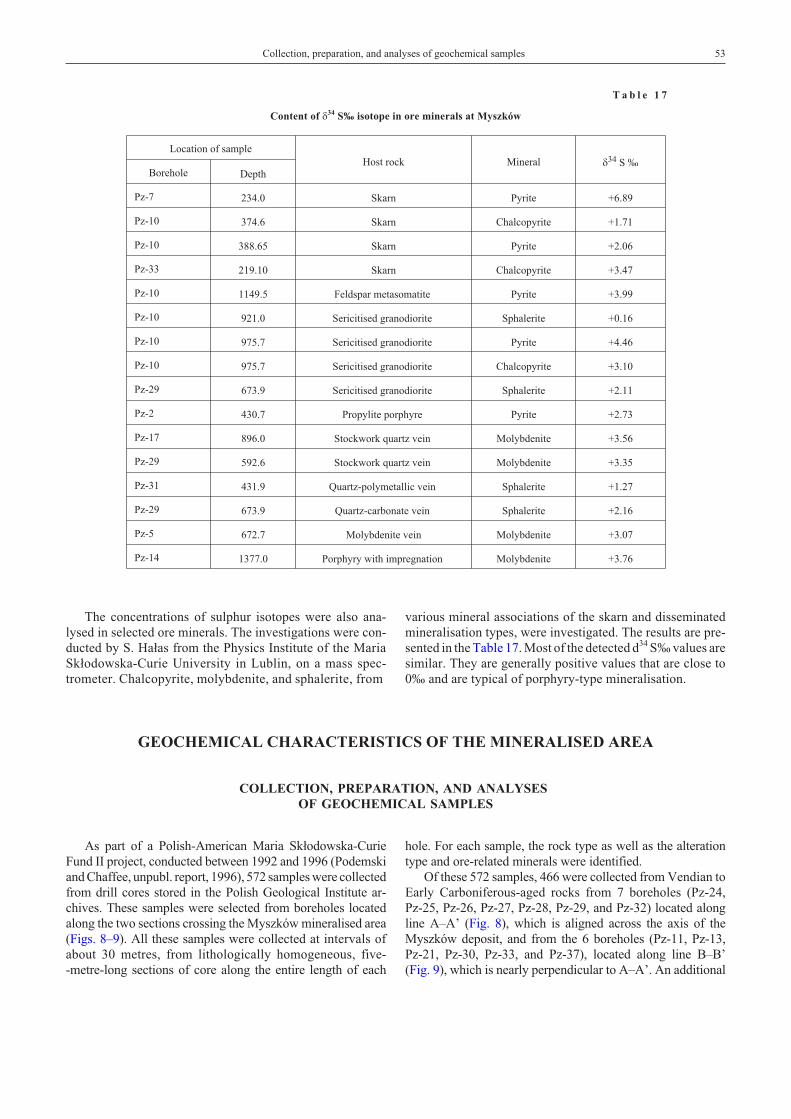
The concentrations of sulphur isotopes were also ana-lysed in selected ore minerals. The investigations were con-ducted by S. Ha³as from the Physics Institute of the MariaSk³odowska-Curie University in Lublin, on a mass spec-trometer. Chalcopyrite, molybdenite, and sphalerite, from
various mineral associations of the skarn and disseminatedmineralisation types, were investigated. The results are pre-sented in the Table 17. Most of the detected d34 S‰ values aresimilar. They are generally positive values that are close to0‰ and are typical of porphyry-type mineralisation.
GEOCHEMICAL CHARACTERISTICS OF THE MINERALISED AREA
COLLECTION, PREPARATION, AND ANALYSESOF GEOCHEMICAL SAMPLES
As part of a Polish-American Maria Sk³odowska-CurieFund II project, conducted between 1992 and 1996 (Podemskiand Chaffee, unpubl. report, 1996), 572 samples were collectedfrom drill cores stored in the Polish Geological Institute ar-chives. These samples were selected from boreholes locatedalong the two sections crossing the Myszków mineralised area(Figs. 8–9). All these samples were collected at intervals ofabout 30 metres, from lithologically homogeneous, five--metre-long sections of core along the entire length of each
hole. For each sample, the rock type as well as the alterationtype and ore-related minerals were identified.
Of these 572 samples, 466 were collected from Vendian toEarly Carboniferous-aged rocks from 7 boreholes (Pz-24,Pz-25, Pz-26, Pz-27, Pz-28, Pz-29, and Pz-32) located alongline A–A’ (Fig. 8), which is aligned across the axis of theMyszków deposit, and from the 6 boreholes (Pz-11, Pz-13,Pz-21, Pz-30, Pz-33, and Pz-37), located along line B–B’(Fig. 9), which is nearly perpendicular to A–A’. An additional
Collection, preparation, and analyses of geochemical samples 53
T a b l e 1 7
Content of �34
S‰ isotope in ore minerals at Myszków
Location of sampleHost rock Mineral �34 S ‰
Borehole Depth
Pz-7 234.0 Skarn Pyrite +6.89
Pz-10 374.6 Skarn Chalcopyrite +1.71
Pz-10 388.65 Skarn Pyrite +2.06
Pz-33 219.10 Skarn Chalcopyrite +3.47
Pz-10 1149.5 Feldspar metasomatite Pyrite +3.99
Pz-10 921.0 Sericitised granodiorite Sphalerite +0.16
Pz-10 975.7 Sericitised granodiorite Pyrite +4.46
Pz-10 975.7 Sericitised granodiorite Chalcopyrite +3.10
Pz-29 673.9 Sericitised granodiorite Sphalerite +2.11
Pz-2 430.7 Propylite porphyre Pyrite +2.73
Pz-17 896.0 Stockwork quartz vein Molybdenite +3.56
Pz-29 592.6 Stockwork quartz vein Molybdenite +3.35
Pz-31 431.9 Quartz-polymetallic vein Sphalerite +1.27
Pz-29 673.9 Quartz-carbonate vein Sphalerite +2.16
Pz-5 672.7 Molybdenite vein Molybdenite +3.07
Pz-14 1377.0 Porphyry with impregnation Molybdenite +3.76
64 samples were collected from Triassic and Quaternary (post--mineralisation-aged) rocks.
Samples were also collected from Vendian to Early Car-boniferous rocks from other boreholes (Pz-10, Pz-12, Pz-14,Pz-15, Pz-16, Pz-17, Pz-18, Pz-19, Pz-20, Pz-22, Pz-23, Pz-31,Pz-34, Pz-35, Pz-36, Pz-38, and Pz-40) located throughout theMyszków area (Fig. 7, except for hole Pz-10, which is locatedabout 2 km south-east of holes Pz-13 and Pz-14, outside of themap area) at depths of about 300 and 700 m, respectively.These samples were collected to provide, on two levels, a moreregional geochemical setting for the Myszków mineralisationin order to identify any lateral chemical zoning that might be re-lated to previously reported mineralogical zoning (Œlósarz,1985). Altogether 45 samples were collected for that purpose.
The samples were crushed to grains less than about 3 mmand then milled to produce material <0.06 mm in diameter.Chemical analyses were carried out in the Central ChemicalLaboratory of the PGI in Warsaw and in the US GeologicalSurvey Laboratory in Denver, Colorado, USA.
In the PGI Laboratory, samples were analysed for 37 vari-ables. The content of 17 variables (Ag, Al, Au, Ca, Cu, Fe, K, Li,Mg, Mn, Mo, Na, Pb, Si, Ti, V, and Zn) were determined byatomic-absorption spectrometry; 16 variables (Be, Ce, Co, Cr,Cd, Ga, La, Nb, Nd, Ni, P, S, Sc, Th, Y, and Yb) by induc-tively-coupled plasma atomic-emission (ICP-AES) spectros-copy, after a total digestion; 3 variables (Ba, Sr, and W) by X-rayfluorescence; and F — using an ion-selective electrode (ISE).
In Denver, Colorado, the samples were analysed for 67variables, including 50 elements analysed by ICP-AES, 11 byX-ray fluorescence, 4 (Au, Hg, Te, and Tl) by atomic-absorp-tion spectrometry, and 2 by other techniques (W by photo-spectrometry and S by an ignition technique).
After removing data for variables with no reported valuesabove the lower limit of determination for the variable, a total
of 43 variables (Ag, Al, As, Au, Ba, Be, Bi, Ca, Cd, Ce, Co, Cr,Cu, Fe, Ga, Hg, K, La, Li, Mg, Mn, Mo, Na, Nb, Nd, Ni, P, Pb,S, Sb, Sc, Si, Sr, Te, Th, Ti, Tl, V, W, Y, Yb, Zn, and loss on ig-nition at 925°C) remained for further evaluation (Chaffee et al.,1999).
As, Bi, Sb, Te, Tl, and the loss on ignition (LOI) concentra-tions were determined only in the US Geological Survey Labo-ratory, whereas F was determined only in the PGI Laboratory.In general, the results obtained in both laboratories for mostother variables were closely comparable.
Samples of the Triassic and Quaternary rocks were ana-lysed to determine whether they contained the same suite of el-ements present in the Vendian to Early Carboniferous rocks.The results show that the suite of mineralisation-related ele-ments in the Triassic rocks are distinctly different from thesuite in the mineralised Vendian to Early Carboniferous rocks,indicating that the ore-related elements present in the Vendianto Early Carboniferous rocks did not migrate upward into theTriassic rocks. Therefore, the distributions of ore-related ele-ments in the Triassic rocks are not related in any way to themineralisation in the Myszków system.
However, anomalous concentrations of Cu (380 ppm) andAg (1.2 ppm) were found in clastic fragments from basal con-glomerates and sandstones of the Lower Buntsandstein (thelowest Triassic strata) that unconformably overlie the Vendianto Early Carboniferous basement. This locally anomalous Cuand Ag is probably derived from weathering of originally ex-posed, mineralised basement rocks.
Anomalous Pb (maximum 560 ppm), Zn (860 ppm), andCd (6.50 ppm), were found in a few samples of Triassic dolo-mite and are thought to be associated with a Mississippi ValleyPb-Zn type mineralisation, which is very common in the Trias-sic carbonate formations of the Silesia–Kraków region.
STATISTICAL EVALUATION OF THE ANALYSES
Tables 18 and 19 summarise statistical information for thechemistry of 292 samples of felsic intrusive rocks and 174 sam-ples of Vendian to Early Cambrian metasedimentary rocks, re-spectively. For each variable, the tables list the maximum andminimum values, the number and percentage of unqualified(uncensored) values, as well as geometric mean values and es-timates of crustal abundances for Ca-rich granites (Table 18)and shale (Table 19). Abundance values for high-Ca granitewere selected for comparison because these values best repre-sent what is thought to be the pre-mineral deposit lithology formost of the intrusive rocks sampled. Abundance values forshale were selected as the closest sedimentary rock analogue tometa-siltstones.
The geometric mean values are based on unqualified valuesonly. They provide typical values for the abundance for eachelement in each of the two main lithologies found in theMyszków area. For the elements As, Au, and Sb, the data weretoo highly censored (too few unqualified analyses) and, there-
fore, values were estimated after examining distributions ofeach element in the Myszków analytical data set.
The column of maximum values for the elements in each ta-ble indicates that, when compared with mean or abundance val-ues, 29 elements (Ag, Al, As, Au, Ba, Be, Bi, Cd, Ce, Co, Cr,Cu, Fe, Hg, K, La, Li, Mn, Mo, Na, Ni, Pb, S, Sb, Sr, Te, Tl, W,and Zn) are clearly enriched in one or more samples, indicatingthat these elements may be associated in some way with forma-tion of the Myszków mineralisation, if only very locally.
FACTOR ANALYSES
Factor analyses was performed on a data set with 466 sam-ples and 43 variables that included both felsic igneous andmetasedimentary rocks. For the 43 selected variables, valueswere substituted for all qualified determinations as follows: for
54 Geochemical characteristics of the mineralised area
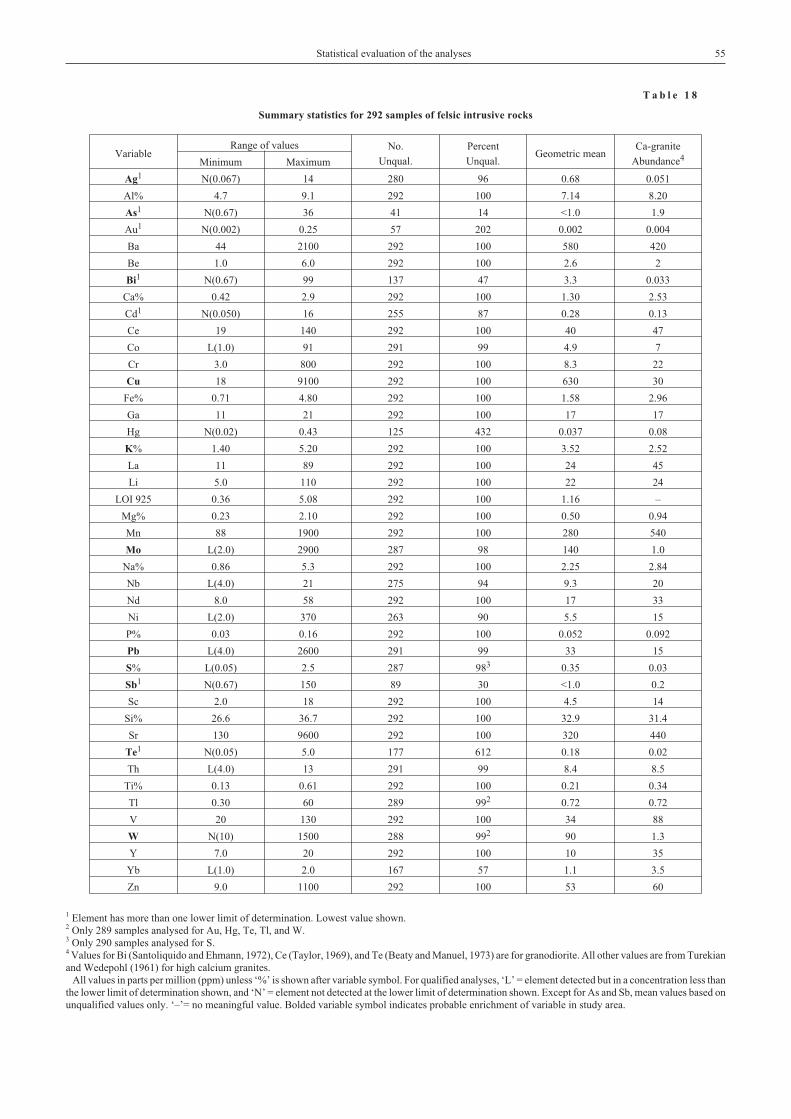
Statistical evaluation of the analyses 55
T a b l e 1 8
Summary statistics for 292 samples of felsic intrusive rocks
VariableRange of values No.
Unqual.
Percent
Unqual.Geometric mean
Ca-granite
Abundance4Minimum Maximum
Ag1 N(0.067) 14 280 96 0.68 0.051
Al% 4.7 9.1 292 100 7.14 8.20
As1 N(0.67) 36 41 14 <1.0 1.9
Au1 N(0.002) 0.25 57 202 0.002 0.004
Ba 44 2100 292 100 580 420
Be 1.0 6.0 292 100 2.6 2
Bi1 N(0.67) 99 137 47 3.3 0.033
Ca% 0.42 2.9 292 100 1.30 2.53
Cd1 N(0.050) 16 255 87 0.28 0.13
Ce 19 140 292 100 40 47
Co L(1.0) 91 291 99 4.9 7
Cr 3.0 800 292 100 8.3 22
Cu 18 9100 292 100 630 30
Fe% 0.71 4.80 292 100 1.58 2.96
Ga 11 21 292 100 17 17
Hg N(0.02) 0.43 125 432 0.037 0.08
K% 1.40 5.20 292 100 3.52 2.52
La 11 89 292 100 24 45
Li 5.0 110 292 100 22 24
LOI 925 0.36 5.08 292 100 1.16 –
Mg% 0.23 2.10 292 100 0.50 0.94
Mn 88 1900 292 100 280 540
Mo L(2.0) 2900 287 98 140 1.0
Na% 0.86 5.3 292 100 2.25 2.84
Nb L(4.0) 21 275 94 9.3 20
Nd 8.0 58 292 100 17 33
Ni L(2.0) 370 263 90 5.5 15
P% 0.03 0.16 292 100 0.052 0.092
Pb L(4.0) 2600 291 99 33 15
S% L(0.05) 2.5 287 983 0.35 0.03
Sb1 N(0.67) 150 89 30 <1.0 0.2
Sc 2.0 18 292 100 4.5 14
Si% 26.6 36.7 292 100 32.9 31.4
Sr 130 9600 292 100 320 440
Te1 N(0.05) 5.0 177 612 0.18 0.02
Th L(4.0) 13 291 99 8.4 8.5
Ti% 0.13 0.61 292 100 0.21 0.34
Tl 0.30 60 289 992 0.72 0.72
V 20 130 292 100 34 88
W N(10) 1500 288 992 90 1.3
Y 7.0 20 292 100 10 35
Yb L(1.0) 2.0 167 57 1.1 3.5
Zn 9.0 1100 292 100 53 60
1 Element has more than one lower limit of determination. Lowest value shown.2 Only 289 samples analysed for Au, Hg, Te, Tl, and W.3 Only 290 samples analysed for S.4 Values for Bi (Santoliquido and Ehmann, 1972), Ce (Taylor, 1969), and Te (Beaty and Manuel, 1973) are for granodiorite. All other values are from Turekianand Wedepohl (1961) for high calcium granites.
All values in parts per million (ppm) unless ‘%’ is shown after variable symbol. For qualified analyses, ‘L’ = element detected but in a concentration less than
the lower limit of determination shown, and ‘N’ = element not detected at the lower limit of determination shown. Except for As and Sb, mean values based on
unqualified values only. ‘–’= no meaningful value. Bolded variable symbol indicates probable enrichment of variable in study area.
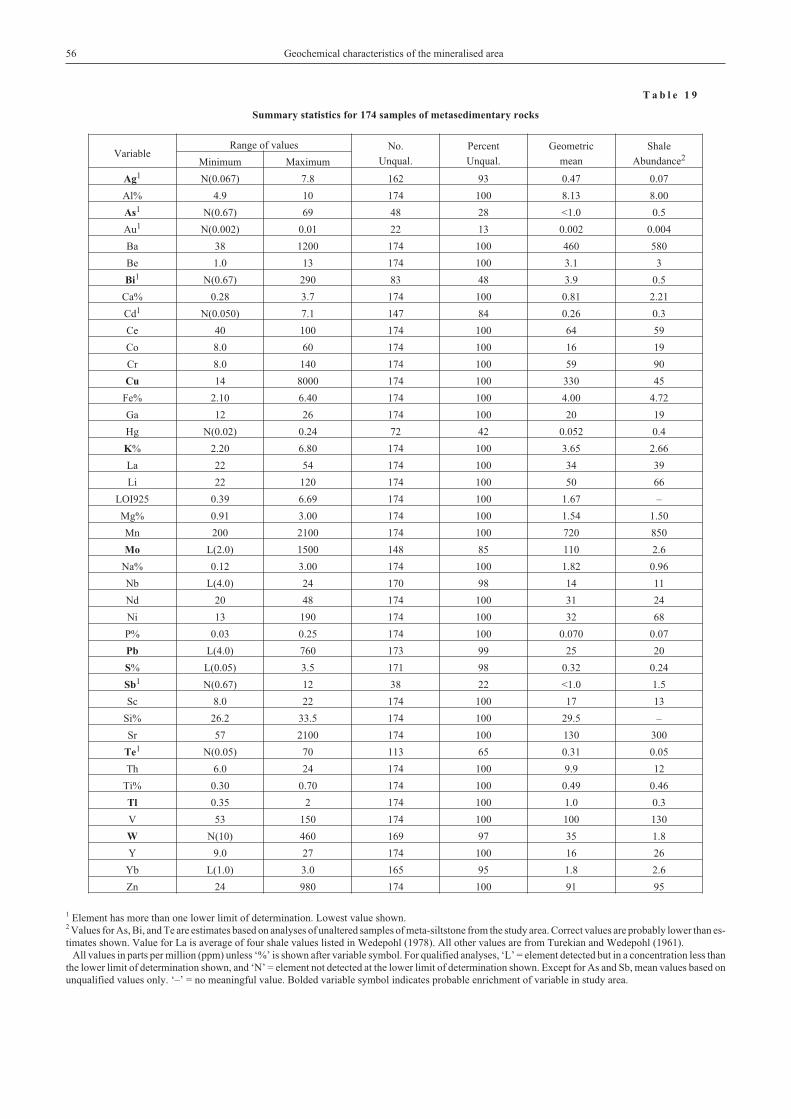
56 Geochemical characteristics of the mineralised area
T a b l e 1 9
Summary statistics for 174 samples of metasedimentary rocks
VariableRange of values No.
Unqual.
Percent
Unqual.
Geometric
mean
Shale
Abundance2Minimum Maximum
Ag1 N(0.067) 7.8 162 93 0.47 0.07
Al% 4.9 10 174 100 8.13 8.00
As1 N(0.67) 69 48 28 <1.0 0.5
Au1 N(0.002) 0.01 22 13 0.002 0.004
Ba 38 1200 174 100 460 580
Be 1.0 13 174 100 3.1 3
Bi1 N(0.67) 290 83 48 3.9 0.5
Ca% 0.28 3.7 174 100 0.81 2.21
Cd1 N(0.050) 7.1 147 84 0.26 0.3
Ce 40 100 174 100 64 59
Co 8.0 60 174 100 16 19
Cr 8.0 140 174 100 59 90
Cu 14 8000 174 100 330 45
Fe% 2.10 6.40 174 100 4.00 4.72
Ga 12 26 174 100 20 19
Hg N(0.02) 0.24 72 42 0.052 0.4
K% 2.20 6.80 174 100 3.65 2.66
La 22 54 174 100 34 39
Li 22 120 174 100 50 66
LOI925 0.39 6.69 174 100 1.67 –
Mg% 0.91 3.00 174 100 1.54 1.50
Mn 200 2100 174 100 720 850
Mo L(2.0) 1500 148 85 110 2.6
Na% 0.12 3.00 174 100 1.82 0.96
Nb L(4.0) 24 170 98 14 11
Nd 20 48 174 100 31 24
Ni 13 190 174 100 32 68
P% 0.03 0.25 174 100 0.070 0.07
Pb L(4.0) 760 173 99 25 20
S% L(0.05) 3.5 171 98 0.32 0.24
Sb1 N(0.67) 12 38 22 <1.0 1.5
Sc 8.0 22 174 100 17 13
Si% 26.2 33.5 174 100 29.5 –
Sr 57 2100 174 100 130 300
Te1 N(0.05) 70 113 65 0.31 0.05
Th 6.0 24 174 100 9.9 12
Ti% 0.30 0.70 174 100 0.49 0.46
Tl 0.35 2 174 100 1.0 0.3
V 53 150 174 100 100 130
W N(10) 460 169 97 35 1.8
Y 9.0 27 174 100 16 26
Yb L(1.0) 3.0 165 95 1.8 2.6
Zn 24 980 174 100 91 95
1 Element has more than one lower limit of determination. Lowest value shown.2 Values for As, Bi, and Te are estimates based on analyses of unaltered samples of meta-siltstone from the study area. Correct values are probably lower than es-
timates shown. Value for La is average of four shale values listed in Wedepohl (1978). All other values are from Turekian and Wedepohl (1961).
All values in parts per million (ppm) unless ‘%’ is shown after variable symbol. For qualified analyses, ‘L’ = element detected but in a concentration less than
the lower limit of determination shown, and ‘N’ = element not detected at the lower limit of determination shown. Except for As and Sb, mean values based on
unqualified values only. ‘–’ = no meaningful value. Bolded variable symbol indicates probable enrichment of variable in study area.
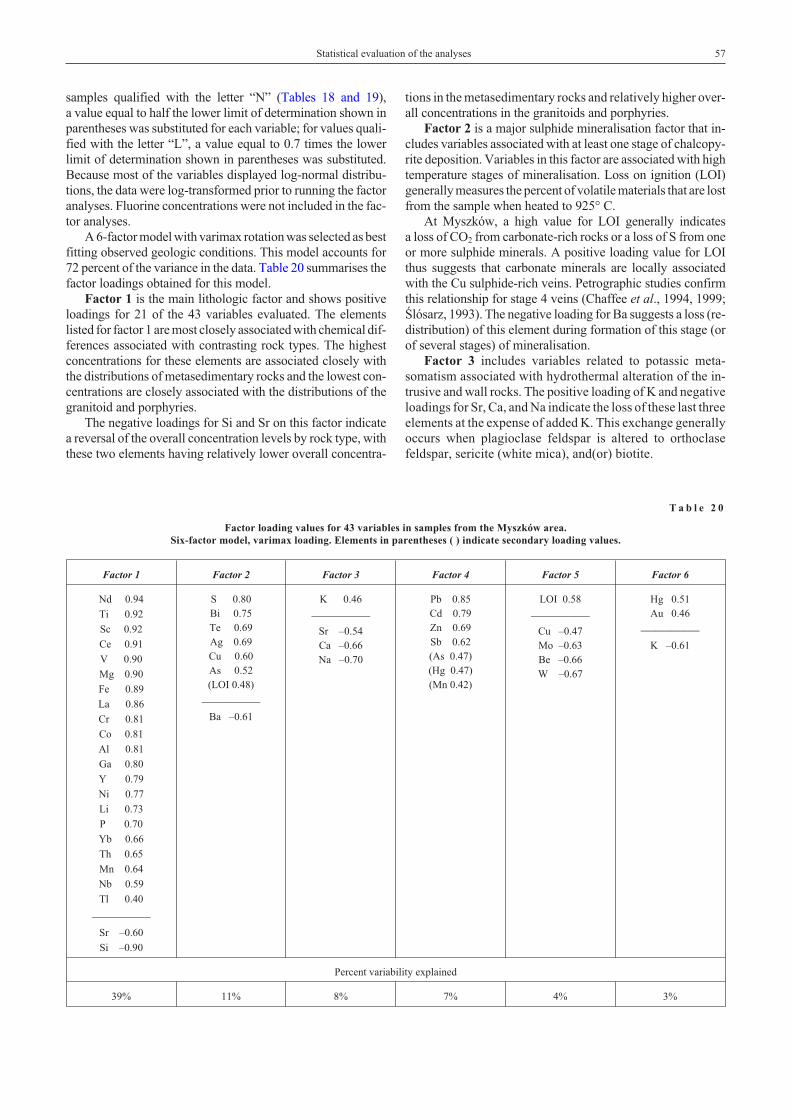
samples qualified with the letter “N” (Tables 18 and 19),a value equal to half the lower limit of determination shown inparentheses was substituted for each variable; for values quali-fied with the letter “L”, a value equal to 0.7 times the lowerlimit of determination shown in parentheses was substituted.Because most of the variables displayed log-normal distribu-tions, the data were log-transformed prior to running the factoranalyses. Fluorine concentrations were not included in the fac-tor analyses.
A 6-factor model with varimax rotation was selected as bestfitting observed geologic conditions. This model accounts for72 percent of the variance in the data. Table 20 summarises thefactor loadings obtained for this model.
Factor 1 is the main lithologic factor and shows positiveloadings for 21 of the 43 variables evaluated. The elementslisted for factor 1 are most closely associated with chemical dif-ferences associated with contrasting rock types. The highestconcentrations for these elements are associated closely withthe distributions of metasedimentary rocks and the lowest con-centrations are closely associated with the distributions of thegranitoid and porphyries.
The negative loadings for Si and Sr on this factor indicatea reversal of the overall concentration levels by rock type, withthese two elements having relatively lower overall concentra-
tions in the metasedimentary rocks and relatively higher over-all concentrations in the granitoids and porphyries.
Factor 2 is a major sulphide mineralisation factor that in-cludes variables associated with at least one stage of chalcopy-rite deposition. Variables in this factor are associated with hightemperature stages of mineralisation. Loss on ignition (LOI)generally measures the percent of volatile materials that are lostfrom the sample when heated to 925° C.
At Myszków, a high value for LOI generally indicatesa loss of CO2 from carbonate-rich rocks or a loss of S from oneor more sulphide minerals. A positive loading value for LOIthus suggests that carbonate minerals are locally associatedwith the Cu sulphide-rich veins. Petrographic studies confirmthis relationship for stage 4 veins (Chaffee et al., 1994, 1999;Œlósarz, 1993). The negative loading for Ba suggests a loss (re-distribution) of this element during formation of this stage (orof several stages) of mineralisation.
Factor 3 includes variables related to potassic meta-somatism associated with hydrothermal alteration of the in-trusive and wall rocks. The positive loading of K and negativeloadings for Sr, Ca, and Na indicate the loss of these last threeelements at the expense of added K. This exchange generallyoccurs when plagioclase feldspar is altered to orthoclasefeldspar, sericite (white mica), and(or) biotite.
Statistical evaluation of the analyses 57
T a b l e 2 0
Factor loading values for 43 variables in samples from the Myszków area.Six-factor model, varimax loading. Elements in parentheses ( ) indicate secondary loading values.
Factor 1 Factor 2 Factor 3 Factor 4 Factor 5 Factor 6
Nd 0.94
Ti 0.92
Sc 0.92
Ce 0.91
V 0.90
Mg 0.90
Fe 0.89
La 0.86
Cr 0.81
Co 0.81
Al 0.81
Ga 0.80
Y 0.79
Ni 0.77
Li 0.73
P 0.70
Yb 0.66
Th 0.65
Mn 0.64
Nb 0.59
Tl 0.40
————Sr –0.60
Si –0.90
S 0.80Bi 0.75Te 0.69Ag 0.69Cu 0.60As 0.52(LOI 0.48)
————Ba –0.61
K 0.46
————Sr –0.54Ca –0.66Na –0.70
Pb 0.85Cd 0.79Zn 0.69Sb 0.62(As 0.47)(Hg 0.47)(Mn 0.42)
LOI 0.58
————Cu –0.47Mo –0.63Be –0.66W –0.67
Hg 0.51Au 0.46
————K –0.61
Percent variability explained
39% 11% 8% 7% 4% 3%
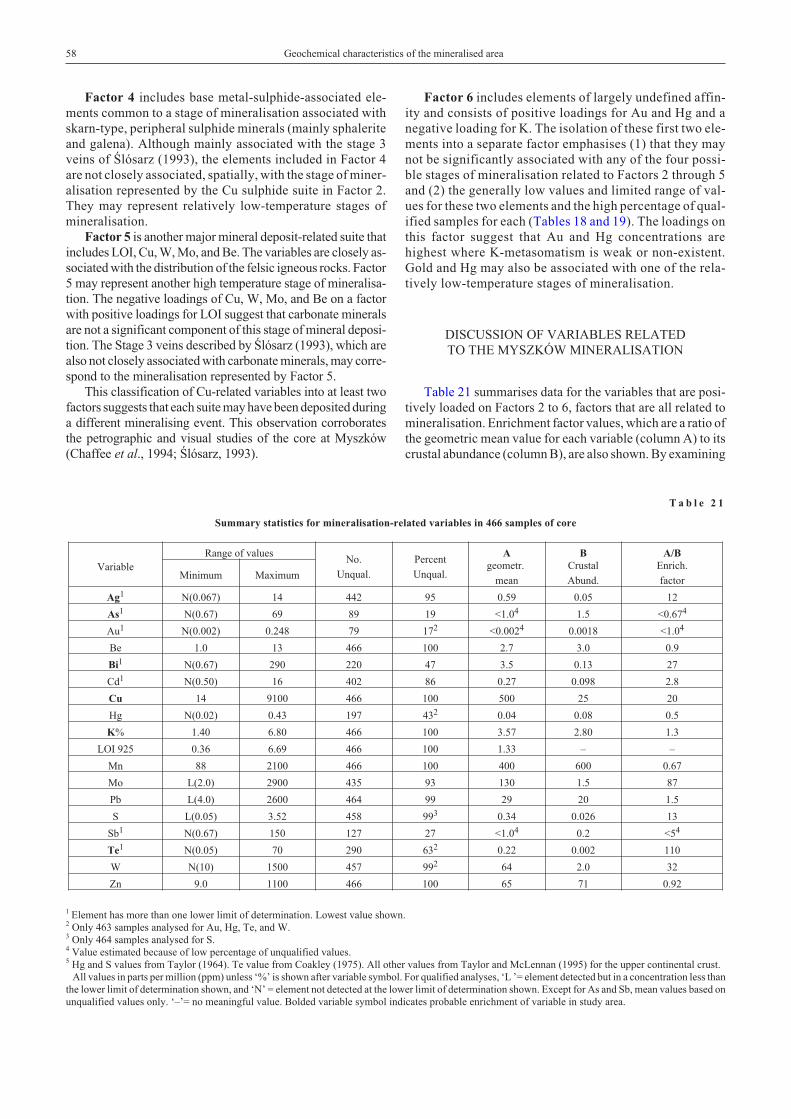
Factor 4 includes base metal-sulphide-associated ele-ments common to a stage of mineralisation associated withskarn-type, peripheral sulphide minerals (mainly sphaleriteand galena). Although mainly associated with the stage 3veins of Œlósarz (1993), the elements included in Factor 4are not closely associated, spatially, with the stage of miner-alisation represented by the Cu sulphide suite in Factor 2.They may represent relatively low-temperature stages ofmineralisation.
Factor 5 is another major mineral deposit-related suite thatincludes LOI, Cu, W, Mo, and Be. The variables are closely as-sociated with the distribution of the felsic igneous rocks. Factor5 may represent another high temperature stage of mineralisa-tion. The negative loadings of Cu, W, Mo, and Be on a factorwith positive loadings for LOI suggest that carbonate mineralsare not a significant component of this stage of mineral deposi-tion. The Stage 3 veins described by Œlósarz (1993), which arealso not closely associated with carbonate minerals, may corre-spond to the mineralisation represented by Factor 5.
This classification of Cu-related variables into at least twofactors suggests that each suite may have been deposited duringa different mineralising event. This observation corroboratesthe petrographic and visual studies of the core at Myszków(Chaffee et al., 1994; Œlósarz, 1993).
Factor 6 includes elements of largely undefined affin-ity and consists of positive loadings for Au and Hg and anegative loading for K. The isolation of these first two ele-ments into a separate factor emphasises (1) that they maynot be significantly associated with any of the four possi-ble stages of mineralisation related to Factors 2 through 5and (2) the generally low values and limited range of val-ues for these two elements and the high percentage of qual-ified samples for each (Tables 18 and 19). The loadings onthis factor suggest that Au and Hg concentrations arehighest where K-metasomatism is weak or non-existent.Gold and Hg may also be associated with one of the rela-tively low-temperature stages of mineralisation.
DISCUSSION OF VARIABLES RELATEDTO THE MYSZKÓW MINERALISATION
Table 21 summarises data for the variables that are posi-tively loaded on Factors 2 to 6, factors that are all related tomineralisation. Enrichment factor values, which are a ratio ofthe geometric mean value for each variable (column A) to itscrustal abundance (column B), are also shown. By examining
58 Geochemical characteristics of the mineralised area
T a b l e 2 1
Summary statistics for mineralisation-related variables in 466 samples of core
Variable
Range of valuesNo.
Unqual.
Percent
Unqual.
Ageometr.
mean
B
Crustal
Abund.
A/B
Enrich.
factorMinimum Maximum
Ag1 N(0.067) 14 442 95 0.59 0.05 12
As1 N(0.67) 69 89 19 <1.04 1.5 <0.674
Au1 N(0.002) 0.248 79 172 <0.0024 0.0018 <1.04
Be 1.0 13 466 100 2.7 3.0 0.9
Bi1 N(0.67) 290 220 47 3.5 0.13 27
Cd1 N(0.50) 16 402 86 0.27 0.098 2.8
Cu 14 9100 466 100 500 25 20
Hg N(0.02) 0.43 197 432 0.04 0.08 0.5
K% 1.40 6.80 466 100 3.57 2.80 1.3
LOI 925 0.36 6.69 466 100 1.33 – –
Mn 88 2100 466 100 400 600 0.67
Mo L(2.0) 2900 435 93 130 1.5 87
Pb L(4.0) 2600 464 99 29 20 1.5
S L(0.05) 3.52 458 993 0.34 0.026 13
Sb1 N(0.67) 150 127 27 <1.04 0.2 <54
Te1 N(0.05) 70 290 632 0.22 0.002 110
W N(10) 1500 457 992 64 2.0 32
Zn 9.0 1100 466 100 65 71 0.92
1 Element has more than one lower limit of determination. Lowest value shown.2 Only 463 samples analysed for Au, Hg, Te, and W.3 Only 464 samples analysed for S.4 Value estimated because of low percentage of unqualified values.5 Hg and S values from Taylor (1964). Te value from Coakley (1975). All other values from Taylor and McLennan (1995) for the upper continental crust.
All values in parts per million (ppm) unless ‘%’ is shown after variable symbol. For qualified analyses, ‘L ’= element detected but in a concentration less than
the lower limit of determination shown, and ‘N’ = element not detected at the lower limit of determination shown. Except for As and Sb, mean values based on
unqualified values only. ‘–’= no meaningful value. Bolded variable symbol indicates probable enrichment of variable in study area.
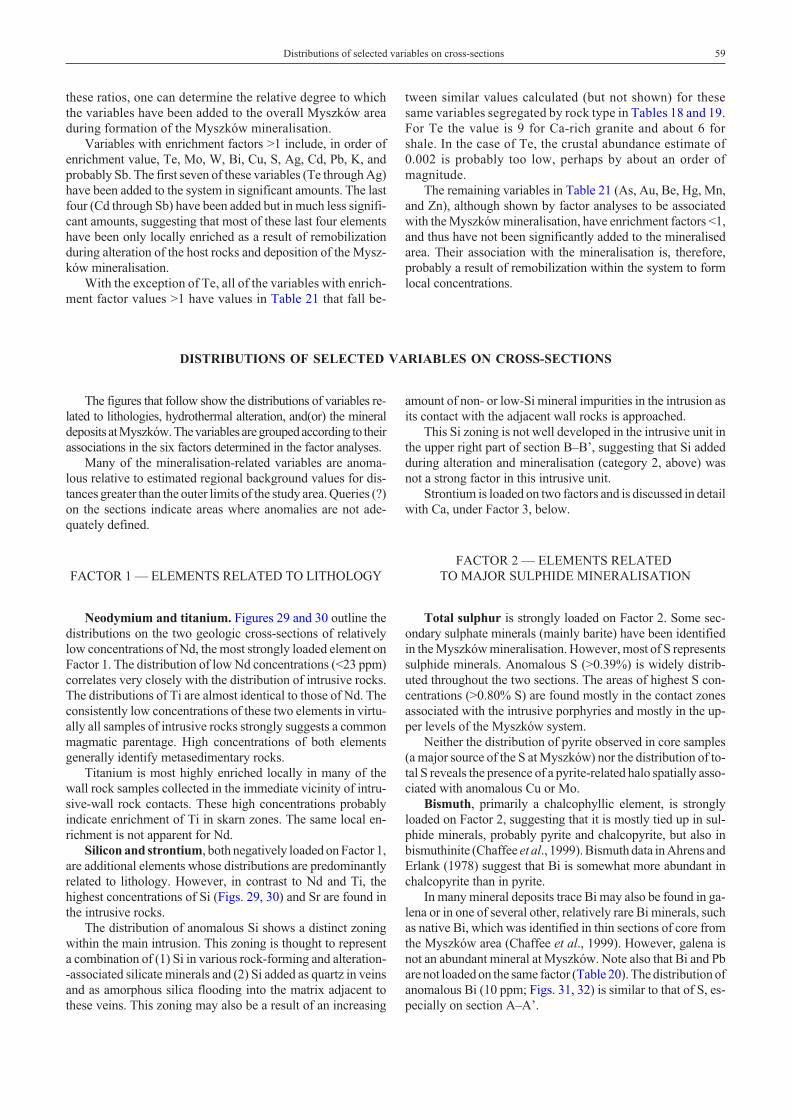
these ratios, one can determine the relative degree to whichthe variables have been added to the overall Myszków areaduring formation of the Myszków mineralisation.
Variables with enrichment factors >1 include, in order ofenrichment value, Te, Mo, W, Bi, Cu, S, Ag, Cd, Pb, K, andprobably Sb. The first seven of these variables (Te through Ag)have been added to the system in significant amounts. The lastfour (Cd through Sb) have been added but in much less signifi-cant amounts, suggesting that most of these last four elementshave been only locally enriched as a result of remobilizationduring alteration of the host rocks and deposition of the Mysz-ków mineralisation.
With the exception of Te, all of the variables with enrich-ment factor values >1 have values in Table 21 that fall be-
tween similar values calculated (but not shown) for thesesame variables segregated by rock type in Tables 18 and 19.For Te the value is 9 for Ca-rich granite and about 6 forshale. In the case of Te, the crustal abundance estimate of0.002 is probably too low, perhaps by about an order ofmagnitude.
The remaining variables in Table 21 (As, Au, Be, Hg, Mn,and Zn), although shown by factor analyses to be associatedwith the Myszków mineralisation, have enrichment factors <1,and thus have not been significantly added to the mineralisedarea. Their association with the mineralisation is, therefore,probably a result of remobilization within the system to formlocal concentrations.
DISTRIBUTIONS OF SELECTED VARIABLES ON CROSS-SECTIONS
The figures that follow show the distributions of variables re-lated to lithologies, hydrothermal alteration, and(or) the mineraldeposits atMyszków.Thevariablesaregroupedaccording to theirassociations in the six factors determined in the factor analyses.
Many of the mineralisation-related variables are anoma-lous relative to estimated regional background values for dis-tances greater than the outer limits of the study area. Queries (?)on the sections indicate areas where anomalies are not ade-quately defined.
FACTOR 1 — ELEMENTS RELATED TO LITHOLOGY
Neodymium and titanium. Figures 29 and 30 outline thedistributions on the two geologic cross-sections of relativelylow concentrations of Nd, the most strongly loaded element onFactor 1. The distribution of low Nd concentrations (<23 ppm)correlates very closely with the distribution of intrusive rocks.The distributions of Ti are almost identical to those of Nd. Theconsistently low concentrations of these two elements in virtu-ally all samples of intrusive rocks strongly suggests a commonmagmatic parentage. High concentrations of both elementsgenerally identify metasedimentary rocks.
Titanium is most highly enriched locally in many of thewall rock samples collected in the immediate vicinity of intru-sive-wall rock contacts. These high concentrations probablyindicate enrichment of Ti in skarn zones. The same local en-richment is not apparent for Nd.
Silicon and strontium, both negatively loaded on Factor 1,are additional elements whose distributions are predominantlyrelated to lithology. However, in contrast to Nd and Ti, thehighest concentrations of Si (Figs. 29, 30) and Sr are found inthe intrusive rocks.
The distribution of anomalous Si shows a distinct zoningwithin the main intrusion. This zoning is thought to representa combination of (1) Si in various rock-forming and alteration--associated silicate minerals and (2) Si added as quartz in veinsand as amorphous silica flooding into the matrix adjacent tothese veins. This zoning may also be a result of an increasing
amount of non- or low-Si mineral impurities in the intrusion asits contact with the adjacent wall rocks is approached.
This Si zoning is not well developed in the intrusive unit inthe upper right part of section B–B’, suggesting that Si addedduring alteration and mineralisation (category 2, above) wasnot a strong factor in this intrusive unit.
Strontium is loaded on two factors and is discussed in detailwith Ca, under Factor 3, below.
FACTOR 2 — ELEMENTS RELATEDTO MAJOR SULPHIDE MINERALISATION
Total sulphur is strongly loaded on Factor 2. Some sec-ondary sulphate minerals (mainly barite) have been identifiedin the Myszków mineralisation. However, most of S representssulphide minerals. Anomalous S (>0.39%) is widely distrib-uted throughout the two sections. The areas of highest S con-centrations (>0.80% S) are found mostly in the contact zonesassociated with the intrusive porphyries and mostly in the up-per levels of the Myszków system.
Neither the distribution of pyrite observed in core samples(a major source of the S at Myszków) nor the distribution of to-tal S reveals the presence of a pyrite-related halo spatially asso-ciated with anomalous Cu or Mo.
Bismuth, primarily a chalcophyllic element, is stronglyloaded on Factor 2, suggesting that it is mostly tied up in sul-phide minerals, probably pyrite and chalcopyrite, but also inbismuthinite (Chaffee et al., 1999). Bismuth data in Ahrens andErlank (1978) suggest that Bi is somewhat more abundant inchalcopyrite than in pyrite.
In many mineral deposits trace Bi may also be found in ga-lena or in one of several other, relatively rare Bi minerals, suchas native Bi, which was identified in thin sections of core fromthe Myszków area (Chaffee et al., 1999). However, galena isnot an abundant mineral at Myszków. Note also that Bi and Pbare not loaded on the same factor (Table 20). The distribution ofanomalous Bi (10 ppm; Figs. 31, 32) is similar to that of S, es-pecially on section A–A’.
Distributions of selected variables on cross-sections 59
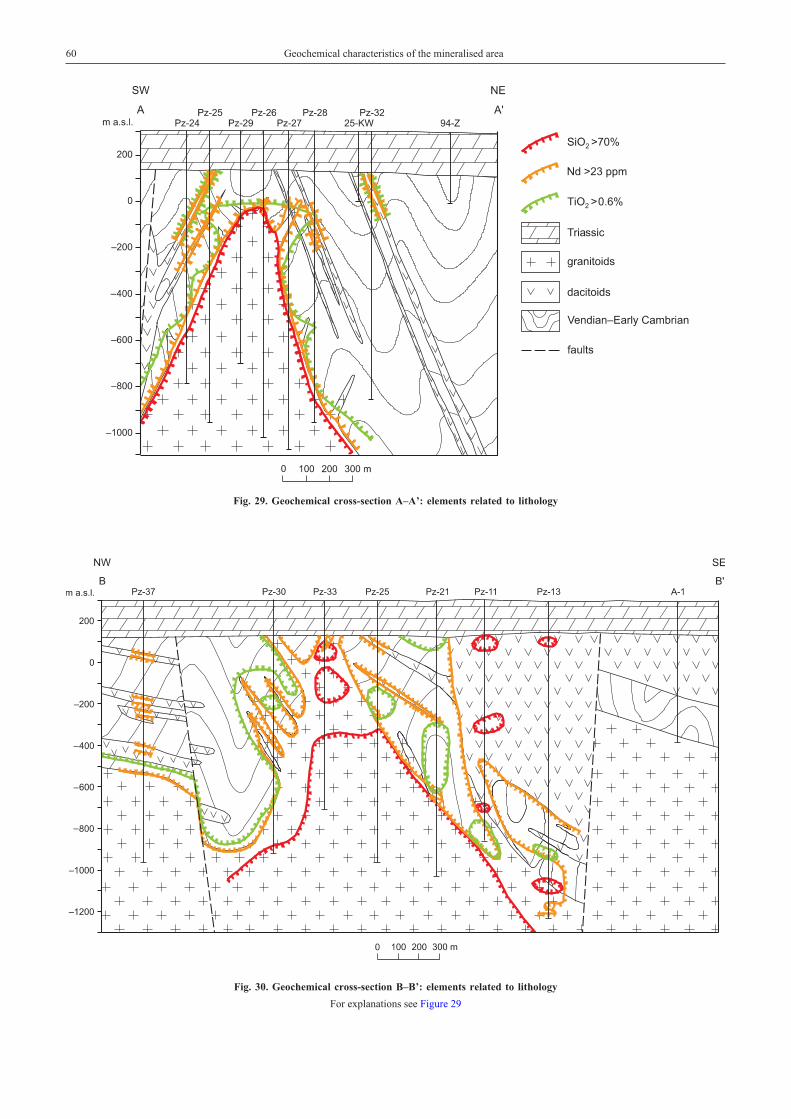
60 Geochemical characteristics of the mineralised area
Fig. 30. Geochemical cross-section B–B’: elements related to lithology
For explanations see Figure 29
Fig. 29. Geochemical cross-section A–A’: elements related to lithology
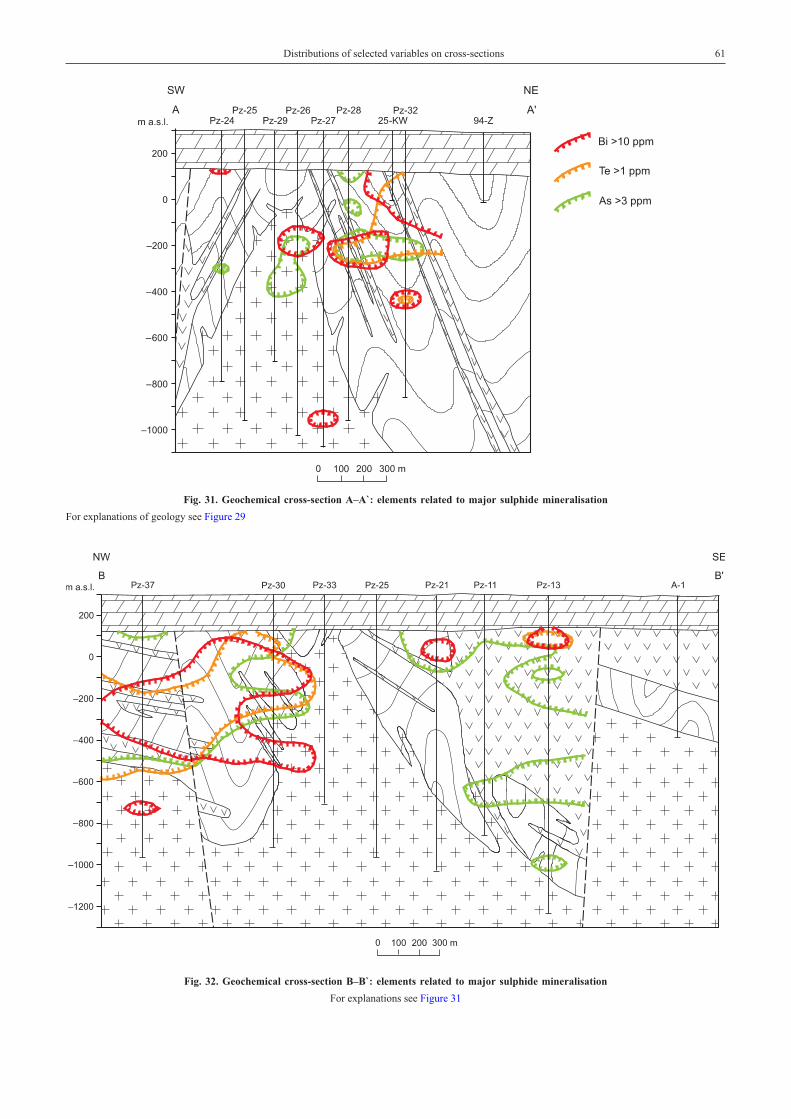
Distributions of selected variables on cross-sections 61
Fig. 31. Geochemical cross-section A–A`: elements related to major sulphide mineralisation
For explanations of geology see Figure 29
Fig. 32. Geochemical cross-section B–B`: elements related to major sulphide mineralisation
For explanations see Figure 31
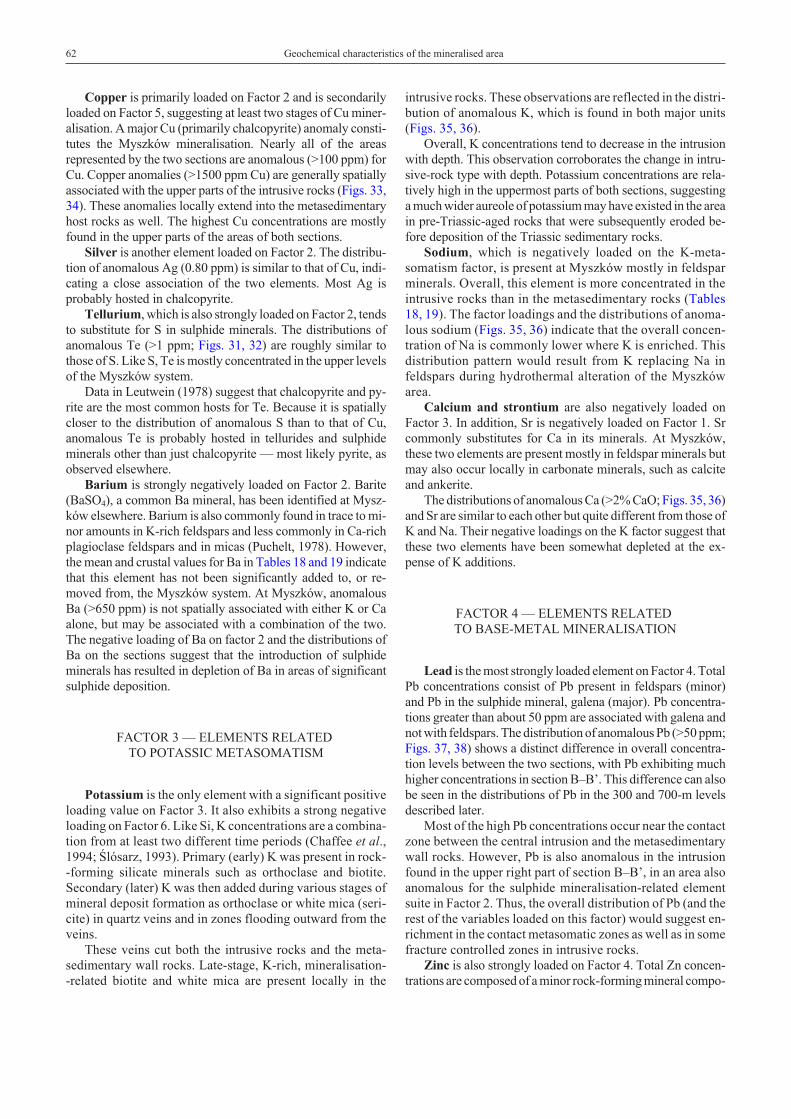
Copper is primarily loaded on Factor 2 and is secondarilyloaded on Factor 5, suggesting at least two stages of Cu miner-alisation. A major Cu (primarily chalcopyrite) anomaly consti-tutes the Myszków mineralisation. Nearly all of the areasrepresented by the two sections are anomalous (>100 ppm) forCu. Copper anomalies (>1500 ppm Cu) are generally spatiallyassociated with the upper parts of the intrusive rocks (Figs. 33,34). These anomalies locally extend into the metasedimentaryhost rocks as well. The highest Cu concentrations are mostlyfound in the upper parts of the areas of both sections.
Silver is another element loaded on Factor 2. The distribu-tion of anomalous Ag (0.80 ppm) is similar to that of Cu, indi-cating a close association of the two elements. Most Ag isprobably hosted in chalcopyrite.
Tellurium, which is also strongly loaded on Factor 2, tendsto substitute for S in sulphide minerals. The distributions ofanomalous Te (>1 ppm; Figs. 31, 32) are roughly similar tothose of S. Like S, Te is mostly concentrated in the upper levelsof the Myszków system.
Data in Leutwein (1978) suggest that chalcopyrite and py-rite are the most common hosts for Te. Because it is spatiallycloser to the distribution of anomalous S than to that of Cu,anomalous Te is probably hosted in tellurides and sulphideminerals other than just chalcopyrite — most likely pyrite, asobserved elsewhere.
Barium is strongly negatively loaded on Factor 2. Barite(BaSO4), a common Ba mineral, has been identified at Mysz-ków elsewhere. Barium is also commonly found in trace to mi-nor amounts in K-rich feldspars and less commonly in Ca-richplagioclase feldspars and in micas (Puchelt, 1978). However,the mean and crustal values for Ba in Tables 18 and 19 indicatethat this element has not been significantly added to, or re-moved from, the Myszków system. At Myszków, anomalousBa (>650 ppm) is not spatially associated with either K or Caalone, but may be associated with a combination of the two.The negative loading of Ba on factor 2 and the distributions ofBa on the sections suggest that the introduction of sulphideminerals has resulted in depletion of Ba in areas of significantsulphide deposition.
FACTOR 3 — ELEMENTS RELATEDTO POTASSIC METASOMATISM
Potassium is the only element with a significant positiveloading value on Factor 3. It also exhibits a strong negativeloading on Factor 6. Like Si, K concentrations are a combina-tion from at least two different time periods (Chaffee et al.,1994; Œlósarz, 1993). Primary (early) K was present in rock--forming silicate minerals such as orthoclase and biotite.Secondary (later) K was then added during various stages ofmineral deposit formation as orthoclase or white mica (seri-cite) in quartz veins and in zones flooding outward from theveins.
These veins cut both the intrusive rocks and the meta-sedimentary wall rocks. Late-stage, K-rich, mineralisation--related biotite and white mica are present locally in the
intrusive rocks. These observations are reflected in the distri-bution of anomalous K, which is found in both major units(Figs. 35, 36).
Overall, K concentrations tend to decrease in the intrusionwith depth. This observation corroborates the change in intru-sive-rock type with depth. Potassium concentrations are rela-tively high in the uppermost parts of both sections, suggestinga much wider aureole of potassium may have existed in the areain pre-Triassic-aged rocks that were subsequently eroded be-fore deposition of the Triassic sedimentary rocks.
Sodium, which is negatively loaded on the K-meta-somatism factor, is present at Myszków mostly in feldsparminerals. Overall, this element is more concentrated in theintrusive rocks than in the metasedimentary rocks (Tables18, 19). The factor loadings and the distributions of anoma-lous sodium (Figs. 35, 36) indicate that the overall concen-tration of Na is commonly lower where K is enriched. Thisdistribution pattern would result from K replacing Na infeldspars during hydrothermal alteration of the Myszkówarea.
Calcium and strontium are also negatively loaded onFactor 3. In addition, Sr is negatively loaded on Factor 1. Srcommonly substitutes for Ca in its minerals. At Myszków,these two elements are present mostly in feldspar minerals butmay also occur locally in carbonate minerals, such as calciteand ankerite.
The distributions of anomalous Ca (>2% CaO; Figs. 35, 36)and Sr are similar to each other but quite different from those ofK and Na. Their negative loadings on the K factor suggest thatthese two elements have been somewhat depleted at the ex-pense of K additions.
FACTOR 4 — ELEMENTS RELATEDTO BASE-METAL MINERALISATION
Lead is the most strongly loaded element on Factor 4. TotalPb concentrations consist of Pb present in feldspars (minor)and Pb in the sulphide mineral, galena (major). Pb concentra-tions greater than about 50 ppm are associated with galena andnot with feldspars. The distribution of anomalous Pb (>50 ppm;Figs. 37, 38) shows a distinct difference in overall concentra-tion levels between the two sections, with Pb exhibiting muchhigher concentrations in section B–B’. This difference can alsobe seen in the distributions of Pb in the 300 and 700-m levelsdescribed later.
Most of the high Pb concentrations occur near the contactzone between the central intrusion and the metasedimentarywall rocks. However, Pb is also anomalous in the intrusionfound in the upper right part of section B–B’, in an area alsoanomalous for the sulphide mineralisation-related elementsuite in Factor 2. Thus, the overall distribution of Pb (and therest of the variables loaded on this factor) would suggest en-richment in the contact metasomatic zones as well as in somefracture controlled zones in intrusive rocks.
Zinc is also strongly loaded on Factor 4. Total Zn concen-trations are composed of a minor rock-forming mineral compo-
62 Geochemical characteristics of the mineralised area
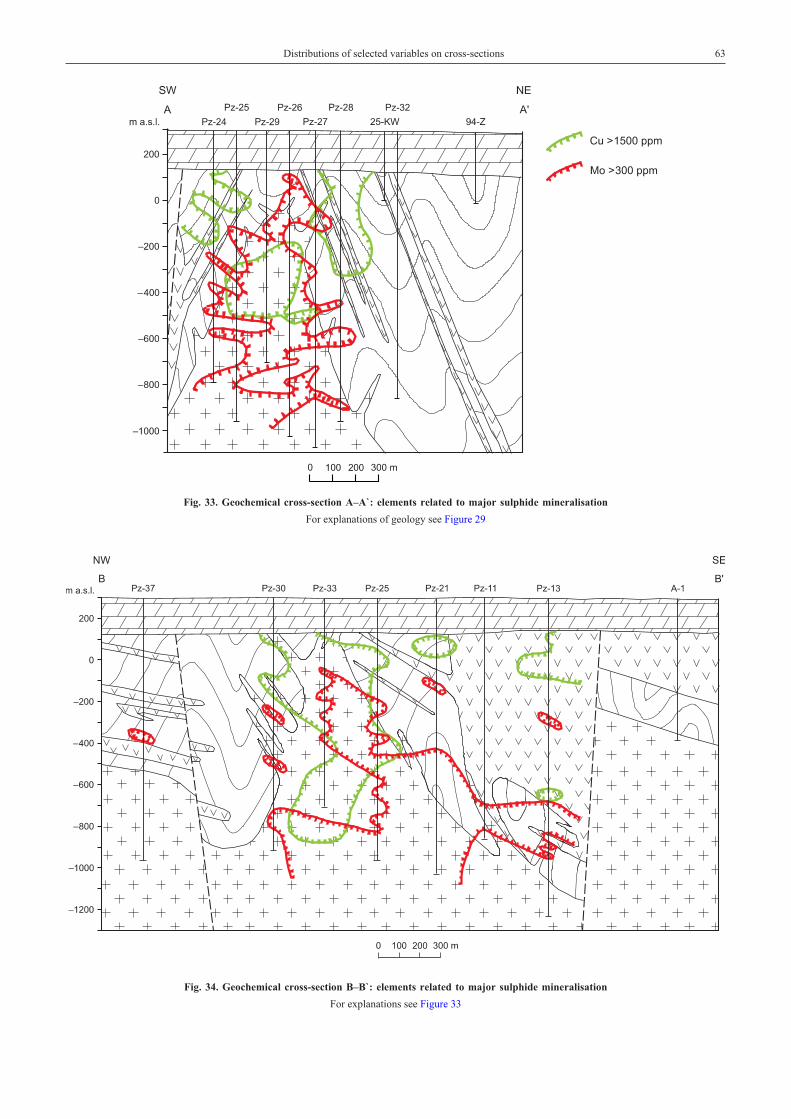
Distributions of selected variables on cross-sections 63
Fig. 33. Geochemical cross-section A–A`: elements related to major sulphide mineralisation
For explanations of geology see Figure 29
Fig. 34. Geochemical cross-section B–B`: elements related to major sulphide mineralisation
For explanations see Figure 33
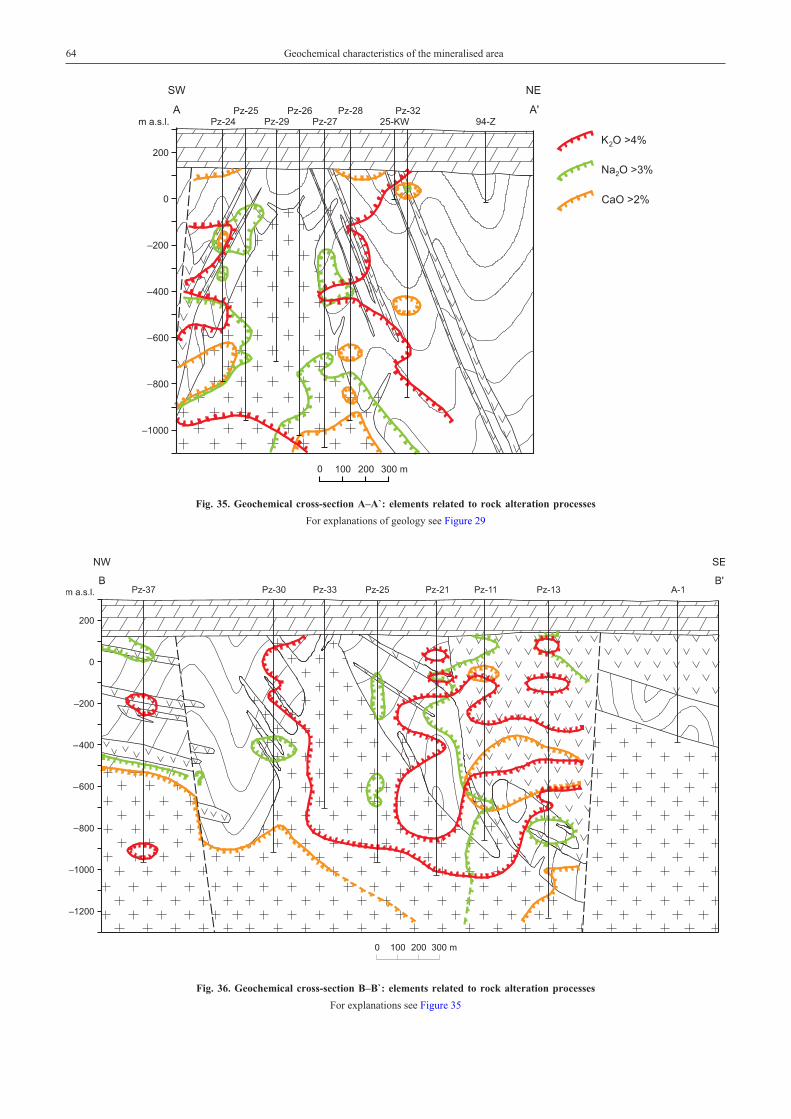
64 Geochemical characteristics of the mineralised area
Fig. 35. Geochemical cross-section A–A`: elements related to rock alteration processes
For explanations of geology see Figure 29
Fig. 36. Geochemical cross-section B–B`: elements related to rock alteration processes
For explanations see Figure 35
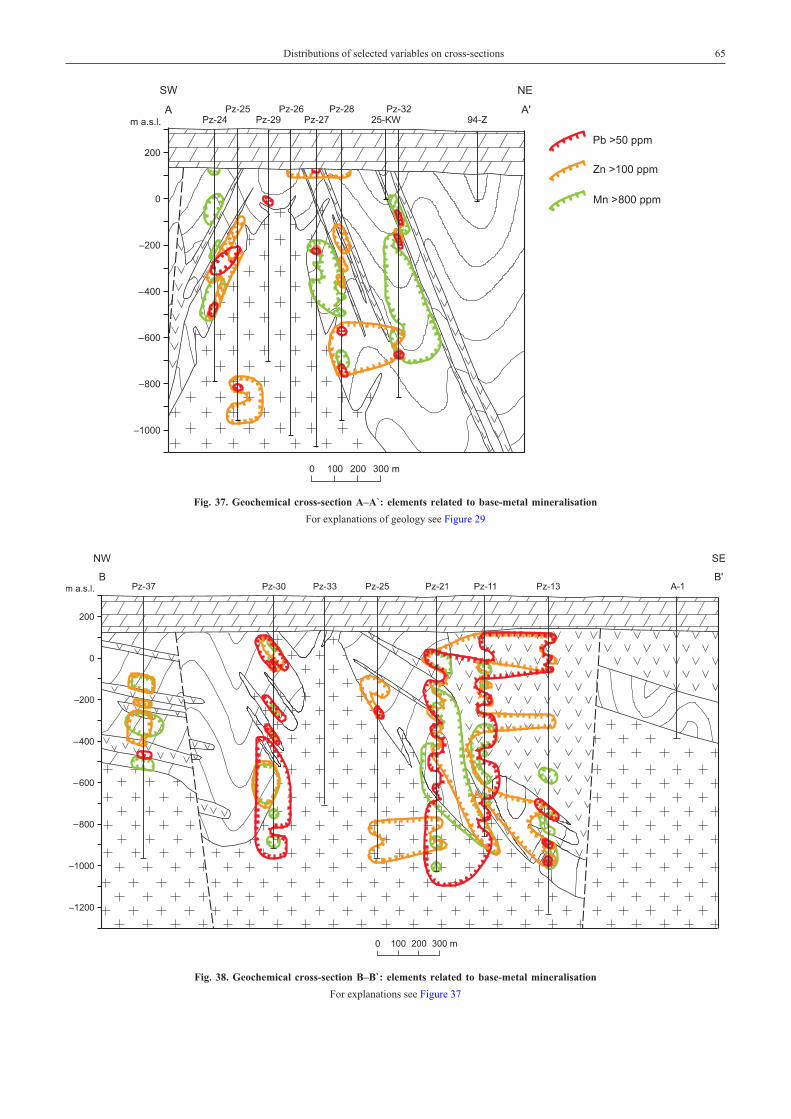
Distributions of selected variables on cross-sections 65
Fig. 37. Geochemical cross-section A–A`: elements related to base-metal mineralisation
For explanations of geology see Figure 29
Fig. 38. Geochemical cross-section B–B`: elements related to base-metal mineralisation
For explanations see Figure 37
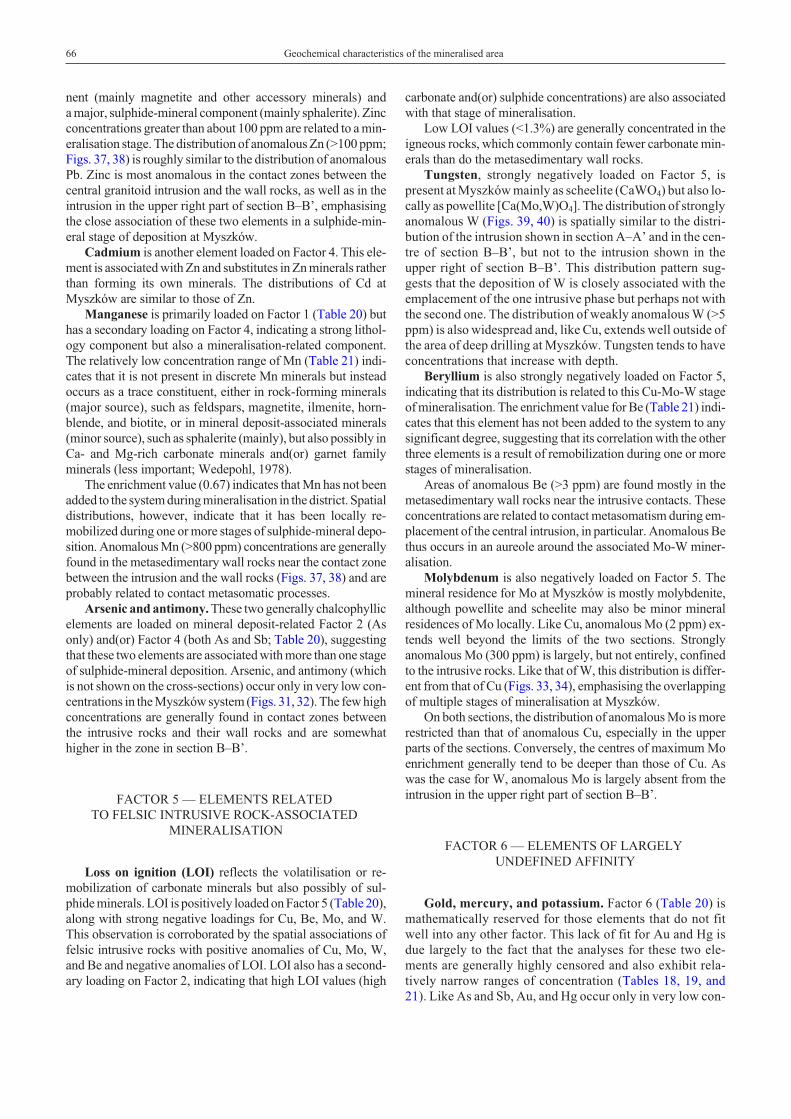
nent (mainly magnetite and other accessory minerals) anda major, sulphide-mineral component (mainly sphalerite). Zincconcentrations greater than about 100 ppm are related to a min-eralisation stage. The distribution of anomalous Zn (>100 ppm;Figs. 37, 38) is roughly similar to the distribution of anomalousPb. Zinc is most anomalous in the contact zones between thecentral granitoid intrusion and the wall rocks, as well as in theintrusion in the upper right part of section B–B’, emphasisingthe close association of these two elements in a sulphide-min-eral stage of deposition at Myszków.
Cadmium is another element loaded on Factor 4. This ele-ment is associated with Zn and substitutes in Zn minerals ratherthan forming its own minerals. The distributions of Cd atMyszków are similar to those of Zn.
Manganese is primarily loaded on Factor 1 (Table 20) buthas a secondary loading on Factor 4, indicating a strong lithol-ogy component but also a mineralisation-related component.The relatively low concentration range of Mn (Table 21) indi-cates that it is not present in discrete Mn minerals but insteadoccurs as a trace constituent, either in rock-forming minerals(major source), such as feldspars, magnetite, ilmenite, horn-blende, and biotite, or in mineral deposit-associated minerals(minor source), such as sphalerite (mainly), but also possibly inCa- and Mg-rich carbonate minerals and(or) garnet familyminerals (less important; Wedepohl, 1978).
The enrichment value (0.67) indicates that Mn has not beenadded to the system during mineralisation in the district. Spatialdistributions, however, indicate that it has been locally re-mobilized during one or more stages of sulphide-mineral depo-sition. Anomalous Mn (>800 ppm) concentrations are generallyfound in the metasedimentary wall rocks near the contact zonebetween the intrusion and the wall rocks (Figs. 37, 38) and areprobably related to contact metasomatic processes.
Arsenic and antimony. These two generally chalcophyllicelements are loaded on mineral deposit-related Factor 2 (Asonly) and(or) Factor 4 (both As and Sb; Table 20), suggestingthat these two elements are associated with more than one stageof sulphide-mineral deposition. Arsenic, and antimony (whichis not shown on the cross-sections) occur only in very low con-centrations in the Myszków system (Figs. 31, 32). The few highconcentrations are generally found in contact zones betweenthe intrusive rocks and their wall rocks and are somewhathigher in the zone in section B–B’.
FACTOR 5 — ELEMENTS RELATEDTO FELSIC INTRUSIVE ROCK-ASSOCIATED
MINERALISATION
Loss on ignition (LOI) reflects the volatilisation or re-mobilization of carbonate minerals but also possibly of sul-phide minerals. LOI is positively loaded on Factor 5 (Table 20),along with strong negative loadings for Cu, Be, Mo, and W.This observation is corroborated by the spatial associations offelsic intrusive rocks with positive anomalies of Cu, Mo, W,and Be and negative anomalies of LOI. LOI also has a second-ary loading on Factor 2, indicating that high LOI values (high
carbonate and(or) sulphide concentrations) are also associatedwith that stage of mineralisation.
Low LOI values (<1.3%) are generally concentrated in theigneous rocks, which commonly contain fewer carbonate min-erals than do the metasedimentary wall rocks.
Tungsten, strongly negatively loaded on Factor 5, ispresent at Myszków mainly as scheelite (CaWO4) but also lo-cally as powellite [Ca(Mo,W)O4]. The distribution of stronglyanomalous W (Figs. 39, 40) is spatially similar to the distri-bution of the intrusion shown in section A–A’ and in the cen-tre of section B–B’, but not to the intrusion shown in theupper right of section B–B’. This distribution pattern sug-gests that the deposition of W is closely associated with theemplacement of the one intrusive phase but perhaps not withthe second one. The distribution of weakly anomalous W (>5ppm) is also widespread and, like Cu, extends well outside ofthe area of deep drilling at Myszków. Tungsten tends to haveconcentrations that increase with depth.
Beryllium is also strongly negatively loaded on Factor 5,indicating that its distribution is related to this Cu-Mo-W stageof mineralisation. The enrichment value for Be (Table 21) indi-cates that this element has not been added to the system to anysignificant degree, suggesting that its correlation with the otherthree elements is a result of remobilization during one or morestages of mineralisation.
Areas of anomalous Be (>3 ppm) are found mostly in themetasedimentary wall rocks near the intrusive contacts. Theseconcentrations are related to contact metasomatism during em-placement of the central intrusion, in particular. Anomalous Bethus occurs in an aureole around the associated Mo-W miner-alisation.
Molybdenum is also negatively loaded on Factor 5. Themineral residence for Mo at Myszków is mostly molybdenite,although powellite and scheelite may also be minor mineralresidences of Mo locally. Like Cu, anomalous Mo (2 ppm) ex-tends well beyond the limits of the two sections. Stronglyanomalous Mo (300 ppm) is largely, but not entirely, confinedto the intrusive rocks. Like that of W, this distribution is differ-ent from that of Cu (Figs. 33, 34), emphasising the overlappingof multiple stages of mineralisation at Myszków.
On both sections, the distribution of anomalous Mo is morerestricted than that of anomalous Cu, especially in the upperparts of the sections. Conversely, the centres of maximum Moenrichment generally tend to be deeper than those of Cu. Aswas the case for W, anomalous Mo is largely absent from theintrusion in the upper right part of section B–B’.
FACTOR 6 — ELEMENTS OF LARGELYUNDEFINED AFFINITY
Gold, mercury, and potassium. Factor 6 (Table 20) ismathematically reserved for those elements that do not fitwell into any other factor. This lack of fit for Au and Hg isdue largely to the fact that the analyses for these two ele-ments are generally highly censored and also exhibit rela-tively narrow ranges of concentration (Tables 18, 19, and21). Like As and Sb, Au, and Hg occur only in very low con-
66 Geochemical characteristics of the mineralised area
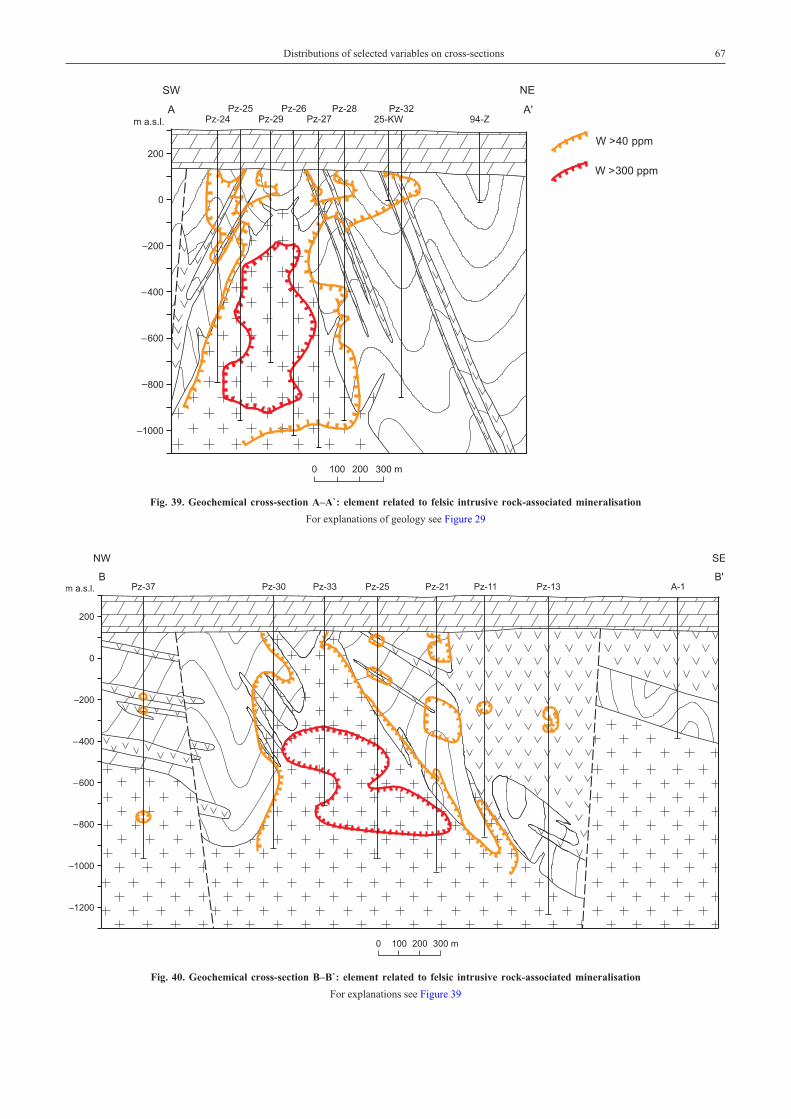
Distributions of selected variables on cross-sections 67
Fig. 39. Geochemical cross-section A–A`: element related to felsic intrusive rock-associated mineralisation
For explanations of geology see Figure 29
Fig. 40. Geochemical cross-section B–B`: element related to felsic intrusive rock-associated mineralisation
For explanations see Figure 39
centrations in the Myszków system. The few high concen-trations are generally found scattered in contact zonesbetween the intrusive rocks and their wall rocks and are rela-tively higher in section B–B’.
The assignment of K (previously discussed above underFactor 3) to this factor is not well understood, but suggests thatanomalous Au and Hg are most likely to occur where K is leastenriched.
DISTRIBUTION OF SELECTED VARIABLES ON THE 300-M AND 700-M LEVELS
A previous study of the Myszków area (Œlósarz, 1985) sug-gested that the Myszków mineralisation, in plan view, showsa Mo-rich core surrounded by a Cu- and Mo-rich zone, with Pband Zn locally concentrated in the periphery. Because this zon-ing was described as occurring mostly outside of the areashown on the two sections, the distributions of selected ele-ments were examined over a wider area and on two levels — atdepths below the surface of 300 and 700 m.
Neodymium and titanium. The distributions of relativelylow concentrations of Nd (<0.23 ppm) have a close spatial cor-relation with the intrusive rocks. The distributions of Ti showsimilar patterns to those of Nd.
Silicon. On both levels, anomalous Si (>32.3%) displaysa strong NW–SE linear anomaly that is not entirely controlledby lithology. This anomaly represents the addition of quartzand other silicate minerals to the system as a result of hydro-thermal alteration and sulphide mineralisation. Zoning of Siconcentrations can be seen on both levels, with the highest con-centrations centred near the intersection of the two cross-sec-tions at the 700-m level (Pz-25) and centred a few hundredmeters farther to the north-west on the 300-m level.
Copper. On both levels anomalous Cu (>200 ppm) is wide-spread, not well defined, and probably extends well outside ofthe area of drilling. Copper anomalies are not spatially relatedto lithology.
Molybdenum shows widespread anomalies (>40 ppm),especially at the 700-m level. Overall levels of Mo are higher atthe 700-m level than at the 300-m level, emphasising its in-crease in concentration with depth. A NE–SW linear anomalypattern is evident, particularly on the 300-m level. Areas ofweakly anomalous Mo (>2 ppm) probably extend well beyondthe area of drilling, particularly at depth.
Tungsten. Unlike the distributions of W seen on the sec-tions (Figs. 42, 43), the distributions of strongly anomalous W(>20 ppm) on the two levels do not seem to be spatially relatedto intrusive rock. Like Mo, the W anomaly on the 300-m levelseems to be linear. The main anomaly on the 700-m level ismore circular in pattern, with the highest concentrations inboreholes Pz-26, Pz-27, and Pz-29. Like Mo, the overall levelsof W concentrations are also relatively higher at 700 m,emphasising a general increase of this element with depth. LikeCu and Mo, weak W anomalies (>5 ppm) extend beyond thearea of drilling.
Sulphur at Myszków is largely the sum of S in pyrite, chal-copyrite and molybdenite. Sulphur anomalies (>0.40% S) arewidespread on both levels and extend beyond the limits of deep
drilling, particularly on the 300-m level. Anomalies extend moreto the north-west on the 700-m level. On the 300-m level the dis-tribution suggests a possible halo around a central linear low.
Silver. Anomalous Ag (>0.80 ppm) shows distributionssimilar to those of Cu and S, but the anomalies are not as pro-nounced. The linear low seen for S on the 300-m level is alsopresent for Ag. The spatial correlation of Ag with both Cu and Son the plans and sections emphasises that Ag is present atMyszków in trace amounts in sulphide minerals, principally inchalcopyrite but probably also in pyrite and sulphosalts.
Tellurium. Anomalous Te (>0.15 ppm) shows distribu-tions similar to those of S, Cu, and Ag. A well-defined linearlow is present at 300 m surrounded by a large, undefined area ofenrichment. A more restricted Te anomaly is present at the700-m level. Weak Te anomalies (>0.05 ppm) probably extendwell beyond the area of drilling, particularly in the upper levelsof the Myszków mineralisation.
Lead concentrations >50 ppm are related to mineralisationprocesses and not to lithology. On both levels, Pb anomalies arevery restricted and do not closely match those of the other, ma-jor sulphide-related elements, such as Cu and Mo. Lead valuesare generally higher at the 300-m level than at the 700-m level,emphasising that this element is more concentrated in the upperlevels of the system.
Zinc and cadmium. Anomalous Zn (>100 ppm) and Cd(>0.2 ppm), like Pb, are generally more concentrated at the300-m level and exhibit only scattered anomalies related tomineralisation. Concentrations of Zn and Cd are somewhathigher to the south-east on both levels, a pattern similar to thatseen for lead.
Potassium. The distribution of anomalous K (>3.5%) onthe two levels is not strongly controlled by lithology. Anoma-lous concentrations are more widespread on the 300-m levelthan on the 700-m level, indicating a greater addition of this el-ement to the upper levels of the system. The overall relative dif-ference in concentration levels of K with depth in the Myszkówsystem reflects the presence of granodiorite as the dominantpre-mineralisation rock type at depth and granite as the domi-nant post-K-metasomatism rock type higher in the system.The K anomalies are open-ended to the south-west, particu-larly on the 300-m level, and may represent an extension ofK-metasomatism and possibly Cu-Mo mineralisation.
Loss on ignition. Low values for this variable (<1.2%) arefound in both rock units and indicate sites with samples low involatiles. This variable also shows a good NW–SE linearanomaly on both levels.
68 Geochemical characteristics of the mineralised area
GEOCHEMICAL PATTERNS AND PATH-FINDERS OF THE MYSZKÓW MINERALISATION
For the purpose of economic evaluation, three geochemicalzones have been distinguished in the mineralised Myszkówarea: (1) a central (core) ore deposit zone, (2) an intermediateore deposit zone (intermediate zone), and (3) a peripheral zone(Fig. 41). The core zone is defined by the presence of mineral-ised rocks with minimum thicknesses of 10 m and by minimumconcentrations of Mo and W of 500 ppm. This zone extendsoutward for 300 m from the location of borehole Pz-29. The in-termediate zone extends between 300 m and 700 m from thecentre of mineralisation, and the peripheral zone is located be-yond 700 m from the centre of mineralisation.
Most of the significant ore related elements are found in allthree zones but in varying amounts. The most important ore el-ements: Cu, Mo, and W, are found in all three zones as are Sand K. These 5 elements form widespread, distinct geochemi-cal anomalies over most, or all, of the entire area studied. Areasshowing strong anomalies of these elements are shown onFig. 41 in order to emphasise the differences between the threemineralised zones.
Copper concentrations are everywhere greater than theClarke value for Cu, which means that the copper anomalyprobably extends well beyond the drilled area. Molybdenumanomalies (>10 ppm) are also observed over the entire areastudied, except near the area of borehole Pz-32. The continuousW anomaly is very closely associated spatially with thegranitoid body and the intermediately surrounding area. How-ever, anomalous zones and isolated sample points with concen-trations of W >10 ppm are present in all of the boreholes thatwere sampled for this study.
Potassium and Ag that co-exists with copper are also char-acteristic of the core zone. However, anomalous Ag is found inall three zones. Small amounts of Bi and As have also been de-tected in the core zone. These traces are probably in inclusionsin chalcopyrite. Silica, which is a good indicator of stockworkveining, is also anomalous in this zone.
Four main alteration zones: potassic, propylitic, argillic,and phyllic, are described in the classic model of hydrothermalalterations zoning in the rocks of porphyry deposits (Lowelland Guilbert, 1970). These four zones are also present atMyszków.
In the mineralised area of Myszków, propylitic, argillic,and phyllic alteration zones are only present locally in coresfrom boreholes drilled outside the core zone. Potassic alter-ation, characterised by presence of orthoclase, and more rarely,biotite, predominate in the core zone and parts of the intermedi-ate zone at Myszków. Minerals associated with the potassic al-teration zone are found mainly in quartz veins and along theirselvages. Locally, potassium minerals flood the matrix aroundveins systems. Potassic alterations is found in the upper part ofthe granitoid intrusive, in a substantial part of the dacitoids, andlocally, also in the metasedimentary host rocks.
The highest K concentrations (>4% K2O) decrease withdepth below 1300 m. This decrease reflects the graduallithological change of the intrusion, which is a granodiorite at
depth that is altered to granitoid at higher elevations. The high-est K concentrations are found within a 480 m radius from thecentre of mineralisation. It may continue in a southerly direc-tion beyond the area of drilling.
Anomalous concentrations of Cu, Mo, and W, are closelyrelated to the core zone. The lack of any significant spatial cor-relation between K and these three elements suggests, how-ever, that K-metasomatism and the main mineralisation stagemay have occurred at different times. A significant Tl anomalyidentified in the core zone, is also associated with K, though,this element characteristic for the core zone is also associatedwith K; however, Tl is most characteristic of the intermediatezone, at the outer margin of the K-alteration zone.
The maximum content of silica is also found in the corezone. The distribution of this element partly reflects changesin lithology. The highest concentrations of silica (>68%SiO2) are found in the granitoid intrusion in areas where thereis a high density of quartz veins. The strong statistical corre-lation of silica with elements associated with altered rocks(mainly Sr and Ca, but to lesser degree, Ba and Na) suggeststhat silica was remobilized during the period of K-meta-somatism.
The core zone is also characterised by negative anomaliesof Ca, Na, and to some extent, Ba and Mn, all elementsclosely associated with rock alteration. Strontium is distrib-uted differently. Negative anomalies for Sr are found at thecontacts of the metasedimentary rocks with the granitoid in-trusion. In the central part of the intrusion, Sr is found inClarke concentrations.
These five elements were leached from the core zone dur-ing feldspar metasomatism, which resulted in plagioclase be-ing replaced by orthoclase. Weak, positive Ca, Na, Ba, and Sranomalies are found in the intermediate and peripheral zones.Weak Mn anomalies are also found in the transition areas be-tween the core zone and the intermediate zone.
The outer fringes of the anomalies for Mo and W, and partlythat of Cu, also contain anomalies of Be and F. Isolated anoma-lous Be concentrations of as much as 16.5 ppm can be observedin the metasedimentary rocks near where they are in contactwith the intrusion. The F anomaly (>0.1%) is much larger thanthat of Be and extends outward to the middle of the intermedi-ate zone. In contrast, the central part of the granitoid intrusioncontains only Clarke amounts of Be and F. The central parts ofthe intermediate zone contain anomalies of Au, Hg, and Sb, andlocally also Cu, and Ag, Ca, Na, and Sr.
Gold anomalies in the intermediate zone are weak. Isolatedsites with higher Au concentrations (10–40 ppb, maximum 248ppb) are found along contacts between the granitoid and por-phyry dikes, to a distance of about 300–550 m from centre ofthe Mo-W mineralisation.
Most of the samples analysed for Hg also contain onlybackground levels. Anomalous Hg (100–300 ppb, maximum430 ppb) is found along contacts of the magmatic rocks withthe wall rocks, mostly about 300–700 m from the centre of
Geochemical patterns and path-finders of the Myszków mineralisation 69
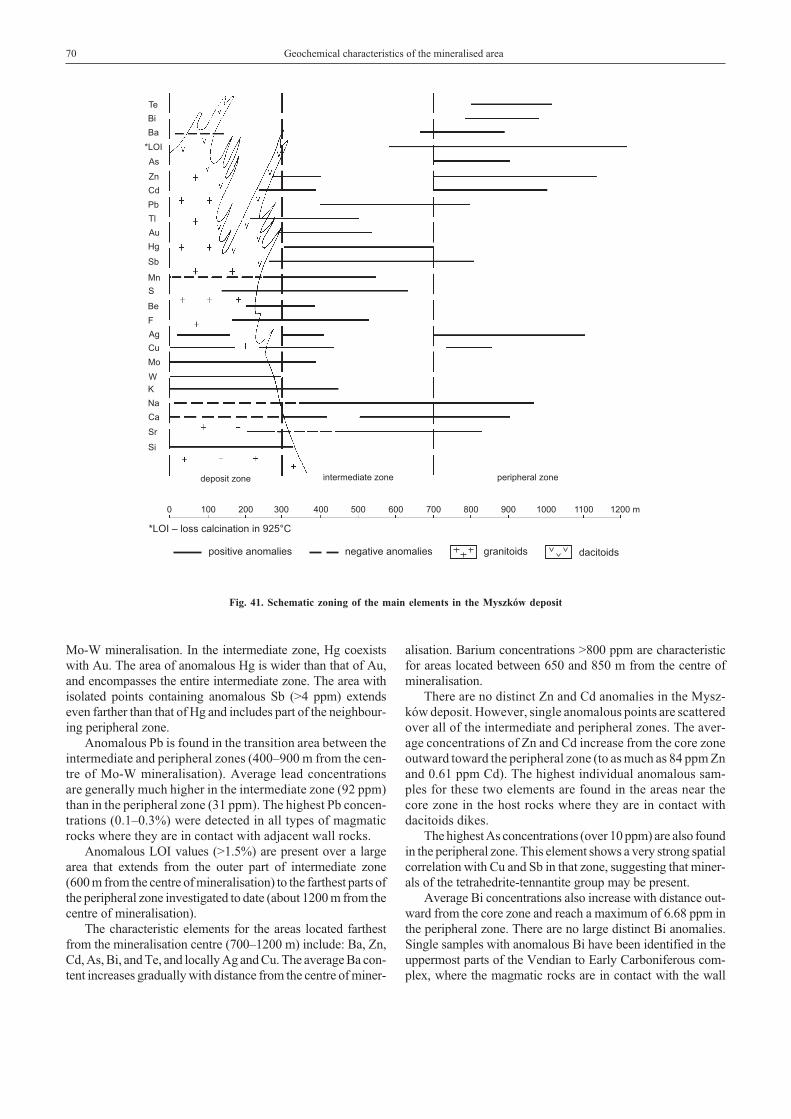
Mo-W mineralisation. In the intermediate zone, Hg coexistswith Au. The area of anomalous Hg is wider than that of Au,and encompasses the entire intermediate zone. The area withisolated points containing anomalous Sb (>4 ppm) extendseven farther than that of Hg and includes part of the neighbour-ing peripheral zone.
Anomalous Pb is found in the transition area between theintermediate and peripheral zones (400–900 m from the cen-tre of Mo-W mineralisation). Average lead concentrationsare generally much higher in the intermediate zone (92 ppm)than in the peripheral zone (31 ppm). The highest Pb concen-trations (0.1–0.3%) were detected in all types of magmaticrocks where they are in contact with adjacent wall rocks.
Anomalous LOI values (>1.5%) are present over a largearea that extends from the outer part of intermediate zone(600 m from the centre of mineralisation) to the farthest parts ofthe peripheral zone investigated to date (about 1200 m from thecentre of mineralisation).
The characteristic elements for the areas located farthestfrom the mineralisation centre (700–1200 m) include: Ba, Zn,Cd, As, Bi, and Te, and locally Ag and Cu. The average Ba con-tent increases gradually with distance from the centre of miner-
alisation. Barium concentrations >800 ppm are characteristicfor areas located between 650 and 850 m from the centre ofmineralisation.
There are no distinct Zn and Cd anomalies in the Mysz-ków deposit. However, single anomalous points are scatteredover all of the intermediate and peripheral zones. The aver-age concentrations of Zn and Cd increase from the core zoneoutward toward the peripheral zone (to as much as 84 ppm Znand 0.61 ppm Cd). The highest individual anomalous sam-ples for these two elements are found in the areas near thecore zone in the host rocks where they are in contact withdacitoids dikes.
The highest As concentrations (over 10 ppm) are also foundin the peripheral zone. This element shows a very strong spatialcorrelation with Cu and Sb in that zone, suggesting that miner-als of the tetrahedrite-tennantite group may be present.
Average Bi concentrations also increase with distance out-ward from the core zone and reach a maximum of 6.68 ppm inthe peripheral zone. There are no large distinct Bi anomalies.Single samples with anomalous Bi have been identified in theuppermost parts of the Vendian to Early Carboniferous com-plex, where the magmatic rocks are in contact with the wall
70 Geochemical characteristics of the mineralised area
Fig. 41. Schematic zoning of the main elements in the Myszków deposit
rocks. The highest Bi concentrations (as much as 290 ppm)were found in an area about 750 to 950 m from the centre ofMo-W mineralisation.
Tellurium is another characteristic element of the periph-eral zone. Like Bi, average concentrations of Te increase out-ward and reach their maximum in the peripheral zone. Thehighest Te concentrations are found in the uppermost partsof the Vendian to Early Carboniferous rocks in the dacitoiddikes where they are in contact with the metasedimentaryrocks. The common distributions of Te and Bi suggests thatminerals such as tetradymite or tellurobismuthite may bepresent. The coincidence of Te and Ag suggests the pres-ence of hessite. The highest Te concentrations (as much as700 ppm) are found in the peripheral parts of the area inves-tigated, about 800–1050 m from the centre of Mo-W min-eralisation.
Strong Cu and Ag anomalies are present in all threezones. In the peripheral zone, which has the lowest averageCu content, Ag concentrations are at their highest (1 ppm). Inthis zone, both elements behave differently than they do inthe other two zones where they show a positive spatial corre-lation with elements of the low-temperature mineralisationstage, especially with As and Sb, a phenomenon not seen inother zones. These observations suggest that some of theseelements may also be associated with the low temperaturemineralisation process, and that they may occur in mineralssuch as tennantite-tetrahedrite and hessite, as well as in Agsulphotellurides. These minerals are typical of the peripheralzones of the porphyry mineralisation.
Geochemical investigations of mineralisation in the Mysz-ków area suggest that the path-finder elements, listed in de-creasing order of importance, may be used in the search forconcealed porphyry mineralisation: W, Mo, Cu (Ag), K, Be,F, Sb, Hg, Au, Pb, Ba, As, Ag, Zn ± Cd, Bi, and Te. This isa very generalised order, as many of these elements may havebeen deposited in several mineralisation stages.
Other variables, such as Na, Ca, Sr, Si, Mn, Tl, and LOI,which are associated with alteration processes, are less impor-tant for prospecting because they do not form obvious geo-chemical anomalies. However, several types of relationshipsmay be of interest. For instance, the gradual increases in K toNa and K to Ca ratios toward the centre of mineralisation mayhave a prospecting value, as some weak, negative Na and Caanomalies are associated with strong, positive K anomaly in thecore zone.
The K2O/Na2O ratio increases from 1.40 in the peripheralzone, to 1.75 in the intermediate zone, to 2.10 in the corezone. Similarly, the K2O/CaO ratio increases from 2.62 in theperipheral zone, to 3.28 in the intermediate zone, to 4.01 inthe core zone.
Sulphur forms a strong, widespread anomaly over the en-tire area investigated. Concentrations lower than the Clarkevalues are rare. Areas with the highest S concentrations cor-relate closely spatially with areas containing high Cu concen-trations. However, S anomalies are not very good indicatorsof the ore deposits at Myszków because pyrite, the most com-mon source of S, is abundant in all parts of the mineralisedarea.
THE SPATIAL DISTRIBUTION OF THE MINERALISATION
SAMPLING AND CHEMICAL ANALYSES OF CORES FROM BOREHOLES
During the exploration phase of drilling for polymetallicmineralisation in the Myszków area, a special emphasis wasgiven to representative sampling, and to selecting adequatemethods of investigations. The boreholes were completelycored and were drilled at a spacing of about 100–120 m alonglines spaced about 200 m apart. The sampled holes were lo-cated along six parallel lines that were oriented NE–SW, per-pendicular to the longest dimension of the granitoid intrusion(Fig. 7). Over 43 000 samples were collected from 24 bore-holes.
The cores were geologically logged and next cut into twohalves along the core axis. One half was stored in the CentralGeological Archives of the Polish Geological Institute and thesecond half was used for laboratory analyses. Standard investi-gations included chemical, geochemical and petrographicanalyses of rocks and ore minerals.
Taking the stockwork and disseminated character of themineralisation into consideration, the following methods wereused to collect samples for standard chemical analyses:
• channel sampling: samples 0,5 m in length for intervalswith macroscopically visible mineralisation and 1,0 m inlength for intervals with relatively weak mineralisation (98%of the total number of samples),
• point sampling, for intervals containing macroscopi-cally invisible mineralisation (2% of the total number ofsamples).
The Vendian to Late Carboniferous rocks were sampled indetail in most of the investigated boreholes. Cores from fourboreholes (Pz-11, Pz-13, Pz-14, and Pz-17) were generally pointsampled and only sporadically channel sampled because most ofthe cores were of only weakly mineralised porphyry rocks.
Standard chemical analyses, for prefeasibility study pur-pose, were determined in the laboratories of the following in-stitutions: the Polish Geological Institute in Warsaw (CentralChemical Laboratory), the Polish Geological Institute Re-gional Branches in Sosnowiec, Kielce, and Wroc³aw; theGeological Enterprises in Warsaw, Kraków, and Katowice;the Mining and Metallurgical Works “Orze³ Bia³y“ in Pie-
Sampling and chemical analyses of cores from boreholes 71
kary Œl¹skie; the Institute of Iron Metallurgy in Gliwice; andthe KGHM Polish Copper S.A. in Lubin. X-ray fluorescencespectrometry, atomic absorption spectrophotometry, emis-sion spectrography, and ICP techniques were used to deter-mine six elements (Cu, Mo, W, Zn, Pb, and Bi).
For quality control, splits of samples were analysed for Cu,Mo, and W in three different laboratories, including those ofthe Polish Geological Institute in Warszawa, the Institute ofBase Metals in Gliwice, and the Technical University inWroc³aw.
VERTICAL ZONING OF THE MINERALISATION
The vertical distribution of Mo-W-Cu mineralisation inthe Myszków area is shown on the two vertical geologicalcross-sections (A–A’ and B–B’). Analyses for Cu, Mo, andW from almost twenty thousand samples were used to pro-duce the geochemical cross-sections.
The krieging procedure (Environmental Protection Agency“GeoEAS” program, Las Vegas, 1988) was used to produce thecontour maps for Cu, Mo, and W. The analysed samples weregrouped over 5 m intervals, and the average Cu, Mo, and Wconcentrations for each interval was calculated. The distribu-tion of the three metals was selected by using histograms. Then,the analytical functions approximated the variability. Thesefunctions were afterwards used as the geostatistical variabilitymodels. The model type is presented in the Table 22.
Concentration levels for Cu, Mo, and W are shown oncross-sections A–A’ and B–B’ which were constructed usingkrieging and contouring techniques in Golden Software’s“Surfer” programme. A grid with 25 m length squares was usedto calculate a random variability parameter.
Molybdenum mineralisation. On cross-section A–A’(Fig. 42), Mo is concentrated in the granitoid. It is also pres-ent in lower concentrations in the wall rocks within about50–150 m of the contact with the intrusion. The 500 ppmMo contour line is almost completely within the intrusionboundary.
On cross-section B–B’ (Fig. 43), the centre of Mo miner-alisation extends beyond the granitoid intrusion, towardborehole Pz-21. Anomalous Mo occurs at a greater depth onthis section than on section A–A’. The maximum Mo con-centrations on both cross-sections is about 1250–1300 ppm.
The distribution of the tungsten mineralisation is similarto that of Mo. However, W is more closely associated spatiallywith granitoid rocks than is Mo (Figs. 44–45). The distributionof tungsten based on the 500 ppm W contour line is more re-stricted than is the anomaly for 500 ppm Mo. The W anomaly isconfined to the granitoid intrusion on both cross-sections. Themaximum W concentration is less than that of Mo, with maxi-mum values reaching 1000–1250 ppm W.
Copper mineralisation has the most complex distribu-tion of the three elements. There are three positive Cuanomalies on cross-section A–A’(Fig. 46). One of them isconnected with the upper part of the granitoid intrusion. Theother two are located closer to the surface, in metamorphosedhost rocks and in the dacitoid veins that cut the host rocks onthe both sides of the intrusion. The highest Cu concentrationsare 0.4–0.5% Cu.
The distribution of anomalous Cu mineralisation on cross--section B–B’ (Fig. 47) is more irregular that that on sectionA–A’ (Fig. 46). The highest Cu concentrations are locatedboth in the intrusion and in its apophyses (Pz-30).
72 The spatial distribution of the mineralisation
T a b l e 2 2
Geostatistical variation models of the Cu, Mo and W mineralisation (cross-sections Figs. 42–47)
Cross-section Element ModelParameters
c0 (ppm2) c (ppm2) a (m)
Cu spherical 400 000 900 000 240
A–A’ Mo spherical 40 000 120 000 700
W spherical 70 000 80 000 600
Cu spherical 400 000 500 000 500
B–B’ Mo spherical 50 000 90 000 700
W spherical 30 000 50 000 600
c0 — random variability; c — range of random variability; a — extend of autocorrelation
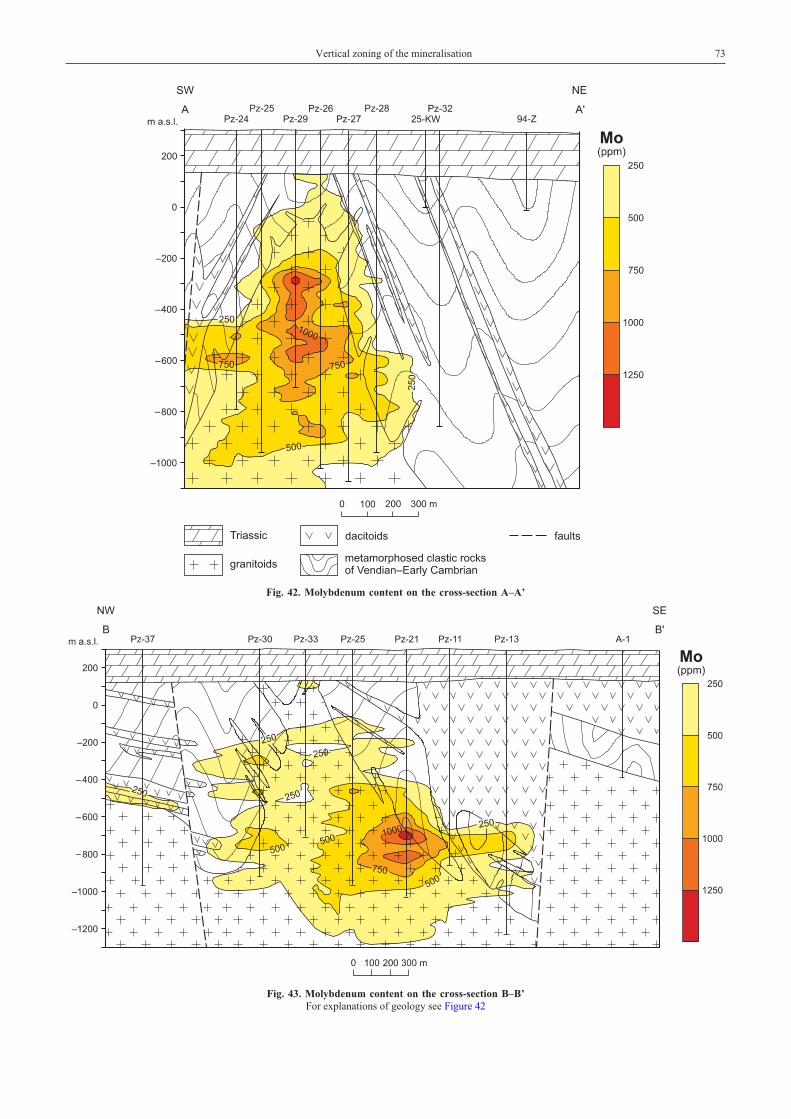
Vertical zoning of the mineralisation 73
Fig. 42. Molybdenum content on the cross-section A–A’
Fig. 43. Molybdenum content on the cross-section B–B’For explanations of geology see Figure 42
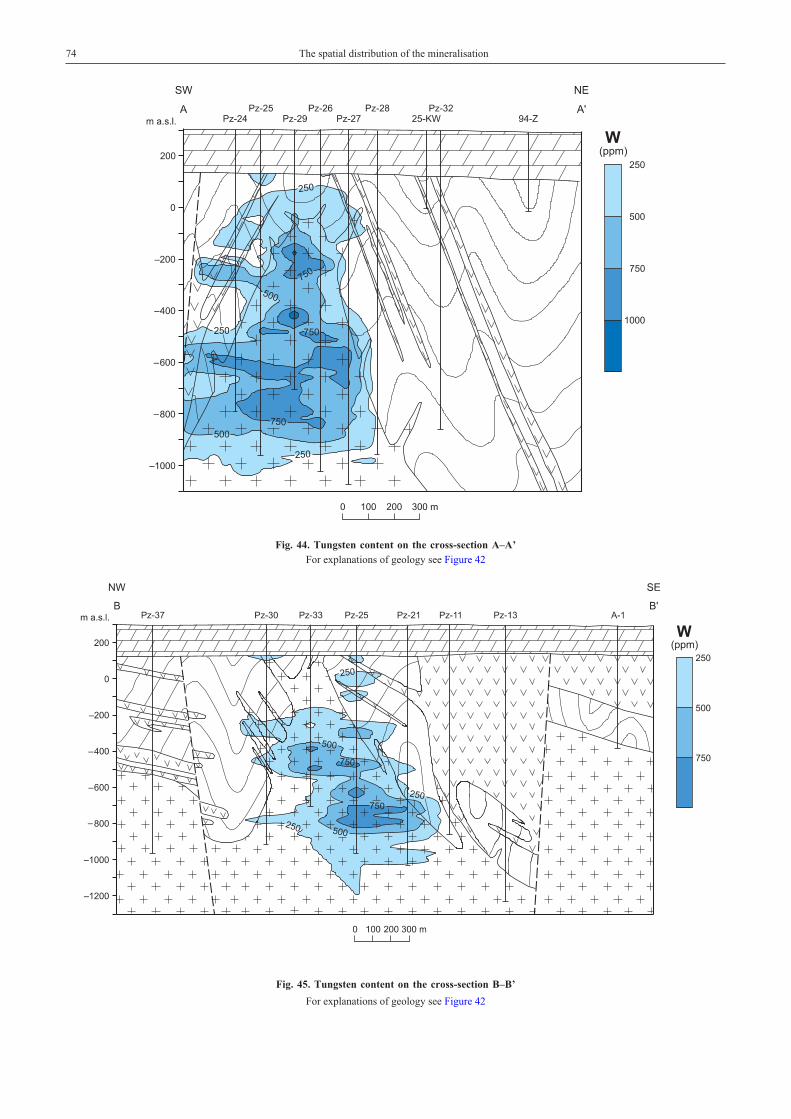
74 The spatial distribution of the mineralisation
Fig. 44. Tungsten content on the cross-section A–A’For explanations of geology see Figure 42
Fig. 45. Tungsten content on the cross-section B–B’
For explanations of geology see Figure 42
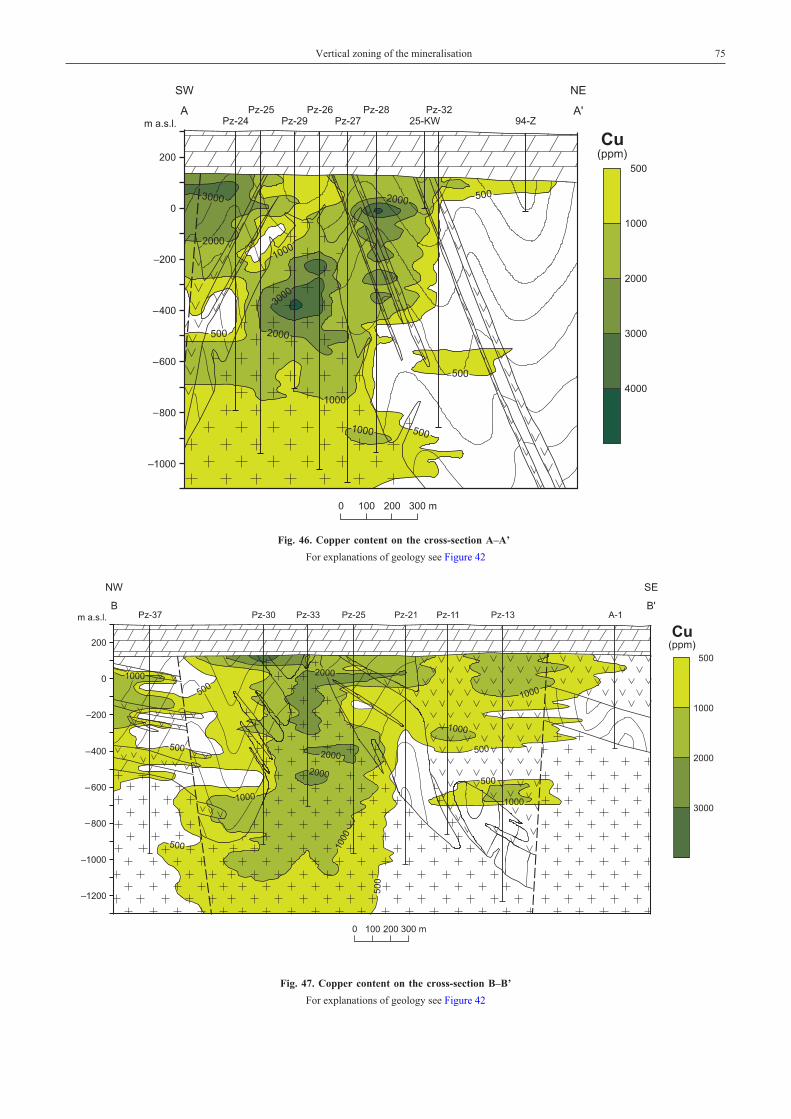
Vertical zoning of the mineralisation 75
Fig. 46. Copper content on the cross-section A–A’
For explanations of geology see Figure 42
Fig. 47. Copper content on the cross-section B–B’
For explanations of geology see Figure 42
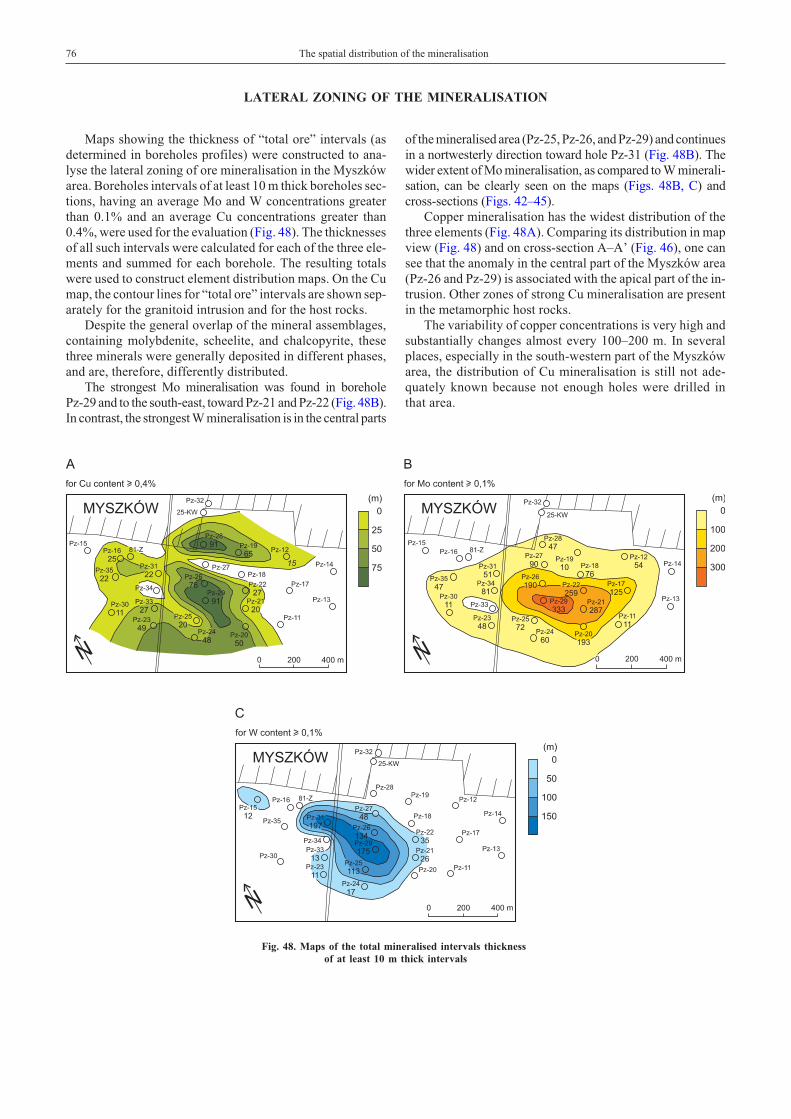
LATERAL ZONING OF THE MINERALISATION
Maps showing the thickness of “total ore” intervals (asdetermined in boreholes profiles) were constructed to ana-lyse the lateral zoning of ore mineralisation in the Myszkówarea. Boreholes intervals of at least 10 m thick boreholes sec-tions, having an average Mo and W concentrations greaterthan 0.1% and an average Cu concentrations greater than0.4%, were used for the evaluation (Fig. 48). The thicknessesof all such intervals were calculated for each of the three ele-ments and summed for each borehole. The resulting totalswere used to construct element distribution maps. On the Cumap, the contour lines for “total ore” intervals are shown sep-arately for the granitoid intrusion and for the host rocks.
Despite the general overlap of the mineral assemblages,containing molybdenite, scheelite, and chalcopyrite, thesethree minerals were generally deposited in different phases,and are, therefore, differently distributed.
The strongest Mo mineralisation was found in boreholePz-29 and to the south-east, toward Pz-21 and Pz-22 (Fig. 48B).In contrast, the strongest W mineralisation is in the central parts
of the mineralised area (Pz-25, Pz-26, and Pz-29) and continuesin a nortwesterly direction toward hole Pz-31 (Fig. 48B). Thewider extent of Mo mineralisation, as compared to W minerali-sation, can be clearly seen on the maps (Figs. 48B, C) andcross-sections (Figs. 42–45).
Copper mineralisation has the widest distribution of thethree elements (Fig. 48A). Comparing its distribution in mapview (Fig. 48) and on cross-section A–A’ (Fig. 46), one cansee that the anomaly in the central part of the Myszków area(Pz-26 and Pz-29) is associated with the apical part of the in-trusion. Other zones of strong Cu mineralisation are presentin the metamorphic host rocks.
The variability of copper concentrations is very high andsubstantially changes almost every 100–200 m. In severalplaces, especially in the south-western part of the Myszkówarea, the distribution of Cu mineralisation is still not ade-quately known because not enough holes were drilled inthat area.
76 The spatial distribution of the mineralisation
Fig. 48. Maps of the total mineralised intervals thicknessof at least 10 m thick intervals
MODEL AND GENESIS OF THE MINERALISATION
All endogenetic Mo deposits can be classified as beingCu-Mo, Mo, or Mo-W types (Poka³ow, 1972; Table 23). TheMyszków deposit is thought to belong to the Mo-W type.
The Mo-W type of deposits is generally connected with thetectonic mobilisation of older rocks. This activity produceddeep-seated fractures that separated areas of crustal rocks intotectonic blocks that were uplifted or down faulted to varyingdegrees. Molybdenum deposits were mainly generated in theuplifted blocks, which are also associated with the granitoid in-trusions (Pavlova and Aleksandrov, 1986). These tectonically--active areas could also be interpreted as being subductionzones along active continental plates (Chaffee et al., 1994,1997, 1999).
Deposits of the Mo-W type are associated with plutonscomposed of leucocratic granites (Poka³ow, 1972), and partic-ularly with small intrusive bodies, some of which could havedeveloped at great distances from their primary batholith.Some Mo-W deposits develop along the endocontacts ofplutons. Molybdenum-bearing plutons commonly exhibit con-tact metasomatic alterations zones that may include hornfelses,biotite, and feldspar minerals (Poka³ow, 1972).
Hornfelses may be found as far as 100 m outward from in-trusion contacts. The distance depends on the temperatureand mineral content of the primary rocks. At greater dis-tances from the intrusion, rock recrystallisation occurs aspatchy textures. Biotite alteration has the widest distributionand may extend more than 1000 m from the outer edge of theintrusion. Feldspathisation occurs as numerous potassiumfeldspar-plagioclase-quartz-biotite veins (as much as 1.5cm-thick) that cut the wall rocks near the intrusion in an aure-ole that extends as far as 300–350 m from the intrusion.
The Mo-W deposit at Myszków is located on the westernedge of the Ma³opolska Block, close to its tectonic contact(Kraków–Lubliniec tectonic zone) with the Upper SilesianBlock (Fig. 4). According to ¯aba (1999), this zone was acti-vated in two stages. The first was in the Late Silurian and thesecond in the Late Carboniferous to Early Permian. In contrast,Chaffee et al. (1994, 1997) regard this tectonic zone as a sub-duction zone in continentally-derived rocks.
Although it is probable that the Myszków deposit parentgranitoid batholith is leucocratic, it has not as yet been pene-trated by drilling. It is speculated that this batholith is the sourceof the large negative gravity anomaly at Kotowice (Fig. 2A).The granitoid intrusions in the Myszków–Mrzyg³ód, Zawier-cie, Pilica and Dolina Bêdkowska areas may all represent smallintrusive bodies, associated with this batholith.
A characteristic, though limited, zone of exocontact alter-ation is present near each of these intrusions. Hornfelses andbiotitised host rocks have been observed in the Myszkówarea. The distribution of hornfelses is rather small and ex-tends from several tens of centimetres to a few metres beyondthe intrusion wall rock contact. Patches of recrystallisedrocks extend much farther. No classic feldspathic alteration
was observed in the Myszków area. On the other hand,biotitisation has affected rocks for a distance of as much asseveral hundred metres beyond the edge of the intrusion. Theeffects of biotitisation have also been observed in a few bore-holes from the Kotowice area suggesting the presence ofa granitoid intrusion at a greater depth.
Textures of the Myszków granitoids suggest that they mayhave crystallised at rather shallow depths. Textural featuresthat suggest this include zoned, very often recurrent plagio-clases, the presence of perthites, the characteristics of quartzgrains, and the appearance of fluid inclusions.
Andalusite (Heflik et al., 1975) and cordierite (Banaœ et al.,unpubl. report, 1977) have been observed in the Myszków areain wall rocks near their contact with the granitoid intrusion.These minerals also suggest a shallow depth of crystallisation(2–10 km) and a contact zone temperature range of 550–700°C(Carmichael et al., 1974).
The chemical connection of the granitoids and associateddacitoids, and the calc-alkali characteristics of the granitoids,have been determined by chemical analyses. These rocksformed after a relatively rapid period of crystallisation, fromthe silica-saturated, granodioritic or dacitic magma (Jusko-wiak, 1971). Wieser (1957) made a similar conclusions butstated that the dacitic magma originated from tholeitic magma,which also is the parent magma for the diabases. According toRyka (1974), the diabase-lamprophyre rocks, as well as the“porphyries” were generated from the same tholeitic magma.The resulting differences in the rocks depend on the type ofhost-rock contamination.
The ore mineralisation that produced the Myszków depositwas the result of a very complex process. The dominantsulphides, oxides, as well as sulphosalts, tellurides, and nativeBi have been identified in many different parageneses, and inmany generations of mineral deposition. These minerals havecrystallised over a wide range of temperatures. This wide rangeis suggested by some mineral associations as well as by disinte-gration textures of solid solution minerals (sphalerite, cubanite,bornite, and valleriite inclusions in chalcopyrite), martitisationof magnetite, and the native Bi inclusions in the Bi minerals.The geochemical investigations of individual ore minerals didnot reveal significant chemical differences within any one spe-cies, suggesting a common postmagmatic source for both theCu-Mo-W and the skarn ores.
Differences in the composition of sulphur isotopes in theore minerals from the main stage of Cu-Mo-W deposition, aswell as from younger stages of mineralisation, might have beencaused by changes in the physico-chemical environment dur-ing evolution of the hydrothermal fluids from oxides andsulphides to sulphates and (or) by the effects of contaminationby host rocks incorporated into the magma.
The disseminated mineralisation and stockwork veining atMyszków are typical of most calc-alkaline porphyry Cu sys-tems, except for the occurrence of significant concentrations of
Model and genesis of the mineralisation 77
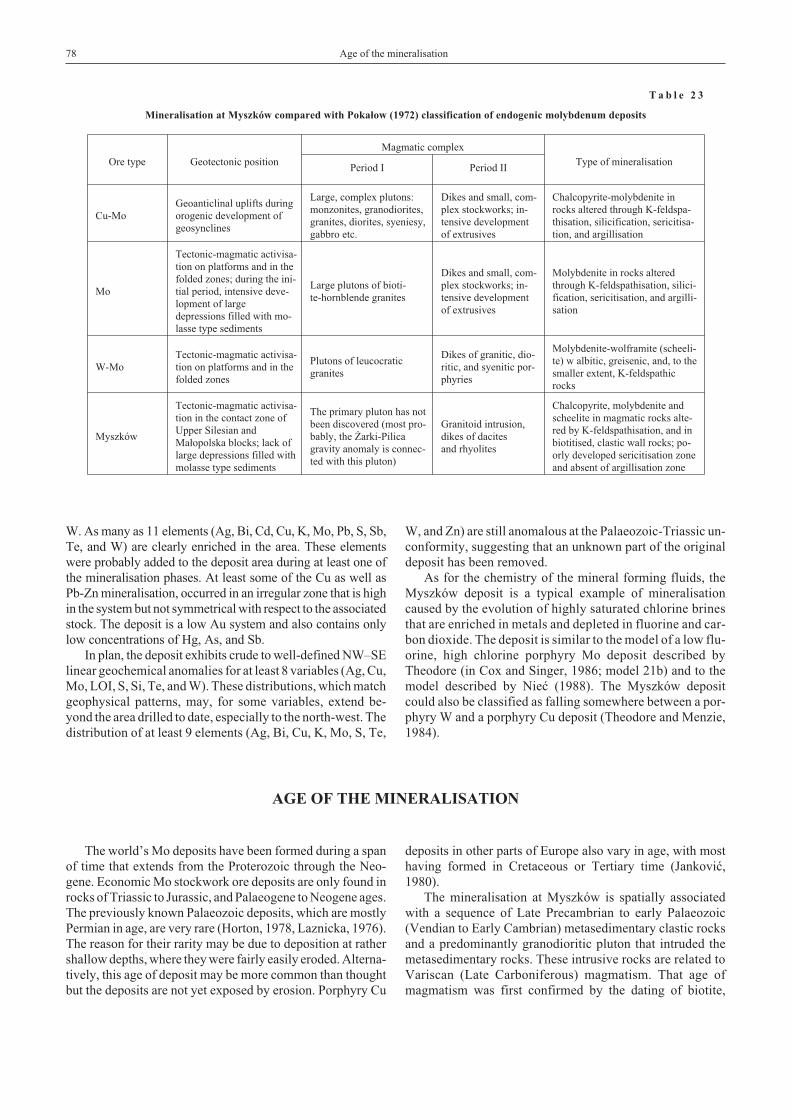
W. As many as 11 elements (Ag, Bi, Cd, Cu, K, Mo, Pb, S, Sb,Te, and W) are clearly enriched in the area. These elementswere probably added to the deposit area during at least one ofthe mineralisation phases. At least some of the Cu as well asPb-Zn mineralisation, occurred in an irregular zone that is highin the system but not symmetrical with respect to the associatedstock. The deposit is a low Au system and also contains onlylow concentrations of Hg, As, and Sb.
In plan, the deposit exhibits crude to well-defined NW–SElinear geochemical anomalies for at least 8 variables (Ag, Cu,Mo, LOI, S, Si, Te, and W). These distributions, which matchgeophysical patterns, may, for some variables, extend be-yond the area drilled to date, especially to the north-west. Thedistribution of at least 9 elements (Ag, Bi, Cu, K, Mo, S, Te,
W, and Zn) are still anomalous at the Palaeozoic-Triassic un-conformity, suggesting that an unknown part of the originaldeposit has been removed.
As for the chemistry of the mineral forming fluids, theMyszków deposit is a typical example of mineralisationcaused by the evolution of highly saturated chlorine brinesthat are enriched in metals and depleted in fluorine and car-bon dioxide. The deposit is similar to the model of a low flu-orine, high chlorine porphyry Mo deposit described byTheodore (in Cox and Singer, 1986; model 21b) and to themodel described by Nieæ (1988). The Myszków depositcould also be classified as falling somewhere between a por-phyry W and a porphyry Cu deposit (Theodore and Menzie,1984).
AGE OF THE MINERALISATION
The world’s Mo deposits have been formed during a spanof time that extends from the Proterozoic through the Neo-gene. Economic Mo stockwork ore deposits are only found inrocks of Triassic to Jurassic, and Palaeogene to Neogene ages.The previously known Palaeozoic deposits, which are mostlyPermian in age, are very rare (Horton, 1978, Laznicka, 1976).The reason for their rarity may be due to deposition at rathershallow depths, where they were fairly easily eroded. Alterna-tively, this age of deposit may be more common than thoughtbut the deposits are not yet exposed by erosion. Porphyry Cu
deposits in other parts of Europe also vary in age, with mosthaving formed in Cretaceous or Tertiary time (Jankoviæ,1980).
The mineralisation at Myszków is spatially associatedwith a sequence of Late Precambrian to early Palaeozoic(Vendian to Early Cambrian) metasedimentary clastic rocksand a predominantly granodioritic pluton that intruded themetasedimentary rocks. These intrusive rocks are related toVariscan (Late Carboniferous) magmatism. That age ofmagmatism was first confirmed by the dating of biotite,
78 Age of the mineralisation
T a b l e 2 3
Mineralisation at Myszków compared with Poka³ow (1972) classification of endogenic molybdenum deposits
Ore type Geotectonic position
Magmatic complex
Type of mineralisationPeriod I Period II
Cu-MoGeoanticlinal uplifts duringorogenic development ofgeosynclines
Large, complex plutons:monzonites, granodiorites,granites, diorites, syeniesy,gabbro etc.
Dikes and small, com-plex stockworks; in-tensive developmentof extrusives
Chalcopyrite-molybdenite inrocks altered through K-feldspa-thisation, silicification, sericitisa-tion, and argillisation
Mo
Tectonic-magmatic activisa-tion on platforms and in thefolded zones; during the ini-tial period, intensive deve-lopment of largedepressions filled with mo-lasse type sediments
Large plutons of bioti-te-hornblende granites
Dikes and small, com-plex stockworks; in-tensive developmentof extrusives
Molybdenite in rocks alteredthrough K-feldspathisation, silici-fication, sericitisation, and argilli-sation
W-MoTectonic-magmatic activisa-tion on platforms and in thefolded zones
Plutons of leucocraticgranites
Dikes of granitic, dio-ritic, and syenitic por-phyries
Molybdenite-wolframite (scheeli-te) w albitic, greisenic, and, to thesmaller extent, K-feldspathicrocks
Myszków
Tectonic-magmatic activisa-tion in the contact zone ofUpper Silesian andMa³opolska blocks; lack oflarge depressions filled withmolasse type sediments
The primary pluton has notbeen discovered (most pro-bably, the ¯arki-Pilicagravity anomaly is connec-ted with this pluton)
Granitoid intrusion,dikes of dacitesand rhyolites
Chalcopyrite, molybdenite andscheelite in magmatic rocks alte-red by K-feldspathisation, and inbiotitised, clastic wall rocks; po-orly developed sericitisation zoneand absent of argillisation zone
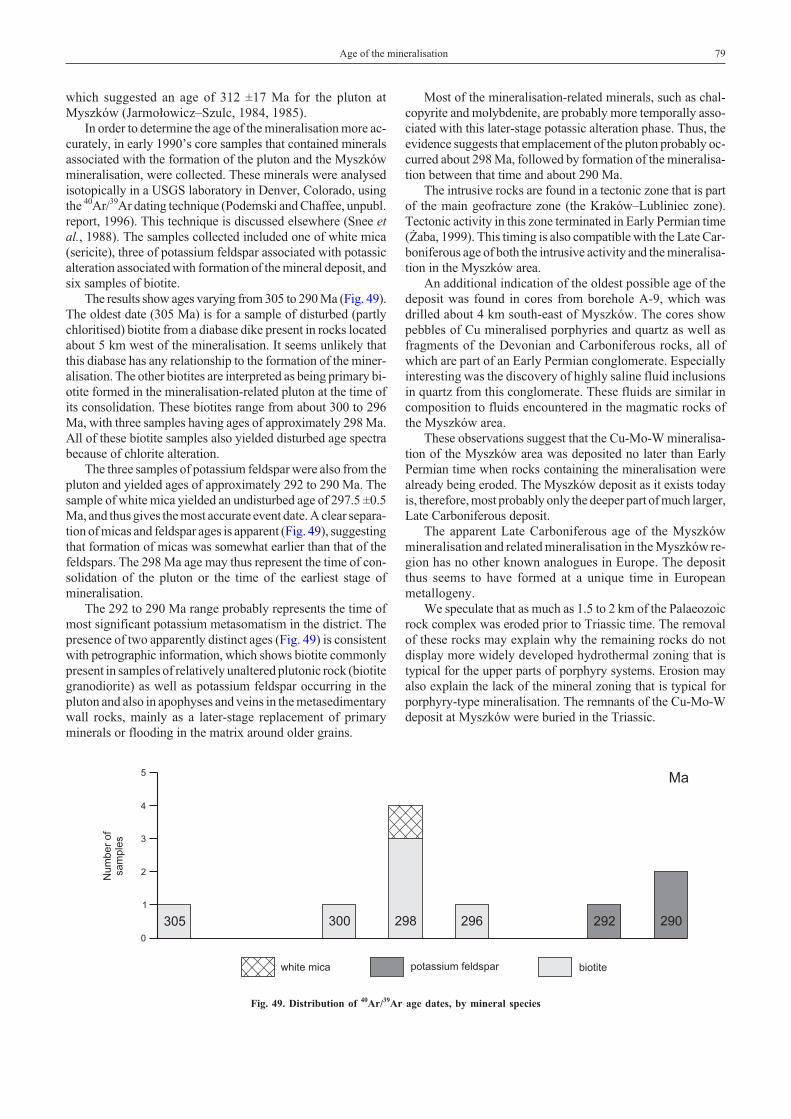
which suggested an age of 312 ±17 Ma for the pluton atMyszków (Jarmo³owicz–Szulc, 1984, 1985).
In order to determine the age of the mineralisation more ac-curately, in early 1990’s core samples that contained mineralsassociated with the formation of the pluton and the Myszkówmineralisation, were collected. These minerals were analysedisotopically in a USGS laboratory in Denver, Colorado, usingthe 40Ar/39Ar dating technique (Podemski and Chaffee, unpubl.report, 1996). This technique is discussed elsewhere (Snee et
al., 1988). The samples collected included one of white mica(sericite), three of potassium feldspar associated with potassicalteration associated with formation of the mineral deposit, andsix samples of biotite.
The results show ages varying from 305 to 290 Ma (Fig. 49).The oldest date (305 Ma) is for a sample of disturbed (partlychloritised) biotite from a diabase dike present in rocks locatedabout 5 km west of the mineralisation. It seems unlikely thatthis diabase has any relationship to the formation of the miner-alisation. The other biotites are interpreted as being primary bi-otite formed in the mineralisation-related pluton at the time ofits consolidation. These biotites range from about 300 to 296Ma, with three samples having ages of approximately 298 Ma.All of these biotite samples also yielded disturbed age spectrabecause of chlorite alteration.
The three samples of potassium feldspar were also from thepluton and yielded ages of approximately 292 to 290 Ma. Thesample of white mica yielded an undisturbed age of 297.5 ±0.5Ma, and thus gives the most accurate event date. A clear separa-tion of micas and feldspar ages is apparent (Fig. 49), suggestingthat formation of micas was somewhat earlier than that of thefeldspars. The 298 Ma age may thus represent the time of con-solidation of the pluton or the time of the earliest stage ofmineralisation.
The 292 to 290 Ma range probably represents the time ofmost significant potassium metasomatism in the district. Thepresence of two apparently distinct ages (Fig. 49) is consistentwith petrographic information, which shows biotite commonlypresent in samples of relatively unaltered plutonic rock (biotitegranodiorite) as well as potassium feldspar occurring in thepluton and also in apophyses and veins in the metasedimentarywall rocks, mainly as a later-stage replacement of primaryminerals or flooding in the matrix around older grains.
Most of the mineralisation-related minerals, such as chal-copyrite and molybdenite, are probably more temporally asso-ciated with this later-stage potassic alteration phase. Thus, theevidence suggests that emplacement of the pluton probably oc-curred about 298 Ma, followed by formation of the mineralisa-tion between that time and about 290 Ma.
The intrusive rocks are found in a tectonic zone that is partof the main geofracture zone (the Kraków–Lubliniec zone).Tectonic activity in this zone terminated in Early Permian time(¯aba, 1999). This timing is also compatible with the Late Car-boniferous age of both the intrusive activity and the mineralisa-tion in the Myszków area.
An additional indication of the oldest possible age of thedeposit was found in cores from borehole A-9, which wasdrilled about 4 km south-east of Myszków. The cores showpebbles of Cu mineralised porphyries and quartz as well asfragments of the Devonian and Carboniferous rocks, all ofwhich are part of an Early Permian conglomerate. Especiallyinteresting was the discovery of highly saline fluid inclusionsin quartz from this conglomerate. These fluids are similar incomposition to fluids encountered in the magmatic rocks ofthe Myszków area.
These observations suggest that the Cu-Mo-W mineralisa-tion of the Myszków area was deposited no later than EarlyPermian time when rocks containing the mineralisation werealready being eroded. The Myszków deposit as it exists todayis, therefore, most probably only the deeper part of much larger,Late Carboniferous deposit.
The apparent Late Carboniferous age of the Myszkówmineralisation and related mineralisation in the Myszków re-gion has no other known analogues in Europe. The depositthus seems to have formed at a unique time in Europeanmetallogeny.
We speculate that as much as 1.5 to 2 km of the Palaeozoicrock complex was eroded prior to Triassic time. The removalof these rocks may explain why the remaining rocks do notdisplay more widely developed hydrothermal zoning that istypical for the upper parts of porphyry systems. Erosion mayalso explain the lack of the mineral zoning that is typical forporphyry-type mineralisation. The remnants of the Cu-Mo-Wdeposit at Myszków were buried in the Triassic.
Age of the mineralisation 79
5
4
3
2
1
0
300 298 296
Ma
Nu
mb
er
of
sa
mp
les
305 292 290
white mica potassium feldspar biotite
Fig. 49. Distribution of 40Ar/39Ar age dates, by mineral species
COMPARISON OF THE MYSZKÓW DEPOSIT TO OTHER PORPHYRY DEPOSITS
Comparison of the Myszków deposit to Climax-type por-phyry deposits and to quartz-monzonite Mo deposits (Whiteet al., 1981) reveals numerous common features. Mineralisa-tion of the Myszków area is most similar to quartz-mon-zonite type Mo deposits, although there are no knownmonzonite rocks at Myszków (Table 24). The Myszków de-posit differs, however, from the quartz-monzonite model be-cause it has a linear shaped intrusion, lacks substantialfluorine, has a different kind of Bi mineralisation, lacks tinmineralisation, and has a fairly low Cu/Mo ratio.
The Myszków deposit also differs from porphyry Cu de-posits with significant Mo concentrations found elsewhere,such as in Chile. The Mo concentrations in these porphyry Cudeposits varies between 0.01 and 0.05% and averages 0.02 %.They also contain substantial concentrations of Au and Ag(White et al., 1981). At Myszków, the average concentration ofMo is much higher than in typical Cu-Mo deposit and the con-centrations of Au and Ag are much lower. The Myszków de-posit also contains a considerably higher overall concentrationlevel of W than do typical porphyry Cu-Mo deposit.
Many of the characteristics of the Myszków deposit aresimilar to those of described for the Lowell and Guilbert (1970)model for calc-alkaline-associated porphyry Cu deposits, in-cluding deposit chemistry, mineralogy, and vein morphology,tectonic setting, composition of associated plutonic rocks,fluid-inclusion compositions, and many other features.
However, for the Myszków mineralisation, several charac-teristics are not typical of most porphyry Cu deposits, particu-larly those in Europe. Mineralogically, scheelite is widespreadin veins cutting the ore-related stock and is also found locally inskarn zones in the wall rocks. The literature on porphyry Cu de-posits (Culver and Broughton, 1945; Hollister, 1978; Purdy,1954) contains very few references to W minerals (principallyscheelite and tungstenite); consequently, little is known aboutW in this deposit type. Where they have been identified in ma-jor porphyry Cu deposits, W minerals are usually found inskarn zones in the wall rocks and not in the ore-related pluton,as is the case at Myszków.
The closest analogues to the Myszków deposit may be theporphyry Cu-Mo deposits in the Cascade Mountains of thenorth-western United States, in the Canadian Cordillera ofBritish Columbia and Yukon, and in Alaska that are describedby Culver and Broughton (1945), Hollister (1978), and Purdy(1954). In this region of North America, scheelite and tung-stenite are often mentioned as accessory minerals in many por-phyry deposits. However, details concerning the abundanceand distribution of W in these deposits are lacking.
No other porphyry Cu-Mo-type deposits with high concen-trations of W have been reported in Europe outside of Poland.Thus, the W enrichment at Myszków also seems to be uniqueamong deposits of this type in Europe.
80 Comparison of the Myszków deposit to other porphyry deposits
T a b l e 2 4
Comparison of the Myszków deposit to other Mo-porphyry deposits (the latter after White et al., 1981)
Characteristic elements of deposit Climax type deposit Quartz-monzonite type Mo deposit the Myszków deposit
Rocks genetically connected withmineralisation
Granite porphyries Quartz-monzonite porphyries Granodiorite
Intrusive stages Multistage granite intrusions Complex intrusions: from quartz-diori-tes to quartz-monzonites
Intrusions composed of granodiori-tes, dacites, and rhyolites
Form of intrusion Magmatic block Magmatic block or batholith Linear intrusion, probably connec-ted with batholith
Type of ore body Stockwork Stockwork Stockwork
Form of ore body Reversed bowl Reversed bowl and banded Cone with ellipse-like basis
Average MoS2 content 0,30–0,45% 0,10–0,20% 0,15%-0,40%
Ore body reserves 50–1000 mil. t 50–1000 mil. t With average content = 0.25% Moex
~150 mil. tx
Mo e = Mo + W + 0.3 Cu
MoS2 dissemination Rare Rare Rare
Age Middle to Late Tertiary Mesozoic and Tertiary Late Carboniferous
Fluorine minerals Fluorite, topaz Fluorite Rare fluorite
Bismuth minerals Sulphosalts Sulphosalts Bismuthinite, sulphosalts, native Bi
Tungsten minerals Wolframite (hübnerite) Scheelite Scheelite
Tin minerals Cassiterite, stannine Rare Absent
Copper minerals Chalcopyrite, rarely Small amounts of chalcopyrite Chalcopyrite
Silicification Silica-rich core Insignificant silicification Insignificant silicification
Greisenisation Greisens present Greisens absent Greisens absent
Cu:Mo relation in ore zone From 1:1000 to 1:50 From 1:30 to 1:1 2:1; Cu:W:Mo = 2.7:1:14
RECOMMENDATIONS FOR FURTHER STUDIES
Widely spaced, deep drilling in the north-eastern border ofthe Upper Silesian Coal Basin (USCB), the area known also asKraków–Lubliniec region, has identified many localities withCu porphyry-type features, however, no major deposit has asyet been delineated. Our data show that the mineralised area atMyszków has not yet been completely defined by deep drilling.The criteria established for our model of the Myszków depositshould be useful in defining the lateral extent of this deposit anduseful in the search for additional, similar deposits in theKraków–Lubliniec region.
The distributions of anomalous Cu, Mo, S, W, and Te ex-tend laterally well beyond the area of deep drilling in theMyszków area. Clearly, these elements are the best to use in ex-
ploring for porphyry-type mineralisation, both in the Myszkówarea and in the rest of the Kraków–Lubliniec region.
The presence of NW–SE linear parallel geochemical andgeophysical anomalies near Myszków may be a pattern re-peated regionally in other parts of the Kraków–Lubliniec re-gion. This NW–SE linearity should be tested in the vicinity ofother poorly defined geochemical and geophysical anomaliesfound elsewhere in the region.
Because the Vendian to Late Carboniferous rocks that maycontain mineralisation are not exposed in most of the Kra-ków–Lubliniec region, additional drilling, as well as geophysi-cal and other studies, will be necessary to evaluate the economicpotential of this incompletely understood porphyry Cu province.
SUMMARY AND CONCLUSIONS
The Myszków deposit is one of several porphyry Cu-typedeposits that have been identified within a poorly defined beltof Precambrian to Palaeozoic rocks in south-central Poland.This belt is nowhere exposed at the surface so that the maxi-mum regional extent of rocks that may host porphyry depositsis unknown.
The Myszków mineralisation is in a complex of Vendianto Early Cambrian-aged metasedimentary rocks that was in-truded by a stock of Late Carboniferous age. These primarilyclayey to muddy to sandy wall rocks were regionally meta-morphosed to produce minerals in the chloritic zone of thegreenschist facies. Greenschist facies temperatures are sug-gested by mineral parageneses and by mineral chemistry.
The thermal and thermal–metasomatic metamorphism,which is younger than the regional metamorphism, is spa-tially associated with the Variscan granitoid intrusion bothnear wall rock direct and in more distant areas. Hornfelses,pyroxene-amphibole skarns, and metasomatites were formedduring contact metamorphism. Mineral parageneses sug-gests an alteration temperature range of about 350–500°C,with the upper limit based on the presence of garnets (Deer et
al., 1962).The isotopic dating of mineralisation related feldspars and
micas indicates that the age of the intrusive rocks and the min-eralisation phases is Late Carboniferous, an age of porphyry--type deposit formation not known to be present elsewhere inEurope. Most porphyry Cu deposits discovered to date in Eu-rope were formed in Cretaceous or Tertiary time. The Late Car-boniferous (Variscan) age of the Myszków mineralisation maytherefore be unique for European deposits of this type.
The chemistry, mineralogy, and vein morphology of theMyszków deposit are generally similar to those of the Lowelland Guilbert (1970) model for calc-alkaline-associated por-phyry Cu deposits. The mineralisation at Myszków consistsmainly of stockwork veins; skarn minerals are uncommon.
Eight substages of mineral deposition have been identified,five of which are closely associated with formation of theMyszków porphyry Mo-W-Cu mineralisation.
The complete mineral assemblage of the Myszków deposit,which is found in all the periods and stages of mineralisation,consists of pyrite, chalcopyrite, magnetite, molybdenite, spha-lerite, galena, scheelite, and rutile. More rarely bornite, hema-tite, pyrrhotite, marcasite, ilmenite, tungstenite, and ferberiteare encountered. Bismuthinite, native Bi, chalcopyrite,cubanite, emplectite, aikinite, hessite, tetradymite, cosalite,wittichenite, tetrahedrite, tennantite, valleriite, and chalcociteappear only in trace amounts. Chalcocite, covellite, malachite,and goethite have been observed in the weathered zone.
The results of a factor analyses on the chemical data for thedeposit support the concept of multiple stages of mineralisationat Myszków that has been observed in the petrographic investi-gations. Copper is loaded on two different factors, suggestingat least two stages of Cu mineralisation. The presence ofpotassic metasomatism and base-metal-related factors empha-sises that additional stages of mineralisation can be docu-mented using chemical analyses.
The abundance levels of the elements analysed for thisstudy shows that as many as 11 elements (Ag, Bi, Cd, Cu, K,Mo, Pb, S, Sb, Te, and W) are clearly enriched in the mineral-ised area. In contrast, As, Hg, Au, Be, Mn, and Zn show nosignificant enrichment in the system. Localities with highconcentrations of these latter elements are generally found incontact metasomatic zones where they were enriched byremobilization during formation of the mineral deposits.
The Myszków mineralisation is strongly enriched in Cu,Mo, and W but contains very little Au. The enrichment of Mobut not Au in this deposit is typical of many calc-alka-line-type porphyry Cu deposits whose causative pluton andore-related elements are derived from continental rather thanoceanic crust.
Recommendations for further studies 81
Guilbert and Park (1986) suggest that a “typical” calc-alka-line-type porphyry Cu deposit might contain 0.45 percenthypogene Cu and 0.015 percent Mo, giving a Cu/Mo ratio ofabout 30. The mean values for Cu and Mo at Myszków are 500and 130 ppm, respectively (Table 21), giving a ratio for theMyszków mineralisation of about 4.
At Myszków the mean value for Mo is similar to the valuegiven by Guilbert and Park (1986); however, the Cu value forMyszków is much lower than that given by these authors. Thus,even allowing for wide ranges in the overall Cu and Mo con-centrations in “typical” deposits, the Myszków mineralisationdoes not seem to fit the “standard”. The low ratio at Myszkówsuggests that much of any high-level, Cu-rich part of this de-posit (if it ever existed) was eroded prior to deposition of theoverlying Triassic rocks.
Scheelite is widespread in the ore-related stock at Mysz-ków and is also found locally in wall rock skarn zones. Incomparison to other calc-alkaline-type porphyry Cu depos-its, this area contains an unusually high concentration of W,particularly in the mineralised part of the stock. Therefore,we classify the Myszków deposit as being closest to a por-phyry Mo-W model.
Zoning is present in vertical section for most of the miner-alisation-related elements. This zoning is spatially related: (1)to the causative pluton (especially Mo and W), (2) to contactmetasomatic zones (e.g., Be, Mn, Pb, and Zn), or (3) to neither aspecific lithology nor contact zones (e.g., Ag, Bi, Cu, S, andTe). A concentric, vertical aureole of elements was not found.In plan, no well-defined element zoning patterns were identi-fied within the area of deep drilling for either level examined;however, some deposit-related elements produce wider aure-oles than do others.
Pre-Triassic weathering of the Vendian to Late Carbonifer-ous rocks at Myszków was not significant. As a result, nosupergene enrichment zone is present in this area. In addition,the potassic alteration zone and the distributions of sulphideminerals and anomalies of many of the sulphide mineral-re-lated elements (Ag, Bi, Cu, Mo, S, Te, W, and Zn) extend all theway to the erosion surface at the top of the Vendian to Late Car-boniferous complex at Myszków.
Overall, the mineralisation also exhibits typical mineralogyfor the deeper parts of a porphyry Cu system. Thus, it may beconcluded that the upper (perhaps significant) part of this de-
posit was removed by rapid erosion that was followed by rapidburial of the erosion surface by a sequence of Triassic marinerocks.
However, more complete deposits of this type-deposits,which might also contain supergene enrichment zones, couldbe present in down-faulted blocks in other parts of the Kra-ków–Lubliniec region, in areas subjected to less extensiveerosion.
Acknowledgments. We express our special thanks to ourlate colleague, Dr. Kazimierz Piekarski, economic geologistof the Polish Geological Institute Upper Silesian Branch, inSosnowiec. Without his scientific enthusiasm, and sometimeseven stubbornness, the Myszków Mo-W-Cu deposit wouldstill remain undiscovered. We therefore dedicate this mono-graph to his memory.
We also thank all the economic geologists and other scien-tists investigating the Precambrian and Palaeozoic basement ofthe Kraków–Lubliniec area and its associated mineralisation,and especially those investigating the Myszków area, for theirscientific innovation and research. Their research results arethe foundation of this monograph.
We are also indebted to those scientists who have con-ducted supplementary investigations on the geology and oremineralisation of the Myszków area, the results of which havebeen incorporated into this monograph. In particular, we thankW. Heflik, Z. Migaszewski, and O. Jeleñski for their comple-mentary petrographic investigations of the magmatic rocks,and S. Ha³as and his team from the Physics Institute of theMaria Sk³odowska-Curie University in Lublin, for their sul-phur isotope studies of the ore minerals. D. Sikorska helped uswith the illustrations and text.
Many other people assisted us as part of the Polish–Ameri-can geochemical project. We especially thank L. A. Bradley,K. J. Curry, M. W. Doughten, D. L. Fey, R. J. Knight,A. H. Love, J. S. Mee, C. A. Motooka, J. M. Motooka,R. M. O’Leary, C. S. Papp, B. H. Roushey, and D. F. Siems ofthe USGS, and H. Bellok, B. Budzicka, A. Chab³o, M. Gniadek,E. Górecka, K. Hnatyszak, A. Jaklewicz, I. Jaron,J. Kucharczyk, B. Kud³owska, E. Macio³ek, W. Narkiewicz,and P. Pas³awski of the Polish Geological Institute for their as-sistance with the analyses.
REFERENCES
AHRENS L. H., ERLANK A. J., 1978 — Bismuth, parts 83D-83M; 83O.In: Handbook of Geochemistry (ed. K. H. Wedepohl), v. II/5. Springer--Verlag, New York.
BADERA J., 1992 — Tektonika utworów paleozoicznych w otworze wiert-niczym Mrzyg³ód Pz-36. [Tectonics of the Palaeozoic deposits in theMrzyg³ód Pz-36 borehole; in Polish]. Arch. WNoZ UŒ., Sosnowiec.
BADERA J., 1999 — Wp³yw tektoniki na rozwój mineralizacji poli-metalicznej w rejonie Myszkowa. [Influence of tectonics on the poly-metallic mineralisation in Myszków area; in Polish]. Arch. PIG,Sosnowiec.
BANAŒ M., MOCHNACKA K., SALAMON W., 1977 — Analiza mine-ralogiczno-geochemiczna okruszcowania ³upków staropaleozoicznychna tle procesów metasomatycznych i charakterystyki petrograficznejska³ (otwór wiertniczy Pz-5). [Mineralogic-geochemical analyses of theOld Palaeozoic shists mineralisation with regards to metasomatic pro-cesses and to petrographic characteristics of rocks (borehole Pz-5); inPolish]. Arch. PIG, Sosnowiec.
BANAŒ M., PAULO A., PIEKARSKI K., 1972 — Copper and molybdenummineralization in the vicinity of Mrzyg³ód [Eng. Sum.]. Rudy i Met.
Nie¿., 1: 3–7.
82 References
BEANE R. E., TITLEY S. R., 1984 — Medno-porfirovye mestoro¿denija.C.II: Gidrotermalnye izmenenija i mineralizacija. In: Genezis rudnychmestoro¿denij. Moskva Mir, (transl. from: Economic Geology, SeventyFifth Anniversary, vol. 1905–1980): 278–333.
BEATY R. D., MANUEL O. K., 1973 — Tellurium in rocks. Chemical Ge-
ology, 12:155–159.BODNAR R. J., BEANE R. E., 1980 — Temporal and spatial variations in
hydrothermal fluid characteristics during vein-filing in pore cover over-lying deeply buried porphyry copper mineralisation at Red Mountain,Arizona. Econ. Geol., 75: 876–893.
BOGACZ K., 1980 — Tectonics of the Paleozoic rocks of the Dêbnik region[Eng. Sum.]. Rocz. Pol. Tow. Geol. 50, 2: 183–205.
BOJKOWSKI K., BUKOWY S., 1966 — The facial zones of the Lower Car-boniferous in the Silesia–Cracow Anticlinorium [Eng. Sum.]. Acta Geol.
Pol., 16, 2: 201–228.BROCHWICZ-LEWIÑSKI W., PO¯ARYSKI W., TOMCZYK H., 1983 —
Paleozoic strike-slip movements in southern Poland [Eng. Sum.]. Prz.
Geol., 31, 12: 651–658.BUKOWY S., 1964a — New views on the structure of the north-eastern mar-
gin of the Upper Silesian Coal Basin [Eng. Sum.]. Biul. Inst. Geol., 184:5–34.
BUKOWY S., 1964b — Notes on the geological structure of the Paleozoic ofthe eastern margin of the Upper Silesian Coal Basin [Eng. Sum.]. Biul.
Inst. Geol., 184: 21–38.BUKOWY S., 1982 — Problemy budowy paleozoiku regionu œl¹sko-kra-
kowskiego. [Problems of the Palaeozoic structure in the Silesia–Cracowregion; in Polish]. Przew. LIV Zjazdu Pol. Tow. Geol. Sosnowiec
23–25.IX.1982: 7–25.BUKOWY S., 1984 — Struktury waryscyjskie regionu œl¹sko-krakow-
skiego. [Variscan structures of the Silesia-Cracow region; in Polish]. Pr.
Nauk. UŒl., 691: 1–67.BUKOWY S., 1994 — Outline of Paleozoic structure of NE margin of the
Upper Silesian Coal Basin [Eng. Sum.]. In: Przew. LXV Zjazdu Pol.
Tow. Geol. Sosnowiec 22–23.IX.1994: 14–30.BUKOWY S., ŒLÓSARZ J., 1968 — The results of Bêb³o borehole [Eng.
Sum.]. Biul. Inst. Geol., 212: 7–34.BU£A Z., 1994 — Problems of stratigraphy and development of Lower Pa-
leozoic sediments of the NE margin of the Upper Silesian Coal Basin[Eng. Sum.]. Przew. LXV Zjazdu Pol. Tow. Geol., Sosnowiec
22–24.IX.1994: 31–57.BU£A Z., 2000 — The Lower Palaeozoic of Upper Silesia and West
Ma³opolska [Eng. Sum.]. Pr. Pañstw. Inst. Geol., 171: 5–71.BU£A Z., JACHOWICZ M., 1996 — The Lower Paleozoic sediments in the
Upper Silesian Block. Geol. Quart., 40, 3: 299–336.BU£A Z., HABRYN R., KRIEGER W., KUREK S., MARKOWIAK M.,
PREIDL M., WO� NIAK P., 1996 — Podsumowanie badañ geo-logicznych wykonanych na NE obrze¿eniu Górnoœl¹skiego Zag³êbiaWêglowego. [Geological studies on the NE margin of the Upper SilesianCoal Basin – a summary; in Polish]. Arch. PIG, Sosnowiec.
BU£A Z., JACHOWICZ M., ¯ABA J., 1997 — Principal characteristics ofthe Upper Silesian Block and Ma³opolska Block border zone (SouthernPoland). Geol. Mag., 134, 5: 669–677.
CARMICHAEL I. S., TURNER F. J., VERHOOGEN J., 1974 — Igneouspetrology. McGraw-Hill, New York.
CHAFFEE M. A., EPPINGER R. G., LASOÑ K., ŒLÓSARZ J., PODEMSKIM., 1994 — The Myszków porphyry copper-molybdenum deposit, Po-land: Internat. Geol. Rev.., 36: 947–960.
CHAFFEE M. A., EPPINGER R. G., LASOÑ K., ŒLÓSARZ J., PODEMSKIM., 1997 — A geological alteration, and geochemical model of theMyszków porphyry Cu-Mo deposit, southern Poland. In: Mineral De-posits: Research and Exploration — Where do They Meet? (eds. Papunen,Heikki): 851–854. A.A. Balkema, Rotterdam.
CHAFFEE M. A., EPPINGER R. G., LASOÑ K., ŒLÓSARZ J., 1999 —Geologic information and analytical results for samples of drill corefrom the Myszków porphyry copper-molybdenum deposit, southern Po-land: U.S. Geological Survey Open-File Report, 99-530-A: 118 p.
CIEŒLA E., KOSOBUDZKA I., OKULUS H., 1984 — Monoklina œl¹sko--krakowska w naturalnych polach fizycznych Ziemi: grawitacyjnym imagnetycznym. [Silesia–Cracow Monocline in the Earth natural physi-cal fields: gravity and magnetic ones; in Polish]. Sympozjum n.t. Bada-nia geofizyczne przy poszukiwaniu i rozpoznawaniu z³ó¿ surowcówsta³ych. PBG i SITG, Jab³onna k/Warszawy, 7–8 czerwca 1984: 1–33.
CLOKE P. L., KESLER S. E., 1979 — The halite trend in hydrothermal solu-tions. Econ. Geol., 74: 1823–1831.
COX D. P., SINGER D. A., 1986 — Mineral deposit models. U.S. Geol.
Surv. Biull., 1693: 73–122.COAKLEY G. J., 1975 — Tellurium. In: U.S. Bureau of Mines staff, mineral
facts and problems, 1975 Edition. U.S. Bureau of Mines: 1103–1108.CULVER H. E., BROUGHTON W. A., 1945 — Tungsten resources of
Washington. State of Washington Division of Geology Bulletin, 34: 89 p.DEER W. A., HOWIE R. A., ZUSSMAN J., 1962 — Rock-forming miner-
als. Longmans, London.EASTOE C. J., 1978 — A fluid inclusion study of the Panguna porphyry
copper deposit, Bougainville, Papua New Guinea. Econ. Geol., 73:721–748.
EKIERT F., 1957 — Geological conditions of the occurrence of magmaticrocks in Mrzyg³ód near Zawiercie Œl¹skie (Upper Silesia) [Eng. Sum.].Kwart. Geol., 1, 1: 106–112.
EKIERT F., 1971 — Geological structure of the Sub-Permian basement ofthe north-eastern margin of the Upper Silesian Coal Basin [Eng. Sum.].Pr. Inst. Geol., 66: 5–77.
GeoEAS, 1988 — (Geostatistical Environmental Assessment Software)User’s guide. Environmental Monitoring System Laboratory, Las Vegas.
G£ADYSZ J., JACHOWICZ M., PIEKARSKI K., 1990 — Palaeozoicacritarcha from the Siewierz vicinity (northern margin of the UpperSilesian Coal Basin) [Eng. Sum.]. Kwart. Geol., 34, 4: 623–630.
GUILBERT J. G., PARK C. F., Jr., 1986 — The geology of ore deposits: 985p. W. H. Freeman and Company, New York.
HABRYN R., MARKOWIAK M., ŒLÓSARZ J., 1994 — Prospects of thediscovery of a new ore body in the NW direction from the MyszkówMo-W-Cu deposit [Eng. Sum.]. Prz. Geol., 42, 8: 611–614.
HARAÑCZYK C., 1982a — Mineralizacja paleozoiczna pó³nocnego iwschodniego obrze¿enia Górnoœl¹skiego Zag³êbia Wêglowego.[Palaeozoic mineralisation of the Northern and Eastern margins of theUpper Silesian Coal Basin; in Polish]. Przew. LIV Zjazdu Pol. Tow.
Geol., Sosnowiec 23–25.IX.1982: 38–44.HARAÑCZYK C., 1982b — Nowe dane do poznania kaledoñskiego góro-
tworu Krakowidów. [New data to understand the Caledonian Krakowidyorogen; in Polish]. Przew. LIV Zjazdu Pol. Tow. Geol., Sosnowiec
23–25.IX.1982: 90–102.HARAÑCZYK C., 1988 — Significance of the sutural geofracture Za-
wiercie–Rzeszotary for development and occurrence of Paleozoic mine-ralization and ore deposits of Zn-Pb [Eng. Sum.]. Prz. Geol., 36, 7:379–381.
HARAÑCZYK C., 1994a — Znaczenie sutury terranowej Zawiercie–Rze-szotary dla poznania kaledoñskiego transpresyjnego górotworu krako-widów. [The importance of the Zawiercie–Rzeszotary terrane suture tounderstand the Caledonian transpresive Krakovidy orogene; in Polish].Przew. LXV Zjazdu Pol. Tow. Geol., Sosnowiec, 22–24.IX.1994: 69–80.
HARAÑCZYK C., 1994b — Caledonian Kracovides (SW Poland) as atranspressional orogene [Eng. Sum.]. Prz. Geol., 11: 893–901.
HEFLIK W., 1982 — Utwory metamorficzne z pod³o¿a brze¿nej czêœciKarpat obszaru Cieszyn–Rzeszotary. [Metamorphic rocks from thebasement of the Carpathien marginal part, Cieszyn–Rzeszotary area; inPolish]. Przew. LIV Zjazdu Pol. Tow. Geol. Sosnowiec 23–25.IX.1982:210–213.
HEFLIK W., 1992 — Contact metamorphic rocks from the vicinity ofMyszków (Upper Silesia). Bull. Pol. Acad. Sci., 40, 1: 31–42.
HEFLIK W., MORYC W., MUSZYÑSKI M., 1992 — Lamprophyres of theSilesia-Cracow Region. Bull. Pol. Acad. Earth Sc., 40, 1: 23–28.
HEFLIK W., MUSZYÑSKI M., PIECZKA A., 1985 — Lamprophyres fromthe vicinities of Zawiercie [Eng. Sum.]. Kwart. Geol., 29, 3/4: 529–542.
HEFLIK W., PIEKARSKI K., 1989 — On trachyandesite from the vicinityof Myszków, South Poland [Eng. Sum.]. Geologia Kwart. AGH, 15, 4:107–116.
HEFLIK W., PARACHONIAK W., PIEKARSKI K., RATAJCZAK T.,RYSZKA J., 1975 — The petrography of the Old Palaeozoic rocks fromthe vicinity of Myszków (Upper Silesia) [Eng. Sum.]. Zesz. Nauk. AGH
Geologia, 1, 4: 35–43.HOLLISTER V. F., 1978 — Geology of the porphyry copper deposits of the
western hemisphere. New York, Society of Mining Engineers of theAmerican Institute of Mining, Metallurgical, and Petroleum Engineers:219 p.
References 83
HORTON D. J., 1978 — Porphyry-type copper-molybdenum mineralizationbelts in eastern Queensland, Australia. Econ. Geol., 73: 904–921.
JACHOWICZ M., 1995 — Opracowanie stratygrafii starszego paleozoikuna NE obrze¿eniu GZW w oparciu o badania mikropaleontologiczneAcritarcha. [Report on the research on the Old Palaeozoic stratigraphy ofthe NE margin of the USCB, based on the micropalaeontological studiesof Acritarcha; in Polish]. Arch. PIG, Sosnowiec.
JACOBS D. C., PARRY W. T., 1976 — A comparison of the geochemistryof biotite from some basin and range stocks. Econ. Geol., 71:1029–1035.
JANKOVIÆ S., 1980 — Ore-deposit types and major copper metallogenicunits in Europe. In: European copper deposits, Proceedings of an Inter-national Symposium held at Bor, Yugoslavia, 18–22 September 1979,Belgrade (eds. S. Jankoviæ, R. H. Sillitoe). Society for Geology Applied
to Mineral Deposits Special Publication, 1: 9–25. UNESCO Publica-tions.
JARMO£OWICZ-SZULC K., 1984 — Datowania metod¹ K-Ar ska³ NEobrze¿enia Górnoœl¹skiego Zag³êbia Wêglowego. [K-Ar datings ofrocks from NE margin of the Upper Silesian Coal Basin; in Polish].Sprawozdania z posiedzeñ naukowych Instytutu Geologicznego. Kwart.
Geol., 28, 3/4: 749–750.JARMO£OWICZ-SZULC K., 1985 — K-Ar datings of igneous rocks from
NE margin of the Upper Silesian Coal Basin [Eng. Sum.]. Kwart. Geol.,29, 2: 343–354.
JURKIEWICZ H., 1975 — The geological structure of the basement of theMezozoic in the central part of the Miechów Trough [Eng. Sum.]. Biul.
Inst. Geol., 283: 5–100.JUSKOWIAK O., 1971 — Petrologia kwaœnych ska³ magmowych z
pó³nocno-wschodniego obrze¿enia Górnoœl¹skiego Zag³êbia Wêglo-wego. Kwart. Geol., 15, 3: 705–706.
KALJU¯NYJ V. A., 1960 — Metody vyvæennja bagatofazovych vkljuæen’ umineralach. Kyiv AN URSR.
KARWOWSKI £., 1988 — Mineral-forming fluids of the Variscan Cu-por-phyry formation from the Myszków–Mrzyg³ód area of Cracovides [Eng.Sum.]. Pr. Nauk. UŒl., 929: 1–89.
KARWOWSKI £., 1989 — Badania temperaturowe metod¹ homogenizacjiwrostków w utworach ¿y³owych paleozoiku z rejonu Myszkowa iMrzyg³odu. [Temperature studies, using the homogenization methods,of the inclusions in Palaeozoic veins from the Myszków and Mrzyg³ódregions; in Polish]. Arch. PIG, Sosnowiec.
KIERSNOWSKI H., 1991 — Lithostratigraphy of the Permian north-west ofthe Upper Silesia Coal Basin — a new proposal [Eng. Sum.]. Prz. Geol.,39, 4: 198–203.
KOTAS A., 1982 — Zarys budowy geologicznej Górnoœl¹skiego Zag³êbiaWêglowego. [Scheme of the Upper Silesian Coal Basin geologicalstructure; in Polish]. Przew. LIV Zjazdu Pol. Tow. Geol., Sosnowiec
23–25.IX.1982: 45–72.KOTAS A., 1985 — Structural evolution of the Upper Silesian Coal Basin
(Poland). X Cong. Int. Strat. Geol. Carb., C. R., 3, Madrid: 459–469.KOZ£OWSKI A., 1981 — Melt inclusions in pyroclastic quartz from Car-
boniferous deposits of the Holy Cross Mts., and the problem of mag-matic corrosion. Acta Geol. Pol., 31, 3/4: 273–284.
KOZ£OWSKI A., KARWOWSKI £., 1972 — Physico-chemical conditionsof the drusy mineral crystallisation from Alam Kuh (Iran). Bull. Acad.
Pol. Sci., Ser. Sci. de la Terre, 20: 249–255.LASOÑ K., 1990 — Opracowanie metodyki geochemicznej oceny prognoz
mineralizacji polimetalicznej w pó³nocno-wschodnim obrze¿eniu GZW.[Preparation of the geochemical methodics for the assessment of thepolymetallic mineralisation prospect in the NE margin of the UpperSilesian Coal Basin; in Polish]. Arch. PIG, Sosnowiec.
LASOÑ K., 1992 — Zoning of polymetallic mineralisation in the Paleozoicfrom the Myszków region (NE margin of the Upper Silesian Coal Basin)[Eng. Sum.]. Arch. Miner., 48, 1/2: 43–59.
LAZNICKA P., 1976 — Porphyry copper and molybdenum deposits of theUSSR and their plate tectonic settings. Amer. Inst. Mining Metall. Petro-
leum Engineers Trans., 82: B14–B32.LE MAITRE R. W., 1984 — A proposal by the IUGS Subcommission on the
Systematics of igneous rocks for a chemical classification of volcanicrocks based on the total alkali-silica (TAS) diagram. Australian J., Earth
Sc., 31: 243–255.
LEUTWEIN F., 1978 — Tellurium. Parts 52B–52K; 52O. In: Handbook ofGeochemistry (ed. K. H. Wedepohl), v. II/4. Springer-Verlag, NewYork.
LOWELL J. D., GUILBERT J. M., 1970 — Lateral and vertical alteration —mineralisation zoning in porphyry ore deposits. Econ. Geol., 65: 373–406.
£YDKA K., 1973 — Late-Precambrian and Silurian in the Myszków area[Eng. Sum.]. Kwart. Geol., 17, 4: 700–712.
MARKIEWICZ J., 1989 — Charakterystyka petrograficzna ska³ magmo-wych. Dokumentacja geologiczna otworu wiertniczego Pz-31. [Petro-graphic characteristics of the magmatic rocks. Geological data from thePz-31 borehole; in Polish]. Arch. PIG, Sosnowiec.
MARKIEWICZ J., 1994 — Zró¿nicowanie kwaœnych ska³ magmowych wstrefach kontaktowych na podstawie wybranych profili otworów wiert-niczych rejonu Myszkowa–Mrzyg³odu. [Differentiation of the acidicmagmatic rocks within the contact zones, based on the chosen boreholesprofiles from Myszków–Mrzyg³ód region; in Polish]. Posiedz. Nauk.
PIG, 50, 2: 98–99.MARKIEWICZ J., 1995 — Petrografia strefy apikalnej granitoidów mrzy-
g³odzkich [Petrography of the Mrzyg³ód granitoides apical zone; in Pol-ish]. Arch. PIG, Warszawa.
MARKIEWICZ J., 1998 — Petrography of the apical zone of the Mrzyg³ódgranitoids [Eng. Sum.]. Biul. PIG, 382: 5–29.
MARKIEWICZ J., MARKOWIAK M., 1998 — Inwentaryzacja (kolekcjaska³ i baza danych) paleozoicznych ska³ krystalicznych i piroklas-tycznych regionu krakowsko-czêstochowskiego. [Catalogue of thePalaeozoic crystalline and pyroclastic rocks from Cracow-Czêstochowaregion; in Polish]. Arch. PIG, Warszawa.
MARKIEWICZ J., ŒLÓSARZ J., TRUSZEL M., 1993 — Pozycja geolo-giczna mineralizacji Cu-Mo-W w paleozoiku pó³nocno-wschodniegoobrze¿enia GZW. [Geological position of the Cu-Mo-W mineralisationin Palaeozoic of the NE margin of the USCB; in Polish]. Pr. Spec. Pol.
Tow. Mineral., 3: 47–54.MARKOWIAK M., HABRYN R., 1994 — Aktualne wyniki badañ geo-
chemicznej strefowoœci zmineralizowanych utworów paleozoicznychobszaru Myszkowa. [The latest results of the geochemical research onthe zoning of the Palaeozoic mineralised rocks from Myszków area; inPolish]. Arch. PIG, Sosnowiec.
MASAO M., MASAO G., MITSUO H., 1965 — The geologie developmentof the Japanese Islands. Tsukiji Shokan Co. Ltd., Tokyo.
MORYC W., HEFLIK W., 1998 — Metamorphic rocks in the basement ofthe Carpathians between Bielsko-Bia³a and Cracow. Geol. Quart., 42, 1:1–14.
MIYASHIRO A., 1973 — Metamorphism and metamorphic belts. GeorgeAllen & Unwin Ltd., London.
NARKIEWICZ M., 1978 — Stratigraphy and facies development of the Up-per Devonian in the Olkusz–Zawiercie area, Southern Poland [Eng.Sum.]. Acta Geol. Pol., 28, 4: 415–470.
NARKIEWICZ M., RACKI G., 1984 — Stratigraphy of the Devonian of theDêbnik Anticline [Eng. Sum.]. Kwart. Geol., 28, 3/4: 513–546.
NASH J. T., THEODORE T. G., 1971 — Ore fluids in a porphyry copper de-posit at Copper Canyon, Nevada. Econ. Geol., 66: 385–399.
NAUMOV V. B., MALININ S. D., 1968 — Novyj metod opredelenijadavlenija po gazovo-¿idkim vkluæenijam. Geochimija, 4: 432–441.
NEHRING-LEFELD M., MODLIÑSKI Z., SIEWNIAK-MADEJ A., 1992— Biostratigraphy of the Old Paleozoic carbonates in the Zawiercie area(NE margin of the Upper Silesian Coal Basin). Geol. Quart., 36, 2:171–198.
NEHRING-LEFELD M., SZYMAÑSKI B., 1998 — Ordovician stratigra-phy in the ¯arki-Myszków (NE margin of the Upper Silesian Coal Ba-sin). Geol. Quart., 42, 1: 29–40.
NIEÆ M., 1988 — Possibility of the ore deposits discovery within the olderPaleozoic rocks, NE margin of the USCB [Eng. Sum.]. Prz. Geol., 36, 7:390–395.
NIGGLI P., 1954 — Rocks and mineral deposits. In: M. Freeman and Com-pany. San Francisco.
PAJCHLOWA M., SIEWNIAK-MADEJ A., CHOROWSKA M., TRU-SZEL M., SOBOÑ-PODGÓRSKA J., 1983 — Dewon. W: Z³o¿a rudmetali na tle budowy geologicznej NE obrze¿enia GZW. Stratygrafia.cz. 1. [Devonian. In: Metal ores deposits with respect to geological struc-ture of the NE margin of the Upper Silesian Coal Basin. Stratigraphy,pt. 1; in Polish]. Arch. PIG, Sosnowiec.
84 References
PARRY W. T., 1972 — Chloride in biotite from basin and range plutons.Econ. Geol., 67: 972–975.
PASZKOWSKI M., 1988 — Basen dinantu w okolicach Krakowa — próbasyntezy. [Dinantian basin in the Cracow area: an attempt of a synthesis].Prz. Geol., 36: 200–207.
PAVLOVA I. G., ALEKSANDROV G. V., 1986 — Molybdenium. In:Kritierii prognoznoj ocienki tieritorij (ed. D. B. Rundkwist). Leningrad:295–316.
PETTIJOHN F. J., POTTER P. E., SIEVER R., 1972 — Sand and sandstone.Springer-Verlag, Berlin–Heidelberg–New York.
PIEKARSKI K., 1970 — Projekt wierceñ parametrycznych dla stworzeniapodstaw do poszukiwañ z³ó¿ surowców metalicznych w utworachstaropaleozoicznych pó³nocno-wschodniego obrze¿enia GZW. [Para-metric drillings programme, to prepare foundations for metallic depos-its prospecting in the Old Paleozoic rocks of the NE margin of theUpper Silesian Coal Basin; in Polish]. Arch. PIG, Sosnowiec.
PIEKARSKI K., 1971a — Perspektywy wystêpowania z³ó¿ miedziowo-mo-libdenowych w utworach staropaleozoicznych pó³nocno-wschodniegoobrze¿enia GZW. [Prospects of the copper-molybdenum deposits exis-tence in the Lower Palaeozoic formations of the NE margin of UpperSilesian Coal Basin; in Polish]. Sprawozdania z Posiedzeñ NaukowychInstytutu Geologicznego. Kwart. Geol., 15, 3: 710–711.
PIEKARSKI K., 1971b — Signs of mineralization in Silurian formations inthe “Lubliniec” borehole [Eng. Sum]. Rudy i Met. Nie¿., 4: 189–193.
PIEKARSKI K., 1982a — Molybdenum schists in the vicinities of Myszków[Eng. Sum.]. Prz. Geol. 30, 7: 335–340.
PIEKARSKI K., 1982b — Aktualny stan badañ okruszcowania paleozoikuNE obrze¿enia GZW. [The present status of the research on the Palaeo-zoic mineralisation in the NE margin of the USCB; in Polish]. Przew.
LIV Zjazdu Pol. Tow. Geol. Sosnowiec 23–25.IX.1982: 26–38.PIEKARSKI K., 1985 — Metallogenic and prognostic analysis of the
Palaeozoic sequence of the NE margin of the Upper Silesian Coal Basin[Eng. Sum.]. Rocz. Pol. Tow. Geol. (1983), 53, 1–4: 207–234.
PIEKARSKI K., 1988 — New data on ore mineralization in Late Paleozoicsediments of the Myszków–Mrzyg³ód area, northeastern margin of theUpper Silesian Coal Basin (USCB) [Eng. Sum.]. Prz. Geol., 36, 7:381–387.
PIEKARSKI K., 1995 — Geologic setting and ore mineralisation character-istics of the Myszków area (Poland). Geol. Quart., 39, 1: 31–42.
PIEKARSKI K., GAJOWIEC B., HABRYN R., KARWASIECKA M.,KURBIEL H., £USZCZKIEWICZ A., MARKIEWICZ J., MARKO-WIAK M., SIEMIÑSKI A., STÊPNIEWSKI M., TRUSZEL M., 1993— Dokumentacja geologiczna z³o¿a rud molibdenowo-wolframowo--miedziowych Myszków w kategorii C2 [Pre-feasibility study of theMyszków Mo-W-Cu ore deposit, in C2 category; in Polish]. Arch. PIG,Sosnowiec.
PIEKARSKI K., KURBIEL H., ŒLUSARZ J., 1979 — Projekt badañ geo-logiczno-z³o¿owych utworów staropaleozoicznych w obszarze Po-raj–Mrzyg³ód. [A geological-economic research programme on the OldPalaeozoic rocks from Poraj–Mrzyg³ód area; in Polish]. Arch. PIG,Sosnowiec.
PIEKARSKI K., MARKIEWICZ J., TRUSZEL M., 1982 — Lithological--petrographic characteristics of Ordovician strata in the Myszków–Mrzy-g³ód area [Eng. Sum.]. Prz. Geol., 30, 7: 340–347.
PIEKARSKI K., MIGASZEWSKI Z., 1993 — Old Paleozoic ore mineral-ization of the Myszków–Mrzyg³ód area (NE margin of the UpperSilesian Coal Basin). Geol. Quart., 37, 3: 385–396.
PIEKARSKI K., SIEWNIAK-WITRUK A., 1978 — On the occurrence ofOrdovician in the vicinities of Mrzyg³ód [Eng. Sum.]. Prz. Geol., 11:647–648.
PIEKARSKI K., SZYMAÑSKI B., 1982 — Stratigraphic position of theKotowice Beds [Eng. Sum.]. Prz. Geol., 7: 366–369.
PIEKARSKI K., SZYMAÑSKI B., WIELGOMAS L., 1985 — A new Ordo-vician stratigraphic reference point in the vicinities of Myszków [Eng.Summ.]. Prz. Geol., 33, 9: 501–503.
PIEKARSKI K., WIELGOMAS L., KURBIEL H., STACHURA A., 1987— Aneks do projektu badañ geologiczno-z³o¿owych utworów staro-paleozoicznych w obszarze Poraj–Mrzyg³ód, obejmuj¹cy prace po-szukiwawcze dla udokumentowania z³o¿a w kat. C2 rud molibdenu ipierwiastków towarzysz¹cych. [An annex to the exploration pro-gramme of the Mo and associated elements ore deposit in the Old
Palaeozoic rocks in Poraj–Mrzyg³ód area; in Polish]. Arch. PIG,Sosnowiec.
PODEMSKI M., CHAFFEE M. A., 1996 — Geochemical prospecting inareas of covered and concealed mineral deposits in Poland. Final reporton the project No MOS/USGS-92-95. Polish-American Maria Sk³o-dowska-Curie Fund II. Arch. PIG, Warszawa.
POKA£OW W. T., 1972 — Geneticzieskije tipy i poiskowyje kritieriiendogiennych miestoro¿dienij molibdiena. Moskwa: 3–270.
PO¯ARYSKI W., 1990 — The Middle Europe Caledonides — wrenchingorogen composed of terranes [Eng. Sum.]. Prz. Geol., 38, 1: 1–9.
PO¯ARYSKI W., BROCHWICZ-LEWIÑSKI W., TOMCZYK H., 1982 —On heterochroneity of the Teisseyre-Tornquist Line [Eng. Sum.]. Prz.
Geol., 30: 569–574.PO¯ARYSKI W., GROCHOLSKI A., TOMCZYK H., KARNKOWSKI P.,
MORYC W., 1992 — Mapa tektoniczna Polski w epoce waryscyjskiej.[The tectonic map of Poland in the Variscan epoch]. Prz. Geol., 40, 1:643–651.
PO¯ARYSKI W., KOTAÑSKI Z., 1979 — The tectonic development of thePolish part of East-European Platform Forefield in the Baikalian andCaledono-Variscan Epochs [Eng. Sum.]. Kwart. Geol., 23, 1: 7–20.
PO¯ARYSKI W., TOMCZYK H., 1968 — Assyntian orogen in SoutheastPoland. Biul. Inst. Geol., 237: 13–27.
PUCHELT H., 1978, — Barium, parts 56B–56O. In: Handbook of Geochem-istry (ed. K. H. Wedepohl), v. II/4. Springer-Verlag, New York.
PURDY C. P., Jr., 1954 — Molybdenum occurrences of Washington. State
of Washington Division of Mines and Geology Report of Investigations,18: 118 p.
REYNOLDS T. J., BEANE R. E., 1979 — The evolution of hydrothermalfluid characteristics through time at the Santa Rita, New Mexico; por-phyry copper deposit [abstr.]. Geol. Soc. America. Abstracts with Pro-
grams, 11: 502.ROEDDER E., 1971 — Fluid inclusion studies of the porphyry-type ore de-
posits at Bingham, Utah Butte, Montana and Climax, Colorado. Econ.
Geol., 66: 98–120.ROEDDER E., 1972 — Laboratory studies on inclusions in the minerals As-
cension Island granitic blocks and their petrologic significance. In: FluidInclusion Research. Proceedings of COFFI, 5.
DE LA ROCHE H., LETERRIER J., GRANDCLAUDE P., MARCHAL M.,1980 — A classification of volcanic and plutonic rocks using R1R2 - dia-gram and major — element analyses — its relationships with current no-menclature. Chem. Geol., 29, 3/4.
RYKA W., 1971 — Przejawy metamorfizmu regionalnego w pó³nocno--wschodnim obrze¿eniu GZW. [Forms of the regional metamor-phism in the NE margin of the Upper Silesian Coal Basin; in Polish].Spraw. z Pos. Nauk. Inst. Geol. Kwart. Geol., 15, 3: 706–707.
RYKA W., 1973 — Metamorphic rocks of the Caledonian basement in thevicinity of Zawiercie [Eng. Sum.]. Kwart. Geol., 17, 4: 667–682.
RYKA W., 1974 — Diabase-lamprophyre association on the north-east bor-der of the Upper Silesian Coal Basin [Eng. Sum.]. Biul. Inst. Geol., 278:35–70.
RYKA W., 1978 — Metamorphic rocks [Eng. Sum.]. Pr. Inst. Geol., 83:69–71.
RYKA W., 1987 — Klasyfikacja i nazewnictwo ska³ magmowych orazmateria³ów piroklastycznych. [Magmatic rocks and pyroclastic mate-rial classification and nomenclature; in Polish]. Instr. i Met. Bad. Geol.,48: 5–52.
RYKA W., MALISZEWSKA A., 1991 — S³ownik petrograficzny. [Petrog-raphy, a dictionary; in Polish]. Wyd. Geol., Warszawa.
SALAMON W., 1989 — Studium geochemiczno-mineralogiczne g³ównychminera³ów kruszcowych mineralizacji polimetalicznej w paleozoiku NEobrze¿enia GZW. [Geochemical-mineralogical study of the main oreminerals from polymetallic mineralisation in Palaeozoic of the north--eastern border of the Upper Silesian Coal Basin; in Polish]. Arch. PIG,Sosnowiec.
SANTOLIQUIDO P. M., EHMANN W. D., 1972 — Bismuth in stony mete-orites and standard rocks. Geochimica et Cosmochimica Acta, 36:897–902.
SIEDLECKI S., 1962 — On the occurrence of Silurian in the eastern andnorth-eastern periphery of the Upper Silesian Coal Basin. Bull. Acad.
Pol. Sci., 10: 41–46.
References 85
SIEWNIAK-MADEJ A., 1994 — A review of the conodont studies of the Pa-leozoic deposits of the NE border of the Upper Silesia Coal Basin (SWPoland) [Eng. Sum.]. Prz. Geol., 42, 8: 649–652.
SKORUPA J., 1953 — Magnetic survey in the area north-east of Krze-szowice [Eng. Sum.]. Biul. Pañstw. Inst. Geol., 13: 1–33.
SNEE L. W., SUTTER J. F., KELLY W. C., 1988 — Thermochronology ofeconomic mineral deposits: Dating the stages of mineralization atPanasqueira, Portugal, by high-precision 40Ar/39Ar age spectrum tech-niques on muscovite. Econ. Geol., 83: 335–354.
SPRY A., 1969 — Metamorphic textures. Pergamon Press. Oxford.SZE£ÊG E., 1997 — Warunki krystalizacji scheelitu w ska³ach pó³nocno-
-wschodniego obrze¿enia Górnoœl¹skiego Zag³êbia Wêglowego —rejon Myszkowa–Mrzyg³odu. [Scheelite crystallisation conditions inrocks from the NE margin of the Upper Silesian Coal Basin — Mysz-ków–Mrzyg³ód area; in Polish]. Arch. WNoZ UŒ, Sosnowiec.
SZYMAÑSKI B., NEHRING-LEFELD M., 1995 — Opracowanie osadówstarszego paleozoiku w pod³o¿u NE obrze¿enia GZW. [Report on thestudy of the Old Palaeozoic sediments from the basement of the NE mar-gin of the Upper Silesian Coal Basin; in Polish]. Arch. PIG, Warszawa.
SZYMAÑSKI B., TELLER L., 1998 — The Silurian stratigraphy of theZawiercie–¯arki area (NE margin of the Upper Silesian Coal Basin).Kwart. Geol., 42, 2: 183–299.
ŒL¥CZKA A., 1976 — Nowe dane o budowie pod³o¿a Karpat na po³udnieod Wadowic. Rocz. Pol. Tow. Geol., 46, 3: 337–350.
ŒL¥CZKA A., 1982 — Profil utworów kambru w otworach po³o¿onych napo³udniowy wschód od Gocza³kowic. [Cambrian sediments profile inthe boreholes located south-east from Gocza³kowice; in Polish]. Przew.
LIV Zjazdu Pol. Tow. Geol. Sosnowiec 23–25.IX.1982: 201–205.ŒLÓSARZ J., 1982 — Some remarks on geological setting of copper-molyb-
denum mineralization in the Paleozoic in the vicinities of Myszków[Eng. Sum.]. Prz. Geol., 30, 7: 329–335.
ŒLÓSARZ J., 1985 — Stages and zonality of ore mineralisation in Palaeo-zoic rocks of the environs of Myszków [Eng. Sum.]. Ann. Soc. Geol.
Pol., 53, 1–4: 267–288.ŒLÓSARZ J., 1988 — Symptoms of tungsten mineralization in Paleozoic
sediments, northeastern margin of USCB [Eng. Sum.]. Prz. Geol., 36, 7:387–390.
ŒLÓSARZ, J., 1993 — The main paragenetic stages for molybdenum miner-alisation in the Palaeozoic rocks of the Myszków area and their impor-tance to the formation of the ore deposits of that area [Eng. Sum.]. Pol.
Tow. Mineral., Pr. Spec., 3: 123–128.ŒLÓSARZ J., KARWOWSKI £., 1981 — Fizyczno-chemiczne warunki
mineralizacji polimetalicznej w utworach paleozoicznych rejonu Mysz-kowa (NE obrze¿enie GZW). [Physico-chemical conditions of the poly-metallic mineralisation in the Palaeozoic rocks in Myszków area (NEmargin of the USCB); in Polish]. In: Procesy pomagmowe w ska³achplutonicznych i wulkanicznych. Streszczenia referatów sesji naukowej,Warszawa, 16–17 paŸdziernika 1981: 14–15.
ŒLÓSARZ J., KARWOWSKI £., 1982 — Polymetallic mineralisation inPalaeozoic rocks of Myszków area, Poland (genesis and zonation). In:Genesis of ore deposits. Abstracts of the 6 IAGOD Symposium, Tbilisi
1982: 203–204.ŒLÓSARZ J., KARWOWSKI £., 1983 — Physico-chemical conditions of
polymetallic mineralisation in the Paleozoic formations of the Myszkówregion (NE border zone of the Upper Silesian Coal Basin) [Eng. Sum.].Arch. Mineral., 39, 1: 93–108.
ŒLÓSARZ J., MARKIEWICZ J., TRUSZEL M., 1995 — Uzupe³niaj¹cebadania petrograficzne i mineralogiczne ska³ paleozoicznych rej.Myszkowa. [Supplementary petrographic and mineralogical studies ofthe Palaeozoic rocks from Myszków area; in Polish]. Arch. PIG,Sosnowiec.
ŒLÓSARZ J., TRUSZEL M., 1997 — Skarny i metasomatyty towarzysz¹cemineralizacji kruszcowej, formacji porfirowej w paleozoiku w rejonieMyszkowa. [Skarns and metasomatites associated with ore mineralisa-tion in porphyry formation from Myszków area; in Polish]. Arch. PIG,Sosnowiec.
TAYLOR S. R., 1964 — Abundance of chemical elements in the continentalcrust: a new table. Geochimica et Cosmochimica Acta, 28: 1273–1285.
TAYLOR S. R., 1969 — Trace element chemistry of andesites and associ-ated calc-alkaline rocks. In: Proceedings of the andesite conference (ed.A R. McBirney). Oregon Department of Geology and Mineral Re-
sources Bulletin, 65: 43–63.
TAYLOR S. R., McLENNAN S. M., 1995 — The geochemical evolution ofthe continental crust. Reviews of Geophysics, 33, 2: 241–265.
THEODORE T. G., MENZIE W. D., 1984 — Fluorine-deficient porphyrymolybdenum deposits in the western North America Cordillera. Pro-
ceedings of the Sixth Quadrennial IAGOD Symposium, Tbilisi, USSR. E.Schweizerbart’sche Verlagsbuchhandlung. Stuttgart.
TITLEY R. S., BEANE R. E., 1984 — Medno-porfirowye mestoro�denija.È.I: Geologièeskaja pozicija, petrologija i tektogenez. In: Genezis rud-nych mestoro�denij. Mir, Moskva (transl. from Economic Geology Sev-
enty-fifth Anniversary Volume 1905–1980).TOMCZYK H., TOMCZYKOWA E., 1983 — Sylur. W: Z³o¿a rud metali na
tle budowy geologicznej NE obrze¿enia GZW. Stratygrafia. cz. 1. [Silu-rian. In: Metal ores deposits with respect to geological structure of theNE margin of the Upper Silesian Coal Basin. Stratigraphy, pt. 1; in Pol-ish]. Arch. PIG, Warszawa.
TRUSZEL M., 1994 — Charakterystyka petrograficzna ska³ metamorficz-nych z rejonu Myszkowa i Mrzyg³odu. Przew. LXV Zjazdu PTG,Sosnowiec 1994: 187–191.
TUREKIAN K. K., WEDEPOHL K. H., 1961 — Distribution of the ele-ments in some major units of the earth’s crust. Geological Society of
America Bulletin, 72: 175–192.VERNON R. H., 1976 — Metamorphic processes, reactions and micro-
structure development. George Allen & Unwin Ltd., London.WEDEPOHL K. H., 1978 — Manganese. Parts 25B–25O. In: Handbook of
Geochemistry (ed. K. H. Wedepohl), v. II/3. Springer-Verlag, NewYork.
WHITE W. H., BOOKSTROM A. A., KAMILLI R. J., GANSTER M. W.,SMITH R. P., RANTA D. E., STEININGER R. C., 1981 — Characterand origin of Climax type molybdenum deposits. Econ. Geol, 75
thAnni-
versary Volume, Economic Geology Publishing Company: 270–316.WIELGOMAS L., GAJEWSKI Z., CIEMNIEWSKA M., DANIEC J.,
DYMOWSKI W., KACPRZAK R., KERBER B., KURBIEL H., SIE-MIÑSKI A., STACHURA A., SUFFCZYÑSKI S., SZATKOW-SKI K., ZIÊTEK-KRUSZEWSKA A., BEDNARSKI J., KISIEL P.,MOLENDZKA J., OLESIÑSKA T., PAWLIK A., 1986 — Doku-mentacja geologiczna rejonu ¯arki Zachód w pó³nocnej czêœci obszaruœl¹sko-krakowskiego. [Geological report on the ¯arki West area, north-ern part of the Silesia-Cracow region; in Polish]. Arch. PIG, Warszawa.
WIELGOMAS L., CIEMNIEWSKA M., DANIEC J., DYMOWSKI W.,GAJEWSKI Z., KACPRZAK R., KERBER B., KURBIEL H., LISIA-KIEWICZ S., SUFFCZYÑSKI S., SZATKOWSKI K., ZIÊTEK--KRUSZEWSKA A., BEDNARSKI J., KISIEL P., MOLENDZKA J.,OLESIÑSKA T., PAWLIK A., 1988 — Dokumentacja geologiczno--surowcowa wyników poszukiwañ z³ó¿ rud cynku i o³owiu w rejonieWinowno–Bêdusz. [Geological and economic-geological report on theZn-Pb deposits prospecting results, Winowno–Bêdusz area; in Polish].Arch. PIG, Warszawa.
WIESER T., 1957 — Petrographic characteristics of albitophyres, porphy-ries and diabases from Mrzyg³ód near Zawiercie [Eng. Sum.]. Kwart.
Geol., 1, 1: 113–126.WILSON J. W. J., KESLER S. E., CLOKE P. L., KELLY W. C., 1980 —
Fluid inclusion geochemistry of the Granisle and Bell porphyry copperdeposits, British Columbia. Econ. Geol., 75: 45–61.
WIMMENAUER W., 1973 — Lamprophyre, semilamprophyre und anchi-basaltische Ganggesteine. Fortschr. Miner., 51: 3–67.
WINKLER H. G. F., 1967 — Petrogenesis of metamorphic rocks. Springer--Verlag, New York.
WOJNAR B., 1985 — Charakterystyka tektoniczna utworów paleozoicz-nych. W: Dokumentacja geologiczno-wynikowa otworu wiertniczegoPz-17 Myszków. [Tectonic characteristics of the Palaeozoic rocks. In:Report on the geological results of the Pz-17 Myszków borehole; in Pol-ish]. Arch. PIG, Sosnowiec.
WOJNAR B., 1989 — Charakterystyka tektoniczna utworów paleozoicz-nych. W: Dokumentacja geologiczno-wynikowa otworu wiertniczegoPz-31 Myszków. [Tectonic characteristics of the Palaeozoic rocks. In:Report on the geological results of the Pz-31 Myszków borehole; in Pol-ish]. Arch. PIG, Sosnowiec.
ZHARIKOV V. A., 1970 — Skarns. Internat. Geology Rev., 12: 541–559,619–647, 760–775.
ZNOSKO J., 1964 — On the necessity of deeper drilling in the apical partof the Mrzyg³ód Batolith [Eng. Sum.]. Kwart. Geol., 3, 8: 465–475.
86 References
ZNOSKO J., 1965 — Tectonic position of the Silesia-Cracow Coal Basin[Eng. Sum.]. Biul. Inst. Geol., 188: 73–102.
ZNOSKO J., 1983 — Tectonics of southern part of Middle Poland (beyondthe Carpathians) [Eng. Sum.]. Kwart. Geol., 27, 3: 457–470.
ZNOSKO J., 1996 — The tectonic outline of the Holy Cross Mountains. Bull.
Pol. Acad. Sc.: Earth Sc., 44: 51–65.¯ABA J., 1994 — Mesoscopic flower structures in the Lower Paleozoic de-
posits of the NE border of the Upper Silesia Coal Basin — a result of thetranspresional shearing in the Kraków–Mrzyg³ód (Hamburg–Kraków)dislocation zone (SW Poland) [Eng. Sum.]. Prz. Geol., 42: 643–648.
¯ABA J., 1995 — Tectonic activity of the Kraków–Lubliniec (Ham-burg–Kraków) fault zone at the boundary of Upper Silesia and Ma³o-polska massifs (S Poland). Europ. Coal Conf. 95, June 26–July 1, 1995,
Abstr., Prague: 91.¯ABA J., 1996a — Late Carboniferous strike slip activity at the boundary
zone of Upper Silesia and Ma³opolska blocks (southern Poland) Eng.Sum.]. Prz. Geol., 44: 173–180.
¯ABA J., 1996b — G³ówne etapy ewolucji strukturalnej utworów paleo-zoicznych w brze¿nej czêœci bloku ma³opolskiego (NE obrze¿enie
GZW). [The main stages of the Palaeozoic rocks structural evolution inthe marginal part of the Ma³opolska block (NE margin of the USCB); inPolish]. In: Tektonika i rozwój budowy geologicznej pó³nocnej czê-œci GZW oraz strefy fa³dowej Kraków–Lubliniec. Mat. Konf. Nauk.,Siewierz, 08–09.11.1996. UŒ., Sosnowiec: 43–55.
¯ABA J., 1997a — G³ówne etapy ewolucji strukturalnej utworów paleo-zoicznych w brze¿nej czêœci bloku ma³opolskiego (NE obrze¿enieGZW). [The main stages of the Palaeozoic rocks structural evolution inthe marginal part of the Ma³opolska block (NE margin of the USCB); inPolish]. Tech. Posz. Geol., Geosyn. Geoterm., 1/2: 31–42.
¯ABA J., 1997b — Ewolucja strukturalna utworów paleozoicznych NEobrze¿enia GZW (na podstawie materia³ów wiertniczych). [Structuralevolution of the Palaeozoic rocks in the NE margin of the USCB (basedon the boreholes cores); in Polish]. Raport koñcowy z realizacji Projektu
Badawczego Komitetu Badañ Naukowych, nr 6 P04D 011 08. Arch.KBN, Warszawa.
¯ABA J., 1999 — The structural evolution of lower Palaeozoic succession inthe Upper Silesia Block and Ma³opolska Block border zone (southernPoland) [Eng. Sum.]. Pr. Pañstw. Inst. Geol., 166: 1–162.
References 87