Embed Size (px)
Citation preview

Physics of the Earth and Planetary Interiors 133 (2002) 127–146
Palaeomagnetic study of Oligocene (24–30 Ma) lava flows fromthe Kerguelen Archipelago (southern Indian Ocean):
directional analysis and magnetostratigraphy
G. Pleniera, P. Campsa,∗, B. Henryb, K. Nicolaysenca Laboratoire Géophysique, Tectonique et Sédimentologie, CNRS and ISTEEM, Université Montpellier 2 case 060,
34095 Montpellier Cedex 05, Franceb Laboratoire Géomagnétisme et Paléomagnétisme, CNRS and IPGP, Paris, France
c Department of Geology, Kansas State University, Manhattan, KS 66506, USA
Received 15 February 2000; received in revised form 14 May 2001; accepted 10 July 2002
Abstract
We report palaeomagnetic determinations in order to estimate the palaeosecular variation of the geomagnetic field forthe upper Oligocene period from a southern site. We measured the anisotropy of magnetic susceptibility (AMS) of basaltsfrom five sections to check the reliability of applying tectonic correction and concluded that no stratigraphic correctionswere needed. A positive reversal test implies that secondary components were sufficiently removed from the characteristicremanent magnetization. Also, the sampling was sufficiently random to accurately reflect upper Oligocene palaeosecularvariation. Calculations of the between-flow angular standard deviation (SB) from the geographic pole show values between21.2 and 21.8◦. This palaeosecular variation estimate agrees with Model G for palaeosecular variation [J. Geophys. Res.96 (B3) (1991) 3923], which is axisymmetric and assumes an equatorial symmetry of the geomagnetic field. The virtualgeomagnetic poles (VGPs) from the Mont des Ruches section seem to exhibit two polarity changes: reverse–normal (R–N)first, and in more detail a second normal–reverse (N–R) one. Finally, assuming that no polarity chrons are missed by any ofthe sections, we compare the magnetostratigraphy we defined to the global geomagnetic polarity scale of [Geophys. J. Int.129 (1) (1997) 176] using previously obtained radiometric dates to correlate the sections [J. Petrol. 39 (4) (1998) 711; EarthPlanet. Sci. Lett. 174 (2000) 313; J. Petrol. 43 (7) (2002) 1341]. The precise age constraints furnished by these correlationsallow an estimation of eruption rates from 0.30 to at least 1.31 km/my, with wide variations from section to section and anincrease of eruption rate for younger sections. However, due to the non-uniqueness of the correlations, the age limits of thesections and consequently the extrusion rate estimations can vary. Moreover, assuming the Mont des Ruches section that hasprobably recorded all the magnetic polarity intervals, the Mont de la Rabouillère and Mont de la Tourmente intermediateVGP directions may indicate unrecorded polarity chrons. The eruption rates calculated can thus be overestimated.© 2002 Elsevier Science B.V. All rights reserved.
Keywords:Oligocene palaeosecular variation; Anisotropy of magnetic susceptibility; Virtual geomagnetic poles
∗ Corresponding author. Tel.:+33-467-14-3938;fax: +33-467-52-3908.E-mail address:[email protected] (P. Camps).
1. Introduction
Because there is no way to observe the composi-tion and dynamics of the Earth’s core directly, oneindirect method is to study the Earth’s magnetic field
0031-9201/02/$ – see front matter © 2002 Elsevier Science B.V. All rights reserved.PII: S0031-9201(02)00089-4

128 G. Plenier et al. / Physics of the Earth and Planetary Interiors 133 (2002) 127–146
fluctuations recorded or observed at the Earth’s sur-face. These fluctuations, which include secular varia-tion, reversals, and excursions, are principally relatedto the fluid dynamics of the outer core. An accurateunderstanding of core dynamics can be obtained bythe use of geomagnetic field modeling (seeDormyet al. (2000)for a review). However, these simula-tions require more experimental constraints to definethe robust characteristics of the Earth’s magneticfield against which they can be tested. Thus, numer-ous records more or less uniformally distributed atthe Earth’s surface for consecutive time windows onthe geological time scale are needed(Merrill andMcFadden, 1999). Unfortunately, owing to thenon-uniform distribution of the continents, a samplingbias between the northern and southern hemisphere,particularly at high latitudes, affects the palaeo-magnetic data currently available. Only few studiespresent volcanic sequences located in the southernhemisphere. A question that arises is whether themain palaeomagnetic field is equatorially symmetric,as used for some models of palaeosecular variation
Fig. 1. (A) Locations of sampled sections: (1) Mont des Ruches: 18 flows, (2) Mont des Tempetes: 20 flows, (3) Mont de la Rabouillere: 19flows, (4) Mont de la Tourmente: 33 flows and (5) Mont Amery: 8 flows. (B) Location of the Kerguelen Archipelago in the Indian Ocean.
(McFadden et al., 1991), or whether it is more com-plicated as currently observed.
This report presents a palaeomagnetic study car-ried out on samples from five stratigraphic sections ofOligocene lava flows from the Kerguelen Archipelago(49.9◦S, 70◦E). Our objectives were to add new mag-netic data in a poorly defined area, to prospect forflows recording transitions, and to check the sym-metry of the geomagnetic field between the northernand southern hemisphere. Finally, by comparing themagnetostratigraphy of the five studied sections withprevious geochemical studies and geochronologicaldating (Gautier et al., 1990; Nicolaysen et al., 2000;Frey et al., 2000; Doucet et al., 2002), we discuss thecorrelation between disparate stratigraphic sectionsand more precisely constrain calculated eruption rates.
2. Geological setting
The Kerguelen Archipelago is located in the south-ern Indian Ocean (49.9◦S, 70◦E) on the northern

G. Plenier et al. / Physics of the Earth and Planetary Interiors 133 (2002) 127–146 129
part of the Kerguelen–Gaussberg Plateau (Fig. 1).This large oceanic plateau, with its conjugate Bro-ken Ridge, is a manifestation of intensive Cretaceous(119–95 Ma) volcanism due to the Kerguelen hotspot(Duncan, 2002and references therein). The Kergue-len Archipelago represents the continuation of thishotspot volcanism for the last 30 Ma(Yang et al.,1998; Weis et al., 1998; Nicolaysen et al., 2000), butsome magmatic contribution from the Southeast In-dian Ridge (SEIR) during the early Cenozoic is notexcluded(Doucet et al., 2002). More than 85% of theArchipelago is composed of basalt flows which formvalley walls (400–900 m high) exposed by glacialerosion. Intrusions (gabbro, granite, and syenite) from1 to 15 km diameter also occur. Isotopic chemistrylinks the origin of the plutons to Kerguelen plumemelts(Giret, 1990; Weis and Giret, 1994).
3. Palaeomagnetic sampling
In recent geochemical study of seven volcanic sec-tions located principally in the northern part of theKerguelen Archipelago,Nicolaysen et al. (2000)andDoucet et al. (2002)determined40Ar/39Ar isochronages on acid leached groundmass. To benefit fromthese available dates, the strategy was to samplethe same sections. Then, we looked for the thickeststudied sections, recovering the maximum number ofsuccessive and minimally-altered lava flows. We alsosearched for sampling areas not affected by significanttectonism or by subsequent intrusions. Based on geo-logic, geochemical, and logistical criteria, we decidedto target the five sections presented inFig. 1. In addi-tion to a previous palaeomagnetic study (Camps et al.,in preparation), this allowed us to completely samplethe Oligocene basalts exposed on the Archipelago.Except for the Mont de la Tourmente section, we wereunable to sample the previously-dated sections in ex-actly the same locations. For the Mont des Ruchessection, syenite and dyke intrusions close to the orig-inal geochimical section led us to sample the oppo-site valley wall (800 m westward), assuming the twosections are correlated. For the Mont des Tempetessection, we were not able to cross a major river toreach the 3 km distant Mont Fontaine section. Hereagain, we sampled the opposite valley wall assum-ing the lavas correlate between the two sections. For
the Mont Rabouillère section, we preferred to take anearby section (400 m away) which was less alteredand undisturbed by dykes. In this case, there is nodoubt of the lateral continuity between the two sec-tions. Finally, for the Mont Amery section, we choseto continue the previous magnetic sampling ofHenryand Plessard (1997), starting at the next flow upward,rather than to resample the dated Mont Crozier section(about 2 km away) which is more difficult to reach.
In all, almost a hundred lava flows with sevensamples per flow on average were drilled using agas-powered drill, and the samples were oriented withboth solar sightings and magnetic compass plus a cli-nometer. Because of the particular field trip conditionsencountered on Kerguelen, the possibility to return tothe same place is always uncertain. For this reason,we decided to sample each successive lava flow, inorder to recover any existing magnetic transitionaldirections.
4. Rock magnetic properties
4.1. Low-field susceptibility versus temperature
4.1.1. Experimental procedureWe performed continuous measurements of the
low-field (100�T) magnetic susceptibility versustemperature (KT curves) during heating and coolingcycles to characterize the magnetic mineralogy ofsamples and to estimate their thermal stability. Weused the method ofPrévot et al. (1983)to estimatethe mean Curie temperature of magnetic minerals re-vealed by a reversible fall in theKT curves. The mea-surements were performed in vacuum (<10−2 mbar)using a modified Bartington susceptibility meter MS2associated to a home made furnace. The rock sam-ple is a cylindrical core of≈1 cm3. One sample perflow for the Mont des Ruches, Mont des Tempetesand Mont Rabouillère sections was heated to itsCurie temperature with a heating and cooling rate of7◦/min. Unfortunately, some technical problems didnot permit analysis of all the flows, but the shape ofthe curves we obtained are independent of the cor-responding section. The two treated flows from theMont de la Tourmente section make us confident toexpect that the two remaining sections will qualita-tively provide similar results.

130 G. Plenier et al. / Physics of the Earth and Planetary Interiors 133 (2002) 127–146
Fig. 2. Low-field susceptibility versus temperature curves displaying the two typical behaviours observed for the Kerguelen basalts. Bold(dashed) lines correspond to heating (cooling) phases.
4.1.2. Results and interpretationThe primary magnetic carrier is presumed to be
a titanomagnetite (Fe3−xTixO4) with an x value of0.6–0.7 as generally expected for basaltic lava flows.Two distinct types ofKT behaviour were observed.The first case, sample 123C inFig. 2 illustrates theirreversible and complex thermomagnetic behaviourobserved for almost 60% of the samples. This samplepresents three susceptibility falls at≈100–150◦C, near350◦C and finally around 400◦C. We suggest that thefirst susceptibility decrease corresponds to the originaltitanomagnetites. However, titanomagnetites are sup-posed to stay stable during heating under vacuum andshould be observed in the cooling curve. Therefore,it is not excluded that the first fall indicate slightlyoxidized titanomaghemites, resulting from low tem-perature oxydation of the original titanomagnetites.Heating–cooling cycles at various intermediate tem-peratures performed on some other specimens lead usto interpret the second fall as due to the presence of
titanomaghemites with higher degree of oxidation ordifferent mineral size but also at the same time to dis-sociation effects of the metastable titanomaghemitespresent in the sample. Because inversion of ti-tanomaghemites is an irreversible phenomenon, thethird susceptibility fall might not exist before heatingin the laboratory. Titanomaghemites are known toinvert in two stages during heating–cooling cycles,with a first unstable inversion product which producesthe third susceptibility decrease near 400◦C, and afinal stable inversion product which depends on thedegree of oxidation of the starting titanomaghemite(Özdemir, 1987). These final products usually con-sist of a titanomagnetite–ilmenite assemblage, orhaematite and pseudobrookite for the most highly ox-idized titanomaghemite(Özdemir, 1987). No matterwhich is the degree of oxidation because as it is oftenobserved, haematite is reduced under vacuum to yielda Ti-poor titanomagnetite (∼400◦C). In case of totaloxidation, the susceptibility measured during cooling

G. Plenier et al. / Physics of the Earth and Planetary Interiors 133 (2002) 127–146 131
might only reflect this titanomagnetite. Thus, what-ever the degree of oxidation considered, the shoulderin the susceptibility curve observed during coolingmight relate the presence of a stable titanomagnetitewith a 460± 25◦C Curie temperature. All samplesshowing this complex behaviour yield qualitativelythe sameKT-curve with some differences due prob-ably to varying degrees of oxidation of the originaltitanomaghemite.
For the second case, sample 228D inFig. 2, the re-versibility of the curve indicates that the primary min-eral phase is a non-maghemitized titanomagnetite witha mean Curie temperature of 560±15◦C. This low-Tititanomagnetite quite probably results from high tem-perature oxyexsolution during the flow emplacementof the original titanomagnetite.
Unfortunately, the two behaviours describe abovecannot be related to macroscopic flow characteristicsas for example, the flow thickness, the color of thesamples or the presence of phenocrysts. Thus, a com-plete study of each flow is needed to detect the ther-mally stable second case which could correspond tosamples well suited for palaeointensity determinations(Plenier et al., in preparation).
4.2. Viscosity index
4.2.1. Experimental procedureBefore magnetic cleaning, the viscosity indexν
(Thellier and Thellier, 1944; Prévot, 1981)was firstdetermined on the entire collection in order to estimatethe viscous remanent magnetization (VRM) possiblyacquired by the samples since the beginning of theBrunhes polarity epoch. We measured the specimensafter 2 weeks in the ambient magnetic field orientedalong thez core axis and again, after 2 weeks storagein a zero field. The difference between these two mea-surements yield the VRM acquired during 15 days inthe present geomagnetic field(Thellier and Thellier,1944). We calculate the viscosity indexν using
ν = ∆z√x2
0 + y20 + z2
0
× 100
where ∆z represents the difference in the magne-tization intensity parallel to the magnetizing fieldbetween the two measurements, andx0, y0 and z0represent the cartesian components in core coordinate
of the magnetization after 2 weeks storage in afield-free space. The viscosity index, expressed asa percentage, corresponds approximately to 25% ofthe VRM acquired in situ since the last reversal ofpolarity (780 kyr)(Prévot, 1981).
4.2.2. Results and interpretationsThe mean geometric viscosity indices (ν) for each
flow are reported inTable 1. Calculated for the wholecollection,νall is relatively high (10.3%) compared tothe mean value of 6.1% for subaerial volcanic rocksfound byPrévot (1981). Only 33% of the specimenshave a viscosity index<5 or <10% for intermediatepolarity. Surprisingly, the mean geometric viscosityindex calculated for the reverse polarity units alone(νR) is lower than for normal ones (νN), 5.8 and 16.4%respectively, which contradicts normal expectations(Prévot, 1981).
However, the high normal polarityνN indices andthe difference inν values for normal and reverse polar-ity flows are due to the Mont de la Tourmente sectiononly. As observed inFig. 3A, the four other localitiespresent more expected values ofν, with more than50% of the samples displaying a viscosity index lowerthan 10%. For the Mont de la Tourmente section, only20% of the samples display a similarν value. More-over, we can observe that almost 15% of the samplesfrom this section present viscosity indices greater than100%.Fig. 3B and C illustrate that these huge valuesare associated to samples providing low magnetiza-tion intensity, after two weeks storage in a shieldedroom, combined with larger viscous component, after15 days under the present geomagnetic field.
The particular behaviour of the Mont de la Tour-mente samples is quite difficult to explain. Accordingto Prévot (1981), VRMs in basalts can arise in twoways. VRMs hard with respect to alternating fields(AFs) demagnetization are carried by single domainmagnetite grains with sizes near the superparamag-netism threshold, resulting from high-temperatureoxidation of originally homogeneous titanomagnetite.AF-soft VRMs are carried by multidomain grainsof low Curie point homogeneous titanomagnetite.Because the ratio of VRM on the total remanent mag-netization is supposed to increase with the grain sizeof magnetic mineral, our results may indicate a largermagnetic grain size for the Mont de la Tourmente lavaflows than for classical subaerial lavas. As already

132 G. Plenier et al. / Physics of the Earth and Planetary Interiors 133 (2002) 127–146
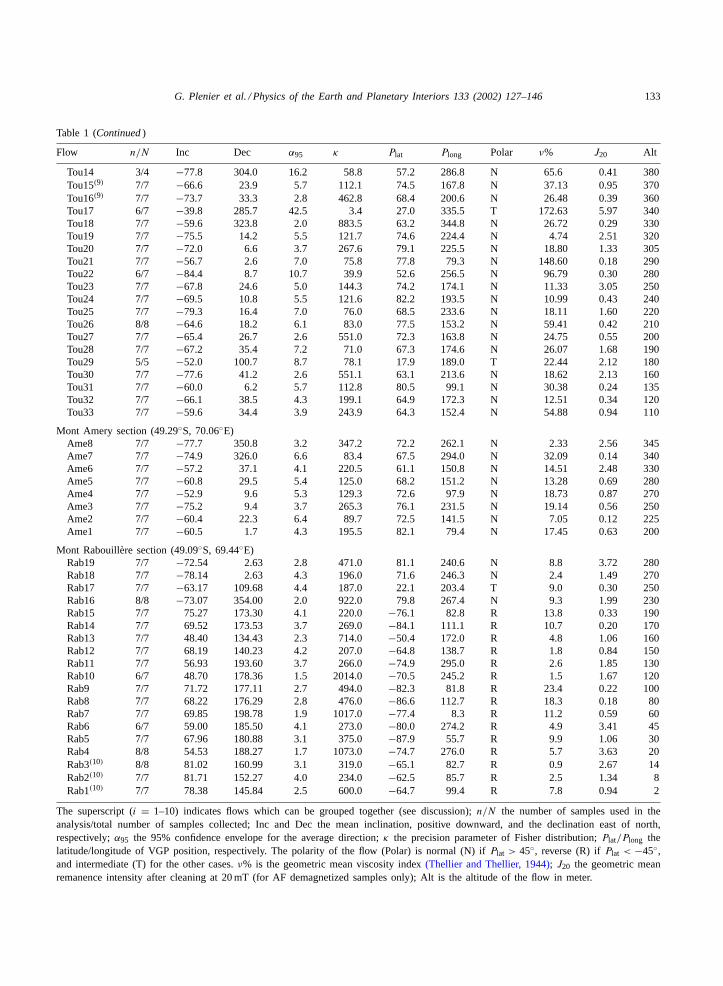
Table 1Cleaned average directions of magnetization of the lava flows
Flow n/N Inc Dec α95 κ Plat Plong Polar ν% J20 Alt
Mont des Ruches section (48.87◦S, 68.91◦E)Ruc18 7/7 72.7 175.7 4.3 197.7 −80.5 82.8 R 9.13 0.37 230Ruc17 7/7 65.6 192.6 5.6 116.4 −81.6 336.2 R 9.85 0.53 220Ruc16 4/4 79.9 183.3 6.5 201.6 −68.4 65.9 R 2.48 0.50 180Ruc15(1) 7/7 74.5 159.2 3.9 244.8 −73.1 105.3 R 4.6 1.17 160Ruc14(1) 7/7 76.4 149.5 4.5 183.8 −67.7 104.5 R 5.8 1.15 150Ruc13 7/7 64.0 237.6 11.1 30.5 −51.8 356.7 R 32.45 0.33 140Ruc12 7/7 64.0 69.4 6.0 102.3 −22.2 113.8 T 65.81 0.45 120Ruc11 7/7 81.3 144.1 8.0 58.2 −61.2 89.8 R 0.23 1.73 100Ruc10 7/7 78.3 92.7 5.3 130.5 −45.1 101.7 R 1.25 1.08 90Ruc9 11/11 −14.4 15.0 8.1 32.4 46.6 90.8 N 35.88 1.10 85Ruc8 8/8 −60.8 15.9 2.5 474.4 76.8 132.5 N 17.11 0.59 80Ruc7 6/7 −62.0 345.1 4.9 188.2 78.3 1.9 N 21.2 0.85 70Ruc6(2) 8/8 −68.7 358.2 4.1 180.1 86.6 268.0 N 2.57 3.69 60Ruc5(2) 7/7 −59.1 0.6 13.1 22.2 81.0 71.9 N 9.36 1.80 55Ruc4(2) 7/7 −66.2 10.1 5.5 120.6 83.3 160.3 N 4.45 2.92 50Ruc3(2) 8/8 −70.6 356.6 3.9 203.2 83.7 267.0 N 4.28 5.37 40Ruc2 7/7 −60.9 58.2 3.3 329.2 49.6 171.8 N 5.21 1.08 25Ruc1 8/8 52.5 195.1 5.3 108.6 −70.6 290.0 R 4.11 1.28 10
Mont des Tempetes section (48.88◦S, 69.11◦E)Tem20 7/8 67.4 165.3 5.1 139.9 −80.4 145.5 R 25.52 0.16 246Tem19 6/7 73.4 142.8 7.2 88.1 −66.2 119.3 R 72.64. 0.20 224Tem18 8/8 60.7 177.0 3.5 248.7 −82.5 231.6 R 2.73 9.47 172Tem17 7/7 62.0 186.0 4.0 224.8 −83.0 287.7 R 3.36 13.40 160Tem16 5/7 64.2 178.1 4.2 328.6 −86.8 224.6 R 5.57 3.62 152Tem15(3) 4/4 64.5 188.1 2.8 1109.8 −84.0 317.3 R 4.04 5.80 145Tem14(3) 7/7 57.1 190.3 7.9 59.3 −76.6 286.6 R 2.06 15.10 140Tem13 7/7 55.5 180.5 5.0 146.0 −77.2 250.9 R 2.99 1.76 130Tem12(4) 7/7 59.8 175.0 5.2 136.0 −81.1 223.9 R 10.48 1.23 120Tem11(4) 7/7 58.5 185.1 4.3 199.5 −79.7 271.7 R 3.91 0.45 110Tem10(4) 7/7 60.6 188.0 7.0 75.6 −80.8 289.7 R 2.56 0.75 105Tem9 7/7 58.7 186.7 7.2 70.5 −79.4 278.5 R 11.64 0.47 100Tem8 6/7 88.4 106.2 4.1 269.4 −49.7 73.9 R 47.41 0.17 90Tem7(5) 7/7 77.3 219.9 4.3 193.6 −63.4 33.1 R 5.28 0.22 80Tem6(5) 5/5 77.1 221.2 2.4 979.6 −63.0 31.9 R 4.94 0.53 75Tem5 5/5 80.9 251.2 4.4 308.3 −51.5 41.5 R 5.93 0.39 68Tem4 7/7 78.3 232.9 3.2 360.7 −58.0 34.0 R 9.00 0.33 60Tem3(6) 7/7 74.4 203.1 14.4 18.5 −69.2 42.4 R 21.44 1.38 50Tem2(6) 7/7 64.6 215.7 4.4 193.1 −66.1 347.0 R 41.99 1.10 30Tem1 7/7 −67.3 356.6 2.8 464.7 87.5 309.2 N 5.87 3.20 5
Mont de la Tourmente section (49.30◦S, 69.39◦E)Tou1 7/7 −69.9 358.0 4.9 150.0 85.3 264.1 N 13.21 1.15 580Tou2 7/7 −47.7 3.8 4.1 222.0 69.3 78.9 N 2.97 0.57 525Tou3 7/7 −49.6 6.2 4.9 152.6 70.6 85.6 N 4.63 8.33 520Tou4 7/7 −69.6 358.3 5.3 131.4 85.8 263.4 N 23.08 0.72 510Tou5 9/9 −56.1 332.0 3.9 174.9 66.1 0.8 N 53.48 1.10 505Tou6(7) 7/7 −62.6 356.4 5.5 123.6 84.1 43.2 N 8.82 1.15 495Tou7(7) 4/4 −63.9 346.2 11.1 69.0 80.0 355.9 N 37.93 0.86 490Tou8(7) 7/7 −64.3 359.6 6.8 80.5 86.8 64.5 N 110.17 0.29 480Tou9 7/7 −76.6 131.0 5.8 108.3 30.0 227.4 T 54.67 1.24 465Tou10(8) 7/7 −65.0 11.9 3.5 306.5 81.7 147.6 N 9.47 1.20 430Tou11(8) 6/6 −72.1 6.5 4.3 247.0 81.3 225.5 N 20.26 2.12 420Tou12 7/7 −52.6 22.4 7.6 63.9 71.2 120.8 N 52.44 0.80 410Tou13 7/7 −55.6 34.4 6.1 98.4 61.8 144.6 N 6.35 1.78 390
G. Plenier et al. / Physics of the Earth and Planetary Interiors 133 (2002) 127–146 133
Table 1 (Continued)
Flow n/N Inc Dec α95 κ Plat Plong Polar ν% J20 Alt
Tou14 3/4 −77.8 304.0 16.2 58.8 57.2 286.8 N 65.6 0.41 380Tou15(9) 7/7 −66.6 23.9 5.7 112.1 74.5 167.8 N 37.13 0.95 370Tou16(9) 7/7 −73.7 33.3 2.8 462.8 68.4 200.6 N 26.48 0.39 360Tou17 6/7 −39.8 285.7 42.5 3.4 27.0 335.5 T 172.63 5.97 340Tou18 7/7 −59.6 323.8 2.0 883.5 63.2 344.8 N 26.72 0.29 330Tou19 7/7 −75.5 14.2 5.5 121.7 74.6 224.4 N 4.74 2.51 320Tou20 7/7 −72.0 6.6 3.7 267.6 79.1 225.5 N 18.80 1.33 305Tou21 7/7 −56.7 2.6 7.0 75.8 77.8 79.3 N 148.60 0.18 290Tou22 6/7 −84.4 8.7 10.7 39.9 52.6 256.5 N 96.79 0.30 280Tou23 7/7 −67.8 24.6 5.0 144.3 74.2 174.1 N 11.33 3.05 250Tou24 7/7 −69.5 10.8 5.5 121.6 82.2 193.5 N 10.99 0.43 240Tou25 7/7 −79.3 16.4 7.0 76.0 68.5 233.6 N 18.11 1.60 220Tou26 8/8 −64.6 18.2 6.1 83.0 77.5 153.2 N 59.41 0.42 210Tou27 7/7 −65.4 26.7 2.6 551.0 72.3 163.8 N 24.75 0.55 200Tou28 7/7 −67.2 35.4 7.2 71.0 67.3 174.6 N 26.07 1.68 190Tou29 5/5 −52.0 100.7 8.7 78.1 17.9 189.0 T 22.44 2.12 180Tou30 7/7 −77.6 41.2 2.6 551.1 63.1 213.6 N 18.62 2.13 160Tou31 7/7 −60.0 6.2 5.7 112.8 80.5 99.1 N 30.38 0.24 135Tou32 7/7 −66.1 38.5 4.3 199.1 64.9 172.3 N 12.51 0.34 120Tou33 7/7 −59.6 34.4 3.9 243.9 64.3 152.4 N 54.88 0.94 110
Mont Amery section (49.29◦S, 70.06◦E)Ame8 7/7 −77.7 350.8 3.2 347.2 72.2 262.1 N 2.33 2.56 345Ame7 7/7 −74.9 326.0 6.6 83.4 67.5 294.0 N 32.09 0.14 340Ame6 7/7 −57.2 37.1 4.1 220.5 61.1 150.8 N 14.51 2.48 330Ame5 7/7 −60.8 29.5 5.4 125.0 68.2 151.2 N 13.28 0.69 280Ame4 7/7 −52.9 9.6 5.3 129.3 72.6 97.9 N 18.73 0.87 270Ame3 7/7 −75.2 9.4 3.7 265.3 76.1 231.5 N 19.14 0.56 250Ame2 7/7 −60.4 22.3 6.4 89.7 72.5 141.5 N 7.05 0.12 225Ame1 7/7 −60.5 1.7 4.3 195.5 82.1 79.4 N 17.45 0.63 200
Mont Rabouillere section (49.09◦S, 69.44◦E)Rab19 7/7 −72.54 2.63 2.8 471.0 81.1 240.6 N 8.8 3.72 280Rab18 7/7 −78.14 2.63 4.3 196.0 71.6 246.3 N 2.4 1.49 270Rab17 7/7 −63.17 109.68 4.4 187.0 22.1 203.4 T 9.0 0.30 250Rab16 8/8 −73.07 354.00 2.0 922.0 79.8 267.4 N 9.3 1.99 230Rab15 7/7 75.27 173.30 4.1 220.0 −76.1 82.8 R 13.8 0.33 190Rab14 7/7 69.52 173.53 3.7 269.0 −84.1 111.1 R 10.7 0.20 170Rab13 7/7 48.40 134.43 2.3 714.0 −50.4 172.0 R 4.8 1.06 160Rab12 7/7 68.19 140.23 4.2 207.0 −64.8 138.7 R 1.8 0.84 150Rab11 7/7 56.93 193.60 3.7 266.0 −74.9 295.0 R 2.6 1.85 130Rab10 6/7 48.70 178.36 1.5 2014.0 −70.5 245.2 R 1.5 1.67 120Rab9 7/7 71.72 177.11 2.7 494.0 −82.3 81.8 R 23.4 0.22 100Rab8 7/7 68.22 176.29 2.8 476.0 −86.6 112.7 R 18.3 0.18 80Rab7 7/7 69.85 198.78 1.9 1017.0 −77.4 8.3 R 11.2 0.59 60Rab6 6/7 59.00 185.50 4.1 273.0 −80.0 274.2 R 4.9 3.41 45Rab5 7/7 67.96 180.88 3.1 375.0 −87.9 55.7 R 9.9 1.06 30Rab4 8/8 54.53 188.27 1.7 1073.0 −74.7 276.0 R 5.7 3.63 20Rab3(10) 8/8 81.02 160.99 3.1 319.0 −65.1 82.7 R 0.9 2.67 14Rab2(10) 7/7 81.71 152.27 4.0 234.0 −62.5 85.7 R 2.5 1.34 8Rab1(10) 7/7 78.38 145.84 2.5 600.0 −64.7 99.4 R 7.8 0.94 2
The superscript (i = 1–10) indicates flows which can be grouped together (see discussion);n/N the number of samples used in theanalysis/total number of samples collected; Inc and Dec the mean inclination, positive downward, and the declination east of north,respectively;α95 the 95% confidence envelope for the average direction;κ the precision parameter of Fisher distribution;Plat/Plong thelatitude/longitude of VGP position, respectively. The polarity of the flow (Polar) is normal (N) ifPlat > 45◦, reverse (R) ifPlat < −45◦,and intermediate (T) for the other cases.ν% is the geometric mean viscosity index(Thellier and Thellier, 1944); J20 the geometric meanremanence intensity after cleaning at 20 mT (for AF demagnetized samples only); Alt is the altitude of the flow in meter.

134 G. Plenier et al. / Physics of the Earth and Planetary Interiors 133 (2002) 127–146
Fig. 3. (A) Cumulative distribution function of the viscosity indices(ν) from (1) Mont des Ruches, Mont des Tempetes, Mont de laRabouillere, and Mont Amery sections combined, (2) the Mont dela Tourmente section. (B) Magnetization intensity after 2 weeksstorage in a shielded room (NRM0) as a function ofν. (C)Magnetization intensity of the viscous component acquired during15 days under the geomagnetic field (∆z 15 days) as a functionof ν.
deduced from theKT analysis, both low Curie tem-perature (first case) and high temperature oxidation(second case) are observed in Kerguelen samples. Wewill demonstrate that the VRM carried by the samplesis soft (removed at 20 mT), favoring the hypothe-sis of larger multidomain grains of low Curie point
titanomagnetites to explain the high normal polarityvalues.
5. Palaeodirection determinations
5.1. Tectonic corrections
No significant dip has been observed for four ofour sections. On the contrary, the whole Mont de laTourmente section presents an eastward dip of 15◦.According to the geological map(Nougier, 1970),only east–west trending fractures are present in theneighborhood of this section, and there is no directevidence for a tilting of the entire section after flowemplacement.
5.1.1. Anisotropy of magnetic susceptibility (AMS)It is possible to discriminate paleotopography and
associated flow direction from post-emplacementtectonic tilting by comparing the flowing direction,determined using AMS and the present dip direction.We measured the AMS of the samples from the Montde la Tourmente section to know if the tectonic cor-rections were needed. In order to recover the initialflow direction(Cañón Tapia et al., 1995), all the sam-ples, with regular standard shape (n = 221 of 244),were analyzed using the KLY2 kappabridge in theIPG Paris Palaeomagnetic Laboratory at Saint Maur.In order to eliminate statistically indistinct values,we filtered the individual data using both F statisticsand the three sigma limit on the A and B factorsas described byCañón Tapia et al. (1995). Thus, 33samples were eliminated. The confidence regions forthe mean direction of each axis were calculated us-ing linear perturbation analysis(Hext, 1963; Jelinek,1978; Lienert, 1991), bootstrap method(Constableand Tauxe, 1990)and the bivariate extension ofFisher’s statistics(Henry and Le Goff, 1995). A diffi-culty in AMS study of volcanic flows is the possibleoccurrence of permutation of maximum-intermediatesusceptibility axis. Such permutations of the principalsusceptibility axis are sometimes observed in samplesfrom a same flow, possibly giving wrong mean direc-tions (Cañón Tapia et al., 1996). We therefore deter-mined the density contour of the maximum (Kmax),intermediate (Kint), and minimum (Kmin) principalsusceptibility axis to look for possible discrepancies

G. Plenier et al. / Physics of the Earth and Planetary Interiors 133 (2002) 127–146 135
Fig. 4. Mean principal susceptibility axis of three consecutive parts form the Mont de la Tourmente section and their 95% confidenceellipses (Constable and Tauxe, 1990), squareKmax, triangleKint and circleKmin.
between orientation of the axis clusters and meandirections.
AMS measurement of fewer than 10 specimens perflow yields quite large statistical uncertainty of thesusceptibility tensor(Cañón Tapia et al., 1997). Al-though all our samples were drilled from the lowerpart of each flow, the sampling strategy was not de-signed for AMS analysis. Because only seven sampleswere taken per flow, AMS mean directions per floware of weak significance, showing large uncertainties.However, the aim of our study was not to constrainthe flowing direction of each flow, because it can berelated to the local flowing disturbances, but to deter-mine the mean flowing direction. The low significance
Table 2Directions of the mean principal susceptibilities and sizes of the confidence regions around them for the Mont de la Tourmente section
s δs Dec Inc ζ dζ iζ η dη iη
Flows 1–10 (N = 53) Max 0.336 0.0005 128.2 21.0 9.6 295.8 68.5 26.0 36.5 4.2Int 0.334 0.0005 219.1 2.4 14.9 73.9 87.1 27.9 309.1 1.7Min 0.330 0.0006 315.3 68.8 8.7 140.7 21.1 17.7 50.0 1.8
Flows 11–20 (N = 56) Max 0.336 0.0005 107.9 16.0 9.6 355.7 52.8 21.8 208.4 32.5Int 0.334 0.0003 207.4 30.2 12.4 346.4 52.3 22.0 105.0 20.3Min 0.330 0.0004 353.7 55.0 9.3 104.8 14.1 12.6 203.5 31.3
Flows 21–33 (N = 79) Max 0.336 0.0003 103.0 7.9 7.6 359.4 59.4 27.4 197.5 29.3Int 0.334 0.0003 196.1 21.3 11.3 8.0 68.5 27.4 105.1 2.8Min 0.330 0.0004 353.8 67.2 7.6 85.0 0.5 11.8 175.2 22.8
Whole section (N = 188) Max 0.336 0.0003 113.6 16.1 5.7 351.0 61.9 14.0 210.4 22.4Int 0.334 0.0002 209.3 18.9 7.5 348.5 65.7 14.0 114.1 14.7Min 0.330 0.0003 345.9 64.8 5.7 107.7 13.9 7.5 203.0 20.6
N is the number of sample per data-set;s the eigenvalue of normalized mean susceptibility tensor;δs corresponds to the 95% confidenceregion for s; Dec and Inc the declination and the inclination of the mean susceptibility axis, respectively;ζ and η the semiangles ofminor and major axis of the 95% confidence ellipse, respectively;dζ,η the declination of minor, major axis direction;iζ,η the inclinationof minor, major axis direction.
of the data per flow does not allow determination ofthis mean flowing direction from running direction inthe different flows. The lack of observed discordancesbetween the flows suggests that the flowing conditionswere relatively constant for the whole section, and wetherefore merged all the AMS data.
To verify that such a merging is justified, a com-parison of the mean data was made dividing thesection in three subsets. The coherent results obtainedin these parts (Fig. 4 and Table 2) clearly show theconstant flowing conditions during emplacement ofthe whole section. The three statistical methods usedto define the mean directions and their associatedconfidence zones, provided approximately the same

136 G. Plenier et al. / Physics of the Earth and Planetary Interiors 133 (2002) 127–146
Fig. 5. (a–d) Density diagrams of the principal susceptibility axisKmax (a), Kint (b), Kmin (c) andKmax–Kint (d) combined for the Montde la Tourmente section (n = 188). Mean principal axis (e) and their 95% confidence ellipses (Constable and Tauxe, 1990), squareKmax,triangleKint and circleKmin.
results, for each part as for the whole data.Fig. 5a–ddisplays for all the samples theKmax, Kint, Kmin andKmax–Kint density diagrams, respectively.Kmax, KintandKmax–Kint density contours present bipolar dia-grams. ForKmax, the two maxima of density are ESEand S oriented.Kint own a comparable S trend but thesecond maximum is E in this case. The combinationof theKmax andKint leads to decrease the density con-trasts, with a maximum of W–E to WNW–ESE maindirection and another one, weaker, of S azimuth. TheKmin density diagram displays a well defined mean di-rection, with a maximum of density strongly dippingnorthwestward.
5.1.2. DiscussionThe bipolarity of theKmax and Kint density dia-
grams clearly show thatKmax–Kint axis permutation
is important in this section. However, one of the max-imum density ofKmax and the maximum density ofKmin perfectly agree with the meanKmax andKmin,determined using the other statistical approaches. Thisindicates that permutations do not significantly af-fects the mean tensor directions. The consistency ofthe mean directions for the different parts of the sec-tion and the relatively small 95% confidence areas forthe whole section yield a strong and coherent signalamong the section. The mean tensor directions canbe therefore used for the determination of the flowingdirection.The interpretation of these data is unfortu-nately questionable. In fact, because of axis permuta-tion, Kmax or Kint could represent the flowing direc-tion. Moreover, both meanKmaxand meanKint presenta significant inclination.Kmin is not in the verticalplane includingKmax or Kint. On the one hand,Kmaxcorresponds to the strongest maximum density and

G. Plenier et al. / Physics of the Earth and Planetary Interiors 133 (2002) 127–146 137
Fig. 6. Orthogonal plots for normal reversed and intermediate flows for differently demagnetized samples in geographic coordinates. Theblack (white) points correspond to the horizontal (vertical) plane.
138 G. Plenier et al. / Physics of the Earth and Planetary Interiors 133 (2002) 127–146
should be a good candidate. In this case, the flowing di-rection agrees with the present dip direction and prob-ably no tilting occurred after lava emplacement. On theother hand, ifKint represents the flowing direction, theflows were tilted after emplacement. Untilting leads tohorizontalKmax, and toKmin andKint in a same verti-cal plane. No decisive argument yields choice betweenthese two possibilities. The VGPs from the five sec-tions (seeTable 1) are more axially distributed with-out tectonic corrections on the Mont de la Tourmentesection. This argues for a eastward dip of topographicorigin before the lava flowing. AMS data being com-patible with a lack of tilting after lava emplacement,we chosen to not apply dip correction to the paleo-magnetic data from the Mont de la Tourmente section.
5.2. Palaeomagnetic cleaning
We performed demagnetizations of the samples intwo steps. First, two pilot samples per flow were step-wise demagnetized, one in AF using a laboratory-builtAF demagnetizer (up to 140 mT) and the other ther-mally in a non-inductive PYROX furnace with aresidual magnetic field of less than 20 nT. Remanentmagnetizations were measured using a JR-5A spin-ner magnetometer after each demagnetization step(7–16). The behaviour of the pilot specimens guidedour choice of the best demagnetization procedure forthe remaining samples from the same flow. When thetwo demagnetization methods yield almost the sameresults, we preferred to proceed with the thermaltreatment because the separation of components isusually more efficient for volcanic rocks. Moreover,the thermal demagnetizations reveal the spectrum ofremanence unblocking temperatures, used later todefine the demagnetization steps of a pilot palaeoin-tensity experiment (Plenier et al., in preparation).
5.3. Results
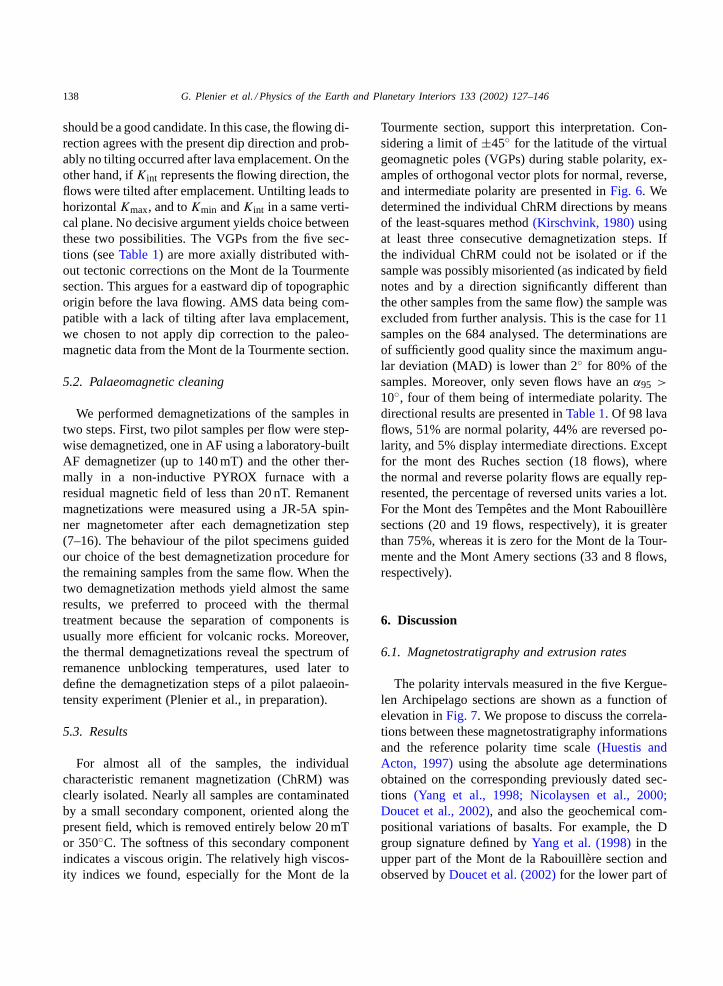
For almost all of the samples, the individualcharacteristic remanent magnetization (ChRM) wasclearly isolated. Nearly all samples are contaminatedby a small secondary component, oriented along thepresent field, which is removed entirely below 20 mTor 350◦C. The softness of this secondary componentindicates a viscous origin. The relatively high viscos-ity indices we found, especially for the Mont de la
Tourmente section, support this interpretation. Con-sidering a limit of±45◦ for the latitude of the virtualgeomagnetic poles (VGPs) during stable polarity, ex-amples of orthogonal vector plots for normal, reverse,and intermediate polarity are presented inFig. 6. Wedetermined the individual ChRM directions by meansof the least-squares method(Kirschvink, 1980)usingat least three consecutive demagnetization steps. Ifthe individual ChRM could not be isolated or if thesample was possibly misoriented (as indicated by fieldnotes and by a direction significantly different thanthe other samples from the same flow) the sample wasexcluded from further analysis. This is the case for 11samples on the 684 analysed. The determinations areof sufficiently good quality since the maximum angu-lar deviation (MAD) is lower than 2◦ for 80% of thesamples. Moreover, only seven flows have anα95 >
10◦, four of them being of intermediate polarity. Thedirectional results are presented inTable 1. Of 98 lavaflows, 51% are normal polarity, 44% are reversed po-larity, and 5% display intermediate directions. Exceptfor the mont des Ruches section (18 flows), wherethe normal and reverse polarity flows are equally rep-resented, the percentage of reversed units varies a lot.For the Mont des Tempetes and the Mont Rabouillèresections (20 and 19 flows, respectively), it is greaterthan 75%, whereas it is zero for the Mont de la Tour-mente and the Mont Amery sections (33 and 8 flows,respectively).
6. Discussion
6.1. Magnetostratigraphy and extrusion rates
The polarity intervals measured in the five Kergue-len Archipelago sections are shown as a function ofelevation inFig. 7. We propose to discuss the correla-tions between these magnetostratigraphy informationsand the reference polarity time scale(Huestis andActon, 1997)using the absolute age determinationsobtained on the corresponding previously dated sec-tions (Yang et al., 1998; Nicolaysen et al., 2000;Doucet et al., 2002), and also the geochemical com-positional variations of basalts. For example, the Dgroup signature defined byYang et al. (1998)in theupper part of the Mont de la Rabouillère section andobserved byDoucet et al. (2002)for the lower part of

G. Plenier et al. / Physics of the Earth and Planetary Interiors 133 (2002) 127–146 139
Fig. 7. Magnetostratigraphic correlations with the global geomagnetic polarity time scale(Huestis and Acton, 1997)interpreted usingradiometric dates and geochemical observation(Yang et al., 1998; Nicolaysen et al., 2000; Doucet et al., 2002). We assume that all thepolarity chrons are recorded at each section 1–4 are the possible correlations allowed for the Mont de la Tourmente section.
the Mont des Ruches and Mont des Tempetes sectionshelps to place these sections stratigraphically withrespect to each other. For the Mont Amery section,we sampled upward from the last units studied byHenry and Plessard (1997). We thus included theirpalaeomagnetic data, which describe the first 200 mof the section, to furnish a more complete magne-tostratigraphy.
In order to check the relationship between the initia-tion of Kerguelen flood basalts and the conjunction ofthe Kerguelen Plume with the Southeast Indian Ridge,Nicolaysen et al. (2000)used lava accumulation ratesto evaluate the location of the Kerguelen Archipelagowhen it began to form. The magnetostratigraphy cor-related to the global geomagnetic polarity time scaleallow to better constrain the age limits of each section

140 G. Plenier et al. / Physics of the Earth and Planetary Interiors 133 (2002) 127–146
and then recalculate more accurate extrusion rates foreach section. We calculated the extrusion rate (exr) asfollows:
exr = �H
�t − ref
where�H is the analyzed stratigraphic thickness and�t − ref, the duration of the chrons the correlatinglavas.
The correlations are made using the working hy-pothesis that all the polarity chrons spanning theemplacement of the volcanic sequence were recorded.This assumption seems reasonable because the vol-canic activity of the Kerguelen hotspot is acknowl-edged to be vigourous. We did not see for exampleerosion surfaces between the lava flows, only thinsediment layers were sometimes observed. However,the volcanic activity of the Kerguelen plume maydiffer from place to place and the thickness of thesedimentary layers is not directly related to the timespan between two successive flows, their absence doesnot necessary evidence a rapid succession. Withoutrigorous arguments, we tentatively considered that nohidden polarity chrons are missing from the volcanicsequences.
Because of the errors on age determinations, sev-eral correlations remain possible for each section. Toovercome these uncertainties, we kept the nearest so-lution from the best radiometric dates available. Forinstance, the 26± 1 Ma date obtained at the base ofthe less constrained Mont de la Tourmente section isnot directly related to a polarity boundary and the pre-cision is not sufficiently accurate to allow a firm cor-relation. On the contrary, the 25.31± 0.67 Ma date atthe top of the section is of quite good quality, but fourcorrelations can be made considering the error bars(1–4 inFig. 7). The correlation (2) corresponding to anormal polarity chron between 24.92 and 25.28 Ma isthe nearest to 25.31 Ma and was kept as our preferredinterpretation. One can argue that using dates deter-mined on sections not sampled exactly at the sameplace can also introduce some bias, but as explained inthe paleomagnetic sampling descriptionSection 3, weare quite confident about the stratigraphic relation be-tween the dated sections and the palaeomagnetic ones.
Concerning the extrusion rate calculations, depend-ing on the interpretation made to correlate the sectionsto the global geomagnetic polarity scale, the results
can vary significantly. For this reason, we will giveboth a lower and upper estimate. It is also importantto notice that because the sections do not span the en-tire chrons, the time elapsed to produce each sectionis necesseraly shorter than the one used for the cal-culation. Therefore, both values of the extrusion rateare actually lower bounds of the true eruption rates.These limitations should be kept in mind to appreciatecorrectly the estimate proposed.
The interpretation, based on the nearest solutionfrom the best radiometric dates, furnish the follow-ing constraints on the age limits. The Mont de laRabouillère section accumulated between 29.7 and28.7 Ma, the Mont des Ruches section between 28.7and 28.1 Ma, the Mont des Tempetes section between28.6 and 28.1 Ma, the Mont Amery section between24.9 and 24.8 Ma, and the Mont de la Tourmentesection between 25.3 and 24.9 Ma. For the Montde la Rabouillère, Mont des Ruches, and Mont desTempetes sections, we calculated an average extru-sion rate of 0.33 km/my (0.70 km/my). But the wellconstrained normal polarity interval in between tworeversed chrons observed on the Mont des Ruchessection allows estimation of a more realistic eruptionrate of 0.27 km/my (0.39 km/my) for this section. Theupper limit of the D geochemical signature combinedwith the magnetic results indicate that the eruption ratefor the Mont des Tempetes section is almost two timeslower than for the Mont des Ruches (between 0.16 and0.23 km/my). For the youngest Mont de la Tourmenteand Mont Amery sections, our first interpretationyields eruption rates of 1.31 km/my (8.55 km/my) and6.27 km/my (0.96 km/my), respectively.
However, this last eruption rate seems unlikely be-cause very high. Thus, we suggest that Mont de laTourmente and Mont Amery sections erupted duringthe same normal polarity chron C7n.2n. This alter-native interpretation still agrees with the radiometricdates within error. The age limits of the C7n.2n chron,between 25.3 and 24.9 Ma, yield a more acceptableeruption rate of 0.96 km/my for the Mont Amerysection. This second interpretation is our preferred.Fig. 7 summarizes the retained correlations of eachsection with respect to the reference polarity timescale(Huestis and Acton, 1997).
Therefore, the Mont de la Tourmente and MontAmery sections present smaller values, but within theincertitude interval, than the mean 1.6 ± 0.9 km/my

G. Plenier et al. / Physics of the Earth and Planetary Interiors 133 (2002) 127–146 141
proposed byNicolaysen et al. (2000)for the samesections. The eruption rates calculated by means ofthe magnetic remanence seem very different fromsection to section and confirm higher extrusion ratesfor youngest sections as supposed byNicolaysen et al.(2000) from geochronological ages considerations.The major assumption used to obtain these conclu-sions is that all the polarity chrons are recorded ateach section. If this is not the case, the extrusion ratesare overestimated.
6.2. Intermediate directions
In the present study, we define arbitrarly a palaeo-magnetic direction as intermediate if its correspond-ing VGP has a latitude between±45◦. Intermediatedirections can indicate polarity reversals as well asexcursions of the geomagnetic field. Unfortunately,assuming that the magnetostratigraphy is completeat every sampling locality, the presented Kerguelenbasalt sections did not record reversals because allthe intermediate directions occurred within stablepolarity intervals. Concerning the Mont des Ruchessection, the preceding and following VGPs of the in-termediate polarity flow possess a palaeopole latitude30◦ or more away from the closest geographic pole.Thus it is possible to consider this intermediate di-rection as a rebound during a normal–reverse (N–R)polarity change. A similar remark can be made forthe Ruc2 VGP location which might correspond to
Fig. 8. Locations of VGPs from the Mont des Ruches section.
an intermediate position between the reverse–normal(R–N) polarity change. The successive VGPs fromthe Mont des Ruches section, connected together withgreat circles, are shown inFig. 8. The fact that someVGPs can describe a reversal path lead us to consider,as a simplest interpretation, that all the reversals arerecorded at least for the Mont des Ruches section.For the Mont de la Tourmente and Rabouillère sec-tions, because any preceding and following VGPs arenot deviated toward theses positions, the intermediateVGP seem isolated. Thus, they can either representsuper palaeosecular variation, as well as excursionsor true intermediate directions during a reversal notrecorded. The assumption made to correlate these sec-tions to a global geomagnetic polarity scale may beunsuitable.
6.3. Palaeosecular variation
We included in the present statistical analysis thepalaeomagnetic results ofHenry and Plessard (1997)for the Port Jeanne d’Arc, Port Couvreux and MontAmery (Val Studer) sections in order to increase thenumber of upper Oligocene data. In a second step,we removed the transitional data presenting VGPswith latitude less than±45◦ (n = 9). The palaeo-magnetic directions of individual flow for this globaldataset are displayed inFig. 9. with their bootstrappedmeans and associated 95% confidence ellipses(Tauxe,1998).

142 G. Plenier et al. / Physics of the Earth and Planetary Interiors 133 (2002) 127–146
Fig. 9. (a) Palaeomagnetic directions of individual flow (Henryand Plessard (1997)and this study combined), and (b), theirbootstrapped means with 95% confidence ellipses(Tauxe, 1998),after removing of the transitional data. The dipole field directions(squares) are given for comparison. In black (white) circles andsquares are positive (negative) inclinations.
6.3.1. Bootstrap reversal testIn order to check the reliability of the data for
palaeosecular variation study, we processed themby separating the mean directions into two polaritydatasets and by inverting the normal polarity datasetto its antipode. Then we applied the bootstrap test fora common mean(Tauxe, 1998)for the two datasets inorder to perform a reversal test. The statistical analy-sis of flow-average directions for these two dataset arepresented inTable 3. Because the confidence intervalsof the bootstrapped means for the two distributionsoverlap for each cartesian coordinate (Fig. 10), we
Fig. 10. Histograms of cartesian coordinates of the mean boot-srapped normal and reverse polarity directions and their 95% con-fidence intervals(Tauxe, 1998).

G. Plenier et al. / Physics of the Earth and Planetary Interiors 133 (2002) 127–146 143
Table 3Statistical analysis of flow-average direction
Dec Inc N R κ α95
Ungrouped directionsNormal 10.2 −65.6 60 58.0849 30.8 3.4Reverse 178.7 68.9 49 47.5284 32.6 3.6All combined 5.4 −67.2 109 105.4908 30.8 2.5
Grouped directionsNormal 11.1 −65.3 53 51.1493 28.1 3.8Reverse 177.2 68.5 41 39.7268 31.4 4.0All combined 5.5 −66.9 94 90.7407 28.5 2.8
Dec, Inc are the mean declination and inclination, respectively;N
the number of lava flow used in the analysis;R the vector sum ofN unit vectors;κ the precision parameter of Fisher distribution;α95 the 95% confidence envelope for the average direction.
concluded that the two means are statistically iden-tical at the 95% level of confidence. Such a positivereversal test implies further, first, that the individualChRMs are not disturbed by secondary components,next that these ChRMs are primary TRMs, and finallythat the palaeomagnetic directions reasonably averagethe secular variation during the upper Oligocene.
6.3.2. Flow groupingA random sampling with sufficient time elapsed be-
tween successive field recordings is required to esti-mate the variability of the paleofield due to the secularvariation (PSV). Because the present paleomagneticsampling consists of successive lava flows in a verticalsequence, a risk to introduce a bias in the statisticalanalysis by giving a spurious weight to a single direc-tion recorded by successive lava flows emplaced in ashort time exists. To shed light on this problem, weuse the quantitative bootstrap test for a common mean(Tauxe, 1998)to identify non-independent successivedirections. When two or more succesive flows yield di-rections with a common mean, we used the field notesto check the geological evidences for elapsed time be-tween the flows (conglomerates, red sediments, coal,etc.). The flows which cannot be distinguished usingthese two criteria are then grouped together as indi-cated inTable 1. Nonetheless, it is important to keepin mind that the palaeomagnetic field itself can staystable during emplacement of successive lava flowswith time elapsed between eruption long enough com-pared to the rate of secular variation(Love, 2000). Insuch a case, grouping the data will overestimate the
variability of the paleofield. To quantify this poten-tial problem, we estimated the palaeosecular variationusing two extreme cases: with (n = 94) and without(n = 109) grouping of similar successive directions.
6.3.3. Estimation of the palaeosecular variationWe processed the combined data, by reversing the
VGPs of reversed polarity. The total angular standarddeviation (asd) is calculated using
ST = (N − 1)−1/2
(N∑i=1
θ2i
)1/2
whereN is the number of data andθi the angle be-tween theith VGP and the reference position. Thetotal asd is then corrected for experimental error byremoving the within-flow asd:
S2B = S2
T − S2W
n
where n is the mean number of samples per unit,
SW ≈ 81◦/√k is the within-flow asd, andk the mean
precision parameter. Results of these calculations arereported inTable 4. Because of the low number of
Table 4Dispersion statistics of VGP
VGPs (>45◦) GroupedVGPs (>45◦)
N 109 94Mean latitude 85.6 85.8Mean longitude 202.0 197.7Precision parameterK 15.5 14.6α95 3.6 4.0Within flow asd (SW) 5.00 4.98
Dispersion from mean VGPTotal asd (ST) 20.85 21.50Between-flow asd (SB) 19.35 19.95Confidence limits (95%) onSB 17.70–21.35 18.12–22.18
Dispersion from the Earth’s rotation axisTotal asd (ST) 21.3 21.9Between-flow asd (SB) 21.2 21.8Confidence limits (95%) onSB 19.4–23.4 19.8–24.3
N is the number of flow for calculations.SB , ST, and SW arethe between, total, and within flow angular standard deviations,respectively. The 95% confidence limits onSB are calculated usingthe table of 95% confidence limits for angular standard deviation(Cox, 1969).

144 G. Plenier et al. / Physics of the Earth and Planetary Interiors 133 (2002) 127–146
Fig. 11. VGP scatter and 95% confidence interval about spin axis of data (n = 94) from Henry and Plessard (1997)and the present studycombined (with grouping of magnetically identical flows) compared to the Model G for palaeosecular variation (McFadden et al., 1991).
grouped flows, the two different data-sets consid-ered do not change significantly the results. The realpalaeosecular variation is estimated in the range of19.4–24.3◦, which corresponds to the lower and upperbounds of the two extreme cases.
6.3.4. Comparison with palaeosecular variationmodel
In Fig. 11, we report the VGP scatter and theassociated 95% confidence interval about the spinaxis (n = 94) to compare it with the Model G forpalaeosecular variation(McFadden et al., 1991). Weused this model because it is the only one whichcan be applied for the 24–30 Ma time window. Obvi-ously, the data fit nicely the model. This substantiatesthe Model G ofMcFadden et al. (1991)for the ap-proximation of the palaeosecular variation during the22.5–45 Ma time interval. The equatorial symmetryof the main geomagnetic field assumed in PSV ModelG is then coherent with our southern hemispheredataset.
7. Conclusions
We present a paleomagnetic analysis of five lavasections from the Kerguelen Archipelago. We use theAMS technique to determine the initial flow directionand conclude that no tectonic corrections to sampleorientations are needed for this study. The magneticcarriers have been identified using low-field suscep-tibility evolution curves and include: (1) originaltitanomagnetite or slightly oxidized titanomaghemite,(2) titanomaghemite with higher Curie temperature,more or less thermally stable due to low temperatureoxidation at a different level, and (3) poor-Ti titano-magnetite produced by high temperature oxidation.Surprisingly, the calculated viscosity index of theMont de la Tourmente section is larger than expectedfor subaerial lavas. After laboratory treatment, theprimary remanent magnetization is well isolated, asshown by little within flow dispersion and a positivebootstrap reversal test. This test also assures that theOligocene palaeosecular variation is well averaged

G. Plenier et al. / Physics of the Earth and Planetary Interiors 133 (2002) 127–146 145
by the sampling. If we assume that no reversals aremissed by the sections, and considering our inter-pretation of correlation to theHuestis and Acton(1997)global geomagnetic polarity scale, the magne-tostratigraphy permits us to improve the dates of eachsection—between 29.7 and 28.7 Ma for The Mont dela Rabouillère section, 28.7 and 28.1 Ma for the Montdes Ruches section, 28.6 and 28.1 Ma for the Mont desTempetes section, and between 25.3 and 24.9 Ma forthe Mont Amery and Mont de la Tourmente sections,and calculate more precisely the eruption rates. Theseextrusion rates –0.35 km/my for the Mont des Ruchessection, 0.43 km/my for the Mont des Tempetes, andlower bound values of 0.3, 0.96 and 1.31 km/my forthe Mont de la Rabouillère, Mont Amery and theMont de la Tourmente, respectively—present impor-tant variations from section to section with an increasefor the younger sections. Thus, the assumption byNicolaysen et al. (2000)of a constant eruption ratefor the Eocene–Oligocene activity of the Kerguelenplume is an oversimplification. The intermediate datafrom the Mont des Ruches section is considered as arebound during a normal to reverse polarity change.The VGP direction provided by the Ruc2 flow can alsobe considered as an intermediate position between thereverse to normal polarity change. These observationsleads to consider that at least the Mont des Ruchessection recorded all the reversals. Some doubts existfor the Mont de la Rabouillère and Mont de la Tour-mente sections. Their intermediate VGP directionscould signal unrecorded reversals, and thus the erup-tion rates calculated on these sections may be exag-gerated. Finally, the estimated palaeosecular variationsubstantiates an axially symmetric palaeomagneticfield with equatorial symmetry since they are coherentwith the Model G of palaeosecular variation proposedfor the Oligocene period(McFadden et al., 1991).
Acknowledgements
We are grateful to the “Institut Polaire Paul EmileVictor” for providing all transport facilities and forthe support of this project. Special thanks to AlainLamalle, Roland Pagny and all our field friends. Wethank Mireille Perrin for her help during sampling,Michel Prévot for scientific discussions, and RobCoe for reading the manuscript and for helpful com-
ments. The authors also want to thanks Scott Bogueand two anonymous reviewer for their constructiveremarks. They help to clarify and improve the qualityof this article. This work was partially supported byCNRS-INSU programme intérieur Terre.
References
Cañón Tapia, E., Walker, G., Herrero-Bervera, E., 1995. Magneticfabric and flow direction in basaltic pahoehoe lava of Xitlevolcano, Mexico. J. Volcanol. Geotherm. Res. 65, 249–263.
Canon Tapia, E., Walker, G., Herrero-Bervera, E., 1996. Theinternal structure of lava flows—insights from AMS measure-ments. I. Near-vent a’a. J. Volcanol. Geotherm. Res. 70, 21–36.
Canon Tapia, E., Walker, G., Herrero-Bervera, E., 1997. Theinternal structure of lava flows—insights from AMS measure-ments. II. Hawaiian pahoehoe, toothpaste lava and a’a. J.Volcanol. Geotherm. Res. 76 (1/2), 19–46.
Constable, C., Tauxe, L., 1990. The bootstrap for magneticsusceptibility tensors. J. Geophys. Res. 95 (8), 383–395.
Cox, A., 1969. Confidence limits for the precision parameterK.Geophys. J. R. Astr. Soc. 18, 545-549.
Dormy, E., Valet, J., Courtillot, V., 2000. Numerical models of thegeodynamo and observational constraints. Geochem. Geophys.Geosyst. (2000GC000062).
Doucet, S., Weis, D., Scoates, J., Nicolaysen, K., Frey, F.,Giret, A., 2002. The depleted mantle component in KerguelenArchipelago basalts: petrogenesis of tholeiitic–transitionalbasalts from the Loranchet Peninsula. J. Petrol. 43 (7),1341–1366.
Duncan, R., 2002. A time frame for construction of the KerguelenPlateau and Broken Ridge. J. Petrol. 43 (7) 1109–1119.
Frey, F., Weis, D., Yang, H.-J., Nicolaysen, K., Leyrit, H.,Giret, A., 2000. Temporal geochemical trends in KerguelenArchipelago basalts: evidence for decreasing magma supplyfrom the Kerguelen plume. Chem. Geol. 164, 61–80.
Gautier, I., Weis, D., Mennessier, J., Vidal, P., Giret, A., Loubet,M., 1990. Petrology and geochemistry of the KerguelenArchipelago basalts (south Indian Ocean): evolution of themantle sources from ridge to intraplate position. Earth Planet.Sci. Lett. 100, 59–76.
Giret, A., 1990. Typology, evolution, and origin of the Kerguelenplutonic series, Indian Ocean: a review. Geol. J. 25, 239–247.
Henry, B., Le Goff, M., 1995. Application of the bivariateextension of Fisher’s statistics to the magnetic susceptibilityanisotropy data: integration of the measurment uncertainties onthe orientation of the principal directions. C.R. Acad. Sci. Paris320 (IIa), 1037–1042.
Henry, B., Plessard, C., 1997. New palaeomagnetic results fromthe Kerguelen Islands. Geophys. J. Int. 128 (1), 73–83.
Hext, G., 1963. The estimation of second-order tensors, withrelated tests and designs. Biometrika 50, 353–373.
Huestis, S., Acton, G., 1997. On the construction of geomagnetictimescales from non-prejudicial treatment of magnetic anomalydata from multiple ridges. Geophys. J. Int. 129 (1), 176–182.

146 G. Plenier et al. / Physics of the Earth and Planetary Interiors 133 (2002) 127–146
Jelinek, V., 1978. Statistical processing of magnetic susceptibilitymeasured in groups of specimens. Stud. Geophys. Geodyn. 22,50–62.
Kirschvink, J., 1980. The least-squares line and plane and theanalysis of paleomagnetic data. Geophys. Geophys. J. R. Astr.Soc. 62, 699–718.
Lienert, B., 1991. Monte Carlo simulation of errors in theanisotropy of magnetic susceptibility: a second-rank symmetrictensor. J. Geophys. Res. 96, 19539–19544.
Love, J., 2000. Statistical assessment of preferred transitional VGPlongitudes based on paleomagnetic volcanic data. Geophys. J.Int. 140, 211–221.
McFadden, P., Merrill, R., McElhinny, M., Sunhee, L., 1991.Reversals of the Earth’s magnetic field and temporal variationsof the dynamo families. J. Geophys. Res. 96 (B3), 3923–3933.
Merrill, R., McFadden, P., 1999. Geomagnetic polarity transitions.Rev. Geophys. 37 (2), 201–226.
Nicolaysen, K., Frey, F., Hodges, K., Weis, D., Giret, A., 2000.40Ar/39Ar geochronology of flood basalts from the KerguelenArchipelago, southern Indian Ocean: implications for Cenozoiceruption rates of the Kerguelen plume. Earth Planet. Sci. Lett.174, 313–328.
Nougier, J., 1970. Terres Australes et Antarctique Francaises(TAAF), Kerguelen Islands reconnaissance map, 1:200,000.Institute Geograph. Natl., Paris.
Özdemir, O., 1987. Inversion of titanomaghemites. Phys. EarthPlanet. Int. 46, 184-196.
Prévot, M., 1981. Some aspects of magnetic viscosity on subaerialand sub-marine volcanic rocks. Geophys. J. R. Astr. Soc. 66,169–192.
Prévot, M., Mankinen, E., Grommé, C., Lecaille, A., 1983. Highpaleointensities of the geomagnetic field from thermomagneticstudies on rift valley pillow basalts from the mid-Atlantic Ridge.J. Geophys. Res. 88, 2316–2326.
Tauxe, L., 1998. Paleomagnetic Principles and Practice. Kluwer,Dordrecht.
Thellier, E., Thellier, O., 1944. Recherches géomagnétiquessur des coulees volcaniques d’Auvergne. Ann. Geophys. 1,37–52.
Weis, D., Giret, A., 1994. Kerguelen plutonic complexes: Sr, Nd,Pb isotopic study and inferences about their sources, age andgeodynamic setting. Membr. Soc. Geol. Fr. 166, 47–59.
Weis, D., Damasceno, D., Frey, F., Nicolaysen, K., Giret, A.,1998. Temporal isotopic variations in the Kerguelen plume:evidence from the Kerguelen Archipelago. Miner. Mag. 62A,1643–1644.
Yang, H.-J., Frey, F., Weis, D., Giret, A., Pyle, D., Michon, G.,1998. Petrogenesis of the flood basalts forming the northernKerguelen Archipelago: implications for the Kerguelen plume.J. Petrol. 39 (4), 711–748.