Embed Size (px)
Citation preview

PALADIN ENERGY LTD ACN 061 681 098
Level 4, 502 Hay Street, Subiaco, Western Australia 6008 Postal: PO Box 201, Subiaco, Western Australia 6904
Tel: +61 (8) 9381 4366 Fax: +61 (8) 9381 4978 Email: [email protected] Website: www.paladinenergy.com.au
Ref: 399274
27 August 2015 ASX Market Announcements Australian Securities Exchange 20 Bridge Street SYDNEY NSW 2000
By Electronic Lodgement
Dear Sir/Madam
Paladin Energy Ltd 30 June 2015 Annual Report
Attached please find the 2015 Annual Report including audited financial statements for the year ended 30 June 2015 together with Appendix 4E and Management, Discussion and Analysis. Yours faithfully Paladin Energy Ltd
ALEXANDER MOLYNEUX Interim CEO
For
per
sona
l use
onl
y
PALADIN ENERGY LTD ACN 061 681 098
Level 4, 502 Hay Street, Subiaco, Western Australia 6008 Postal: PO Box 201, Subiaco, Western Australia 6904
Tel: +61 (8) 9381 4366 Fax: +61 (8) 9381 4978 Email: [email protected] Website: www.paladinenergy.com.au
NEWS RELEASE
FINANCIAL REPORT FOR THE YEAR ENDED 30 JUNE 2015 AND OUTLOOK
Perth, Western Australia – 27 August 2015: Paladin Energy Ltd (“Paladin” or “the Company”) (ASX:PDN / TSX:PDN) announces the release of its consolidated Financial Report for the year ended 30 June 2015. The Financial Report is appended to this News Release.
HIGHLIGHTS
Operations
Langer Heinrich Mine (LHM) produced1 5.037Mlb U3O8 for the year ended 30 June 2015, down 13% from 2014.
C1 cost of production2:
LHM C1 unit cash cost of production for the year ended 30 June 2015 increased by 5% from US$27.71/lb in 2014 to US$29.07/lb in 2015.
Sales and revenue
Sales revenue of US$198.6M for the year ended 30 June 2015, selling 5.367Mlb U3O8.
Average realised uranium sales price for the year was US$37.00/lb U3O8 compared to the average TradeTech weekly spot price for the year of US$35.80/lb U3O8.
Corporate
Progress on recapitalisation during the year:
Refinancing of US$110M project finance facility in July 2015.
Completion of sale of a 25% interest in LHM to CNNC Overseas Uranium Holding Limited for US$190M in July 2015.
Completion of equity capital raising initiatives, introducing a cornerstone strategic investor – HOPU Clean Energy (Singapore) Pte. Ltd. (HOPU), via a 15% placement as well as the completion of a well-supported entitlement offer together raising A$205M in December 2014.
US$150M 2020 convertible bond issue in March 2015.
Repurchase of outstanding US$300M convertible bonds due November 2015.
Impairment of US$180.8M (after tax) recognised for the Queensland exploration assets.
1 LHM production volumes and unit C1 cost of production include an adjustment to in-circuit inventory relating to leached uranium within process circuit. 2 C1 cost of production = cost of production excluding product distribution costs, sales royalties and depreciation and amortisation before adjustment for impairment. C1 cost, which is non-IFRS information, is a widely used ‘industry standard’ term.
For
per
sona
l use
onl
y
385636_1 Page 2
Outlook
Cash flow optimisation initiatives being implemented including in addition to those announced on 30 July 2015.
Forecast to be cash flow neutral3 for FY2016 on an ‘all in’ basis at current spot uranium price and foreign exchange rates.
Key elements of FY2016 guidance include:
LHM production 5.0Mlb to 5.4Mlb U3O8.
Weighted average sales price premium to spot of approximately US$4/lb.
LHM C1 cash costs in the range of US$25/lb to US$27/lb (i.e., 7-14% lower than FY2015).
Results
(References below to 2015 and 2014 are to the equivalent year ended 30 June 2015 and 2014 respectively).
Safety and sustainability
The Company’s 12 month moving average Lost Time Injury Frequency Rate4 (LTIFR) was 2.07 as compared to 3.11 in the previous year to 30 June 2014.
The Kayelekera Mine (KM) conducted a bi-annual internal audit to prepare for the July 2015 NOSA Health, Safety and Environment (HSE) External Audit. The NOSA auditor has recommended the highest 5 Star Platinum rating for KM subject to confirmation by the NOSA Review Board.
Paladin’s safety record has continued to improve in the past year as a result of a long-term commitment to identify new initiatives and improvements, increases in in-house and external training, more formal risk assessments, more rigorous permits to work and more thorough site inductions. The Company remains fully focussed on improving on this positive trend.
Langer Heinrich Mine (LHM)
LHM produced 5.037Mlb U3O8 for the year ended 30 June 2015, down 13% from the previous year. Key production drivers included:
Feed grade: 768ppm U3O8 (FY2014: 783ppm U3O8).
Recovery: 87.6% (FY2014: 90.6%).
Bicarbonate Recovery Plant (BRP) successfully commissioned in March 2015 and operating above design.
LHM unit C1 cash cost of production for the year increased by 5% to US$29.07/lb U3O8 from US$27.71/lb in 2014 as a result of the lower production volume, although total US$ C1 cash costs of production decreased by 9% to US$146.4M.
Kayelekera Mine (KM) remains on care and maintenance
KM remains on care and maintenance. A restart feasibility study for internal use is near completion. Discharge of treated water continued successfully during the year.
3 Excluding one-off restructuring and implementation costs of approximately US$6M and not taking into account any potential capital management or strategic initiatives. 4 All frequency rates are per million personnel hours.
For
per
sona
l use
onl
y

385636_1 Page 3
Profit and Loss
Total sales volume for the year was 5.367Mlb U3O8. (2014: 8.665Mlb).
Sales revenue for the year decreased by 39% from US$328.8M in 2014 to US$198.6M in 2015, as a result of a 2% decrease in realised sales price and a 94% (3.272Mlb) decrease in sales volume from KM which ceased production on 6 May 2014 and is now on care and maintenance. The last of KM finished goods were sold in December 2014.
The average realised uranium sales price for the year ended 30 June 2015 was US$37.00/lb U3O8 (2014: US$37.90/lb U3O8), compared to the TradeTech weekly spot price average for the year of US$35.80/lb U3O8.
Gross Profit for the year of US$1.8M is a turnaround from a US$65.1M gross loss (including a gross loss of US$60.3M from KM) in 2014.
An impairment of US$180.8M (after tax) was recognised for the Queensland exploration assets.
Net loss after tax attributable to members of the Group for the year was US$267.8M. (2014: Net loss US$338.4M)
Cash flow
Cash outflow from operating activities for the year was US$24.7M, after net interest payments of US$28.8M and exploration expenditure of US$1.6M.
Cash outflow from investing activities for the year totalled US$15.6M:
plant and equipment acquisitions of US$11.5M, including, the BRP;
equipment and spiral heat exchangers at LHM; and
capitalised exploration expenditure of US$4.2M.
Cash inflow from financing activities for the year of US$137.6M is attributable to the balance of proceeds received from the sale of a 25% interest in LHM of US$170M, the proceeds from the entitlement offer of US$119.7M, from the share placement to HOPU of US$52.7M, and from the convertible bond issue of US$150M, all of which has been partially offset by the repurchase of the US$300M November 2010 convertible bond, a US$39.9M repayment of the LHM project finance and syndicated loan facility, US$1.5M in syndicated loan facility establishment costs, US$3.0M in costs attributable to the sale of a 25% interest in LHM, US$6.2M in equity capital raising costs and US$4.2M in convertible bond issue costs.
Cash position
Cash of US$183.7M at 30 June 2015.
Balance of proceeds from the sale of a 25% interest in LHM of US$170M, US$119.7M proceeds from the entitlement offer, US$52.7M proceeds from the share placement to HOPU and US$150M proceeds from the convertible bond issue.
Repurchase of the US$300M convertible bond due November 2015, US$30.8M repayment of the LHM project finance facility and US$9.1M repayment of the syndicated loan.
Capital management
In July 2014, the Company refinanced the existing US$110M project finance facility and US$20M working capital facility into a new US$70M syndicated loan facility. Proceeds were utilised to repay US$30.8M of the existing facility.
In July 2014, the Company completed the settlement of the sale of a 25% interest in LHM to CNNC Overseas Uranium Holding Limited, a wholly owned subsidiary of CNNC, the leading Chinese nuclear utility, for consideration of US$190M.
For
per
sona
l use
onl
y
385636_1 Page 4
During November and December 2014, Paladin successfully completed two capital raising initiatives. This involved introducing a cornerstone strategic investor – HOPU, via a 15% placement as well as the completion of a well-supported entitlement offer, together raising A$205M. After receiving Foreign Investment Review Board (FIRB) approval on 21 November 2014, HOPU acquired a 15% interest in Paladin via a placement at A$0.42 per share and it participated pro rata in the general entitlement offer at A$0.26 per share, leading to a final shareholding post fundraising of 14.99%.
On 31 March 2015, Paladin issued a US$150M convertible bond. The issue structure included a US$100M convertible bond issued on 13 February 2015 and, as a result of Paladin exercising an upsize option, an additional US$50M issued on 25 March 2015. The US$100M was issued to high quality institutional investors, whilst the US$50M was issued to Leader Investment Corporation, a controlled subsidiary of China Investment Corporation (CIC). The US$150M convertible bond carries a coupon of 7% per annum, maturing on 31 March 2020 and is convertible into Paladin shares at an initial conversion price of US$0.356 per share.
Proceeds from the convertible bond were used to fund the concurrent tender offer to acquire the outstanding US$300M convertible bond due November 2015. On 2 April 2015, Paladin repurchased US$289.25M of the US$300M convertible bonds. On 17 April 2015, Paladin exercised its optional redemption right for the remaining US$10.75M convertible bonds, settling on 18 May 2015.
The documents comprising the Financial Report for the year ended 30 June 2015, including the Management Discussion and Analysis, Financial Statements and Certifications are attached and will be filed with the Company’s other documents on Sedar (sedar.com) and on the Company’s website (paladinenergy.com.au).
Outlook
Uranium market
The TradeTech U3O8 Spot Price at the end of June 2015 was US$36.25/lb, approximately 29% higher than at the end of June 2014 when prices were close to a nine-year and post-Fukushima low.
It seems apparent that the uranium market could be in the early stages of a recovery from the earthquake and tsunami in Japan in March 2011 and its damaging effect on Japan’s nuclear power industry. Prior to March 2011, Japan was the world’s second largest consumer of uranium and since that time Japan has been almost absent from the market. Certain other major nuclear power producing nations, such as Germany, have implemented plans to reduce or eliminate nuclear power.
Paladin holds a belief that a meaningful turnaround for uranium is underway. Our views are predicated on a number of key elements:
Many countries that eliminated or reduced their nuclear reliance are now encountering significant consequences and switching back to nuclear – Japan, in particular, is a key uranium customer now switching back to nuclear. In August 2015, Kyushu Electric Power’s Sendai 1 nuclear reactor became the first in Japan to restart operation.
Demand is rapidly accelerating in new markets – All of the ‘BRICS’ countries (i.e., Brazil, Russia, India, China and South Africa) are rapidly growing their nuclear power capacity and increasing their reliance on nuclear power as a proportion of overall power generation.
Current prices will constrain supply – According to supply cost curves published by industry analysts, approximately one third of current mine supply is uneconomic at the current spot price. Low prices are forcing producers to curtail mining, development and exploration. According to industry analysts, in the 2014 calendar year, at least 12 million pounds of annual U3O8 supply has been eliminated.
For
per
sona
l use
onl
y
385636_1 Page 5
Company strategy
Despite the Company’s belief that a uranium industry turnaround is tentatively underway, its current strategies are focused on optimising actions to maximise cash flow whilst also prudently enacting capital management actions. Paladin’s strategies are aimed at maximising shareholder value through the uranium price downturn whilst remaining positioned for a future normalisation of the uranium market and price. Key elements of the Company’s strategy include:
Maximising LHM operating cash flows through optimisation initiatives that preserve the integrity of the long-term life of mine plan.
Maintaining KM and the Company’s exploration assets on a minimal expenditure, care and maintenance basis.
Minimise corporate and administrative costs.
Consider strategic initiatives with respect to partnerships, strategic investment, funding and corporate transactions, that result in de-risking Paladin’s funding structure or clear value accretion for shareholders.
Cash flow optimisation initiatives
Subsequent to the US$33M in cost reductions announced on 30 July 2015, Paladin has identified further significant cash flow optimisation initiatives. Such initiatives include:
LHM operating initiatives – As a consequence of the BRP, barren solution used for wash in the counter current decantation section of the LHM plant is expected to reduce from
approximately 50ppm U3O8 to less than 10ppm. This will result in a significant improvement
in wash efficiency. The Company’s original FY2016 outlook assumed wash efficiency of 93.1%. Paladin now anticipates a wash efficiency in the range of 95% to 98% for FY2016. The Company has also revised its FY2016 life of mine plan for LHM resulting in an average
feed grade of 694ppm U3O8, i.e., an increase of 11ppm over the guidance provided in the
last Quarterly Activities Report announced on 16 July 2015.
Corporate costs, exploration and KM initiatives – Paladin has implemented reductions in these areas to further reduce annualised cash expenditure by approximately US$8M over the initiatives set out in the cost reduction announcement of 30 July 2015 (i.e., a cumulative US$14M less than FY2015). The additional initiatives include a reduction in approximately 50% of corporate staff that was undertaken on 21 August 2015 concurrent with the reduction in the number of directors and reduction in board fees announced the same day. Exploration has been put on care and maintenance whereby the Company will undertake the work required to meet minimum license expenditures only.
Company outlook
Paladin has acted quickly to identify additional cash flow optimisation initiatives and now anticipates that based on current spot uranium price and foreign exchange rates, the Company will be cash flow neutral for FY2016 taking into account LHM operating cash flow, capital expenditure, corporate costs, exploration costs, KM care and maintenance costs and debt servicing and repayments (i.e., on an ‘all in’ basis). However, this excludes one-off restructuring and implementation costs of approximately US$6M and does not take into account any positive or negative adjustments for potential capital management or strategic initiatives.
Key relevant guidance items for FY2016 include:
LHM Production – Production guidance remains in the previously stated range of 5.0Mlb to 5.4Mlb U3O8.
Sales price premium – The Company has a number of contracts for FY2016 with a fixed price element. Based on current spot uranium price, the Company would anticipate a weighted average premium of US$4/lb for its FY2016 received selling price.
For
per
sona
l use
onl
y
385636_1 Page 6
LHM C1 cash costs – Paladin is targeting LHM C1 cash costs in the range of US$25/lb to US$27/lb on average for FY2016 (i.e., 7-14% lower than FY2015).
Corporate costs, exploration and KM – Combined expenditure on corporate costs, exploration and KM care and maintenance is forecast to be approximately US$19M excluding one off costs associated with retrenchments and contract cancellations. This is a reduction of US$8M compared to the cost reductions announced on 30 July 2015 and a reduction of US$14M compared to FY2015.
In line with its forecast to be cash flow neutral through to the end of FY2016, the Company currently anticipates its group cash balance to fall to US$120-130M at 30 September 2015. The reasons for this cash burn in the quarter to 30 September 2015 include:
Timing of sales under key contracts – The impact of the bi-annual delivery into the CNNC contract and contractual deliveries to a North American utility mean approximately 500,000lbs of uranium sales occur in the quarter to 31 December 2015 for production incurred in the quarter to 30 September 2015. Additionally, due to timing and payment terms, the proceeds for the sales that will be recognised in the September 2015 quarter will be received in the December 2015 quarter.
Higher than trend LHM C1 cash costs – The timing of delivery on cash flow processing related optimisation initiatives and the revised mine plan will likely result in C1 cash costs for the quarter to 30 September 2015 around US$2-3/lb higher than the average forecast for FY2016.
Convertible bond interest payment – the first interest payment, amounting to US$5.3M, on the new US$150M convertible bond will be paid in September 2015.
One-off restructuring costs – The Company has incurred approximately US$6M in one off redundancy, restructuring and implementation costs associated with cash flow optimisation initiatives, which will be predominantly spent in the quarter to 30 September 2015.
At current spot uranium price and foreign exchange rates, Paladin expects each of the three quarters subsequent to the quarter ending 30 September 2015 to be substantially cash flow positive on an ‘all in’ basis, resulting in a cash flow neutral position by 30 June 2016.
GENERALLY ACCEPTED ACCOUNTING PRACTICE
The news release includes non-GAAP performance measures: C1 cost of production, non-cash costs as well as other income and expenses. The Company believes that, in addition to the conventional measures prepared in accordance with GAAP, the Company and certain investors use this information to evaluate the Company’s performance and ability to generate cash flow. The additional information provided herein should not be considered in isolation or as a substitute for measures of performance prepared in accordance with GAAP.
DECLARATION
The information in this announcement that relates to minerals exploration and mineral resources is based on information compiled by David Princep BSc, FAusIMM (CP) who has sufficient experience that is relevant to the style of mineralisation and type of deposit under consideration and to the activity that he is undertaking to qualify as Competent Person as defined in the 2012 Edition of the Australasian Code for Reporting of Exploration Results, Mineral Resources and Ore Reserves (JORC Code). Mr Princep is a full-time employee of Paladin Energy Ltd. Mr. Princep consents to the inclusion of the information in this announcement in the form and context in which it appears.
For
per
sona
l use
onl
y

385636_1 Page 7
CONFERENCE CALL
Conference Call and Investor Update is scheduled for 06:30 Perth & Hong Kong, Friday 28 August 2015; 18:30 Toronto and 23:30 London, Thursday 27 August 2015. Details are included in a separate news release dated 24 August 2015.
CONTACTS
For additional information, please contact:
Andrew Mirco Investor Relations Contact (Perth) Tel: +61-8-9423-8162 or Mobile: +61-409-087-171 Email: [email protected]
For
per
sona
l use
onl
y
375100_11
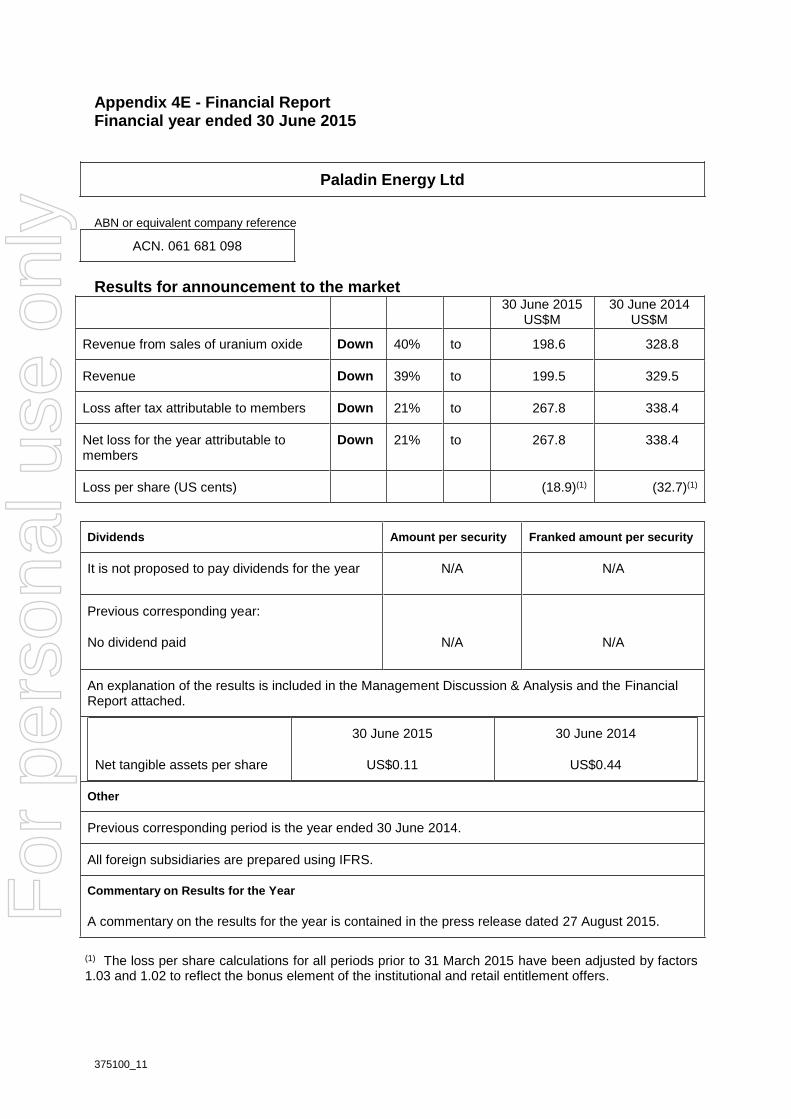
Appendix 4E - Financial Report Financial year ended 30 June 2015
Paladin Energy Ltd
ABN or equivalent company reference
ACN. 061 681 098
Results for announcement to the market
30 June 2015
US$M 30 June 2014
US$M
Revenue from sales of uranium oxide Down 40% to 198.6 328.8
Revenue Down 39% to 199.5 329.5
Loss after tax attributable to members Down 21% to 267.8 338.4
Net loss for the year attributable to members
Down 21% to 267.8 338.4
Loss per share (US cents) (18.9)(1) (32.7)(1)
Dividends Amount per security Franked amount per security
It is not proposed to pay dividends for the year N/A N/A
Previous corresponding year:
No dividend paid
N/A
N/A
An explanation of the results is included in the Management Discussion & Analysis and the Financial Report attached.
Net tangible assets per share
30 June 2015
US$0.11
30 June 2014
US$0.44
Other
Previous corresponding period is the year ended 30 June 2014.
All foreign subsidiaries are prepared using IFRS.
Commentary on Results for the Year
A commentary on the results for the year is contained in the press release dated 27 August 2015.
(1) The loss per share calculations for all periods prior to 31 March 2015 have been adjusted by factors 1.03 and 1.02 to reflect the bonus element of the institutional and retail entitlement offers.
For
per
sona
l use
onl
y
375100_11
PALADIN ENERGY LTD
ACN 061 681 098
ANNUAL
REPORT
2015
For
per
sona
l use
onl
y
2
CONTENTS __________________________________________________________________________________
375100_11
CORPORATE VALUES AND KEY ACHIEVEMENTS ........................................................................... 3
INSIGHTS FROM THE INTERIM CEO ................................................................................................... 6
NUCLEAR POWER – GETTING BACK ON TRACK ............................................................................. 7
MANAGEMENT DISCUSSION AND ANALYSIS ................................................................................. 10
REVIEW OF OPERATIONS ............................................................................................................. 11
HEALTH & SAFETY ......................................................................................................................... 29
FINANCIAL REVIEW ....................................................................................................................... 31
SUSTAINABLE DEVELOPMENT ......................................................................................................... 42
ENVIRONMENT ............................................................................................................................... 42
CORPORATE SOCIAL RESPONSIBILITY ...................................................................................... 46
OUR PEOPLE .................................................................................................................................. 55
COPORATE GOVERNANCE STATEMENT ....................................................................................... 60
DIRECTORS' REPORT......................................................................................................................... 61
REMUNERATION REPORT ............................................................................................................ 68
CONTENTS OF THE FINANCIAL REPORT ........................................................................................ 89
CONSOLIDATED INCOME STATEMENT ........................................................................................... 90
CONSOLIDATED STATEMENT OF COMPREHENSIVE INCOME .................................................... 91
CONSOLIDATED STATEMENT OF FINANCIAL POSITION .............................................................. 92
CONSOLIDATED STATEMENT OF CHANGES IN EQUITY .............................................................. 93
CONSOLIDATED STATEMENT OF CASH FLOWS ........................................................................... 94
NOTES TO THE CONSOLIDATED FINANCIAL STATEMENTS ........................................................ 95
DIRECTORS’ DECLARATION ........................................................................................................... 157
INDEPENDENT AUDIT REPORT ....................................................................................................... 158
ADDITIONAL INFORMATION ............................................................................................................ 160
CORPORATE DIRECTORY ............................................................................................................... 166
The annual report covers the Group consisting of Paladin Energy Ltd (referred throughout as the Company or Paladin) and its controlled entities. Paladin Energy Ltd is a company limited by shares, incorporated and domiciled in Australia. Its registered office and principal place of business is: Paladin Energy Ltd Level 4 502 Hay Street SUBIACO WA 6008 Through the use of the internet, we have ensured that our corporate reporting is timely, complete, and available globally at minimum cost to the Company. All press releases, financial statements and other information are available on our website www.paladinenergy.com.au.
For
per
sona
l use
onl
y

3
CORPORATE VALUES AND KEY ACHIEVEMENTS __________________________________________________________________________________
CORPORATE VALUES
Create shareholder wealth by developing the considerable opportunities Paladin has and continues to generate.
Become a major player in the global uranium supply market.
Operate at global best practice with particular emphasis on safety and the environment.
Reward employee performance and provide a fulfilling work environment.
Contribute to the growth and prosperity of the countries in which Paladin operates by conducting operations in an efficient and effective manner and by seeking out opportunities for expansion.
Respond to the attitudes and expectations of the communities in which it operates as part of its commitment to corporate social responsibility.
Act with integrity, honesty and cultural sensitivity in all of its dealings.
PALADIN TODAY
Overview
Paladin’s value is based on five key drivers - production, quality pipeline, proven team, industry positioning and sustainability of operations.
Operations
Langer Heinrich Mine - Focus on process optimisation and cost reduction. - Successful process innovation at Langer Heinrich should provide a pathway to C1 cash
costs1 substantially lower than recent experience.
Kayelekera Mine - Placed on care and maintenance due to low uranium prices and non-profitability. - Maintaining plant, infrastructure and critical aspects of intellectual property and
operational knowhow to allow for a quick restart, when justified. - Care and maintenance to preserve the orebody to recommence production once the
uranium price provides sufficient incentive (circa US$75/lb).
Innovation & Project Pipeline
Proven track record in mining and processing innovation.
Established in-house technical strength.
Consolidating a unique, geographically diversified asset base.
Positioning Going Forward
Only non-aligned, independent, pure-play uranium producer.
Long-term business strategy and vision is to continue to strengthen through key partnerships.
Maintain Paladin as a partner of choice.
Technical innovation, process optimisation and cost reduction an ongoing focus.
Project pipeline able to drive organic growth.
1 Refer to ‘Non IFRS Measure’ in Financial Review section.
For
per
sona
l use
onl
y

4
CORPORATE VALUES AND KEY ACHIEVEMENTS __________________________________________________________________________________
KEY ACHIEVEMENTS FOR THE YEAR
July 2014 Settlement of sale of 25% minority interest in Langer Heinrich to subsidiary of China National Nuclear Corporation for US$190M. Successful refinancing of Langer Heinrich financing facility.
December 2014 Entitlement offer and institutional placement raises A$205M. Cornerstone strategic investor – HOPU Clean Energy (Singapore) Pte. Ltd – on register with 15% equity.
February 2015 Issue of US$100M senior unsecured convertible bonds (CB) issued to high quality institutional investors.
March 2015 Additional US$50M CBs issued to subsidiary of China Investment Corporation (CIC).
March 2015 Key optimisation success at Langer Heinrich. Bicarbonate Recovery Plant (BRP) commissioned and operating above design.
April 2015 Completion of repurchase of US$300M CBs, due November 2015.
June 2015 Strategic acquisition of Carley Bore uranium deposit to consolidate and enhance Manyingee project.
June 2015 Historic decision by Canadian government to exempt Paladin from the Non-Resident Ownership Policy in relation to the Michelin Project in Newfoundland and Labrador.
For
per
sona
l use
onl
y

5
CORPORATE VALUES AND KEY ACHIEVEMENTS __________________________________________________________________________________
WHAT WE SET OUT TO DO IN 2015
2015 production guidance for Langer Heinrich in the range of 5.4 to 5.8Mlb U3O8. - Revised guidance 5.0 to 5.2Mlb U3O8. Achieved 5.04Mlb.
Continue to reduce unit production costs at Langer Heinrich via:
- Focused cost management. - Optimisation of existing processes. - Ongoing development and introduction of process innovation.
Improve health and safety performance across the Group.
Increase value through strategic partnerships.
Advance approvals process to enable a Field Leach Trial at Manyingee.
Strengthen balance sheet through continued debt reduction.
Maintain Kayelekera Mine in operational ready status.
WHAT WE PLAN TO DO IN 2016
2016 production guidance for Langer Heinrich in the range of 5.0Mlb to 5.4Mlb U3O8.
Focussed cost reduction and optimisation efforts to achieve group-wide sustainability.
Strengthen balance sheet through debt reduction.
Continue to increase efficiency and productivity at Langer Heinrich through successful process innovation.
CODE
Achieved
Ongoing
Not achieved
For
per
sona
l use
onl
y
6
INSIGHTS FROM THE INTERIM CEO __________________________________________________________________________________
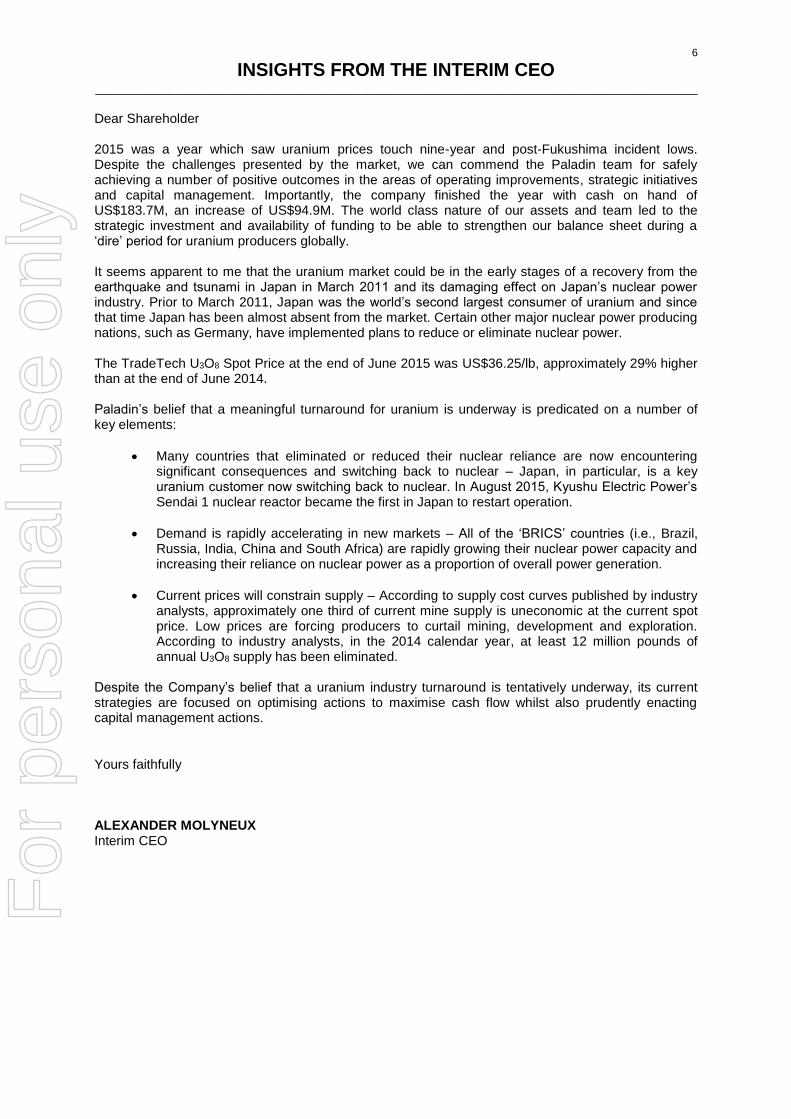
Dear Shareholder 2015 was a year which saw uranium prices touch nine-year and post-Fukushima incident lows. Despite the challenges presented by the market, we can commend the Paladin team for safely achieving a number of positive outcomes in the areas of operating improvements, strategic initiatives and capital management. Importantly, the company finished the year with cash on hand of US$183.7M, an increase of US$94.9M. The world class nature of our assets and team led to the strategic investment and availability of funding to be able to strengthen our balance sheet during a ‘dire’ period for uranium producers globally. It seems apparent to me that the uranium market could be in the early stages of a recovery from the earthquake and tsunami in Japan in March 2011 and its damaging effect on Japan’s nuclear power industry. Prior to March 2011, Japan was the world’s second largest consumer of uranium and since that time Japan has been almost absent from the market. Certain other major nuclear power producing nations, such as Germany, have implemented plans to reduce or eliminate nuclear power. The TradeTech U3O8 Spot Price at the end of June 2015 was US$36.25/lb, approximately 29% higher than at the end of June 2014. Paladin’s belief that a meaningful turnaround for uranium is underway is predicated on a number of key elements:
Many countries that eliminated or reduced their nuclear reliance are now encountering significant consequences and switching back to nuclear – Japan, in particular, is a key uranium customer now switching back to nuclear. In August 2015, Kyushu Electric Power’s Sendai 1 nuclear reactor became the first in Japan to restart operation.
Demand is rapidly accelerating in new markets – All of the ‘BRICS’ countries (i.e., Brazil, Russia, India, China and South Africa) are rapidly growing their nuclear power capacity and increasing their reliance on nuclear power as a proportion of overall power generation.
Current prices will constrain supply – According to supply cost curves published by industry analysts, approximately one third of current mine supply is uneconomic at the current spot price. Low prices are forcing producers to curtail mining, development and exploration. According to industry analysts, in the 2014 calendar year, at least 12 million pounds of annual U3O8 supply has been eliminated.
Despite the Company’s belief that a uranium industry turnaround is tentatively underway, its current strategies are focused on optimising actions to maximise cash flow whilst also prudently enacting capital management actions.
Yours faithfully
ALEXANDER MOLYNEUX Interim CEO
For
per
sona
l use
onl
y
7
NUCLEAR POWER – GETTING BACK ON TRACK __________________________________________________________________________________
375100_11
The March 2011 Great East Japan earthquake and resultant tsunami severely damaged the Fukushima-Diiachi reactor complex and set in motion market forces which continue to negatively impact the global uranium market. While conditions in Japan are showing noticeable improvement as discussed below, the FY2015 market suffered from the Fukushima after-effects. While growth in global commercial nuclear power remains strong and increasing, the clearly identified shift from the traditional nuclear power regions/countries of North America (predominantly the United States), Western Europe and Japan continues unabated. During FY2015, installed nuclear capacity rose in China, South Korea, Russia and Argentina while Japan lost units to decommissioning as did the United States. The natural uranium production sector which had experienced uninterrupted growth since 2006 reported a decline in output of 9Mlb (6%) as a host of production problems began to be revealed, supplemented by existing production centres being placed on care and maintenance or output curtailed in response to persistent depressed uranium prices. Spot Uranium Price Volatility Prevailed During FY2015, the spot uranium price demonstrated substantial volatility beginning the year at around US$28.00/lb before rising to US$44.00/lb in mid-November, an increase of 56% in less than six months. The near-term price then plunged to US$35.50/lb by the end of the calendar year, a decline of 20% in less than two months. Entering CY2015, the spot price rose, once again, to US$39.50/lb (late March) a gain of over 11% before dropping to US$35.00/lb by the end of May. Overall, the uranium spot price ended the year at US$36.75/lb, showing an increase of 30% for the 12 month period. The long-term uranium price which tends to reflect market conditions several years in the future, showed much less volatility, starting the year at US$44.00/lb then rising to US$50.00/lb by late November before declining to US$46.00/lb at the end of May. Operational Reactors Increased FY2015 saw the number of operational nuclear reactors increase by a total of three units as China (+6), South Korea (+1), Russia (+1), and Argentina (+1) placed new units in commercial operation while a single reactor was decommissioned in the United States and Japanese utilities made the decision to permanently close five older, smaller reactors in the face of economically unjustified safety upgrades under the Nuclear Regulatory Authority post-Fukushima guidelines. Compared to the global situation immediately preceding Fukushima, the total number of operational reactors is down slightly to six reactors in total), a reflection of the decommissioning initiatives in Japan, Germany and, to a lesser degree, the United States but, much more importantly, the number of reactors under construction now stands at 66 units (compared to 62) and the number of planned reactors is currently 10 reactors higher than in March 2011. China Driving Global Commercial Nuclear Power Reactors classified as “under construction” declined during FY2015 as a number of Chinese reactors entered commercial operations but were yet to be followed by further new build authorisations, a condition which changed in March 2015 when the China State Council approved the construction of two additional units at the Hongyanhe NPP with further such authorisations anticipated. The Chinese government continues to aggressively pursue the development of a significant commercial nuclear programme in support of increasing electricity needs and implementation of climate change goals. Installed nuclear capacity of 58 Gwe remains the 2020 objective with China planning to eclipse the United States nuclear programme as the largest in the world by 2025, having operational reactors totalling 100 Gwe or more.
For
per
sona
l use
onl
y
8
NUCLEAR POWER – GETTING BACK ON TRACK (continued)
__________________________________________________________________________________
Japanese Nuclear Power Poised to Restart Post-Fukushima, the commercial nuclear power programme in Japan has been under heightened scrutiny as the government created the independent Nuclear Regulatory Authority (NRA) which then developed and promulgated far-ranging safety guidelines for nuclear power plants. Japanese utilities have submitted safety evaluation requests for a total of 24 reactors located at 13 sites, representing almost 60% of the currently operational Japanese reactors. Sendai 1 & 2, (Kyushu Electric Power Company) are now likely to restart in the September quarter 2015 while NRA preliminary approvals have been given to Takahama 3 & 4 (Hokuriku Electric Power) and Ikata 3 (Shikoku Electric Power), with the Takahama units under a temporary court injunction against their operations. In mid-April, the Japanese Cabinet approved the “Strategic Energy Plan” calling for nuclear power to represent 20-22% of total installed generating capacity by 2030. That target would require not only operating life extension for a number of units but also new reactor construction to proceed. India’s Nuclear Programme Moving Forward After a period of relative stagnation, the newly-elected Prime Minister, Narendra Modi, has reinvigorated the Indian commercial nuclear power programme supporting term contracts with Kazakhstan, Uzbekistan and Canada (Cameco). Additional multi-year purchase commitments are expected as the country’s meagre nuclear generation (supplied 3.5% of total electricity in 2014) grows from the current 21 operating reactors (5.3 Gwe) reaching 14.6 Gwe by 2020 with the 2050 target being nuclear-generated electricity providing 25% of the nation’s needs. In order to support its expanding nuclear programme, India announced in mid-July 2015 that the country will pursue the creation of a strategic uranium reserve totalling 13Mlb which will increase to 39Mlb as the installed nuclear capacity rises into the future. Global Uranium Production Struggling Global uranium output stumbled during CY2014 declining from the CY2013 level of 154Mlb down to 145Mlb. A myriad of factors were in play as operational problems resulted in significant reductions at both Ranger (Australia) and Rössing (Namibia) while Areva’s Somaïr operation (Niger) produced at a reduced rate. Even Canada’s prolific Athabaska Basin operations reported a 3% decline in annual uranium production. In addition to Paladin’s Kayelekera Mine (Malawi), UraniumOne’s ISR production facility at Honeymoon (South Australia) was placed on care and maintenance while some United States-based ISR mines held production at contracted levels. Looking forward, FY2016 will see increased output from the Cigar Lake Mine (Canada) and the possible initiating of mining at the Husab Project (CGNPC) in Namibia. However, aggregate global uranium production might not exceed 150-152Mlbs as producers struggle with unsustainably depressed uranium prices. Term Uranium Contracting on the Rise The vast majority of natural uranium concentrates are delivered to utility end-users under term (multi-year) purchase agreements. Since 1995, the two largest uranium consuming regions, the United States and the European Union, reported total purchases aggregating 1.9Blb U3O8 with 87% of that total being delivered under term uranium agreements. During CY2013, global term contracting volume totalled about 20Mlb for future delivery, a far cry from the annual average of 155Mlb or more. That term contracting activity increased in CY2014 to around 80Mlb, a decided improvement but still far short of the normal term contracting activity by the world’s nuclear utilities.
For
per
sona
l use
onl
y

9
NUCLEAR POWER – GETTING BACK ON TRACK (continued)
__________________________________________________________________________________
During the first half of CY2015, several nuclear utilities, located in the United States, Western Europe and Asia/Pacific (non-China) have either entered the term market or have indicated plans to pursue additional longer term uranium coverage with deliveries beginning 2017-2018 and extending well into the next decade. These procurement programmes will truly test the availability of uranium later in this decade and past 2020. Nowhere is the need for future uranium coverage most evident than in the United States. The United States government agency, the U.S. Energy Information Administration, provides comprehensive data regarding United States nuclear utility nuclear fuel procurement and forward forecasts. According to its “2014 Uranium Marketing Annual Report”, the United States nuclear utilities need to secure deliveries totalling 283Mlb over the period 2015-2024, representing almost 60% of their ten-year forward total uranium requirements. Interestingly, United States utility contractual coverage for a ten year forward period has declined consistently over the past seven years. Uranium Supply Deficits Looming Paladin continues to revise/update its internal annual uranium demand, supply and price assessment and forecasts. That comprehensive analysis of the global uranium market underscores the absolute imperative for the development of additional uranium production in the immediate near future. That conclusion is increasingly being reached by industry analysts as well as financial analysts focused on the uranium sector. At this point in time, the principal question remains the timing of the market reaction to the fully recognised fundamentals of uranium demand and supply.
For
per
sona
l use
onl
y

10
MANAGEMENT DISCUSSION AND ANALYSIS __________________________________________________________________________________
The following Management Discussion and Analysis (“MD&A”) for Paladin Energy Ltd (“Company”) and its controlled entities (“Group”) should be read in conjunction with the Consolidated Financial Statements for the year ended 30 June 2015. The effective date of this report is 27 August 2015. The financial information presented in this MD&A has been extracted from the attached financial statements. For the purpose of preparing our MD&A, we consider the materiality of information. Information is considered material if: (i) such information results in, or would reasonably be expected to result in, a significant change in market price or value of our shares; or (ii) there is a substantial likelihood that a reasonable investor would consider it important in making an investment decision; or (iii) it would significantly alter the total mix of information available to investors. We evaluate materiality with reference to all relevant circumstances, including potential market sensitivity. Additional information relating to the Company, including public announcements, is available at www.paladinenergy.com.au. FORWARD LOOKING STATEMENTS Some of the statements contained in this MD&A, including those relating to strategies and other statements, are predictive in nature, and depend upon or refer to future events or conditions, or include words such as “expects”, “intends”, “plans”, “anticipates”, “believes”, “estimates”, “with an expectation of”, “is expected”, “are expected”, or similar expressions that are forward looking statements. Forward looking statements include, without limitation, the information concerning possible or assumed further results of operations as set forth herein. These statements are not historical facts but instead represent only expectations, estimates and projections regarding future events and are qualified in their entirety by the inherent risks and uncertainties surrounding future expectations generally. The forward looking statements contained in this MD&A are not guarantees of future performance and involve certain risks and uncertainties that are difficult to predict. The future results of the Group may differ materially from those expressed in the forward looking statements contained in this MD&A due to, among other factors, the risks and uncertainties inherent in the business of the Group. The Company does not undertake any obligation to update or release any revisions to these forward looking statements to reflect events or circumstances after the date of this MD&A or to reflect the occurrence of anticipated events.
For
per
sona
l use
onl
y
11
MANAGEMENT DISCUSSION AND ANALYSIS REVIEW OF OPERATIONS
PROJECT LOCATIONS AND RESOURCE OVERVIEW
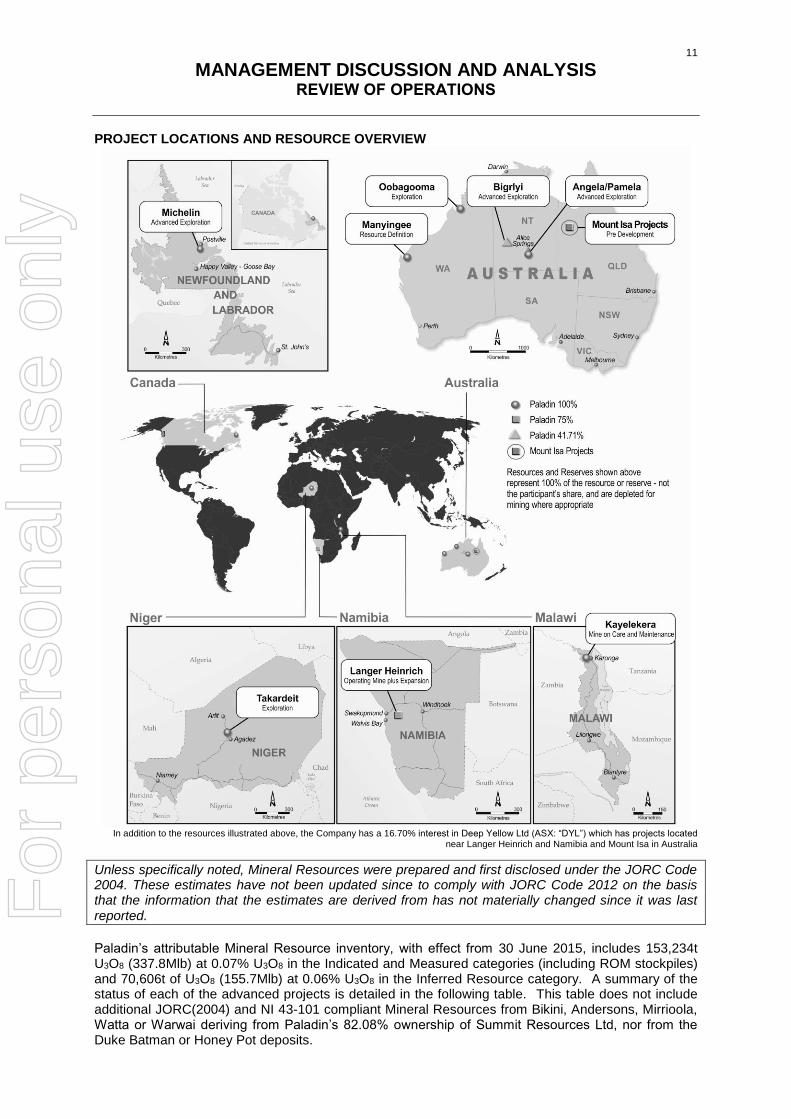
In addition to the resources illustrated above, the Company has a 16.70% interest in Deep Yellow Ltd (ASX: “DYL”) which has projects located
near Langer Heinrich and Namibia and Mount Isa in Australia
Unless specifically noted, Mineral Resources were prepared and first disclosed under the JORC Code 2004. These estimates have not been updated since to comply with JORC Code 2012 on the basis that the information that the estimates are derived from has not materially changed since it was last reported.
Paladin’s attributable Mineral Resource inventory, with effect from 30 June 2015, includes 153,234t U3O8 (337.8Mlb) at 0.07% U3O8 in the Indicated and Measured categories (including ROM stockpiles) and 70,606t of U3O8 (155.7Mlb) at 0.06% U3O8 in the Inferred Resource category. A summary of the status of each of the advanced projects is detailed in the following table. This table does not include additional JORC(2004) and NI 43-101 compliant Mineral Resources from Bikini, Andersons, Mirrioola, Watta or Warwai deriving from Paladin’s 82.08% ownership of Summit Resources Ltd, nor from the Duke Batman or Honey Pot deposits.
For
per
sona
l use
onl
y
12
MANAGEMENT DISCUSSION AND ANALYSIS REVIEW OF OPERATIONS (continued)
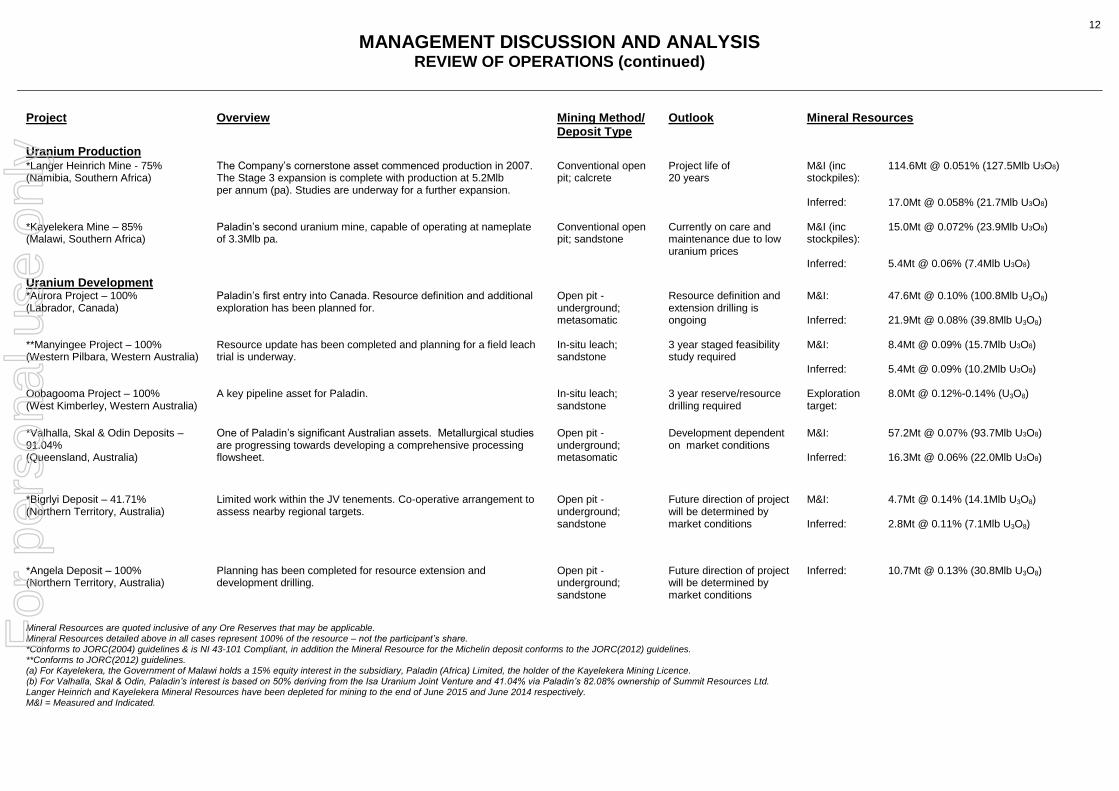
Project
Overview Mining Method/ Deposit Type
Outlook
Mineral Resources
Uranium Production
*Langer Heinrich Mine - 75% (Namibia, Southern Africa)
The Company’s cornerstone asset commenced production in 2007. The Stage 3 expansion is complete with production at 5.2Mlb per annum (pa). Studies are underway for a further expansion.
Conventional open pit; calcrete
Project life of 20 years
M&I (inc stockpiles): Inferred:
114.6Mt @ 0.051% (127.5Mlb U3O8) 17.0Mt @ 0.058% (21.7Mlb U3O8)
*Kayelekera Mine – 85% (Malawi, Southern Africa)
Paladin’s second uranium mine, capable of operating at nameplate of 3.3Mlb pa.
Conventional open pit; sandstone
Currently on care and maintenance due to low uranium prices
M&I (inc stockpiles): Inferred:
15.0Mt @ 0.072% (23.9Mlb U3O8) 5.4Mt @ 0.06% (7.4Mlb U3O8)
Uranium Development
*Aurora Project – 100% (Labrador, Canada)
Paladin’s first entry into Canada. Resource definition and additional exploration has been planned for.
Open pit - underground; metasomatic
Resource definition and extension drilling is ongoing
M&I: Inferred:
47.6Mt @ 0.10% (100.8Mlb U3O8) 21.9Mt @ 0.08% (39.8Mlb U3O8)
**Manyingee Project – 100% (Western Pilbara, Western Australia)
Resource update has been completed and planning for a field leach trial is underway.
In-situ leach; sandstone
3 year staged feasibility study required
M&I: Inferred:
8.4Mt @ 0.09% (15.7Mlb U3O8) 5.4Mt @ 0.09% (10.2Mlb U3O8)
Oobagooma Project – 100% (West Kimberley, Western Australia)
A key pipeline asset for Paladin.
In-situ leach; sandstone
3 year reserve/resource drilling required
Exploration target:
8.0Mt @ 0.12%-0.14% (U3O8)
*Valhalla, Skal & Odin Deposits – 91.04% (Queensland, Australia)
One of Paladin’s significant Australian assets. Metallurgical studies are progressing towards developing a comprehensive processing flowsheet.
Open pit - underground; metasomatic
Development dependent on market conditions
M&I: Inferred:
57.2Mt @ 0.07% (93.7Mlb U3O8) 16.3Mt @ 0.06% (22.0Mlb U3O8)
*Bigrlyi Deposit – 41.71% (Northern Territory, Australia)
Limited work within the JV tenements. Co-operative arrangement to assess nearby regional targets.
Open pit - underground; sandstone
Future direction of project will be determined by market conditions
M&I:
Inferred:
4.7Mt @ 0.14% (14.1Mlb U3O8) 2.8Mt @ 0.11% (7.1Mlb U3O8)
*Angela Deposit – 100% (Northern Territory, Australia)
Planning has been completed for resource extension and development drilling.
Open pit - underground; sandstone
Future direction of project will be determined by market conditions
Inferred: 10.7Mt @ 0.13% (30.8Mlb U3O8)
Mineral Resources are quoted inclusive of any Ore Reserves that may be applicable. Mineral Resources detailed above in all cases represent 100% of the resource – not the participant’s share. *Conforms to JORC(2004) guidelines & is NI 43-101 Compliant, in addition the Mineral Resource for the Michelin deposit conforms to the JORC(2012) guidelines. **Conforms to JORC(2012) guidelines. (a) For Kayelekera, the Government of Malawi holds a 15% equity interest in the subsidiary, Paladin (Africa) Limited, the holder of the Kayelekera Mining Licence. (b) For Valhalla, Skal & Odin, Paladin’s interest is based on 50% deriving from the Isa Uranium Joint Venture and 41.04% via Paladin’s 82.08% ownership of Summit Resources Ltd. Langer Heinrich and Kayelekera Mineral Resources have been depleted for mining to the end of June 2015 and June 2014 respectively. M&I = Measured and Indicated.
For
per
sona
l use
onl
y

13
MANAGEMENT DISCUSSION AND ANALYSIS REVIEW OF OPERATIONS (continued)
NAMIBIA LANGER HEINRICH MINE (LHM) Paladin through its Namibian subsidiary, Langer Heinrich Uranium (Pty) Ltd 75% and CNNC Overseas Uranium Holding Limited 25% Following the sale of a 25% equity stake to CNNC Overseas Uranium Holding Limited (CNNC), a wholly-owned subsidiary of China National Nuclear Corporation, Paladin owns 75% of LHM in Namibia through its Namibian subsidiary, Langer Heinrich Uranium (Pty) Ltd (LHUPL). Paladin purchased the Langer Heinrich project in August 2002 and, following development and construction, production commenced from the open pit mine and conventional alkaline leach plant in early 2007, with annual production of 2.7Mlb of U3O8 achieved in FY2009. Soon afterwards, a Stage 2 expansion was undertaken to increase production to 3.7Mlb pa U3O8, followed by construction and commissioning of the Stage 3 expansion, completed in FY2012 resulting in production over 5Mlb. Langer Heinrich is a surficial, calcrete type uranium deposit containing a Mineral Resource of 57,831t U3O8 at a grade of 0.050% U3O8 in the Measured and Indicated categories (including ROM stockpiles) in seven mineralised zones designated Detail 1 to 7 (see figure below), along the length of the Langer Heinrich valley within the 15km length of a contiguous paleodrainage system. The deposit is located in the Namib Desert, 80km from the major seaport of Walvis Bay.
Operations Langer Heinrich produced 5.037Mlb (2,284t) U3O8 in FY2015, down 13% from the previous year’s total of 5.822Mlb (2,641t) U3O8. Recoveries through the plant decreased by 3% from the previous year to 87.6% with a decrease in feed grade of 2% to 768ppm. The major contributor to the lower production was a decrease in plant throughput of 8.8% from the record of FY2014, due largely to a major scaling incident that occurred early in the year and is now resolved. The mine has recently recruited an experienced production manager and already a positive impact on the plant can be seen. With the Husab mine and the aggressive recruitment by surrounding mines in the Erongo region, staff retention has been a challenge. Consequently, the mine has embarked on a number of initiatives to ensure stability returns to staff turnover rates.
With the declining uranium price, initiatives to reduce the operating and unit costs at LHM continued to be front and centre, with a number of improvements identified and implemented. In this regard, the most notable is the Bicarbonate Recovery Plant (BRP) which was commissioned in the June quarter. The BRP has surpassed all design expectations and at the time of writing was operating at approximately 148% of design capacity. In the coming year the Company expects to approximately double the beneficial impact of this technology at LHM. Already, a significant reduction in operating cost has been experienced as a consequence of the project which has demonstrated a capital pay-back period of less than 6 months. The BRP involves leading edge technology for which Paladin has
For
per
sona
l use
onl
y

14
MANAGEMENT DISCUSSION AND ANALYSIS REVIEW OF OPERATIONS (continued)
developed and owns the intellectual property. Suitable patent protection has been applied for to protect this very valuable intellectual property asset that is expected to have broad application throughout the uranium processing sector. Future production and possible expansion options to allow the treating of much lower feed grade are still being considered and advanced. Various evaluations have been completed or planned on piloting and testing programmes to test the most promising options and enhancements. The goal of this work is to increase production at lower unit costs and at lower grades. The focus is also on improved process efficiencies and operability and the BRP is a good example of the outcomes being sought. A focus on cost reduction and efficiency remains at the forefront going into FY2016 with an expectation of significant benefits going forward. Mineral Resources and Ore Reserves Estimation Mineral Resources and Ore Reserves conforming to both the JORC(2004) code and NI 43-101 are detailed below. Mineral Resource estimate (250ppm U3O8 cut-off)
Mt Grade % U3O8 t U3O8 Mlb U3O8
Measured 19.6 0.056 10,912 24.1
Indicated 62.9 0.054 34,051 75.1
Measured + Indicated 82.5 0.055 44,964 99.1
Stockpiles 32.1 0.040 12,867 28.4
Inferred 17.0 0.06 9,842 21.7
(Figures may not add due to rounding and are quoted inclusive of any Ore Reserves, and have been depleted for mining to the end of June 2015).
Ore Reserves Economic analysis on this resource has indicated a break-even cut-off grade of 250ppm. Ore Reserve Estimate (250ppm U3O8 cut-off)
Mt Grade % U3O8 t U3O8 Mlb U3O8
Proved 15.80 0.057 8,955 19.74
Probable 52.83 0.055 29,273 64.54
Stockpiles 32.1 0.040 12,867 28.37
Total 100.7 0.051 51,095 112.64
Ore Reserve has been depleted for mining to the end of June 2015.
The Ore Reserve was estimated from the original un-depleted Measured and Indicated Mineral Resource of 139.3Mt at a grade of 0.055% U3O8. The Mineral Resource estimate was completed using Multi-Indicator Kriging and incorporates a specific adjustment based on expected mining parameters. As a result, additional dilution and mining recovery are not included in the Ore Reserve estimation. These reserves form the basis of the continuing life of mine plan for the Project. The revised mine plan allows a project life of 20 years, based on current processing feed rates. Exploration (EPL3500) EPL3500 previously covered the western extension of the mineralised Langer Heinrich paleochannel. An application to convert the EPL to a mining lease has progressed through the regulatory process and the site has received notice of the intent to grant the licence application.
For
per
sona
l use
onl
y

15
MANAGEMENT DISCUSSION AND ANALYSIS REVIEW OF OPERATIONS (continued)
MALAWI KAYELEKERA MINE (KM) Kayelekera Mine (KM), which is currently on care and maintenance (C&M), is located in northern Malawi, 600km north of the country’s capital city, Lilongwe, and 52km west of the regional administrative and commercial centre of Karonga. Kayelekera is a sandstone-hosted uranium deposit, associated with the Permian Karoo sediments and hosted by the Kayelekera member of the North Rukuru sedimentary outcrop of the Karoo System. The mineralisation is associated with seven variably oxidised, coarse grained arkoses, separated by shales and mudstones. Uranium mineralisation occurs as lenses, primarily within the arkose layers and, to a lesser extent, in the mudstone. The lowest level of known mineralisation is at a depth of approximately 160m below surface. Kayelekera is owned 100% by Paladin (Africa) Limited (PAL), an 85% subsidiary of Paladin. In July 2009, Paladin issued 15% of the equity in PAL to the Government of Malawi (GoM) under the terms of the Development Agreement signed between PAL and the Government in February 2007, which established the fiscal regime and development framework for KM. PAL operates KM under the provisions of Environmental Certificate 27.3.1, granted in March 2007, following approval of the Kayelekera Project Environmental Impact Assessment (EIA) and Mining Licence ML152, granted in April 2007. ML152 covers an area of some 55km² surrounding the Kayelekera deposit and was granted for a period of 15 years, renewable for further 10-year periods. The EIA contained a Social Impact Assessment and Management Plan, which was implemented during the construction and operational phases of KM, with certain components continuing during C&M. Under the terms of the Development Agreement, PAL has undertaken various corporate social responsibility (CSR) obligations in relation to operation of a Social Responsibility Plan, Local Business Development and Community Consultation. Construction took place in 2007-9 and KM operated for five years from 2009-2014, producing a total of 10.7Mlb U3O8 in that period. As a consequence of sustained losses due to low prevailing uranium prices in the wake of the 2011 Fukushima incident, production at KM was suspended in May 2014. The operation was placed on C&M until such time as economic conditions improve sufficiently to enable KM to resume production with sustained profitability. More than 50% of the project’s total reserves and resources remain for future development. This is sufficient to provide for 2.5Mlb pa of production, with the potential to produce strong cash flows for at least another six years. Additional regional exploration has the potential to extend that further. C&M Operations KM completed a full year on C&M, with no production since May 2014 and no sales revenue since December 2014. The key focus at KM has been ensuring the safety of C&M personnel and the security of the project assets; maintaining idled plant and equipment in a fit state of readiness to facilitate a rapid restart of operations when a decision is made to do so; maintaining legal and social obligations encompassing community relations, environmental and radiological monitoring and treating and discharging surplus water stocks at KM to reduce KM’s water balance prior to the onset of the next rainfall season. During production, rainfall run-off water captured in the operational area was stored on site and was recycled for use in processing of uranium ore. Since the operation went on C&M, this has no longer been occurring, necessitating the controlled release of treated water in order to reduce KM’s water balance prior to the onset of the next rainfall season. PAL modified a section of the KM processing plant to treat water to remove contaminants prior to release to meet internationally recognised standards. PAL was licensed by the GoM in October 2014 to treat and release water, with the government setting strict conditions regulating critical water quality parameters, including the World Health Organization (WHO) drinking water guideline for uranium content. Controlled treated water release commenced in April 2015 and continued without incident. In late June, discharge was suspended due to the very low receiving water level in the local river system. Comprehensive monitoring of samples has been undertaken at the end of the discharge outlet and upstream and downstream from KM.
For
per
sona
l use
onl
y
16
MANAGEMENT DISCUSSION AND ANALYSIS REVIEW OF OPERATIONS (continued)
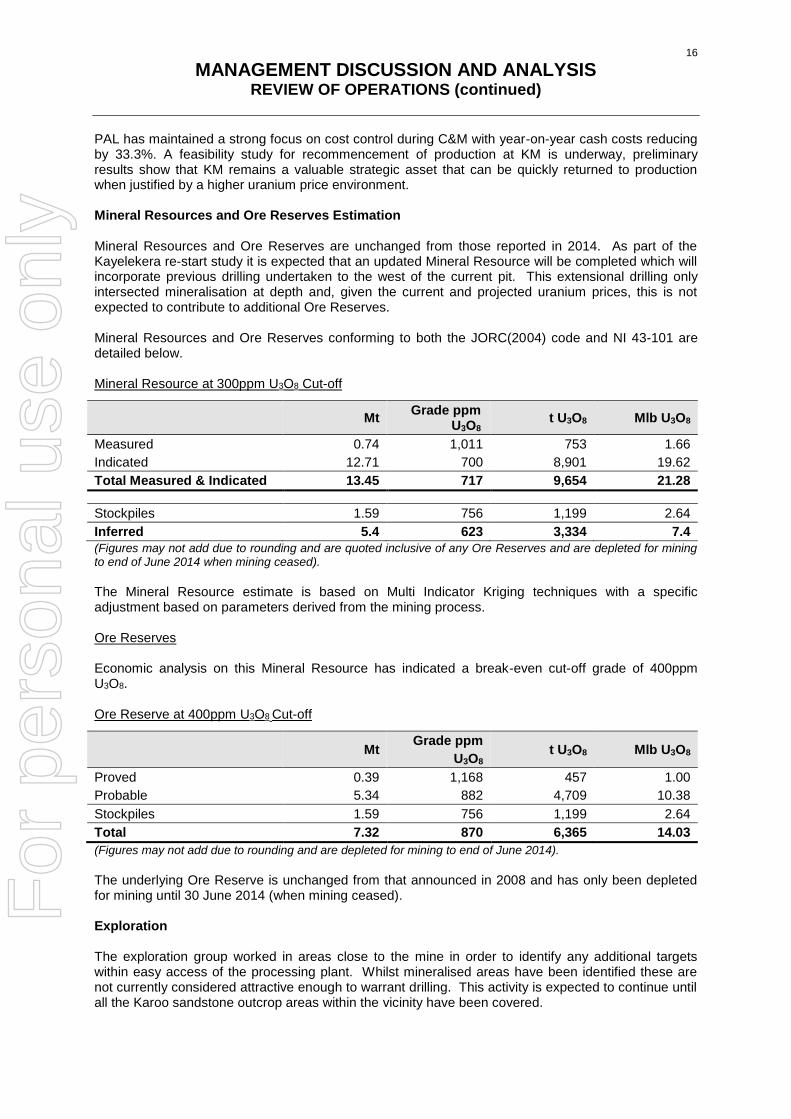
PAL has maintained a strong focus on cost control during C&M with year-on-year cash costs reducing by 33.3%. A feasibility study for recommencement of production at KM is underway, preliminary results show that KM remains a valuable strategic asset that can be quickly returned to production when justified by a higher uranium price environment. Mineral Resources and Ore Reserves Estimation Mineral Resources and Ore Reserves are unchanged from those reported in 2014. As part of the Kayelekera re-start study it is expected that an updated Mineral Resource will be completed which will incorporate previous drilling undertaken to the west of the current pit. This extensional drilling only intersected mineralisation at depth and, given the current and projected uranium prices, this is not expected to contribute to additional Ore Reserves. Mineral Resources and Ore Reserves conforming to both the JORC(2004) code and NI 43-101 are detailed below. Mineral Resource at 300ppm U3O8 Cut-off
Mt
Grade ppm U3O8
t U3O8 Mlb U3O8
Measured 0.74 1,011 753 1.66
Indicated 12.71 700 8,901 19.62
Total Measured & Indicated 13.45 717 9,654 21.28
Stockpiles 1.59 756 1,199 2.64
Inferred 5.4 623 3,334 7.4
(Figures may not add due to rounding and are quoted inclusive of any Ore Reserves and are depleted for mining to end of June 2014 when mining ceased).
The Mineral Resource estimate is based on Multi Indicator Kriging techniques with a specific adjustment based on parameters derived from the mining process. Ore Reserves Economic analysis on this Mineral Resource has indicated a break-even cut-off grade of 400ppm U3O8. Ore Reserve at 400ppm U3O8 Cut-off
Mt
Grade ppm
U3O8 t U3O8 Mlb U3O8
Proved 0.39 1,168 457 1.00
Probable 5.34 882 4,709 10.38
Stockpiles 1.59 756 1,199 2.64
Total 7.32 870 6,365 14.03
(Figures may not add due to rounding and are depleted for mining to end of June 2014).
The underlying Ore Reserve is unchanged from that announced in 2008 and has only been depleted for mining until 30 June 2014 (when mining ceased). Exploration The exploration group worked in areas close to the mine in order to identify any additional targets within easy access of the processing plant. Whilst mineralised areas have been identified these are not currently considered attractive enough to warrant drilling. This activity is expected to continue until all the Karoo sandstone outcrop areas within the vicinity have been covered.
For
per
sona
l use
onl
y
17
MANAGEMENT DISCUSSION AND ANALYSIS REVIEW OF OPERATIONS (continued)
The Malawian Government is currently implementing a new Cadastral system and is in the process of introducing a new mining act. While this is progressing a moratorium for accepting and granting Exploration Licences has been implemented. The process is expected to be completed by the end of CY2015 and Paladin is preparing new Exploration Licence Applications for submission early CY2016.
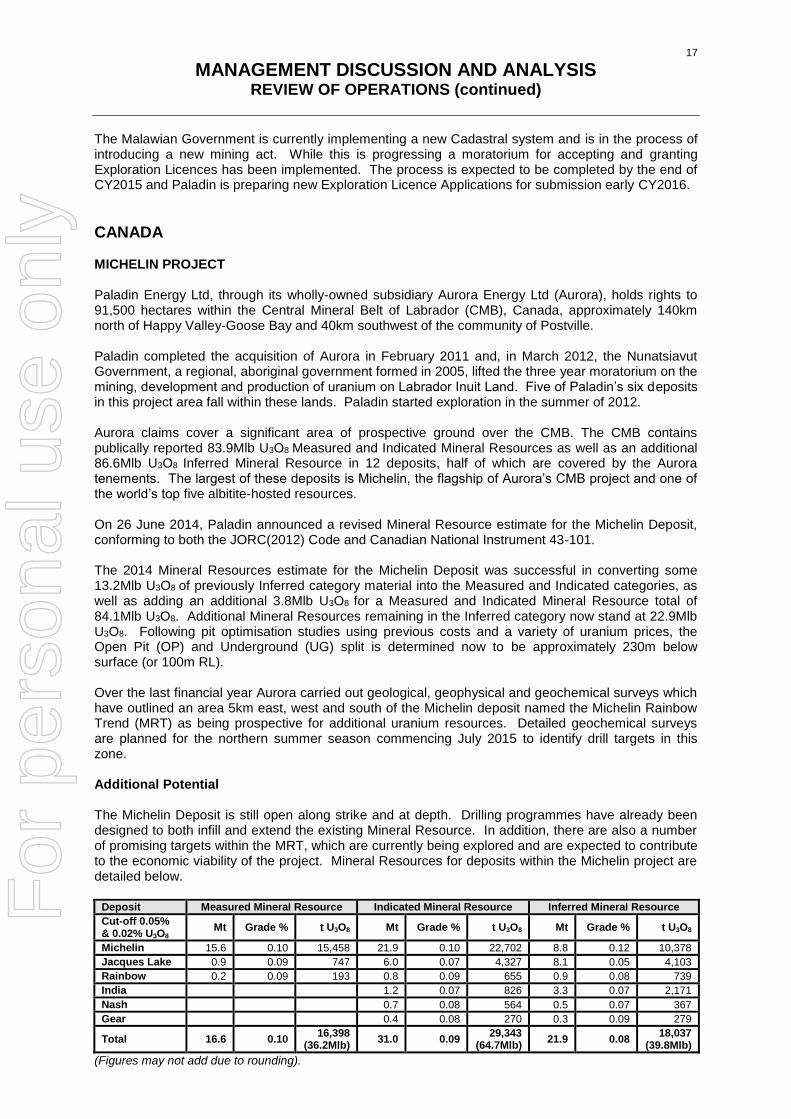
CANADA MICHELIN PROJECT Paladin Energy Ltd, through its wholly-owned subsidiary Aurora Energy Ltd (Aurora), holds rights to 91,500 hectares within the Central Mineral Belt of Labrador (CMB), Canada, approximately 140km north of Happy Valley-Goose Bay and 40km southwest of the community of Postville. Paladin completed the acquisition of Aurora in February 2011 and, in March 2012, the Nunatsiavut Government, a regional, aboriginal government formed in 2005, lifted the three year moratorium on the mining, development and production of uranium on Labrador Inuit Land. Five of Paladin’s six deposits in this project area fall within these lands. Paladin started exploration in the summer of 2012. Aurora claims cover a significant area of prospective ground over the CMB. The CMB contains publically reported 83.9Mlb U3O8 Measured and Indicated Mineral Resources as well as an additional 86.6Mlb U3O8 Inferred Mineral Resource in 12 deposits, half of which are covered by the Aurora tenements. The largest of these deposits is Michelin, the flagship of Aurora’s CMB project and one of the world’s top five albitite-hosted resources. On 26 June 2014, Paladin announced a revised Mineral Resource estimate for the Michelin Deposit, conforming to both the JORC(2012) Code and Canadian National Instrument 43-101. The 2014 Mineral Resources estimate for the Michelin Deposit was successful in converting some 13.2Mlb U3O8 of previously Inferred category material into the Measured and Indicated categories, as well as adding an additional 3.8Mlb U3O8 for a Measured and Indicated Mineral Resource total of 84.1Mlb U3O8. Additional Mineral Resources remaining in the Inferred category now stand at 22.9Mlb U3O8. Following pit optimisation studies using previous costs and a variety of uranium prices, the Open Pit (OP) and Underground (UG) split is determined now to be approximately 230m below surface (or 100m RL). Over the last financial year Aurora carried out geological, geophysical and geochemical surveys which have outlined an area 5km east, west and south of the Michelin deposit named the Michelin Rainbow Trend (MRT) as being prospective for additional uranium resources. Detailed geochemical surveys are planned for the northern summer season commencing July 2015 to identify drill targets in this zone. Additional Potential The Michelin Deposit is still open along strike and at depth. Drilling programmes have already been designed to both infill and extend the existing Mineral Resource. In addition, there are also a number of promising targets within the MRT, which are currently being explored and are expected to contribute to the economic viability of the project. Mineral Resources for deposits within the Michelin project are detailed below.
Deposit Measured Mineral Resource Indicated Mineral Resource Inferred Mineral Resource
Cut-off 0.05% & 0.02% U3O8
Mt Grade % t U3O8 Mt Grade % t U3O8 Mt Grade % t U3O8
Michelin 15.6 0.10 15,458 21.9 0.10 22,702 8.8 0.12 10,378
Jacques Lake 0.9 0.09 747 6.0 0.07 4,327 8.1 0.05 4,103
Rainbow 0.2 0.09 193 0.8 0.09 655 0.9 0.08 739
India 1.2 0.07 826 3.3 0.07 2,171
Nash 0.7 0.08 564 0.5 0.07 367
Gear 0.4 0.08 270 0.3 0.09 279
Total 16.6 0.10 16,398
(36.2Mlb) 31.0 0.09
29,343 (64.7Mlb)
21.9 0.08 18,037
(39.8Mlb)
(Figures may not add due to rounding).
For
per
sona
l use
onl
y

18
MANAGEMENT DISCUSSION AND ANALYSIS REVIEW OF OPERATIONS (continued)
The Mineral Resources for the deposits are reported at cut-off grades that contemplated underground (0.05% U3O8 cut-off) and open pit (0.02% U3O8 cut-off) mining, based on preliminary economic assumptions carried out by Aurora. The updated 2014 Mineral Resource Estimate for the Michelin Deposit has provided added confidence in the character of the mineralisation with the significant increase in Measured and Indicated category material. Importantly, in addition, the near surface open pittable portion of the deposit now contains a substantial increase in both uranium grade and contained metal. Future drilling will concentrate on expanding the Mineral Resources at both the Michelin Deposit and the deposits and prospects occurring in the immediate surrounds.
Exemption from Non-Resident Ownership Restriction On 22 June 2015 Paladin received notification from the Canadian Government that its submission to be the majority owner of a uranium mine at the Michelin Project has been approved. Under the current Non-Resident Ownership Policy (NROP), non-resident mining companies can own 100% of an exploration project but, by the stage of first production, there must be a minimum level of Canadian resident ownership in individual uranium mining projects of 51%. This posed an obvious limitation to the Michelin Project. Given the Company’s global mining experience and reputation, it has always considered itself as an owner/operator of its uranium projects. The granting of an exemption from NROP allowing Paladin to proceed eventually to production at the Michelin Project will permit Paladin to introduce a suitable minority joint venture partner at the appropriate time should this be desired. Paladin underwent an extensive and rigorous appraisal process by the relevant authorities in Canada conducted over a 5 month period. The decision required the support of the Minister of Natural Resources, the Hon. Greg Rickford and ultimately the Prime Minister, Mr Harper. During the familiarisation and due diligence process that was conducted to assess the submission for an exemption from NROP, Paladin was questioned on its achievements, technical abilities, environmental performance, commodity knowledge and social responsibility particularly its relation to the local
For
per
sona
l use
onl
y
19
MANAGEMENT DISCUSSION AND ANALYSIS REVIEW OF OPERATIONS (continued)
communities and its standing with the Nunatsiavut government which is tasked to manage the Labrador Inuit Lands.
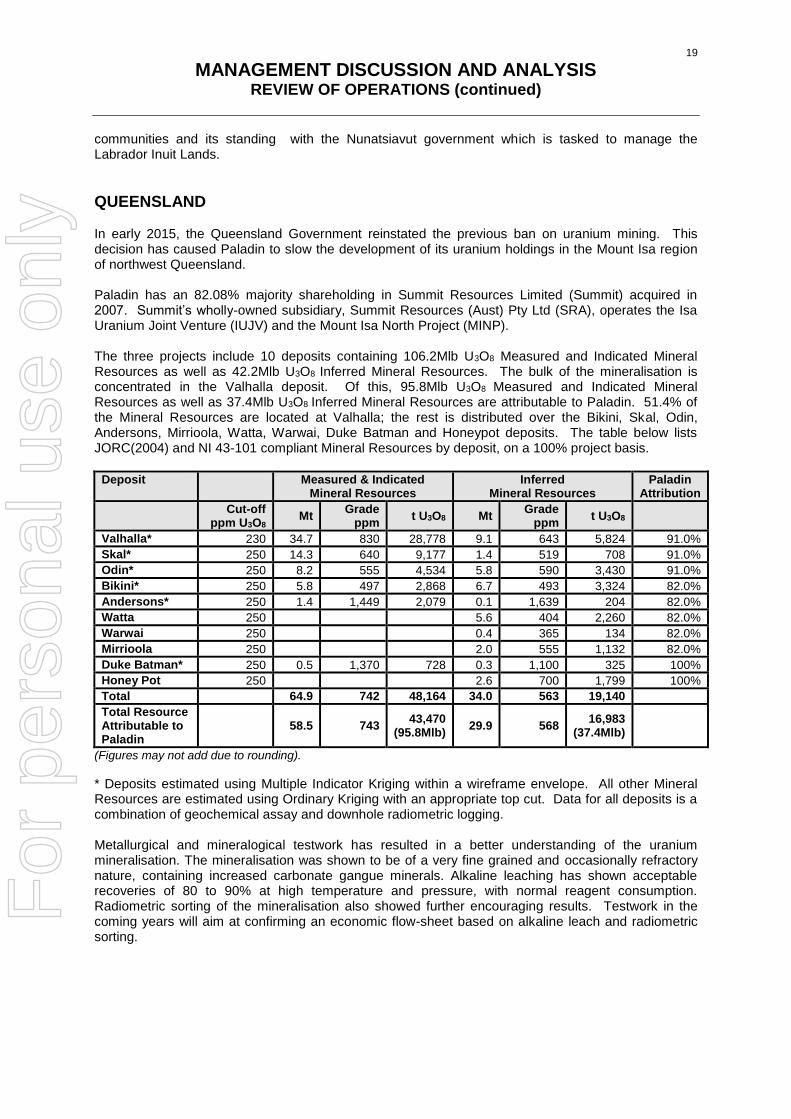
QUEENSLAND In early 2015, the Queensland Government reinstated the previous ban on uranium mining. This decision has caused Paladin to slow the development of its uranium holdings in the Mount Isa region of northwest Queensland. Paladin has an 82.08% majority shareholding in Summit Resources Limited (Summit) acquired in 2007. Summit’s wholly-owned subsidiary, Summit Resources (Aust) Pty Ltd (SRA), operates the Isa Uranium Joint Venture (IUJV) and the Mount Isa North Project (MINP). The three projects include 10 deposits containing 106.2Mlb U3O8 Measured and Indicated Mineral Resources as well as 42.2Mlb U3O8 Inferred Mineral Resources. The bulk of the mineralisation is concentrated in the Valhalla deposit. Of this, 95.8Mlb U3O8 Measured and Indicated Mineral Resources as well as 37.4Mlb U3O8 Inferred Mineral Resources are attributable to Paladin. 51.4% of the Mineral Resources are located at Valhalla; the rest is distributed over the Bikini, Skal, Odin, Andersons, Mirrioola, Watta, Warwai, Duke Batman and Honeypot deposits. The table below lists JORC(2004) and NI 43-101 compliant Mineral Resources by deposit, on a 100% project basis.
Deposit Measured & Indicated Mineral Resources
Inferred Mineral Resources
Paladin Attribution
Cut-off ppm U3O8
Mt Grade
ppm t U3O8 Mt
Grade ppm
t U3O8
Valhalla* 230 34.7 830 28,778 9.1 643 5,824 91.0%
Skal* 250 14.3 640 9,177 1.4 519 708 91.0%
Odin* 250 8.2 555 4,534 5.8 590 3,430 91.0%
Bikini* 250 5.8 497 2,868 6.7 493 3,324 82.0%
Andersons* 250 1.4 1,449 2,079 0.1 1,639 204 82.0%
Watta 250 5.6 404 2,260 82.0%
Warwai 250 0.4 365 134 82.0%
Mirrioola 250 2.0 555 1,132 82.0%
Duke Batman* 250 0.5 1,370 728 0.3 1,100 325 100%
Honey Pot 250 2.6 700 1,799 100%
Total 64.9 742 48,164 34.0 563 19,140
Total Resource Attributable to Paladin
58.5 743
43,470 (95.8Mlb)
29.9 568 16,983
(37.4Mlb)
(Figures may not add due to rounding).
* Deposits estimated using Multiple Indicator Kriging within a wireframe envelope. All other Mineral Resources are estimated using Ordinary Kriging with an appropriate top cut. Data for all deposits is a combination of geochemical assay and downhole radiometric logging. Metallurgical and mineralogical testwork has resulted in a better understanding of the uranium mineralisation. The mineralisation was shown to be of a very fine grained and occasionally refractory nature, containing increased carbonate gangue minerals. Alkaline leaching has shown acceptable recoveries of 80 to 90% at high temperature and pressure, with normal reagent consumption. Radiometric sorting of the mineralisation also showed further encouraging results. Testwork in the coming years will aim at confirming an economic flow-sheet based on alkaline leach and radiometric sorting.
For
per
sona
l use
onl
y
20
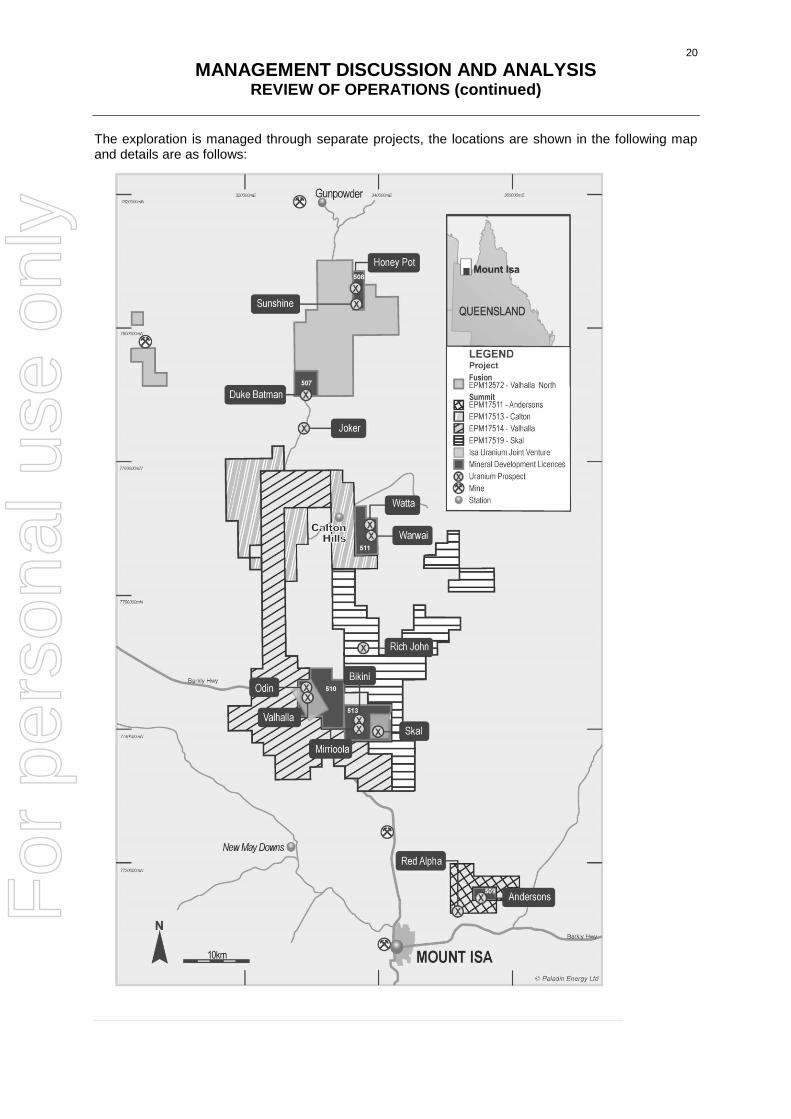
MANAGEMENT DISCUSSION AND ANALYSIS REVIEW OF OPERATIONS (continued)
The exploration is managed through separate projects, the locations are shown in the following map and details are as follows:
For
per
sona
l use
onl
y

21
MANAGEMENT DISCUSSION AND ANALYSIS REVIEW OF OPERATIONS (continued)
ISA URANIUM JOINT VENTURE (IUJV) Summit Resources (Aust) Pty Ltd (SRA) 50% and Manager Mount Isa Uranium Pty Ltd (MIU) 50% The IUJV covers ground containing the Valhalla, Odin and Skal uranium deposits 40km north of Mount Isa. Mineral Resource estimates are included in the table on the previous page. Participants in the joint operation are SRA and Mount Isa Uranium Pty Ltd (MIU), each holding a 50% interest, with SRA as manager. MIU is a wholly-owned subsidiary of Valhalla Uranium Pty Ltd (VUL), a formerly public company and now a wholly-owned subsidiary of Paladin. Paladin’s effective participating interest in the IUJV is 91.04% through its ownership of 82.08% of the issued capital of Summit. Ground subject to the IUJV covers 17.24km2 at Valhalla and 10km2 at Skal. These two areas lie within a larger holding of contiguous tenements of 934km2 held 100% and managed by SRA and Paladin as outlined in the map below. The application to cover the Valhalla and Skal uranium deposits with Mineral Development Licences (MDLs) was granted by the Queensland Government in September 2014. Valhalla is now covered by MDL510 and Skal by MDL517 which also includes the Bikini and Mirrioola Deposits. MOUNT ISA NORTH PROJECT (MINP) The MINP is located 10 to 70km north and east of Mount Isa and contains numerous uranium prospects. The area is 100% held and managed by SRA utilising Paladin staff and expertise. Exploration continues on MINP where Summit holds 934km2 of granted tenements that are prospective for uranium, copper and base metals. In early 2015 the Queensland Government extended the licences for a further three years to 2018. The tenements are centred on the city of Mount Isa. The project includes the Bikini, Mirrioola, Watta, Warwai and Anderson uranium deposits, as well as numerous other uranium prospects. Mineral Resource estimates are shown in the table on page 19. Summit’s applications to cover the Anderson, Bikini, Mirrioola, Watta and Warwai deposits with MDLs were granted in September 2014. The deposits are now covered by MDLs 509, 511 and 513. VALHALLA NORTH PROJECT (VNP) The VNP is located on EPM 12572 totalling 193km2, situated approximately 80km north of the Valhalla deposit. The geological setting is similar to the Summit/Paladin projects to the south where albitised basalts with interbedded metasediments are mineralised along east-west and north-south structures in Eastern Creek Volcanics. The project includes the Duke Batman and Honey Pot deposits and Mineral Resource estimates for these deposits are listed in the table on page 19. Paladin’s application for MDLs over the Honey Pot and Duke Batman deposits were granted in September 2014. The deposits are now covered by MDLs 507 and 508. QUEENSLAND URANIUM POLITICS The expectation in Queensland is that a conservative government will strongly support uranium mining while a Labor government (under current policy) will not permit it. Until the elections in March 2015, the Conservative government under Campbell Newman were active in putting in place the regulatory regime to support the uranium mining industry. After the Labor government was elected in March 2015 it indicated that it would continue to allow exploration for uranium but would not permit mining.
For
per
sona
l use
onl
y

22
MANAGEMENT DISCUSSION AND ANALYSIS REVIEW OF OPERATIONS (continued)
WESTERN AUSTRALIA
MANYINGEE URANIUM PROJECT (Manyingee) Manyingee is located in the north-west of Western Australia, 1,100km north of Perth and 85km inland from the coastal township of Onslow. The property is comprised of three mining leases covering 1,307 hectares. Paladin purchased Manyingee in 1998 from Afmeco Mining and Exploration Pty Ltd (AFMEX), a subsidiary of Cogema from France. Between 1973 and 1984, approximately 400 holes were drilled by the previous owners to establish the extent and continuity of the sediment-hosted uranium mineralisation contained in permeable sandstone in paleochannels. Field trials by AFMEX demonstrated that the Manyingee sandstone-hosted uranium deposit is amenable to extraction by in-situ recovery (ISR). In 2012, Paladin drilled 96 holes for 9,026m of Rotary Mud and 242m of PQ core. The drilling resulted in a new geological model and, on 14 January 2014, Paladin announced an updated Mineral Resource for the Manyingee Project. The Mineral Resource estimate conforms to both the JORC(2012) Code and NI 43-101.
Updated Mineral Resource Estimate (250ppm U3O8 and 0.2m cut-off)
Mineral Resource Category
Tonnes M
Grade
ppm U3O8
Pounds M
Metal t
Total Indicated Inferred
8.37 5.41
850 850
15.71 10.17
7,127 4,613
Figures may not add due to rounding.
The geology of the deposit is well understood, having been subject to extensive exploration over a number of years with the stratigraphic sequence being defined by the comprehensive dataset of downhole electric logs. A total of 35 water bores in place since 2012, are used for ongoing monitoring of physical and chemical properties of the aquifer containing the uranium mineralisation. Paladin believes that the Mineral Resources on the mining leases can be increased and that commencement of production at the project can be achieved within a 4-5 year time frame. Current work on the project is concentrated on compiling a Field Leach Trial proposal document expected to be submitted to the WA Department of Mines and Petroleum in the first half of CY2016. Several specialist studies have been started for this work and these include hydrogeological modelling, metallurgical testing and environmental and radiation approval assistance. CARLEY BORE On 1 June 2015 Paladin announced the acquisition of strategically important tenements containing the Carley Bore deposit from Energia Minerals Limited (EMX) for consideration of Paladin shares and A$1.6M in cash. On 7 August 2015, Paladin issued to EMX 40 million fully paid shares in addition to the cash payment for the purchase of EL 08/1645 and EL 08/1646, a 685km2 land package covering a rich sedimentary basin which hosts the Carley Bore deposit, in the north west region of Western Australia. A further 5 million Paladin fully paid shares were issued for the purchase of the adjacent northern EMX tenement, EL 08/1644, following EMX’s application for expenditure being approved. The acquisition also provides Paladin with a right of first refusal over the disposal of any interest in any future tenements granted to EMX that share a boundary with the existing Carley Bore tenements and certain specific tenements in the vicinity. Consisting of three contiguous exploration licences, this new project area is located 100km south of Paladin’s Manyingee Uranium Project (Manyingee) as shown in the location map. The Carley Bore deposit, as estimated by EMX, contains an Indicated Mineral Resource of 5.0Mlb U3O8 grading 420ppm and an Inferred Mineral Resource of 10.6Mlb U3O8 grading 280ppm (JORC (2012)) at a cut-off grade of 150ppm U3O8.
For
per
sona
l use
onl
y
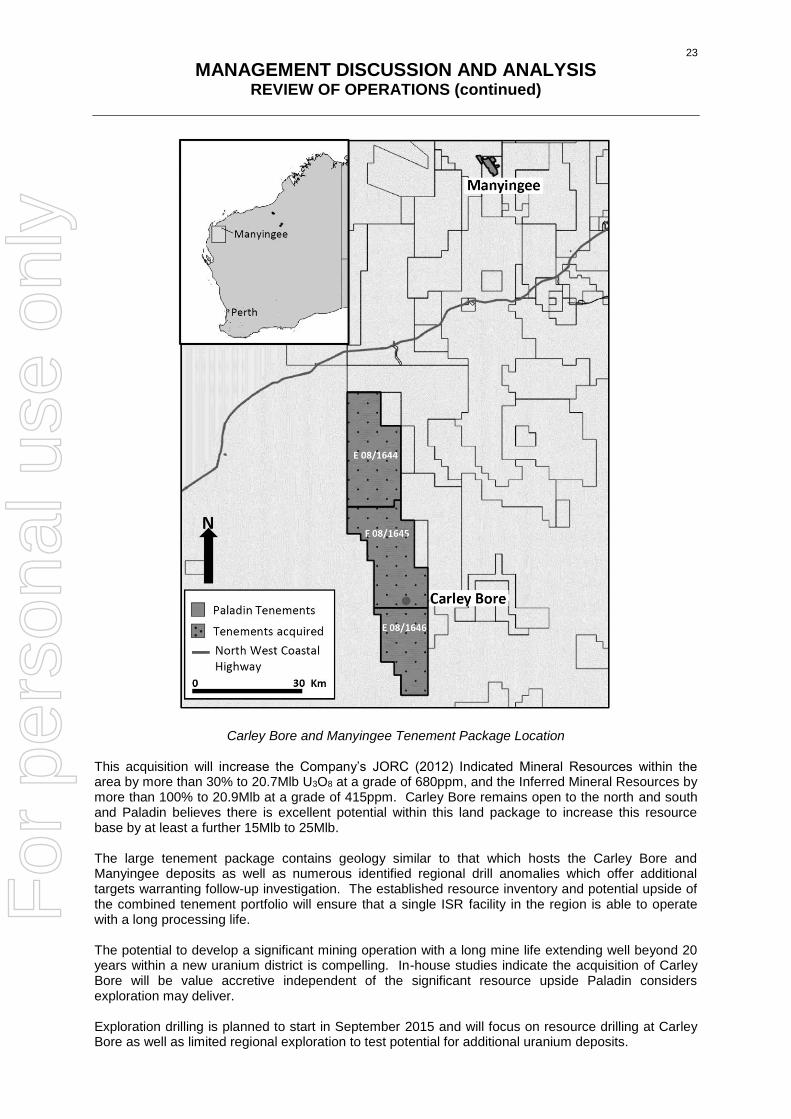
23
MANAGEMENT DISCUSSION AND ANALYSIS REVIEW OF OPERATIONS (continued)
Carley Bore and Manyingee Tenement Package Location This acquisition will increase the Company’s JORC (2012) Indicated Mineral Resources within the area by more than 30% to 20.7Mlb U3O8 at a grade of 680ppm, and the Inferred Mineral Resources by more than 100% to 20.9Mlb at a grade of 415ppm. Carley Bore remains open to the north and south and Paladin believes there is excellent potential within this land package to increase this resource base by at least a further 15Mlb to 25Mlb. The large tenement package contains geology similar to that which hosts the Carley Bore and Manyingee deposits as well as numerous identified regional drill anomalies which offer additional targets warranting follow-up investigation. The established resource inventory and potential upside of the combined tenement portfolio will ensure that a single ISR facility in the region is able to operate with a long processing life. The potential to develop a significant mining operation with a long mine life extending well beyond 20 years within a new uranium district is compelling. In-house studies indicate the acquisition of Carley Bore will be value accretive independent of the significant resource upside Paladin considers exploration may deliver.
Exploration drilling is planned to start in September 2015 and will focus on resource drilling at Carley Bore as well as limited regional exploration to test potential for additional uranium deposits.
For
per
sona
l use
onl
y

24
MANAGEMENT DISCUSSION AND ANALYSIS REVIEW OF OPERATIONS (continued)
OOBAGOOMA URANIUM PROJECT (Oobagooma)
The Oobagooma Project (held 100%) is located in the West Kimberley region of Western Australia, 1,900km north-north-east of Perth and 75km north-east of the regional centre of Derby. The project now comprises one application for an EPL covering approximately 450km². In 1998, Paladin acquired a call option in relation to the purchase of Oobagooma. This arrangement was more recently varied so that Paladin Energy Minerals NL is now the applicant and will, upon the anticipated grant, hold the exploration licence directly. The Oobagooma project area was explored by AFMEX between 1983 and 1986, during which time extensive zones of uranium mineralisation were discovered. AFMEX identified a historic resource of 21.9Mlb U3O8 at 0.12% U3O8 with a 0.035% cut-off. Paladin has classified this mineralisation as an exploration target, but, after examining the AFMEX data, Paladin believes that following validation of all existing data, there is good potential to upgrade the exploration target within the area to 40 to 50Mlb U3O8.
Previous tonnages, grades, assays and other technical data for Oobagooma are taken from historical records prior to the implementation of JORC or NI 43-101. While the data are believed to have been acquired, processed and disclosed by persons believed to be technically competent, it is unverifiable at present. A Competent Person as defined under the JORC Code or Qualified Person as defined under NI 43-101 has not done sufficient work to classify the historical estimate as current Mineral Resources. Paladin is not treating any historical estimates as current Mineral Resources as defined in either the JORC Code or NI 43-101 and the historical estimates should not be relied upon.
BIGRLYI JOINT VENTURE (BJV) Energy Metals Limited 53.29% and Manager Northern Territory Uranium Pty Ltd 41.71% Southern Cross Exploration NL 5%
The BJV covers ten granted Exploration Licences in Retention (ELRs), two granted Exploration Licences (ELs), and a number of applications all located in the Ngalia Basin approximately 320km north-west of Alice Springs in the Northern Territory. Participants in the Project are Energy Metals Limited (53.29% and Manager), Northern Territory Uranium Pty Ltd (a wholly- owned subsidiary of Paladin) (41.71%) and Southern Cross Exploration NL (5%). Energy Metals Limited (EME), as the Manager of the BJV, announced in June 2011 the completion of a Pre-Feasibility Study (PFS) for the Bigrlyi Project showing that, under current market conditions, it is not economically viable. A substantial increase in the resource base that has been identified to date is required, especially resources amenable to open pit mining to help the economic outcome of this project. EME is exploring the wider Ngalia Basin for additional resources on its 100% owned licences. In late June 2011, EME released an updated Mineral Resource estimate, conforming to both the JORC(2004) guidelines and NI 43-101, based on all drilling to date. The breakdown of Mineral Resource category is detailed below and is reported at a 500ppm U3O8 cut-off grade.
Mineral Resource Classification
Tonnes Mt
Grade ppm U3O8
Metal t U3O8
Metal Mlb U3O8
Indicated 4.7 1,366 6,400 14.1
Inferred 2.8 1,144 3,200 7.1
Additionally, in the Ngalia Basin, Paladin holds, as part of the BJV, Mineral Lease North (MLN) and Mineral Claim South (MCS) applications covering the Karins deposit, together with interests in granted ELRs covering the Walbiri (58%) and Malawiri (48%) prospects; both in partnership with EME. Paladin also holds 100% of the Mt Wedge retention lease applications in the Ngalia Basin. On 1 July 2015 Energy Metals announced an Inferred (JORC 2012) Mineral Resource of 1.5Mlb U3O8 at 0.06% U3O8 for the Karins deposit. Previous explorers defined exploration targets on all leases and it is expected that exploration will be carried out on these leases, in the coming years to further expand the resource base of the project.
For
per
sona
l use
onl
y
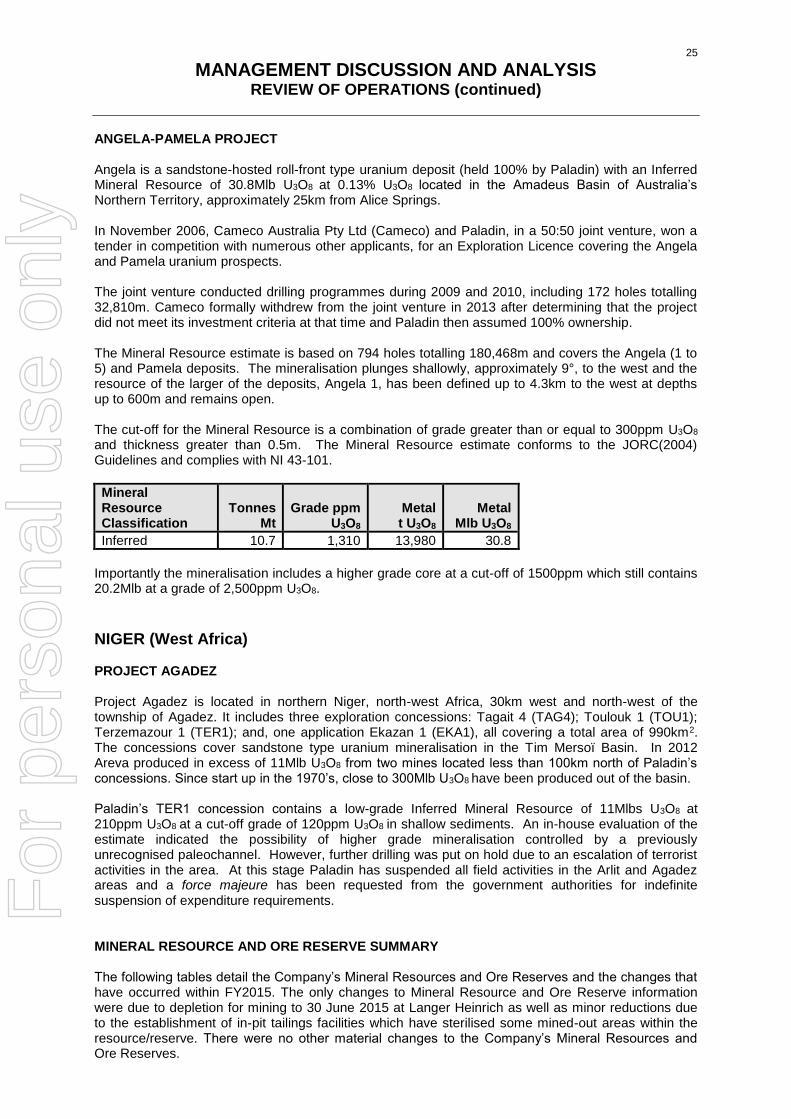
25
MANAGEMENT DISCUSSION AND ANALYSIS REVIEW OF OPERATIONS (continued)
ANGELA-PAMELA PROJECT Angela is a sandstone-hosted roll-front type uranium deposit (held 100% by Paladin) with an Inferred Mineral Resource of 30.8Mlb U3O8 at 0.13% U3O8 located in the Amadeus Basin of Australia’s Northern Territory, approximately 25km from Alice Springs. In November 2006, Cameco Australia Pty Ltd (Cameco) and Paladin, in a 50:50 joint venture, won a tender in competition with numerous other applicants, for an Exploration Licence covering the Angela and Pamela uranium prospects. The joint venture conducted drilling programmes during 2009 and 2010, including 172 holes totalling 32,810m. Cameco formally withdrew from the joint venture in 2013 after determining that the project did not meet its investment criteria at that time and Paladin then assumed 100% ownership. The Mineral Resource estimate is based on 794 holes totalling 180,468m and covers the Angela (1 to 5) and Pamela deposits. The mineralisation plunges shallowly, approximately 9°, to the west and the resource of the larger of the deposits, Angela 1, has been defined up to 4.3km to the west at depths up to 600m and remains open. The cut-off for the Mineral Resource is a combination of grade greater than or equal to 300ppm U3O8
and thickness greater than 0.5m. The Mineral Resource estimate conforms to the JORC(2004) Guidelines and complies with NI 43-101.
Mineral Resource Classification
Tonnes
Mt
Grade ppm
U3O8
Metal t U3O8
Metal
Mlb U3O8
Inferred 10.7 1,310 13,980 30.8
Importantly the mineralisation includes a higher grade core at a cut-off of 1500ppm which still contains 20.2Mlb at a grade of 2,500ppm U3O8.
NIGER (West Africa) PROJECT AGADEZ Project Agadez is located in northern Niger, north-west Africa, 30km west and north-west of the township of Agadez. It includes three exploration concessions: Tagait 4 (TAG4); Toulouk 1 (TOU1); Terzemazour 1 (TER1); and, one application Ekazan 1 (EKA1), all covering a total area of 990km2. The concessions cover sandstone type uranium mineralisation in the Tim Mersoï Basin. In 2012 Areva produced in excess of 11Mlb U3O8 from two mines located less than 100km north of Paladin’s concessions. Since start up in the 1970’s, close to 300Mlb U3O8 have been produced out of the basin. Paladin’s TER1 concession contains a low-grade Inferred Mineral Resource of 11Mlbs U3O8 at 210ppm U3O8 at a cut-off grade of 120ppm U3O8 in shallow sediments. An in-house evaluation of the estimate indicated the possibility of higher grade mineralisation controlled by a previously unrecognised paleochannel. However, further drilling was put on hold due to an escalation of terrorist activities in the area. At this stage Paladin has suspended all field activities in the Arlit and Agadez areas and a force majeure has been requested from the government authorities for indefinite suspension of expenditure requirements. MINERAL RESOURCE AND ORE RESERVE SUMMARY The following tables detail the Company’s Mineral Resources and Ore Reserves and the changes that have occurred within FY2015. The only changes to Mineral Resource and Ore Reserve information were due to depletion for mining to 30 June 2015 at Langer Heinrich as well as minor reductions due to the establishment of in-pit tailings facilities which have sterilised some mined-out areas within the resource/reserve. There were no other material changes to the Company’s Mineral Resources and Ore Reserves.
For
per
sona
l use
onl
y

26
MANAGEMENT DISCUSSION AND ANALYSIS REVIEW OF OPERATIONS (continued)
30 June 2014 30 June 2015 Change
Mineral Resources
M tonnes
grade % U3O8
Metal t
M tonnes
grade % U3O8
Metal t
M tonnes
Metal t
Canada
Measured Jacques Lake 0.86 0.087 747 0.86 0.087 747 - -
Michelin 15.57 0.099 15,458 15.57 0.099 15,458 - -
Rainbow 0.21 0.092 193 0.21 0.092 193 - -
Indicated Gear 0.35 0.077 270 0.35 0.077 270 - -
Inda 1.2 0.069 826 1.2 0.069 826 - -
Jacques Lake 6.04 0.072 4,327 6.04 0.072 4,327 - -
Michelin 21.93 0.104 22,701 21.93 0.104 22,701 - -
Nash 0.68 0.083 564 0.68 0.083 564 - -
Rainbow 0.76 0.086 655 0.76 0.086 655 - -
Inferred Gear 0.3 0.093 279 0.3 0.093 279 - -
Inda 3.26 0.067 2,171 3.26 0.067 2,171 - -
Jacques Lake 8.1 0.051 4,103 8.1 0.051 4,103 - -
Michelin 8.81 0.118 10,378 8.81 0.118 10,378 - -
Nash 0.51 0.072 367 0.51 0.072 367 - -
Rainbow 0.91 0.082 739 0.91 0.082 739 - -
Malawi
Measured Kayelekera 0.74 0.101 753 0.74 0.101 753 - -
Indicated
12.71 0.070 8,901 12.71 0.070 8,901 - -
Inferred
5.35 0.062 3,334 5.35 0.062 3,334 - -
Stockpiles 1.59 0.076 1,199 1.59 0.076 1,199 - -
Namibia
Measured Langer Heinrich 22.42 0.055 12,410 19.60 0.056 10,912 -2.82 -1,498
Indicated
66.98 0.055 36,877 62.94 0.054 34,051 -4.04 -2,826
Inferred
17.59 0.058 10,246 16.99 0.058 9,842 -0.60 -404
Stockpiles 30.42 0.041 12,500 32.09 0.040 12,867 +1.67 +367
Niger
Inferred Takardeit 23.21 0.021 4,943 23.21 0.021 4,943 - -
Australia
Measured Valhalla 16.02 0.082 13,116 16.02 0.082 13,116 - -
Indicated Bigrlyi 4.7 0.136 6,400 4.7 0.136 6,400 - -
Andersons 1.4 0.145 2,079 1.4 0.145 2,079 - -
Bikini 5.77 0.050 2,868 5.77 0.050 2,868 - -
Duke Batman 0.53 0.137 728 0.53 0.137 728 - -
Odin 8.2 0.055 4,534 8.2 0.055 4,534 - -
Skal 14.3 0.064 9,177 14.3 0.064 9,177 - -
Valhalla 18.64 0.084 15,662 18.64 0.084 15,662 - -
Manyingee 8.37 0.085 7,127 8.37 0.085 7,127 - -
Inferred Angela 10.7 0.131 13,980 10.7 0.131 13,980 - -
Bigrlyi 2.8 0.114 3,200 2.8 0.114 3,200 - -
Andersons 0.1 0.164 204 0.1 0.164 204 - -
Bikini 6.7 0.490 3,324 6.7 0.490 3,324 - -
Duke Batman 0.29 0.110 325 0.29 0.110 325 - -
Honey Pot 2.56 0.070 1,799 2.56 0.070 1,799 - -
Mirrioola 2 0.056 1,132 2 0.056 1,132 - -
Odin 5.8 0.059 3,430 5.8 0.059 3,430 - -
Skal 1.4 0.052 708 1.4 0.052 708 - -
Valhalla 9.1 0.064 5,824 9.1 0.064 5,824 - -
Watta 5.6 0.040 2,260 5.6 0.040 2,260 - -
Warwai 0.4 0.036 134 0.4 0.036 134 - -
Manyingee 5.41 0.085 4,613 5.41 0.085 4,613 - -
For
per
sona
l use
onl
y
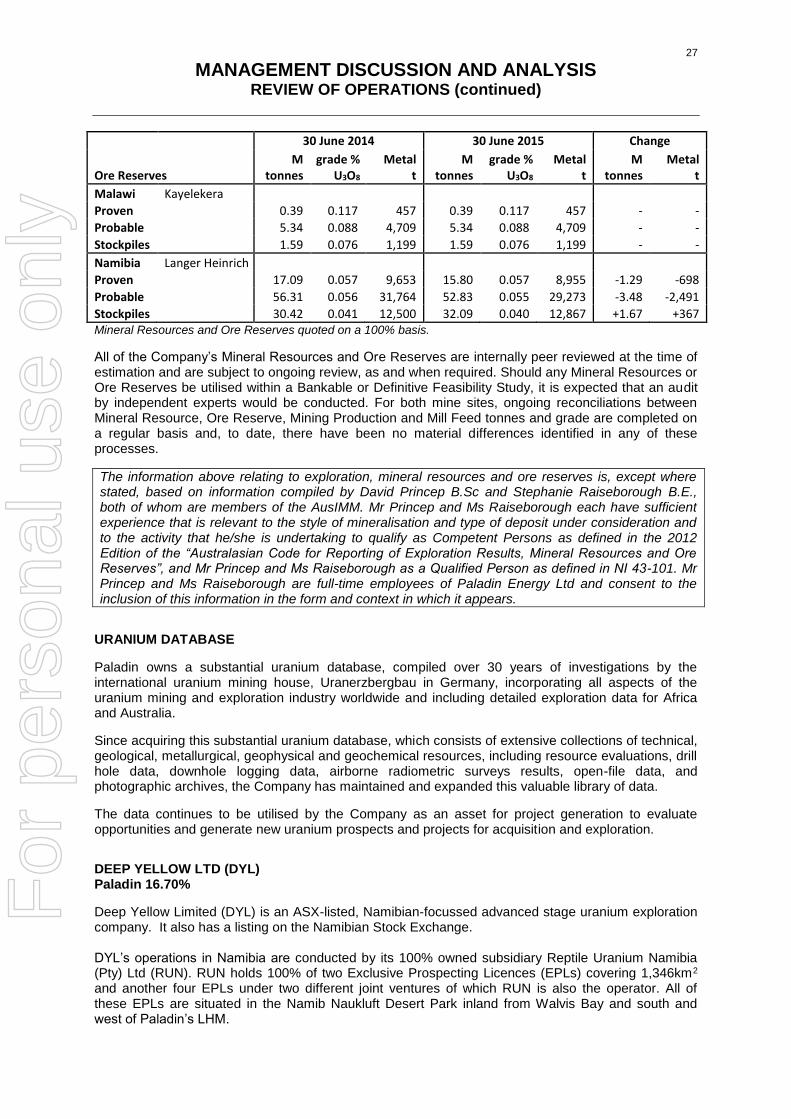
27
MANAGEMENT DISCUSSION AND ANALYSIS REVIEW OF OPERATIONS (continued)
30 June 2014 30 June 2015 Change
Ore Reserves M
tonnes grade %
U3O8 Metal
t M
tonnes grade %
U3O8 Metal
t M
tonnes Metal
t
Malawi Kayelekera
Proven
0.39 0.117 457 0.39 0.117 457 - -
Probable
5.34 0.088 4,709 5.34 0.088 4,709 - -
Stockpiles 1.59 0.076 1,199 1.59 0.076 1,199 - -
Namibia Langer Heinrich
Proven
17.09 0.057 9,653 15.80 0.057 8,955 -1.29 -698
Probable
56.31 0.056 31,764 52.83 0.055 29,273 -3.48 -2,491
Stockpiles 30.42 0.041 12,500 32.09 0.040 12,867 +1.67 +367 Mineral Resources and Ore Reserves quoted on a 100% basis.
All of the Company’s Mineral Resources and Ore Reserves are internally peer reviewed at the time of estimation and are subject to ongoing review, as and when required. Should any Mineral Resources or Ore Reserves be utilised within a Bankable or Definitive Feasibility Study, it is expected that an audit by independent experts would be conducted. For both mine sites, ongoing reconciliations between Mineral Resource, Ore Reserve, Mining Production and Mill Feed tonnes and grade are completed on a regular basis and, to date, there have been no material differences identified in any of these processes.
The information above relating to exploration, mineral resources and ore reserves is, except where stated, based on information compiled by David Princep B.Sc and Stephanie Raiseborough B.E., both of whom are members of the AusIMM. Mr Princep and Ms Raiseborough each have sufficient experience that is relevant to the style of mineralisation and type of deposit under consideration and to the activity that he/she is undertaking to qualify as Competent Persons as defined in the 2012 Edition of the “Australasian Code for Reporting of Exploration Results, Mineral Resources and Ore Reserves”, and Mr Princep and Ms Raiseborough as a Qualified Person as defined in NI 43-101. Mr Princep and Ms Raiseborough are full-time employees of Paladin Energy Ltd and consent to the inclusion of this information in the form and context in which it appears.
URANIUM DATABASE
Paladin owns a substantial uranium database, compiled over 30 years of investigations by the international uranium mining house, Uranerzbergbau in Germany, incorporating all aspects of the uranium mining and exploration industry worldwide and including detailed exploration data for Africa and Australia.
Since acquiring this substantial uranium database, which consists of extensive collections of technical, geological, metallurgical, geophysical and geochemical resources, including resource evaluations, drill hole data, downhole logging data, airborne radiometric surveys results, open-file data, and photographic archives, the Company has maintained and expanded this valuable library of data.
The data continues to be utilised by the Company as an asset for project generation to evaluate opportunities and generate new uranium prospects and projects for acquisition and exploration.
DEEP YELLOW LTD (DYL) Paladin 16.70%
Deep Yellow Limited (DYL) is an ASX-listed, Namibian-focussed advanced stage uranium exploration company. It also has a listing on the Namibian Stock Exchange. DYL’s operations in Namibia are conducted by its 100% owned subsidiary Reptile Uranium Namibia (Pty) Ltd (RUN). RUN holds 100% of two Exclusive Prospecting Licences (EPLs) covering 1,346km2 and another four EPLs under two different joint ventures of which RUN is also the operator. All of these EPLs are situated in the Namib Naukluft Desert Park inland from Walvis Bay and south and west of Paladin’s LHM.
For
per
sona
l use
onl
y

28
MANAGEMENT DISCUSSION AND ANALYSIS REVIEW OF OPERATIONS (continued)
The company’s flagship is the higher grade alaskite Omahola Project on which studies are being conducted to supplement a recently completed (internal) preliminary economic analysis. Scoping level metallurgical testwork is also being planned, which will be required to demonstrate the technical feasibility of developing Omahola as a heap leach project. During the past year DYL attempted to secure a domestic offtaker for the Tubas Sand Project but marginal economics prevented a successful outcome and the project is now on hold. Subsequently the company commenced evaluating fast track development options for its surficial calcrete deposits, similar in nature and some close to Paladin’s LHM, which appear to be amenable to various physical beneficiation upgrading techniques that have been successfully tested over the last four years.
For
per
sona
l use
onl
y
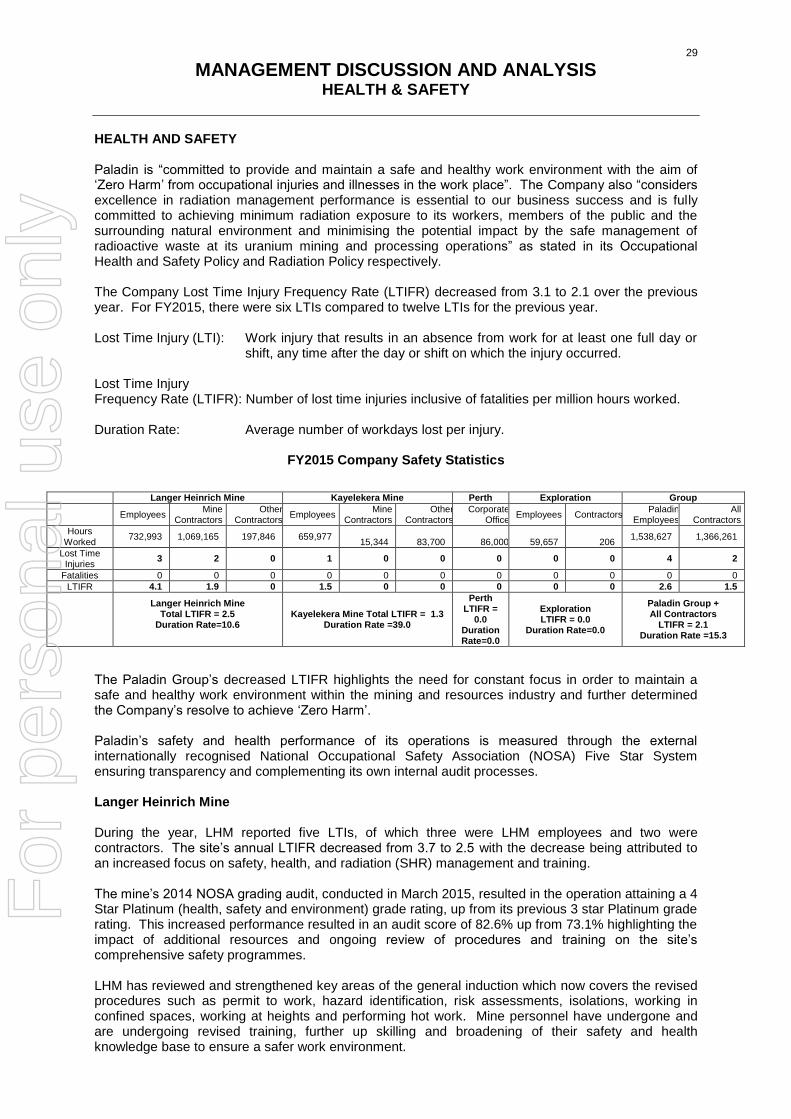
29
MANAGEMENT DISCUSSION AND ANALYSIS HEALTH & SAFETY
HEALTH AND SAFETY Paladin is “committed to provide and maintain a safe and healthy work environment with the aim of ‘Zero Harm’ from occupational injuries and illnesses in the work place”. The Company also “considers excellence in radiation management performance is essential to our business success and is fully committed to achieving minimum radiation exposure to its workers, members of the public and the surrounding natural environment and minimising the potential impact by the safe management of radioactive waste at its uranium mining and processing operations” as stated in its Occupational Health and Safety Policy and Radiation Policy respectively. The Company Lost Time Injury Frequency Rate (LTIFR) decreased from 3.1 to 2.1 over the previous year. For FY2015, there were six LTIs compared to twelve LTIs for the previous year. Lost Time Injury (LTI): Work injury that results in an absence from work for at least one full day or
shift, any time after the day or shift on which the injury occurred. Lost Time Injury Frequency Rate (LTIFR): Number of lost time injuries inclusive of fatalities per million hours worked. Duration Rate: Average number of workdays lost per injury.
FY2015 Company Safety Statistics
The Paladin Group’s decreased LTIFR highlights the need for constant focus in order to maintain a safe and healthy work environment within the mining and resources industry and further determined the Company’s resolve to achieve ‘Zero Harm’. Paladin’s safety and health performance of its operations is measured through the external internationally recognised National Occupational Safety Association (NOSA) Five Star System ensuring transparency and complementing its own internal audit processes. Langer Heinrich Mine During the year, LHM reported five LTIs, of which three were LHM employees and two were contractors. The site’s annual LTIFR decreased from 3.7 to 2.5 with the decrease being attributed to an increased focus on safety, health, and radiation (SHR) management and training. The mine’s 2014 NOSA grading audit, conducted in March 2015, resulted in the operation attaining a 4 Star Platinum (health, safety and environment) grade rating, up from its previous 3 star Platinum grade rating. This increased performance resulted in an audit score of 82.6% up from 73.1% highlighting the impact of additional resources and ongoing review of procedures and training on the site’s comprehensive safety programmes. LHM has reviewed and strengthened key areas of the general induction which now covers the revised procedures such as permit to work, hazard identification, risk assessments, isolations, working in confined spaces, working at heights and performing hot work. Mine personnel have undergone and are undergoing revised training, further up skilling and broadening of their safety and health knowledge base to ensure a safer work environment.
Langer Heinrich Mine Kayelekera Mine Perth Exploration Group
Employees Mine
Contractors Other
Contractors Employees
Mine Contractors
Other Contractors
Corporate Office
Employees Contractors Paladin
Employees All
Contractors
Hours Worked
732,993 1,069,165 197,846 659,977
15,344
83,700
86,000
59,657
206 1,538,627 1,366,261
Lost Time Injuries
3 2 0 1 0 0 0 0 0 4 2
Fatalities 0 0 0 0 0 0 0 0 0 0 0
LTIFR 4.1 1.9 0 1.5 0 0 0 0 0 2.6 1.5
Langer Heinrich Mine
Total LTIFR = 2.5 Duration Rate=10.6
Kayelekera Mine Total LTIFR = 1.3 Duration Rate =39.0
Perth LTIFR =
0.0 Duration Rate=0.0
Exploration LTIFR = 0.0
Duration Rate=0.0
Paladin Group + All Contractors
LTIFR = 2.1 Duration Rate =15.3
For
per
sona
l use
onl
y
30
MANAGEMENT DISCUSSION AND ANALYSIS HEALTH & SAFETY (continued)
LHM continues to be actively involved with the Chamber of Mines Uranium Institute in Namibia, a leading source of advocacy, training and research on uranium related issues. The mine participates in the Chamber of Mines Safety Committee who together with a group of mines safety managers conduct quarterly peer safety reviews. The Safety Committee carried out a safety inspection at the Langer Heinrich Mine during September 2014. The 2014 Annual Radiation Report was compiled and delivered to the Namibian Radiation Protection Authority (NRPA) in March 2015. Radiation doses reported include:
The mean dose to Designated Workers was 3.1 mSv, compared with 3.7 mSv in 2013;
The dose to Non-Designated Workers was 1.6 mSv (compared to 1.9mSv in 2013); and
The dose to a hypothetical group living on the site boundary (Remote Gate) for the entire 2014 year would have been 1.9 mSv. This compares with the mean world member of the public dose as reported by the United Nations Scientific Committee on the Effects of Atomic Radiation (UNSCEAR) of 2.4 mSv.
In April the NRPA issued LHU with a consolidated Authorisation to Export Radioactive Material and Licences for the Possession and Use of Sources. This is the first time that LHU has been able to obtain a consolidated authorisation replacing numerous documents that were previously required to be renewed at various times during the year. Kayelekera Mine The Kayelekera Mine is currently under care and maintenance therefore the workforce numbers and thus man hours have significantly decreased from the previous financial year. The site reported one LTI, relating to an employee, decreasing the annual LTIFR from 2.9 to 1.3. Similar to LHM, a fresh and increased focus and awareness programme instigated as a result of last year’s poor performance has resulted in this reduction in LTIFR. A NOSA Health, Safety and Environment external audit was conducted for the period July 2014 to May 2015 resulting in Kayelekera Mine being awarded a 5 Star Platinum rating – NOSA’s highest standard. The designated worker mean annual radiation dose was 1.1 mSv for 5 months of operating in CY2014 compared with the internationally recommended annual dose limit of 20 mSv. Exploration Paladin’s exploration activities included drilling in Canada and limited ground surveys in remote locations undertaken for its other projects. No LTI’s were recorded for the year with the LTIFR rate decreasing from 11.0 to 0. Exploration continues to maintain and enhance its Safety and Health Management System particularly in the aspects of remote area operations. F
or p
erso
nal u
se o
nly

31
MANAGEMENT DISCUSSION AND ANALYSIS FINANCIAL REVIEW
Operational overview The Group has two uranium mines in Africa1, uranium exploration projects in Australia, Africa and Canada, and a strategy to become a major uranium mining house. The Company is incorporated under the laws of Western Australia with a primary share market listing on the Australian Securities Exchange (“ASX”) and additional listings on the Toronto Stock Exchange (“TSX”) in Canada; as well as the Munich, Berlin, Stuttgart and Frankfurt Stock Exchanges in Europe; and the Namibian Stock Exchange in Africa.
LHM commenced production in 2007 with a capacity of 2.7Mlb U3O8 pa. After operating at this level for a sustained period of time, construction of the Stage 2 expansion to 3.7Mlb U3O8 pa commenced in CY2008. LHM reached the Stage 2 design capacity in December 2009. The plant consistently operated at the 3.7Mlb U3O8 pa rate from the beginning of CY2010. Construction of the Stage 3 expansion to 5.2Mlb U3O8 commenced at the beginning of CY2010 and was completed on 31 March 2012. Commercial production was declared from 1 April 2012. The plant achieved Stage 3 design performance in FY2013. In FY2014, the focus turned to process innovation and production optimisation. The plant achieved record annual production totalling 5.822Mlb2 U3O8 for FY2014, 6% higher than FY2013. In FY2015 the production optimisation strategy continued and focused on the better utilisation of existing equipment, operator and supervision training and the further integration of process control. Process innovation was focused on the Bicarbonate Recovery Plant (BRP). The BRP was commissioned in early March 2015 and apart from minor downtime to complete priority construction punch list items, the plant has run continuously since, at or above design throughput. The process performance of the plant is substantially better than predicted and bicarbonate recovery levels are much higher than forecast. The high degree of success from this project also augurs very well for the ongoing innovation programme and subsequent expected reductions in C1 costs. Construction of KM, with a 3.3Mlb U3O8 design capacity, commenced in 2007 and, after a two-year construction phase, the mine entered its production ramp-up phase in CY2009. KM continued to ramp-up its production volumes through to July 2010. Commercial production was declared from 1 July 2010. KM made its first delivery of uranium to customers in December 2009. During FY2012, the operation made substantial positive steps toward the design of 3.3Mlb U3O8 pa through a programme of plant upgrades aimed at addressing bottlenecks. The plant achieved record annual production totalling 2.963Mlb U3O8 for FY2013, 20% higher than FY2012. The focus at KM turned to production optimisation with the acid recycling (nano-technology) project representing a key element. The acid recovery plant was operational up to the cessation of ore processing and continued to improve beyond its design criteria. On 7 February 2014, the Company announced that it was suspending production at KM and placing the mine on care and maintenance due to the low uranium price and non-profitability of the operation. The plant operated until all reagents in the supply chain were consumed to the maximum extent possible and the plant ceased production on 6 May 2014. After a transition period, during which the site was made safe, the plant cleaned and all remaining product dispatched to customers, the care and maintenance period commenced on 26 May 2014. During care and maintenance the project will be maintained with an adequate component of staffing to keep the project in good working order and to preserve the critical aspects of Intellectual Property and operational knowhow. The Feasibility Study for recommencement of production at KM is near completion with a final internal review of the study underway. The study to date has confirmed that KM remains a valuable strategic asset. KM can provide an additional 2.5Mlb pa in production and has clear potential to produce strong cash flow at uranium prices of US$75/lb, for at least six years, as more than 50% of the project’s total reserves and resources remain for future development. Further regional exploration has the potential to provide additional upside.
1 Langer Heinrich Mine, Namibia (operating). Kayelekera Mine, Malawi (on care and maintenance). 2 Langer Heinrich Mine production volumes were restated and include an adjustment to in-circuit inventory.
For
per
sona
l use
onl
y
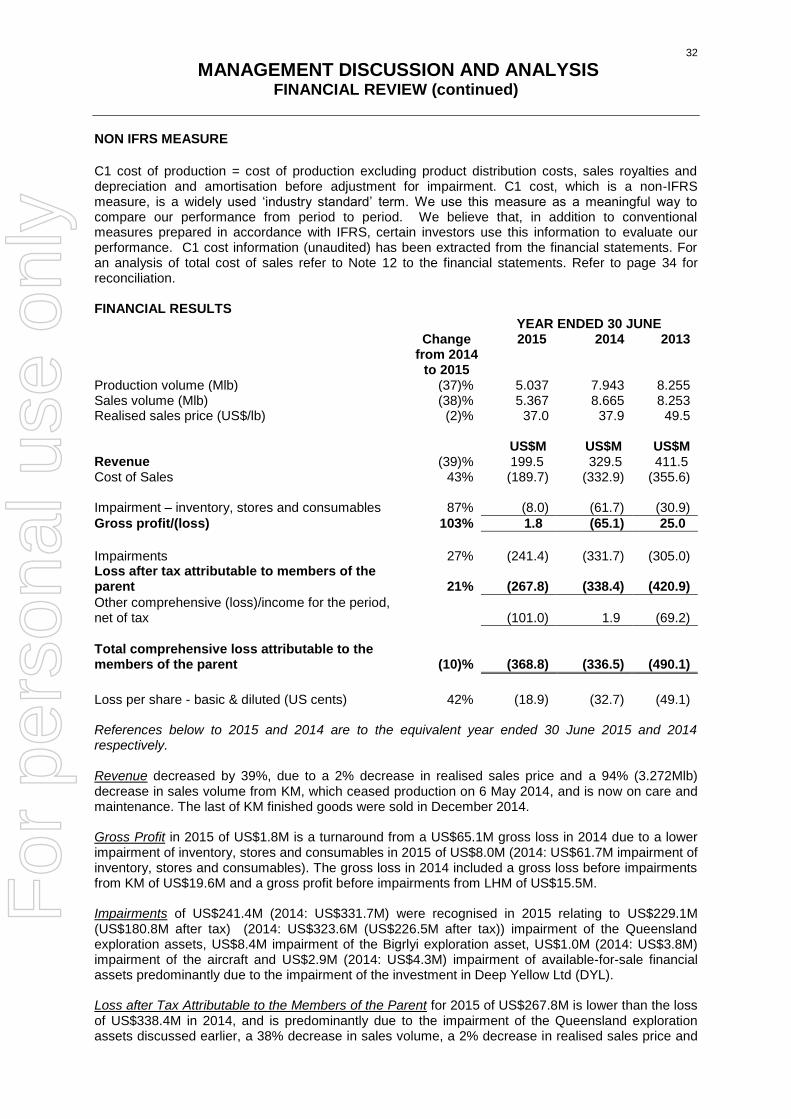
32
MANAGEMENT DISCUSSION AND ANALYSIS FINANCIAL REVIEW (continued)
NON IFRS MEASURE
C1 cost of production = cost of production excluding product distribution costs, sales royalties and depreciation and amortisation before adjustment for impairment. C1 cost, which is a non-IFRS measure, is a widely used ‘industry standard’ term. We use this measure as a meaningful way to compare our performance from period to period. We believe that, in addition to conventional measures prepared in accordance with IFRS, certain investors use this information to evaluate our performance. C1 cost information (unaudited) has been extracted from the financial statements. For an analysis of total cost of sales refer to Note 12 to the financial statements. Refer to page 34 for reconciliation. FINANCIAL RESULTS YEAR ENDED 30 JUNE Change
from 2014 to 2015
2015 2014 2013 Production volume (Mlb) (37)% 5.037 7.943 8.255 Sales volume (Mlb) (38)% 5.367 8.665 8.253 Realised sales price (US$/lb) (2)% 37.0 37.9 49.5 US$M US$M US$M Revenue (39)% 199.5 329.5 411.5 Cost of Sales 43% (189.7) (332.9) (355.6)
Impairment – inventory, stores and consumables
87% (8.0) (61.7) (30.9)
Gross profit/(loss) 103% 1.8 (65.1) 25.0
Impairments 27% (241.4) (331.7) (305.0) Loss after tax attributable to members of the parent
21% (267.8) (338.4) (420.9)
Other comprehensive (loss)/income for the period, net of tax (101.0) 1.9 (69.2)
Total comprehensive loss attributable to the members of the parent
(10)% (368.8) (336.5) (490.1)
Loss per share - basic & diluted (US cents) 42% (18.9) (32.7) (49.1) References below to 2015 and 2014 are to the equivalent year ended 30 June 2015 and 2014 respectively. Revenue decreased by 39%, due to a 2% decrease in realised sales price and a 94% (3.272Mlb) decrease in sales volume from KM, which ceased production on 6 May 2014, and is now on care and maintenance. The last of KM finished goods were sold in December 2014. Gross Profit in 2015 of US$1.8M is a turnaround from a US$65.1M gross loss in 2014 due to a lower impairment of inventory, stores and consumables in 2015 of US$8.0M (2014: US$61.7M impairment of inventory, stores and consumables). The gross loss in 2014 included a gross loss before impairments from KM of US$19.6M and a gross profit before impairments from LHM of US$15.5M. Impairments of US$241.4M (2014: US$331.7M) were recognised in 2015 relating to US$229.1M (US$180.8M after tax) (2014: US$323.6M (US$226.5M after tax)) impairment of the Queensland exploration assets, US$8.4M impairment of the Bigrlyi exploration asset, US$1.0M (2014: US$3.8M) impairment of the aircraft and US$2.9M (2014: US$4.3M) impairment of available-for-sale financial assets predominantly due to the impairment of the investment in Deep Yellow Ltd (DYL). Loss after Tax Attributable to the Members of the Parent for 2015 of US$267.8M is lower than the loss of US$338.4M in 2014, and is predominantly due to the impairment of the Queensland exploration assets discussed earlier, a 38% decrease in sales volume, a 2% decrease in realised sales price and
For
per
sona
l use
onl
y
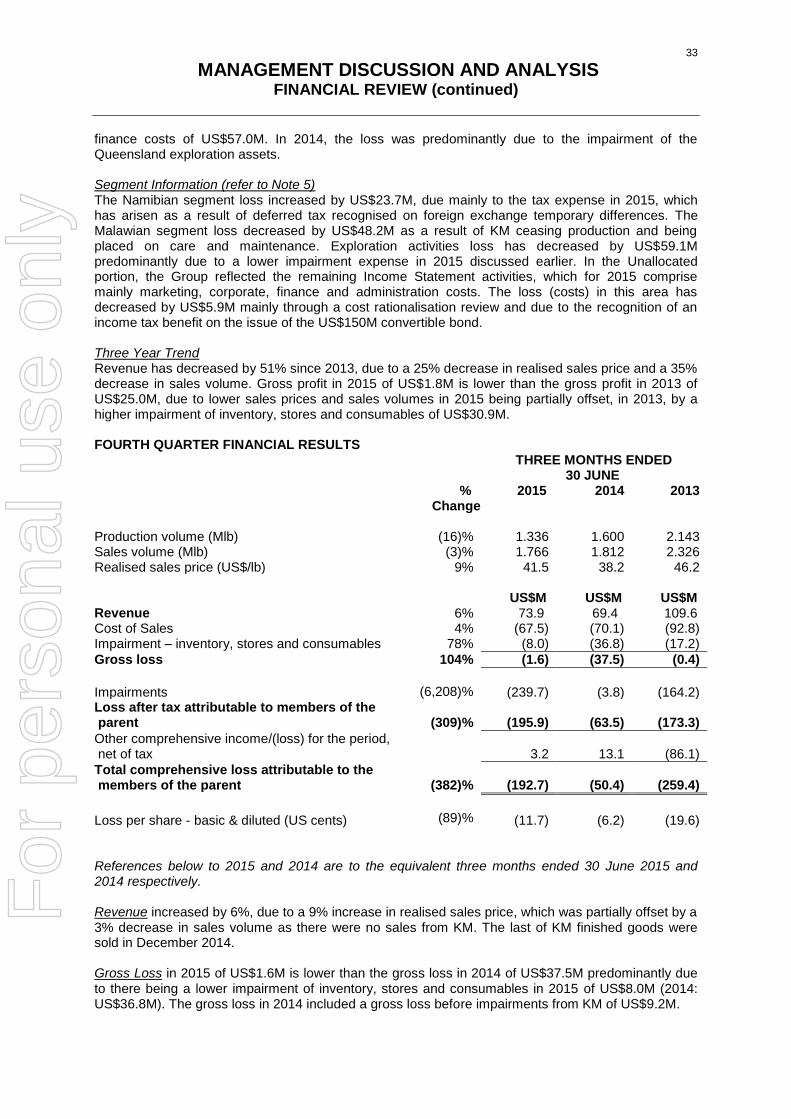
33
MANAGEMENT DISCUSSION AND ANALYSIS FINANCIAL REVIEW (continued)
finance costs of US$57.0M. In 2014, the loss was predominantly due to the impairment of the Queensland exploration assets. Segment Information (refer to Note 5) The Namibian segment loss increased by US$23.7M, due mainly to the tax expense in 2015, which has arisen as a result of deferred tax recognised on foreign exchange temporary differences. The Malawian segment loss decreased by US$48.2M as a result of KM ceasing production and being placed on care and maintenance. Exploration activities loss has decreased by US$59.1M predominantly due to a lower impairment expense in 2015 discussed earlier. In the Unallocated portion, the Group reflected the remaining Income Statement activities, which for 2015 comprise mainly marketing, corporate, finance and administration costs. The loss (costs) in this area has decreased by US$5.9M mainly through a cost rationalisation review and due to the recognition of an income tax benefit on the issue of the US$150M convertible bond. Three Year Trend Revenue has decreased by 51% since 2013, due to a 25% decrease in realised sales price and a 35% decrease in sales volume. Gross profit in 2015 of US$1.8M is lower than the gross profit in 2013 of US$25.0M, due to lower sales prices and sales volumes in 2015 being partially offset, in 2013, by a higher impairment of inventory, stores and consumables of US$30.9M. FOURTH QUARTER FINANCIAL RESULTS THREE MONTHS ENDED
30 JUNE % 2015 2014 2013 Change Production volume (Mlb) (16)% 1.336 1.600 2.143 Sales volume (Mlb) (3)% 1.766 1.812 2.326 Realised sales price (US$/lb) 9% 41.5 38.2 46.2 US$M US$M US$M Revenue 6% 73.9 69.4 109.6 Cost of Sales 4% (67.5) (70.1) (92.8) Impairment – inventory, stores and consumables 78% (8.0) (36.8) (17.2)
Gross loss 104% (1.6) (37.5) (0.4)
Impairments (6,208)% (239.7) (3.8) (164.2) Loss after tax attributable to members of the parent
(309)% (195.9) (63.5) (173.3)
Other comprehensive income/(loss) for the period, net of tax
3.2 13.1 (86.1)
Total comprehensive loss attributable to the members of the parent
(382)% (192.7) (50.4) (259.4)
Loss per share - basic & diluted (US cents)
(89)% (11.7) (6.2) (19.6)
References below to 2015 and 2014 are to the equivalent three months ended 30 June 2015 and 2014 respectively. Revenue increased by 6%, due to a 9% increase in realised sales price, which was partially offset by a 3% decrease in sales volume as there were no sales from KM. The last of KM finished goods were sold in December 2014. Gross Loss in 2015 of US$1.6M is lower than the gross loss in 2014 of US$37.5M predominantly due to there being a lower impairment of inventory, stores and consumables in 2015 of US$8.0M (2014: US$36.8M). The gross loss in 2014 included a gross loss before impairments from KM of US$9.2M.
For
per
sona
l use
onl
y
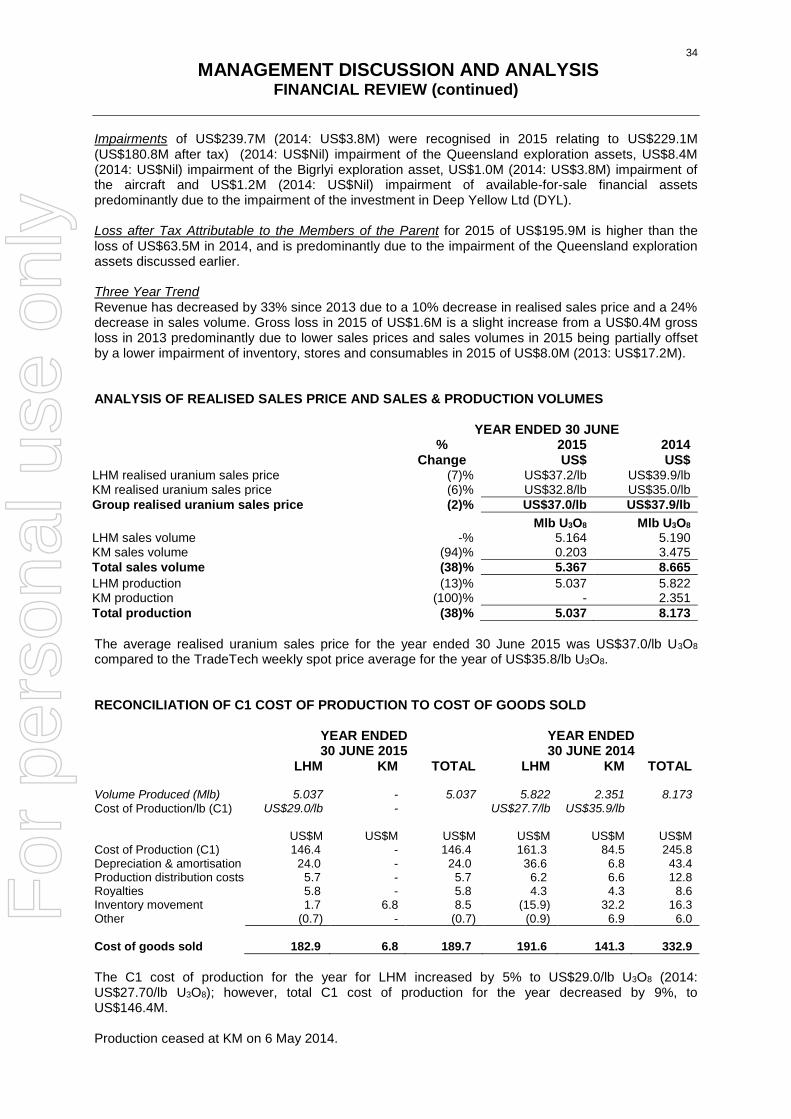
34
MANAGEMENT DISCUSSION AND ANALYSIS FINANCIAL REVIEW (continued)
Impairments of US$239.7M (2014: US$3.8M) were recognised in 2015 relating to US$229.1M (US$180.8M after tax) (2014: US$Nil) impairment of the Queensland exploration assets, US$8.4M (2014: US$Nil) impairment of the Bigrlyi exploration asset, US$1.0M (2014: US$3.8M) impairment of the aircraft and US$1.2M (2014: US$Nil) impairment of available-for-sale financial assets predominantly due to the impairment of the investment in Deep Yellow Ltd (DYL). Loss after Tax Attributable to the Members of the Parent for 2015 of US$195.9M is higher than the loss of US$63.5M in 2014, and is predominantly due to the impairment of the Queensland exploration assets discussed earlier. Three Year Trend Revenue has decreased by 33% since 2013 due to a 10% decrease in realised sales price and a 24% decrease in sales volume. Gross loss in 2015 of US$1.6M is a slight increase from a US$0.4M gross loss in 2013 predominantly due to lower sales prices and sales volumes in 2015 being partially offset by a lower impairment of inventory, stores and consumables in 2015 of US$8.0M (2013: US$17.2M). ANALYSIS OF REALISED SALES PRICE AND SALES & PRODUCTION VOLUMES YEAR ENDED 30 JUNE
%
Change 2015 US$
2014 US$
LHM realised uranium sales price KM realised uranium sales price
(7)% (6)%
US$37.2/lb US$32.8/lb
US$39.9/lb US$35.0/lb
Group realised uranium sales price (2)% US$37.0/lb US$37.9/lb
Mlb U3O8 Mlb U3O8 LHM sales volume KM sales volume
-% (94)%
5.164 0.203
5.190 3.475
Total sales volume (38)% 5.367 8.665
LHM production KM production
(13)% (100)%
5.037 -
5.822 2.351
Total production (38)% 5.037 8.173
The average realised uranium sales price for the year ended 30 June 2015 was US$37.0/lb U3O8 compared to the TradeTech weekly spot price average for the year of US$35.8/lb U3O8. RECONCILIATION OF C1 COST OF PRODUCTION TO COST OF GOODS SOLD
YEAR ENDED 30 JUNE 2015
YEAR ENDED 30 JUNE 2014
LHM KM TOTAL LHM KM TOTAL Volume Produced (Mlb) 5.037 - 5.037 5.822 2.351 8.173
Cost of Production/lb (C1) US$29.0/lb - US$27.7/lb US$35.9/lb US$M US$M US$M US$M US$M US$M Cost of Production (C1) 146.4 - 146.4 161.3 84.5 245.8 Depreciation & amortisation 24.0 - 24.0 36.6 6.8 43.4 Production distribution costs 5.7 - 5.7 6.2 6.6 12.8 Royalties 5.8 - 5.8 4.3 4.3 8.6 Inventory movement 1.7 6.8 8.5 (15.9) 32.2 16.3 Other (0.7) - (0.7) (0.9) 6.9 6.0
Cost of goods sold 182.9 6.8 189.7 191.6 141.3 332.9
The C1 cost of production for the year for LHM increased by 5% to US$29.0/lb U3O8 (2014: US$27.70/lb U3O8); however, total C1 cost of production for the year decreased by 9%, to US$146.4M. Production ceased at KM on 6 May 2014.
For
per
sona
l use
onl
y

35
MANAGEMENT DISCUSSION AND ANALYSIS FINANCIAL REVIEW (continued)
ANALYSIS OF ADMINISTRATION, MARKETING & NON-PRODUCTION COSTS
YEAR ENDED 30 JUNE %
Change 2015
US$M 2014
US$M
Total 12% (19.3) (21.9)
Costs for the year ended 30 June 2015 decreased by US$2.6M, primarily due to a reduction of US$2.9M in non-production mine site costs as KM has been placed on care and maintenance. SUMMARY OF QUARTERLY FINANCIAL RESULTS 2015 2015 2014 2014 Jun Qtr Mar Qtr Dec Qtr Sep Qtr
LHM
Production U3O8* Mlb 1.336 1.234 1.377 1.090
C1 cost of production* US$/lb 26.0 29.4 28.6 33.0
KM
Production U3O8 Mlb - - - - C1 cost of production US$/lb - - - -
Total revenues US$M 73.9 17.1 70.4 39.3 Sales volume Mlb 1.766 0.440 1.911 1.250
Realised uranium sales price US$/lb 41.5 38.0 36.4 31.2 Impairments US$M (247.7) - (1.7) - Loss after tax attributable to members US$M (195.9) (12.6) (20.5) (38.8)
Basic and diluted loss per share US cents (11.7) (0.8) (1.7) (3.8)
2014
2014 2013 2013
Jun Qtr Mar Qtr Dec Qtr Sep Qtr
LHM
Production U3O8* Mlb 1.416 1.463 1.514 1.429
C1 cost of production* US$/lb 29.5 27.6 26.0 28.0
KM
Production U3O8 Mlb 0.262 0.697 0.777 0.615
C1 cost of production US$/lb 44.7 32.9 33.1 39.3
Total revenues US$M 69.4 88.6 102.1 69.4
Sales volume Mlb 1.812 2.405 2.775 1.673
Realised uranium sales price US$/lb 38.2 36.8 36.7 41.4
Impairments US$M (40.6) - (337.3) (15.5)
Loss after tax attributable to members US$M (63.5) (19.9) (215.0) (40.0)
Basic and diluted loss per share US cents (6.2) (2.0) (21.2) (3.9)
* LHM production volumes and unit C1 cost of production for the quarters ended December 2014, September 2014, June 2014, March 2014 and December 2013 include an adjustment to in-circuit inventory relating to leached uranium within the process circuit. The unit C1 cost of production for LHM decreased 12% over the last year, from US$29.5/lb in the June 2014 quarter to US$26.0/lb in the June 2015 quarter, due to a combination of a weaker Namibian dollar and cost saving initiatives.
For
per
sona
l use
onl
y
36
MANAGEMENT DISCUSSION AND ANALYSIS FINANCIAL REVIEW (continued)
Cash flow optimisation remains an ongoing priority and further improvements in C1 costs are expected due to a number of additional initiatives. Process innovation was focused on the Bicarbonate Recovery Plant (BRP). The BRP was commissioned in early March 2015. The process performance of the plant is substantially better than predicted and bicarbonate recovery levels are much higher than forecast. The high degree of success from this project also augurs very well for the ongoing innovation programme and subsequent expected reductions in C1 costs. The BRP operated well throughout the June 2015 quarter, achieving 115% to 120% of design capacity in terms of both volume processed and sodium bicarbonate recovered. Significant process optimisation has taken place during the June 2015 quarter such that, for the month of June 2015, the plant achieved 147% of its design capacity, a level of performance that is expected to be maintained, or exceeded, through the September quarter. This equates to a potential direct annual saving of approximately 22,500tpa of sodium bicarbonate and 10,700tpa of caustic soda totalling about US$16M in reagent cost savings. Further optimisation is ultimately expected to lift the BRP performance to higher than 200% of design (in terms of sodium bicarbonate recycled and caustic savings) by December 2015 and without the need for the installation of any additional equipment. Further associated innovations are either in the implementation or design phase and scheduled for both FY16 and FY17. As expected, the BRP has had a significant additional positive impact on broader process plant performance and subsequent unit operating cost with:
Soluble loss down approximately 70%;
Resin loadings approximately double previous levels and consequently planned resin replacement ($0.50/lb cost) may no longer be required;
Stabilised process operability; and
Stabilised site water balance with greater discretionary control. In addition to the direct savings, there are a number of indirect savings and recovery improvements that were expected. These too are being realised at a substantially greater level. One of these indirect benefits is a reduction in soluble loss that has allowed the recognition of additional dissolved uranium inventory within Tailings Facility TSF3, which will now be converted to drummed product in the normal course of operations. A consequential adjustment of 509,694lb was required, and has been made, for all production since TSF3 was commissioned in October 2013 (FY2015: 280,046lb and FY2014: 229,648lb). In addition, following the commissioning of the BRP, process improvements have increased product in circuit by 334,101lb. The impact of the BRP has been to: (i) concentrate the uranium in the SDU reactors, (ii) increase the slurry density to improve final product quality, and (iii) reduce in process water inventory. Additional inventory has also accumulated in the circuit, due to operational factors associated with the SDU thickener. It is expected that this inventory will be processed and drummed in the normal course of operations. The high degree of success from the BRP project augurs well for the ongoing success of Paladin’s innovation programme. The new technology underpinning this programme is the key driver of the forecast further reductions in C1 costs at LHM. It should be noted that at the end of FY14 the combined sodium bicarbonate and caustic reagent costs represented approximately 56% of process operating costs. This is expected to fall to 32% in FY16 with potential remaining for further reductions. Total revenue for the quarter ended June 2015 was higher than the comparative quarter, due to higher realised uranium prices. Total revenue for the quarter ended March 2015 was lower than the comparative quarter, because of lower uranium sales volumes. Total revenues for the quarters ended September 2014 and December 2014 were lower than the comparative quarters, due to lower realised uranium prices and lower sales volumes. Additionally, KM is now in care and maintenance with production ceasing on 6 May 2014.
For
per
sona
l use
onl
y
37
MANAGEMENT DISCUSSION AND ANALYSIS FINANCIAL REVIEW (continued)
Certain Balance Sheet items are set out below:
SUMMARISED STATEMENT OF FINANCIAL POSITION
YEAR ENDED 30 JUNE
2015 2014 2013 US$M US$M US$M
Cash and cash equivalents 183.7 88.8 78.1 Inventories 231.6 238.3 300.2 Total assets 1,100.0 1,565.7 1,837.7 Interest bearing loans and borrowings 534.5 725.6 677.8 Total long-term liabilities 859.3 1,049.1 1,058.1 Net Assets 198.3 432.4 648.2
Cash and Cash Equivalents have increased by US$94.9M, mainly as a result of the final US$170.0M proceeds received in July 2014 from the sale of a 25% interest in LHM, US$119.7M from the entitlement offer, US$52.7M from the share placement to HOPU, and the proceeds from the issue of a US$150.0M convertible bond at 31 March 2015, which have been partially offset by the repurchase of the US$300.0M November 2010 convertible bond, a US$39.9M repayment of the LHM project finance facility and syndicated loan and costs attributable to the capital raisings. Additionally, there were payments for plant and equipment of US$11.5M, exploration and evaluation project expenditure of US$5.8M and net interest paid of US$28.8M. Inventories have decreased by US$6.7M, predominantly due to a decrease in the number of pounds of finished goods at 30 June 2015 which has been partially offset by a planned increase in ROM stockpiles at LHM as part of Stage 3 production expansion required to meet the future mine plan ore-blend requirements. Interest Bearing Loans and Borrowings have decreased by US$191.1M, primarily as a result of the repurchase of the US$300M November 2010 convertible bond and US$39.9M repayment of the LHM project finance facility and syndicated loan, which has been partially offset by the issue of a US$150M convertible bond on 31 March 2015, establishment costs for the new syndicated loan of US$1.5M, convertible bond raising costs of US$4.2M less non-cash accretion of the convertible bonds of US$18.2M. Segment Assets: Namibian assets have increased predominantly due to an increase in cash, which was partially offset by a decrease in inventory and trade and other receivables. Malawian assets have decreased as a result of a decrease in the value of inventory held by KM, as all finished product has now been sold, and a decrease in cash and trade debtors. KM is on care and maintenance. The Exploration segment assets have decreased predominantly due to the impairment of the Queensland exploration assets discussed under the Financial Results section and as a result of a decrease in the US dollar value of exploration assets, which is due to the decremental foreign exchange movement of the Australian and Canadian dollar currencies against the US dollar. In the Unallocated portion, assets decreased primarily due to a decrease in trade and other receivables, which in 2014 included a US$170M receivable relating to the outstanding proceeds for the sale of a 25% equity stake in LHM, which was partially offset by an increase in cash from the placement and entitlement offer and the issue of a US$150M convertible bond. LIQUIDITY AND CAPITAL RESOURCES The Group’s principal source of liquidity as at 30 June 2015, was cash of US$183.7M (30 June 2014: US$88.8M). Any cash available to be invested is held with Australian banks with a minimum AA- Standard & Poor’s credit rating over a range of maturities. Of this, US$178.6M is held in US dollars. Net Cash Outflow from Operating Activities was US$24.7M in 2015 (2014: inflow US$10.1M), primarily due to receipts from customers of US$215.4M (2014: US$370.3M), which were offset by payments to suppliers and employees of US$210.9M (2014: US$326.3M) and net interest paid of US$28.8M (2014: US$32.3M).
For
per
sona
l use
onl
y
38
MANAGEMENT DISCUSSION AND ANALYSIS FINANCIAL REVIEW (continued)
Net Cash Outflow from Investing Activities was US$15.6M in 2015 and is due primarily to plant and equipment acquisitions of US$11.5M, including, at LHM, the BRP and spiral heat exchangers, as well as capitalised exploration expenditure of US$4.2M. The net cash outflow of US$25.3M in 2014 was due primarily to plant and equipment acquisitions of US$20.3M, predominantly the new tailings facility at LHM and BRP and tailings pipeline at KM, as well as capitalised exploration expenditure of US$5.8M. Net Cash Inflow from Financing Activities of US$137.6M in 2015 is attributable to the proceeds received from the sale of a 25% interest in LHM for US$170M, from the entitlement offer of US$119.7M, from the share placement to HOPU of US$52.7M and from the convertible bond issue of US$150M, and has been partially offset by the repurchase of the US$300M November 2010 convertible bond, a US$39.9M repayment of the LHM project finance and syndicated loan facility, US$1.5M in syndicated loan facility establishment costs, US$3.0M in costs attributable to sale of a non-controlling interest in LHM, US$6.2M in equity capital raising costs and US$4.2M in convertible bond raising costs. The net inflow in 2014 of US$26.3M was attributable to the net proceeds received from the share placement of US$80.7M and from the drawdown of debt funding of US$110.0M, which was partially offset by a repayment of project financing of US$178.8M. GOING CONCERN As at 30 June 2015, the Group had a net working capital surplus of US$231.8M (30 June 2014: US$288.5M), including cash on hand of US$183.7M (30 June 2014: US$88.8M). Included within this cash on hand is US$31.2M (30 June 2014: US$13.2M), which is restricted for use in respect of the LHM syndicated loan facility and supplier guarantees provided by LHM. The amount outstanding at 30 June 2015 on the syndicated loan facility was US$60.9M. Repayment obligations during the next twelve months to 30 June 2016 in respect of interest bearing loans and borrowings are summarised as follows:
secured bank loan principal repayments of US$9.1M for syndicated loan facility; and
interest payments of US$29.7M for syndicated loan facility and 2012 (due 2017) and 2015 (due 2020) unsecured convertible bonds.
In December 2014, the Group successfully completed an equity capital raising of A$205M (US$172.4M) through the introduction of a strategic investor, together with completion of a well-supported entitlement offer. On 31 March 2015, the Company issued a US$150M convertible bond with a coupon rate of 7.00% maturing on 31 March 2020 and a conversion price of US$0.356 for Company shares. US$100M was issued to high quality institutional investors, whilst US$50M was issued to Leader Investment Corporation, a controlled subsidiary of CIC, one of the largest sovereign wealth funds in the world. The issue was approved by shareholders on 30 March 2015. The proceeds from the convertible bond issue, along with the existing cash balance, were used to fund a concurrent tender offer to acquire the outstanding US$300M convertible bonds due November 2015, issued by the Company on 4 November 2010. At the date of this report, the Directors are satisfied there are reasonable grounds to believe that, having regard to the Group’s position and its available financing options, the Group will be able to meet its obligations as and when they fall due.
For
per
sona
l use
onl
y

39
MANAGEMENT DISCUSSION AND ANALYSIS FINANCIAL REVIEW (continued)
The following is a summary of the Group’s outstanding commitments as at 30 June 2015: Payments due by period
Total
US$M
Less than 1 yr
US$M
1 to 5yrs
US$M
5yrs+ or Unknown
US$M
Tenements 21.6 0.6 9.8 11.2 Operating leases 0.9 0.8 0.1 - Mining, transport and reagents 17.2 15.3 1.9 - Manyingee acquisition costs 0.6 - - 0.6 Total commitments 40.3 16.7 11.8 11.8
In relation to the Manyingee Uranium Project, the acquisition terms provide for a payment of A$0.75M (US$0.57M) by the Group to the vendors when all project development approvals are obtained. The Group has no other material off balance sheet arrangements. OUTSTANDING SHARE INFORMATION As at 27 August 2015, Paladin had 1,711,927,688 fully paid ordinary shares issued. The following table sets out the fully paid ordinary shares and those issuable under the Group Employee Performance Share Rights Plan and in relation to the Convertible Bonds: As at 27 August 2015 Number Ordinary shares 1,711,927,688 Issuable under Employee Performance Share Rights Plan 788,754 Issuable under Share Option Plan 1,000,000 Issuable in relation to the US$274 million Convertible Bonds 149,726,776 Issuable in relation to the US$150 million Convertible Bonds 421,348,315
Total 2,284,791,533 CRITICAL ACCOUNTING ESTIMATES The preparation of the Financial Report requires management to make estimates and assumptions that affect the reported amount of assets and liabilities and disclosure of contingent assets and liabilities at the date of the financial statements and the reported amount of revenues and expenses during the reporting period. Significant areas requiring the use of management estimates relate to the determination of the following: carrying value or impairment of inventories, financial investments, property, plant and equipment, intangibles, mineral properties and deferred tax assets; carrying value of rehabilitation, mine closure, sales contracts provisions and deferred tax liabilities; and the calculation of share-based payments. FINANCIAL INSTRUMENTS At 30 June 2015, the Group has exposure to interest rate risk, which is the risk that the Group’s financial position will be adversely affected by movements in interest rates that will increase the cost of floating rate project finance debt or opportunity losses that may arise on fixed rate convertible bonds in a falling interest rate environment. Interest rate risk on cash and short-term deposits is not considered to be a material risk due to the historically low US dollar interest rates of these financial instruments. The Group has no significant monetary foreign currency assets or liabilities apart from Namibian Dollar cash, receivables, payables and provisions and Australian dollar cash and, payables and Canadian payables. The Group currently does not engage in any hedging or derivative transactions to manage uranium price movements, interest rate or foreign currency risks. The Group’s credit risk is the risk that a contracting entity will not complete its obligation under a financial instrument that will result in a financial loss to the Group. The carrying amount of financial assets represents the maximum credit exposure. The Group trades only with recognised, credit worthy third parties. In addition, receivable balances are monitored on an ongoing basis with the result that the Group’s exposure to bad debts is not material.
For
per
sona
l use
onl
y
40
MANAGEMENT DISCUSSION AND ANALYSIS FINANCIAL REVIEW (continued)
The Group’s treasury function is responsible for the Group’s capital management, including management of the long-term debt and cash as part of the capital structure. This involves the use of corporate forecasting models which enable analysis of the Group’s financial position, including cash flow forecasts, to determine the future capital management requirements. To ensure sufficient funding for operational expenditure and growth activities, a range of assumptions are modelled so as to provide the flexibility in determining the Group’s optimal future capital structure. OTHER RISKS AND UNCERTAINTIES Risk Factors
The Group is subject to other risks that are outlined in the Annual Information Form 51-102F2, which is available on SEDAR at sedar.com TRANSACTIONS WITH RELATED PARTIES During the year ended 30 June 2015, no payments were made to Director related entities. Directors of the Company receive fees as outlined in the Company’s management circular forming part of the Company’s Notice of AGM. The only related party transactions are with Directors and Key Management Personnel. Refer to Note 27. Details of material controlled entities are set out in Note 32.
DISCLOSURE CONTROLS The Group has applied its Disclosure Control Policy to the preparation of the Consolidated Financial Report for year ended 30 June 2015, associated Management Discussion and Analysis and Report to Shareholders. An evaluation of the Group’s disclosure controls and procedures used has been undertaken and concluded that the disclosure controls and procedures were effective. INTERNAL CONTROLS The Group has designed appropriate Internal Controls over Financial Reporting (ICFR) and ensured that these were in place for the year ended 30 June 2015. An evaluation of the design of ICFR has concluded that it is adequate to prevent a material misstatement of the Group’s Consolidated Financial Report as at 30 June 2015. During the year, the Group continued to have an internal audit function externally contracted to Deloitte Touche Tohmatsu. Internal audit reports and follow-up reviews were completed during the year and the Group continues to address their recommendations. The resultant changes to the ICFR have improved and will continue to improve the Group’s framework of internal control in relation to financial reporting. CHANGES IN ACCOUNTING POLICIES The Group has adopted all new and amended Australian Accounting Standards and AASB Interpretations effective from 1 July 2014. The nature and impact of each new standard and amendment is described in Note 3 – Basis of Preparation. SUBSEQUENT EVENTS Other than disclosed below, since 30 June 2015, the Directors are not aware of any other matter or circumstance not otherwise dealt with in this report, that has significantly or may significantly affect the operations of the Group, the results of those operations or the state of affairs of the Group in subsequent periods with the exception of the following, the financial effects of which have not been provided for in the 30 June 2015 Financial Report:
For
per
sona
l use
onl
y

41
MANAGEMENT DISCUSSION AND ANALYSIS FINANCIAL REVIEW (continued)
Material Reduction in Costs On 30 July 2015, the Company advised of a material reduction in its cash flow break-even level through a sustainable reduction in its all-in cash costs (including capital expenditure, corporate costs and debt servicing). These measures will reduce Paladin’s total cash costs by more than US$33M compared to FY2015. Subsequent to the US$33M in cost reductions announced on 30 July 2015, Paladin has identified further significant cash flow optimisation initiatives. Such initiatives include:
LHM operating initiatives – As a consequence of the BRP, barren solution used for wash in the counter current decantation section of the LHM plant is expected to reduce from approximately 50ppm U3O8 to less than 10ppm. This will result in a significant improvement in wash efficiency. The Company’s original FY2016 outlook assumed wash efficiency of 93.1%. Paladin now anticipates a wash efficiency in the range of 95% to 98% for FY2016. The Company has also revised its FY2016 life of mine plan for LHM resulting in an average feed-grade of 694ppm U3O8, i.e., an increase of 11ppm over the guidance provided in the last Quarterly Activities Report announced on 16 July 2015.
Corporate costs, exploration and KM initiatives – Paladin has implemented reductions in these areas to further reduce annualised cash expenditure by approximately US$8M over the initiatives set out in the cost reduction announcement of 30 July 2015 (i.e., a cumulative US$14M less than FY2015). The additional initiatives include a reduction in approximately 50% of corporate staff that was undertaken on 21 August 2015 concurrent with the reduction in the number of directors and reduction in board fees announced the same day. Exploration has been put on care and maintenance whereby the Company will undertake the work required to meet minimum license expenditures only.
Change of Chief Executive Officer On 30 July 2015, the Company advised that its Board and Managing Director and CEO Mr John Borshoff had agreed that Mr Borshoff would step down from his role with the Company. A process to identify a suitable new CEO is now underway. In the interim, Mr Alexander Molyneux has been appointed Interim CEO. Mr Molyneux joins with substantial experience in natural resources executive leadership, including both public mining company CEO and uranium experience. Mr Molyneux’s core mandate will be to: (i) to continue the optimisation of Paladin’s overall cash flow break-even level with the aim to become cash flow generative in the current uranium price environment; (ii) focus on accelerating strategic initiatives that deliver value; and (iii) to assist the Board in its search for a permanent CEO. Board and Management Restructuring On 21 August 2015, the Company advised of board and management changes, and a reduction in board remuneration. Paladin’s board accepted the resignation of Non-Executive Director Mr Sean Llewelyn. Ms Gillian Swaby, Group Company Secretary and EGM Corporate Services, and the Company agreed Ms Swaby would step down from her role at the Company. Mr Ranko Matic was appointed Company Secretary. Paladin’s board adjusted its remuneration structure with an effective date of 1 July 2015. The revised structure will alter the base salary for Non-Executive Directors to A$65,000 and the Non-Executive Chairman to A$125,000.
For
per
sona
l use
onl
y
42
SUSTAINABLE DEVELOPMENT
Paladin is committed to the goal of sustainable development, which is reflected in its corporate values. The Company’s values include promoting the creation of shared wealth, becoming a major uranium supplier, operating at global best practice, safety and environmental stewardship, employee welfare and recognition, and contributing and responding to the attitudes and expectations of local communities in the countries in which Paladin operates. The Company is cognisant of the extra diligence that is required for those in the uranium industry. It has therefore established an in-house team with extensive knowledge about uranium and the stringent requirements related to the commodity. The Company emphasises acting with integrity, honesty and cultural sensitivity in all of its dealings. In support of this commitment, Paladin applies and adheres to established and internationally recognised principles of sustainable development for all of its global activities. In implementing its sustainable development programme, Paladin aims to achieve a balance between economic, environmental and social needs in all phases of its projects, and takes into consideration its employees, communities, shareholders and other key stakeholders. Paladin ensures that its high standards are not compromised despite the difficult economic climate that it is currently operating in. To deliver on Paladin’s commitment to sustainable development, the Company has a Sustainability Committee whose role is to provide the Board with an overview of Paladin’s performance in the areas of health, safety, radiation, environment, social responsibility and sustainable development, and to offer advice and recommendations where significant sustainability related issues arise. The Sustainability Committee comprises three members: the Chairman of Paladin’s Board, Paladin’s Managing Director/CEO and a Non-executive independent Director who is also the Chairman of that Committee. Corporate Sustainability Reporting Paladin produced its third Sustainability Report (FY2014), which can be found on the Company’s website www.paladinenergy.com.au. Paladin is continuing the data collection process from LHM and KM for input into the FY2015 Sustainability Report. Data is collected specifically to meet the reporting guidelines of the Global Reporting Initiative (GRI) Framework applying the G4 requirements. The GRI Sustainability Reporting Guidelines provide principles for and guidance on defining report content. Paladin’s focus is on those indicators that are considered material to the Company and have therefore conducted materiality assessments to define the reporting parameters. To allow sufficient time for comprehensive data collection, assessment and reporting for the FY2015 period, the report is expected to be available on the website towards the end of CY2015. The following discussion provides an overview of Paladin’s environmental management. More detail on environmental performance, specific management and quantitative data for the reporting period will be provided in the 2015 Sustainability Report. ENVIRONMENT Our Commitment Paladin is committed to ensuring that effective environmental management is planned and undertaken for all aspects of its operations. The approach to environmental management is guided by Paladin’s Environmental Policy, which promotes a standard of excellence for environmental performance across its operations. The key points of the Policy include:
complying with applicable environmental legislation;
ensuring operations have developed an environmental management system;
identifying, assessing and managing environmental risks;
implementing and assigning accountabilities for standards, guidelines and procedures;
striving to achieve continuous improvement in environmental performance;
preventing and mitigating pollution;
communicating environmental responsibility to employees and contractors;
effective consultation with stakeholders on environmental issues;
inspections and audits of environmental performance; and
reporting on environmental performance.
For
per
sona
l use
onl
y

43
SUSTAINABLE DEVELOPMENT (continued)
Paladin has established Corporate Sustainable Development Standards for all of its operational subsidiaries. Operational compliance with Paladin’s Standards forms part of the Corporate Environmental Audit Programme. Environmental Management System Within the Paladin Environmental Management System (EMS) Standard, each operating site is required to develop and implement an EMS that is consistent with the requirements of ISO14001:2004. The EMS for LHM was re-certified in April 2015 for a period of three years. The development and implementation of an EMS at KM is continuing for the care and maintenance phase. Operational Environmental Management Plans (EMP) for both LHM and KM have been submitted to and reviewed by the Namibian and Malawian Governments, as well as to other stakeholders and international financial lending institutions as part of the project financing agreement conditions. The Operational EMPs are regularly updated and revised as part of the sites’ continual improvement process. A care and maintenance EMP has been prepared for KM and will be adhered to during the care and maintenance phase. Environment Regulatory Reporting Both LHUPL and PAL prepare various environmental reports for the Namibian and Malawi Governments, respectively. Regulatory reporting for LHM is conducted monthly and annually for water aspects, and, annually for general environmental reporting. Regulatory environmental reporting at KM is conducted on a quarterly basis for data provision and for regulatory compliance, and on an annual basis for general environmental reporting Inspection and Audit Programme The Paladin Environmental Audit Standard requires operating sites to establish and implement environmental inspection and audit programmes to ensure that the environmental performance of the operations is reviewed, audited and reported to the Board. These audits are undertaken to ensure that there is not only compliance with regulatory and Paladin requirements, but also with the World Bank Equator Principles and other industry standards, particularly those specified for the uranium industry. During the reporting period, inspections and audits were undertaken at both LHM and KM, with the findings documented and actions developed to rectify and manage identified issues. Corporate Environmental Audit Reports are provided to the Paladin Energy Board Sustainability Committee. Energy Energy requirements at Paladin’s operations are principally in the form of fuel for vehicles and electricity generation. Electricity at LHM is purchased from the Namibian grid, which can be supplemented, if necessary, with power generated from the on-site power plant. Power for the care and maintenance activities at KM is generated by a diesel-fuelled power station. Fuel usage at both sites for vehicles comprises diesel and minor amounts of petrol. Emulsion is used at LHM as an explosive for blasting. The volume of the fuels used and the energy purchased during the reporting period is being collated and will be reported in the 2015 Sustainability Report. Water Paladin applies a Standard for Water Use and Water Quality at its operations to ensure that there is efficient, safe and sustainable use of water and that water resources and ecosystems around its sites are protected. Both LHM and KM have implemented water management strategies and maintain whole-of-site water balances to ensure that the Company’s objectives around water usage, supply and resource protection are achieved. Reuse and recycling of water is maximised as much as possible at Paladin’s operations.
For
per
sona
l use
onl
y
44
SUSTAINABLE DEVELOPMENT (continued)
A specific care and maintenance water management strategy has been developed for KM which focuses on reducing stored water in the water collection ponds to ensure sufficient capacity remains in the ponds to capture rainfall runoff from the mining and processing areas of disturbance. Water from the ponds is being treated in an on-site water treatment plant to a quality suitable for discharge. Treated water is discharged into the local river under licence conditions. A comprehensive surface and groundwater monitoring programme is undertaken at LHM and KM. All water monitoring data are collated in annual water reports that consolidate and summarise the key water aspects across Paladin’s operations. Water aspects as per the GRI indicator requirements will be presented in the 2015 Sustainability Report. Land Use, Biodiversity and Rehabilitation Land use and understanding land values are important components of sustainable development. Prior to disturbance for project development or expansions, studies are conducted to determine land use and land values including for biodiversity, ecological, social and cultural heritage. Land clearing approval processes are in place at all Paladin sites with the aim of minimising the area of disturbance, and ensuring areas are surveyed to assess impacts prior to clearing. Progressive rehabilitation of disturbed areas is undertaken where practicable at all of Paladin’s exploration sites and mining operations. Paladin’s aim is to conserve biodiversity by obtaining knowledge of the ecosystems within the regions in which the Company operates, and to ensure that impacts on biodiversity are minimised and managed. Data on land use and biodiversity management aspects is being collated from LHM and KM and will be presented in the 2015 Sustainability Report. Air Emissions
Paladin has an Air Quality Standard in place with the intent to ensure that air pollutant emissions generated by any of Paladin’s activities are identified, impacts assessed and management measures established and implemented. The common air pollutants generated by Paladin activities which have the potential to impact on human health and/or the environment include; particulate matter (dust), sulphur oxides (SOX); carbon oxides (CO and CO2), and nitrogen oxides (NOx). Dust generation during exploration activities and at the mine sites is suppressed using water sprays to enable a safe working environment and to minimise impacts on the environment and surrounding communities. Fugitive dust level monitoring is conducted at both the LHM and KM sites and the results are collated in Annual Environmental Reports and submitted to the respective Governments. SOX emissions are generated at the operations by the burning of fuel for heating and power generation, and vehicle emissions. The sulphuric acid plant at KM has been mothballed whilst the site is on care and maintenance. Ambient ground level concentrations of SO2 are monitored around KM. Monitoring data are analysed and the results reported in the Annual Environmental Report submitted to the Malawi Government. The principal direct greenhouse gas emissions from Paladin’s operations are those from fuel burning for power generation, boilers, burners, emulsions for explosives and automotive exhausts. The key indirect greenhouse gas emissions relate to the energy purchased from the Namibian electricity grid to power the LHM operations. Greenhouse gas emissions data are collected from the operating sites and will be calculated as Carbon Dioxide (CO2) equivalent emissions. Paladin’s current Australian activities are confined to Paladin’s limited exploration activities and the corporate Perth office. Waste Rock Waste rock is removed to allow access to the uranium ore in the mine pit and placed in dumps. Waste rock dump location, design and placement are important to the Company in terms of environmental considerations and cost. The main objectives for the final landform of the dumps are to be stable, blend in with the surrounding landscape and be capable of supporting a self-sustaining ecosystem.
For
per
sona
l use
onl
y

45
SUSTAINABLE DEVELOPMENT (continued)
Studies have been conducted at both mine sites to determine the best locations for the waste rock dumps, taking haulage costs and environmental aspects into consideration. The design of the dumps and the placement of waste rock also considers other factors such as the physical and geochemical properties of the material placed in the dumps. Tailings Tailings and tailings storage facility (TSF) management continues to be a high priority at the LHM operational site and also at KM whilst in care and maintenance. Paladin applies measures to ensure that its TSF are appropriately designed, operated and managed according to acceptable standards. Specialist TSF engineers have designed the TSFs at both LHM and KM. The specialists have also defined the operational practice and management to ensure that the tailings and TSFs are appropriately managed and any potential environmental impacts from the tailings or the facility are minimised. Independent experts conduct peer reviews of the design, construction and operations of the TSFs on an ongoing basis. Non-Mineral Waste
Non-mineral waste includes typical general wastes, sewage and some water that may be considered hazardous. The LHM and KM operations both have waste management programmes and procedures in place with the aim of applying the principles of reduce, reuse and recycle wherever possible. At LHM, domestic solid wastes are separated into recyclable and non-recyclable. Recyclable domestic waste is collected and taken to off-site recycling depots whilst the non-recyclables are delivered to the municipal landfill sites. Facilities for the recycling of waste materials in Malawi are very limited, as are suitable off-site waste disposal locations. The majority of the waste materials generated at KM require on-site disposal so the wastes are categorised and segregated into their types and directed to appropriate on site waste disposal sites. Sewerage treatment plants are installed at both mine sites to treat sewage. Treated sewage from the plants is directed to the process water pond at LHM, and at KM to the water pond and TSF. Waste oils are collected by licensed contractors in both Namibia and Malawi and taken off-site for recycling or disposal. Environmental Incidents A standardised Paladin Incident Reporting Procedure is in place to ensure there is consistency across the business in terms of incident classification and reporting. Statistics and information on incidents occurring during the reporting period will be included in the 2015 Sustainability Report.
Closure
Mine closure planning is a key component of Paladin’s commitment to Sustainable Development. A Closure Standard is in place for all of Paladin’s developing and operational sites. The intent of the Standard is to ensure that Paladin’s sites are left in a safe and stable manner and that environmental and social impacts are minimised so that tenements can be relinquished without future liability to the Company, government or the community. During the reporting period, the LHM Draft Mine Closure Plan was being revised and updated to reflect current and future mine plans. A Closure Strategy has been prepared for KM and progress continued on the preparation of a Draft Mine Closure Plan.
For
per
sona
l use
onl
y
46
SUSTAINABLE DEVELOPMENT (continued)
CORPORATE SOCIAL RESPONSIBILITY Paladin’s purpose is to create value for its shareholders. In pursuit of this goal, the Company recognises that encompassing economic, environmental and social values are all important components of corporate success. Paladin stakeholders expect their Company to be a good corporate citizen, with fair and beneficial business practices focused on: operating to the highest ethical standards; contributing to the growth and prosperity of host countries and responding positively to community needs. Paladin’s approach to Corporate Social Responsibility (CSR) – as with its commitment to sustainability – involves:
Top-level support of the Board of Directors and Managing Director/CEO;
Adherence to principles enunciated in Corporate Policy and Procedures;
Programmes aligned with host country Millennium Development Goals;
Personnel dedicated to achieving CSR objectives;
Compliance with recognised international codes of conduct;
Acknowledgement of voluntary standards; and,
Reporting in accordance with the Global Reporting Initiative.
Paladin seeks to achieve these objectives by example, both through its own actions and by its active participation in industry and community-based organisations that foster and promote these values and aspirations. Below is a summary of the organisations in which the Company participates:
Paladin played an instrumental role in establishing the Australia-Africa Mining Industry Group (AAMIG) – an industry body that facilitates the sharing of knowledge and experience to create better outcomes on the ground. It partners with Australian and African governments to promote active engagement and promotes best practice in CSR among Australian mining companies active in Africa.
Paladin has committed to the principles contained in Enduring Value – the Australian Minerals Industry Framework for Sustainable Development. This commitment is aligned with the Ten Sustainable Development Principles of the International Council on Mining and Metals.
Paladin supports the Extractive Industries Transparency Initiative (EITI) and has registered as an EITI Supporting Company, endorsing its principles and criteria. Taxes paid by Paladin to the Malawian and Namibian governments are presented in the Company's Sustainability Report.
Paladin supports and respects a number of international guiding documents and seeks to conduct its business in accordance with the spirit and intent of them. These include the UN International Bill of Human Rights, the UN Guiding Principles on Business and Human Rights, The UN Global Compact, the ILO Declaration, the Voluntary Principles on Security and Human Rights, the OECD Guidelines for Multi-National Enterprises and the Equator Principles. These are embodied in Paladin’s governance framework.
Paladin’s CSR programmes are developed, managed and assessed in compliance with the Group’s Community Relations Policy.
Paladin contributes significantly to those economies in its countries of operation through a variety of government taxes. These are detailed below for both Malawi and Namibia, where the Group’s mines are located. It should be noted that the Kayelekera Mine in Malawi is currently on care and maintenance.
For
per
sona
l use
onl
y
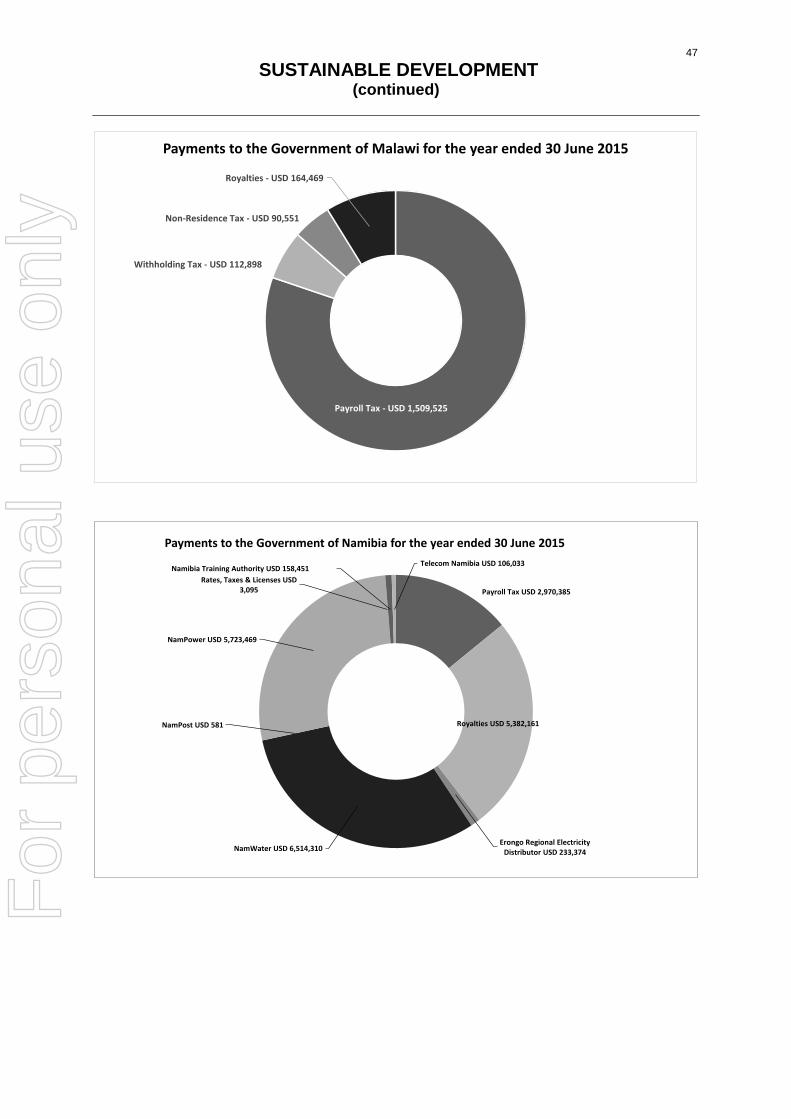
47
SUSTAINABLE DEVELOPMENT (continued)
Payroll Tax - USD 1,509,525
Withholding Tax - USD 112,898
Non-Residence Tax - USD 90,551
Royalties - USD 164,469
Payments to the Government of Malawi for the year ended 30 June 2015
Payroll Tax USD 2,970,385
Royalties USD 5,382,161
Erongo Regional Electricity Distributor USD 233,374NamWater USD 6,514,310
NamPost USD 581
NamPower USD 5,723,469
Rates, Taxes & Licenses USD 3,095
Namibia Training Authority USD 158,451Telecom Namibia USD 106,033
Payments to the Government of Namibia for the year ended 30 June 2015
For
per
sona
l use
onl
y

48
SUSTAINABLE DEVELOPMENT (continued)
Employment Insurance (Gov't of Canada) USD 28,376
Canada Pension Plan (Gov't of Canada) USD 61,574
Income Tax USD 364,656
Workers Health, Safety & Compensation Commission (Gov't of Newfoundland & Labrador) USD 12,051
Health & Post Secondary Education Tax (Gov't of Newfoundland and Labrador) USD 21,755
Payments to the Canadian Government for the year ended 30 June 2015
Shire Of Ashburton USD 37,776
Dept Of Environment & Heritage Protection USD 1,609
Department Of Natural Resources & Mines USD
8,496
Deartment Of Mines & Petroleum USD 16,160
Payroll Tax WA USD 526,174
Payroll Tax QLD USD 1,282
BAS USD 107,162
Department of TransportUSD 5,166
Payments to the Australian Government for the year ended 30 June 2015
For
per
sona
l use
onl
y

49
SUSTAINABLE DEVELOPMENT (continued)
Human Rights Paladin is committed to respecting human rights and fundamental freedoms. The Company’s overall approach to human rights issues is reflected in its Human Rights Policy, which can be found on the Paladin website. The Human Rights Policy provides the overarching framework to assist in achieving Paladin’s commitment to respect human rights throughout its business. The Board reviews this regularly to ensure that it is current and that the requirements of the Policy reflect Paladin’s commitment to human rights principles. Training on human rights is conducted across the entire Paladin Group at all levels. This also extends to key external stakeholders and suppliers with specific training tailored for the security contingents at each site. Industry Participation As a leading participant in the global uranium sector, Paladin plays an active and responsible role in public policy development, both corporately in Australia and through Group subsidiary companies in their respective constituencies. The Company is a member of the Minerals Council of Australia (MCA), which represents Australia’s exploration, mining and minerals processing industry, nationally and internationally, in its contribution to sustainable development and society. The Australian Uranium Association (AUA) has been integrated into the MCA and is now represented specifically through the Uranium Forum of the MCA. As such, Paladin is committed to abiding by and implementing the terms of the Uranium Industry Code of Practice. Along with the Code, the Group observes the Charter and Principles of Uranium Stewardship, which provide a guide to doing business ethically, responsibly and safely. Together, the Code, Charter and Stewardship Principles make up a vital standards framework for the uranium industry. Senior management across the Group at both board and committee level are actively involved in a number of industry and policy making organisations. These include the MCA, Uranium Council of Australia, Advisory Group for IAEA, AAMIG and the Chamber of Mines and Energy of Namibia. In addition, Mr Greg Walker, General Manager-International Affairs, who is resident in Malawi, is Australia’s Honorary Consul to Malawi. Mr Walker provides consular assistance as well as assisting the Australian Embassy in Harare to promote Australia’s political and commercial interests in Malawi. It is pleasing to note that a report issued in 2015 by the Danish Institute for International Studies titled “Corporate Engagement in Non-Proliferation along the Nuclear Supply Chain and Material Stewardship and Traceability in Uranium Procurement” shows Paladin as an example …”Paladin can be seen as having one of the most robust approaches to this issue among all eight leading mining companies…..; and …” sets the example on Uranium Stewardship”. LHUPL was a founding member of the Swakopmund-based Namibian Uranium Institute (NUI) in 2009. The NUI provides support and advice for industry members, operates a Uranium Information Centre, and engages with the public and scientific community through hosting training and information events, meetings and workshops. The Institute’s aim is to improve the quality of healthcare, environment management and radiation safety in Namibia. LHUPL also supports the Namibian Uranium Association (NUA), an advocacy body that represents the uranium industry exclusively. Members of the NUA work co-operatively to ensure the Namibian uranium exploration, mining and exporting industry is able to operate, expand and thrive safely and efficiently. The NUA’s Board of Directors, of which LHUPL’s Managing Director, Simon Solomons, is a member, also governs the NUI, which is an industry training and research centre. LHUPL is represented on four of its working groups – Water Quality, Sustainable Development, Radiation Safety and Swakop River Farmers.
For
per
sona
l use
onl
y
50
SUSTAINABLE DEVELOPMENT (continued)
LHM continues to provide strong support to the Namibian Chamber of Mines, which organised a major Mining Conference in May 2015 under the theme “Mining Industry - A Catalyst for Vision 2030”. This very successful conference was attended by almost 500 delegates from all over the country and from South Africa and provided an important forum for interaction between industry leaders and stakeholders. Malawi Delegation to Australia The Minister of Mines and Energy visited Paladin’s Head Office in September 2014 as part of his attendance at a mining conference. This provided a useful forum for interaction and understanding of the Paladin Group. Stakeholder Interaction Regular meetings are conducted with the stakeholder groups in countries where Paladin has interests. These interactions include regular and/or informal meetings with:
o Community groups; o Environmental groups; o Host nation government ministers and senior civil servants; o Indigenous groups; o Civil Society Organisations; and o Employees and their representative organisations.
International Initiatives Malaria Treatment for Children Paladin has continued to provide support to Suda Ltd for Suda’s development of ArTiMist™, a sub-lingual (under the tongue) spray for the treatment of severe and complicated malaria in children. Suda announced the results from a Phase III trial of ArTiMist™ in 2013, which was a comparative study against intravenous quinine. The report from the trial identified that ArTiMist™ was superior when compared to IV quinine. Approximately 95% of the patients treated with ArTiMist™ had parasite count reduced by more than 90% within 24 hours versus 40.6% of the patients treated with IV quinine. Suda is working with the Medicines for Malaria Venture and other groups to expand the opportunity for ArTiMist™ by evaluating the product as an early interventional treatment before patients are referred to hospital. Suda and its Clinical Advisory Board are finalising the design of a pivotal clinical trial of ArTiMist™ in the pre-referral setting and Suda aims to secure philanthropic funding from global organisations to support the trial. The majority of deaths from severe malaria in childhood are caused by the delayed administration of effective anti-malarial treatment. There is a relentless deterioration in the clinical condition of a young child with malaria who fails to get effective treatment, with death ensuing in a matter of hours or days. Suda believes that ArTiMist™ has the potential to be an effective pre-referral medication. It has the potential to significantly reduce child mortality and the adverse effects suffered by children, particularly within the first 24 hours of infection.
MALAWI Paladin has continued to fulfil its Social Development responsibilities in Malawi under the terms of the Kayelekera Development Agreement and Environmental Impact Assessment Social Impact Control Programme. Following on from its decision to place KM on care and maintenance last year, Paladin has maintained its community relations presence in Karonga, albeit at a reduced level of expenditure consistent with Kayelekera’s non-producing status.
For
per
sona
l use
onl
y

51
SUSTAINABLE DEVELOPMENT (continued)
Paladin has continued its ongoing community programmes focused primarily on health and education. Through its corporate CSR programmes and projects undertaken and funded by the Paladin staff charity, Friends and Employees for African Children (FEPAC), the Company social development footprint extends throughout the Karonga District, so ensuring that villages other than those in the immediate vicinity of KM benefit from its programmes. Garnet Halliday Karonga Water Supply Project The Garnet Halliday Karonga Water Project was built at a cost of more than US$10M and is the centrepiece of Paladin’s Social Development commitment to Malawi, the objective being to provide a safe and reliable water supply to the Town of Karonga. The plant is now operating as per design, providing Karonga with a safe and reliable water supply that will meet the town’s projected needs until 2025. During the year maintenance support continued to be provided. Community Liaison Engagement with the community locally is formalised through the District Executive Committee (DEC) stakeholders’ meetings, which are held monthly and are used as a community information forum and to address any stakeholder questions or concerns that arise. Weekly meetings are held with the Kayelekera village leadership and, on a more informal basis, with the Karonga District Commissioner and her staff together with traditional authorities and their advisors. Attendance at the Village Development Committee assists in communicating about current CSR projects. The Company engages individually with NGOs in the region and is in regular contact with the District Education Manager, the District Health Administrator and the District Ministry of Water and Irrigation. These forums ensure open communication between local stakeholders and the Company, particularly with the local CSR team on the ground and operating in the community on a daily basis. KM also supports the Karonga Youth Entrepreneurs by providing them with all the shredded office paper from site as material to assist in their cooking fuel project. Community Education and HIV/AIDS Awareness Paladin continues its commitment in relation to HIV/AIDS awareness campaigns and to promote good health and hygiene in order to improve the quality of life of local communities. This effort includes its ongoing, very successful “education-through-storybooks” project, with publication of another seven books during the year. These covered the topics of bribery in the workplace, Christmas, dangers of loans and debt, alcohol, obesity, dangerous situations and communication. The collection now comprises 36 titles, covering a variety of community-focused subjects, and has been translated into a number of local languages. They continue to be a very effective communications medium and remain extremely popular, given the general lack of reading material in the district, particularly in local languages. A further 3,226 books were distributed broadly through to the community during the year, covering KM employees and local schools and communities and government agencies, bringing the total number distributed to-date to over 157,000.
HIV/AIDS awareness programmes continued through the medium of the Nyange Nyange drama group and distribution of related story books. Books are rare and precious in the region. It is not uncommon in rural areas for school children to be the only family members who are literate. As a result, local language books distributed by Paladin are frequently taken home and read to other family members, thus becoming a very effective means of communicating with the community at large. In an effort to make learning fun and to increase awareness of potentially damaging lifestyle issues, the storybooks are distributed to employees and then followed by a quiz with small prizes awarded. This has become very popular amongst the local population.
For
per
sona
l use
onl
y

52
SUSTAINABLE DEVELOPMENT (continued)
Paladin continues to support the local Nyange Nyange drama group, which uses theatre in an effective and popular way to communicate key social messaging across the community. Through Paladin’s support, Nyange Nyange has used the funds earned by performing in schools for Paladin to produce several DVDs on HIV prevention. These have been purchased by Paladin for distribution as quiz prizes providing a very effective and popular medium for the message. Community Health Care Paladin continued its support of local health clinics by providing transport for government medical staff in the region, alleviating the need for local villagers to travel long distances, and facilitating an under-fives clinic. Paladin’s Community Relations team, both being health professionals, provided support services, including a large number of health talks at rural schools reaching over 4,500 children; hosting international researchers and other NGO staff; liaising with the District Health Office on local programmes; and, assisting with audiology clinics at the School for the Deaf and Karonga District Hospital. In relation to Paladin’s commitment to construction of a local clinic, the assigned land has been cleared and graded. The building design and budget has been agreed with the village leadership and construction is scheduled to commence in early FY2016 with Paladin’s funding commitment. Paladin also runs a mosquito control programme in Kayelekera Village and at Karonga Airport, in addition to the mine and accommodation areas, as a very effective malaria-control mechanism. Educational Support Paladin’s Community Relations team continues to assist in the maintenance of local schools and teacher housing, assistance with teacher wages and provision of a variety of educational supplies. The local primary school was fully renovated during the long school holiday with maintenance also undertaken on the secondary school. Schools in the area are regularly visited to present interactive lessons on health issues with small tokens relevant to the lesson given to the children such as soap or colouring projects to assist with their learning. Paladin continued its practice of delivering a Christmas gift to over 2000 school students in the area, providing school supplies, an individual personal item and snacks. This included cloth shoulder bags made by graduates of the FEPAC sponsored tailoring classes thereby extending the benefit. An annual donation from a Paladin board member pays for the school fees for 105 girls who would otherwise not be able to finish their education to a secondary level. Consular Service Paladin continues to promote positive bilateral relations between Australia and Malawi by providing Consular services for the Department of Foreign Affairs and Trade (DFAT) in Malawi. The Company’s office in Lilongwe is the designated Australian Consulate, augmenting services provided by the nearest Australian diplomatic mission located in Harare, Zimbabwe. The Consulate provides consular support for Australian expatriates and visitors in Malawi and Malawians wishing to visit or study in Australia. PAL’s resident director in Malawi, Mr Greg Walker serves as Australia’s Honorary Consul to Malawi. NAMIBIA In line with Paladin Energy’s policies and procedures, LHUPL continues to play a significant role in improving the living conditions of the people of the Erongo region. Its focus is on education, sports and youth development, feeding programmes and environmental projects.
For
per
sona
l use
onl
y

53
SUSTAINABLE DEVELOPMENT (continued)
Education Mondesa Youth Opportunities (MYO) A five year agreement reached between LHUPL and MYO in April 2015 will ensure the long term sustainability of the centre. A donation of N$1.2M was made during the year towards the annual running costs of the centre and LHUPL has been the major supporter since 2010. The non-profit organisation was established in 2003 as an after-school programme for youth from the Mondesa and DRC Township. The centre offers these underprivileged yet academically able performers with after school classes in mathematics, English, music and computer skills. Redundant computer equipment was also donated to the centre. 10th National Mathematics Congress LHUPL sponsored the 10th National Mathematics Congress held in April 2015. The three day meeting, attended by close to 300 mathematics teachers from across the country, discussed factors hampering the teaching of mathematics in Namibia. LHUPL has been the main sponsor of the Annual National Mathematics Congress since 2009. School Support Projects
Text Book Donations The Coastal High and Swakopmund Secondary Schools became the beneficiaries of LHUPL’s 4th textbook donation initiative. The donation was made on the recommendation of the Ministry of Education as these schools took in the bulk of grade eight learners in 2015. Mathematics Enrichment Programme LHUPL has been supporting this programme for the past four years, focused on the development of secondary school learners who have the potential to excel in more advanced levels of mathematics than that offered at schools. The programme benefits on average 200 learners annually through several activities such as after-school learning, spring schools, mathematics competitions and others. In the past academic year, all learners on this programme achieved above average to average results, whilst no learners achieved below average marks or were ungraded. Laptop Donation to Polytechnic of Namibia Students LHUPL sponsored laptops to Environmental Health Sciences Programme students at the Polytechnic of Namibia.to assist in their studies. Book Vouchers In the past year book vouchers have been donated to three government schools from the Erongo Region. These awards, aimed at grade or specific best in school performers, encourage learners to work hard during their school careers and achieve high marks. This programme has been supported for the past six years.
Environment Gobabeb Training and Research Internship Programme (GRTIP) LHUPL and the Gobabeb Research and Training Centre signed a five year agreement in December 2014 to assist the centre in running its Internship programme aimed at training 20 Namibian students studying towards becoming environmental scientists. The GRTIP is a five-month field course presented to students who are tasked with designing and implementing original, independent research projects focused on management and restoration of degraded ecosystems.
For
per
sona
l use
onl
y
54
SUSTAINABLE DEVELOPMENT (continued)
Renovation of the Park Ranger’s Station House In 2014, LHUPL made a commitment to renovate the Ministry of Environment and Tourism’s Park Ranger’s Station House located in the Namib Naukluft Park, approximately 80km from the Langer Heinrich Mine. The house will be utilised by the park rangers who monitor park activities within the national park. Community Blue Waters Sports Club Sponsorship of the Blue Waters Sports Club’s youth development programme continued. As principal sponsor, LHUPL provides equipment, transport and financial backing to ensure a continued flow of young sports stars are developed through the youth development structures of both the cricket and football teams. 4th Annual Charity Golf Tournament The Langer Heinrich Uranium 4th Annual Charity Golf Tournament took place at the Rossmund Golf Course in March 2015, and raised N$150,000 which was divided between three children-centred organisations from Swakopmund. The Swakopmund Football Club, the Namibian Association for Children with Disabilities and the House of Safety each received N$50 000. Annual Career Awareness Day Held in June 2015, the one day event was a success with 230 Grade 10 learners from various Swakopmund schools attending. The event, in its second year, is aimed at exposing the learners to a variety of career fields within LHUPL. Departmental presentations pointing out the qualifications/skills needed for certain careers were given to around 230 Grade 10 students to help motivate them to work hard toward a goal or career they are passionate about. LHUPL also hosted a stand at the annual Mining Expo in Windhoek and participated in the mining conference hosted by the Chamber of Mines during the same period. Food Assistance Programme Support continued during the year for 2 feeding organisations, Promiseland Trust and Eagle Christian Centre which cater for disadvantaged children in Walvis Bay and Swakopmund.
Australian Initiatives In 2011, Paladin made a five-year financial commitment to the Hammond-Nisbet Geoscience Fund administered by the University of Western Australia (UWA). The fund supports the creation of an endowed professorship within UWA’s Centre for Exploration Targeting (CET). This research-intensive position focusses on mentoring new generations of geoscientists in interpretation of fieldwork and structural geophysics and in applying this understanding to mineral systems and exploration targeting. Paladin also continued its involvement with the ASX Thomson Reuters Charity Foundation. Along with other companies listed on the S&P ASX 200 Index, Paladin contributed to the creation of a share portfolio which was auctioned off at a major charity fundraiser organised by the Foundation. Proceeds from the fundraiser go to a set of pre-determined charities, the main focus being on medical research for children.
For
per
sona
l use
onl
y
55
SUSTAINABLE DEVELOPMENT (continued)
CANADA Aurora continues to maintain an active presence in the Labrador communities. Donations focus on education and training, aboriginal cultural initiatives, youth and sport. During the year, Aurora contributed to 21 community events and initiatives. Community activities have included public meetings to inform residents of Aurora’s activities and to seek their feedback. Regular contact with Provincial and Nunatsiavut government officials has been maintained and Aurora continues to enjoy good support from the governments and local residents. Aurora’s contribution to the economic well-being of Labrador continues through extensive use of local contractors for camp support and by hiring up to 25 local staff per field season, a practice that has been widely appreciated by Nunatsiavut officials and residents.
Employee Charitable Foundation, supported by Paladin
Friends and Employees of Paladin for African Children (FEPAC) is a charitable foundation established in 2008 by Paladin employees to fund social projects that are outside the scope of the Company’s CSR programmes. Paladin supports the involvement of its employees in FEPAC and donates 25c for every A$1 raised and also provides administrative support. To date, FEPAC has raised A$809,972 through employee donations, golf days and quiz nights.
The charity supports six projects in Malawi that assist orphaned children with educational needs and vocational training courses. These include two projects that support kindergarten aged children where they receive porridge for breakfast, which for many may be their only meal of the day, and age appropriate lessons.
Two vocational training projects are also supported where courses such as brick laying, carpentry and tailoring are provided. Currently, 158 teenagers have completed these courses and have been given the tools of their trade to enable them to earn money to support their younger siblings. On completion of the courses, the students also complete a five-day, small business training course to teach them the basic fundamentals for setting up their own small businesses.
FEPAC also supports a school for the visually impaired and a school for deaf children. Over the years FEPAC has helped fund the construction of classrooms, dormitories and teacher’s houses for these schools as well as assisting with their monthly running costs.
During the year FEPAC funded the construction of four classrooms in the Chiteka village in a remote part of Kayelekera where no schooling infrastructure previously existed. This was a very successful project in collaboration with the local community despite extremely difficult access conditions. There were numerous small projects funded by FEPAC during the year such as providing stationery, books, furniture and school uniforms to local schools. FEPAC employs former carpentry and tailoring students to make the furniture and school uniforms and many of the former students use the profits from this work to help establish their own businesses. The 4th annual Charity Golf Day was held in Namibia, organised by local employees. The event was an outstanding success, raising N$150,000. The funds were divided between three organisations focussed on children – the Swakopmund Football Club, Namibian Association for Children with Disabilities and the House of Safety. OUR PEOPLE The Company has spent the past year focussing on stabilising and retaining its workforce throughout all projects. Following on from the previous period, consolidation and rationalisation of organisational structures have been ongoing and contributed to the decrease in total employee numbers seen across the Group.
For
per
sona
l use
onl
y

56
SUSTAINABLE DEVELOPMENT (continued)
A Group-wide analysis of HR policies and procedures was undertaken with the intention of ensuring an appropriate suite in place at each location with an effort made to standardise processes where possible with collaboration across sites. A focus on identifying and tracking employee metrics saw the introduction of a Group-wide data collection process allowing the tracking of numerous employee aspects such as turnover, retention, training and development, recruitment, workforce demographics and employee relations consistently across the Group.
Turnover for the Group is detailed in the following table.
Location Total at
Year-end
Female % Local
Nationals %
Turnover
%*
Australia
- Corporate, administration, financial & marketing
27 51.85% n/a 10.81%
- Technical Services 9 33.33% n/a 53.57%**
- Exploration 10 20.00% n/a 9.60%
Namibia - LHM 344 17.44% 94.47% 19.53%
Malawi
- KM 215 9.30% 88.37% 20.19%
- Exploration 2 0% 100% 101.12%***
Canada - Exploration 11 27.27% 72.72% 8.89%
Total 618 16.50%
* Employee turnover is based on a 12 month rolling average. ** High turnover seen due to internal transfers within Group. *** Due to exploration retrenchments at 30 June.
Diversity overall, and gender diversity specifically, remains a focus and, despite the overall headcount decreasing over the period, the percentage of female representation within the workforce has remained reasonably steady. Supporting a diverse workforce remains one of the cornerstones of Paladin’s strategy with a commitment to equitable gender representation amongst its workforce, balanced with availability of appropriate candidates in the region of operation. Further information on diversity can be found in the Corporate Governance Statement available on Paladin’s website. Australia (Head Office & Mount Isa) The Perth head office currently has 46 employees, a reduction from 52 at the same time last year. Females within the head office represent 41.3% of employees and 47.3% of all females employed hold roles within the professional, managerial or senior management categories. During the period, the 12 month rolling total turnover was 24.27% in comparison to 30.43% at the same time last year. In light of the continued focus on consolidating the organisational structure two roles were made redundant and an additional two roles were restructured to part time. In instances of natural attrition only those roles that were deemed essential were replaced, resulting in a reduction of a further seven roles. In line with the continued focus on rationalising costs, only a small number of salary increases were awarded for the period and only in instances where there were significant market parity discrepancies. For the second consecutive year the senior management team maintained a 10% salary reduction. As part of a senior management review all executive managers undertook a 360 degree performance evaluation in an effort to reinforce both a culture of continuous improvement and provide an element to measure performance within the leadership team. This process will be cascaded to the next level of senior management and to some key technical roles across the Group within the upcoming year. The year ahead will see a continued focus on retaining key skills in an environment of cost rationalisation. In addition, a review of succession plans that are currently in place for key roles will be undertaken ensuring a robust strategy to address concerns should they arise.
For
per
sona
l use
onl
y
57
SUSTAINABLE DEVELOPMENT (continued)
Exploration Group-wide the exploration team totals 23 spread across projects based in Australia, Malawi and Canada. Paladin places a large focus on the development of its geoscience capabilities and has the benefit of exposing its professionals to a number of different geological terrains and environments within the global project portfolio. Additionally, a number of senior technical individuals within the Group are consistently invited to present papers at industry conferences, providing yet another opportunity to transfer expert knowledge amongst the Group and aid in the development of junior professionals. The Perth based exploration team is a small group predominantly comprised of senior technical roles focussed on providing support and guidance across the Group. This small group consistently has minimal turnover and currently has an average tenure of 8.8 years of service within the team. Unfortunately, as a result of the Malawian government not renewing Paladin’s exploration licences, at the end of June 2015 14 employees within the Kayelekera exploration team were retrenched resulting in only two members of the original team being retained. Those individuals retrenched all received generous severance packages in recognition of their service with the Company. The Aurora exploration team based in Canada have again had low turnover for the period with only one individual leaving. The Aurora team have been together now for a number of years with the average tenure growing to 6.7 years. In addition to the permanent team the project employs approximately 30 seasonal staff for each field season. Of these individuals currently 80% are employed from the surrounding communities of Postville, Makkovik and Rigolet and 73% of the seasonal staff has consistently been re-employed for the past three field seasons. Malawi (Kayelekera Mine) With KM now on C&M, the focus has been on adapting the workforce and operations to this significant change. As the operation has moved into a more settled state within C&M, the organisational structure was again reviewed resulting in further decreases to both the national and expatriate employee numbers throughout the year. At year end there were 192 national employees, of which 95 are within the site security team, and an additional 24 expatriates. Turnover has slowly started to steady with the rolling 12 month total turnover for national employees sitting at 15.42%, and the expectation that this will reduce further. The focus at KM will remain one of consolidation whereby all HR processes, procedures and policies are under review to ensure a solid foundation for restart. This process will also include a training element to ensure that all new processes and procedures are understood by the senior leadership team and cascaded throughout the workforce. A relationship with the Miracle Technical School in Karonga has proved beneficial whereby hospitality students are rotated for practical experience through the site services department to gain hands-on experience in areas of cooking, cleaning and general service. In turn, KM has access to high performing and experienced individuals after they graduate, should a vacancy arise. Although cost reduction is a priority, a conscious effort has been made to ensure that the opportunity to develop high performing employees has been retained via ongoing study assistance programmes. A number of employees are currently undergoing further education relevant to their roles, with KM both paying the fees and providing paid leave for study and examination purposes. Additionally, mentoring and one-on-one career development remains a focus and KPI for the leadership team. Cross-development opportunities are also made available where possible in order to provide exposure to other operations within the Paladin portfolio for key roles and individuals. Namibia (Langer Heinrich Mine) In response to Swakop Uranium’s ongoing and aggressive recruitment campaign for its Husab Mine, LHM has struggled with the retention of skilled roles resulting in a 12 month rolling total turnover of 19.53%. Hardest hit has been the processing department with the highest level of employee turnover.
For
per
sona
l use
onl
y

58
SUSTAINABLE DEVELOPMENT (continued)
With such a large number of experienced operators departing, and the availability of replacements within the local area limited, a number of operators who previously worked at KM have been recruited into Namibia. This strategy has provided the benefit of recruiting individuals who are familiar with Paladin’s operations, whilst providing employment to individuals who Paladin had to unfortunately retrench when the mine went onto C&M in February 2014. With further turnover likely to be experienced when Husab moves to the engineering phase of its recruitment campaign, LHU has renewed its focus on training and development programmes. Currently the internal training modules are being updated and a competency based training programme implemented to allow recruitment of individuals with less experience. This strategy allows for a sustainable solution to the shortage of skilled labour currently being experienced. The Namibian government has recently introduced a Vocational Educational & Training Levy which is set at 1% of a company’s total annual payroll. In the past 12 months LHU has invested N$3.8M into the training and development of its employees, representing 2.3% of total annual payroll. As in previous years LHU places a focus on attracting graduates and trainees allowing development of a pipeline of future skilled individuals and potential leaders. To enable this, LHU offers a number of bursary opportunities within the year, both internal and external, allowing for formal training and education opportunities to be coupled with internal development and mentoring. There are currently 12 graduates within the disciplines of engineering, metallurgy, supply chain, human resources, finance, corporate relations and radiation management, and LHU places a large focus on transitioning those graduates into permanent roles within the organisation which has been consistently successful. LHU’s long standing relationship with the Namibian Institute of Mining Technology creates an opportunity to provide the hands-on training components of the skilled trade and, in turn, LHU has access to a number of skilled artisans upon completion of their studies. With the current shortage of local artisans, this relationship will play a significant and ongoing role in the ability to attract skilled individuals. During the year the relationship between the Mineworkers Union of Namibia (MUN) and LHU has been positive with both parties agreeing in principle to the Recognition and Procedural Agreement (RPA), which has been in development for a number of years, and it is anticipated that in the coming months the final agreement will be signed. The RPA details the partnership between LHU and MUN and sets out the standards by which the two parties will deal with all relevant matters pertaining to employee concerns. Additionally, both parties have recently agreed to a three year Remuneration Agreement, which sets out the bargaining unit’s annual salary increases for the next three year period, allowing employees the assurance of clear expectations in this area. During the year LHU undertook a job-grading project to align all roles into the Patterson Grading System. This was a lengthy process, yet the benefits it has provided have been numerous. With a solid basis for comparison now in place, a remuneration review of all roles measured against peers within the Namibian mining industry was undertaken, allowing LHU to ensure that competitive remuneration packages are offered. In addition, a Senior Employee Retention Scheme has been introduced with benefits awarded based on the performance of both the individual and the Company, coupled with a long-term retention hook, to assist in retention of key individuals and top performers. LHU is compliant with all requirements of the Affirmative Action Act and has a consultative forum which is an integral part of its affirmative action strategy. Furthermore, it is committed to, and fully supports, the policy of equal opportunity employment and non-discrimination through its measurable Affirmative Action Plan. The LHU Affirmative Action Report reflects the following demographics based on the calendar year reporting cycle:
CY2013 CY2014
% Female Employees 21.2% 18.7%
% Historically Racially Disadvantaged Employees* 89.5% 89.3%
% Non Namibians 1.7% 1.7%
Total Employees 402 363
* As defined in the Affirmative Action (Employment) Act 1998
For
per
sona
l use
onl
y

59
SUSTAINABLE DEVELOPMENT (continued)
LHU places significant importance on employee health and wellness and collaborates with external health organisations (e.g. The Cancer Association of Namibia and Namibian Blood Transfusion Service), who provide employee wellness screenings and counselling events on site. Membership to private health insurance is a condition of employment at LHU and the Medical Aid providers counsel employees on healthy lifestyle choices and in identifying the risks associated with unhealthy practices resulting in issues such as high blood pressure, elevated cholesterol, HIV and other themes common to Namibia. The year ahead will see a continued focus on the internal training and development in response to the current tight labour market, coupled with retention measures to attempt to stabilise the turnover rate.
For
per
sona
l use
onl
y
60
CORPORATE GOVERNANCE STATEMENT
CORPORATE GOVERNANCE FRAMEWORK
The Board of Directors of Paladin Energy Ltd is responsible for the corporate governance of the Group. Paladin has adopted systems of control and accountability as the basis for the administration of corporate governance. This Corporate Governance Statement, dated 30 June 2015 and approved by the Board on 20 August 2015, outlines the key principles and practices of the Company which, taken as a whole, represents the system of governance. Shareholders are reminded that Paladin operates with a dual-listing in Australia on the ASX and in Canada on the Toronto Stock Exchange (TSX). In formulating the governance framework, the regulatory requirements in both Australia and Canada have been taken into account. The ASX Listing Rules require the Company to report on the extent to which it has followed the Corporate Governance Recommendations contained in the ASX Corporate Governance Council’s (ASX CGC) 3rd Edition of its Corporate Governance Principles and Recommendations. For FY2015, Paladin has complied with all the recommendations and has referenced these throughout this Corporate Governance Statement. Further, the Company also complies with the Ontario Securities Commission’s corporate governance requirements as set out in National Instrument 58-101. Paladin’s Corporate Governance Statement can be found in the Corporate Governance section of the Investor Centre on its website at www.paladinenergy.com.au, along with the ASX Appendix 4G, a checklist cross-referencing the ASX Principles and Recommendations to disclosures in this statement, the current Annual Report and the Company website. The Corporate Governance Statement, together with the 4G, have been lodged with the ASX on 27 August 2015. The Company reviews and amends its corporate governance policies as appropriate to reflect the growth of the Company, current legislation and good practice. Copies or summaries of key corporate governance policy documents can be found on the Company’s website (www.paladinenergy.com.au).
For
per
sona
l use
onl
y
61
DIRECTORS' REPORT ____________________________________________________________________________________
The Directors present their report on the Group consisting of Paladin Energy Ltd (Company) and the entities (Group) it controlled at the end of, or during, the year ended 30 June 2015. DIRECTORS The following persons were Directors of Paladin Energy Ltd and were in office for this entire period unless otherwise stated: Mr Rick Wayne Crabb B. Juris (Hons), LLB, MBA, FAICD (Non-executive Chairman) Age 58
Mr Crabb holds degrees of Bachelor of Jurisprudence (Honours), Bachelor of Laws and Master of
Business Administration from the University of Western Australia. He practised as a solicitor from 1980 to
2004 specialising in mining, corporate and commercial law and advised in relation to numerous project
developments in Australia and Africa. Mr Crabb now focuses on his public company directorships and
investments. He has been involved as a director and strategic shareholder in a number of successful
public companies. He is also the non-executive chairman of Platypus Minerals Ltd (formerly Ashburton
Minerals Ltd) (since 1999), Golden Rim Resources Ltd (since 2001) and Otto Energy Ltd (since 2004). Mr
Crabb is a councillor on the Western Australian Division of the Australian Institute of Company Directors.
Mr Crabb was appointed to the Paladin Board on 8 February 1994 and as Chairman on 27 March 2003.
Special Responsibilities Chairman of the Board Member of Remuneration Committee from 1 June 2005 Member of Nomination Committee from 1 June 2005 Member of Sustainability Committee from 25 November 2010
Mr John Borshoff B.Sc., F.AusIMM, FAICD (resigned 10 August 2015) (Managing Director/Chief Executive Officer) Age 70
Mr Borshoff is a geologist who has been involved in the Australian and African exploration and mining
industry for over 30 years. Mr Borshoff worked for International Nickel and Canadian Superior Mining
before joining a German mining group, Uranerz from 1976 to 1991. He became Chief
Geologist/Exploration Manager during the period 1981-1986 and served as its chief executive from 1987
to mid-1991, when the German parent of Uranerz made the decision to close its Australian operations.
The primary focus of the Uranerz Group was the search for and development of uranium with the
company operating extensively throughout Australia, North America and Africa.
Mr Borshoff has extensive knowledge of the uranium industry and experience in company management
and strategic planning. He serves on the Board of the Minerals Council of Australia.
Mr Borshoff founded Paladin and was appointed to the Paladin Board on 24 September 1993. Special Responsibilities Managing Director/Chief Executive Officer Member of Nomination Committee from 1 June 2005 Member of Sustainability Committee from 25 November 2010 Mr Sean Reveille Llewelyn LL.B, MAICD (resigned 21 August 2015) (Non-executive Director) Age 67
Mr Llewelyn originally qualified, and practised, as a solicitor in Australia and then re-qualified in England.
He has subsequently worked in the finance and merchant banking industries for more than 20 years in
Australia, the UK, the United States and South Africa. His considerable finance experience has been in
derivatives (a founder, President and CEO of Capital Market Technology Inc.), structured finance and
early stage investment relating to the metal markets. He has been involved with the uranium industry for
many years and has a comprehensive understanding of the uranium market.
Mr Llewelyn was the instigator and driving a force in the formation of Nufcor International Ltd, a major
uranium marketing company, initially jointly owned between Anglo Gold and First Rand International.
Mr Llewelyn was appointed to the Paladin Board on 12 April 2005.
For
per
sona
l use
onl
y

62
DIRECTORS' REPORT (continued)
____________________________________________________________________________________
Special Responsibilities Member of Audit Committee from 12 April 2005 Chairman of Remuneration Committee from 26 November 2008 (member from 1 June 2005) Chairman of Nomination Committee from 26 November 2008 (member from 1 June 2005) Mr Donald Shumka B.A., MBA (Non-executive Director) Age 73
Mr Shumka is a Vancouver-based Corporate Director with more than 40 years’ experience in financial
roles. From 2004 to 2011, he was President and Managing Director of Walden Management, a
consulting firm specialising in natural resources. From 1989 to 2004, he was Managing Director,
Investment Banking with CIBC World Markets and Raymond James Ltd. Prior to 1989, Mr Shumka was
Vice President, Finance and Chief Financial Officer of West Fraser Timber Co. Ltd., one of Canada’s
largest forest products companies. He holds a Bachelor of Arts Degree in Economics from the University
of British Columbia and a Master of Business Administration Degree from Harvard University. Mr Shumka
is also a director of Eldorado Gold Corp. (since May 2005), Alterra Energy Corp. (since March 2008) and
Odin Mining and Exploration Ltd (since July 2014).
Mr Shumka was appointed to the Paladin Board on 9 July 2007. Special Responsibilities Chairman of Audit Committee from 9 July 2007 Member of Remuneration Committee from 10 August 2007 Member of Nomination Committee from 9 July 2007
Mr Peter Mark Donkin BEc, LLB., F Fin, MAICD
(Non-executive Director) Age 58
Mr Donkin has over 30 years’ experience in finance, including 20 years arranging finance in the mining
sector. He was previously the Managing Director of the Mining Finance Division of Société Générale in
Australia, having worked for that bank for 21 years in both their Sydney and London offices. Prior to that,
he was with the corporate and international banking division of the Royal Bank of Canada. His
experience has involved arranging transactions for mining companies, both in Australia and
internationally, in a wide variety of financial products, including project finance, corporate finance,
acquisition finance, export finance and early stage investment capital. Mr Donkin holds a Bachelor of
Economics degree and a Bachelor of Law degree from the University of Sydney. He is a director of
Allegiance Coal Ltd (since 2010) and was previously a director of Sphere Minerals Ltd (from March 2010
to November 2010) and Carbine Tungsten Ltd (from February to April 2013).
Mr Donkin was appointed to the Paladin Board on 1 July 2010.
Special Responsibilities
Member of Audit Committee from 25 November 2010 Member of Nomination Committee from 1 July 2010
Mr Philip Baily BSc, MSc
(Non-executive Director) Age 71
Mr Baily is a metallurgist with more than 40 years’ experience in the mining industry, including some 11
years in the uranium sector. Throughout his career, he has been involved in the design, construction,
commissioning and operation of mineral processing plants, including two uranium plants. Project
locations have varied from the deserts of Australia to the tropics of Papua New Guinea and the high
altitudes of Argentina. He has extensive experience, at senior management level, in the evaluation of
projects from grass roots development to the acquisition of advanced projects and operating companies.
These projects have been located throughout the world, many in developing countries and
environmentally sensitive areas. Mr Baily holds a Bachelor of Science and a Master of Science degree in
Metallurgy from the University of NSW.
Mr Baily was appointed to the Paladin Board on 1 October 2010.
Special Responsibilities Chairman of Sustainability Committee from 25 November 2010 Member of Nomination Committee from 1 October 2010
For
per
sona
l use
onl
y

63
DIRECTORS' REPORT (continued)
____________________________________________________________________________________
Mr Wendong Zhang
(Non-executive Director) Age 45
Mr Zhang has over 23 years’ experience in financial services and international capital markets and was among the first generation Chinese bankers on Wall Street working with Morgan Stanley, UBS and Citi across New York, Hong Kong and Beijing. He also co-founded two boutique investment advisory firms focusing on China opportunities. He has completed a number of advisory, financing and investment transactions and established relationships with leading players in various sectors including conventional energy, nuclear utilities and natural resources. Mr Zhang graduated from Dartmouth College, New Hampshire USA, in 1991 with a B.A. in Engineering and Economics.
Mr Zhang was appointed to the Paladin Board on 25 November 2014.
Special Responsibilities Member of Remuneration Committee from 12 February 2015
COMPANY SECRETARY AND EXECUTIVE GENERAL MANAGER - CORPORATE SERVICES
Ms Gillian Swaby Age 55 (resigned 21 August 2015) B.Bus, FCIS, FAICD
Ms Swaby has been involved in financial and corporate administration for listed companies, as both Director and Company Secretary, covering a broad range of industry sectors, for over 30 years. Ms Swaby has extensive experience in the area of secretarial practice, corporate governance, management accounting and corporate and financial management. In addition to her role as Group Company Secretary, the divisions of human resources, legal and corporate social responsibility also fall under her management in the role of EGM-Corporate Services.
Ms Swaby is past Chair of the Western Australian Council of Chartered Secretaries of Australia, a former Director on their National Board and a lecturer for the Securities Institute of Australia. Ms Swaby is the principal of a corporate consulting company and was a member of the Paladin Board for a period of 10 years. She is a director of Australia-Africa Mining Industry Group (AAMIG).
BOARD AND COMMITTEE MEETINGS
The number of Directors’ meetings and meetings of committees held in the period each Director held office during the financial year, and the number of meetings attended by each Director were: Board of
Directors
Audit Committee
Remuneration Committee
Nomination Committee
Sustainability Committee
Name
Number attended
Number eligible
to attend
Number attended
Number eligible
to attend
Number attended
Number eligible
to attend
Number attended
Number eligible
to attend
Number attended
Number eligible
to attend Mr Rick Crabb 13 13 - - 4 4 2 2 3 3 Mr John Borshoff 13 13 - - - - 2 2 3 3 Mr Sean Llewelyn 13 13 5 5 4 4 2 2 - - Mr Donald Shumka 13 13 5 5 4 4 2 2 - - Mr Peter Donkin 13 13 5 5 - - 2 2 - - Mr Philip Baily 13 13 - - - - 2 2 3 3 Mr Wendong Zhang 7 7 - - 2 2 2 2 3 3
Of the above Board meetings, 4 were face to face with the remainder held via electronic means. The Board meeting schedule also includes a scheduled conference call mid quarter between the face to face meetings. INTERESTS IN THE SECURITIES OF THE COMPANY As at the date of this report, the interests of the Directors in the securities of Paladin Energy Ltd were:
Director Paladin Shares Share rights (issued under
the Paladin Employee Plan)
Mr Rick Crabb 5,981,528 Nil
Mr Donald Shumka 200,000 Nil
Mr Peter Donkin 22,500 Nil
Mr Philip Baily
Mr Wendong Zhang
18,000
1,180,000
Nil
Nil
For
per
sona
l use
onl
y

64
DIRECTORS' REPORT (continued)
____________________________________________________________________________________
RESIGNATION, ELECTION AND CONTINUATION IN OFFICE OF DIRECTORS
In accordance with the Constitution of the Company, Mr Donald Shumka and Mr Peter Donkin will seek re-election at the 2015 Annual General Meeting, following their retirement by rotation. Mr Wendong Zhang was appointed as a Non-executive Director by the Board effective 25 November 2014. Mr Zhang will seek election by shareholders at the 2015 Annual General Meeting. PRINCIPAL ACTIVITY The principal activity of the Group was the development and operation of uranium mines in Africa, together with global exploration and evaluation activities in Africa, Australia and Canada. REVIEW AND RESULTS OF OPERATIONS A detailed operational and financial review of the Group is set out on pages 11 to 41 of this report under the section entitled Management Discussion and Analysis. The Group’s loss after tax for the year is US$267.8M (2014: US$338.4M) representing a decrease of 21% from the previous year. DIVIDENDS No dividend has been paid during the financial year and no dividend is recommended for the current year. SIGNIFICANT CHANGES IN THE STATE OF AFFAIRS There were no significant changes in the state of affairs of the Group during the financial year not otherwise dealt with in this report. SIGNIFICANT EVENTS AFTER THE BALANCE DATE Other than disclosed below, since the end of the year, the Directors are not aware of any other matter or circumstance not otherwise dealt with in this report, that has significantly or may significantly affect the operations of the Group, the results of those operations or the state of affairs of the Group in subsequent years with the exception of the following, the financial effects of which have not been provided for in the 30 June 2015 Financial Report: Material Reduction in Costs On 30 July 2015, the Company advised of a material reduction in its cash flow break-even level through a sustainable reduction in its all-in cash costs (including capital expenditure, corporate costs and debt servicing). These measures will reduce Paladin’s total cash costs by more than US$33M compared to FY2015. Subsequent to the US$33M in cost reductions announced on 30 July 2015, Paladin has identified further significant cash flow optimisation initiatives. Such initiatives include:
LHM operating initiatives – As a consequence of the BRP, barren solution used for wash in the counter current decantation section of the LHM plant is expected to reduce from approximately 50ppm U3O8 to less than 10ppm. This will result in a significant improvement in wash efficiency. The Company’s original FY2016 outlook assumed wash efficiency of 93.1%. Paladin now anticipates a wash efficiency in the range of 95% to 98% for FY2016. The Company has also revised its FY2016 life of mine plan for LHM resulting in an average head-grade of 694ppm U3O8, i.e., an increase of 11ppm over the guidance provided in the last Quarterly Activities Report announced on 16 July 2015.
Corporate costs, exploration and KM initiatives – Paladin has implemented reductions in these areas to further reduce annualised cash expenditure by approximately US$8M over the initiatives set out in the cost reduction announcement of 30 July 2015 (i.e., a cumulative US$14M less than FY2015). The additional initiatives include a reduction in approximately 50% of corporate staff that was undertaken on 21 August 2015 concurrent with the reduction in the number of directors and reduction in board fees announced the same day. Exploration has been put on care and maintenance whereby the Company will undertake the work required to meet minimum license expenditures only.
For
per
sona
l use
onl
y

65
DIRECTORS' REPORT (continued)
____________________________________________________________________________________
Change of Chief Executive Officer
On 30 July 2015, the Company advised that its Board and Managing Director and CEO Mr John Borshoff had agreed that Mr Borshoff would step down from his role with the Company. A process to identify a suitable new CEO is now underway. In the interim, Mr Alexander Molyneux has been appointed Interim CEO. Mr Molyneux joins with substantial experience in natural resources executive leadership, including both public mining company CEO and uranium experience. Mr Molyneux’s core mandate will be to: (i) to continue the optimisation of Paladin’s overall cash flow break-even level with the aim to become cash flow generative in the current uranium price environment; (ii) focus on accelerating strategic initiatives that deliver value; and (iii) to assist the Board in its search for a permanent CEO. Board and Management Restructuring On 21 August 2015, the Company advised of board and management changes, and a reduction in board remuneration. Paladin’s board accepted the resignation of Non-Executive Director Mr Sean Llewelyn. Ms Gillian Swaby, Group Company Secretary and EGM Corporate Services, and the Company agreed Ms Swaby would step down from her role at the Company. Mr Ranko Matic was appointed Company Secretary. Paladin’s board adjusted its remuneration structure with an effective date of 1 July 2015. The revised structure will alter the base salary for Non-Executive Directors to A$65,000 and the Non-Executive Chairman to A$125,000. LIKELY DEVELOPMENTS Likely developments in the operations of the Group constituted by the Company and the entities it controls from time to time are set out under the section entitled Management, Discussion and Analysis. ENVIRONMENTAL REGULATIONS
The Group is subject to significant environmental regulation in respect to its exploration, evaluation, development and operational activities for uranium projects under the laws of the countries in which its activities are conducted. The Group currently has mining and processing operations in Namibia and Malawi (placed on care and maintenance in February 2014), as well as exploration projects in Australia, Niger and Labrador, Canada. The Group’s Policy is to ensure compliance with all applicable environmental laws and regulations in the countries in which it conducts business. Specific environmental regulations, approvals and licences for the exploration, development and operation are required to conduct the activities at each site. In addition, many other international and industry standards are also applied to the Group’s activities, including those specified for the global uranium industry. These environmental laws, regulations and standards relate to environmental factors such as radiation, water, flora, fauna, air quality, noise, waste management and pollution control. The Directors are not aware of any environmental matters which would have a significant adverse effect on the Group. F
or p
erso
nal u
se o
nly
66
DIRECTORS' REPORT (continued)
____________________________________________________________________________________
REMUNERATION FOR THE YEAR AT A GLANCE Details of the remuneration received by the Key Management Personnel are prepared in accordance with statutory requirements and accounting standards, and are detailed further in the Remuneration Report. The disclosure below aims to provide an overall picture of the group-wide remuneration platform and not simply focus on Key Management Personnel. Given the economic conditions associated with the continuing poor uranium price, and resulting cash constraints that the Company faced during the past year, with the exception of a small number of employees who received adjustments for parity issues seen within local labour markets, there were no general salary increases granted across the Group. A significant number of management personnel agreed to extend a 10% reduction in salary with a non-cash compensation option to offset the reduction, tailored to individual circumstances to assist in retention.
The Managing Director/CEO agreed to extend the voluntary 10% reduction in salary setting the tone for the cost rationalisation programme to continue across the Group.
An extension of the 10% reduction in directors’ fees and management personnel base salaries during the year. At a management level, this affected 21 individuals and resulted in further overall cash savings of approximately A$1 million. This reduction in fees and salaries will remain in place until certain market conditions are met, at which point they will return to their pre-adjusted rates. To compensate, individuals (other than directors) were offered a choice of an issue of share rights, additional leave or an option of reduced working hours, to the value of the 12 months of their reduction in salary.
No cash bonuses were paid across the Group this year.
Given the salary freeze, the Company absorbed the superannuation increase of 0.25% legislated in Australia.
A focus on rationalisation and consolidation of the workforce continued with a reduction in overall headcount across the Group and certain roles made redundant over the period. Additionally, where natural attrition occurred, only those roles deemed to be critical were replaced.
Certain positions within the Group moved from full time to part time to reflect the business needs.
1,791,992 share rights were granted during the year as an allocation to those employees affected by the 10% reduction in management personnel salaries.
A total of 2,388,072 share rights vested during the year (0.14% of issued capital).
Long-term incentives on issue at balance date comprise 788,754 share rights representing 0.05% of the issued capital. All were issued as an offset to salary reductions.
Executive Remuneration – cash value of earnings realised (unaudited) In keeping with the Company’s practice since 2011, the tables below set out the cash value of earnings realised by the Managing Director/CEO and other executives considered to represent Key Management Personnel (KMP) for 2015 and 2014 and the intrinsic value of share-based payments that vested to the executives during the period. This is in addition and different to the disclosures required by the Corporations Act and Accounting Standards, particularly in relation to share rights. As a general principle, the Accounting Standards require a value to be placed on share rights based on probabilistic calculations at the time of grant, which may be reflected in the remuneration report even if ultimately the share rights do not vest because performance and service hurdles are not met. By contrast, this table discloses the intrinsic value of share rights, which represents only those share rights which actually vest and result in shares issued to a KMP. The intrinsic value is the Company’s closing share price on the date of vesting.
For
per
sona
l use
onl
y

67
DIRECTORS' REPORT (continued)
____________________________________________________________________________________
REMUNERATION FOR THE YEAR AT A GLANCE (continued) Executive Remuneration - cash value of earnings realised (continued) The Company believes that this additional information is useful to investors as recognised by the 2009 Productivity Commission Inquiry Report ‘Executive Remuneration in Australia’. The Commission recommended that remuneration reports should include actual levels of remuneration received by the individuals named in the report in order to increase its usefulness to investors. The cash value of earnings realised include cash salary and fees, superannuation, cash bonuses and other benefits received in cash during the year and the intrinsic value of long-term incentives vesting during the 2015 year. The tables do not include the accounting value for share rights granted in the current and prior years, as this value may or may not be realised as they are dependent on the achievement of certain performance hurdles. The accounting value of other long-term benefits which were not received in cash during the year have also been excluded. All cash remuneration is paid in Australian dollars to those parties listed below (with the exception of Mr D Garrow, who is paid in US$), therefore the tables are presented in both A$ and US$ being the functional and presentation currency of the Company. The detailed schedules of remuneration presented later in this report are presented in US$. 2015 (A$’000) / (US$’000)
Name Base Salary & Superannuation
LTI(1) Bonus
Other Total Cash
LTIP 5 Nov 2010(2)
LTIP 2 Apr 2012(3)
LTIP 15 Nov 2013(4)
Total
A$ US$ A$ US$ A$ US$ A$ US$ A$ US$ A$ US$ A$ US$ A$ US$
Mr John Borshoff(5) 1,382 1,151 - - 210(6) 175(6) 1,592 1,326 48 40 - - - - 1,640 1,366 Mr Dustin Garrow(7)
591 492 - - - - 591 492 - - 8 7 63 52 662 551
Ms Gillian Swaby(8)
- - - - 510(9) 425(9) 510 425 - - 7 6 52 43 569 474
Mr Mark Chalmers 465 387 513 427 25(10) 21(10) 1,003 835 - - 29 24 26 22 1,058 881 Mr Craig Barnes 410 342 - - - - 410 342 - - - - - - 410 342
Total 2,848 2,372 513 427 745 621 4,106 3,420 48 40 44 37 141 117 4,339 3,614
Refer to the Compensation of Key Management Personnel table later in the Remuneration Report for audited information required in accordance with the Corporations Act 2001 and its Regulations. Exchange rate used is average for year US$1 = A$1.20149. (1) Payment of LTI retention bonus granted 1 January 2012. Refer to page 77. (2) Value of share rights granted on 5 November 2010 and vesting on 14 November 2014 at a market price of A$0.38. (3) Value of share rights granted on 2 April 2012 and vesting on 1 September 2014 and 8 September
2014 at a market price of A$0.38. (4) Value of share rights granted on 15 November 2013 that either vested immediately and were held
in escrow to 14 November 2014 or vested on 14 November 2014 at a market price of A$0.38. (5) Mr John Borshoff resigned effective 10 August 2015. (6) Represents 40 days accrued annual leave paid out. (7) Mr Dustin Garrow resigned effective 21 August 2015. (8) Ms Gillian Swaby resigned effective 21 August 2015. (9) Fees for services paid to a company of which Ms Gillian Swaby is a director and shareholder. (10) Mark Chalmers resigned on 30 June 2015. Represents accrued annual leave paid out at 30 June
2015.
For
per
sona
l use
onl
y
68
DIRECTORS' REPORT (continued)
____________________________________________________________________________________
REMUNERATION FOR THE YEAR AT A GLANCE (continued) Executive Remuneration - cash value of earnings realised (continued) 2014 (A$’000) / (US$’000)
Name Base Salary & Superannuation
LTI(1) Bonus
Other Total Cash
LTIP 5 Nov 2010(2)
LTIP 15 Feb 2011(3)
LTIP 2 Apr 2012(4)
Total
A$ US$ A$ US$ A$ US$ A$ US$ A$ US$ A$ US$ A$ US$ A$ US$
Mr John Borshoff 1,433 1,314 - - - - 1,433 1,314 - - - - - - 1,433 1,314 Mr Dustin Garrow 606 556 729 668 - - 1,335 1,224 11 11 - - 5 5 1,351 1,240 Ms Gillian Swaby - - 547 502 529(5) 485(5) 1,076 987 8 8 53 48 5 4 1,142 1,047 Mr Mark Chalmers 482 443 - - 39(6) 36(6) 521 479 - - - - 7 6 528 485 Mr Alan Rule(7) 468 430 - - - - 468 430 - - - - - - 468 430 Mr Craig Barnes(8) 64 57 - - - - 64 57 - - - - - - 64 57
Total 3,053 2,800 1,276 1,170 568 521 4,897 4,491 19 19 53 48 17 15 4,986 4,573
Refer to the Compensation of Key Management Personnel table later in the Remuneration Report for audited information required in accordance with the Corporations Act 2001 and its regulations. Exchange rate used is average for year US$1 = A$1.09006. (1) Payment of LTI retention bonus granted 1 July 2010. Refer to page 77. (2) Value of share rights granted on 5 November 2010 and vesting on 1 September 2013 at a market price of A$0.58. (3) Value of share rights granted on 15 February 2011 and vesting on 15 February 2014 at a market price of A$0.485. (4) Value of share rights granted on 2 April 2012 and vesting on 1 September 2013 at a market price
of A$0.58. (5) Fees for services paid to a company of which Ms Gillian Swaby is a director and shareholder. (6) Living away from home allowance. (7) Mr Alan Rule resigned effective 30 June 2014. (8) Mr Craig Barnes commenced on 5 May 2014. Appointment as Chief Financial Officer effective on
1 July 2014. REMUNERATION REPORT (Audited)
This Remuneration Report outlines the Director and executive remuneration arrangements of the Company and the Group in accordance with the requirements of the Corporations Act 2001 (Cth) and its Regulations. For the purposes of this report, Key Management Personnel of the Group are defined as those persons having authority and responsibility for planning, directing and controlling the major activities of the Group, directly or indirectly, including any Director, whether executive or otherwise, of the parent company. Key Management Personnel comprise:
Mr Rick Crabb, Non-executive Chairman
Mr John Borshoff, Managing Director/CEO (resigned 10 August 2015)
Mr Alexander Molyneux, Interim CEO (appointed 10 August 2015)
Mr Sean Llewelyn, Non-executive Director (resigned 21 August 2015)
Mr Donald Shumka, Non-executive Director
Mr Philip Baily, Non-executive Director
Mr Peter Donkin, Non-executive Director
Mr Wendong Zhang, Non-executive Director (appointed 25 November 2014)
Ms Gillian Swaby, Group Company Secretary and Executive General Manager – Corporate Services (resigned 21 August 2015)
Mr Dustin Garrow, Executive General Manager - Marketing (resigned 21 August 2015)
Mr Mark Chalmers, Executive General Manager – Production (resigned 30 June 2015)
Mr Craig Barnes, Chief Financial Officer
For
per
sona
l use
onl
y

69
DIRECTORS' REPORT (continued)
____________________________________________________________________________________
REMUNERATION REPORT (Audited) (continued) Following the resignation of Mr Mark Chalmers, effective 30 June 2015, the ultimate responsibility for planning, directing and controlling production has been transferred to Mr John Borshoff (10 August 2015, Alexander Molyneux was appointed Interim CEO). This reflects the fact that the Company now has only one operating mine being Langer Heinrich, with Kayelekera on care and maintenance. There were no other changes to KMP after the reporting date and before the date the financial report was authorised for issue. For the purposes of this report, the term ‘Executive’ encompasses the Managing Director/CEO, senior executives, managers and company secretary of the Parent and the Group. Remuneration Report approval at FY2014 Annual General Meeting (AGM) The FY2014 remuneration report received a 69% vote for approval at the FY2014 AGM. The 31% proxy vote against represented just 5.08% of Paladin’s total issued capital. Proxies representing 17% of Paladin’s total issued capital were received for this resolution. This is a particularly low voting turnout compared to past years, as reflected in the table below:
Year Issued Capital Total Votes
Received
% of Issued
Capital
Total No Vote % of Votes
Received
2014 965,752,118 160,202,690 16.588 49,050,562 30.618
2013 964,118,567 303,547,579 31.484 48,947,968 16.125
2012 836,825,651 347,577,412 41.535 27,206,523 7.827 The number of proxies tendered against the Remuneration Report was in line with voting at the 2013 AGM. Due to significantly higher shareholder participation in 2013 (which reflected previous years), some 83% of voting shareholders, representing 26% of the Company’s total issued capital, voted in favour of the Remuneration Report and the resolution was carried. Paladin believes it has worked hard to improve the transparency of its Remuneration Report and ensure remuneration across the business reflects the challenging conditions being experienced by uranium producers since the incident at Fukushima in 2011. In 2014, Paladin implemented a 10% reduction in directors’ fees and the base salaries of senior management. This reduction also applied to Managing Director and CEO John Borshoff, whose salary has fallen by 32.5% since June 2012. REMUNERATION APPROVAL PROCESS The Remuneration Committee is charged with assisting the Board by reviewing and making appropriate recommendations on remuneration packages for the Managing Director/CEO, Non-executive Directors and senior executives. In addition, it makes recommendations on long-term incentive plans and associated performance hurdles together with the quantum of grants made, taking into account both the individual’s and the Company’s performance. The Remuneration Committee, chaired by Mr Sean Llewelyn, held four meetings during the year. Messrs Crabb, Shumka and Zhang are also Committee members. The Managing Director/CEO is invited to attend those meetings which consider the remuneration strategy of the Group and recommendations in relation to senior executives. Having regard to the recommendations made by the Managing Director/CEO, the Committee approves the quantum of any short-term incentive bonus pool and the total number of any long-term incentive grants to be made and recommends the same for approval by the Board. Individual awards are then determined by the Managing Director/CEO in conjunction with senior management, as appropriate. The remuneration for the Managing Director/CEO is determined by the Remuneration Committee. Any salary reviews and bonus payments are effective from 1 January in the year.
For
per
sona
l use
onl
y
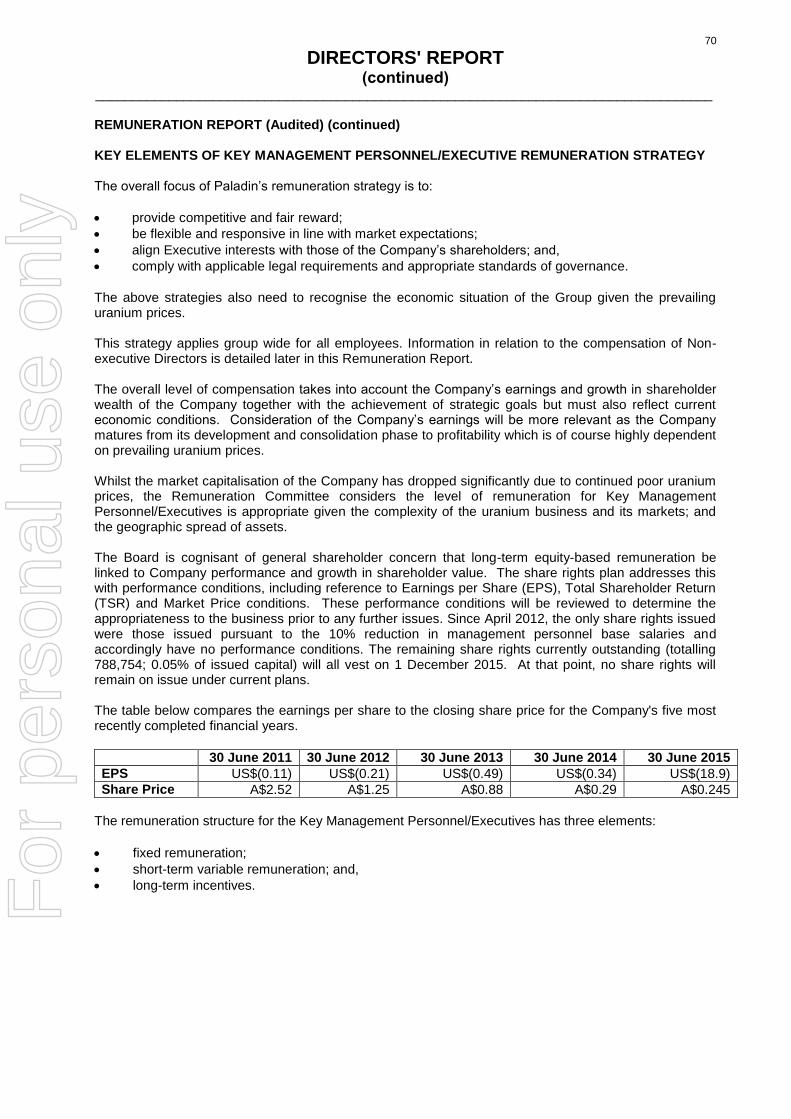
70
DIRECTORS' REPORT (continued)
____________________________________________________________________________________
REMUNERATION REPORT (Audited) (continued) KEY ELEMENTS OF KEY MANAGEMENT PERSONNEL/EXECUTIVE REMUNERATION STRATEGY The overall focus of Paladin’s remuneration strategy is to:
provide competitive and fair reward;
be flexible and responsive in line with market expectations;
align Executive interests with those of the Company’s shareholders; and,
comply with applicable legal requirements and appropriate standards of governance.
The above strategies also need to recognise the economic situation of the Group given the prevailing uranium prices. This strategy applies group wide for all employees. Information in relation to the compensation of Non-executive Directors is detailed later in this Remuneration Report. The overall level of compensation takes into account the Company’s earnings and growth in shareholder wealth of the Company together with the achievement of strategic goals but must also reflect current economic conditions. Consideration of the Company’s earnings will be more relevant as the Company matures from its development and consolidation phase to profitability which is of course highly dependent on prevailing uranium prices. Whilst the market capitalisation of the Company has dropped significantly due to continued poor uranium prices, the Remuneration Committee considers the level of remuneration for Key Management Personnel/Executives is appropriate given the complexity of the uranium business and its markets; and the geographic spread of assets. The Board is cognisant of general shareholder concern that long-term equity-based remuneration be linked to Company performance and growth in shareholder value. The share rights plan addresses this with performance conditions, including reference to Earnings per Share (EPS), Total Shareholder Return (TSR) and Market Price conditions. These performance conditions will be reviewed to determine the appropriateness to the business prior to any further issues. Since April 2012, the only share rights issued were those issued pursuant to the 10% reduction in management personnel base salaries and accordingly have no performance conditions. The remaining share rights currently outstanding (totalling 788,754; 0.05% of issued capital) will all vest on 1 December 2015. At that point, no share rights will remain on issue under current plans. The table below compares the earnings per share to the closing share price for the Company's five most recently completed financial years.
30 June 2011 30 June 2012 30 June 2013 30 June 2014 30 June 2015
EPS US$(0.11) US$(0.21) US$(0.49) US$(0.34) US$(18.9)
Share Price A$2.52 A$1.25 A$0.88 A$0.29 A$0.245
The remuneration structure for the Key Management Personnel/Executives has three elements:
fixed remuneration;
short-term variable remuneration; and,
long-term incentives. F
or p
erso
nal u
se o
nly

71
DIRECTORS' REPORT (continued)
____________________________________________________________________________________
REMUNERATION REPORT (Audited) (continued) COMPONENTS OF KEY MANAGEMENT PERSONNEL/EXECUTIVE REMUNERATION These are detailed as follows:
Remuneration Component Elements Details
Fixed Remuneration Annual base salary determined as at 1 January each year
The ‘not at risk’ cash component which may include certain salary sacrifice packaging.
Statutory superannuation contributions
Statutory % of base salary.
Expatriate benefits Executives who fulfil their roles as an expatriate may receive benefits including relocation costs, health insurance, housing and car allowances, educational fees and tax advisory services.
Foreign assignment allowance An additional % of base salary is payable in relation to foreign assignments being 15% for Malawi and 10% for Namibia.
Variable Performance Linked Remuneration (“at risk” remuneration)
Short-term incentive, paid as a cash bonus
Rewards Executives for performance over a short period, being the year ending 31 December. Bonuses are awarded at the same time as the salary reviews. Assessment is based on the individual’s performance and contribution to team and Company performance.
Long-term incentive, granted under the Rights Plan
Award determined in the September quarter of each year, based on individual performance and contribution to team and Company performance. Vesting dependent on creation of shareholder value over a three year period, together with a retention element.
Fixed Remuneration This is reviewed annually with consideration given to both the Company and the individual’s performance and effectiveness. Market data, focused on the mining industry, is analysed with a focus on maintaining parity or above with companies of similar complexity and size operating in the resources sector and becoming an employer of choice. The Company did not engage remuneration consultants, however it subscribes to a number of remuneration surveys and reports including Boardroom Remuneration Review (Connect 4), and AUSREM. The Company also takes into consideration the annual publication, Executive and Board Remuneration Report produced by Ernst & Young. Despite the challenging economic times, local reviews against industry salary benchmarks were undertaken and in instances where there were parity issues, adjustments were made accordingly as part of the effort to maintain a competitive remuneration structure. Mr John Borshoff is referred to as both Managing Director/CEO to clarify the understanding of his position in both North America and Australia, given Paladin’s stock exchange listings in each jurisdiction.
For
per
sona
l use
onl
y
72
DIRECTORS' REPORT (continued)
____________________________________________________________________________________
REMUNERATION REPORT (Audited) (continued) Fixed Remuneration (continued) Managing Director/CEO The current contract for the period 27 November 2013 to 31 December 2014, with an option for the parties to agree for a further 1 or 2 years to 31 December 2015 or 2016 respectively was extended on 26 August 2014 until 31 December 2016 on the same terms and conditions. Base salary was voluntarily reduced by 25% at 1 December 2011 to A$1,533,600 (US$1,276,415), with a further 10% reduction to A$1,382,000 (US$1,150,238), effective 27 November 2013. If at any time during the term the month-end U3O8 spot price as published by UxC equals or exceeds US$45/lb for a period of 3 consecutive months, and Mr Borshoff achieves other key strategic objectives as agreed between Mr Borshoff and the Board, Mr Borshoff’s base salary will be reinstated to $1,533,600 (including superannuation), with effect from the day after the end of the said 3 consecutive months. In addition, his contract provides for payment of a benefit on retirement or early termination by the Company, other than for gross misconduct, is equal to one year’s average base salary for the 3 years immediately preceding the termination date. The remuneration level reflects the extensive knowledge and experience Mr John Borshoff has in the uranium sector gained over the past 40 years, as a recognised global authority. Expertise at this level is in extremely limited supply, particularly given the period of over 20 years of non-activity in the uranium sector and the very small number of uranium producers worldwide. His knowledge and expertise of the sector have been key to the growth and acquisition strategy of the Company and integral to its development from a junior explorer to a uranium producer with two mines. This benefit reflects 22 years of service to the Company by John Borshoff, being the founder in 1993. Variable Remuneration Short-term Incentives The Company provides short-term incentives comprising a cash bonus to Executives of up to 30% of base salary. The bonus is entirely discretionary with the goal of focusing attention on short-term strategic and financial objectives. The amount is dependent on the Company’s performance in its stated objectives and the individual’s performance, together with the individual’s position and level of responsibility. This component is an “at risk” component of overall remuneration designed to encourage exceptional performance whilst adhering to the Company values. Specific targets for individuals have not been set due to the philosophy of achieving a common goal for the Company, however, the following measures are taken into account where these are applicable to the Key Management Personnel and individual Executives and have been selected to align their interests to those of shareholders: (a) health, safety and environmental performance; (b) production performance; (c) project development performance; (d) additional uranium resources delineated; (e) performance of the Company in meeting its various other objectives; (f) financial performance of the Company; and (g) such other matters determined by the Remuneration Committee in its discretion. The above must, however, be viewed in the context of the operating environment and the priorities in terms of the allocation and preservation of cash. Given the priority of cost reduction and cash conservation with the uranium industry continuing to experience difficult times, no cash bonuses were paid across the Group this year (CY2014 US$32,000). The expectation is that short-term incentives will not be reinstated until such time as the operating environment improves and, at that time, a more structured incentive programme linked both to individual and corporate performance will be implemented.
For
per
sona
l use
onl
y
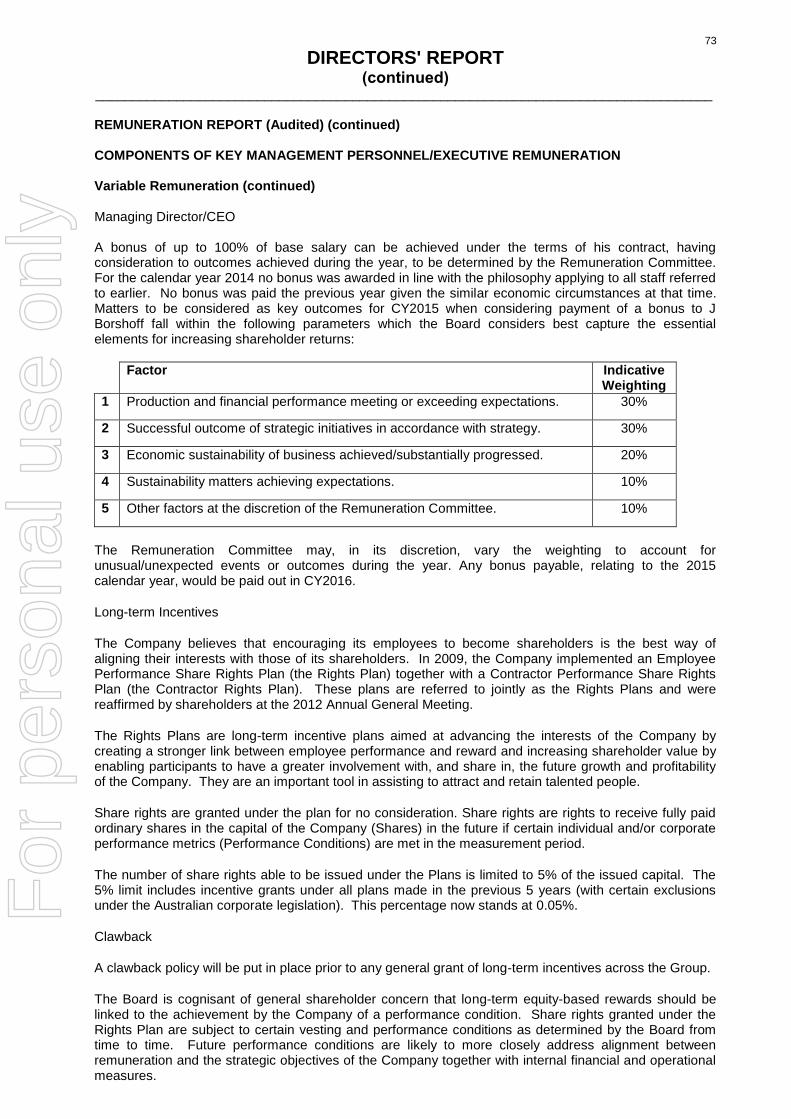
73
DIRECTORS' REPORT (continued)
____________________________________________________________________________________
REMUNERATION REPORT (Audited) (continued) COMPONENTS OF KEY MANAGEMENT PERSONNEL/EXECUTIVE REMUNERATION Variable Remuneration (continued) Managing Director/CEO A bonus of up to 100% of base salary can be achieved under the terms of his contract, having consideration to outcomes achieved during the year, to be determined by the Remuneration Committee. For the calendar year 2014 no bonus was awarded in line with the philosophy applying to all staff referred to earlier. No bonus was paid the previous year given the similar economic circumstances at that time. Matters to be considered as key outcomes for CY2015 when considering payment of a bonus to J Borshoff fall within the following parameters which the Board considers best capture the essential elements for increasing shareholder returns:
Factor Indicative Weighting
1 Production and financial performance meeting or exceeding expectations.
30%
2 Successful outcome of strategic initiatives in accordance with strategy.
30%
3 Economic sustainability of business achieved/substantially progressed.
20%
4 Sustainability matters achieving expectations.
10%
5 Other factors at the discretion of the Remuneration Committee.
10%
The Remuneration Committee may, in its discretion, vary the weighting to account for unusual/unexpected events or outcomes during the year. Any bonus payable, relating to the 2015 calendar year, would be paid out in CY2016.
Long-term Incentives
The Company believes that encouraging its employees to become shareholders is the best way of aligning their interests with those of its shareholders. In 2009, the Company implemented an Employee Performance Share Rights Plan (the Rights Plan) together with a Contractor Performance Share Rights Plan (the Contractor Rights Plan). These plans are referred to jointly as the Rights Plans and were reaffirmed by shareholders at the 2012 Annual General Meeting.
The Rights Plans are long-term incentive plans aimed at advancing the interests of the Company by creating a stronger link between employee performance and reward and increasing shareholder value by enabling participants to have a greater involvement with, and share in, the future growth and profitability of the Company. They are an important tool in assisting to attract and retain talented people.
Share rights are granted under the plan for no consideration. Share rights are rights to receive fully paid ordinary shares in the capital of the Company (Shares) in the future if certain individual and/or corporate performance metrics (Performance Conditions) are met in the measurement period.
The number of share rights able to be issued under the Plans is limited to 5% of the issued capital. The 5% limit includes incentive grants under all plans made in the previous 5 years (with certain exclusions under the Australian corporate legislation). This percentage now stands at 0.05%.
Clawback
A clawback policy will be put in place prior to any general grant of long-term incentives across the Group.
The Board is cognisant of general shareholder concern that long-term equity-based rewards should be linked to the achievement by the Company of a performance condition. Share rights granted under the Rights Plan are subject to certain vesting and performance conditions as determined by the Board from time to time. Future performance conditions are likely to more closely address alignment between remuneration and the strategic objectives of the Company together with internal financial and operational measures.
For
per
sona
l use
onl
y

74
DIRECTORS' REPORT (continued)
____________________________________________________________________________________
REMUNERATION REPORT (Audited) (continued) COMPONENTS OF KEY MANAGEMENT PERSONNEL/EXECUTIVE REMUNERATION (continued) Variable Remuneration (continued) Clawback (continued) The Company does not offer any loan facilities to assist in the purchase of shares by employees. (a) Share Rights Plan Vesting and Performance Conditions
The following vesting and performance conditions applied to share rights that vested during the year. These were originally issued on 2 April 2012 and there are no more share rights on issue with these conditions.
Proportion of share rights to which performance hurdle applies
Vesting and Performance Conditions
10% Time based – must remain in employ for 1 year from date of grant
15% Time based – must remain in employ for 2 years from date of grant
25% Time based – must remain in employ for 3 years from date of grant
20% Total Shareholder Return (TSR) relative to mining companies in ASX S&P 200 Index
30% Market Price Performance (MPP) measuring the increase in share price over the period
Managing Director/CEO The share rights issued to the Managing Director/CEO have different vesting hurdles to reflect the “at risk” nature of 100% of this component of his remuneration and provide a direct link between Managing Director/CEO reward and shareholder return, and provide a clear line of sight between Managing Director/CEO performance and Company performance. No share rights were granted to Mr Borshoff during the years ended 30 June 2014 and 2015. During the year ended 30 June 2015, 125,000 share rights vested in accordance with their vesting conditions (the TSR measure, as detailed later in this report). (2014: no share rights vested). The performance conditions of those share rights granted to Managing Director/CEO which vested during the year were:
Proportion of share rights to which performance hurdle applies
Performance measure
50% Total Shareholder Return (TSR) relative to mining companies in ASX S&P 200 Index*
50% Earnings Per Share (EPS) Measuring the increase in earnings over the period
Following the vesting as outlined above, Mr Borshoff holds no share rights. *The initial measurement date of the share rights subject to the relative TSR condition is at the end of year three, calculated from the date of grant. At the end of year three, Mr John Borshoff can either:
For
per
sona
l use
onl
y

75
DIRECTORS' REPORT (continued)
____________________________________________________________________________________
REMUNERATION REPORT (Audited) (continued) COMPONENTS OF KEY MANAGEMENT PERSONNEL/EXECUTIVE REMUNERATION (continued) Vesting and Performance Conditions (continued) Managing Director/CEO (continued)
accept the vesting outcome achieved; or,
elect to have his share rights retested at the end of year four (in which case the same vesting schedule applies, but the retest period covers the entire four year period from the date the share rights were granted).
He is not permitted to “double dip”, so by electing to have his share rights retested at the end of year four, he forfeits any entitlement to share rights, which otherwise would have vested at the end of year three. All share rights subject to the relative TSR condition will expire at the end of year four. The Remuneration Committee allows one retest to reflect the volatile nature of the industry. The way in which the retest is applied maintains alignment with shareholder interests. Why were these vesting conditions selected? The Board considered the measures reflected an appropriate balance in terms of alignment between comparative shareholder return and individual reward, a market based performance measure and the encouragement of long-term retention. A review will be undertaken prior to any future issues to determine more appropriate hurdles. Details of the various vesting and performance conditions for the Employee and Contractor Performance Share Rights Plan follow:
Time-based Vesting
50% of the share rights will vest based on the participant continuing to be employed with the Group. These are not subject to a performance condition and are staggered over time and this condition is designed to assist in long-term retention of staff. Such benefits also assist in recruitment of suitably qualified personnel in a market place where both mining, and more particularly uranium experience, are in particularly short supply. Paladin competes in the global recruitment market and must offer competitive benefits to be successful and attract quality candidates. The available talent pool with uranium expertise is both small and internationally focussed and competition is high for quality personnel. Costs for replacement of personnel and the hidden costs of disruption to the business can be substantial. This vesting criteria does not apply to the Managing Director/CEO.
Total Shareholder Return (TSR)
Except for the MD/CEO, 20% of the share rights will vest based on the Company’s TSR relative to the TSRs of a peer group of companies. This measure represents the change in the Company’s share price over the measurement period, plus dividends (if any) notionally reinvested in the Company’s shares, expressed as a percentage of the opening value. The peer group will comprise of mining companies in the S&P/ASX 200 Index as at the date of the offer, excluding steel companies and any companies that pay a dividend during any year of the performance period. Mining companies are companies under the Global Industry Classification Standard (GICS) sub-industries: Oil & Gas – Coal & Consumable Fuels (10102050), Metals & Mining – Aluminium (15104010), Metals & Mining – Diversified Metals & Mining (15104020), Metals & Mining – Gold (15104030), Metals & Mining – Precious Metals & Minerals (15104040) and Metals & Mining – Steel (15104050).
The limited number of uranium development and production companies globally presents difficulties in determining a suitable peer group. It was therefore decided that, as the primary listing is on the ASX and the majority of share trading takes place in that market, the peer group set out above is the most appropriate. This also reflects the Group’s competitors for capital and talent.
Relative TSR is independent of market conditions and is considered a more relevant measure of management performance in terms of value delivered to shareholders over the medium to long-term.
50% of the share rights granted to the Managing Director/CEO will vest based on the Company’s Relative TSR to the TSRs of a peer group of companies as described above.
The base and stretch targets for the TSR performance condition are as follows:
For
per
sona
l use
onl
y

76
DIRECTORS' REPORT (continued)
____________________________________________________________________________________
REMUNERATION REPORT (Audited) (continued) COMPONENTS OF KEY MANAGEMENT PERSONNEL/EXECUTIVE REMUNERATION (continued) Vesting and Performance Conditions (continued)
Relative TSR percentile ranking Percentage of share rights that may vest if the relative TSR performance condition is met
Less than 50th percentile at 50th percentile Greater than the 50th percentile but less than the 75th percentile At 75th percentile or greater
0% of the share rights subject to the TSR condition 50% of the share rights subject to the TSR condition Pro-rated vesting between 51% and 99% of the share rights subject to the TSR condition 100% of the share rights subject to the TSR condition
Market Price Performance (MPP)
30% of the share rights are subject to MPP vesting condition which measures the increase in share price of the Company. Share rights will vest if, at the end of the measurement period, the share price of the Company is 25% above the market price at the date of the offer. As part of the mix of performance conditions this provides a market based performance measure. The base price for each grant is detailed in the table on the following page.
This does not apply to the Managing Director/CEO.
Earnings Per Share (EPS)
EPS is determined by dividing the operating profit or loss attributable to members of Paladin Group by the weighted average number of ordinary shares outstanding during the financial year. Prior to 1 July 2013, in the event that EPS is negative (representing a loss per share) a reduction of the loss per share is, for this purpose, treated as a growth in EPS. This was due to the development phase the Company was in and the importance of the CEO leading the Company into positive earnings growth. However in respect of any share rights issued after 1 July 2013, only EPS growth measured to a positive number will be applicable. Growth in EPS will be measured by comparing the EPS in the base year (being the full financial year ending prior to the date of grant) and the measurement year. EPS has been chosen as a performance condition because it provides a clear line of sight between Managing Director/CEO performance and Company performance. It is also a generally recognised and understood measure of performance.
50% of the share rights granted to the Managing Director/CEO will vest based on the Company’s EPS.
The base and stretch targets for the share rights subject to the EPS conditions are as follows:
Compound growth in EPS over the performance period
Percentage of share rights that may vest if the EPS hurdle is met
Less than 10% pa At 10% pa More than 10% pa but less than 20% pa At 20% pa or greater
0% of the share rights subject to the EPS condition
50% of the share rights subject to the EPS condition
Pro-rated vesting between 51% and 99% of the share rights subject to the EPS condition
100% of the share rights subject to the EPS condition
Shares Acquired Under the Rights Plan Shares to be allocated to participants on vesting are currently issued from equity. No consideration is paid on the vesting of the share rights and resultant shares carry full dividend and voting rights.
For
per
sona
l use
onl
y

77
DIRECTORS' REPORT (continued)
____________________________________________________________________________________
REMUNERATION REPORT (Audited) (continued) COMPONENTS OF KEY MANAGEMENT PERSONNEL/EXECUTIVE REMUNERATION (continued) Change of Control All share rights will vest on a change of control event. The Remuneration Committee considers that this is appropriate given that shareholders (or a majority thereof) would have collectively elected to accept a change of control event. Moreover the number of share rights relative to total issued shares is very insignificant (0.05%) and thus are not considered a disincentive to a potential bidder. Cessation of Employment Under the Rights Plan, employees’ share rights will be cancelled on cessation of employment, unless special circumstances exist such as retirement, total and permanent disability, redundancy or death. Contractors will have their share rights cancelled, other than on death at which point the contractor’s legal representative will be entitled to receive them. Other Rights at 30 June 2015
Date rights granted
Vesting date Vesting performance conditions Number
1 December 2014 1 December 2015 Time based 788,754(1)
Total 788,754
(1) Issued pursuant to 10% reduction in management personnel base salaries. Issue of Share Rights - A number of management personnel agreed to extend a 10% reduction in salary and fees. This reduction in fees and salaries will remain in place until certain market conditions are met, at which point they will return to their pre-adjusted rates. To compensate, individuals (other than directors) were offered a choice of an issue of share rights, additional leave or an option of reduced working hours, to the value of the 12 months of their reduction in salary. Accordingly, this award has no performance conditions. 506,647 share rights were granted to KMPs.
In summary, this balance represents 0.05% of the issued capital. Hedging of Incentive Grants Prohibited The Company’s policy prohibits hedging of equity compensation grants. Prohibited hedging practices include put/call arrangements over “in money” options to hedge against a future drop in share price. The Board considers such hedging to be against the spirit of such remuneration and inconsistent with shareholder objectives. Retention Programme The remaining balance/second grant of the programme was paid on 1 January 2015. No further grants have been made and no balance is outstanding/payable. As a component of the strategy for retention of key personnel, certain executives and staff participated in a retention bonus programme. Participation extended to a limited number of selected individuals that were identified as possessing the requisite skills, expertise and experience in the uranium sector and those with specialist corporate and commercial skills that the Company required to achieve its aggressive goals. This initiative was driven by a desire to retain the intellectual property pool considered necessary to ensure the continued success of the Company. The programme entitled the participants to receive a cash award at the end of the three year retention period. In the event employment terminated for any of retirement, disablement, redundancy or death, after the first anniversary one third became payable and after the second anniversary two thirds became payable. The cash award varied between 50% and 100% of the average annual salary over the 3 year period. The second grant under this programme was on 1 January 2012 with a payment date on 1 January 2015. US$1,655,088/A$1,988,572 of this grant vested to key personnel employed across the Group at head office, Namibia and Malawi, and was paid in the financial year ended 30 June 2015 (first grant paid 1 July 2013: US$7,352,574/A$8,014,077). A Senior Employee Retention Scheme has been introduced with benefits awarded based on the performance of both the individual and the Company, coupled with a long-term retention hook, to assist in retention of key individuals and top performers.
For
per
sona
l use
onl
y
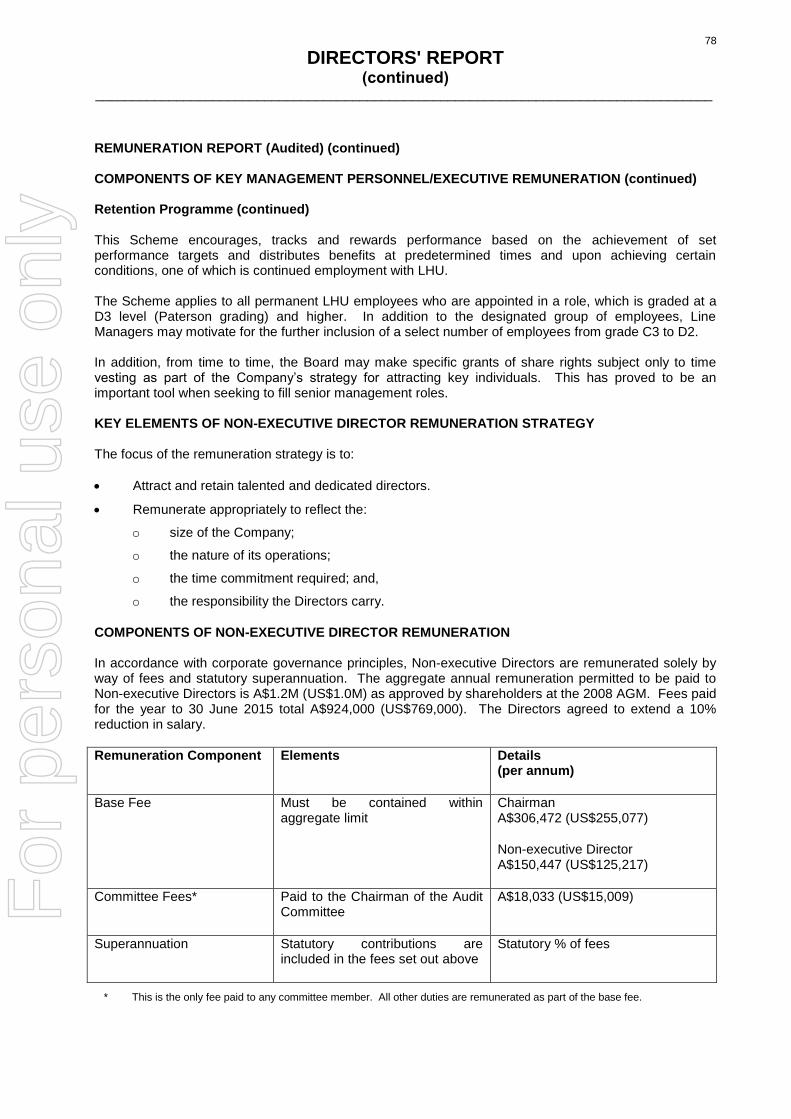
78
DIRECTORS' REPORT (continued)
____________________________________________________________________________________
REMUNERATION REPORT (Audited) (continued) COMPONENTS OF KEY MANAGEMENT PERSONNEL/EXECUTIVE REMUNERATION (continued) Retention Programme (continued) This Scheme encourages, tracks and rewards performance based on the achievement of set performance targets and distributes benefits at predetermined times and upon achieving certain conditions, one of which is continued employment with LHU. The Scheme applies to all permanent LHU employees who are appointed in a role, which is graded at a D3 level (Paterson grading) and higher. In addition to the designated group of employees, Line Managers may motivate for the further inclusion of a select number of employees from grade C3 to D2. In addition, from time to time, the Board may make specific grants of share rights subject only to time vesting as part of the Company’s strategy for attracting key individuals. This has proved to be an important tool when seeking to fill senior management roles. KEY ELEMENTS OF NON-EXECUTIVE DIRECTOR REMUNERATION STRATEGY The focus of the remuneration strategy is to:
Attract and retain talented and dedicated directors.
Remunerate appropriately to reflect the:
o size of the Company;
o the nature of its operations;
o the time commitment required; and,
o the responsibility the Directors carry.
COMPONENTS OF NON-EXECUTIVE DIRECTOR REMUNERATION In accordance with corporate governance principles, Non-executive Directors are remunerated solely by way of fees and statutory superannuation. The aggregate annual remuneration permitted to be paid to Non-executive Directors is A$1.2M (US$1.0M) as approved by shareholders at the 2008 AGM. Fees paid for the year to 30 June 2015 total A$924,000 (US$769,000). The Directors agreed to extend a 10% reduction in salary.
Remuneration Component Elements Details (per annum)
Base Fee Must be contained within aggregate limit
Chairman A$306,472 (US$255,077)
Non-executive Director A$150,447 (US$125,217)
Committee Fees* Paid to the Chairman of the Audit Committee
A$18,033 (US$15,009)
Superannuation Statutory contributions are included in the fees set out above
Statutory % of fees
* This is the only fee paid to any committee member. All other duties are remunerated as part of the base fee.
For
per
sona
l use
onl
y

79
DIRECTORS' REPORT (continued)
____________________________________________________________________________________
REMUNERATION REPORT (Audited) (continued) COMPONENTS OF NON-EXECUTIVE DIRECTOR REMUNERATION (continued) The following graph is provided to give a clearer understanding of the Non-executive Directors’ remuneration.
Other Fees/Benefits In addition, the Company’s Constitution provides for additional compensation to be paid if any of the Directors are called upon to perform extra services or make any special exertions on behalf of the Company or the business of the Company. The Company may compensate such Director in accordance with such services or exertions, and such compensation may be either in addition to or in substitution for the Directors’ fees referred to above. No additional fees were paid during the year, other than the Directors’ fees disclosed. Non-executive Directors are also entitled to be reimbursed for reasonable expenses incurred whilst engaged on Company business. There is no entitlement to compensation on termination of non-executive directorships. Non-executive Directors do not earn retirement benefits (other than the statutory superannuation) and are not entitled to any form of performance linked remuneration. Rotation of Directors Mr Donald Shumka and Mr Peter Donkin will seek re-election at the 2015 Annual General Meeting, following their retirement by rotation. Mr Wendong Zhang was appointed as a Non-executive Director by the Board effective 25 November 2014. Mr Zhang will seek election by shareholders at the 2015 Annual General Meeting.
For
per
sona
l use
onl
y
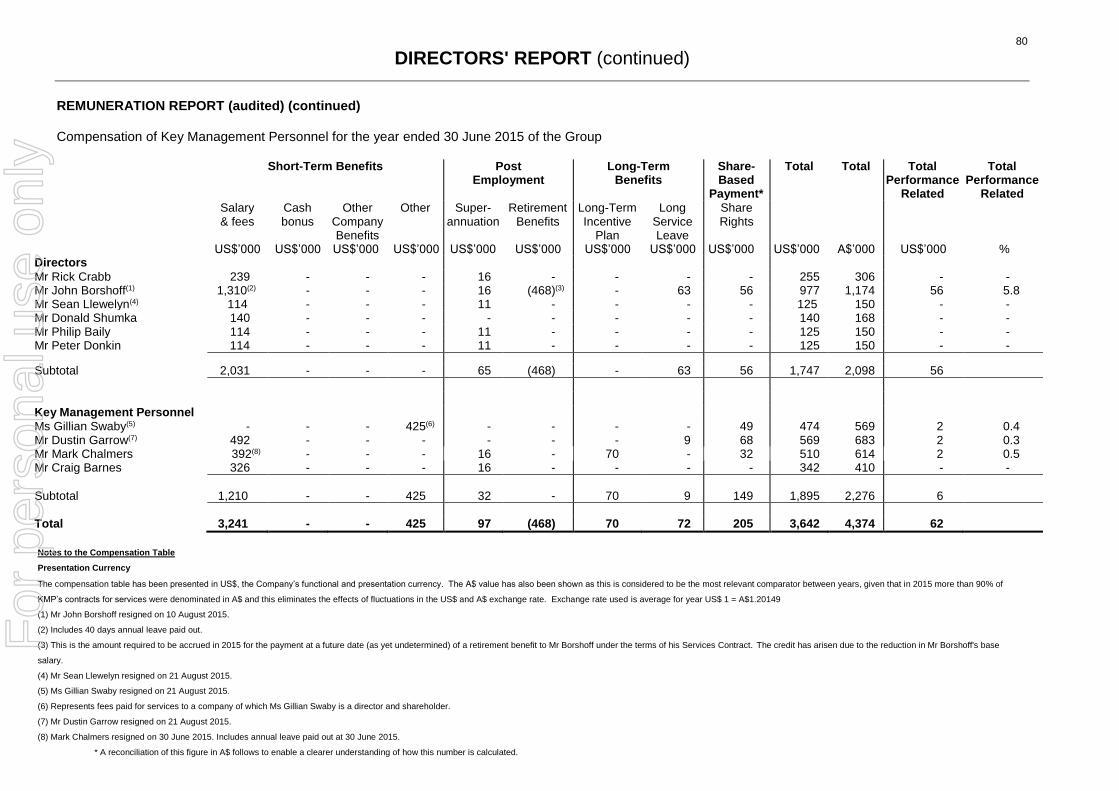
80
DIRECTORS' REPORT (continued)
REMUNERATION REPORT (audited) (continued) Compensation of Key Management Personnel for the year ended 30 June 2015 of the Group
Short-Term Benefits Post Employment
Long-Term Benefits
Share-Based
Payment*
Total Total Total Performance
Related
Total Performance
Related Salary
& fees Cash bonus
Other Company Benefits
Other Super-annuation
Retirement Benefits
Long-Term Incentive
Plan
Long Service Leave
Share Rights
US$’000 US$’000 US$’000 US$’000 US$’000 US$’000 US$’000 US$’000 US$’000 US$’000 A$’000 US$’000 % Directors Mr Rick Crabb 239 - - - 16 - - - - 255 306 - - Mr John Borshoff(1) 1,310(2) - - - 16 (468)(3) - 63 56 977 1,174 56 5.8 Mr Sean Llewelyn(4) 114 - - - 11 - - - - 125 150 - - Mr Donald Shumka 140 - - - - - - - - 140 168 - - Mr Philip Baily 114 - - - 11 - - - - 125 150 - - Mr Peter Donkin 114 - - - 11 - - - - 125 150 - -
Subtotal 2,031 - - - 65 (468) - 63 56 1,747 2,098 56
Key Management Personnel Ms Gillian Swaby(5) - - - 425(6) - - - - 49 474 569 2 0.4 Mr Dustin Garrow(7) 492 - - - - - - 9 68 569 683 2 0.3 Mr Mark Chalmers 392(8) - - - 16 - 70 - 32 510 614 2 0.5 Mr Craig Barnes 326 - - - 16 - - - - 342 410 - -
Subtotal 1,210 - - 425 32 - 70 9 149 1,895 2,276 6
Total 3,241 - - 425 97 (468) 70 72 205 3,642 4,374 62
Notes to the Compensation Table
Presentation Currency
The compensation table has been presented in US$, the Company’s functional and presentation currency. The A$ value has also been shown as this is considered to be the most relevant comparator between years, given that in 2015 more than 90% of
KMP’s contracts for services were denominated in A$ and this eliminates the effects of fluctuations in the US$ and A$ exchange rate. Exchange rate used is average for year US$ 1 = A$1.20149
(1) Mr John Borshoff resigned on 10 August 2015.
(2) Includes 40 days annual leave paid out.
(3) This is the amount required to be accrued in 2015 for the payment at a future date (as yet undetermined) of a retirement benefit to Mr Borshoff under the terms of his Services Contract. The credit has arisen due to the reduction in Mr Borshoff's base
salary.
(4) Mr Sean Llewelyn resigned on 21 August 2015.
(5) Ms Gillian Swaby resigned on 21 August 2015.
(6) Represents fees paid for services to a company of which Ms Gillian Swaby is a director and shareholder.
(7) Mr Dustin Garrow resigned on 21 August 2015.
(8) Mark Chalmers resigned on 30 June 2015. Includes annual leave paid out at 30 June 2015.
* A reconciliation of this figure in A$ follows to enable a clearer understanding of how this number is calculated.
For
per
sona
l use
onl
y

81
DIRECTORS' REPORT (continued)
REMUNERATION REPORT (audited) (continued) Reconciliation of Share-Based Payment Compensation of Key Management Personnel for the year ended 30 June 2015 of the Group. Share Rights
granted 5 November 2010 (vesting CY2011 to
CY2014)
Share Rights granted 2 April 2012 (vesting CY2012 to
CY2014)
Share Rights granted 1 December 2014(1) (vesting CY2014 to CY2015)
Total Share-Based
Payment
A$’000 US$’000 A$’000 US$’000 A$’000 US$’000 A$’000 US$’000 Directors Mr John Borshoff 68 56 - - - - 68 56
Subtotal 68 56 - - - - 68 56
Executives Ms Gillian Swaby - - 4 3 55 46 59 49 Mr Dustin Garrow - - 4 3 77 65 81 68 Mr Mark Chalmers - - 11(2) 10(2) 27 22 38 32
Subtotal - - 19 16 159 133 178 149
TOTAL 68 56 19 16 159 133 246 205
It should be noted that time or performance vesting conditions are attached to all of the share rights referred to above. These are detailed elsewhere in this report.
Exchange rate used as the average for year US$1 = A$1.20149.
(1) Share rights granted as an allocation to offset 10% reduction in salaries and fees.
(2) Includes A$6,000/US$5,000 relating to 50,000 time-based shares negotiated as a sign-on bonus to assist in attracting quality personnel.
For
per
sona
l use
onl
y

82
DIRECTORS' REPORT (continued)
REMUNERATION REPORT (audited) (continued) Compensation of Key Management Personnel for the year ended 30 June 2014 of the Group
Short-Term Benefits Post Employment
Long-Term Benefits
Share-Based
Payment*
Total Total Total Performance
Related
Total Performance
Related Salary
& fees Cash bonus
Other Company Benefits
Other Super-annuation
Retirement Benefits
Long-Term Incentive
Plan
Long Service Leave
Share Rights
US$’000 US$’000 US$’000 US$’000 US$’000 US$’000 US$’000 US$’000 US$’000 US$’000 A$’000 US$’000 % Directors Mr Rick Crabb 274 - - - 17 - - - - 291 317 - - Mr John Borshoff 1,297 - - - 17 (118)(1) - 18 366 1,580 1,723 366 23.2 Mr Sean Llewelyn 131 - - - 12 - - - - 143 156 - - Mr Donald Shumka 160 - - - - - - - - 160 175 - - Mr Philip Baily 131 - - - 12 - - - - 143 156 - - Mr Peter Donkin 131 - - - 12 - - - - 143 156 - -
Subtotal 2,124 - - - 70 (118) - 18 366 2,460 2,683 366
Key Management Personnel Ms Gillian Swaby - - - 485(2) - - - - 195 680 741 17 2.4 Mr Alan Rule(3) 413 - - - 17 - (214)(4) - 44 260 283 - - Mr Dustin Garrow 556 - - - - - - 83 97 736 802 19 2.6 Mr Mark Chalmers 426 - 36(5) - 17 - 197 - 90 766 835 16 2.1 Mr Craig Barnes(6) 54 - - - 3 - - - - 57 63 - -
Subtotal 1,449 - 36 485 37 - (17) 83 426 2,499 2,724 52
Total 3,573 - 36 485 107 (118) (17) 101 792 4,959 5,407 418
Notes to the Compensation Table
Presentation Currency
The compensation table has been presented in US$, the Company’s functional and presentation currency. The A$ value has also been shown as this is considered to be the most relevant comparator between years, given that in 2014 more than 89% of
KMP’s contracts for services were denominated in A$ and this eliminates the effects of fluctuations in the US$ and A$ exchange rate. Exchange rate used is average for year US$ 1 = A$1.09006
(1) This is the amount required to be accrued in 2014 for the payment at a future date (as yet undetermined) of a retirement benefit to Mr Borshoff under the terms of his Services Contract. The credit has arisen due to the reduction in Mr Borshoff's base
salary.
(2) Other represents fees paid for services to a company of which Ms Gillian Swaby is a director and shareholder.
(3) Mr Alan Rule resigned on 30 June 2014.
(4) The credit has arisen due to Mr Alan Rule’s resignation on 30 June 2014.
(5) Living away from home allowance.
(6) Mr Craig Barnes – commenced on 5 May 2014. Appointment as Chief Financial Officer effective on 1 July 2014.
* A reconciliation of this figure in A$ follows to enable a clearer understanding of how this number is calculated.
For
per
sona
l use
onl
y

83
DIRECTORS' REPORT (continued)
REMUNERATION REPORT (audited) (continued) Reconciliation of Share-Based Payment Compensation of Key Management Personnel for the year ended 30 June 2014 of the Group. Share Rights
granted 26 March 2010 (vesting CY2010 to
CY2014)
Share Rights granted 5 November 2010
(vesting CY2011 to CY2014)
Share Rights granted 15 February 2011
(vesting CY2012 to CY2014)
Share Rights granted 2 April 2012 (vesting CY2012 to
CY2014)
Share Rights granted 15 November 2013(1) (vesting CY2013 to CY2014)
Total Share-Based
Payment
A$’000 US$’000 A$’000 US$’000 A$’000 US$’000 A$’000 US$’000 A$’000 US$’000 A$’000 US$’000 Directors Mr John Borshoff 74 68 325 298 - - - - - - 399 366
Subtotal 74 68 325 298 - - - - - - 399 366
Executives Ms Gillian Swaby - - 9 8 123(2) 113(2) 25 23 55 51 212 195 Mr Alan Rule - - - - - - - - 47 7 44 47 44 Mr Dustin Garrow - - 12 11 - - 27 25 67 61 106 97 Mr Mark Chalmers - - - - - - 71(3) 65(3) 28 25 99 90
Subtotal - - 21 19 123 113 123 113 197 181 464 426
TOTAL 74 68 346 317 123 113 123 113 197 181 863 792
It should be noted that time or performance vesting conditions are attached to all of the share rights referred to above. These are detailed elsewhere in this report.
Exchange rate used as the average for year US$1 = A$1.09006
(1) Share rights granted as a one-off allocation to offset 10% reduction in salaries and fees.
(2) Issued pursuant to retention programme, vesting time based only in order to retain quality personnel.
(3) Includes A$37,000/US$34,000 relating to 50,000 time-based shares negotiated as a sign-on bonus to assist in attracting quality personnel.
For
per
sona
l use
onl
y

84
DIRECTORS' REPORT (continued)
__________________________________________________________________________________
REMUNERATION REPORT (audited) (continued)
Share Rights Holdings of Key Management Personnel (Group) 30 June 2015
01 Jul 14
Granted as remuneration(1)
Fair value at grant date(2)
Vested as shares
Lapsed (3)
30 Jun 15
number number US$ number number Number Directors Mr John Borshoff 250,000 - - (125,000) (125,000)(4) - Executives Ms Gillian Swaby 41,250 174,529 50,435 (193,779) (22,000)(5) - Mr Dustin Garrow 209,979 245,582 70,967 (185,979) (24,000)(5) 245,582 Mr Mark Chalmers 174,373 86,536 25,007 (144,373) (30,000)(5) 86,536(6)
Total
675,602
506,647
146,409
(649,131)
(201,000)
332,118
No other Key Management Personnel held share rights during the year ended 30 June 2015. (1) Allocation of share rights to offset 10% reduction in salary/fees. (2) Fair value per right at grant date was US$0.32. (3) Lapsed as performance conditions were not met. (4) Granted 5 November 2010. (5) Granted 2 April 2012. (6) Rights vested but cannot be exercised until 1 December 2015.
Shares held in Paladin Energy Ltd (number)
30 June 2015
Balance 01 Jul 14
On Vesting of Rights
Net Change Other
Balance 30 June 15
Directors Mr Rick Crabb 5,181,528 - 800,000 5,981,528 Mr John Borshoff 16,081,794 125,000 6,488,111 22,694,905 Mr Sean Llewelyn 100,000 - 50,000 150,000 Mr Donald Shumka 200,000 - - 200,000 Mr Peter Donkin 15,000 - 7,500 22,500 Mr Philip Baily Mr Wendong Zhang
12,000 -
- -
6,000 1,180,000
18,000 1,180,000
Executives Ms Gillian Swaby 554,632 193,779(1) - 748,411 Mr Mark Chalmers 18,750 144,373(2) 81,562 244,685 Mr Dustin Garrow 15,000 185,979(2) (79,979) 121,000
Total 22,178,704 649,131 8,533,194 31,361,029 No other Key Management Personnel held shares during the year ended 30 June 2015. (1) Includes 174,529 share rights issued on 1 December 2014 to offset 10% reduction in fees. Vested immediately, to be held in escrow to 1 December 2015. (2) Includes 233,102 share rights issued on 14 November 2013 to offset 10% reduction in fees. Vested on 14 November 2014.
All equity transactions with Key Management Personnel have been entered into under terms and conditions no more favourable than those the Group would have adopted if dealing at arm’s length. Other Transactions and Balances with Key Management Personnel Fees paid in the normal course of business in 2015 for corporate services totalling US$425,000 (2014: US$485,000) were paid/payable (balance outstanding at 30 June 2015 and included in trade creditors US$Nil (2014: US$Nil)) to a company of which Ms Gillian Swaby is a director and shareholder. All amounts are excluding GST.
For
per
sona
l use
onl
y

85
DIRECTORS' REPORT (continued)
__________________________________________________________________________________
REMUNERATION REPORT (audited) (continued) CONTRACTS FOR SERVICES Remuneration and other terms of employment for the Key Management Personnel are normally formalised in contracts for services. All contracts with Key Management Personnel may be terminated early by either party providing between three to twelve months written notice or providing payments in lieu of the notice period (based on fixed component of remuneration). On termination notice by the Company, any rights that have vested, or that will vest during the notice period, will be released. Rights that have not yet vested will be forfeited. Mr John Borshoff, Managing Director/CEO (Resigned effective 10 August 2015) Term of agreement – 27 November 2013 to 31 December 2014, extended for a further 2 years to 31 December 2016 on the same terms and in accordance with the original agreement. Base salary, inclusive of superannuation, A$1,533,600. Further 10% reduction in salary to A$1,382,000. If at any time during the term the month-end U3O8 spot price as published by UxC equals or exceeds US$45/lb for a period of three consecutive months, and Mr Borshoff achieves other key strategic objectives as agreed between Mr Borshoff and the Board, Mr Borshoff’s base salary will be reinstated to $1,533,600 (including superannuation), with effect from the day after the end of the said three consecutive months. Three months long service leave after five years continual service. Payment of a benefit on retirement or early termination by the Company, other than for gross misconduct, equal to one year’s average base salary over the three years immediately preceding the termination date. Notice period three months. Ms Gillian Swaby, Group Company Secretary and Executive General Manager – Corporate Services (Resigned effective 21 August 2015) Fees are paid in the ordinary course of business for services to a company of which Ms Gillian Swaby is a director and shareholder. Consultancy agreement with no fixed term. Annual fee A$567,000. 10% reduction in fees to A$510,300 offset with an allocation of 174,529 share rights. Notice period twelve months. No termination benefit is specified in the agreement. Mr Dustin Garrow, Executive General Manager - Marketing (Resigned effective 21 August 2015) Term of agreement – no fixed term. Base salary, of US$683,385. 10% reduction in salary and 20% reduction in time to US$492,037 offset with an allocation of 245,582 share rights. No termination benefit is specified in the agreement. Notice period six months. Mr Mark Chalmers, Executive General Manager – Production (Resigned effective 30 June 2015) Term of Agreement – no fixed term. Base salary, inclusive of superannuation of A$514,500. 10% reduction in salary to A$464,827 offset with an allocation of 86,536 share rights. No termination benefit is specified. Notice period three months. Mr Craig Barnes, Chief Financial Officer Term of agreement – no fixed term. Base salary, inclusive of superannuation of A$410,000. No termination benefit is specified in the agreement. Notice period six months. Remuneration for all parties referred to above includes provision of an annual discretionary bonus and initial and ongoing discretionary participation in the Company’s long-term incentive plans.
For
per
sona
l use
onl
y

86
DIRECTORS' REPORT (continued)
__________________________________________________________________________________
REMUNERATION REPORT (audited) (continued) Share Rights Vested as Shares - Key Management Personnel (Group) 30 June 2015 Vested as
shares Directors Mr John Borshoff 125,000 Executives Ms Gillian Swaby 193,779(1) Mr Dustin Garrow 185,979(2) Mr Mark Chalmers 144,373(2)
Total
649,131(3)
(1) Includes 174,529 share rights issued on 1 December 2014 to offset 10% reduction in fees. Vested immediately, to be held in escrow to 1 December 2015. (2) Includes 233,102 share rights issued on 14 November 2013 to offset 10% reduction in salary. Vested on 14 November 2014. (3) All shares issued for nil consideration.
End of audited Remuneration Report
SHARE RIGHTS The outstanding balance of share rights at the date of this report are as follows:
Date rights granted
Vesting date Vesting performance conditions Number
1 December 2014 1 December 2015 Time based 788,754(1)
Total 788,754
(1) Issued pursuant to 10% reduction in management personnel base salaries.
2,388,072 shares were issued on the vesting of share rights during the year ended 30 June 2015.
For
per
sona
l use
onl
y
87
DIRECTORS' REPORT (continued)
__________________________________________________________________________________
DIRECTORS’ INDEMNITIES
During the year the Company has incurred premiums to insure the Directors and/or officers for liabilities incurred as costs and expenses that may be incurred in defending civil or criminal proceedings that may be brought against the officers in their capacity as officers of the Company and or its controlled entities. Under the terms and conditions of the insurance contract, the nature of liabilities insured against and the premium paid cannot be disclosed. INDEMINIFICATION OF AUDITORS To the extent permitted by law, the Company has agreed to indemnify its auditors, Ernst & Young, as part of the terms of its audit engagement agreement against claims by third parties arising from the audit (for an unspecified amount). No payment has been made to indemnify Ernst & Young during or since the financial year. ROUNDING
The amounts contained in this report, the Financial Report and the Management, Discussion and Analysis have been rounded to the nearest US$100,000 (where rounding is applicable) under the option available to the Company under ASIC Class Order 98/0100. The Company is an entity to which the Class Order applies.
AUDITOR
Ernst & Young were appointed auditors for the Company on 21 June 2005, which was approved by shareholders at the 2005 Annual General Meeting on 9 November 2005. AUDITOR INDEPENDENCE AND NON-AUDIT SERVICES
The Directors received the following declaration from the auditor of Paladin Energy Ltd.
For
per
sona
l use
onl
y

88
DIRECTORS' REPORT (continued)
__________________________________________________________________________________
NON-AUDIT SERVICES The following non-audit and assurance services were provided by the Company’s auditor, Ernst & Young. The Directors are satisfied that the provision of non-audit and assurance services is compatible with the general standard of independence for auditors imposed by the Corporations Act. The nature and scope of each type of non-audit and assurance service provided means that auditor independence was not compromised. Ernst & Young received or are due to receive the following amounts for the provision of non-audit services:
US$’000 Other services 99
Tax compliance services 154
International tax consulting 44
Other tax advice 23
Total 320
Signed in accordance with a resolution of the Directors.
Rick Crabb Chairman Perth, Western Australia 27 August 2015
For
per
sona
l use
onl
y

89
PALADIN ENERGY LTD AND CONTROLLED ENTITIES FINANCIAL REPORT
FOR THE YEAR ENDED 30 JUNE 2015
EXPRESSED IN US DOLLARS
CONTENTS OF THE FINANCIAL REPORT
Note Title Page Number ___________________________________________________________________________________ CONSOLIDATED INCOME STATEMENT ........................................................................................... 90
CONSOLIDATED STATEMENT OF COMPREHENSIVE INCOME ................................................... 91
CONSOLIDATED STATEMENT OF FINANCIAL POSITION ............................................................. 92
CONSOLIDATED STATEMENT OF CHANGES IN EQUITY .............................................................. 93
CONSOLIDATED STATEMENT OF CASH FLOWS .......................................................................... 94
NOTES TO THE CONSOLIDATED FINANCIAL STATEMENTS ....................................................... 95
For
per
sona
l use
onl
y

90
PALADIN ENERGY LTD AND CONTROLLED ENTITIES CONSOLIDATED INCOME STATEMENT
FOR THE YEAR ENDED 30 JUNE 2015
EXPRESSED IN US DOLLARS
Notes 2015 US$M
2014 US$M
Revenue Revenue 11 199.5 329.5 Cost of sales 12 (189.7) (332.9) Impairment – inventories 17 (8.0) (61.7)
Gross profit/(loss) 1.8 (65.1) Other income 12 5.5 0.4 Exploration and evaluation expenses 22 (1.6) (1.7) Administration, marketing and non-production costs 12 (19.3) (21.9) Other expenses 12 (267.6) (337.6)
Loss before interest and tax (281.2) (425.9) Finance costs 12 (57.0) (59.7)
Net loss before income tax (338.2) (485.6) Income tax benefit 13 38.1 96.0
Net loss after tax (300.1) (389.6)
Attributable to: Non-controlling interests (32.3) (51.2) Members of the parent (267.8) (338.4) Net loss after tax (300.1) (389.6)
Loss per share (US cents) (1) Loss after tax from operations attributable to ordinary equity holders of the Company – basic and diluted (US cents) 14 (18.9) (32.7) The above Consolidated Income Statement should be read in conjunction with the accompanying notes. (1) The loss per share calculations for all periods prior to 31 March 2015 have been adjusted by factors of 1.03 and 1.02 to
reflect the bonus element of the institutional and retail entitlement offers.
F
or p
erso
nal u
se o
nly

91
PALADIN ENERGY LTD AND CONTROLLED ENTITIES CONSOLIDATED STATEMENT OF COMPREHENSIVE INCOME
FOR THE YEAR ENDED 30 JUNE 2015
EXPRESSED IN US DOLLARS
2015 US$M
2014 US$M
Net loss after tax from operations (300.1) (389.6) Other comprehensive income Items that may be subsequently reclassified to profit or loss: Net loss on available-for-sale financial assets (3.7) (3.4) Transfer of realised gains to other income on disposal of available-for-sale financial assets (0.4) (0.3) Transfer of impairment loss on available-for-sale financial assets to income statement 2.9 4.3 Foreign currency translation (99.2) 1.3 Income tax on items of other comprehensive income (0.6) - Items that will not be subsequently reclassified to profit or loss: Foreign currency translation attributable to non- controlling interests (5.6) (0.2)
Other comprehensive income/(loss) for the year, net of tax (106.6) 1.7
Total comprehensive loss for the year (406.7) (387.9)
Total comprehensive loss attributable to: Non-controlling interests (37.9) (51.4) Members of the parent (368.8) (336.5)
(406.7) (387.9)
The above Consolidated Statement of Comprehensive Income should be read in conjunction with the accompanying notes.
For
per
sona
l use
onl
y

92
PALADIN ENERGY LTD AND CONTROLLED ENTITIES CONSOLIDATED STATEMENT OF FINANCIAL POSITION
AS AT 30 JUNE 2015
EXPRESSED IN US DOLLARS
Notes 2015 US$M
2014 US$M
ASSETS Current assets Cash and cash equivalents 6 183.7 88.8 Trade and other receivables 16 9.5 198.7 Prepayments 2.9 3.3 Inventories 17 75.3 78.1 Assets classified as held for sale 18 2.8 3.8
TOTAL CURRENT ASSETS 274.2 372.7
Non current assets Trade and other receivables 16 0.6 1.0 Inventories 17 156.3 160.2 Other financial assets 19 2.6 6.6 Property, plant and equipment 20 273.7 281.8 Mine development 21 43.0 43.9 Exploration and evaluation expenditure 22 337.9 687.3 Intangible assets 23 11.7 12.2
TOTAL NON CURRENT ASSETS 825.8 1,193.0
TOTAL ASSETS 1,100.0 1,565.7
LIABILITIES Current liabilities Trade and other payables 24 30.4 39.3 Interest bearing loans and borrowings 7 8.5 39.4 Provisions 25 3.5 5.5
TOTAL CURRENT LIABILITIES 42.4 84.2
Non current liabilities Interest bearing loans and borrowings 7 427.3 590.2 Other Interest bearing loans - CNNC 8 98.7 96.0 Deferred tax liabilities 13 47.9 90.2 Provisions 25 85.4 72.7 Unearned revenue 26 200.0 200.0
TOTAL NON CURRENT LIABILITIES 859.3 1,049.1 TOTAL LIABILITIES 901.7 1,133.3
NET ASSETS 198.3 432.4
EQUITY Contributed equity 9 2,094.9 1,926.9 Reserves 9 61.1 161.9 Accumulated losses (1,901.7) (1,633.9)
Parent interests 254.3 454.9 Non-controlling interests 32 (56.0) (22.5)
TOTAL EQUITY 198.3 432.4
The above Consolidated Statement of Financial Position should be read in conjunction with the accompanying notes.
For
per
sona
l use
onl
y

93
PALADIN ENERGY LTD AND CONTROLLED ENTITIES CONSOLIDATED STATEMENT OF CHANGES IN EQUITY
FOR THE YEAR ENDED 30 JUNE 2015 EXPRESSED IN US DOLLARS
Contributed Equity US$M
Available -for-Sale Reserve
US$M
Share-Based
Payments Reserve
US$M
Convertible Bond Non-
Distrib-utable
Reserve US$M
Foreign Currency
Revaluation Reserve
US$M
Premium on
Acquisition Reserve
US$M
Option Application
Reserve US$M
Consol-idation
Reserve US$M
Accumu-lated
Losses US$M
Attributable to Owners
of the Parent US$M
Non-Controlling
Interests US$M
Total US$M
Balance at 1 July 2013 1,845.7 (4.2) 50.2 85.5 (39.7) 14.9 0.1 (0.2) (1,295.5) 656.8 (8.6) 648.2
Loss for the period - - - - - - - - (338.4) (338.4) (51.2) (389.6) Other comprehensive income/(loss) - 0.6 - - 1.3 - - - - 1.9 (0.2) 1.7
Total comprehensive income/ (loss) for the year net of tax - 0.6 - - 1.3 - - - (338.4) (336.5) (51.4) (387.9) Share-based payment - - 0.5 - - - - - - 0.5 - 0.5 Vesting performance rights 3.1 - (3.1) - - - - - - - - - Contributions of equity, net of transaction costs 78.1 - - - - - - - - 78.1 - 78.1 Allotment of interest in Paladin (Africa) to Govt of Malawi to maintain 15% shareholding - - - - - - - (6.7) - (6.7) 6.7 - Sale of 25% interest in Langer Heinrich to CNNC - - - - - - - 62.7 - 62.7 30.8 93.5
Balance at 30 June 2014 1,926.9 (3.6) 47.6 85.5 (38.4) 14.9 0.1 55.8 (1,633.9) 454.9 (22.5) 432.4
Loss for the period - - - - - - - - (267.8) (267.8) (32.3) (300.1) Other comprehensive income/(loss) - (1.8) - - (99.2) - - - - (101.0) (5.6) (106.6)
Total comprehensive income/ (loss) for the year net of tax - (1.8) - - (99.2) - - - (267.8) (368.8) (37.9) (406.7) Share-based payment - - 0.6 - - - - - - 0.6 - 0.6 Vesting performance rights 1.8 - (1.8) - - - - - - - - - Contributions of equity, net of transaction costs 166.2 - - - - - - - - 166.2 - 166.2 Convertible bond, equity component – net of transaction costs - - - 16.0 - - - - - 16.0 - 16.0 Convertible bond, buy back - - - (7.2) - - - - - (7.2) - (7.2) Allotment of interest in Paladin (Africa) to Govt of Malawi to maintain 15% shareholding - - - - - - - (4.4) - (4.4) 4.4 - Sale of 25% interest in Langer Heinrich to CNNC - - - - - - - (3.0) - (3.0) - (3.0)
Balance at 30 June 2015 2,094.9 (5.4) 46.4 94.3 (137.6) 14.9 0.1 48.4 (1,901.7) 254.3 (56.0) 198.3
The above Consolidated Statement of Changes in Equity should be read in conjunction with the accompanying notes.
For
per
sona
l use
onl
y

94
PALADIN ENERGY LTD AND CONTROLLED ENTITIES
CONSOLIDATED STATEMENT OF CASH FLOWS
FOR THE YEAR ENDED 30 JUNE 2015
EXPRESSED IN US DOLLARS
Notes 2015 US$M
2014 US$M
CASH FLOWS FROM OPERATING ACTIVITIES Receipts from customers 215.4 370.3 Payments to suppliers and employees (210.9) (326.3) Interest received 0.9 0.7 Interest paid (29.7) (33.0) Exploration and evaluation expenditure (1.6) (1.7) Other income 1.2 0.1 NET CASH (OUTFLOW)/INFLOW FROM OPERATING ACTIVITIES 15 (24.7) 10.1
CASH FLOWS FROM INVESTING ACTIVITIES Capitalised exploration expenditure (4.2) (5.8) Payments for property, plant and equipment (11.5) (20.3) Payments for available-for-sale investments (0.2) - Proceeds from sale of property, plant & equipment - 0.4 Proceeds from sale of available-for-sale investments 0.3 0.4
NET CASH OUTFLOW FROM INVESTING ACTIVITIES (15.6) (25.3)
CASH FLOWS FROM FINANCING ACTIVITIES Repayment of convertible bonds (300.0) - Proceeds from convertible bonds 150.0 - Convertible bond finance costs (4.2) - Share placement 52.7 80.7 Proceeds from entitlement issue 119.7 - Equity fundraising costs (6.2) (2.5) Project finance facility establishment costs (1.5) (3.1) Repayment of borrowings (39.9) (178.8) Proceeds from borrowings - 110.0 Costs from sale of non-controlling interest (3.0) - Proceeds from sale of non-controlling interest 170.0 20.0
NET CASH INFLOW FROM FINANCING ACTIVITIES 137.6 26.3
NET INCREASE IN CASH AND CASH EQUIVALENTS 97.3 11.1
Cash and cash equivalents at the beginning of the financial year 88.8 78.1 Effects of exchange rate changes on cash and cash equivalents (2.4) (0.4) CASH AND CASH EQUIVALENTS AT THE END OF THE FINANCIAL YEAR 6 183.7 88.8
The above Consolidated Statement of Cash Flows should be read in conjunction with the accompanying notes.
For
per
sona
l use
onl
y
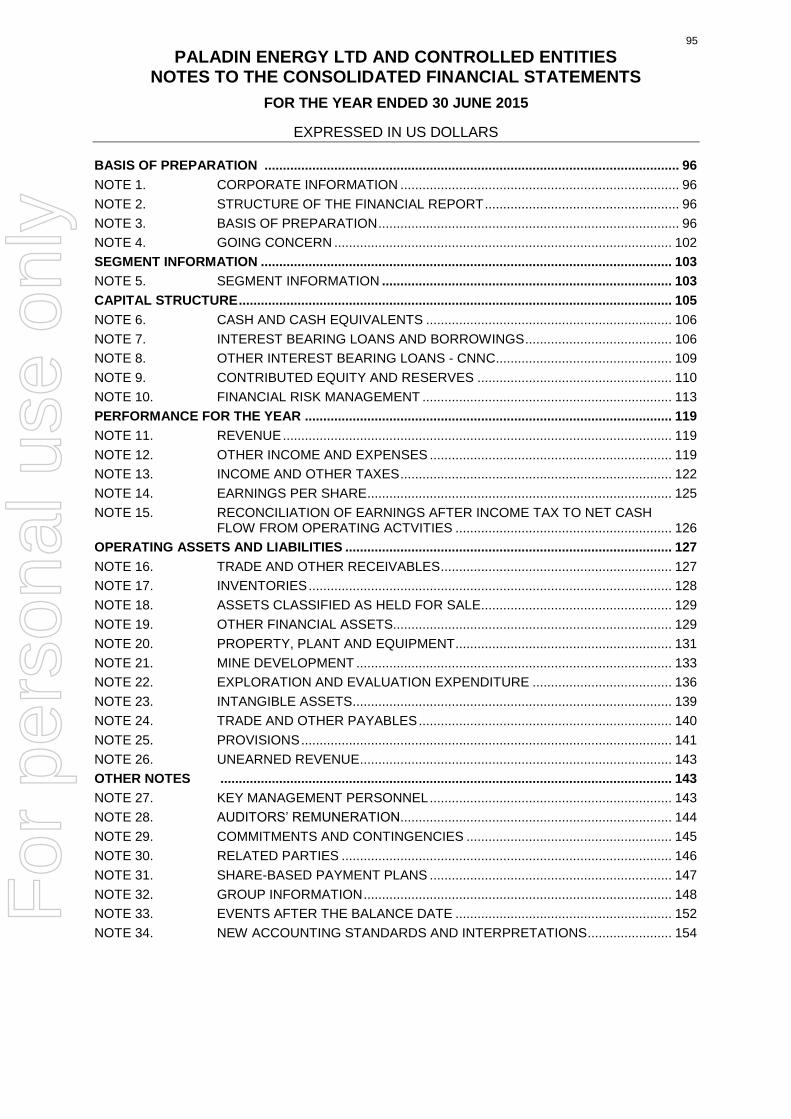
95
PALADIN ENERGY LTD AND CONTROLLED ENTITIES NOTES TO THE CONSOLIDATED FINANCIAL STATEMENTS
FOR THE YEAR ENDED 30 JUNE 2015
EXPRESSED IN US DOLLARS
BASIS OF PREPARATION ................................................................................................................. 96
NOTE 1. CORPORATE INFORMATION ............................................................................ 96
NOTE 2. STRUCTURE OF THE FINANCIAL REPORT ..................................................... 96
NOTE 3. BASIS OF PREPARATION .................................................................................. 96
NOTE 4. GOING CONCERN ............................................................................................ 102
SEGMENT INFORMATION ................................................................................................................ 103
NOTE 5. SEGMENT INFORMATION ............................................................................... 103
CAPITAL STRUCTURE ...................................................................................................................... 105
NOTE 6. CASH AND CASH EQUIVALENTS ................................................................... 106
NOTE 7. INTEREST BEARING LOANS AND BORROWINGS ........................................ 106
NOTE 8. OTHER INTEREST BEARING LOANS - CNNC................................................ 109
NOTE 9. CONTRIBUTED EQUITY AND RESERVES ..................................................... 110
NOTE 10. FINANCIAL RISK MANAGEMENT .................................................................... 113
PERFORMANCE FOR THE YEAR .................................................................................................... 119
NOTE 11. REVENUE .......................................................................................................... 119
NOTE 12. OTHER INCOME AND EXPENSES .................................................................. 119
NOTE 13. INCOME AND OTHER TAXES .......................................................................... 122
NOTE 14. EARNINGS PER SHARE ................................................................................... 125
NOTE 15. RECONCILIATION OF EARNINGS AFTER INCOME TAX TO NET CASH FLOW FROM OPERATING ACTVITIES ........................................................... 126
OPERATING ASSETS AND LIABILITIES ......................................................................................... 127
NOTE 16. TRADE AND OTHER RECEIVABLES ............................................................... 127
NOTE 17. INVENTORIES ................................................................................................... 128
NOTE 18. ASSETS CLASSIFIED AS HELD FOR SALE.................................................... 129
NOTE 19. OTHER FINANCIAL ASSETS............................................................................ 129
NOTE 20. PROPERTY, PLANT AND EQUIPMENT ........................................................... 131
NOTE 21. MINE DEVELOPMENT ...................................................................................... 133
NOTE 22. EXPLORATION AND EVALUATION EXPENDITURE ...................................... 136
NOTE 23. INTANGIBLE ASSETS ....................................................................................... 139
NOTE 24. TRADE AND OTHER PAYABLES ..................................................................... 140
NOTE 25. PROVISIONS ..................................................................................................... 141
NOTE 26. UNEARNED REVENUE ..................................................................................... 143
OTHER NOTES ........................................................................................................................... 143
NOTE 27. KEY MANAGEMENT PERSONNEL .................................................................. 143
NOTE 28. AUDITORS’ REMUNERATION.......................................................................... 144
NOTE 29. COMMITMENTS AND CONTINGENCIES ........................................................ 145
NOTE 30. RELATED PARTIES .......................................................................................... 146
NOTE 31. SHARE-BASED PAYMENT PLANS .................................................................. 147
NOTE 32. GROUP INFORMATION .................................................................................... 148
NOTE 33. EVENTS AFTER THE BALANCE DATE ........................................................... 152
NOTE 34. NEW ACCOUNTING STANDARDS AND INTERPRETATIONS ....................... 154
For
per
sona
l use
onl
y
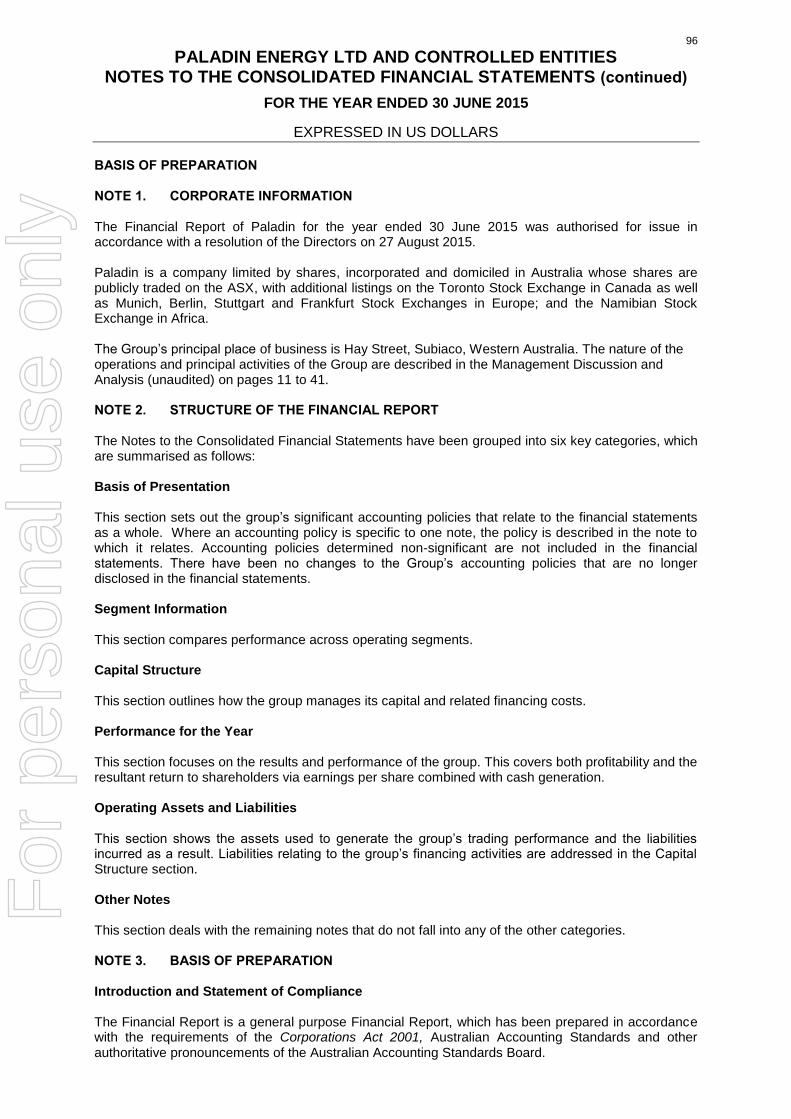
96
PALADIN ENERGY LTD AND CONTROLLED ENTITIES NOTES TO THE CONSOLIDATED FINANCIAL STATEMENTS (continued)
FOR THE YEAR ENDED 30 JUNE 2015
EXPRESSED IN US DOLLARS
BASIS OF PREPARATION NOTE 1. CORPORATE INFORMATION
The Financial Report of Paladin for the year ended 30 June 2015 was authorised for issue in accordance with a resolution of the Directors on 27 August 2015. Paladin is a company limited by shares, incorporated and domiciled in Australia whose shares are publicly traded on the ASX, with additional listings on the Toronto Stock Exchange in Canada as well as Munich, Berlin, Stuttgart and Frankfurt Stock Exchanges in Europe; and the Namibian Stock Exchange in Africa. The Group’s principal place of business is Hay Street, Subiaco, Western Australia. The nature of the operations and principal activities of the Group are described in the Management Discussion and Analysis (unaudited) on pages 11 to 41. NOTE 2. STRUCTURE OF THE FINANCIAL REPORT
The Notes to the Consolidated Financial Statements have been grouped into six key categories, which are summarised as follows: Basis of Presentation This section sets out the group’s significant accounting policies that relate to the financial statements as a whole. Where an accounting policy is specific to one note, the policy is described in the note to which it relates. Accounting policies determined non-significant are not included in the financial statements. There have been no changes to the Group’s accounting policies that are no longer disclosed in the financial statements. Segment Information This section compares performance across operating segments. Capital Structure This section outlines how the group manages its capital and related financing costs. Performance for the Year This section focuses on the results and performance of the group. This covers both profitability and the resultant return to shareholders via earnings per share combined with cash generation. Operating Assets and Liabilities This section shows the assets used to generate the group’s trading performance and the liabilities incurred as a result. Liabilities relating to the group’s financing activities are addressed in the Capital Structure section. Other Notes This section deals with the remaining notes that do not fall into any of the other categories. NOTE 3. BASIS OF PREPARATION Introduction and Statement of Compliance The Financial Report is a general purpose Financial Report, which has been prepared in accordance with the requirements of the Corporations Act 2001, Australian Accounting Standards and other authoritative pronouncements of the Australian Accounting Standards Board.
For
per
sona
l use
onl
y
97
PALADIN ENERGY LTD AND CONTROLLED ENTITIES NOTES TO THE CONSOLIDATED FINANCIAL STATEMENTS (continued)
FOR THE YEAR ENDED 30 JUNE 2015
EXPRESSED IN US DOLLARS
NOTE 3. BASIS OF PREPARATION (continued) The Financial Report complies with International Financial Reporting Standards as issued by the International Accounting Standards Board. The Financial Report has also been prepared on a historical cost basis, except for available-for-sale investments, which have been measured at fair value. Where necessary, comparatives have been reclassified and repositioned for consistency with current year disclosures. For the purposes of preparing the consolidated financial statements, the Company is a for-profit entity. In addition to these Australian requirements further information has been included in the Consolidated Financial Statements for the year ended 30 June 2015 in order to comply with applicable Canadian securities law, as the Company is listed on the Toronto Stock Exchange. The Financial Report is presented in US dollars and all values are rounded to the nearest hundred thousand dollars (US$100,000) unless otherwise stated under the option available to the Company under Australian Securities and Investments Commission (ASIC) Class Order 98/100. The Company is an entity to which the class order applies. Changes in Accounting Policies Apart from the changes in accounting policies noted below, the accounting policies adopted are consistent with those disclosed in the Financial Report for the year ended 30 June 2014. New Accounting Standards and Interpretations The Group has adopted all new and amended Australian Accounting Standards and AASB Interpretations effective from 1 July 2014. The nature and impact of each new standard and amendment is described below:
Reference Title Impact
AASB 2013-3 Amendments to AASB 136 – Recoverable Amount Disclosures for Non-Financial Assets AASB 2013-3 amends the disclosure requirements in AASB 136 Impairment of Assets. The amendments include the requirement to disclose additional information about the fair value measurement when the recoverable amount of
impaired assets is based on fair value less costs of disposal.
There was no material impact on the Annual Report.
AASB 1031 Materiality The revised AASB 1031 is an interim standard that cross-references to other Standards and the Framework (issued December 2013) that contain guidance on materiality. AASB 1031 will be withdrawn when references to AASB 1031 in all Standards and Interpretations have been removed. AASB 2014-1 Part C issued in June 2014 makes amendments to eight Australian Accounting Standards to delete their references to AASB 1031. The amendments are effective from 1 July 2014.
No adjustments to any of the carrying amounts in the financial statements were required as a result of the adoption of AASB 1031.
For
per
sona
l use
onl
y

98
PALADIN ENERGY LTD AND CONTROLLED ENTITIES NOTES TO THE CONSOLIDATED FINANCIAL STATEMENTS (continued)
FOR THE YEAR ENDED 30 JUNE 2015
EXPRESSED IN US DOLLARS
NOTE 3. BASIS OF PREPARATION (continued) New Accounting Standards and Interpretations (continued)
Reference Title Impact
AASB 2014-1 Part A -Annual Improvements
2010–2012 Cycle
AASB 2014-1 Part A: This standard sets out amendments to Australian Accounting Standards arising from the issuance by the International Accounting Standards Board (IASB) of International Financial Reporting Standards (IFRSs) Annual Improvements to IFRSs 2010–2012 Cycle and Annual Improvements to IFRSs 2011–2013 Cycle. Annual Improvements to IFRSs 2010–2012 Cycle addresses the following items: ► AASB 2 - Clarifies the definition of 'vesting conditions' and 'market condition' and introduces the definition of 'performance condition' and 'service condition'. ► AASB 3 - Clarifies the classification requirements for contingent consideration in a business combination by removing all references to AASB 137. ► AASB 8 - Requires entities to disclose factors used to identify the entity's reportable segments when operating segments have been aggregated. An entity is also required to provide a reconciliation of total reportable segment assets to the entity's total assets. ► AASB 116 & AASB 138 - Clarifies that the determination of accumulated depreciation does not depend on the selection of the valuation technique and that it is calculated as the difference between the gross and net carrying amounts. ► AASB 124 - Defines a management entity providing KMP services as a related party of the reporting entity. The amendments added an exemption from the detailed disclosure requirements in paragraph 17 of AASB 124 Related Party Disclosures for KMP services provided by a management entity. Payments made to a management entity in respect of KMP services should be separately disclosed.
There was no material impact on the Annual Report.
For
per
sona
l use
onl
y

99
PALADIN ENERGY LTD AND CONTROLLED ENTITIES NOTES TO THE CONSOLIDATED FINANCIAL STATEMENTS (continued)
FOR THE YEAR ENDED 30 JUNE 2015
EXPRESSED IN US DOLLARS
NOTE 3. BASIS OF PREPARATION (continued)
New Accounting Standards and Interpretations (continued) Basis of Consolidation
The consolidated financial statements comprise the financial statements of Paladin Energy Ltd and its subsidiaries as at 30 June 2015 (the Group).
Control is achieved when the Group is exposed, or has rights, to variable returns from its involvement with the investee and has the ability to affect those returns through its power over the investee. Specifically, the Group controls an investee if and only if the Group has:
Power over the investee (i.e. existing rights that give it the current ability to direct the relevant activities of the investee);
Exposure, or rights, to variable returns from its involvement with the investee; and
The ability to use its power over the investee to affect its returns.
When the Group has less than a majority of the voting or similar rights of an investee, the Group considers all relevant facts and circumstances in assessing whether it has power over an investee, including:
The contractual arrangement with the other vote holders of the investee
Rights arising from other contractual arrangements
The Group’s voting rights and potential voting rights
The Group re-assesses whether or not it controls an investee if facts and circumstances indicate that there are changes to one or more of the three elements of control. Consolidation of a subsidiary begins when the Group obtains control over the subsidiary and ceases when the Group loses control of the subsidiary. Assets, liabilities, income and expenses of a subsidiary acquired or disposed of during the year are included in the statement of comprehensive income from the date the Group gains control until the date the Group ceases to control the subsidiary.
Profit or loss and each component of other comprehensive income (OCI) are attributed to the equity holders of the parent of the Group and to the non-controlling interests, even if this results in the non-controlling interests having a deficit balance. When necessary, adjustments are made to the financial statements of subsidiaries to bring their accounting policies into line with the Group’s accounting policies. All intra-group assets and liabilities, equity, income, expenses and cash flows relating to transactions between members of the Group are eliminated in full on consolidation.
A change in the ownership interest of a subsidiary, without a loss of control, is accounted for as an equity transaction. If the Group loses control over a subsidiary, it:
De-recognises the assets (including goodwill) and liabilities of the subsidiary
De-recognises the carrying amount of any non-controlling interests
De-recognises the cumulative translation differences recorded in equity
Recognises the fair value of the consideration received
Recognises the fair value of any investment retained
Recognises any surplus or deficit in profit or loss
Reclassifies the parent’s share of components previously recognised in OCI to profit or loss or retained earnings, as appropriate, as would be required if the Group had directly disposed of the related assets or liabilities
Business combinations are accounted for using the acquisition method. For
per
sona
l use
onl
y

100
PALADIN ENERGY LTD AND CONTROLLED ENTITIES NOTES TO THE CONSOLIDATED FINANCIAL STATEMENTS (continued)
FOR THE YEAR ENDED 30 JUNE 2015
EXPRESSED IN US DOLLARS
NOTE 3. BASIS OF PREPARATION (continued) Foreign Currency Translation Functional and Presentation Currency
Items included in the Financial Statements of each of the Group's entities are measured using the currency of the primary economic environment in which the entity operates ('the functional currency'). The Consolidated Financial Statements are presented in United States dollars (US dollars), which is the Company’s functional and presentation currency. Transactions and Balances Foreign currency transactions are converted into the functional currency using the exchange rates prevailing at the dates of the transactions. Foreign exchange gains and losses resulting from the settlement of such transactions and from the translation at year-end exchange rates of monetary assets and liabilities denominated in foreign currencies are recognised in the Income Statement. Translation differences on available-for-sale financial assets are included in the available-for-sale reserve. Group Companies Some Group entities have a functional currency of US dollars which is consistent with the Company’s functional and presentational currency. For all other Group entities the functional currency has been translated into US dollars for presentation purposes. Assets and liabilities are translated using exchange rates prevailing at the balance date; revenues and expenses are translated using average exchange rates prevailing for the income statement year; and equity transactions are translated at exchange rates prevailing at the dates of transactions. The resulting difference from translation is recognised in a foreign currency translation reserve. Upon the sale of a subsidiary the Functional Currency Translation Reserve (FCTR) attributable to the parent is recycled to the Income Statement. The following material operating subsidiaries have a US dollar functional currency:
Paladin Finance Pty Ltd
Paladin (Africa) Limited
Langer Heinrich Uranium (Pty) Ltd
Paladin Nuclear Ltd
For
per
sona
l use
onl
y
101
PALADIN ENERGY LTD AND CONTROLLED ENTITIES NOTES TO THE CONSOLIDATED FINANCIAL STATEMENTS (continued)
FOR THE YEAR ENDED 30 JUNE 2015
EXPRESSED IN US DOLLARS
NOTE 3. BASIS OF PREPARATION (continued) Foreign Currency Translation (continued) The following material operating subsidiaries have an Australian dollar functional currency:
Northern Territory Uranium Pty Ltd
Mount Isa Uranium Pty Ltd
Paladin Energy Minerals NL
Summit Resources (Aust) Pty Ltd
Fusion Resources Pty Ltd
The following material operating subsidiaries have a Canadian dollar functional currency:
Aurora Energy Ltd
Michelin Uranium Ltd
Paladin Canada Holdings (NL) Ltd
Paladin Canada Investments (NL) Ltd Significant Accounting Judgements, Estimates and Assumptions The preparation of the Group’s consolidated financial statements requires management to make judgements, estimates and assumptions that affect the reported amounts of revenues, expenses, assets and liabilities, and the accompanying disclosures, and the disclosure of contingent liabilities. Uncertainty about these assumptions and estimates could result in outcomes that require a material adjustment to the carrying amount of assets or liabilities affected in future periods. The carrying amounts of certain assets and liabilities are often determined based on estimates and assumptions of future events. The key estimates and assumptions, that have a significant risk of causing a material adjustment to the carrying amounts of certain assets and liabilities within the next annual reporting period, are dealt with elsewhere in the notes.
For
per
sona
l use
onl
y

102
PALADIN ENERGY LTD AND CONTROLLED ENTITIES NOTES TO THE CONSOLIDATED FINANCIAL STATEMENTS (continued)
FOR THE YEAR ENDED 30 JUNE 2015
EXPRESSED IN US DOLLARS
NOTE 4. GOING CONCERN As at 30 June 2015, the Group had a net working capital surplus of US$231.8M (30 June 2014: US$288.5M), including cash on hand of US$183.7M (30 June 2014: US$88.8M). Included within this cash on hand is US$31.2M (30 June 2014: US$13.2M), which is restricted for use in respect of the LHM syndicated loan facility and supplier guarantees provided by LHM. The amount outstanding at 30 June 2015 on the syndicated loan facility was US$60.9M. Repayment obligations during the next twelve months to 30 June 2016 in respect of interest bearing loans and borrowings are summarised as follows: • secured bank loan principal repayments of US$9.1M for syndicated loan facility; and • interest payments of US$29.7M for syndicated loan facility and 2012 (due 2017) and 2015 (due 2020) unsecured convertible bonds. In December 2014, the Group successfully completed an equity capital raising of A$205M (US$172.4M) through the introduction of a strategic investor, together with completion of a well-supported entitlement offer. On 31 March 2015, the Company issued a US$150M convertible bond with a coupon rate of 7.00% maturing on 31 March 2020 and a conversion price of US$0.356 for Company shares. US$100M was issued to high quality institutional investors, whilst US$50M was issued to Leader Investment Corporation, a controlled subsidiary of CIC, one of the largest sovereign wealth funds in the world. The issue was approved by shareholders on 30 March 2015. The proceeds from the convertible bond issue, along with the existing cash balance, were used to fund a concurrent tender offer to acquire the outstanding US$300M convertible bonds due November 2015, issued by the Company on 4 November 2010. At the date of this report, the Directors are satisfied there are reasonable grounds to believe that, having regard to the Group’s position and its available financing options, the Group will be able to meet its obligations as and when they fall due.
For
per
sona
l use
onl
y

103
PALADIN ENERGY LTD AND CONTROLLED ENTITIES NOTES TO THE CONSOLIDATED FINANCIAL STATEMENTS (continued)
FOR THE YEAR ENDED 30 JUNE 2015
EXPRESSED IN US DOLLARS
SEGMENT INFORMATION
NOTE 5. SEGMENT INFORMATION Identification of Reportable Segments The Company has identified its operating segments to be Exploration, Namibia and Malawi, on the basis of the nature of the activity and geographical location and different regulatory environments. The main segment activity in Namibia and Malawi(1) is the production and sale of uranium from the mines located in these geographic regions. The Exploration segment is focused on developing exploration and evaluation projects in Australia, Niger and Canada. Unallocated portion covers the Company’s sales and marketing, treasury, corporate and administration. Discrete financial information about each of these operating segments is reported to the Group’s executive management team (chief operating decision makers) on at least a monthly basis. The accounting policies used by the Group in reporting segments internally are the same as those contained in the accounts and in the prior period. Inter-entity sales are priced with reference to the spot rate. Corporate charges comprise non-segmental expenses such as corporate office expenses. A proportion of the corporate charges are allocated to Namibia and Malawi on the basis of timesheet allocations with the balance remaining in Unallocated. The Group’s customers are major utilities and other entities located mainly in USA, Australia, China, Taiwan and UK. These revenues are attributed to the geographic location of the mines being the reporting segments Namibia and Malawi. (1) Currently on care and maintenance due to low uranium price. Production ceased on 6 May 2014.
For
per
sona
l use
onl
y

104
PALADIN ENERGY LTD AND CONTROLLED ENTITIES NOTES TO THE CONSOLIDATED FINANCIAL STATEMENTS (continued)
FOR THE YEAR ENDED 30 JUNE 2015
EXPRESSED IN US DOLLARS
NOTE 5. SEGMENT INFORMATION (continued) The following tables present revenue, expenditure and asset information regarding operating segments for the years ended 30 June 2015 and 30 June 2014.
Year ended 30 June 2015
Exploration US$M
Namibia US$M
Malawi US$M
Unallocated US$M
Consolidated US$M
Sales to external customers - 191.9 6.7 - 198.6 Other revenue - - - 0.9 0.9
Total consolidated revenue - 191.9 6.7 0.9 199.5
Cost of goods sold - (182.9) (6.8) - (189.7) Impairment of Inventory - (8.0) - - (8.0)
Gross profit - 1.0 (0.1) 0.9 1.8 Other expenses (1.5) (2.2) (23.6) (12.9) (40.2) Impairment of asset (237.5) - - (3.9) (241.4) Write off of Exploration and evaluation (1.4) - - - (1.4)
Segment (loss)/profit before income tax and finance costs
(240.4)
(1.2)
(23.7)
(15.9)
(281.2)
Finance costs - (10.2) (2.2) (44.6) (57.0)
(Loss)/profit before income tax (240.4) (11.4) (25.9) (60.5) (338.2) Income tax benefit/(expense) 72.1 (17.0) - (17.0) 38.1
Loss after income tax (168.3) (28.4) (25.9) (77.5) (300.1)
At 30 June 2015
Segment assets/total assets 340.9 622.8 12.6 123.7(1) 1,100.0
Australia
US$M Canada
US$M Namibia
US$M Other US$M
Consolidated US$M
Non current assets (excluding financial instruments) by country
111.1
231.1
481.0
-
823.2
In 2015, the three most significant customers equated on a proportionate basis to 25% (US$50.2M Namibia), 22% (US$44.6M Namibia) and 14% (US$27.5M Namibia, Malawi) of the Group’s total sales revenue. (1) Includes US$116.0 M in cash and cash equivalents and US$2.6M available-for-sale financials assets (refer to
Note 19).
For
per
sona
l use
onl
y
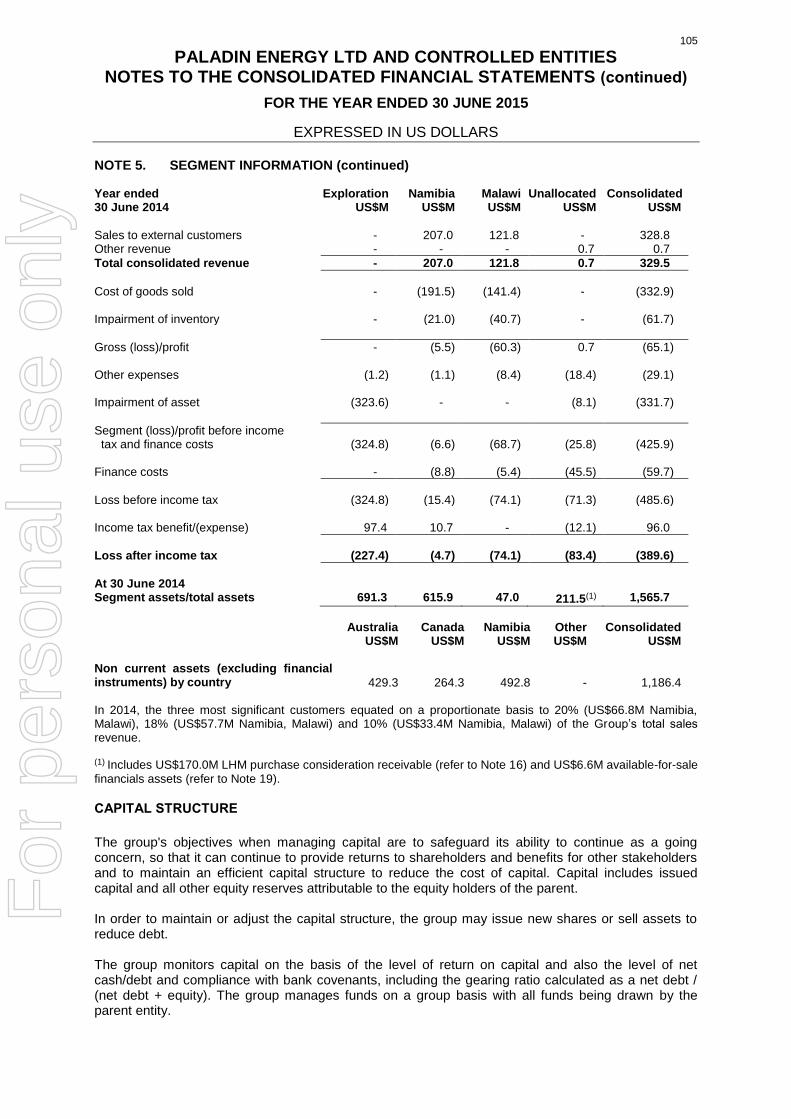
105
PALADIN ENERGY LTD AND CONTROLLED ENTITIES NOTES TO THE CONSOLIDATED FINANCIAL STATEMENTS (continued)
FOR THE YEAR ENDED 30 JUNE 2015
EXPRESSED IN US DOLLARS
NOTE 5. SEGMENT INFORMATION (continued) Year ended 30 June 2014
Exploration US$M
Namibia US$M
Malawi US$M
Unallocated US$M
Consolidated US$M
Sales to external customers - 207.0 121.8 - 328.8 Other revenue - - - 0.7 0.7
Total consolidated revenue - 207.0 121.8 0.7 329.5
Cost of goods sold - (191.5) (141.4) - (332.9) Impairment of inventory - (21.0) (40.7) - (61.7)
Gross (loss)/profit - (5.5) (60.3) 0.7 (65.1) Other expenses (1.2) (1.1) (8.4) (18.4) (29.1) Impairment of asset (323.6) - - (8.1) (331.7)
Segment (loss)/profit before income tax and finance costs
(324.8)
(6.6)
(68.7)
(25.8)
(425.9)
Finance costs - (8.8) (5.4) (45.5) (59.7)
Loss before income tax (324.8) (15.4) (74.1) (71.3) (485.6) Income tax benefit/(expense) 97.4 10.7 - (12.1) 96.0
Loss after income tax (227.4) (4.7) (74.1) (83.4) (389.6)
At 30 June 2014
Segment assets/total assets 691.3 615.9 47.0 211.5(1) 1,565.7
Australia
US$M Canada
US$M Namibia
US$M Other US$M
Consolidated US$M
Non current assets (excluding financial instruments) by country
429.3
264.3
492.8
-
1,186.4
In 2014, the three most significant customers equated on a proportionate basis to 20% (US$66.8M Namibia, Malawi), 18% (US$57.7M Namibia, Malawi) and 10% (US$33.4M Namibia, Malawi) of the Group’s total sales revenue. (1) Includes US$170.0M LHM purchase consideration receivable (refer to Note 16) and US$6.6M available-for-sale
financials assets (refer to Note 19). CAPITAL STRUCTURE
The group's objectives when managing capital are to safeguard its ability to continue as a going concern, so that it can continue to provide returns to shareholders and benefits for other stakeholders and to maintain an efficient capital structure to reduce the cost of capital. Capital includes issued capital and all other equity reserves attributable to the equity holders of the parent. In order to maintain or adjust the capital structure, the group may issue new shares or sell assets to reduce debt. The group monitors capital on the basis of the level of return on capital and also the level of net cash/debt and compliance with bank covenants, including the gearing ratio calculated as a net debt / (net debt + equity). The group manages funds on a group basis with all funds being drawn by the parent entity.
For
per
sona
l use
onl
y

106
PALADIN ENERGY LTD AND CONTROLLED ENTITIES NOTES TO THE CONSOLIDATED FINANCIAL STATEMENTS (continued)
FOR THE YEAR ENDED 30 JUNE 2015
EXPRESSED IN US DOLLARS
NOTE 6. CASH AND CASH EQUIVALENTS 2015
US$M 2014 US$M
Cash at bank and on hand 3.1 10.3 Short-term bank deposits 180.6 78.5
Total cash and cash equivalents 183.7 88.8
Total cash and cash equivalents includes US$31.2M (2014: US$13.2M) restricted for use in respect of the project finance facilities (refer to Note 7) and supplier guarantees provided by LHM. Recognition and measurement Cash and cash equivalents includes cash on hand, deposits held at call with financial institutions, other short-term, highly liquid investments with original maturities of three months or less that are readily convertible to known amounts of cash and which are subject to an insignificant risk of changes in value, and bank overdrafts. Cash at bank earns interest at floating rates based on daily bank deposit rates. Short-term deposits are made for varying periods depending on the immediate cash requirements of the Group, and earn interest at the respective short-term deposit rates.
NOTE 7. INTEREST BEARING LOANS AND BORROWINGS
Maturity 2015 US$M
2014 US$M
Current Secured bank loans 8.5 39.4
Total current interest bearing loans and borrowings 8.5 39.4
Non Current Unsecured convertible bonds(1) 2015
2017 - 285.8
Unsecured convertible bonds(2) 254.3 245.0 Unsecured convertible bonds(3) 2020 123.4 - Secured bank loan amortised to 2019 49.6 59.4
Total non current interest bearing loans and borrowings 427.3 590.2
The above figures include transaction costs which offset the balance in accordance with the requirements of Accounting Standards. Fair value disclosures
Details of the fair value of the Group’s interest bearing liabilities are set out in Note 10. Unsecured convertible bonds (1)
On the 5 November 2010, the Company issued US$300M in convertible bonds with a coupon rate of 3.625%, (underlying effective interest rate of 7.47%) maturing on 5 November 2015 with a conversion price of US$4.688, for Company shares. On 2 April 2015, US$289.25M bonds were repurchased pursuant to a tender offer concurrent with the issue of US$150M 7.00% convertible bonds due 2020. The US$10.75M bonds, which remained outstanding following settlement of the tender offer, were redeemed through the exercise of the Company’s optional redemption right on 18 May 2015.
For
per
sona
l use
onl
y
107
PALADIN ENERGY LTD AND CONTROLLED ENTITIES NOTES TO THE CONSOLIDATED FINANCIAL STATEMENTS (continued)
FOR THE YEAR ENDED 30 JUNE 2015
EXPRESSED IN US DOLLARS
NOTE 7. INTEREST BEARING LOANS AND BORROWINGS (continued) Unsecured convertible bonds (continued) (2)
On 30 April 2012, the Company issued US$274M in convertible bonds with a coupon rate of 6% (underlying effective interest rate of 10.68%) maturing on 30 April 2017 with a conversion price of US$1.83 for Company shares.
(3)
On 31 March 2015, the Company issued US$150M in convertible bonds with a coupon rate of 7% (underlying effective interest rate of 12.37%) maturing on 31 March 2020 with a conversion price of US$0.356 for Company shares.
Pursuant to the terms of the Bonds the prevailing Conversion Price is subject to adjustment where any new issue of shares is at less than 95% of the Current Market Price. Following the completion of the Institutional Entitlement offer on 4 December 2014 and the Retail Entitlement offer on 17 December 2014, the Conversion Price has been adjusted as follows:
Convertible bonds due 2017: US$1.83 (previously US$2.109) Secured bank loans On 23 July 2014, the Company entered into agreements with its existing lenders to refinance the existing US$110M LHM project finance facility and US$20M working capital facility into a new US$70M Syndicated Facility Agreement. Proceeds from the LHM minority sale were utilised to repay US$30.8M of the existing facility, taking the outstanding balance to US$70M. The Borrower of the new facility remains Paladin Finance Pty Ltd (“PFPL”). The new facility has less security with neither Langer Heinrich Mauritius Holdings Limited (“LHMHL”) nor Langer Heinrich Uranium (Pty) Ltd (“LHU”) granting any security or providing any guarantees to support the new facility. The new facility is secured by a Share Pledge Agreement from PFPL over its 75% interest in LHMHL. The facility has a financial covenant holiday for the first four 6-monthly calculations periods commencing 31 December 2014. The first debt covenant ratios calculation date is 31 December 2016. The new facility is provided by Nedbank Capital, a division of Nedbank Limited, Nedbank Namibia Limited, along with the Standard Bank of South Africa Limited and Standard Bank Namibia Limited. The facility is repayable on a semi-annual basis over the term of the loan (five and a half years) commencing 31 December 2014 with seven instalments of US$4.454M and 3 instalments of US$9.545M and one of US$9.550M and bears interest at the LIBOR plus 5.50%. Under the terms of the facility, 50% of any distributions from LHU to PFPL are repayable to the financiers. At 30 June 2015, US$60.9M (30 June 2014: US$100.8M) was outstanding under the syndicated loan facility. Transaction costs relating to the establishment of the facility totalled US$1.5M (2014: US$3.1M), and have been included as part of interest bearing loans and borrowings. Recognition and measurement Bank loan borrowings are initially recognised at fair value, net of transaction costs incurred. Bank loan borrowings are subsequently measured at amortised cost. Any difference between the proceeds (net of transaction costs) and the redemption amount is recognised in the Income Statement over the period of the borrowings using the effective interest method. Borrowings are classified as current liabilities unless the Group has an unconditional right to defer settlement of the liability for at least 12 months after the balance date.
For
per
sona
l use
onl
y

108
PALADIN ENERGY LTD AND CONTROLLED ENTITIES NOTES TO THE CONSOLIDATED FINANCIAL STATEMENTS (continued)
FOR THE YEAR ENDED 30 JUNE 2015
EXPRESSED IN US DOLLARS
NOTE 7. INTEREST BEARING LOANS AND BORROWINGS (continued) Recognition and measurement (continued) The component of convertible bonds that exhibits characteristics of debt is recognised as a liability in the Statement of Financial Position, net of transaction costs. On issue of convertible bonds, the fair value of the liability component is determined using a market rate for an equivalent non-convertible bond and this amount is carried as a liability on the amortised cost basis until extinguished on conversion or redemption. The increase in the liability due to the passage of time is recognised as a finance cost. The remainder of the proceeds is allocated to the equity component and is recognised in shareholders’ equity. The carrying amount of the equity component is not remeasured in subsequent years. Financing facilities available At reporting date, the following financing facilities had been negotiated and were available:
2015
US$M 2014 US$M
Total facilities: Unsecured convertible bonds 424.0 574.0 Secured bank loans 60.9 130.0
484.9 704.0
Facilities used at reporting date: Unsecured convertible bonds 424.0 574.0 Secured bank loans 60.9 110.0
484.9 684.0
Facilities unused at reporting date: Unsecured convertible bonds - - Secured bank loans - 20.0
The carrying amounts of assets pledged as security for current and non current interest bearing liabilities (secured bank loans) are: Current Floating charge Cash and cash equivalents - 28.0 Trade and other receivables - 19.7 Inventories - 68.7
Total current assets pledged as security - 116.4
Non Current Inventories - 160.2 Property, plant and equipment - 279.6 Mine development - 43.9 Intangible assets - 12.2
Total non current assets pledged as security - 495.9
Total assets pledged as security - 612.3
The syndicated loan facility holds no security over project assets. The new facility is secured by a Share Pledge Agreement from PFPL over its 75% interest in LHMHL.
For
per
sona
l use
onl
y
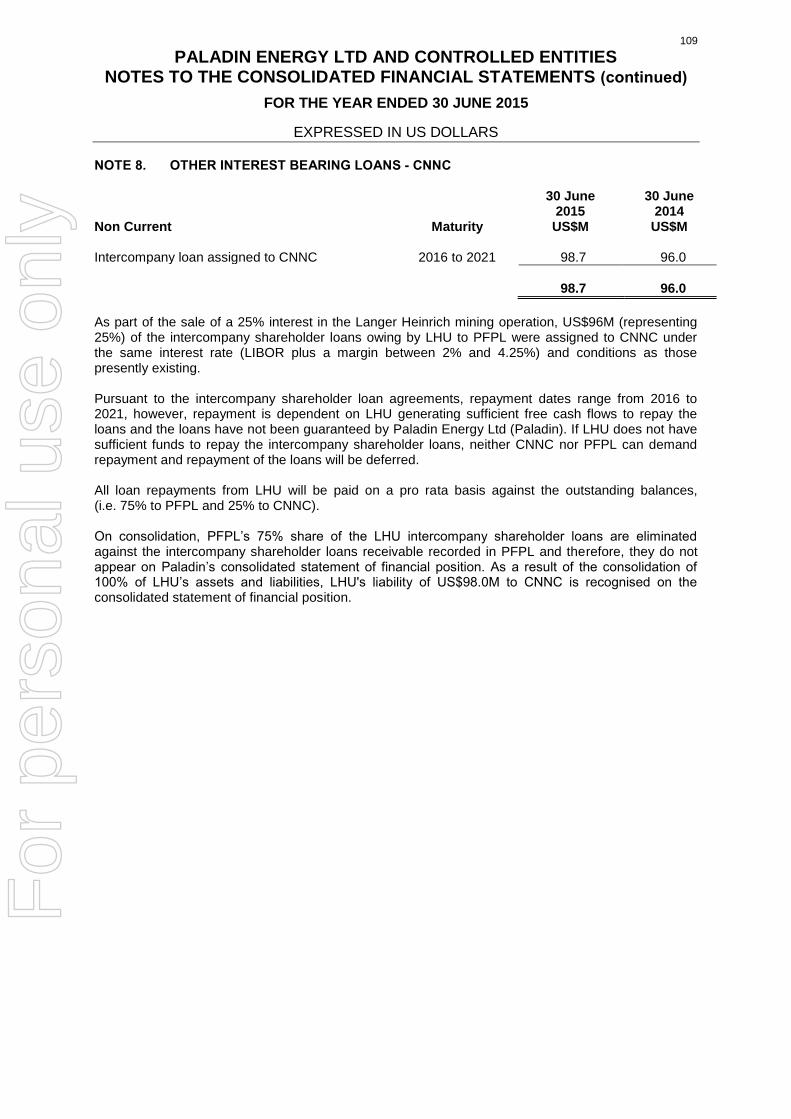
109
PALADIN ENERGY LTD AND CONTROLLED ENTITIES NOTES TO THE CONSOLIDATED FINANCIAL STATEMENTS (continued)
FOR THE YEAR ENDED 30 JUNE 2015
EXPRESSED IN US DOLLARS
NOTE 8. OTHER INTEREST BEARING LOANS - CNNC
Non Current Maturity
30 June 2015 US$M
30 June 2014
US$M Intercompany loan assigned to CNNC 2016 to 2021 98.7 96.0
98.7 96.0
As part of the sale of a 25% interest in the Langer Heinrich mining operation, US$96M (representing 25%) of the intercompany shareholder loans owing by LHU to PFPL were assigned to CNNC under the same interest rate (LIBOR plus a margin between 2% and 4.25%) and conditions as those presently existing. Pursuant to the intercompany shareholder loan agreements, repayment dates range from 2016 to 2021, however, repayment is dependent on LHU generating sufficient free cash flows to repay the loans and the loans have not been guaranteed by Paladin Energy Ltd (Paladin). If LHU does not have sufficient funds to repay the intercompany shareholder loans, neither CNNC nor PFPL can demand repayment and repayment of the loans will be deferred. All loan repayments from LHU will be paid on a pro rata basis against the outstanding balances, (i.e. 75% to PFPL and 25% to CNNC). On consolidation, PFPL’s 75% share of the LHU intercompany shareholder loans are eliminated against the intercompany shareholder loans receivable recorded in PFPL and therefore, they do not appear on Paladin’s consolidated statement of financial position. As a result of the consolidation of 100% of LHU’s assets and liabilities, LHU's liability of US$98.0M to CNNC is recognised on the consolidated statement of financial position.
For
per
sona
l use
onl
y

110
PALADIN ENERGY LTD AND CONTROLLED ENTITIES NOTES TO THE CONSOLIDATED FINANCIAL STATEMENTS (continued)
FOR THE YEAR ENDED 30 JUNE 2015
EXPRESSED IN US DOLLARS
NOTE 9. CONTRIBUTED EQUITY AND RESERVES Issued and Paid Up Capital Number of Shares 2015
2014
2015 US$M
2014 US$M
Ordinary shares Issued and fully paid 1,666,927,668 964,367,284 2,094.9 1,926.9
Fully paid ordinary shares carry one vote per share and carry the right to dividends. Recognition and measurement Ordinary shares are classified as equity. Incremental costs directly attributable to the issue of new shares are shown in equity as a deduction, net of tax, from the proceeds. Movements in Ordinary Shares on Issue
Date Number of Shares Issue
Price A$
Exchange Rate
US$: A$
Total
US$M Balance 30 June 2013 837,187,808 1,845.7
August 2013 Share placement 125,578,171 0.70 1.08998 80.6 September 2013 Rights vested 566,095 - November 2013 Rights vested 786,493 - December 2013 Rights vested 85,437 - January 2014 Rights vested 37,630 - February 2014 Rights vested 125,650 - Transfer from share-
based payments reserve
3.1 Transaction costs (2.5)
Balance 30 June 2014 964,367,284(1) 1,926.9
(1) Includes 1,084 shares held by Paladin Employee Plan Pty Ltd.
September 2014 Rights vested 390,950 - - - September 2014 Rights vested 136,340 - - - November 2014 Rights vested 857,544 - - - November 2014 Share placement 144,862,817 0.42 1.15423 52.7 December 2014 Rights vested 1,003,238 December 2014 Institutional entitlement
offer 191,530,053 0.26 1.18827 41.9
December 2014 Retail entitlement offer 363,779,442 0.26 1.21563 77.8 Transfer from share-
based payments reserves
1.8 Transaction costs (6.2)
Balance 30 June 2015 1,666,927,668(2) 2,094.9
(2) Includes 184 shares held by Paladin Employee Plan Pty Ltd.
For
per
sona
l use
onl
y

111
PALADIN ENERGY LTD AND CONTROLLED ENTITIES NOTES TO THE CONSOLIDATED FINANCIAL STATEMENTS (continued)
FOR THE YEAR ENDED 30 JUNE 2015 EXPRESSED IN US DOLLARS
NOTE 9. CONTRIBUTED EQUITY AND RESERVES (continued) Reserves Consolidation
reserve
US$M
Listed option
application reserve US$M
Share-based
payments reserve US$M
Available -for-sale reserve
US$M
Foreign currency
translation reserve US$M
Convertible bond non-
distributable reserve US$M
Premium on acquisition
reserve
US$M
Total
US$M
At 1 July 2013 (0.2) 0.1 50.2 (4.2) (39.7) 85.5 14.9 106.6 Net unrealised movement on available-for-sale investments
-
-
-
(3.4)
-
-
-
(3.4)
Share-based payments - - (2.6) - - - - (2.6) Foreign currency translation - - - - 1.3 - - 1.3 Transfer of impairment loss to Income Statement
-
-
-
4.3
-
-
-
4.3
Transfer realised gains to other income - - - (0.3) - - - (0.3) Allotment of interest in Paladin (Africa) to Govt of Malawi to maintain 15% shareholding
(6.7)
-
-
-
-
-
-
(6.7)
Sale of 25% interest in Langer Heinrich to CNNC
62.7
-
-
-
-
-
-
62.7
At 30 June 2014 55.8 0.1 47.6 (3.6) (38.4) 85.5 14.9 161.9
Net unrealised movement on available-for-sale investments
-
-
-
(3.7)
-
-
-
(3.7)
Share-based payments - - (1.2) - - - - (1.2) Foreign currency translation - - - - (99.2) - - (99.2) Transfer of impairment loss to Income Statement
-
-
-
2.9
-
-
-
2.9
Transfer realised gains to other income - - - (0.4) - - - (0.4) Income Tax - - - (0.6) - - - (0.6) Convertible bond, equity component – net of transaction costs
-
-
-
-
-
16.0
-
16.0
Convertible bond, buy back - - - - - (7.2) - (7.2) Allotment of interest in Paladin (Africa) to Govt of Malawi to maintain 15% shareholding
(4.4)
-
-
-
-
-
-
(4.4)
Sale of 25% interest in Langer Heinrich to CNNC
(3.0)
-
-
-
-
-
-
(3.0)
At 30 June 2015 48.4 0.1 46.4 (5.4) (137.6) 94.3 14.9 61.1
For
per
sona
l use
onl
y

112
PALADIN ENERGY LTD AND CONTROLLED ENTITIES NOTES TO THE CONSOLIDATED FINANCIAL STATEMENTS (continued)
FOR THE YEAR ENDED 30 JUNE 2015
EXPRESSED IN US DOLLARS
NOTE 9. CONTRIBUTED EQUITY AND RESERVES (continued) Nature and Purpose of Reserves Consolidation reserve
This reserve recognises the difference between the fair value of the 15% interest in PAL allotted to the Government of Malawi, at the net present value of the Kayelekera Project on the date the Development Agreement was signed (22 February 2007), and the non-controlling interest in the net assets of PAL. It also recognises the excess of the proceeds received over the 25% interest in net assets of Langer Heinrich Mauritius Holdings limited and Langer Heinrich Uranium (Pty) Ltd disposed of to China Uranium Corporation Limited, a subsidiary of China National Nuclear Corporation, on 28 June 2014 under the Share Sale Agreement dated 18 January 2014. Listed option application reserve
This reserve consists of proceeds from the issue of listed options, net of expenses of issue. These listed options expired unexercised and no restriction exists for the distribution of this reserve. Share-based payments reserve
This reserve is used to record the value of equity benefits provided to Directors, employees and consultants as part of their remuneration. Refer to Note 31 for further details on share-based payments. Available-for-sale reserve
This reserve records the fair value changes on the available-for-sale financial assets as set out in Note 19. Foreign currency translation reserve
This reserve is used to record exchange differences arising on translation of the group entities that do not have a functional currency of US dollars and have been translated into US dollars for presentation purposes, as described in Note 3. Convertible bond non-distributable reserve
This reserve records the equity portion of the convertible bonds issued as described in Note 7. Acquisition reserve
This reserve represents the premium paid on the acquisition of a non-controlling interest in Summit.
For
per
sona
l use
onl
y

113
PALADIN ENERGY LTD AND CONTROLLED ENTITIES NOTES TO THE CONSOLIDATED FINANCIAL STATEMENTS (continued)
FOR THE YEAR ENDED 30 JUNE 2015
EXPRESSED IN US DOLLARS
NOTE 10. FINANCIAL RISK MANAGEMENT Financial Risk Management Objectives and Policies
The Group’s management of financial risk is aimed at ensuring net cash flows are sufficient to:
meet all its financial commitments; and
maintain the capacity to fund corporate growth activities.
The Group monitors its forecast financial position on a regular basis. Market, liquidity and credit risk (including foreign exchange, commodity price and interest rate risk) arise in the normal course of the Group’s business. These risks are managed under Board approved directives which underpin treasury practices and processes. The Group’s principal financial instruments comprise interest bearing debt, cash and short-term deposits and available for sale financial assets. Other financial instruments include trade receivables and trade payables, which arise directly from operations. The Group’s forecast financial risk position with respect to key financial objectives and compliance with treasury practice is regularly reported to the Board. Market Risk
Foreign Exchange Risk
The Group operates internationally and is exposed to foreign exchange risk arising from various currency exposures. Foreign exchange risk arises from future commitments, assets and liabilities that are denominated in a currency that is not the functional currency of the relevant Group company. The Group’s borrowings and deposits are largely denominated in US dollars. Currently there are no foreign exchange hedge programmes in place. However, the Group treasury function manages the purchase of foreign currency to meet operational requirements.
The financial instruments exposed to movements in the Namibian dollar are as follows:
2015
US$M 2014 US$M
Financial assets Cash and cash equivalents 2.0 6.5 Trade and other receivables 7.0 9.3
9.0 15.8
Financial liabilities Trade and other payables (20.5) (23.7) Net exposure (11.5) (7.9) Based on the Group’s net exposure at the balance date, a reasonably possible change in the exchange rate would not have a material impact on profit or equity.
For
per
sona
l use
onl
y

114
PALADIN ENERGY LTD AND CONTROLLED ENTITIES NOTES TO THE CONSOLIDATED FINANCIAL STATEMENTS (continued)
FOR THE YEAR ENDED 30 JUNE 2015
EXPRESSED IN US DOLLARS
NOTE 10. FINANCIAL RISK MANAGEMENT (continued) Market Risk (continued)
Interest Rate Risk
Interest rate risk is the risk that the Group’s financial position will be adversely affected by movements in interest rates that will increase the cost of floating rate debt or opportunity losses that may arise on fixed rate borrowings in a falling interest rate environment. Interest rate risk on cash and short-term deposits is not considered to be a material risk due to the short-term nature of these financial instruments. The Group’s main interest rate risk arises from long-term debt. Floating rate debt exposes the Group to cash flow interest rate risk and fixed rate debt exposes the Group to fair value interest rate risk. All other financial assets and liabilities in the form of receivables, investments in shares, payables and provisions, are non-interest bearing. The Group currently does not engage in any hedging or derivative transactions to manage interest rate risk. The floating rate financial instruments exposed to interest rates movements are as follows:
2015 US$M
2014 US$M
Financial assets Cash and cash equivalents – short-term deposits 183.7 78.5
Financial liabilities Interest-bearing liabilities (159.7) (196.8)
Net exposure 24.0 (118.3)
Based on the Group’s net exposure at the balance date, a reasonably possible change in LIBOR would not have a material impact on profit or equity.
For
per
sona
l use
onl
y

115
PALADIN ENERGY LTD AND CONTROLLED ENTITIES NOTES TO THE CONSOLIDATED FINANCIAL STATEMENTS (continued)
FOR THE YEAR ENDED 30 JUNE 2015
EXPRESSED IN US DOLLARS
NOTE 10. FINANCIAL RISK MANAGEMENT (continued) Liquidity Risk
The liquidity position of the Group is managed to ensure sufficient liquid funds are available to meet the Group’s financial commitments in a timely and cost effective manner. The Group treasury function continually reviews the Group’s liquidity position including cash flow forecasts to determine the forecast liquidity position and maintain appropriate liquidity levels. Sensitivity analysis is conducted on a range of pricing and market assumptions to ensure the Group has the ability to meet repayment commitments. This enables the Group to manage cash flows on a long-term basis and provides the flexibility to pursue a range of funding alternatives if necessary. Note 7 details the repayment obligations in respect of the amount of the facilities. The maturity analysis of payables at the reporting date was as follows: Payables maturity analysis
2015
Total
US$M
<1 year
US$M
1-2 years
US$M
2-3 years
US$M
>3 years
US$M
Trade and other payables 30.4 30.4 - - - Loans and borrowings 580.9 12.9 283.1 14.1 270.8 Interest payable 113.6 33.4 32.9 16.0 31.3
Total payables 724.9 76.7 316.0 30.1 302.1
2014
Trade and other payables 39.3 39.3 - - - Loans and borrowings 770.8 39.9 312.9 283.1 134.9 Interest payable 100.7 34.2 28.3 22.4 15.8
Total payables 910.8 113.4 341.2 305.5 150.7
Credit Risk Credit risk is the risk that a contracting entity will not complete its obligation under a financial instrument that will result in a financial loss to the Group. The carrying amount of financial assets represents the maximum credit exposure. The Group trades only with recognised, creditworthy third parties. In addition, receivable balances are monitored on an ongoing basis with the result that the Group’s exposure to bad debts is not significant. The maximum exposure to credit risk at the reporting date was a total of US$193.8M (2014 US$288.5M), comprising cash and receivables.
2015
US$M 2014 US$M
Current Cash and cash equivalents* 183.7 88.8 Trade receivables 2.1 18.9 Other receivables – other entities 7.4 179.8
193.2 287.5 Non Current Other receivables – other entities 0.6 1.0 Total 193.8 288.5
* The Group’s maximum deposit with a single financial institution represents 57% (2014: 53%) of cash and cash equivalents. Any cash available to be invested is held with Australian banks with a minimum AA- Standard & Poor’s credit rating.
For
per
sona
l use
onl
y
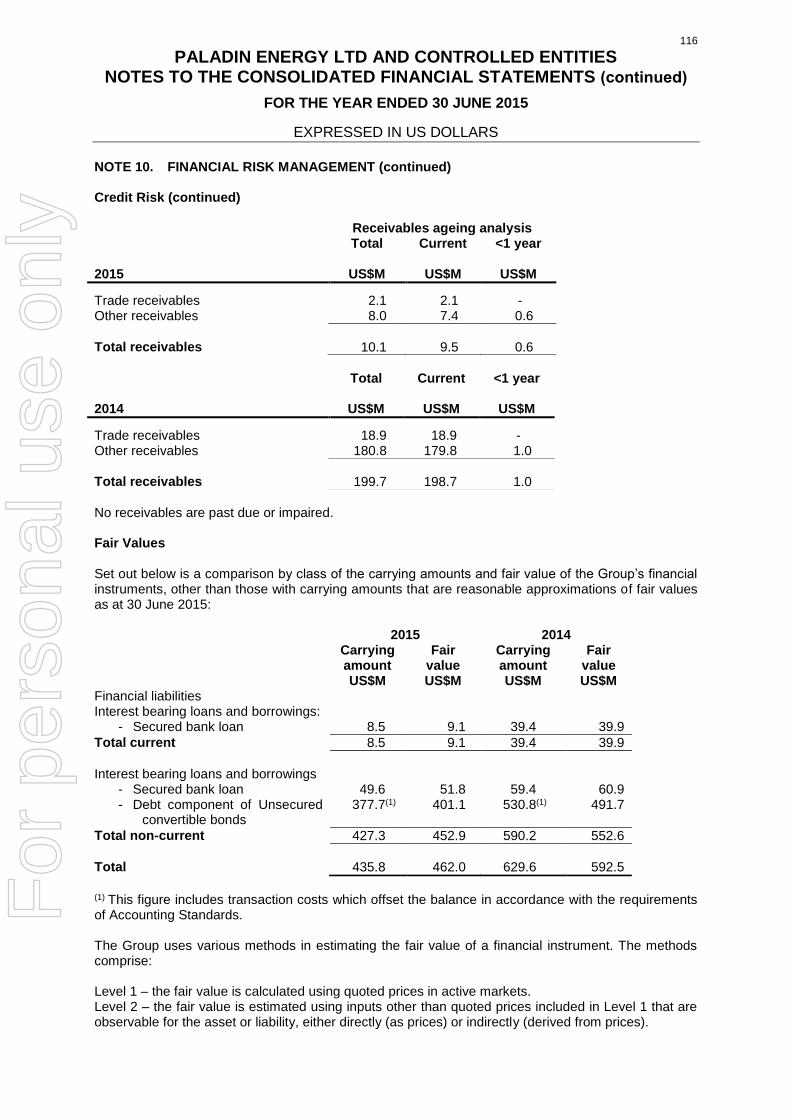
116
PALADIN ENERGY LTD AND CONTROLLED ENTITIES NOTES TO THE CONSOLIDATED FINANCIAL STATEMENTS (continued)
FOR THE YEAR ENDED 30 JUNE 2015
EXPRESSED IN US DOLLARS
NOTE 10. FINANCIAL RISK MANAGEMENT (continued) Credit Risk (continued) Receivables ageing analysis 2015
Total
US$M
Current
US$M
<1 year
US$M
Trade receivables 2.1 2.1 - Other receivables 8.0 7.4 0.6
Total receivables 10.1 9.5 0.6
2014
Total
US$M
Current
US$M
<1 year
US$M
Trade receivables 18.9 18.9 - Other receivables 180.8 179.8 1.0
Total receivables 199.7 198.7 1.0
No receivables are past due or impaired. Fair Values Set out below is a comparison by class of the carrying amounts and fair value of the Group’s financial instruments, other than those with carrying amounts that are reasonable approximations of fair values as at 30 June 2015: 2015 2014 Carrying
amount Fair
value Carrying amount
Fair value
US$M US$M US$M US$M Financial liabilities Interest bearing loans and borrowings:
- Secured bank loan 8.5 9.1 39.4 39.9
Total current 8.5 9.1 39.4 39.9
Interest bearing loans and borrowings
- Secured bank loan 49.6 51.8 59.4 60.9 - Debt component of Unsecured
convertible bonds 377.7(1) 401.1 530.8(1) 491.7
Total non-current 427.3 452.9 590.2 552.6
Total 435.8 462.0 629.6 592.5
(1) This figure includes transaction costs which offset the balance in accordance with the requirements of Accounting Standards. The Group uses various methods in estimating the fair value of a financial instrument. The methods comprise: Level 1 – the fair value is calculated using quoted prices in active markets. Level 2 – the fair value is estimated using inputs other than quoted prices included in Level 1 that are observable for the asset or liability, either directly (as prices) or indirectly (derived from prices).
For
per
sona
l use
onl
y

117
PALADIN ENERGY LTD AND CONTROLLED ENTITIES NOTES TO THE CONSOLIDATED FINANCIAL STATEMENTS (continued)
FOR THE YEAR ENDED 30 JUNE 2015
EXPRESSED IN US DOLLARS
NOTE 10. FINANCIAL RISK MANAGEMENT (continued) Fair Values (continued) Level 3 – the fair value is estimated using inputs for the asset or liability that are not based on observable market data. The fair value of the financial instruments as well as the methods used to estimate the fair value are summarised in the table below:
Year ended 30 June 2015 Year ended 30 June 2014
Quoted market price (Level 1) US$M
Valuation technique-market observable inputs (Level 2) US$M
Valuation technique- non market observable inputs (Level 3) US$M
Total US$M
Quoted market price (Level 1) US$M
Valuation technique-market observable inputs (Level 2) US$M
Valuation technique- non market observable inputs (Level 3) US$M
Total US$M
Financial assets measured at fair value
Available-for-sale investments
Listed investments 2.6 - - 2.6 6.6 - - 6.6
2.6 - - 2.6 6.6 - - 6.6
Financial liabilities for which fair values are disclosed Interest bearing loans and borrowings
Floating rate borrowings(1)
-
60.9
-
60.9
-
100.8
-
100.8
Debt component of of Convertible bonds(2)
- 401.1 - 401.1 - 491.7 - 491.7
- 462.0 - 462.0 - 592.5 - 592.5
(1) The fair value has been determined by discounting the future cash flows using market rates
currently available for debt on similar terms, credit risk and remaining maturities. (2) The fair value has been determined using a valuation technique based on the quoted market
price of the bonds less the estimated fair value of the equity component attributable to the conversion feature, which was valued using an option pricing model. The estimated fair value of the equity component was not considered material at 30 June 2015.
Quoted market price represents the fair value determined based on quoted prices on active markets as at the reporting date without any deduction for transaction costs. The fair value of the listed equity investments are based on quoted market prices. For financial instruments not quoted in active markets, the Group uses valuation techniques such as present value techniques, comparison to similar instruments for which market observable prices exist and other relevant models used by market participants. These valuation techniques use both observable and unobservable market inputs. For financial instruments that are recognised at fair value on a recurring basis, the Group determines whether transfers have occurred between Levels in the hierarchy by re-assessing categorisation (based on the lowest level input that is significant to the fair value measurement as a whole) at the end of each reporting period. Capital Management When managing capital, management’s objective is to ensure adequate cash resources to meet the Company’s commitments are maintained, as well as to maintain optimal returns to shareholders through ensuring the lowest cost of capital available to the entity.
For
per
sona
l use
onl
y

118
PALADIN ENERGY LTD AND CONTROLLED ENTITIES NOTES TO THE CONSOLIDATED FINANCIAL STATEMENTS (continued)
FOR THE YEAR ENDED 30 JUNE 2015
EXPRESSED IN US DOLLARS
NOTE 10. FINANCIAL RISK MANAGEMENT (continued) Capital Management (continued) The Company utilises a combination of debt, equity and convertible bonds to provide the cash resources required. Management reviews the capital structure from time to time as appropriate. The Group treasury function is responsible for the Group’s capital management, including management of the long-term debt and cash as part of the capital structure. This involves the use of corporate forecasting models which enable analysis of the Group’s financial position including cash flow forecasts to determine the future capital management requirements. To ensure sufficient funding for operational expenditure and growth activities, a range of assumptions are modelled so as to provide the flexibility in determining the Group’s optimal future capital structure. Group treasury monitors gearing and compliances with various contractual financial covenants. The Company’s project finance facility is subject to various financial undertakings including a negative pledge, debt service coverage ratio, loan life coverage ratio and project life coverage ratio. At the time of reporting, the Company was in compliance with all of the facility’s financial undertakings.
2015
US$M 2014 US$M
Total borrowings
534.5
725.6
Less cash and cash equivalents (183.7) (88.8) Net debt 350.8 636.8
Total equity 198.3 432.4
Total Capital 549.1 1,069.2
Gearing Ratio 64% 60%
Commodity Price Risk Uranium is not traded in any significant volume on global commodity exchanges. The Group has customer sales contracts in place for delivery over the period 2015 to 2024. Contracted selling prices are determined by a range of mechanisms including base-escalated pricing and formulas which reference common industry published prices. Contracts may be subject to escalating floor and ceiling prices.
For
per
sona
l use
onl
y
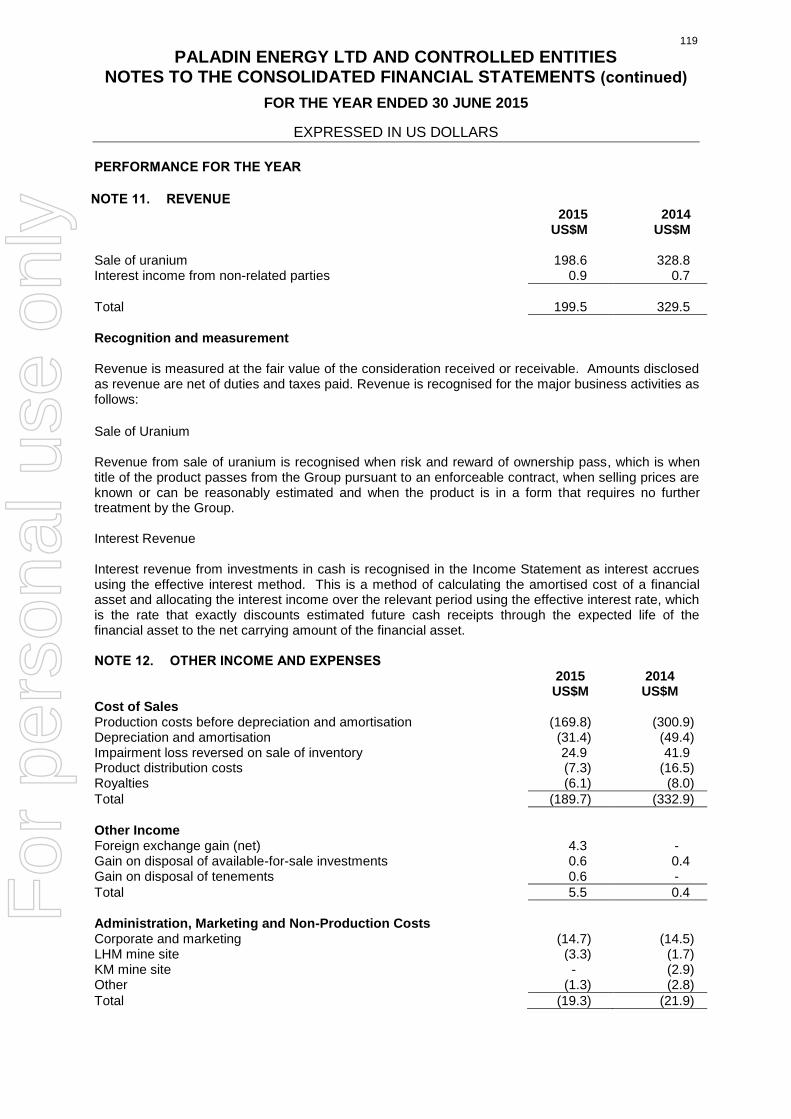
119
PALADIN ENERGY LTD AND CONTROLLED ENTITIES NOTES TO THE CONSOLIDATED FINANCIAL STATEMENTS (continued)
FOR THE YEAR ENDED 30 JUNE 2015
EXPRESSED IN US DOLLARS
PERFORMANCE FOR THE YEAR
NOTE 11. REVENUE 2015
US$M 2014 US$M
Sale of uranium 198.6 328.8 Interest income from non-related parties 0.9 0.7
Total
199.5
329.5
Recognition and measurement Revenue is measured at the fair value of the consideration received or receivable. Amounts disclosed as revenue are net of duties and taxes paid. Revenue is recognised for the major business activities as follows:
Sale of Uranium Revenue from sale of uranium is recognised when risk and reward of ownership pass, which is when title of the product passes from the Group pursuant to an enforceable contract, when selling prices are known or can be reasonably estimated and when the product is in a form that requires no further treatment by the Group. Interest Revenue Interest revenue from investments in cash is recognised in the Income Statement as interest accrues using the effective interest method. This is a method of calculating the amortised cost of a financial asset and allocating the interest income over the relevant period using the effective interest rate, which is the rate that exactly discounts estimated future cash receipts through the expected life of the financial asset to the net carrying amount of the financial asset. NOTE 12. OTHER INCOME AND EXPENSES
2015 US$M
2014 US$M
Cost of Sales Production costs before depreciation and amortisation (169.8) (300.9) Depreciation and amortisation (31.4) (49.4) Impairment loss reversed on sale of inventory 24.9 41.9 Product distribution costs (7.3) (16.5) Royalties (6.1) (8.0)
Total (189.7) (332.9) (332.9) (355.6)
Other Income Foreign exchange gain (net) 4.3 - Gain on disposal of available-for-sale investments 0.6 0.4 Gain on disposal of tenements 0.6 -
Total 5.5 0.4 0.4 3.0
Administration, Marketing and Non-Production Costs Corporate and marketing (14.7) (14.5) LHM mine site (3.3) (1.7) KM mine site - (2.9) Other (1.3) (2.8)
Total (19.3) (21.9)
For
per
sona
l use
onl
y

120
PALADIN ENERGY LTD AND CONTROLLED ENTITIES NOTES TO THE CONSOLIDATED FINANCIAL STATEMENTS (continued)
FOR THE YEAR ENDED 30 JUNE 2015
EXPRESSED IN US DOLLARS
NOTE 12. OTHER INCOME AND EXPENSES (continued) 2015
US$M 2014 US$M
Other Expenses Write-off of exploration assets(1) (1.4) - Impairment of exploration assets(2) (237.5) (323.6) Impairment of aircraft (1.0) (3.8) Impairment for available for sale financial assets (2.9) (4.3) LHM fixed costs during plant shutdown (3.8) - KM fixed costs during plant shutdown - (4.6) KM care and maintenance expenses (13.4) - KM mine closure provision increase (7.6) - KM slope remediation - (0.1) Foreign Exchange Loss (net) - (1.2)
Total
(267.6)
(337.6)
(1) The licence for Spinifex Well was surrendered on 22 September 2014. All capitalised costs were written off.
(2) Impairment charge of US$237.5M, Queensland exploration assets US$229.1M and Bigrlyi project US$8.4M. At 30 June 2015, due to the continuing depressed uranium price, US$229.1M (US$180.8M after tax) was recognised to reduce the carrying value of the Queensland exploration assets. The estimated recoverable amount of the project of US$100.0M was determined on the basis of fair value less costs to dispose (level 3 fair value hierarchy), using a valuation range provided by recent comparable market transactions and other market indicators which ranged from US$0.3/lb to US$7.5/lb. The estimated recoverable amount for the Queensland exploration assets equated to US$0.75/lb, which is based on more recent market transactions and the current uranium market. Bigrlyi was written down to a carrying value of US$Nil.
Finance Costs Interest expense (33.5) (34.1) Accretion relating to convertible bonds (non-cash) (18.2) (18.1) Profit on convertible bond buyback 1.0 - Mine closure provision discount interest expense (5.7) (1.9) Facility costs (0.6) (5.6)
Total
(57.0)
(59.7)
Total depreciation and amortisation expense 31.7 51.0
Employee Benefits Expense Wages and salaries (28.7) (56.5) Defined contribution superannuation (2.3) (2.9) Share-based payments (0.5) (0.7) Other employee benefits (2.3) (3.1)
(33.8) (63.2)
For
per
sona
l use
onl
y
121
PALADIN ENERGY LTD AND CONTROLLED ENTITIES NOTES TO THE CONSOLIDATED FINANCIAL STATEMENTS (continued)
FOR THE YEAR ENDED 30 JUNE 2015
EXPRESSED IN US DOLLARS
NOTE 12. OTHER INCOME AND EXPENSES (continued)
Recognition and measurement
Superannuation The Company contributes to employees’ superannuation plans in accordance with the requirements of Occupational Superannuation Legislation. Contributions by the Company represent a defined percentage of each employee's salary. Employee contributions are voluntary. Employee Performance Share Rights Plan Details of the Employee Performance Share Rights Plan for the Company are disclosed in Note 31. Depreciation – refer to Note 20. Employee benefits – refer to Note 25. Borrowing Costs Borrowing costs incurred for the construction of any qualifying asset are capitalised during the period of time that is required to complete and prepare the asset for its intended use or sale. Other borrowing costs are expensed as incurred including the unwinding of discounts related to mine closure provisions. The capitalisation rate used to determine the amount of borrowing costs to be capitalised is the weighted average interest rate applicable to the entity's outstanding borrowings during the year.
For
per
sona
l use
onl
y

122
PALADIN ENERGY LTD AND CONTROLLED ENTITIES NOTES TO THE CONSOLIDATED FINANCIAL STATEMENTS (continued)
FOR THE YEAR ENDED 30 JUNE 2015
EXPRESSED IN US DOLLARS
NOTE 13. INCOME AND OTHER TAXES 2015
US$M 2014 US$M
Income Tax Benefit/(Expense) Current income tax Current income tax benefit/(expense) - - Deferred income tax
Related to the origination and reversal of temporary differences 38.1 96.0
Income tax (expense)/benefit reported in the Income Statement
38.1
96.0
Amounts Charged or Credited Directly to Equity Deferred income tax related to items charged or credited directly to equity: Foreign currency translation reserve movement 11.1 0.4 Other and prior period (6.9) 0.3
Income tax (expense)/benefit reported in equity
4.2
0.7
Numerical Reconciliation of Income Tax Benefit to Prima Facie Tax Payable
Loss before income tax expense 338.2 485.6
Tax at the Australian tax rate of 30% (2014 – 30%)
101.4
145.7
Difference in overseas tax rates 0.5 (3.4) Non - deductible items 20.8 25.0 Under/over prior year adjustment (27.1) - Losses not recognised - (73.6) Other foreign exchange differences (14.3) 41.7 OtherDTA not recognised (43.2) (39.4)
Income tax (expense)/benefit reported in the Income Statement
38.1
96.0
Tax Losses Australian unused tax losses for which no deferred tax asset has been recognised (387.8) (309.6) Other unused tax losses for which no deferred tax asset has been recognised (384.6) (381.1)
Total unused tax losses for which no deferred tax asset has been recognised (772.4) (690.7)
Unused tax losses for which no DTA has been recognised (222.3) (207.2) F
or p
erso
nal u
se o
nly

123
PALADIN ENERGY LTD AND CONTROLLED ENTITIES NOTES TO THE CONSOLIDATED FINANCIAL STATEMENTS (continued)
FOR THE YEAR ENDED 30 JUNE 2015
EXPRESSED IN US DOLLARS
NOTE 13. INCOME AND OTHER TAXES (continued) 2015
US$M 2014 US$M
Deferred Income Tax Deferred tax liabilities
Accelerated prepayment deduction for tax purposes 0.7 0.8 Accelerated depreciation for tax purposes 100.6 109.2 Exploration expenditure 14.7 16.5 Inventory / Consumables Recognition of acquired exploration expenditure
4.4 -
- 59.4
Convertible bond 11.2 9.7 Other - 1.3
Gross deferred tax liabilities 131.6 196.9 Set off of deferred tax assets (83.7) (106.7)
Net deferred tax liabilities 47.9 90.2
Deferred tax assets Revenue losses available for offset against future taxable income (33.5) (42.5) Available for sale securities (9.7) (9.0) Foreign currency balances (37.0) (48.2) Interest bearing liabilities - (1.2) Other (3.5) (5.8)
Gross deferred tax assets (83.7) (106.7) Set off against deferred tax liabilities 83.7 106.7
Net deferred tax assets recognised - -
Paladin and all its wholly-owned Australian resident entities are part of a tax-consolidated group under Australian tax law. The net deferred tax assets recognised are in respect of revenue losses expected to be offset against future taxable income. This benefit for tax losses will only be obtained if:
(1) the Consolidated Entities derive future assessable income of a nature and of an amount sufficient to enable the benefit from the deductions for the losses to be realised;
(2) the Consolidated Entities continue to comply with the conditions for deductibility imposed by tax legislation; and
(3) no changes in tax legislation adversely affect the Consolidated Entities in realising the benefit from the deductions for the losses.
Recognition and measurement Current income tax assets and liabilities for the current period are measured at the amount expected to be recovered from or paid to the taxation authorities. The tax rates and tax laws used to compute the amount are those that are enacted or substantially enacted, at the reporting date in the countries where the Group operates and generates taxable income. Current income tax relating to items recognised directly in equity is recognised in equity and not in the statement of profit or loss. Management periodically evaluates positions taken in the tax returns with respect to situations in which applicable tax regulations are subject to integration and establishes provisions where appropriate.
For
per
sona
l use
onl
y
124
PALADIN ENERGY LTD AND CONTROLLED ENTITIES NOTES TO THE CONSOLIDATED FINANCIAL STATEMENTS (continued)
FOR THE YEAR ENDED 30 JUNE 2015
EXPRESSED IN US DOLLARS
NOTE 13. INCOME AND OTHER TAXES (continued) Recognition and measurement (continued) Deferred tax assets and liabilities are recognised using the full liability method for temporary differences at the tax rates expected to apply when the assets are recovered or liabilities are settled, based on those tax rates which are enacted or substantively enacted for each jurisdiction. The relevant tax rates are applied to the cumulative amounts of deductible and taxable temporary differences to measure the deferred tax asset or liability. An exception is made for certain temporary differences arising from the initial recognition of an asset or a liability. No deferred tax asset or liability is recognised in relation to these temporary differences if they arose in a transaction, other than a business combination, that at the time of the transaction did not affect either accounting profit or taxable profit or loss. Deferred tax assets are recognised for deductible temporary differences and unused tax losses only if it is probable that future taxable amounts will be available to utilise those temporary differences and losses. Current and deferred tax balances attributable to amounts recognised directly in equity are also recognised directly in equity. Deferred tax assets and liabilities are offset only if a legally enforceable right exists to set off current tax assets against current tax liabilities and the deferred tax assets and liabilities relate to the same taxable entity and the same taxation authority. Significant Accounting Estimates and Assumptions Deferred Tax Assets and Liabilities The Group is subject to income taxes in Australia and jurisdictions where it has foreign operations. Significant judgement is required in determining deferred tax assets and liabilities. There are many transactions and calculations for which the ultimate tax determination is uncertain during the ordinary course of business. The carrying amount of deferred income tax assets is reviewed at each reporting date and reduced to the extent that it is no longer probable that sufficient taxable profit will be available to allow all or part of the deferred income tax asset to be utilised. Unrecognised deferred income tax assets are reassessed at each reporting date and are recognised to the extent that it has become probable that future taxable profit will allow the deferred tax asset to be recovered.
For
per
sona
l use
onl
y
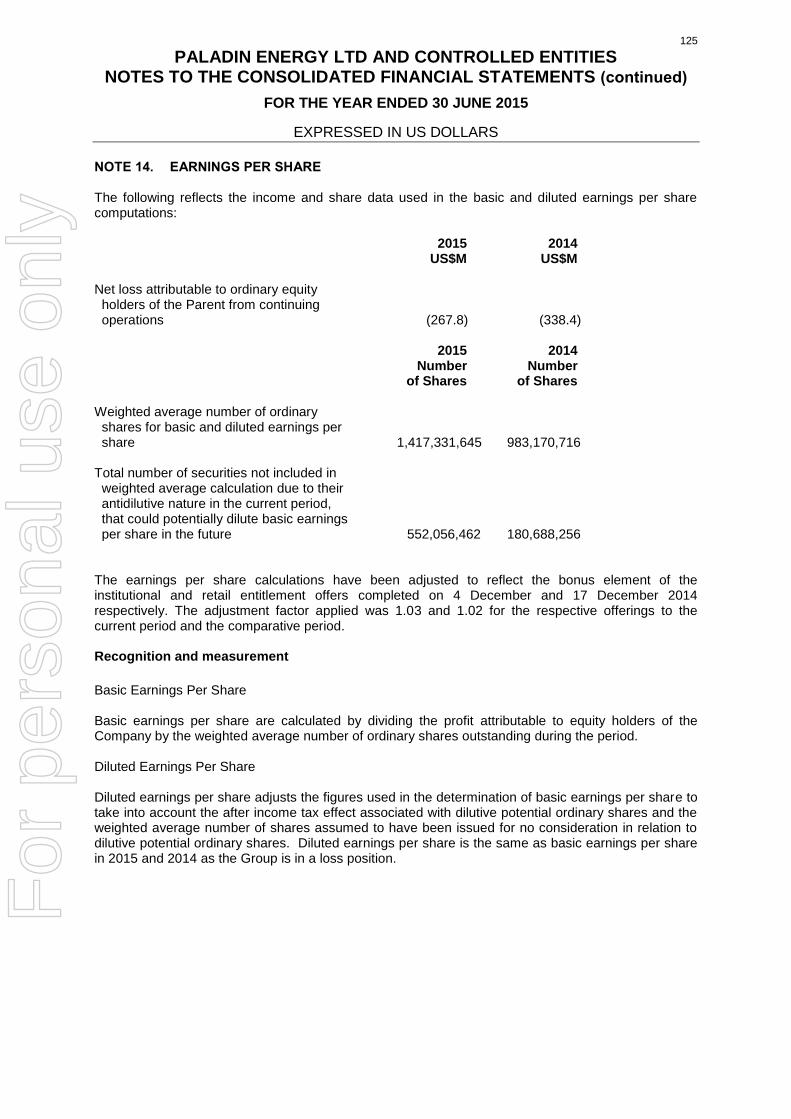
125
PALADIN ENERGY LTD AND CONTROLLED ENTITIES NOTES TO THE CONSOLIDATED FINANCIAL STATEMENTS (continued)
FOR THE YEAR ENDED 30 JUNE 2015
EXPRESSED IN US DOLLARS
NOTE 14. EARNINGS PER SHARE The following reflects the income and share data used in the basic and diluted earnings per share computations:
2015
US$M 2014 US$M
Net loss attributable to ordinary equity holders of the Parent from continuing operations (267.8) (338.4)
2015 Number of Shares
2014 Number of Shares
Weighted average number of ordinary shares for basic and diluted earnings per share 1,417,331,645 983,170,716 Total number of securities not included in weighted average calculation due to their antidilutive nature in the current period, that could potentially dilute basic earnings per share in the future 552,056,462 180,688,256 The earnings per share calculations have been adjusted to reflect the bonus element of the institutional and retail entitlement offers completed on 4 December and 17 December 2014 respectively. The adjustment factor applied was 1.03 and 1.02 for the respective offerings to the current period and the comparative period. Recognition and measurement
Basic Earnings Per Share Basic earnings per share are calculated by dividing the profit attributable to equity holders of the Company by the weighted average number of ordinary shares outstanding during the period. Diluted Earnings Per Share Diluted earnings per share adjusts the figures used in the determination of basic earnings per share to take into account the after income tax effect associated with dilutive potential ordinary shares and the weighted average number of shares assumed to have been issued for no consideration in relation to dilutive potential ordinary shares. Diluted earnings per share is the same as basic earnings per share in 2015 and 2014 as the Group is in a loss position.
For
per
sona
l use
onl
y
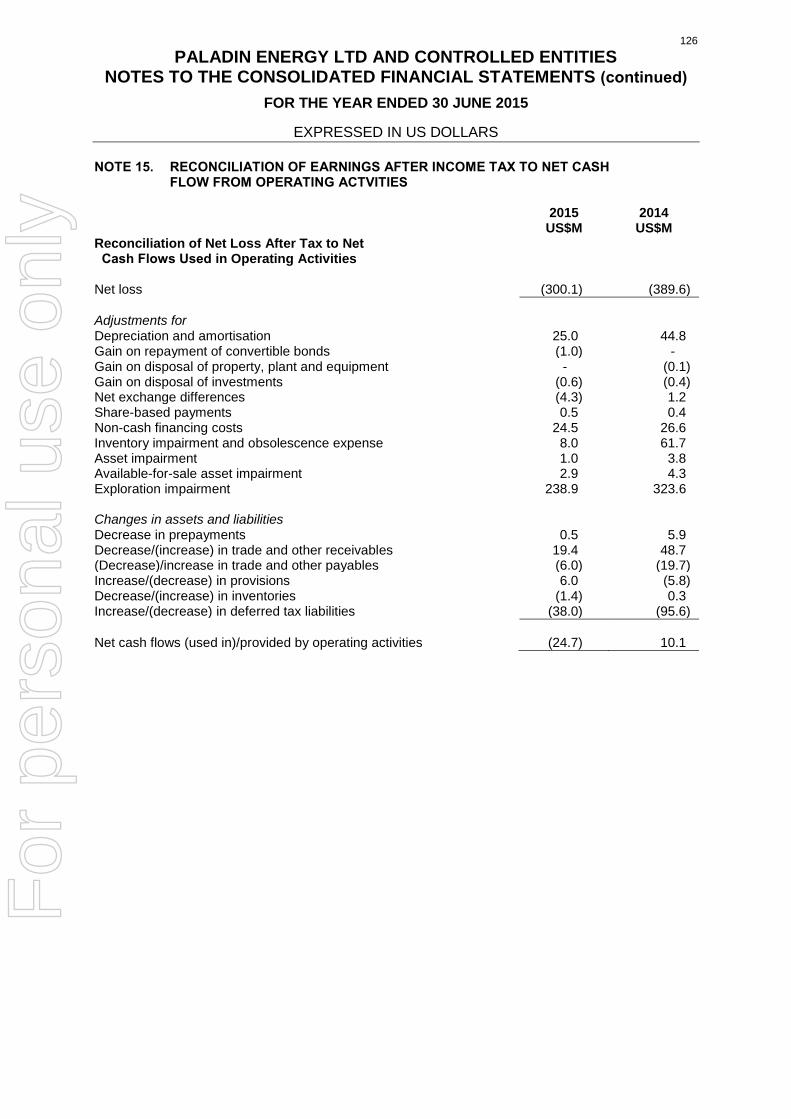
126
PALADIN ENERGY LTD AND CONTROLLED ENTITIES NOTES TO THE CONSOLIDATED FINANCIAL STATEMENTS (continued)
FOR THE YEAR ENDED 30 JUNE 2015
EXPRESSED IN US DOLLARS
NOTE 15. RECONCILIATION OF EARNINGS AFTER INCOME TAX TO NET CASH FLOW FROM OPERATING ACTVITIES
2015 US$M
2014 US$M
Reconciliation of Net Loss After Tax to Net Cash Flows Used in Operating Activities Net loss (300.1) (389.6)
Adjustments for Depreciation and amortisation 25.0 44.8 Gain on repayment of convertible bonds (1.0) - Gain on disposal of property, plant and equipment - (0.1) Gain on disposal of investments (0.6) (0.4) Net exchange differences (4.3) 1.2 Share-based payments 0.5 0.4 Non-cash financing costs 24.5 26.6 Inventory impairment and obsolescence expense 8.0 61.7 Asset impairment 1.0 3.8 Available-for-sale asset impairment 2.9 4.3 Exploration impairment 238.9 323.6 Changes in assets and liabilities Decrease in prepayments 0.5 5.9 Decrease/(increase) in trade and other receivables 19.4 48.7 (Decrease)/increase in trade and other payables (6.0) (19.7) Increase/(decrease) in provisions 6.0 (5.8) Decrease/(increase) in inventories (1.4) 0.3 Increase/(decrease) in deferred tax liabilities (38.0) (95.6)
Net cash flows (used in)/provided by operating activities (24.7) 10.1
For
per
sona
l use
onl
y
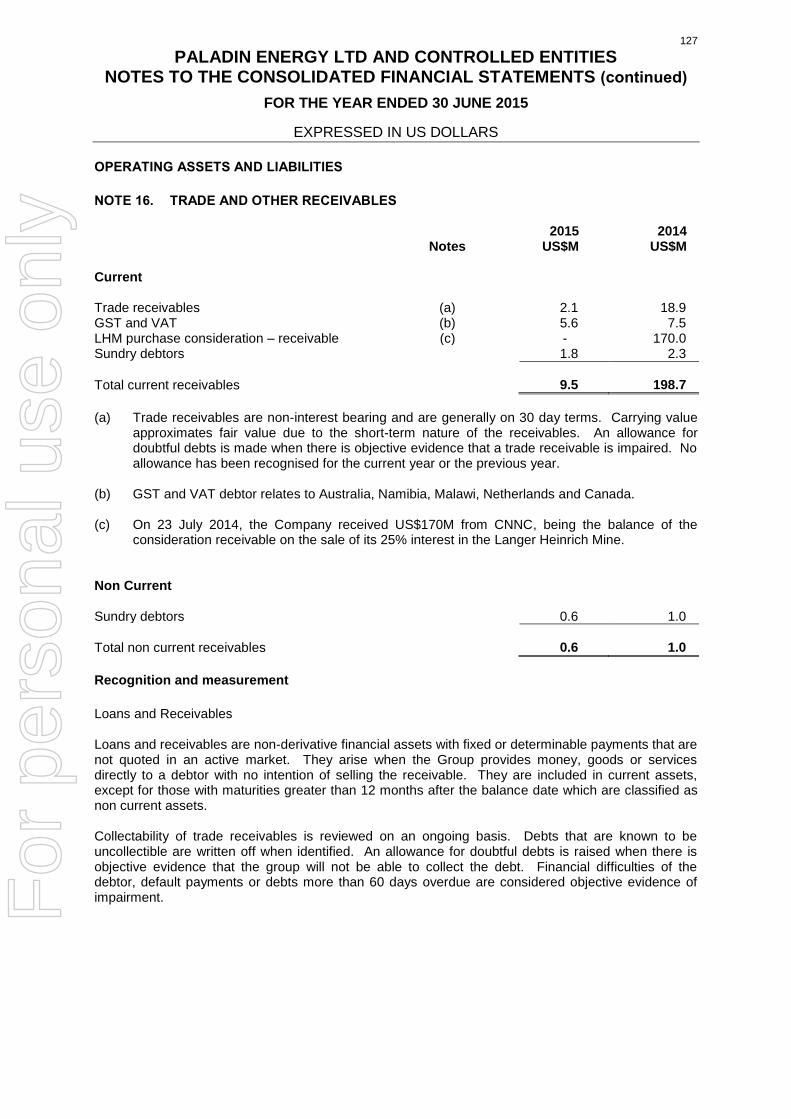
127
PALADIN ENERGY LTD AND CONTROLLED ENTITIES NOTES TO THE CONSOLIDATED FINANCIAL STATEMENTS (continued)
FOR THE YEAR ENDED 30 JUNE 2015
EXPRESSED IN US DOLLARS
OPERATING ASSETS AND LIABILITIES
NOTE 16. TRADE AND OTHER RECEIVABLES
Notes 2015
US$M 2014 US$M
Current Trade receivables (a) 2.1 18.9 GST and VAT (b) 5.6 7.5 LHM purchase consideration – receivable (c) - 170.0 Sundry debtors 1.8 2.3
Total current receivables 9.5 198.7
(a) Trade receivables are non-interest bearing and are generally on 30 day terms. Carrying value
approximates fair value due to the short-term nature of the receivables. An allowance for doubtful debts is made when there is objective evidence that a trade receivable is impaired. No allowance has been recognised for the current year or the previous year.
(b) GST and VAT debtor relates to Australia, Namibia, Malawi, Netherlands and Canada. (c) On 23 July 2014, the Company received US$170M from CNNC, being the balance of the
consideration receivable on the sale of its 25% interest in the Langer Heinrich Mine. Non Current Sundry debtors 0.6 1.0
Total non current receivables 0.6 1.0
Recognition and measurement
Loans and Receivables Loans and receivables are non-derivative financial assets with fixed or determinable payments that are not quoted in an active market. They arise when the Group provides money, goods or services directly to a debtor with no intention of selling the receivable. They are included in current assets, except for those with maturities greater than 12 months after the balance date which are classified as non current assets. Collectability of trade receivables is reviewed on an ongoing basis. Debts that are known to be uncollectible are written off when identified. An allowance for doubtful debts is raised when there is objective evidence that the group will not be able to collect the debt. Financial difficulties of the debtor, default payments or debts more than 60 days overdue are considered objective evidence of impairment.
For
per
sona
l use
onl
y

128
PALADIN ENERGY LTD AND CONTROLLED ENTITIES NOTES TO THE CONSOLIDATED FINANCIAL STATEMENTS (continued)
FOR THE YEAR ENDED 30 JUNE 2015
EXPRESSED IN US DOLLARS
NOTE 17. INVENTORIES
2015
US$M 2014 US$M
Current Stores and consumables (at cost) 11.1 10.3 Stockpiles (at cost) 19.8 7.1 Work in progress (at net realisable value) 9.4 5.1 Finished goods (at cost) 35.0 - Finished goods (at net realisable value) - 55.6
Total current inventories at the lower of cost and net realisable value 75.3 78.1
Non Current Stockpiles (at cost) 156.3 160.2
Total non current inventories at the lower of cost and net realisable value 156.3 160.2
Stockpiles at LHM that are unlikely to be processed within 12 months of the balance sheet date.
Inventory Expense
Inventories sold recognised as an expense for the year ended 30 June 2015 totalled US$189.7M (2014: US$332.9M) for the Group. Impairment of Inventories
During 2015, work-in-progress held at LHM was reduced to net realisable value resulting in an impairment loss of US$8.0M (2014: US$Nil) for the year, recognised in 2015 cost of sales. During 2014, finished goods held at LHM and KM were reduced to net realisable value resulting in an impairment loss of US$35.7M (2015: US$Nil) for the year, recognised in 2014 cost of sales. During 2014, stockpiles held at KM were reduced to net realisable value resulting in an impairment loss of US$8.2M (2015: US$Nil) for the year, recognised in 2014 cost of sales. During 2014 stores and consumables held at KM were reduced by US$17.8M (2015: US$Nil) due to obsolescence. This resulted in an obsolescence expense recognised in 2014 cost of sales. Recognition and measurement Consumable stores inventory are valued at the lower of cost and net realisable value using the weighted average cost method, after appropriate allowances for redundant and slow moving items. Finished goods and work in progress inventory are valued at the lower of cost and net realisable value using the weighted average cost method. Cost is derived on an absorption costing basis, including both fixed and variable production costs and attributable overheads incurred up to the delivery point where legal title to the product passes. No accounting value is attributed to stockpiles containing ore at less than the cut-off grade.
For
per
sona
l use
onl
y
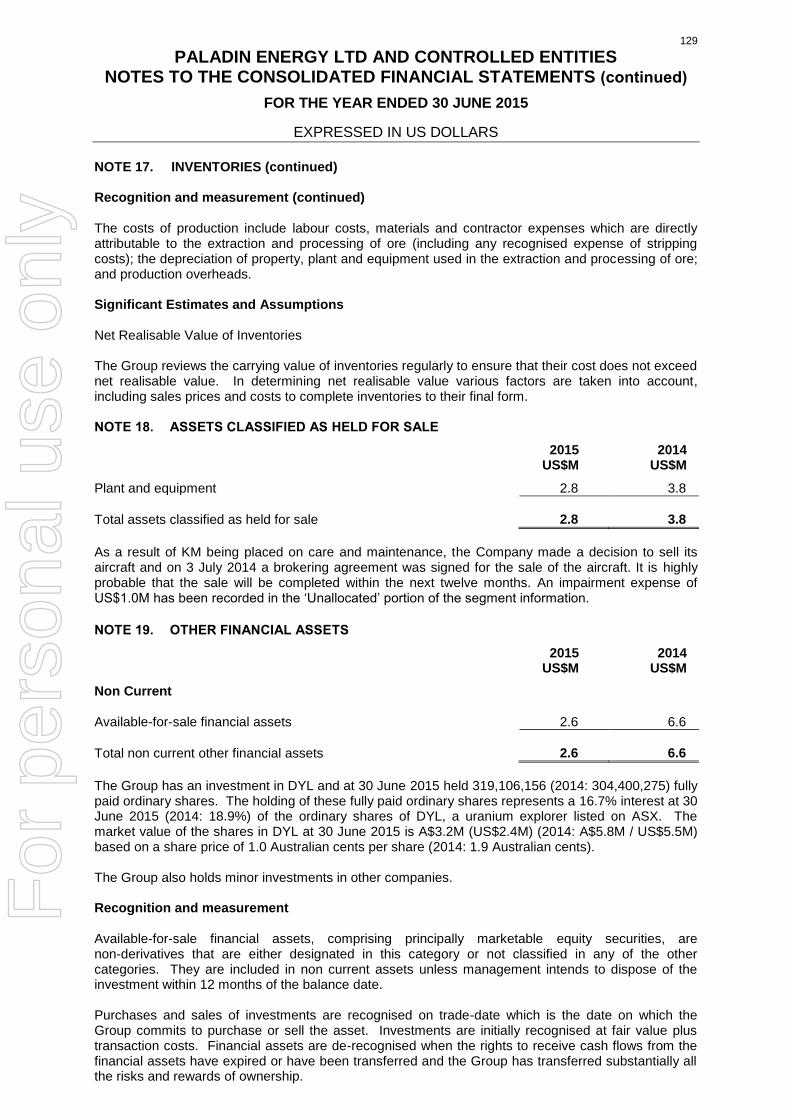
129
PALADIN ENERGY LTD AND CONTROLLED ENTITIES NOTES TO THE CONSOLIDATED FINANCIAL STATEMENTS (continued)
FOR THE YEAR ENDED 30 JUNE 2015
EXPRESSED IN US DOLLARS
NOTE 17. INVENTORIES (continued) Recognition and measurement (continued) The costs of production include labour costs, materials and contractor expenses which are directly attributable to the extraction and processing of ore (including any recognised expense of stripping costs); the depreciation of property, plant and equipment used in the extraction and processing of ore; and production overheads. Significant Estimates and Assumptions Net Realisable Value of Inventories The Group reviews the carrying value of inventories regularly to ensure that their cost does not exceed net realisable value. In determining net realisable value various factors are taken into account, including sales prices and costs to complete inventories to their final form. NOTE 18. ASSETS CLASSIFIED AS HELD FOR SALE
2015 US$M
2014 US$M
Plant and equipment 2.8 3.8
Total assets classified as held for sale 2.8 3.8
As a result of KM being placed on care and maintenance, the Company made a decision to sell its aircraft and on 3 July 2014 a brokering agreement was signed for the sale of the aircraft. It is highly probable that the sale will be completed within the next twelve months. An impairment expense of US$1.0M has been recorded in the ‘Unallocated’ portion of the segment information.
NOTE 19. OTHER FINANCIAL ASSETS
2015 US$M
2014 US$M
Non Current Available-for-sale financial assets 2.6 6.6
Total non current other financial assets 2.6 6.6
The Group has an investment in DYL and at 30 June 2015 held 319,106,156 (2014: 304,400,275) fully paid ordinary shares. The holding of these fully paid ordinary shares represents a 16.7% interest at 30 June 2015 (2014: 18.9%) of the ordinary shares of DYL, a uranium explorer listed on ASX. The market value of the shares in DYL at 30 June 2015 is A$3.2M (US$2.4M) (2014: A$5.8M / US$5.5M) based on a share price of 1.0 Australian cents per share (2014: 1.9 Australian cents). The Group also holds minor investments in other companies. Recognition and measurement Available-for-sale financial assets, comprising principally marketable equity securities, are non-derivatives that are either designated in this category or not classified in any of the other categories. They are included in non current assets unless management intends to dispose of the investment within 12 months of the balance date. Purchases and sales of investments are recognised on trade-date which is the date on which the Group commits to purchase or sell the asset. Investments are initially recognised at fair value plus transaction costs. Financial assets are de-recognised when the rights to receive cash flows from the financial assets have expired or have been transferred and the Group has transferred substantially all the risks and rewards of ownership.
For
per
sona
l use
onl
y
130
PALADIN ENERGY LTD AND CONTROLLED ENTITIES NOTES TO THE CONSOLIDATED FINANCIAL STATEMENTS (continued)
FOR THE YEAR ENDED 30 JUNE 2015
EXPRESSED IN US DOLLARS
NOTE 19. OTHER FINANCIAL ASSETS (continued) Recognition and measurement (continued) Available-for-sale financial assets are subsequently carried at fair value. Unrealised gains and losses which arise from changes in the fair value of non monetary securities classified as available-for-sale are recognised in other comprehensive income. When securities classified as available-for-sale are sold or impaired, the accumulated fair value adjustments are included in the Income Statement as gains and losses from investment securities. Fair value of Financial Instruments The fair values of quoted investments are based on current bid prices. Impairment of Financial Instruments The Group assesses at each balance date whether there is objective evidence that a financial asset or group of financial assets is impaired. In the case of equity securities classified as available-for-sale, a significant or prolonged decline in the fair value of a security below its cost is considered in determining whether the security is impaired. If any such evidence exists for available-for-sale financial assets, the cumulative loss which is measured as the difference between the acquisition cost and the current fair value, less any impairment loss on that financial asset previously recognised in profit and loss is removed from equity and recognised in the Income Statement. Any subsequent increase in value is recognised in equity.
For
per
sona
l use
onl
y
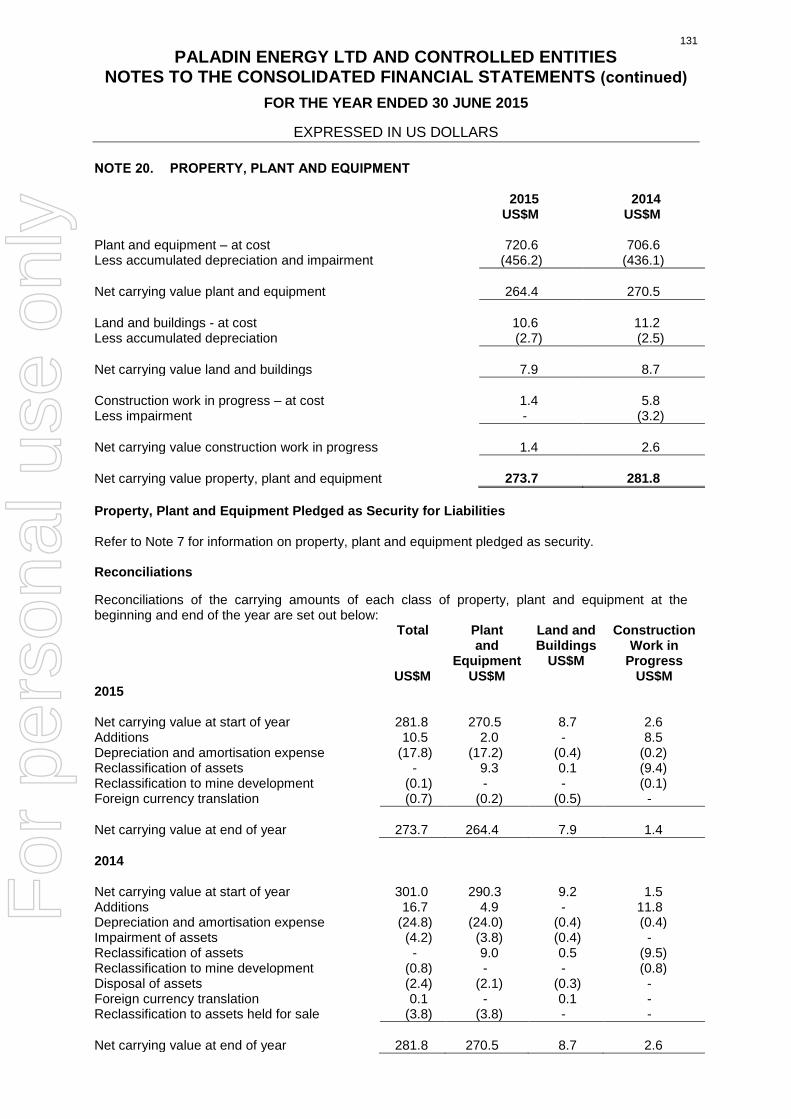
131
PALADIN ENERGY LTD AND CONTROLLED ENTITIES NOTES TO THE CONSOLIDATED FINANCIAL STATEMENTS (continued)
FOR THE YEAR ENDED 30 JUNE 2015
EXPRESSED IN US DOLLARS
NOTE 20. PROPERTY, PLANT AND EQUIPMENT
2015
US$M 2014 US$M
Plant and equipment – at cost 720.6 706.6 Less accumulated depreciation and impairment (456.2) (436.1)
Net carrying value plant and equipment 264.4 270.5
Land and buildings - at cost 10.6 11.2 Less accumulated depreciation (2.7) (2.5)
Net carrying value land and buildings 7.9 8.7
Construction work in progress – at cost 1.4 5.8 Less impairment - (3.2)
Net carrying value construction work in progress 1.4 2.6
Net carrying value property, plant and equipment 273.7 281.8
Property, Plant and Equipment Pledged as Security for Liabilities Refer to Note 7 for information on property, plant and equipment pledged as security. Reconciliations
Reconciliations of the carrying amounts of each class of property, plant and equipment at the beginning and end of the year are set out below: Total
US$M
Plant and
Equipment US$M
Land and Buildings
US$M
Construction Work in
Progress US$M
2015 Net carrying value at start of year 281.8 270.5 8.7 2.6 Additions 10.5 2.0 - 8.5 Depreciation and amortisation expense (17.8) (17.2) (0.4) (0.2) Reclassification of assets - 9.3 0.1 (9.4) Reclassification to mine development (0.1) - - (0.1) Foreign currency translation (0.7) (0.2) (0.5) -
Net carrying value at end of year 273.7 264.4 7.9 1.4
2014 Net carrying value at start of year 301.0 290.3 9.2 1.5 Additions 16.7 4.9 - 11.8 Depreciation and amortisation expense (24.8) (24.0) (0.4) (0.4) Impairment of assets (4.2) (3.8) (0.4) - Reclassification of assets - 9.0 0.5 (9.5) Reclassification to mine development (0.8) - - (0.8) Disposal of assets (2.4) (2.1) (0.3) - Foreign currency translation 0.1 - 0.1 - Reclassification to assets held for sale (3.8) (3.8) - -
Net carrying value at end of year 281.8 270.5 8.7 2.6
For
per
sona
l use
onl
y

132
PALADIN ENERGY LTD AND CONTROLLED ENTITIES NOTES TO THE CONSOLIDATED FINANCIAL STATEMENTS (continued)
FOR THE YEAR ENDED 30 JUNE 2015
EXPRESSED IN US DOLLARS
NOTE 20. PROPERTY, PLANT AND EQUIPMENT (continued)
Recognition and measurement All property, plant and equipment are stated at historical cost less accumulated depreciation and impairment losses. Historical cost includes expenditure that is directly attributable to the acquisition of the items. Subsequent costs are included in the asset's carrying amount or recognised as a separate asset, as appropriate, only when it is probable that future economic benefits associated with the item will flow to the Group and the cost of the item can be measured reliably. All other repairs and maintenance are charged to the Income Statement during the financial period in which they are incurred. Property, plant and equipment costs include both the costs associated with construction of equipment associated with establishment of an operating mine, and the estimated costs of dismantling and removing the asset and restoring the site on which it is located.
Land is not depreciated. Depreciation on other assets is calculated using either the unit of production basis or the straight line method to allocate their cost amount, net of their residual values, over their estimated useful lives, as follows:
Buildings 20 years
Databases 10 years
Plant and equipment 2-6 years
Leasehold improvements period of lease
Mine plant and equipment lesser of life of asset and unit of production basis An asset's carrying amount is written down immediately to its recoverable amount if the asset's carrying amount is greater than its estimated recoverable amount.
Gains and losses on disposals are determined by comparing proceeds with carrying amounts. These are included in the Income Statement. Assets that have an indefinite useful life are not subject to amortisation and are tested annually for impairment. Assets that are subject to amortisation are reviewed for impairment whenever events or changes in circumstances indicate that the carrying amount may not be recoverable. An impairment loss is recognised for the amount by which the asset's carrying amount exceeds its recoverable amount. The recoverable amount is the higher of an asset's fair value less costs to sell and value in use. In assessing value in use, the estimated future cash flows are discounted to their present value using a pre-tax discount rate that reflects current market assessments of the time value of money and the risks specific to the asset. For the purposes of assessing impairment, assets are grouped at the lowest levels for which there are separately identifiable cash flows (cash generating units). Significant Estimates and Assumptions Impairment of Property, Plant and Equipment; Mine Development and Intangibles Property, plant and equipment; mine development and intangibles are tested for impairment whenever events or changes in circumstances indicate that the carrying value may not be recoverable. The Group conducts an internal review of asset values at each reporting date, which is used as a source of information to assess for any indicators of impairment. Factors, such as changes in uranium prices, production performance and mining and processing costs are monitored to assess for indicators of impairment. If any indication of impairment exists, an estimate of the asset’s recoverable amount is calculated. An impairment loss is recognised for the amount by which the asset’s carrying amount exceeds its recoverable amount. Recoverable amount is the higher of an asset’s fair value less costs to sell and value in use. For the purposes of assessing impairment, assets are grouped at the lowest levels for which there are separately identifiable cash inflows that are largely independent of the cash inflows from other assets or groups of assets (cash-generating units).
For
per
sona
l use
onl
y

133
PALADIN ENERGY LTD AND CONTROLLED ENTITIES NOTES TO THE CONSOLIDATED FINANCIAL STATEMENTS (continued)
FOR THE YEAR ENDED 30 JUNE 2015
EXPRESSED IN US DOLLARS
NOTE 20. PROPERTY, PLANT AND EQUIPMENT (continued) Significant Estimates and Assumptions (continued) The future recoverability of the property, plant and equipment, mine development and intangibles is dependent on a number of key factors including: uranium price, discount rates used in determining the estimated discounted cash flows, foreign exchanges rates, tax rates, the level of proved and probable reserves and measured, indicated and inferred mineral resources, future technological changes which could impact the cost of production and futures legal changes, including changes to environmental restoration obligations. The carrying value of the LHM property, plant and equipment has been determined based on the higher of the fair value less costs to sell and value in use. Fair value less costs to sell was determined using the recent transaction with CNNC. Value in use was determined using the discounted cash flow method utilising foreign exchange rate assumptions, TradeTech forecast pricing, estimated operating costs, capital requirements, quantities of recoverable minerals and production levels based on the current Life of Mine Plan and the 2016 budget. No impairment was recognised. NOTE 21. MINE DEVELOPMENT
2015
US$M 2014 US$M
Mine development – at cost 213.1 206.5 Less accumulated depreciation and impairment (170.1) (162.6) (1)
Net carrying value – mine development 43.0 43.9
Net carrying value at start of year 43.9 42.8 Additions - 19.9 Depreciation and amortisation expense (7.5) (19.9) Effects in changes of underlying assumptions & discount rates 6.5 0.5 Reclassification from property, plant and equipment 0.1 0.8 Disposals - (0.2)
Net carrying value at end of year 43.0 43.9
Recognition and measurement Mine development Pre-production costs are deferred as development costs until such time as the asset is capable of being operated in a manner intended by management and depreciated on a units of production basis. Post-production costs are recognised as a cost of production. Stripping (waste removal) costs As part of its mining operations, the Group incurs stripping (waste removal) costs both during the development phase and production phase of its operations. Stripping costs incurred in the development phase of a mine, before the production phase commences (development stripping), are capitalised as part of the cost of constructing the mine and subsequently amortised over its useful life using a units-of-production method. The capitalisation of development stripping costs ceases when the mine/component is commissioned and ready for use as intended by management. Stripping activities undertaken during the production phase of a surface mine (production stripping) are accounted for as set out below. After the commencement of production, further development of the mine may require a phase of stripping that is similar in nature to development phase stripping. The costs of such stripping are accounted for in the same way as development stripping (as outlined above).
For
per
sona
l use
onl
y
134
PALADIN ENERGY LTD AND CONTROLLED ENTITIES NOTES TO THE CONSOLIDATED FINANCIAL STATEMENTS (continued)
FOR THE YEAR ENDED 30 JUNE 2015
EXPRESSED IN US DOLLARS
NOTE 21. MINE DEVELOPMENT (continued) Recognition and measurement (continued) Stripping (waste removal) costs (continued) Stripping costs incurred during the production phase are generally considered to create two benefits, being either the production of inventory or improved access to the ore to be mined in the future. Where the benefits are realised in the form of inventory produced in the period, the production stripping costs are accounted for as part of the cost of producing those inventories. Where the benefits are realised in the form of improved access to ore to be mined in the future, the costs are recognised as a non-current asset, referred to as a stripping activity asset, if the following criteria are met: a) Future economic benefits (being improved access to the ore body) are probable; b) The component of the ore body for which access will be improved can be accurately identified; and c) The costs associated with the improved access can be reliably measured. If all of the criteria are not met, the production stripping costs are charged to the statement of profit or loss as operating costs as they are incurred. In identifying components of the ore body, the Group works closely with the mining operations personnel for each mining operation to analyse each of the mine plans. Generally, a component will be a subset of the total ore body, and a mine may have several components. The mine plans, and therefore the identification of components, can vary between mines for a number of reasons. These include, but are not limited to: the geological characteristics of the ore body, the geographical location, and/or financial considerations. The stripping activity asset is initially measured at cost, which is the accumulation of costs directly incurred to perform the stripping activity that improves access to the identified component of ore, plus an allocation of directly attributable overhead costs. If incidental operations are occurring at the same time as the production stripping activity, but are not necessary for the production stripping activity to continue as planned, these costs are not included in the cost of the stripping activity asset. If the costs of the inventory produced and the stripping activity asset are not separately identifiable, a relevant production measure is used to allocate the production stripping costs between the inventory produced and the stripping activity asset. This production measure is calculated for the identified component of the ore body and is used as a benchmark to identify the extent to which the additional activity of creating a future benefit has taken place. The Group uses the expected volume of waste extracted compared with the actual volume for a given volume of ore production of each component. The stripping activity asset is accounted for as an addition to, or an enhancement of, an existing asset, being the mine asset, and is presented as part of ’Mine Development’ in the statement of financial position. The stripping activity asset is subsequently depreciated using the units-of-production method over the life of the identified component of the ore body that became more accessible as a result of the stripping activity. Economically recoverable reserves, which comprise proven and probable reserves, are used to determine the expected useful life of the identified component of the ore body. The stripping activity asset is then carried at cost less depreciation and any impairment losses. Key Judgements, Estimates and Assumptions The Group has assessed that the useful lives of the individual identifiable components of the relative ore bodies are short and that the strip ratio over the life of component is relatively uniform. Accordingly, the Group has accounted for production stripping costs as a production cost in the years ended 30 June 2014 and 2015.
For
per
sona
l use
onl
y

135
PALADIN ENERGY LTD AND CONTROLLED ENTITIES NOTES TO THE CONSOLIDATED FINANCIAL STATEMENTS (continued)
FOR THE YEAR ENDED 30 JUNE 2015
EXPRESSED IN US DOLLARS
NOTE 21. MINE DEVELOPMENT (continued) Recognition and measurement (continued) Proved and Probable Reserves The Group uses the concept of a life of mine as an accounting value to determine such things as depreciation rates and the appropriate period to discount mine closure provisions. In determining life of mine, the proved and probable reserves measured in accordance with the 2004 edition of the JORC Code specific to a mine are taken into account which by their very nature require judgements, estimates and assumptions.
For
per
sona
l use
onl
y

136
PALADIN ENERGY LTD AND CONTROLLED ENTITIES
NOTES TO THE CONDENSED CONSOLIDATED FINANCIAL STATEMENTS (continued)
FOR THE YEAR ENDED 30 JUNE 2015
EXPRESSED IN US DOLLARS
NOTE 22. EXPLORATION AND EVALUATION EXPENDITURE The following table details the expenditures on interests in mineral properties by area of interest for the year ended 30 June 2015:
Areas of interest
Valhalla /Skal
US$M
Isa North
US$M
Fusion
US$M
Angela Pamela
US$M
Bigrlyi
US$M
Niger
US$M
KM
US$M
LHM
US$M
Canada
US$M
Other Uranium Projects
US$M
Total
US$M Balance 30 June 2014 332.5 60.5 11.3 - 10.3 - - - 263.3 9.4 687.3 Acquisition property payments - - - - - - - - - 0.4 0.4
Project exploration and evaluation expenditure
Labour 0.1 0.1 - - - - 0.1 - 1.7 0.6 2.6 Outside services - - - - - - - - 0.4 0.1 0.5 Other expenses 0.2 0.2 0.1 0.1 0.1 - 0.1 - 1.3 0.5 2.6
Total expenditure 0.3 0.3 0.1 0.1 0.1 - 0.2 - 3.4 1.2 5.7 Expenditure expensed (0.3) (0.3) (0.1) (0.1) (0.1) - (0.2) - (0.1) (0.4) (1.6)
Expenditure capitalised - - - - - - - - 3.3 0.8 4.1 Foreign exchange differences (61.2) (11.9) (2.1) - (1.9) - - - (36.2) (1.7) (115.0) Write off of Spinifex Well - - - - - - - - - (1.4) (1.4) Impairment of exploration and evaluation
(181.7)
(38.2)
(9.2)
-
(8.4)
-
-
-
-
-
(237.5)
Balance 30 June 2015 89.6 10.4 - - - - - - 230.4 7.5 337.9
F
or p
erso
nal u
se o
nly

137
PALADIN ENERGY LTD AND CONTROLLED ENTITIES
NOTES TO THE CONDENSED CONSOLIDATED FINANCIAL STATEMENTS (continued)
FOR THE YEAR ENDED 30 JUNE 2015
EXPRESSED IN US DOLLARS
NOTE 22. EXPLORATION AND EVALUATION EXPENDITURE (continued) The following table details the expenditures on interests in mineral properties by area of interest for the year ended 30 June 2014:
Areas of interest
Valhalla /Skal
US$M
Isa North
US$M
Fusion
US$M
Angela Pamela
US$M
Bigrlyi
US$M
Niger
US$M
KM
US$M
LHM
US$M
Canada
US$M
Other Uranium Projects
US$M
Total
US$M Balance 30 June 2013 576.1 137.7 10.9 - 10.0 - - - 261.7 8.5 1,004.9
Project exploration and evaluation expenditure
Labour 0.1 0.1 - 0.1 - 0.1 0.2 - 2.3 0.5 3.4 Outside services - - - - - - 0.2 - 0.9 0.1 1.2 Other expenses 0.3 0.2 0.1 0.2 - 0.1 0.1 - 2.0 0.5 3.5
Total expenditure 0.4 0.3 0.1 0.3 - 0.2 0.5 - 5.2 1.1 8.1 Expenditure expensed - (0.3) - (0.3) - (0.2) (0.5) - - (0.4) (1.7)
Expenditure capitalised 0.4 - 0.1 - - - - - 5.2 0.7 6.4 Foreign exchange differences 2.7 (0.3) 0.3 - 0.3 - - - (3.6) 0.2 (0.4) Impairment of exploration and evaluation
(246.7)
(76.9)
-
-
-
-
-
-
-
-
(323.6)
Balance 30 June 2014 332.5 60.5 11.3 - 10.3 - - - 263.3 9.4 687.3
F
or p
erso
nal u
se o
nly

138
PALADIN ENERGY LTD AND CONTROLLED ENTITIES
NOTES TO THE CONDENSED CONSOLIDATED FINANCIAL STATEMENTS (continued)
FOR THE YEAR ENDED 30 JUNE 2015
EXPRESSED IN US DOLLARS
NOTE 22. EXPLORATION AND EVALUATION EXPENDITURE (continued) Recognition and measurement Exploration and evaluation expenditure related to areas of interest is capitalised and carried forward to the extent that: 1. rights to tenure of the area of interest are current; and 2. costs are expected to be recouped through successful development and exploitation of the area of interest or alternatively by its sale. Exploration and evaluation expenditure is allocated separately to specific areas of interest. Such expenditure comprises net direct costs and an appropriate portion of related overhead expenditure directly related to activities in the area of interest. Costs related to the acquisition of properties that contain Mineral Resources are allocated separately to specific areas of interest. If costs are not expected to be recouped through successful development and exploitation of the area of interest, or alternatively by sale, costs are expensed in the period in which they are incurred. Exploration and evaluation expenditure that is capitalised is included as part of cash flows from investing activities, whereas exploration and evaluation expenditure that is expensed is included as part of cash flows from operating activities. When a decision to proceed to development is made, the exploration and evaluation capitalised to that area is transferred to mine development. All costs subsequently incurred to develop a mine prior to the start of mining operations within the area of interest are capitalised and carried at cost. These costs include expenditure incurred to develop new ore bodies within the area of interest, to define further mineralisation in existing areas of interest, to expand the capacity of a mine and to maintain production. Capitalised amounts for an area of interest may be written down to their recoverable amount if the area of interest’s carrying amount is greater than their estimated recoverable amount. Significant Estimates and Assumptions Carrying Value of Exploration and Evaluation Expenditure The Group reviews the carrying value of exploration and evaluation expenditure at each reporting date. This requires judgement as to the status of the individual projects and their future economic value. At June 2015, the Group reassessed the carrying value of its capitalised exploration and evaluation expenditure for indicators of impairment. Estimates of recoverable amounts are based on a number of market indicators including similar recent market transactions, net asset value calculations, brokers’ sum-of-parts valuations and uranium company trading multiples. Based on this range of indicators the Group has recognised an impairment charge of US$237.5M: Queensland exploration assets US$229.1M and Bigrlyi project US$8.4M. F
or p
erso
nal u
se o
nly
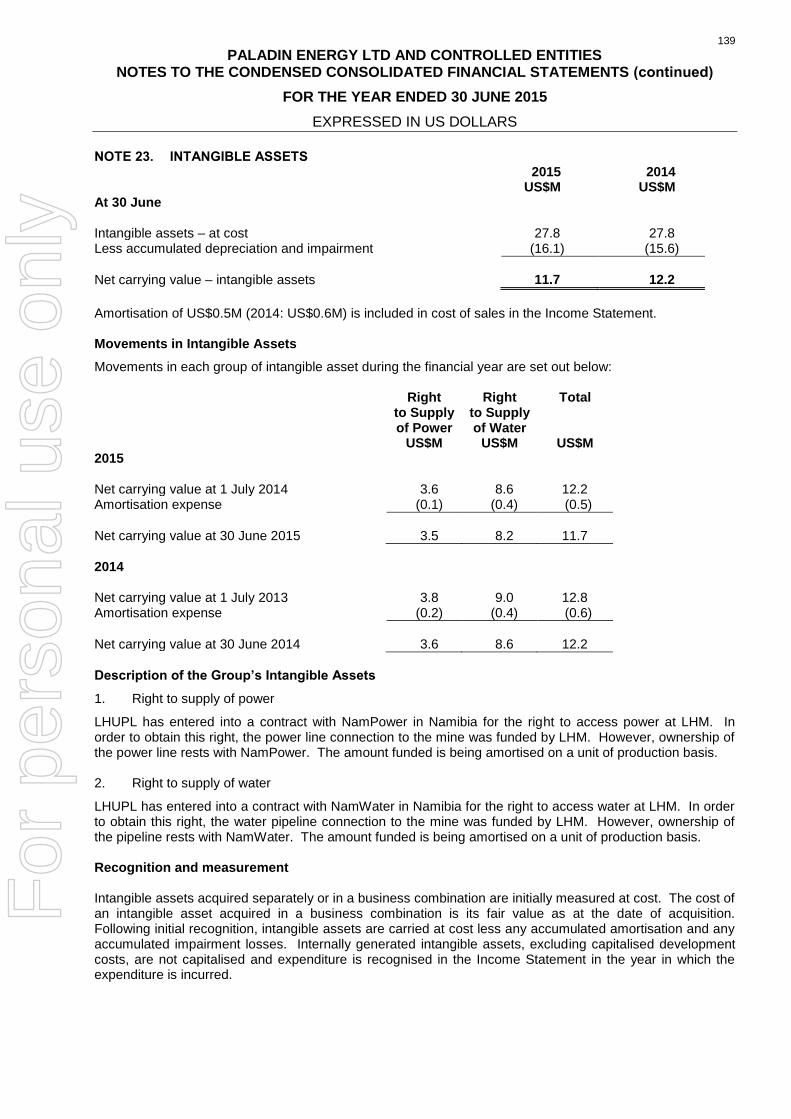
139
PALADIN ENERGY LTD AND CONTROLLED ENTITIES
NOTES TO THE CONDENSED CONSOLIDATED FINANCIAL STATEMENTS (continued)
FOR THE YEAR ENDED 30 JUNE 2015
EXPRESSED IN US DOLLARS
NOTE 23. INTANGIBLE ASSETS
2015
US$M 2014 US$M
At 30 June Intangible assets – at cost 27.8 27.8 Less accumulated depreciation and impairment (16.1) (15.6)
Net carrying value – intangible assets 11.7 12.2
Amortisation of US$0.5M (2014: US$0.6M) is included in cost of sales in the Income Statement. Movements in Intangible Assets
Movements in each group of intangible asset during the financial year are set out below: Right
to Supply of Power
US$M
Right to Supply of Water
US$M
Total
US$M 2015 Net carrying value at 1 July 2014 3.6 8.6 12.2 Amortisation expense (0.1) (0.4) (0.5)
Net carrying value at 30 June 2015 3.5 8.2 11.7
2014 Net carrying value at 1 July 2013 3.8 9.0 12.8 Amortisation expense (0.2) (0.4) (0.6)
Net carrying value at 30 June 2014 3.6 8.6 12.2
Description of the Group’s Intangible Assets
1. Right to supply of power
LHUPL has entered into a contract with NamPower in Namibia for the right to access power at LHM. In order to obtain this right, the power line connection to the mine was funded by LHM. However, ownership of the power line rests with NamPower. The amount funded is being amortised on a unit of production basis. 2. Right to supply of water
LHUPL has entered into a contract with NamWater in Namibia for the right to access water at LHM. In order to obtain this right, the water pipeline connection to the mine was funded by LHM. However, ownership of the pipeline rests with NamWater. The amount funded is being amortised on a unit of production basis. Recognition and measurement Intangible assets acquired separately or in a business combination are initially measured at cost. The cost of an intangible asset acquired in a business combination is its fair value as at the date of acquisition. Following initial recognition, intangible assets are carried at cost less any accumulated amortisation and any accumulated impairment losses. Internally generated intangible assets, excluding capitalised development costs, are not capitalised and expenditure is recognised in the Income Statement in the year in which the expenditure is incurred.
For
per
sona
l use
onl
y
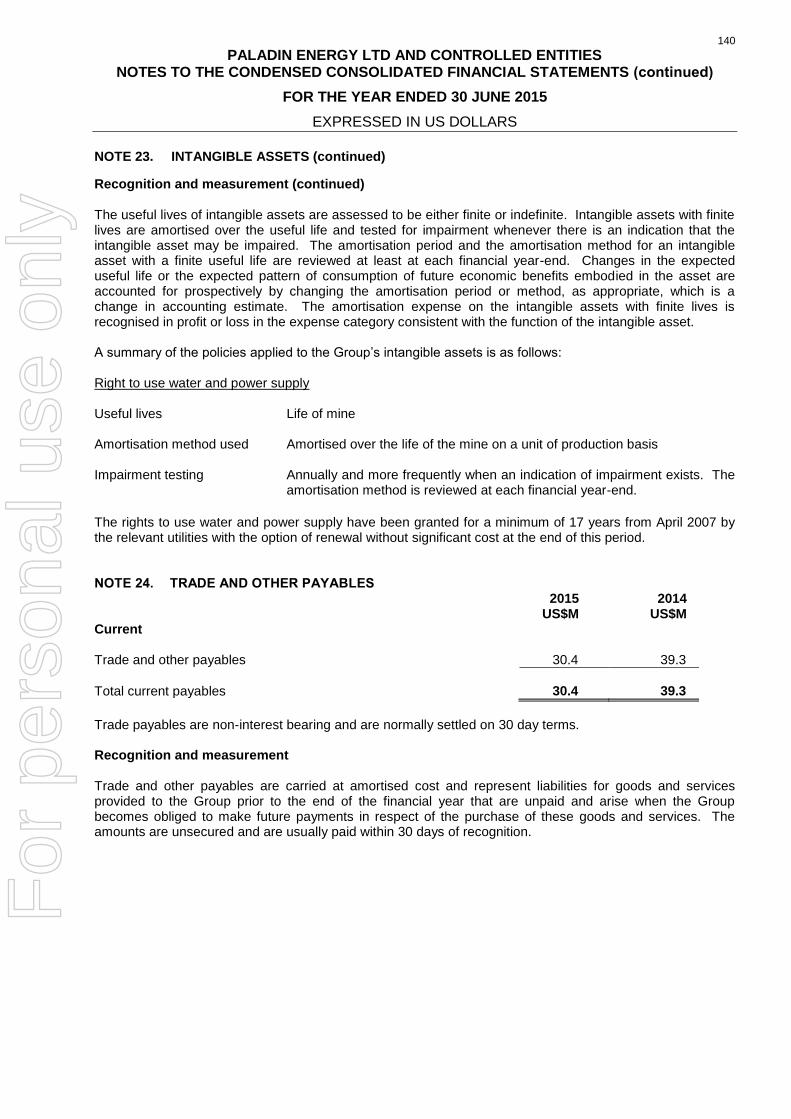
140
PALADIN ENERGY LTD AND CONTROLLED ENTITIES
NOTES TO THE CONDENSED CONSOLIDATED FINANCIAL STATEMENTS (continued)
FOR THE YEAR ENDED 30 JUNE 2015
EXPRESSED IN US DOLLARS
NOTE 23. INTANGIBLE ASSETS (continued)
Recognition and measurement (continued) The useful lives of intangible assets are assessed to be either finite or indefinite. Intangible assets with finite lives are amortised over the useful life and tested for impairment whenever there is an indication that the intangible asset may be impaired. The amortisation period and the amortisation method for an intangible asset with a finite useful life are reviewed at least at each financial year-end. Changes in the expected useful life or the expected pattern of consumption of future economic benefits embodied in the asset are accounted for prospectively by changing the amortisation period or method, as appropriate, which is a change in accounting estimate. The amortisation expense on the intangible assets with finite lives is recognised in profit or loss in the expense category consistent with the function of the intangible asset. A summary of the policies applied to the Group’s intangible assets is as follows: Right to use water and power supply Useful lives Life of mine Amortisation method used Amortised over the life of the mine on a unit of production basis Impairment testing Annually and more frequently when an indication of impairment exists. The
amortisation method is reviewed at each financial year-end.
The rights to use water and power supply have been granted for a minimum of 17 years from April 2007 by the relevant utilities with the option of renewal without significant cost at the end of this period. NOTE 24. TRADE AND OTHER PAYABLES
2015
US$M 2014 US$M
Current Trade and other payables 30.4 39.3
Total current payables 30.4 39.3
Trade payables are non-interest bearing and are normally settled on 30 day terms. Recognition and measurement Trade and other payables are carried at amortised cost and represent liabilities for goods and services provided to the Group prior to the end of the financial year that are unpaid and arise when the Group becomes obliged to make future payments in respect of the purchase of these goods and services. The amounts are unsecured and are usually paid within 30 days of recognition.
For
per
sona
l use
onl
y

141
PALADIN ENERGY LTD AND CONTROLLED ENTITIES
NOTES TO THE CONDENSED CONSOLIDATED FINANCIAL STATEMENTS (continued)
FOR THE YEAR ENDED 30 JUNE 2015
EXPRESSED IN US DOLLARS
NOTE 25. PROVISIONS
Note 2015
US$M 2014 US$M
Current Employee benefits 12 3.5 5.5
Total current provisions 3.5 5.5
Non Current Employee benefits 12 1.4 2.0 Rehabilitation provision 82.5 68.9 Demobilisation provision 1.5 1.8
Total non current provisions 85.4 72.7
Movements in Provisions
Movements in each class of provision during the financial year, excluding provisions relating to employee benefits, are set out below:
Demobilisation US$M
Rehabilitation US$M
Total US$M
At 1 July 2014 1.8 68.9 70.7 Arising during the year 0.1 12.6 12.7 Effects of changes in discount rates (0.2) 6.5 6.3 Foreign currency movements (0.2) (5.5) (5.7)
At 30 June 2015 1.5 82.5 84.0
2015 Current - - - Non current 1.5 82.5 84.0
1.5 82.5 84.0
2014 Current - - - Non current 1.8 68.9 70.7
1.8 68.9 70.7
Nature and Timing of Provisions Rehabilitation
A provision for rehabilitation and mine closure has been recorded in relation to LHM and KM. A provision is made for rehabilitation work when the obligation arises and this is recognised as a cost of production or development as appropriate. Additionally the provision includes the costs of dismantling and demolition of infrastructure or decommissioning, the removal of residual material and the remediation of disturbed areas specific to the infrastructure to a state acceptable to various authorities. The provision is estimated using the assumption that remediation will not take place until 3 to 23 years’ time. Demobilisation
A provision for demobilisation has been recorded in relation to LHM for the costs of demobilising the mining contractor.
For
per
sona
l use
onl
y

142
PALADIN ENERGY LTD AND CONTROLLED ENTITIES
NOTES TO THE CONDENSED CONSOLIDATED FINANCIAL STATEMENTS (continued)
FOR THE YEAR ENDED 30 JUNE 2015
EXPRESSED IN US DOLLARS
NOTE 25. PROVISIONS (continued) Recognition and measurement Provisions
Mine closure and restoration costs include the costs of dismantling and demolition of infrastructure or decommissioning, the removal of residual material and the remediation of disturbed areas specific to the infrastructure. Mine closure costs are provided for in the accounting period when the obligation arising from the related disturbance occurs, whether this occurs during the mine development or during the production phase, based on the net present value of estimated future costs. As the value of the provision for mine closure represents the discounted value of the present obligation to restore, dismantle and close the mine, the increase in this provision due to the passage of time is recognised as a finance cost. The discount rate used is a pre-tax rate that reflects the current market assessment of the time value of money and the risks specific to the liability. Provision is made for rehabilitation work when the obligation arises and this is recognised as a cost of production or development. The rehabilitation costs provided for are the present value of the estimated costs to restore operating locations. The value of the provision represents the discounted value of the current estimate to restore and the discount rate used is the pre-tax rate that reflects the current market assessments of the time value of money and the risks specific to the liability. Employee benefits
Short-term benefits
Liabilities for short-term benefits, including wages and salaries, and accumulating sick leave expected to be settled within 12 months of the reporting date are recognised as a current liability in respect of employees' services up to the reporting date and are measured at the amounts expected to be paid when the liabilities are settled. Liabilities for non-accumulating sick leave are recognised when the leave is taken and measured at the rates paid or payable. Long Service Leave
The liability for long service leave is recognised in the provision for employee benefits and measured as the present value of expected future payments to be made in respect of services provided by employees up to the reporting date. Consideration is given to expected future wage and salary levels, experience of employee departures and periods of service. Expected future payments are discounted using market yields at the reporting date on national government bonds with terms to maturity and currency that match, as closely as possible, the estimated future cash outflows. Significant Accounting Judgements, Estimates and Assumptions Rehabilitation Provision
The value of this provision represents the discounted value of the present obligation to rehabilitate the mine and to restore, dismantle and close the mine. The discounted value reflects a combination of management’s assessment of the cost of performing the work required, the timing of the cash flows and the discount rate. A change in any, or a combination, of the three key assumptions (estimated cash flows, discount rates or inflation rates), used to determine the provision could have a material impact to the carrying value of the provision. F
or p
erso
nal u
se o
nly

143
PALADIN ENERGY LTD AND CONTROLLED ENTITIES
NOTES TO THE CONDENSED CONSOLIDATED FINANCIAL STATEMENTS (continued)
FOR THE YEAR ENDED 30 JUNE 2015
EXPRESSED IN US DOLLARS
NOTE 26. UNEARNED REVENUE
2015 2014 US$M US$M
Non Current Unearned revenue 200.00 200.0
Total unearned revenue 200.00 200.0
Recognition and measurement Revenue from the long-term off-take agreement is a payment for future product to be delivered. Advance customer payments are unearned revenues at the time of receipt. When the product is delivered to the customer the unearned revenue will be released to the Income Statement on an undiscounted basis. Total prepayment of US$200M under a six-year off-take agreement with EdF, a major electricity generator and distribution company in France, to deliver a total of 13.73Mlb U3O8 in the period from 2019 to 2024. Uranium delivered under the off-take agreement will be sold to EdF at market prices prevailing at the time of delivery bounded by escalating floor and ceiling prices. To secure the Company’s obligation to deliver product representing the prepayment amount, EdF holds security over 60.1% of the Group’s Michelin project in Canada. The percentage of Michelin secured will be reduced by joint agreement as the value of that project is enhanced by the Group’s ongoing work. The Michelin security can also be replaced by other appropriate security if required. OTHER NOTES NOTE 27. KEY MANAGEMENT PERSONNEL Details of Key Management Personnel (i) Directors
Mr Rick Crabb Chairman (Non-executive) Mr John Borshoff Managing Director/CEO Mr Sean Llewelyn Director (Non-executive) Mr Donald Shumka Director (Non-executive) Mr Peter Donkin Director (Non-executive) Mr Philip Baily Director (Non-executive) Mr Wendong Zhang Director (Non-executive) (ii) Executives
Ms Gillian Swaby Group Company Secretary and Executive General Manager – Corporate Services
Mr Dustin Garrow Executive General Manager – Marketing Mr Craig Barnes Chief Financial Officer Mr Mark Chalmers Executive General Manager – Production (Resigned effective 30 June 2015)
For
per
sona
l use
onl
y

144
PALADIN ENERGY LTD AND CONTROLLED ENTITIES
NOTES TO THE CONDENSED CONSOLIDATED FINANCIAL STATEMENTS (continued)
FOR THE YEAR ENDED 30 JUNE 2015
EXPRESSED IN US DOLLARS
NOTE 27. KEY MANAGEMENT PERSONNEL (continued) Compensation of Key Management Personnel: Compensation by Category
2015
US$’000 2014 US$’000
Short-term employee benefits 3,666 4,094 Post employment benefits (371) (11) Long-term benefits 142 84 Share-based payment 205 792
3,642 4,959
The average exchange rate used for the year to 30 June 2015 to translate the Australian dollar remuneration to Key Management Personnel was, US$1 = A$1.20149 (2014: US$1 = A$1.09006).
NOTE 28. AUDITORS’ REMUNERATION The auditor of the Paladin Energy Ltd Group is Ernst & Young.
2015
US$’000 2014 US$’000
Amounts received or due and receivable by Ernst & Young (Australia) for:
Audit or review of the financial report of the consolidated Group 319 527
Other services 99 52
Taxation services: Tax compliance services 109 53 International tax consulting 44 30 Other tax advice - 10
Sub-total 571 672
Amounts received or due and receivable by related practices of Ernst & Young (Australia) for:
Audit or review of the financial report of subsidiaries and audit related services
129 143
Taxation services:
Tax compliance services 45 36 International tax consulting - 5 Other 23 4
Sub-total 197 188
The level of non-audit related fees was driven by the tax compliance requirements of multiple jurisdictions and by the specialist advice requirements of potential acquisitions and group restructures. Whilst always striving to meet the highest corporate governance standards, Paladin is also cognisant of the need to retain the value of the best available specialist advice. Paladin engaged Ernst & Young because of their specialised experience in both Africa and the mining sector and Ernst & Young’s detailed understanding of the Paladin Group.
For
per
sona
l use
onl
y

145
PALADIN ENERGY LTD AND CONTROLLED ENTITIES
NOTES TO THE CONDENSED CONSOLIDATED FINANCIAL STATEMENTS (continued)
FOR THE YEAR ENDED 30 JUNE 2015
EXPRESSED IN US DOLLARS
NOTE 28. AUDITORS’ REMUNERATION (continued) In terms of the Company’s Corporate Governance Policy all non-audit services are reviewed and approved by the Audit Committee prior to commencement to ensure that they do not adversely affect the integrity and objectivity of the auditor and that the nature of the services provided does not compromise the Code of Ethics for Professional Accountants APES 110 issued by the Accounting Professional and Ethical Standards Board. All non-audit services provided by Ernst & Young were allowable services that received the sign off of the audit partner confirming that, in his professional opinion, they do not in any way impair the independence of the firm. Where any service might be perceived to be subjective, Ernst & Young policy requires approval by the Oceania Independence and Conflicts Leader.
NOTE 29. COMMITMENTS AND CONTINGENCIES There were no outstanding commitments or contingencies, which are not disclosed in the Financial Report of the Group as at 30 June 2015 other than:
2015
US$M 2014 US$M
Tenements Commitments for tenements contracted for at the reporting date but not recognised as liabilities, payable: Within one year 0.6 2.6 Later than one year but not later than 5 years 9.8 6.4 More than 5 years 11.2 16.8
Total tenements commitment 21.6 25.8
These include commitments relating to tenement lease rentals and the minimum expenditure requirements of the Namibian, Malawian, Canadian, Western Australian, South Australian, Northern Territorian and Queensland Mines Departments attaching to the tenements and are subject to re-negotiation upon expiry of the exploration leases or when application for a mining licence is made. These are necessary in order to maintain the tenements in which the Group and other parties are involved. All parties are committed to meet the conditions under which the tenements were granted in accordance with the relevant mining legislation in Namibia, Malawi, Australia and Canada. Operating Lease Commitments The Group has entered into various property leases relating to rental of offices and residential accommodation. These non-cancellable leases have remaining terms of between 1 month and 13 months. All leases include a clause to enable upward revision of rental charge on an annual basis according to prevailing market conditions.
Future minimum rentals payable under non-cancellable operating leases as at 30 June are as follows:
2015
US$M 2014 US$M
Within one year 0.8 1.0 Later than one year but not later than 5 years 0.1 1.0 More than 5 years - -
Total operating lease commitment 0.9 2.0
For
per
sona
l use
onl
y
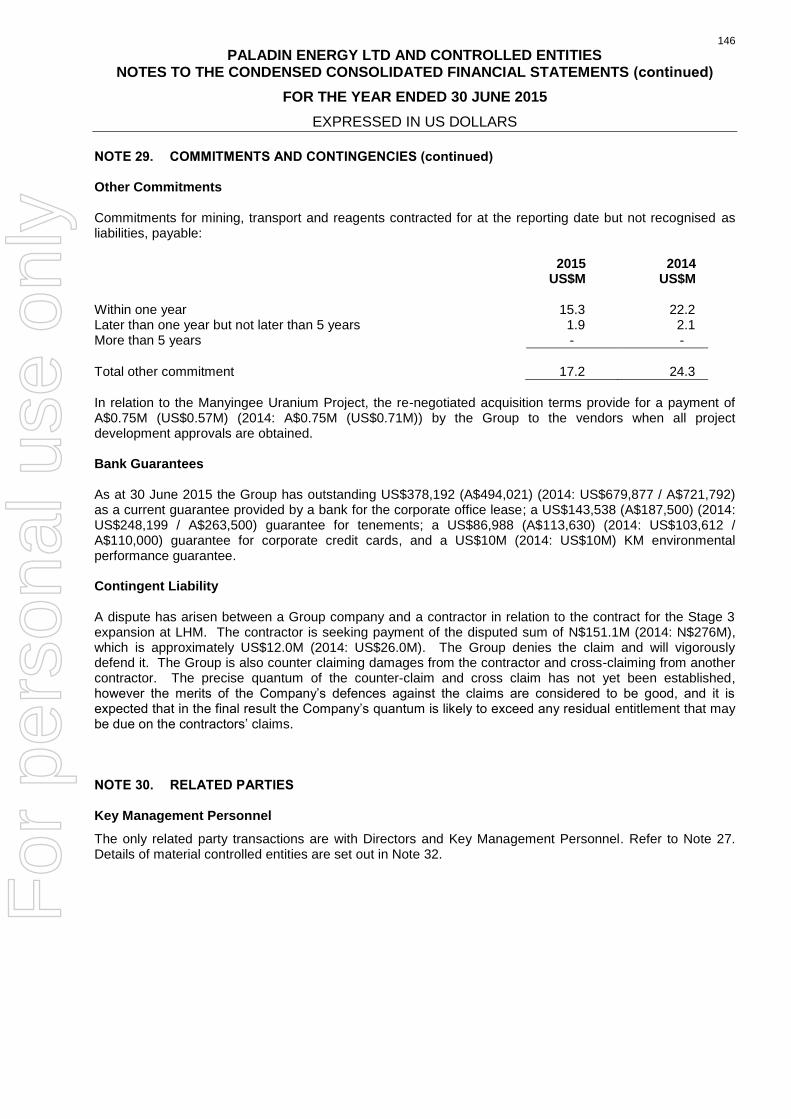
146
PALADIN ENERGY LTD AND CONTROLLED ENTITIES
NOTES TO THE CONDENSED CONSOLIDATED FINANCIAL STATEMENTS (continued)
FOR THE YEAR ENDED 30 JUNE 2015
EXPRESSED IN US DOLLARS
NOTE 29. COMMITMENTS AND CONTINGENCIES (continued) Other Commitments Commitments for mining, transport and reagents contracted for at the reporting date but not recognised as liabilities, payable:
2015
US$M 2014 US$M
Within one year 15.3 22.2 Later than one year but not later than 5 years 1.9 2.1 More than 5 years - -
Total other commitment 17.2 24.3
In relation to the Manyingee Uranium Project, the re-negotiated acquisition terms provide for a payment of A$0.75M (US$0.57M) (2014: A$0.75M (US$0.71M)) by the Group to the vendors when all project development approvals are obtained. Bank Guarantees As at 30 June 2015 the Group has outstanding US$378,192 (A$494,021) (2014: US$679,877 / A$721,792) as a current guarantee provided by a bank for the corporate office lease; a US$143,538 (A$187,500) (2014: US$248,199 / A$263,500) guarantee for tenements; a US$86,988 (A$113,630) (2014: US$103,612 / A$110,000) guarantee for corporate credit cards, and a US$10M (2014: US$10M) KM environmental performance guarantee. Contingent Liability A dispute has arisen between a Group company and a contractor in relation to the contract for the Stage 3 expansion at LHM. The contractor is seeking payment of the disputed sum of N$151.1M (2014: N$276M), which is approximately US$12.0M (2014: US$26.0M). The Group denies the claim and will vigorously defend it. The Group is also counter claiming damages from the contractor and cross-claiming from another contractor. The precise quantum of the counter-claim and cross claim has not yet been established, however the merits of the Company’s defences against the claims are considered to be good, and it is expected that in the final result the Company’s quantum is likely to exceed any residual entitlement that may be due on the contractors’ claims. NOTE 30. RELATED PARTIES Key Management Personnel
The only related party transactions are with Directors and Key Management Personnel. Refer to Note 27. Details of material controlled entities are set out in Note 32.
For
per
sona
l use
onl
y

147
PALADIN ENERGY LTD AND CONTROLLED ENTITIES
NOTES TO THE CONDENSED CONSOLIDATED FINANCIAL STATEMENTS (continued)
FOR THE YEAR ENDED 30 JUNE 2015
EXPRESSED IN US DOLLARS
NOTE 31. SHARE-BASED PAYMENT PLANS
2015
US$M 2014 US$M
Share-based payment expense 0.5 0.5
The share-based payment plans are described in the Directors’ Remuneration Report. 1,791,992 (2014: 1,621,104) share rights were granted during the year as an allocation to those employees affected by the 10% reduction in management personnel salaries. Summaries of Performance Share Rights Granted Under the Rights Plans The following table illustrates the number (No.) of and movements in share rights issued during the year: 2015
No. 2014 No.
Outstanding at the beginning of the year 2,079,094 3,358,957 Granted during the year(1) 1,791,992 1,671,104 Forfeited during the year (694,260) (1,307,162) Vested during the year(2) (2,388,072) (1,643,805)
Outstanding at the end of the year 788,754 2,079,094
(1) 306,888 rights were granted under the Contractor Performance Share Rights Plan (2014: 240,690). (2) The weighted average share price at the vesting date is A$0.35 (2014: A$0.48). The outstanding balance as at 30 June 2015 is represented by: Date rights granted Vesting date Vesting Performance Conditions Number 1 December 2014 1 December 2015 Time based 788,754
Total 788,754
Please refer to Outstanding Share Information table in the Management Discussion & Analysis for movements since the year end. Weighted Average Remaining Contractual Life The weighted average remaining contractual life for the share rights outstanding as at 30 June 2015 is 0.4 years (2014: 0.3 years). Weighted Average Fair Value The weighted average fair value of share rights granted during the year was A$0.32 (2014: A$0.41). Rights Pricing Model The fair value of the equity-settled share rights granted under the plan is estimated as at the date of grant using either the Black-Scholes valuation model for rights with non-market based performance conditions (time based and EPS) or the Monte-Carlo simulation model for rights that contained a market based performance condition (TSR and market price). Recognition and measurement Share-based compensation benefits are provided to employees via the Employee Performance Share Rights Plan and the Contractor Performance Share Rights Plan (Rights Plans). The fair value of rights granted under the Rights Plans is recognised as an employee benefit expense with a corresponding increase in equity. The fair value is measured at grant date and recognised over the period during which the employees become unconditionally entitled to the rights.
For
per
sona
l use
onl
y
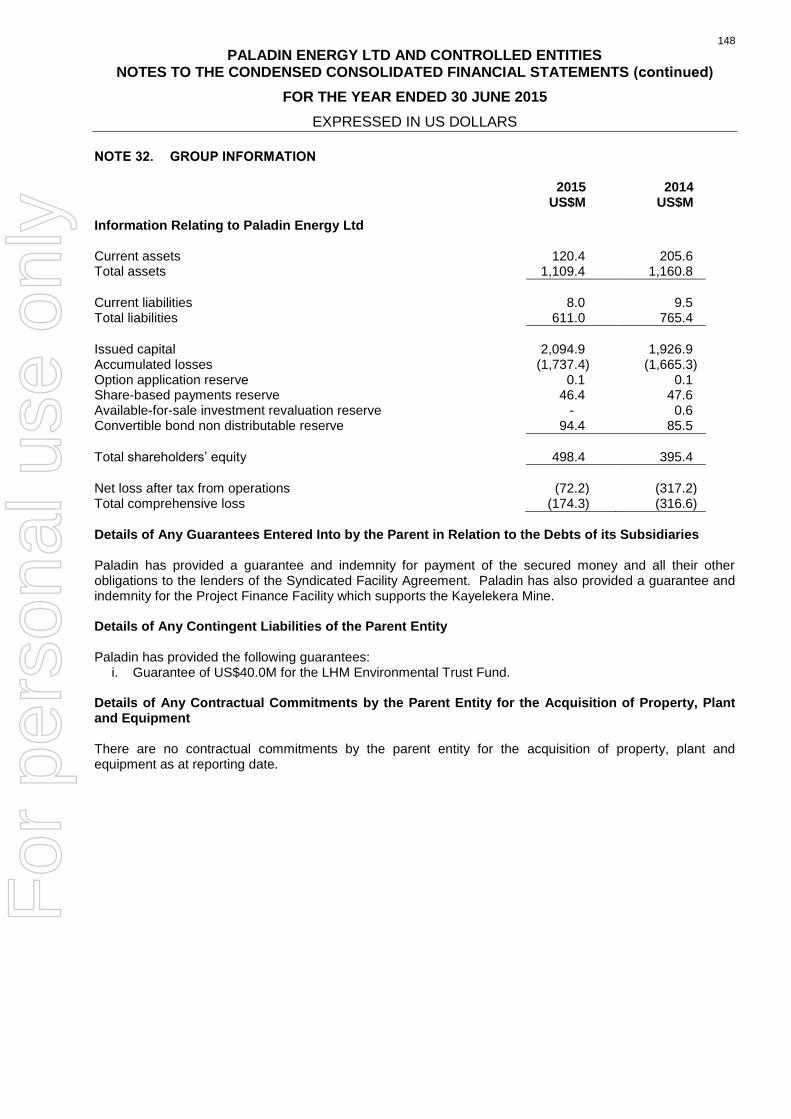
148
PALADIN ENERGY LTD AND CONTROLLED ENTITIES
NOTES TO THE CONDENSED CONSOLIDATED FINANCIAL STATEMENTS (continued)
FOR THE YEAR ENDED 30 JUNE 2015
EXPRESSED IN US DOLLARS
NOTE 32. GROUP INFORMATION
2015
US$M 2014 US$M
Information Relating to Paladin Energy Ltd Current assets 120.4 205.6 Total assets 1,109.4 1,160.8
Current liabilities 8.0 9.5 Total liabilities 611.0 765.4
Issued capital 2,094.9 1,926.9 Accumulated losses (1,737.4) (1,665.3) Option application reserve 0.1 0.1 Share-based payments reserve 46.4 47.6 Available-for-sale investment revaluation reserve - 0.6 Convertible bond non distributable reserve 94.4 85.5
Total shareholders’ equity 498.4 395.4
Net loss after tax from operations (72.2) (317.2) Total comprehensive loss (174.3) (316.6)
Details of Any Guarantees Entered Into by the Parent in Relation to the Debts of its Subsidiaries
Paladin has provided a guarantee and indemnity for payment of the secured money and all their other obligations to the lenders of the Syndicated Facility Agreement. Paladin has also provided a guarantee and indemnity for the Project Finance Facility which supports the Kayelekera Mine. Details of Any Contingent Liabilities of the Parent Entity Paladin has provided the following guarantees:
i. Guarantee of US$40.0M for the LHM Environmental Trust Fund. Details of Any Contractual Commitments by the Parent Entity for the Acquisition of Property, Plant and Equipment There are no contractual commitments by the parent entity for the acquisition of property, plant and equipment as at reporting date.
For
per
sona
l use
onl
y

149
PALADIN ENERGY LTD AND CONTROLLED ENTITIES
NOTES TO THE CONDENSED CONSOLIDATED FINANCIAL STATEMENTS (continued)
FOR THE YEAR ENDED 30 JUNE 2015
EXPRESSED IN US DOLLARS
NOTE 32. GROUP INFORMATION (continued) Tax Consolidation Paladin and its 100% owned Australian resident subsidiaries formed a tax consolidated group (the Group) with effect from 1 July 2003. Paladin is the head entity of the Group. Members of the Group have entered into a tax-sharing agreement that provides that the head entity will be liable for all taxes payable by the Group from the consolidation date. The parties have agreed to apportion the head entity’s taxation liability within the Group based on each contributing member’s share of the Group’s taxable income and losses. Investments in Material Controlled Entities NAME COUNTRY OF
INCORPORATION PERCENTAGE
INTEREST HELD 2015
% 2014 %
Paladin Finance Pty Ltd Australia 100 100 Paladin Energy Minerals NL Australia 100 100 PEM Malawi Pty Ltd Australia 100 100 Eden Creek Pty Ltd Australia 100 100 Paladin Asset Management Pty Ltd Australia 100 100 Paladin (Africa) Limited Malawi 85 85 Kayelekera Holdings SA (liquidated 2015) Switzerland - 100 Paladin Netherlands BV Netherlands 100 100 Paladin Netherlands Holdings Cooperatief U.A. Netherlands 100 100 Langer Heinrich Mauritius Holdings Ltd Mauritius 75 75 Langer Heinrich Uranium (Pty) Ltd Namibia 75 75 Valhalla Uranium Pty Ltd Australia 100 100 Northern Territory Uranium Pty Ltd Australia 100 100 Mount Isa Uranium Pty Ltd Australia 100 100 Paladin Nuclear Ltd Australia 100 100 Summit Resources Ltd Australia 82 82 Summit Resources (Aust) Pty Ltd Australia 82 82 Pacific Mines Pty Ltd Australia 82 82 Paladin NT Pty Ltd Australia 100 100 Paladin Intellectual Property Pty Ltd Australia 100 100 Fusion Resources Pty Ltd Australia 100 100 NGM Resources Pty Ltd Australia 100 100 Indo Energy Ltd B.V.I. 100 100 Paladin Energy Canada Ltd Canada 100 100 Michelin Uranium Ltd Canada 100 100 Paladin Canada Investment (NL) Ltd Canada 100 100 Paladin Canada Holdings (NL) Ltd Canada 100 100 Aurora Energy Ltd Canada 100 100 All investments comprise ordinary shares and all shares held are unquoted, with the exception of Summit’s shares, which are quoted on the ASX and Paladin Netherlands Holdings Cooperatief U.A. which issues membership equity. Financial information of subsidiaries that have material non-controlling interests is provided below: Proportion of equity interest held by non-controlling interests Name COUNTRY OF
OPERATION
2015 %
2014 %
Paladin (Africa) Limited (PAL) Malawi 15 15 Summit Resources Ltd (SRL) Australia 18 18 Langer Heinrich Mauritius (LHM) Mauritius 25 25
For
per
sona
l use
onl
y
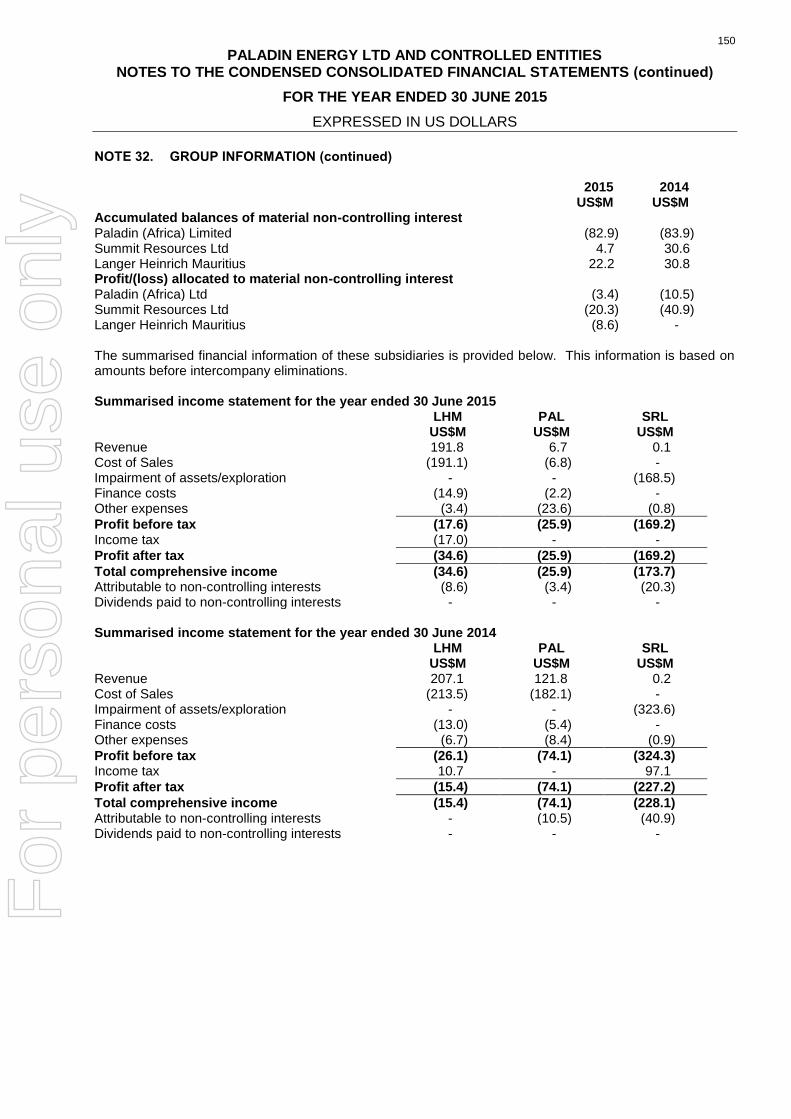
150
PALADIN ENERGY LTD AND CONTROLLED ENTITIES
NOTES TO THE CONDENSED CONSOLIDATED FINANCIAL STATEMENTS (continued)
FOR THE YEAR ENDED 30 JUNE 2015
EXPRESSED IN US DOLLARS
NOTE 32. GROUP INFORMATION (continued) 2015
US$M 2014 US$M
Accumulated balances of material non-controlling interest Paladin (Africa) Limited (82.9) (83.9) Summit Resources Ltd 4.7 30.6 Langer Heinrich Mauritius 22.2 30.8 Profit/(loss) allocated to material non-controlling interest Paladin (Africa) Ltd (3.4) (10.5) Summit Resources Ltd (20.3) (40.9) Langer Heinrich Mauritius (8.6) - The summarised financial information of these subsidiaries is provided below. This information is based on amounts before intercompany eliminations. Summarised income statement for the year ended 30 June 2015 LHM PAL SRL US$M US$M US$M Revenue 191.8 6.7 0.1 Cost of Sales (191.1) (6.8) - Impairment of assets/exploration - - (168.5) Finance costs (14.9) (2.2) - Other expenses (3.4) (23.6) (0.8)
Profit before tax (17.6) (25.9) (169.2) Income tax (17.0) - -
Profit after tax (34.6) (25.9) (169.2)
Total comprehensive income (34.6) (25.9) (173.7) Attributable to non-controlling interests (8.6) (3.4) (20.3) Dividends paid to non-controlling interests - - - Summarised income statement for the year ended 30 June 2014 LHM PAL SRL US$M US$M US$M Revenue 207.1 121.8 0.2 Cost of Sales (213.5) (182.1) - Impairment of assets/exploration - - (323.6) Finance costs (13.0) (5.4) - Other expenses (6.7) (8.4) (0.9)
Profit before tax (26.1) (74.1) (324.3) Income tax 10.7 - 97.1
Profit after tax (15.4) (74.1) (227.2)
Total comprehensive income (15.4) (74.1) (228.1) Attributable to non-controlling interests - (10.5) (40.9) Dividends paid to non-controlling interests - - -
For
per
sona
l use
onl
y

151
PALADIN ENERGY LTD AND CONTROLLED ENTITIES
NOTES TO THE CONDENSED CONSOLIDATED FINANCIAL STATEMENTS (continued)
FOR THE YEAR ENDED 30 JUNE 2015
EXPRESSED IN US DOLLARS
NOTE 32. GROUP INFORMATION (continued) Summarised statement of financial position as at 30 June 2015 LHM PAL SRL US$M US$M US$M Current assets 122.3 12.6 1.6 Non current assets 483.9 127.5 31.4 Current liabilities (46.2) (123.2) (0.1) Non current liabilities (468.5) (569.0) (10.2)
Total equity 91.5 (552.1) 22.7
Attributable to: -Equity holders of parent 69.3 (469.2) 18.0 -Non-controlling interest 22.2 (82.9) 4.7 Summarised statement of financial position as at 30 June 2014 LHM PAL SRL US$M US$M US$M Current assets 112.0 47.0 2.5 Non current assets 579.3 127.2 236.7 Current liabilities (45.4) (126.6) (0.1) Non current liabilities (522.9) (606.7) (71.8)
Total equity 123.0 (559.1) 167.3
Attributable to: -Equity holders of parent 92.2 (475.2) 136.7 -Non-controlling interest 30.8 (83.9) 30.6 Summarised statement of cash flow for the year ended 30 June 2015 LHM PAL SRL US$M US$M US$M Operating 29.0 (0.5) (0.2) Investing (10.2) 0.6 (0.3) Financing - - -
Net decrease in cash and cash equivalents 18.8 0.1 (0.5)
Summarised statement of cash flow for the year ended 30 June 2014 LHM PAL SRL US$M US$M US$M Operating 57.5 25.1 (0.4) Investing (12.9) (6.8) (0.2) Financing (25.4) (26.1) -
Net decrease in cash and cash equivalents 19.2 (7.8) (0.6)
For
per
sona
l use
onl
y

152
PALADIN ENERGY LTD AND CONTROLLED ENTITIES
NOTES TO THE CONDENSED CONSOLIDATED FINANCIAL STATEMENTS (continued)
FOR THE YEAR ENDED 30 JUNE 2015
EXPRESSED IN US DOLLARS
NOTE 33. EVENTS AFTER THE BALANCE DATE Other than disclosed below, since the end of the financial year, the Directors are not aware of any other matter or circumstance not otherwise dealt with in this report, that has significantly or may significantly affect the operations of the Group, the results of those operations or the state of affairs of the Group in subsequent years with the exception of the following, the financial effects of which have not been provided for in the 30 June 2015 Financial Report: Material Reduction in Costs On 30 July 2015, the Company advised of a material reduction in its cash flow break-even level through a sustainable reduction in its all-in cash costs (including capital expenditure, corporate costs and debt servicing). Subsequent to the cost reductions announced on 30 July 2015, Paladin has identified further significant cash flow optimisation initiatives. Such initiatives include:
LHM operating initiatives – As a consequence of the BRP, barren solution used for wash in the counter current decantation section of the LHM plant is expected to reduce from approximately 50ppm U3O8 to less than 10ppm. This will result in a significant improvement in wash efficiency. The Company’s original FY2016 outlook assumed wash efficiency of 93.1%. Paladin now anticipates a wash efficiency in the range of 95% to 98% for FY2016. The Company has also revised its FY2016 life of mine plan for LHM resulting in an average feed-grade of 694ppm U3O8, i.e., an increase of 11ppm over the guidance provided in the last Quarterly Activities Report announced on 16 July 2015.
Corporate costs, exploration and KM initiatives – Paladin has implemented reductions in these areas to further reduce annualised cash expenditure over the initiatives set out in the cost reduction announcement of 30 July 2015. The additional initiatives include a reduction in approximately 50% of corporate staff that was undertaken on 21 August 2015 concurrent with the reduction in the number of directors and reduction in board fees announced the same day. Exploration has been put on care and maintenance whereby the Company will undertake the work required to meet minimum license expenditures only.
Change of Chief Executive Officer On 30 July 2015, the Company advised that its Board and Managing Director and CEO Mr John Borshoff had agreed that Mr Borshoff would step down from his role with the Company. A process to identify a suitable new CEO is now underway. In the interim, Mr Alexander Molyneux has been appointed Interim CEO. Mr Molyneux joins with substantial experience in natural resources executive leadership, including both public mining company CEO and uranium experience. Mr Molyneux’s core mandate will be to: (i) to continue the optimisation of Paladin’s overall cash flow break-even level with the aim to become cash flow generative in the current uranium price environment; (ii) focus on accelerating strategic initiatives that deliver value; and (iii) to assist the Board in its search for a permanent CEO.
For
per
sona
l use
onl
y

153
PALADIN ENERGY LTD AND CONTROLLED ENTITIES
NOTES TO THE CONDENSED CONSOLIDATED FINANCIAL STATEMENTS (continued)
FOR THE YEAR ENDED 30 JUNE 2015
EXPRESSED IN US DOLLARS
NOTE 34. EVENTS AFTER THE BALANCE DATE (continued)
Board and Management Restructuring On 21 August 2015, the Company advised of board and management changes, and a reduction in board remuneration. Paladin’s board accepted the resignation of Non-Executive Director Mr Sean Llewelyn. Ms Gillian Swaby, Group Company Secretary and EGM Corporate Services, and the Company agreed Ms Swaby would step down from her role at the Company. Mr Ranko Matic was appointed Company Secretary. Paladin’s board adjusted its remuneration structure with an effective date of 1 July 2015. The revised structure will alter the base salary for Non-Executive Directors to A$65,000 and the Non-Executive Chairman to A$125,000.
For
per
sona
l use
onl
y

154
PALADIN ENERGY LTD AND CONTROLLED ENTITIES
NOTES TO THE CONDENSED CONSOLIDATED FINANCIAL STATEMENTS (continued)
FOR THE YEAR ENDED 30 JUNE 2015
EXPRESSED IN US DOLLARS
NOTE 35. NEW ACCOUNTING STANDARDS AND INTERPRETATIONS
Accounting Standards and Interpretations issued but not yet effective
The following Australian Accounting Standards that have recently been issued or amended but are not yet effective are relevant to the Group but have not been applied by the Group for the annual reporting period ending 30 June 2015:
Reference Title Summary Application date of standard*
Application date for Group*
AASB 9/IFRS 9 Financial Instruments AASB 9 (December 2014) is a new standard which replaces AASB 139. This new version supersedes AASB 9 issued in December 2009 (as amended) and AASB 9 (issued in December 2010) and includes a model for classification and measurement, a single, forward-looking ‘expected loss’ impairment model and a substantially reformed approach to hedge accounting. AASB 9 is effective for annual periods beginning on or after 1 January 2018. However, the Standard is available for early adoption. The own credit changes can be early adopted in isolation without otherwise changing the accounting for financial instruments. Classification and measurement AASB 9 includes requirements for a simpler approach for classification and measurement of financial assets compared with the requirements of AASB 139. There are also some changes made in relation to financial liabilities. The main changes are described below. Financial assets a. Financial assets that are debt instruments will be classified based on (1) the objective of the entity's business model for managing the financial assets; (2) the characteristics of the contractual cash flows. b. Allows an irrevocable election on initial recognition to present gains and losses on investments in equity instruments that are not held for trading in other comprehensive income. Dividends in respect of these investments that are a return on investment can be recognised in profit or loss and there is no impairment or recycling on disposal of the instrument. c. Financial assets can be designated and measured at fair value through profit or loss at initial recognition if doing so eliminates or significantly reduces a measurement or recognition inconsistency that would arise from measuring assets or liabilities, or recognising the gains and losses on them, on different bases. Financial liabilities Changes introduced by AASB 9 in respect of financial liabilities are limited to the measurement of liabilities designated at fair value through profit or loss (FVPL) using the fair value option. Where the fair value option is used for financial liabilities, the change in fair value is to be accounted for as follows: ► The change attributable to changes in credit risk are presented in other comprehensive income (OCI) ► The remaining change is presented in profit or loss
1 January 2018 1 July 2018
For
per
sona
l use
onl
y

155
PALADIN ENERGY LTD AND CONTROLLED ENTITIES
NOTES TO THE CONDENSED CONSOLIDATED FINANCIAL STATEMENTS (continued)
FOR THE YEAR ENDED 30 JUNE 2015
EXPRESSED IN US DOLLARS
NOTE 34. NEW ACCOUNTING STANDARDS AND INTERPRETATIONS (continued)
Accounting Standards and Interpretations issued but not yet effective (continued)
Reference Title Summary Application date of standard*
Application date for Group*
AASB 9 also removes the volatility in profit or loss that was caused by changes in the credit risk of liabilities elected to be measured at fair value. This change in accounting means that gains or losses attributable to changes in the entity’s own credit risk would be recognised in OCI. These amounts recognised in OCI are not recycled to profit or loss if the liability is ever repurchased at a discount.
Impairment
The final version of AASB 9 introduces a new expected-loss impairment model that will require more timely recognition of expected credit losses. Specifically, the new Standard requires entities to account for expected credit losses from when financial instruments are first recognised and to recognise full lifetime expected losses on a more timely basis.
Hedge accounting
Amendments to AASB 9 (December 2009 & 2010 editions and AASB 2013-9) issued in December 2013 included the new hedge accounting requirements, including changes to hedge effectiveness testing, treatment of hedging costs, risk components that can be hedged and disclosures.
Consequential amendments were also made to other standards as a result of AASB 9, introduced by AASB 2009-11 and superseded by AASB 2010-7, AASB 2010-10 and AASB 2014-1 – Part E.
AASB 2014-7 incorporates the consequential amendments arising from the issuance of AASB 9 in Dec 2014.
AASB 2014-8 limits the application of the existing versions of AASB 9 (AASB 9 (December 2009) and AASB 9 (December 2010)) from 1 February 2015 and applies to annual reporting periods beginning on after 1 January 2015.
AASB 2014-3 Amendments to Australian Accounting
Standards – Accounting for Acquisitions
of Interests in Joint Operations
[AASB 1 & AASB 11]
AASB 2014-3 amends AASB 11 Joint Arrangements to provide guidance on the accounting for acquisitions of interests in joint operations in which the activity constitutes a business. The amendments require: (a) the acquirer of an interest in a joint operation in which the activity constitutes a business, as defined in AASB 3 Business Combinations, to apply all of the principles on business combinations accounting in AASB 3 and other Australian Accounting Standards except for those principles that conflict with the guidance in AASB 11; and (b) the acquirer to disclose the information required by AASB 3 and other Australian Accounting Standards for business combinations.
This Standard also makes an editorial correction to AASB 11
1 January 2016 1 July 2016
AASB 15 Revenue from Contracts with
Customers
In May 2014, the IASB issued IFRS 15 Revenue from Contracts with Customers, which replaces IAS 11 Construction Contracts, IAS 18 Revenue and related Interpretations (IFRIC 13 Customer Loyalty Programmes, IFRIC 15 Agreements for the Construction of Real Estate, IFRIC 18 Transfers of Assets from Customers and SIC-31 Revenue—Barter Transactions Involving Advertising Services).
The core principle of IFRS 15 is that an entity recognises revenue to depict the transfer of promised goods or services to customers in an amount that reflects the consideration to which the entity expects to be entitled in exchange for those goods or services. An entity recognises revenue in accordance with that core principle by applying the following steps: (a) Step 1: Identify the contract(s) with a customer (b) Step 2: Identify the performance obligations in the contract
1 January 2017
Note A
1 July 2017
Note B For
per
sona
l use
onl
y

156
PALADIN ENERGY LTD AND CONTROLLED ENTITIES
NOTES TO THE CONDENSED CONSOLIDATED FINANCIAL STATEMENTS (continued)
FOR THE YEAR ENDED 30 JUNE 2015
EXPRESSED IN US DOLLARS
NOTE 34. NEW ACCOUNTING STANDARDS AND INTERPRETATIONS (continued) Accounting Standards and Interpretations issued but not yet effective (continued)
Reference Title Summary Application date of standard*
Application date for Group*
(c) Step 3: Determine the transaction price (d) Step 4: Allocate the transaction price to the performance obligations in the contract (e) Step 5: Recognise revenue when (or as) the entity satisfies a performance obligation The AASB issued the Australian equivalent of IFRS 15, being AASB 15, in December 2014. Currently, these standards are effective for annual reporting periods commencing on or after 1 January 2017. Early application is permitted. (Note A) AASB 2014-5 incorporates the consequential amendments to a number Australian Accounting Standards (including Interpretations) arising from the issuance of AASB 15.
AASB 2014-10 Amendments to Australian Accounting Standards – Sale or Contribution of Assets between an Investor and its
Associate or Joint Venture
AASB 2014-10 amends AASB 10 Consolidated Financial Statements and AASB 128 to address an inconsistency between the requirements in AASB 10 and those in AASB 128 (August 2011), in dealing with the sale or contribution of assets between an investor and its associate or joint venture. The amendments require: (a) a full gain or loss to be recognised when a transaction involves a business (whether it is housed in a subsidiary or not); and (b) a partial gain or loss to be recognised when a transaction involves assets that do not constitute a business, even if these assets are housed in a subsidiary. AASB 2014-10 also makes an editorial correction to AASB 10. AASB 2014-10 applies to annual reporting periods beginning on or after 1 January 2016. Early adoption permitted.
1 January 2016 1 July 2016
AASB 2015-2 Amendments to Australian Accounting Standards – Disclosure Initiative: Amendments to AASB 101
The Standard makes amendments to AASB 101 Presentation of Financial Statements arising from the IASB’s Disclosure Initiative project. The amendments are designed to further encourage companies to apply professional judgment in determining what information to disclose in the financial statements. For example, the amendments make clear that materiality applies to the whole of financial statements and that the inclusion of immaterial information can inhibit the usefulness of financial disclosures. The amendments also clarify that companies should use professional judgment in determining where and in what order information is presented in the financial disclosures.
1 January 2016 1 July 2016
AASB 2015-3 Amendments to Australian Accounting Standards arising from the Withdrawal of AASB 1031 Materiality
The Standard completes the AASB’s project to remove Australian guidance on materiality from Australian Accounting Standards.
1 July 2015 1 July 2015
* Designates the beginning of the applicable annual reporting period unless otherwise stated.
Note A: The IASB and the AASB have proposed a one year deferral to IFRS 15/AASB 15, which if approved, would move the effective date to annual reporting periods commencing on or after 1 January 2018.
The potential effect of these Standards is yet to be fully determined. For Standards and Interpretations effective from 1 July 2015, it is not expected that the new Standards and Interpretations will significantly affect the Group’s financial performance.
For
per
sona
l use
onl
y
157
DIRECTORS’ DECLARATION __________________________________________________________________________________
In accordance with a resolution of the Directors of Paladin Energy Ltd, I state that: In the opinion of the Directors:
(a) the financial statements and notes of Paladin Energy Ltd are in accordance with the Corporations
Act 2001, including:
(i) giving a true and fair view of the consolidated entity’s financial position as at 30 June 2015 and of its performance for the year ended on that date; and
(ii) complying with Australian Accounting Standards (including the Australian Accounting Interpretations) and the Corporations Regulations 2001;
(b) the financial statements and notes also comply with International Financial Reporting Standards as
disclosed in note 3;
(c) there are reasonable grounds to believe that the Company will be able to pay its debts as and when they become due and payable; and
(d) this declaration has been made after receiving the declarations required to be made to the
Directors in accordance with section 295A of the Corporations Act 2001 for the financial year ending 30 June 2015.
On behalf of the Board
Rick Crabb Chairman Perth, Western Australia 27 August 2015
For
per
sona
l use
onl
y
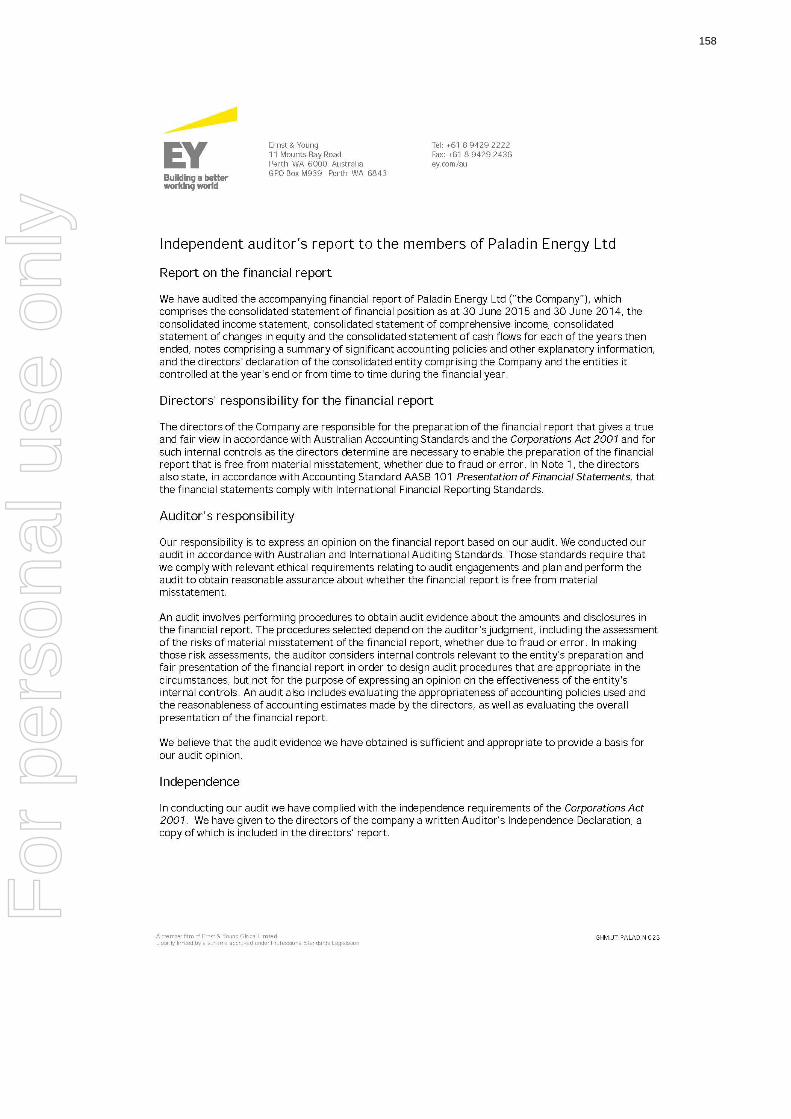
158
For
per
sona
l use
onl
y

159
For
per
sona
l use
onl
y

160
ADDITIONAL INFORMATION __________________________________________________________________________________
Pursuant to the Listing Requirements of ASX as at 25 August 2015: (a) Distribution and number of holders
Range Total Holders No. of Shares
1 - 1,000 8,251 4,142,702 1,001 - 5,000 9,287 24,822,439 5,001 - 10,000 3,439 26,785,891 10,001 - 100,000 5,867 188,736,398
100,001 - maximum 1,045 1,467,440,238 27,889 1,711,927,668
13,758 shareholders hold less than a marketable parcel of shares. (b) The twenty largest shareholders hold 65.77% of the total shares issued.
Holder No. of Shares %
HOPU Clean Energy (Singapore) Pte Ltd 249,888,360 14.60 Citicorp Nominees Pty Limited 226,923,671 13.26 HSBC Custody Nominees (Australia) Limited 180,510,822 10.54 CDS & Co 146,179,294 8.54 J P Morgan Nominees Australia Limited 89,046,887 5.20 Energia Minerals Limited 45,000,000 2.63 CEDE & Co 36,472,984 2.13 National Nominees Limited 34,969,588 2.04 HSBC Custody Nominees (Australia) Limited-GSCO ECA 16,807,425 0.98 HSBC Custody Nominees (Australia) Limited - A/C 3 13,094,612 0.76 ABN Amro Clearing Sydney Nominees Pty Ltd <Custodian A/C> 12,566,390 0.73 UBS Nominees Pty Ltd 11,537,652 0.67 Mr John Borshoff 11,166,172 0.65 BNP Paribas Noms Pty Ltd <DRP> 9,204,330 0.54 National Nominees Limited <DB A/C> 8,580,565 0.50 Merrill Lynch (Australia) Nominees Pty Limited 7,546,382 0.44 Ms Seng Bee Teoh 7,450,000 0.44 Grandor Pty Ltd <Mark Scott Family P/F A/C> 6,476,260 0.38 National Nominees Limited <N A/C> 6,388,365 0.37 UBS Wealth Management Australia Nominees Pty Ltd 6,310,560 0.37
1,126,120,319 65.77
Substantial shareholders as disclosed in substantial shareholder notices given to the Company are as follows: HOPU Clean Energy (Singapore) Pte Ltd 249,888,360 GIC Private Limited (formerly known as “Government of Singapore Investment Corporation Pte Ltd” 108,647,452
(c) Voting rights
Ordinary Shares For all shares, voting rights are one vote per member on a show of hands and one vote per share in a poll. Share Rights There are no voting rights attached to share rights.
(d) Securities Subject to Voluntary Escrow
There are 17,003,238 ordinary fully paid shares subject to voluntary escrow with a release dates of 1 December 2015 (1,003,238 shares) and 7 August 2016 (16,000,000 shares).
(e) Unquoted securities
Unlisted Share Rights The Company has 788,754 share rights on issue, issued in accordance with the Share Rights Plan approved by shareholders in November 2012. The number of beneficial holders of share rights totals seven.
For
per
sona
l use
onl
y

161
ADDITIONAL INFORMATION (continued)
__________________________________________________________________________________
Tenements held URANIUM PROJECTS
NAMIBIA – AFRICA
Project Tenements Interest % JV Partner/s Operator Note
Langer Heinrich 1 MLI 100.00% - LHU 1
Gawib 1 MLI (A) 100.00% - LHU 1
NIGER – AFRICA
Tagait 4 1 EPL 100.00% - IEL
Terzemazour 1 1 EPL 100.00% - IEL
Toulouk 1 1 EPL 100.00% - IEL
Ekazan 1 1 EPL (A) 100.00% - IEL
MALAWI – AFRICA
Kayelekera 1 MLI 100.00% - PAL 2
Kopakopa 1 EPL (A) 100.00% - PAL 2
Nthalire 1 EPL (A) 100.00% - PAL 2
Uliwa 1 EPL (A) 100.00% - PAL 2
Rukuru 1 EPL (A) 100.00% - PAL 2
Mapambo 1 EPL 100.00% - PAL 2
Ngana 1 EPL (A) 100.00% - PAL 2
LABRADOR/NEWFOUNDLAND – CANADA
Central Mineral Belt 31 MLC 100.00% - AUR
QUEENSLAND
Isa North 5 EPMs 82.08% (see Note 4) SRA 3,4 4 MDLs 82.08% (see Note 4) SRA 3,4
Valhalla North 1 EPM 100.00% - FSN 2 MDLs 100.00% - FSN
NORTHERN TERRITORY
Angela and Pamela 1 EL 100.00% - PDN 1 EL (A) 100.00% - PDN Bigrlyi 10 ELRs 41.71% ) Energy Metals Limited EME 11 MCs (A) 41.71% ) Southern Cross Exploration NL EME 2 ELs 41.71% ) EME 1 MLN (A) 41.71% ) EME 1 EL (A) 41.71% ) EME
Walbiri 1 ELR 58.13% Energy Metals Limited EME
Malawiri 1 ELR 47.96% Energy Metals Limited EME
Minerva 12 ELRs (A) 100.00% NTU
Beatrice South 1 EL (A) 33.33% Afmeco Mining and Exploration Pty Ltd Afmeco
Mount Gilruth 1 EL (A) 33.33% Afmeco Mining and Exploration Pty Ltd Afmeco
For
per
sona
l use
onl
y

162
ADDITIONAL INFORMATION (continued)
__________________________________________________________________________________
Tenements held (continued) WESTERN AUSTRALIA
Manyingee 3 MLs 100.00% - PEM
Oobagooma 1 EL (A) 100.00% - PEM
NON-URANIUM PROJECTS
QUEENSLAND
Western Isa Joint Venture (See Note 4) (Summit Resources (Aust) Pty Ltd, Pacific Mines Pty Ltd)
Isa South 6 EPMs 20.00% Aeon Metals Limited AML 5 1 EPM 18.00% Aeon Metals Limited AML 5 Centaurus Metals Limited
May Downs 3 EPMs 20.00% Aeon Metals Limited AML 5
Mount Kelly 1 EPM 20.00% Aeon Metals Limited AML 5
Constance Range 4 EPMs 20.00% Aeon Metals Limited AML 5
SOUTH AUSTRALIA
Reaphook JV 1 EL 7.50% Perilya Limited Perilya Signature Resources NL
For
per
sona
l use
onl
y

163
ADDITIONAL INFORMATION (continued)
__________________________________________________________________________________
Tenements held (continued) Operators Paladin Equity Note
(direct and indirect)
AFMECO Afmeco Mining and Exploration Pty Ltd 0% AML Aeon Metals Limited 0% AUR Aurora Energy Ltd 100% EME Energy Metals Limited 0% FSN Fusion Resources Pty Ltd 100% IEL Indo Energy Ltd 100% LHU Langer Heinrich Uranium (Pty) Ltd 75% 1 MIU Mount Isa Uranium Pty Ltd 100% NTU Northern Territory Uranium Pty Ltd 100% PAC Pacific Mines Pty Ltd 100% PAL Paladin (Africa) Ltd 85% 2 PEM Paladin Energy Minerals NL 100% SRA Summit Resources (Aust) Pty Ltd 82.08% 3 PDN Paladin Energy Ltd PERILYA Perilya Limited 0% Notes
1. Paladin holds an ultimate 75% interest in LHUPL with 25% held by CNNC. 2. Paladin holds 85% equity in PAL with 15% equity having been issued to the Government of Malawi
pursuant to the terms of the Development Agreement for KM between the Government of Malawi, PAL and Paladin Energy Minerals NL.
3. Paladin’s interest in these tenements is held by virtue of Paladin’s 82.08% equity holding in Summit
Resources Limited which in turn holds 100% equity interest in Summit Resources (Aust) Pty Ltd (“SRA”) and Pacific Mines Pty Ltd.
4. The Valhalla and Skal uranium deposits lie within the Isa North tenement block within defined blocks of land
(17km2 and 10km2 respectively) subject to the Isa Uranium Joint Venture between SRA (50% and Operator) and Mount Isa Uranium Pty Ltd (50%).
5. Aeon Metals Limited earned 80% equity in the Western Isa Joint Venture tenements through expenditure of
A$8M within three years of commencement (10 December 2007). SRA and Pacific Mines Pty Ltd have retained up to 20% equity in each of these tenements. Aeon Metals Limited were formally known as Aston Metals (Qld) Limited.
Tenement Types
EL Exploration Licence (Australia) EPL Exclusive Prospecting Licence (Africa) EPM Exploration Permit for Minerals (Australia) ELR Exploration Licence in Retention (Australia) MC Mineral Claim (Australia) MDL Mineral Development Licence (Australia) ML Mining Lease (Australia) MLI Mining Licence (Africa) MLC Mineral Licence (Newfoundland/Labrador) (A) Pending Application
For
per
sona
l use
onl
y

164
ADDITIONAL INFORMATION (continued)
__________________________________________________________________________________
LIST OF ABBREVIATIONS
A$ Australian dollars m metres
bcm bank cubic metres Ma million years
BFS bankable feasibility study MIK multiple indicator kriging
BRP bicarbonate recovery plant mm millimetres
CCD counter current decantation MMI mobile metal ion
C&M care and maintenance mSv millisiverts
DFS definitive feasibility study Mtpa million tonnes per annum
DIFR
ft
disabling incident frequency rate
feet
NI 43-101 National Instrument 43-101 – Standards of Disclosure for Mineral Projects of the Canadian Securities Administrators
g gram NOSA National Occupational Safety Association
g/m3 grams per cubic metre NPV net present value
g/t grams per tonne OK ordinary kriging
hr hours pa per annum
ISO International Organisation for Standardisation
PAL Paladin (Africa) Limited
ISR in situ recovery PFS pre-feasibility study
JORC Joint Ore Reserves Committee ppb parts per billion
K thousand ppm parts per million
kg kilogram QAQC quality assurance and quality control
kg/t kilogram per tonne QC quality control
km kilometres RC reverse circulation
KM Kayelekera Mine RIP resin-in-pulp
km2 square kilometres t tonnes
kW kilowatts t/m3 tonnes per cubic metre
lb pounds tpa tonnes per annum
LHM Langer Heinrich Mine tph tonnes per hour
LHUPL Langer Heinrich Uranium (Pty) Ltd U uranium
LTI lost time injury U3O8 uranium oxide
LTIFR lost time injury frequency rate US$ US dollars
M million w:o waste to ore ratio
Mlb million pounds
For
per
sona
l use
onl
y
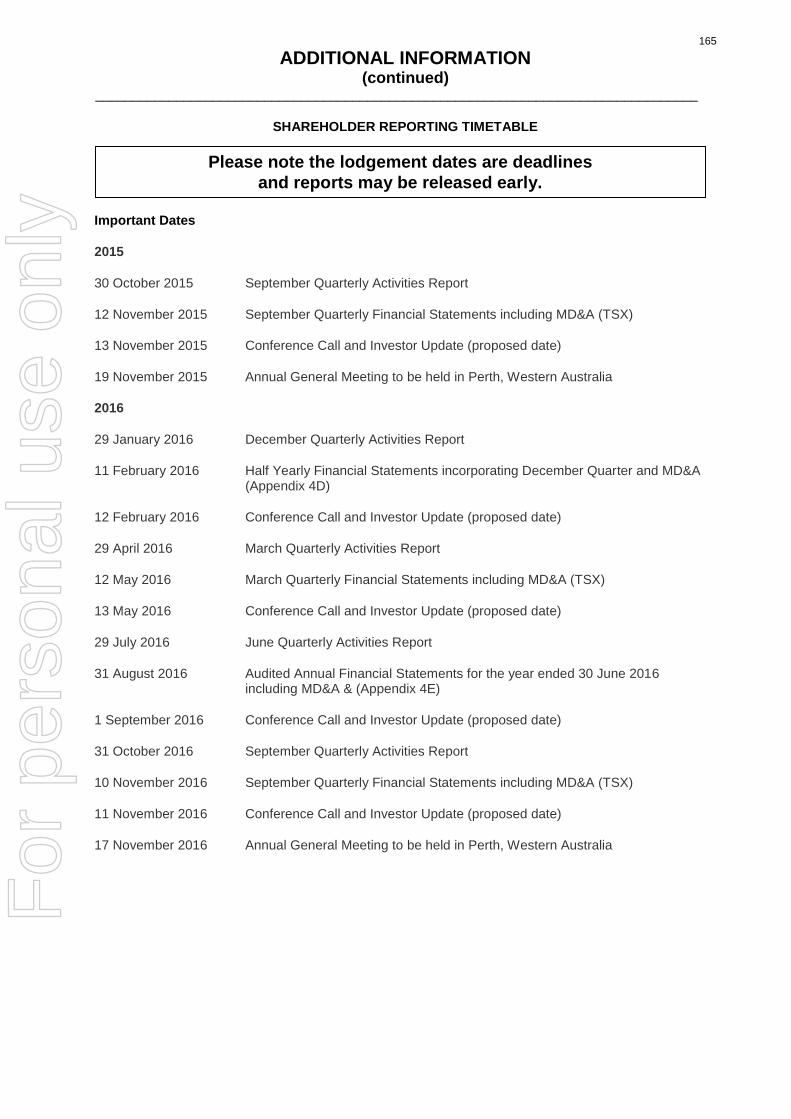
165
ADDITIONAL INFORMATION (continued)
__________________________________________________________________________________
SHAREHOLDER REPORTING TIMETABLE
Important Dates
2015
30 October 2015 September Quarterly Activities Report
12 November 2015 September Quarterly Financial Statements including MD&A (TSX)
13 November 2015 Conference Call and Investor Update (proposed date)
19 November 2015 Annual General Meeting to be held in Perth, Western Australia
2016
29 January 2016 December Quarterly Activities Report
11 February 2016 Half Yearly Financial Statements incorporating December Quarter and MD&A (Appendix 4D)
12 February 2016 Conference Call and Investor Update (proposed date)
29 April 2016 March Quarterly Activities Report
12 May 2016 March Quarterly Financial Statements including MD&A (TSX)
13 May 2016 Conference Call and Investor Update (proposed date)
29 July 2016 June Quarterly Activities Report
31 August 2016 Audited Annual Financial Statements for the year ended 30 June 2016 including MD&A & (Appendix 4E)
1 September 2016 Conference Call and Investor Update (proposed date)
31 October 2016 September Quarterly Activities Report
10 November 2016 September Quarterly Financial Statements including MD&A (TSX)
11 November 2016 Conference Call and Investor Update (proposed date)
17 November 2016 Annual General Meeting to be held in Perth, Western Australia
Please note the lodgement dates are deadlines
and reports may be released early.
For
per
sona
l use
onl
y

166
CORPORATE DIRECTORY
Directors Non-executive Chairman Mr Rick Crabb Interim CEO Mr Alexander Molyneux Non-executive Directors Mr Donald Shumka Mr Peter Donkin Mr Philip Baily Mr Wendong Zhang Company Secretary Mr Ranko Matic Registered Office Level 4, 502 Hay Street Subiaco Western Australia 6008 Telephone: (+61 8) 9381 4366 Facsimile: (+61 8) 9381 4978 Email: [email protected] Web: www.paladinenergy.com.au Share Registries Australia Computershare Investor Services Pty Ltd Level 11, 172 St Georges Terrace Perth Western Australia 6000 Telephone: 1300 850 505 (within Australia) or (+61 3) 9415 4000 (outside Australia) Facsimile: (+61 3) 9473 2500 Canada Computershare Investor Services Inc. 100 University Avenue, 8th Floor Toronto, Ontario M5J 2Y1 Telephone: 1 800 564 6253 (within North America) or (+1) 514 982 7555 Facsimile: (+1) 416 263 9394 or 1 888 453 0330 (within North America) Paladin Energy Ltd is a company limited by shares, incorporated and domiciled in Australia. Its registered office and principal place of business is: Paladin Energy Ltd Level 4, 502 Hay Street SUBIACO WA 6008 Through the use of the internet, we have ensured that our corporate reporting is timely, complete, and available globally at minimum cost to the Company. All press releases, financial statements and other information are available on our website www.paladinenergy.com.au.
Investor Relations Australia – Corporate Office Mr Andrew Mirco Level 4, 502 Hay Street Subiaco Western Australia 6008 (PO Box 201, Subiaco, 6904) Telephone: (+61 8) 9381 4366 Facsimile: (+61 8) 9381 4978 Email: [email protected] Auditors Ernst & Young 11 Mounts Bay Road Perth Western Australia 6000 Stock Exchange Listings Australian Securities Exchange and Toronto Stock Exchange Code: PDN Munich, Berlin, Stuttgart and Frankfurt Stock Exchanges Code: PUR Namibian Stock Exchange Code: NM-PDN
For
per
sona
l use
onl
y