Embed Size (px)
Citation preview
Pål Buhl-MortensenInstitute of Marine
Research
Atlantic Seabed Mapping – Status & Direction
Towards a CAN-EU-US Atlantic strategic seabed mapping pilot initiative:highlighting current drivers, approaches, activities, and priorities, and
future opportunities, challenges and aspirations
Galway Statement Implementation – Atlantic Seabed Mapping WorkshopDublin Castle, Dublin, 1st – 2nd December 2014
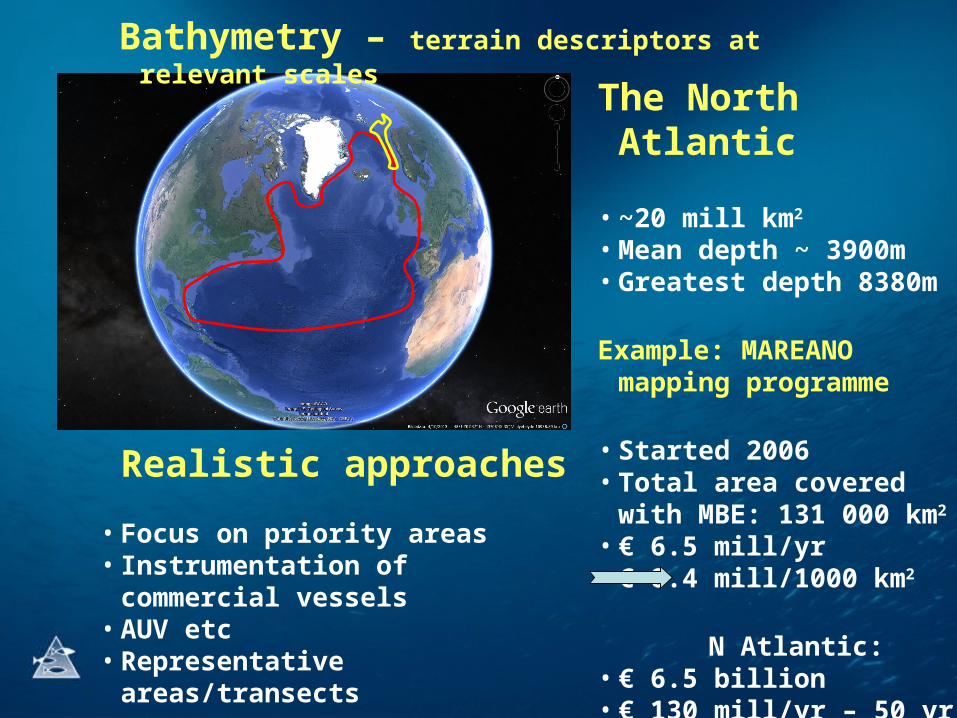
The North Atlantic
• ~20 mill km2
• Mean depth ~ 3900m• Greatest depth 8380m
Example: MAREANO mapping programme
• Started 2006• Total area covered
with MBE: 131 000 km2
• € 6.5 mill/yr• € 0.4 mill/1000 km2
N Atlantic:• € 6.5 billion• € 130 mill/yr – 50 yr
Realistic approaches
• Focus on priority areas• Instrumentation of
commercial vessels• AUV etc• Representative
areas/transects
Bathymetry – terrain descriptors at relevant scales
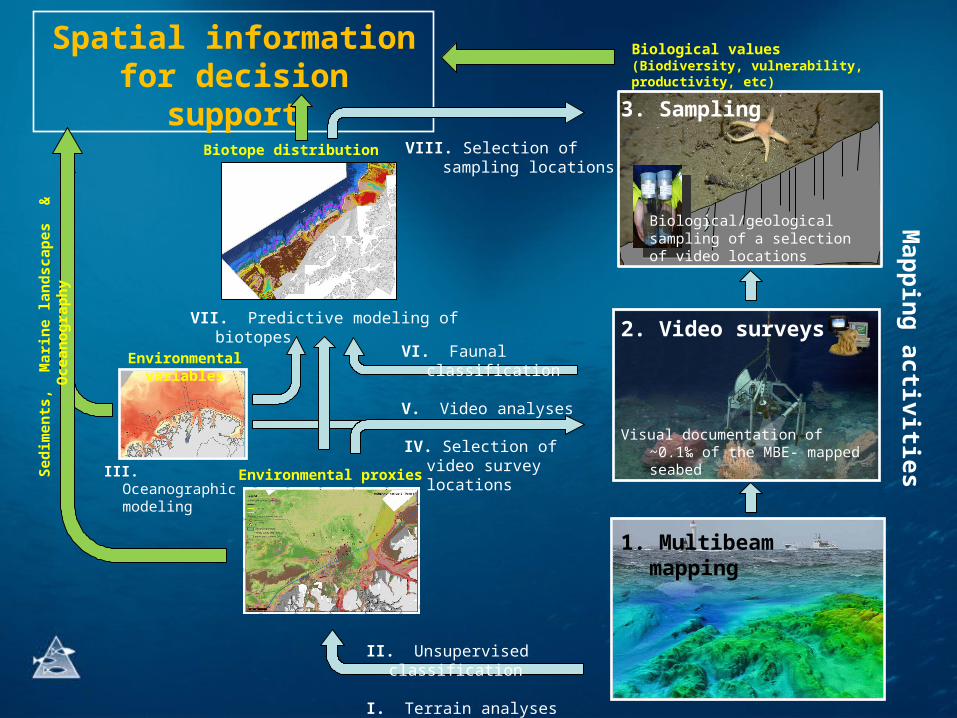
Spatial information for decision support
3. Sampling
Biological/geological sampling of a selection of video locations
2. Video surveys
Visual documentation of ~0.1‰ of the MBE- mapped seabed
1. Multibeam mapping
II. Unsupervised classification
I. Terrain analyses
VIII. Selection of sampling locations
Environmental proxies
Biotope distribution
Biological values(Biodiversity, vulnerability, productivity, etc)
Sed
imen
ts,
Mar
ine
lan
dsc
apes
&
O
cean
og
rap
hy
IV. Selection of video survey locations
VII. Predictive modeling of biotopes
VI. Faunal classification
V. Video analyses
Map
pin
g activities
Environmental variables
III. Oceanographic modeling
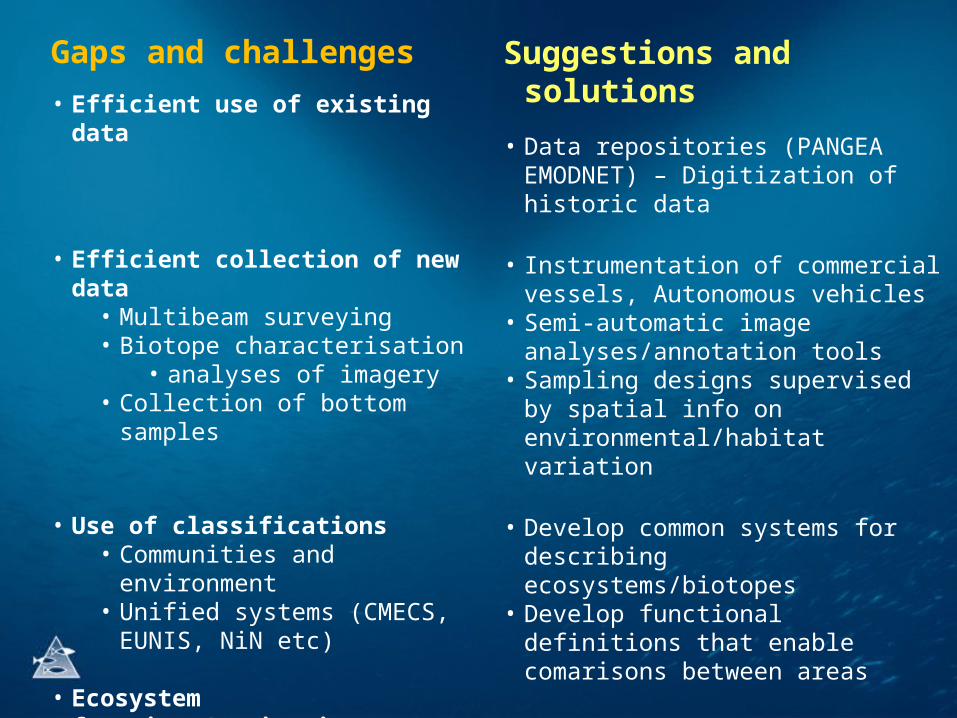
Gaps and challenges
• Efficient use of existing data
• Efficient collection of new data
• Multibeam surveying• Biotope characterisation
• analyses of imagery• Collection of bottom samples
• Use of classifications• Communities and
environment• Unified systems (CMECS,
EUNIS, NiN etc)
• Ecosystem functions/monitoring (selection of locations)
Suggestions and solutions
• Data repositories (PANGEA EMODNET) – Digitization of historic data
• Instrumentation of commercial vessels, Autonomous vehicles
• Semi-automatic image analyses/annotation tools
• Sampling designs supervised by spatial info on environmental/habitat variation
• Develop common systems for describing ecosystems/biotopes
• Develop functional definitions that enable comarisons between areas
• Selection of locations/biotopes/ indicators guided by spatial information on pressures, vulnerability and environmental relationships