Embed Size (px)
Citation preview

1
Pakistan Sugar Journal
April-June 2008 Contents Vol. XXIII, No.2
Editorial Board
M. Asghar Qureshi Chairman
M. Awais Qureshi Member
Dr. Shahid Afghan Member
Dr. Tahir Hussain Member
Dr. Muhammad Zubair Member
Published Under the patronage of
Shakarganj Sugar Research Institute
Subscription
Mohammad Awais Qureshi,
Shakarganj Mills Ltd., Toba Road, JHANG
Ph: 047-7629337-41
Subscription Rate
Pakistan Rs.300/-
OVERSEAS US$25/-
Recognized by
Higher Education Commission Pakistan
Cited by
Pakistan Press International (PPI)
Australian Associated Press (AAP)
ISSN 1028-1193
2
6
12
25
32
Scheduling irrigation for sugarcane with cabbage
as intercrop By M.A.B. Siddique, S.M.I. Hossain, M.N.A. Miah,Kuasha
Mahmud and M.A. Rahman
Response of sugarbeet Beta vulgaris (variety
kaweterma) to different fertility levels By F.C. Oad, M.Usman Usmanikhail, M.H. Siddiqui and
Naseema Junejo
Effect of medium composition on callogenesis and
somatic embryogenesis in different varieties of
sugarcane (Sacchrum officinarum L.) By Shagufta Naz and G.Zahara Jahangir
Determination of site specific fertilizer
requirement of sugarcane and intercrop (potato)
under sugarcane-based cropping system By G. C. Paul, S. M. Bokhtiar, A. K. Azad and M. A. Mannan
Sugar Industry Abstracts
By M. Awais Qureshi and Shahid Afghan
Panel of Referees
Dr. P. Jackson Dr. Benjamin L. Legendre Dr. Yong-Bao Pan Dr. Mac Hogarth Dr. Sizuo Matsuoka Dr. Rakshanda Bajwa Dr. Sabir H. Shah Dr. Shahina Fayyaz
Principal Scientist, CSIRO, AUSTRALIA Interim Director, Audubon Sugar Institute, USA Research Plant Molecular Geneticist, USDA-ARS, USA Group Manager BSES, AUSTRALIA Director, Canavialis SA, BRAZIL Chairperson Pathology University of Punjab, PAKSITAN Director Research, SCRI, Mardan-PAKISTAN Director, National Nematological Research Center, Karachi
© 2008 SSRI, All rights reserved, no part of this publication may be reproduced, stored in a retrieval system, or transmitted in any form or by any means, electronic, mechanical, photocopying, recording, or otherwise without prior written permission of the Publisher.

2
SCHEDULING IRRIGATION FOR SUGARCANE WITH CABBAGE AS INTERCROP
M.A.B. Siddique1, S.M.I. Hossain
2, M.N.A. Miah
3, Kuasha Mahmud
4 and M.A. Rahman
5
1 Associate Scientific Officer, Grade-1, BSRI, Bangladesh
2 Associate Professor, Bangabandhu Sheikh Mujibur Rahman Agri. Univ. Bangladesh
3 & 5 Scientific Officer, BSRI, Bangladesh
4 Senior Instructor (Plant Protection), BSRI, Bangladesh
ABSTRACT
An experiment was conducted in Bangladesh Sugarcane Research Institute (BSRI) farm at
Ishurdi during 1997-98 cropping seasons to develop an irrigation schedule for sugarcane with
cabbage as intercrop using pan ratio (PR) method. Irrigation was applied during pre-monsoon
only. No irrigation was applied during monsoon or post-monsoon. The highest yield of
sugarcane as well as cabbage were obtained when irrigation was applied at PR= 1.0. With this
PR, the highest yield of sugarcane (109.79 t ha-1
) was obtained with 430 mm irrigation water in
addition to 176.43 mm of effective rainfall. The highest yield of cabbage (21.66 t ha-1
) was
obtained with 310 mm of irrigation water.
Key words: Irrigation schedule, sugarcane, cabbage, pan ratio
INTRODUCTION
Farmers grow large number of winter vegetables as sole crop occupying an area of about 220 X
10 3 ha. On the other hand, about 20% of sugarcane land (160 X 10
3 ha) is intercropped with
various short growing winter crops viz. cabbage, cauliflower, potato, carrot, radish etc.
Successful intercropping of various crops with sugarcane has been reported by many
researchers (Rathi et al., 1974; Behli and Narwal, 1977). Without intercropping, the poor cane
growers cannot wait for such a long time to get economic return from sole crop of sugarcane.
Intercropping increased the crop yield per unit area by intensifying the use of land.
The nutritive value of vegetables is high owing to the presence of mineral salt and vitamins. In
Bangladesh, the vegetables production is not evenly distributed throughout the year. Most of the
important vegetables are produced in winter, which amount 367 thousand tons. Only in the
summer 243 thousand tons of vegetables are produced (Anon., 2001). Nutritionist suggests that
an adult person should eat at least 285 g of vegetables per day for maintaining good health. But
in Bangladesh an individual consumes an average of 32 g per day and if potato and sweet potato
are excluded, the quantity becomes just 25 g (Hossain et al., 1990), which result in chronic
malnutrition. All vegetables can‟t be grown in kharif season due to adverse climatic condition.
As a result, late variety cabbage (Atlas-70) plays an important role to supplement this shortage
during the lag period. Late variety of cabbage harvesting in the end of rabi season and
beginning of the kharif season (month of March) which easily meet up the vegetables crisis
during the lag period.
The average yield of this crop is very low due to various reasons including the management
problems. Among these, irrigation, fertilization and plant spacings are the most important
agronomic practices, which have 12 to 49% contribution in sugarcane production (Ali et al.,
1989). For optimum growth of sugarcane 1500 to 1800 mm rainfall is necessary (Rashid et al.,

3
1987). The annual rainfall in Bangladesh ranges from 1000-1500 mm, which is unevenly
distributed throughout the year. Around 70% of the total rainfall occurs during the monsoon
period of July to September, where as, a very little rainfall occurs in the months of November to
May which is the establishment and tillering phases of sugarcane. Imam et al., (1988) reported
that irrigation always played a vital role for increasing cane yield at tillering stage. On the other
hand, irrigation increased the yield of cabbage (cv. Prva zetev) by 11% compared with no
irrigation (Cerne, 1991). While conducting experiment with cultivar Gloria, Fischer and Nel
(1987) found that high soil moisture levels during vegetative growth improved leaf growth but
not necessarily increased yields. Even at low moisture the crop gave satisfactory yields
indicating considerable drought resistance.
In an experiment in Germany, Hartmann and Zengerle (1987) observed that quick maturing (85
days) white cabbage cv. Grenit and slow maturing (136 days) red cabbage cv. Autoro required
396 and 611 mm water and yielded marketable heads weighing 1.40 and 2.18 kg, respectively
with soil moisture maintained at 75-100% of capacity. According to Saha et al., (1998) total
water use by cabbage for high yield, irrigation schedules ranged from 158.44 to 183.23 mm.
Maximum efficacy of irrigation water in terms of marketable yield (602.35 kg/ha per mm) was
achieved when irrigation led to 30% DASM (depletion of available soil moisture).
MATERIALS AND METHODS
The experiment was conducted at BSRI farm, during 1997-98 cropping seasons. Sugarcane
variety Isd 28 and cabbage (Atlas-70) were used as planting material. Sugarcane was planted by
STP method, while single row of cabbage seedlings were transplanted in between two rows of
sugarcane spaced by 90 cm. The experiment was set in a randomized complete block design
with three replications.
The treatments of the experiment were as follows:
IB = only two base irrigation at 1 and 15-20 DAT (days after transplanting) respectively.
I1 = IB + irrigation at PR= 0.6
I2 = IB + irrigation at PR= 0.9
I3 = IB + irrigation at PR= 1.0
Where pan ratio (PR) is the ratio of irrigation water (IW) to the cumulative open pan
evaporation (CPE) from USWB class-A open pan i.e. PR= IW/CPE. Irrigation water (IW) was
calculated considering 40 cm effective root depth at the start and 100 cm during tillering stage
and assuming 50% depletion of available soil moisture allowable. Then irrigation interval was
determined by the following equation:
IW + ER
CPE=
PR
Where, ER is the effective rainfall between two irrigation. In each irrigation a prefixed amount
of irrigation water (in proportion to effective root depth) was applied. No irrigation was needed
during and after monsoon.

4
RESULTS AND DISCUSSION
The effects of irrigation on yield and yield components of sugarcane as well as cabbage during
1997-98 are given in table 1 & 2. It is evident from the table 1 that irrigation had significant
effect on tiller count, millable cane and yield of sugarcane. It had no effect on recovery of sugar.
The highest yield was obtained from treatment I3 (109.79 t ha-1
) followed by treatment I2
(104.08 t ha-1
). The yields of cane, tillers count and also millable cane under the treatments
differed significantly from each other except I2 & I3 for yield of sugarcane.
From the table 2, it is seen that treatment I3 that gave highest yield of sugarcane, received 8
(eight) irrigations including 6 (six) during intercrop period. It received 430 mm of irrigation
water including 310 mm during intercrop period. It is also seen that irrigation had significant
effects on the yield of cabbage. The highest yield of cabbage obtained by treatment I3 (24.66 t
ha-1
) followed by the treatment I2 (22.05 t ha-1
). But I3 and I2 differed insignificantly and both
differed from IB significantly.
Table-1 Effect of irrigation on tillering, millable cane, recovery and yield of
sugarcane during 1997-98 cropping season
Treatment Tiller count
(x 103 ha
-1)
Millable cane
(x 103 ha
-1)
Recovery
(%)
Yield
(t ha-1
)
IB
I1
I2
I3
255.11 a
274.58 b
288.54 c
304.21 d
135.37 a
142.00 b
154.70 c
163.54 d
8.37
9.24
9.53
8.69
80.43 a
99.33 b
104.08 bc
109.79 c
LSD at 5% 13.75 6.53 NS 6.90
Table-2 Irrigation water, effective rainfall, number of irrigation and yield of
cabbage and sugarcane during 1997-98 cropping season
Treatment Irrigation Water Number of irrigation Effective
rainfall
(mm)
Yield of
cabbage
(t ha-1
)
Yield of
sugarcane
(t ha-1
) Intercrop
period
Total Intercrop
period
Total
IB
I1
I2
I3
70
190
250
310
70
310
430
430
2
4
5
6
2
6
8
8
Nil
98.72
176.43
176.43
13.35 a
16.65 b
20.05 bc
21.66 c
80.43 a
99.33 b
104.08 bc
109.79 c
* Figures in a column accompanied by similar letter (s) do not differ significantly at 0.05 level
of probability as per DNMRT.

5
REFERENCES
1. Anonymous. 2001. Monthly Statistical Bulletin. Bangladesh Bureau of Statistics. Ministry
of Planning, Dhaka, p: 54.
2. Ali, M.Y., S.A. Imam, and M.K Ali. 1989. Rupa Akh Chash. Publication No.45, Sugarcane
Research and Training Institute, Ishurdi, Pabna, Bangladesh.p.12.
3. Behli, K.L. and S.S. Narwal. 1977. To study the feasibility of intercropping of rabi crops in
autumn planted sugarcane. Indian Sugar, 27: 23-26.
4. Cerne, M. 1991. Bioloski Vestnik, 39: 95-98.
5. Fischer, H.H. and P.C. Nel. 1987. Appl. Plant Sci., 1: 28-33.
6. Hartmann, H.D. and K.H. Zengerle. 1987. Gemuse, 23: 58-61.
7. Hossain, A.K.M.A., M.A. Haque, and M.S.U. Choudhury. 1990. Vegetable research in
Bangladesh In: vegetable Research and Development in South Asia. S. Shanmugasundram
(ed.). Proc. Workshop held at Islamabad Pakistan, on 24-29 September 1990. AVRDC
publication number 90-331. AVRDC, Taiwan, pp.127-133.
8. Imam, S.A., S.M.A. Uddin, M. Ali, and M.Y. Ali. 1988. Spaced transplanting (STP)
technique of cane planting. BASS, 13th
Annual Bangladesh Science Conference. P.9.
9. Rathi, K.S., H.N. Tripathi, and D. Singh. 1974. Studies on intercropping rabi crop in autumn
planted sugarcane. Indian Sugar, 24: 201-205.
10. Rashid, M.H., M.S. Islam, J. Alam, and M. Hasan, 1987. Irrigation Water Measurement
Manual. Agri.Engg. Div.BARI, Joydevpur, Gazipur, Bangladesh.p.20.
11. Saha, U.K., M.A. Hasnat, J. Haider, R.R. Saha, and S. Kawai. 1998. Japanese J. Trop.
Agric., 42: 71-77.

6
RESPONSE OF SUGARBEET BETA VULGARIS (VARIETY KAWETERMA) TO
DIFFERENT FERTILITY LEVELS
*F.C. Oad, **M.Usman Usmanikhail, ***M.H. Siddiqui and ****Naseema Junejo
*Sindh Agriculture University, Tandojam, Pakistan. **Sugarcane Section, Agriculture Research
Institute, Tandojam. ***University College of Agriculture, Rawalakot, Azad Jamu and
Kashmir. **** Soil Fertility Section, Tandojam.
ABSTRACT
The response of sugarbeet variety Kaweterma to different fertility levels was ascertained in the
field. The treatments included six N-P levels viz: 0-0 (control), 50-50, 75-75, 100-100, 125-125
and 150-150 N-P kg ha-1
. Application of N-P fertilizers in higher quantities (150-150 kg ha-1
)
resulted 93230 ha-1
plant population, 62.50 cm leaves length, 37.38 leaves plant-1
, 2.22 kg
sugarbeet weight plant-1
, 83.142 m.t ha-1
beetroot yield, 22.37% brix content and 11.34% sugar
recovery. N-P application at the rate of 125-125 and 100-100 kg ha-1
produced 92367 and 90053
ha-1
plant population, 61.25 and 58.75 cm leaves length, 35.91 and 31.95 leaves plant-1
, 2.21
and 2.13 kg sugarbeet weight plant-1
, 80.588 and 79.484 m.t ha-1
beetroot yield, 22.34 and
22.11% brix content and 11.31 and 11.19% sugar recovery. It was observed that there was a
gradual improvement in all the growth and yield components with increasing fertility levels.
However, this increase was uneconomical when applied beyond 100-100 kg ha-1
, because
differences amongst 100-100, 125-125 and 150-150 kg N-P ha-1
for all the parameters were
statistically non-significant. Hence, 100-100 kg N-P level was considered to be an optimum
level for economical production of sugarbeet under Tandojam conditions.
Keywords: Sugarbeet, fertility levels, beetroot yield, brix, sugar recovery.
INTRODUCTION
Sugar Beet, Beta vulgaris L. belongs to the family chenopodiaceae, is grown throughout the
world mainly wild Beta maritime for food and medical purpose and its roots used as vegetable.
There are three types of beetroot, the globe beet (which is the most popular); the intermediate or
cylindrical beet and the long beet. Although the long beet is still grown commercially and for
exhibition, it has been superseded to a great extent by the other two kinds. For early sowing
always use the globe beet. The intermediate beet is bigger but it grows more slowly. So it is
more suitable for main crop use (Martyn, 1978). Sugarbeets are believed to the native to the
Mediterranean area of Europe, Egypt and North Africa, and secondary area of development was
located in the near East. Many members of the beet family are found in areas with elevated salt
leaves. Beets have been grown as a potherb throughout the recorded history. The roots of wild
beets, however, were used by ancient civilizations only for medicine. These wild forms did not
resemble the modern enlarged beet (Hamilton, 2005).
Sindh is the only other province where sugarbeet is cultivated but on a very small scale. The
reported area under cultivation in Sindh is about 100 hectares. Sugarcane is the main source of
sugar production in the country. Our sugar industry is entirely dependent on the availability of
sugarcane. However, it is a high delta crop notorious for its lavish water use and occupies land

7
for 10-14 months. In this respect, sugarbeet has a comparative advantage, as it is a low delta
crop and occupies land for 4-5-months (Syed, 2002).
Proper management of fertilizer applications to sugarbeets still remains a challenge for growers.
The researchers have quantified rates of fertilizer uptake, and estimated the amount of N, P and
K in sugarbeet crops that was derived from the soil itself, compared to that derived from
fertilizers. Use of chemical fertilizers has become essential for good beet crop harvest. The
macronutrient (N.P.K) has their individual role in development of root zone and good crop
stand. Moreover, these elements are vitally needed to establish different properties in the beet
root juice and similarly needed for satisfactory crop growth (Pakissan.com, 2004). Plant
analysis is associated with nutrient's concentration in a specific plant part to the growth of the
plant (George and Schmitt, 2002; Mortvedt et al., 2005; Cattanach et al., 1993). Sugarbeets
responded to N deficiency by an increase in sucrose percentage of storage roots and the change
results from an inhibition of vegetative growth, which permits a higher proportion of the
sucrose produced in the leaves to accumulate in the roots rather than be used in growth
(Mortvedt et al., 2005). The crop responses to P fertilization are quite common. The P
deficiency is by far the most difficult to recognize. An overall stunting of the plant and a slight
deepening of the green foliage color are the only visual signs (Mortvedt et al., 2004). In case of
Potassium, a 30-ton sugarbeet root crop contains about 180 pounds of K2O (150 pounds K) in
its tops and roots. The experiment was conducted to examine the response of sugarbeet to
different fertility levels in terms of its growth, yield and sugar recovery under Tandojam
conditions.
MATERIALS AND METHODS
The experiment was laid out in a four replicated randomized complete block design (RCBD),
the sub-plot size kept was 4.2m x 6m (25.2m2). A fallow left (in the off-season) piece of land
was selected and prepared by giving cross wise deep ploughings. After soaking dose, when the
land came in condition, the seedbed was prepared by using cultivator (cross-wise) and rotavator.
Thereafter, clods were broken completely by clod crusher followed by thorough levelling. After
seedbed preparation 60 cm apart ridges were prepared with tractor drawn ridger. Pure seed of
sugarbeet variety “Kaweterma” was obtained with the courtesy of from Sugarcane Specialist,
Agriculture Research Institute, Tandojam and the sowing was completed in the third week of
October 2005. Before sowing, a certain amount of chemical fertilizers (nitrogen and
phosphorus) was applied by mixing in the soil to improve the soil for any sort of deficiency in
these essential nutrient elements. After completion of the germination, the plants were thinned
to maintain plant to plant spacing of 20 cm. Nitrogen was applied in the form of urea and
Phosphorus in the form of Diammonium Phosphate (D.A.P). All P and 1/3rd
of nitrogen were
applied at the time of sowing, while the remaining nitrogen was divided into two equal doses
and applied at third and fourth irrigation. All the agronomic practices were carried out
uniformly in all the plots. Eight irrigations were applied from sowing upto the crop maturity.
After completion of field observations, the samples were brought to the laboratory of Sugarcane
Section, Agriculture Research Institute, Tandojam, where the beetroots were sliced and juice
was extracted to record Brix and sugar recovery. Finally, the data so collected were subjected to
statistical analysis to analyze the treatment variation, while L.S.D. (Least Significant
Difference) test was applied to observe the significance of difference within treatments as
suggested by Gomez and Gomez (1984).

8
RESULTS AND DISCUSSION
Plant population ha-1
The plant population ha-1
was significantly higher (93230) in plots fertilized with highest
fertility level of 150-150 kg N-P ha-1
, closely followed by plant population of 92367 and 90053
plants ha-1
, recorded in plots fertilized with 125-125 kg and 100-100 kg N-P ha-1
, respectively.
The sugarbeet crop fertilized with 75-75 kg and 50-50 kg N-P ha-1
had mean plant population of
78743 and 71389 plants ha-1
, respectively. However, the lowest plant population of 69173
plants ha-1
was recorded in plots left untreated (control). This higher plant population in plots
treated with higher fertility levels was mainly associated with the better germination of seeds,
because due to application of nitrogen and phosphorus in higher quantities, the soil fertility
improved to an adequate level and hence increased plant population resulted. A comprehensive
research on various aspects of sugarbeet has been carried out world over and is published in
various research journals. Jaszczolt (1998) studied different fertilizer sources and concluded that
application of N-P fertilizers improved the plant growth substantially and when applied at
sowing it resulted better crop stand and higher plant population.
Length of leaves (cm)
The length of leaves was highest (62.50 cm) in plots fertilized with highest fertility level of 150-
150 kg N-P ha-1
, closely followed by 61.25 and 58.75 cm length of leaves, recorded in plots
fertilized with 125-125 kg and 100-100 kg N-P ha-1
, respectively. The crop fertilized with 75-75
kg and 50-50 kg N-P ha-1
produced leaves of 52.25 cm and 44.25 cm in length, respectively.
However, the lowest length of leaves of 33.75 cm on average was recorded in plots given zero
fertilizer (control). This higher length of leaves in plots treated with higher fertility levels was
mainly associated with adequacy of soil in essential nutrient elements i.e. N and P due to their
application in higher quantities. Moreover, the results suggested that there was a successive
increase in length of leaves with each increase in N-P level, but the increase in N-P level
beyond 100-100 kg ha-1
was not economical, because the differences amongst 150-150, 125-125
and 100-100 kg N-P ha-1
were statistically non-significant. Similarly, Khan et al., (1998) from
Pakistan reported that plant height with 200 kg N was higher than with 150 kg N from sugarbeet
variety KaweTerma.
Number of leaves plant-1
The number of leaves plant-1
was significantly highest (37.38) in plots fertilized with highest N-
P level of 150-150 kg ha-1
, closely followed by 35.91 leaves plant-1
, recorded in plots fertilized
with 125-125 kg N-P ha-1
, and under N-P level of 100-100 kg ha-1
the number of leaves plant-1
was reduced to 31.95 on average. In case of 75-75 kg and 50-50 kg N-P ha-1
fertility levels, the
mean number of leaves recorded were 25.36 and 21.58, respectively. However, the minimum
number of leaves plant-1
of 13.48 was recorded in plots left untreated (control). This higher
number of leaves plant-1
in plots treated with higher fertility levels was mainly associated with
improved soil fertility of the experimental plots due to N-P application at higher quantities as
compared to lower N-P levels or control plots. The results further indicated that there was a
gradual increase in the number of leaves with each increase in fertility level, but this increase
was uneconomical when N-P level exceeded 125-125 kg ha-1
, because differences in between
125-125 and 150-150 kg N-P ha-1
was non-significant. Similar results have also been reported
by Safronovskaya (1998) who recommended 60 t farmyard manure + 120 kg N, 80 kg P, 180 kg
K for higher sugarbeet yields, while Wyszynski et al., (1999) recommended application of 130-
160 kg N ha-1
required to achieve optimum plant growth in sugarbeet.

9
Sugarbeet weight per plant-1
The sugarbeet weight plant-1
was significantly maximum (2.22 kg) in plots fertilized with
highest N-P level of 150-150 kg ha-1
, closely followed by 2.21 kg and 2.13 kg plant-1
, recorded
in plots fertilized with 125-125 kg and 100-100 N-P ha-1
, respectively. The results further
showed that the fertility levels of 75-75 and 50-50 kg N-P ha-1
resulted mean sugarbeet weight
of 1.63 and 1.22 kg ha-1
, respectively. However, the minimum sugarbeet weight of 0.66 kg
plant-1
was recorded in plots left untreated (control). This higher sugarbeet weight plant-1
in
plots treated with higher fertility levels was resulted due to healthy growing plants which
obviously further resulted in healthy beetroots. However, this all happened due to improved soil
fertility of the experimental plots due to N-P application at higher quantities. These results have
further been supported by Wyszynski et al., (1999) recommended application of 130-160 kg N
ha-1
required to achieve a sucrose yield of 10 t ha-1
and found that root quality decreased at
higher N rates.
Sugarbeet weight per ha-1
The beetroot yield was significantly maximum (83.142 m.t ha-1
) in plots fertilized with highest
N-P level of 150-150 kg ha-1
, closely followed by 80.588 and 79.484 m.t ha-1
, recorded in plots
fertilized with 125-125 kg and 100-100 N-P ha-1
, respectively. The results further showed that
the fertility levels of 75-75 and 50-50 kg N-P ha-1
resulted mean beetroot yield of 65.499 and
54.638 m.t ha-1
, respectively. However, the minimum beetroot yield of 35.255 m.t ha-1
was
recorded in control plots where no fertilizer was applied. This higher beetroot yield ha-1
in plots
treated with higher fertility levels was mainly associated with greater sugarbeet weight plant-1
which has direct effect on the accumulated beetroot yield ha-1
. Supporting the above experiences
of present investigation, Asad et al., (2000) concluded that 120 kg N ha-1
was economical than
150 kg ha-1
, while Barik (2001) used 120 kg N ha-1
and 150 kg K ha-1
treatment at 110 days of
the crop. Similarly, Barlóg (2003) mentioned that the nitrogen is the basic mineral nutrient
determining the yield and quality of the sugarbeet root. The efficiency of nitrogen-based
nutrition can be increased by balanced application of nutrients directly controlling the yielding
functions of nitrogen. It should be mainly focused on phosphorus and potassium, since these
nutrients form the physiological basis of high yields. In a similar study, Uvarov et al., (2004)
from Russia concluded that 90-90-90 kg NPK + 40 t ha-1
manure was most effective
combination in sugarbeet production.
Brix percentage
Brix percentage was significantly higher (22.37 %) in plots fertilized with highest N-P level of
150-150 kg ha-1
, closely followed by 22.34% and 22.11%, recorded in plots fertilized with 125-
125 and 100-100 kg N-P ha-1
, respectively. The brix percentage in sugarbeet juice from the
plants fertilized with 75-75 and 50-50 kg N-P ha-1
was 20.20 and 19.09 %, respectively.
However, the lowest brix content of 17.70% was recorded in control plots where no fertilizer
was applied. This higher brix percentage in plots treated with higher fertility levels may have
association with the nitrogen and phosphorus which are needed for formation of sugar in the
juice. It was observed that there was successive increase in brix percentage with increasing
fertility level, but this increase was uneconomical when N-P level exceeded 100-100 kg ha-1
,
because differences amongst 100-100, 125-125 and 150-150 kg N-P ha-1
were statistically non-
significant for brix percentage. The results of the present investigation are fully confirmed by
the findings of Shahani et al., (2005) brix content in sugarbeet was 22.50 percent under 100-75
kg N-P ha-1
. Similarly, Usmanikhail et al., (2005) concluded that 100-100 kg N-P ha-1
fertility
level proved to be an optimum level for producing significantly economical results.

10
Sugar recovery
The sugar recovery was significantly highest (11.34 %) in plots fertilized with higher N-P level
of 150-150 kg ha-1
, closely followed by 11.31% and 11.19%, recorded in plots fertilized with
125-125 and 100-100 kg N-P ha-1
, respectively. The sugar recovery in sugarbeet juice from the
plants fertilized with 75-75 and 50-50 kg N-P ha-1
was 10.34 and 9.78 %, respectively.
However, the lowest sugar recovery of 8.98% was recorded in control plots where no fertilizer
was applied. This higher sugar recovery in plots treated with higher fertility levels probably
have association with the N-P fertilizers, because application of these chemical fertilizers upto
adequate levels helps the plant to form more glucose and hence recovery improved. It was
observed that sugar recovery was improved consecutively with increasing fertility level, but this
increase was not so pronounced when N-P level exceeded 100-100 kg ha-1
, because differences
amongst 100-100, 125-125 and 150-150 kg N-P ha-1
were statistically non-significant for sugar
recovery. The results of the present investigation are fully confirmed by the findings of Shahani
et al., (2005) recovery in sugarbeet was higher under 100-75 kg N-P ha-1
. Similarly,
Usmanikhail et al., (2005) concluded that 100-100 kg N-P ha-1
fertility level proved to be an
optimum level for producing significantly economical results
CONCLUSIONS
It was concluded from the results of the present investigation that there was a consecutive
improvement in all the quantity and quality components of sugarbeet, but statistically the
differences among 100-100, 125-125 and 150-150 kg N-P ha-1
were non-significant for all the
growth, beetroot yield and recovery parameters. Thus, fertilizer application beyond 100-100 kg
N-P ha-1
was not economical and the above fertility level was considered as an optimum level
for economical sugarbeet production under Tandojam conditions.
Table-1 Mean plant population ha-1
of sugarbeet as affected by different fertility levels
Treatments
(NP kg ha-1
)
Plant
population
ha-1
Length
of leaves
(cm)
No.of
leaves
plant-1
Beetroot
weight
(kg plant-1
)
Beetroot
yield
(kg ha-1
)
Brix (%) Recovery
(%)
T1= Control 69173c 33.75a 13.48e 0.66d 35.255d 17.70d 8.98d
T2=50-50 71389c 44.25c 21.58d 1.22c 54.638c 19.09c 9.78c
T3=75-75 78743b 52.25b 25.36c 1.63b 65.499b 20.20b 10.34b
T4=100-100 90053a 58.75a 31.95b 2.13a 79.484a 22.11a 11.19a
T5=125-125 93367a 61.25a 35.91a 2.21a 80.588a 22.34a 11.31a
T6=150-150 93230a 62.50a 37.38a 2.22a 83.142a 22.37a 11.34a
Values followed by same letters do not differ significantly at 0.05 probability level.
S.E± 558.2330 0.9923 0.6362 0.0511 0.9290 0.0.822 0.0620
LSD 0.05 3190.00 3.547 2.275 0.1846 2.972 0.2955 0.2213
LSD 0.01 3945.00 4.807 3.082 0.2502 4.027 0.4005 0.2999
CV% 4.66 5.21 5.66 7.36 3.38 1.09 1.45

11
REFERENCES
1. Asad, S., 2000. Crop description and climate in terms of water requirement in sugarbeet.
Land and Water Development Division. FAO Home Agriculture.
2. Barik, S., 2001. Strategies to check falling sugar concentration of sugar beet. Indian Journal
of Agricultural Biochemistry, 14 (1/2): 47-50.
3. Barlóg, P., 2003. Principles of mineral fertilizer use in sugarbeet. Gazeta Cukrownicza. 111
(1): 19-24.
4. Cattanach, A., W. C. Dahnke and C. Fanning. 2005. Fertilizing Sugarbeet NDSU Extension
Services, Pp. 1-5.
5. George, R. and M. Schmitt. 2002. Zinc for crop production. Communication and
Educational Technology Services, University of Minnesota Extension Service, Pp. 1-10.
6. Gomez, K. A., and A. A. Gomez. 1984. Statistical procedures for Agri. Res. (2nd
ed.) John
Willy and Sons New York. Pp. 69-75.
7. Hamilton, D., 2005. Sugarbeet, Beta vulgaris.
8. Jaszczolt, E., 1998. Influence of two methods of fertilizing sugarbeet with trace elements on
the yields of roots and sugar. Gazeta Cukrownicza. 106 (12): 232-234.
9. Khan, S. N., S. Rahman, G. Ahmad, U.A. Buriro, G.H. Jamro. 1998. Predicting nitrogen
requirements of sugarbeet based on different levels of irrigation. Sarhad Journal of
Agriculture. 14 (4): 277-280.
10. Martyn, T. H. 1978. Successful fruit and vegetable growing, Orbis Publishing, London, pp.
110
11. Mortvedt, J. J., D.G. Westfall and R.L. Croissant. 2004. Cooperative Extension, Soil and
Crop Sciences. 3 (96): 1-6.
12. Mortvedt, J. J., D.G. Westfall and R.L. Croissant. 2005. Fertilizing sugarbeets. Pakissan,
2004. Daily water situation. Report Center/Water update. Pakissan.Com Consultancies.
13. Safronovskaya, G.M., 1998. Effect of zinc fertilizers on the productivity and changes in zinc
content in sugarbeet at different soil acidity levels of a sod-podzolic loamy soil.
Pochvovedenie i Agrokhimiya. 30: 166-171.
14. Shahani, S., G.S. Tunio, M.U. Usmanikhail, F.T. Chandio and H.I. Majeedano. 2005.
Performance of different sugarbeet cultivars under Tandojam conditions. Proc. 46th
Annual
Conv of PSST, 5-7 September 2005.
15. Syed, M.M., 2002. Sugarbeet-a supplementary sugar crop. New Technology, Pakissan.com.
Pp. 1-3.
16. Usmanikhail, M.U., G.S. Tunio, H. I. Majeedano, Shabana Shahani and L.M. Baloch. 2005.
Effect of fertility levels on the growth, beetroot and quality characters of sugarbeet. Pakistan
Sugar Journal, XII (4): 56-59.
17. Uvarov, G.I., M.W. Bondarenko and W.B. Azarov. 2004. Conditions for high productivity
of sugarbeet in the Belgorod region. Sakharnaya Svekla. (9): 15-15.
18. Wyszynski, Z., Z. M. Kalinowska and B. Broniecka 1999. The effect of growth period,
growth rate and application rate and application method of nitrogen fertilizer on yield and
technological quality of sugarbeet: Part II. Technological yield of sucrose and root quality.
Roczniki Nauk Rolniczych. Seria A, Produkcja Roslinna. 114 (1/2) : 101-112.

12
EFFECT OF MEDIUM COMPOSITION ON CALLOGENESIS AND SOMATIC
EMBRYOGENESIS IN DIFFERENT VARIETIES OF SUGARCANE (SACCHRUM
OFFICINARUM L.) I.E. S-2002-US-302, HSF-240 AND HSF-242
Shagufta Naz* and G.Zahara Jahangir
Botany Department, Lahore College for Women University, Lahore
ABSTRACT
Segments from inner young leaf whorls (of 3-9mm length) of sugarcane were cultured on MS
growth medium supplemented with auxin alone i-e. 2,4-D (1-4 mg/l) and auxin-cytokinin
combinations in different ratios. Leaf tissue explants had great potential for callus induction,
somatic embryoid induction and supported plant regeneration. After inoculation embryogenic
callus (of varied texture and color) was formed while in some cases direct embryoid emergence
on cut edges of explant was also exhibited. Among MS media with auxin concentrations 2,4-D
3mg/l was more appropriate for callus and somatic embryoid induction as well as plant
regeneration in all three varieties. Each variety showed different response to different ratios of
auxin-cytokinin combinations.2,4-D+BAP (2+1, 2+2 & 2+3mg/l) and IAA+BAP (2+2 &
2+3mg/l) were more appropriate for callus and embryo induction and plant regeneration.
Abbreviations: BAP: 6-Benzyl aminopurine, 2,4-D: 2,4-Dichlorophenoxyacetic acid, IAA:
Indole acetic acid, MS: Murashige and Skoog‟s growth medium, EDTA: Ethyline diamine tetra
acetate.
Key words: Sugarcane, Saccharum officinarum, Callogenesis, Somatic embryogenesis. Leaf
whorls as explants
INTRODUCTION
Sugarcane is a member of family Gramineae and is commonly farmed, well known and
important cash crop of Pakistan. It is cropped in Pakistan mainly for sugar production. It is
second largest cash crop of Pakistan after cotton and the multibillion sugar industry of Pakistan
entirely based on sugarcane crop.
Sugarcane is an important source of income and employment for the farming community of
Pakistan along with sugar and sugary production. It also forms essential items for industries like
sugar, chip board, paper, baggase, confectionary, and use in chemicals, plastics, paints,
synthetics, fiber, insecticides and detergents (Alam & Khan, 2001).
It is cultivated on about 7.009 million hectares with 48.8 tons per hectare average yield and
8.33% sugar recovery. This is far below the world average of 63.7 tons per hectare yield and
10.6% sugar recovery (PSMA Annual report-2005). There may be many reasons for low cane
production and sugar recovery but lack of extensive research studies in sugarcane crop
technology & contamination of elite, transgenic varieties during multiplication by common
methods are major causes. Yield decline due to pathogen is most threatening factor.
Production losses in cane crop due to plant diseases can be stopped or lowered by cropping
sugarcane varieties with good agronomic characteristics i.e. tolerant to pests, diseases and

13
weather fluctuations. Disease tolerant or disease resistant varieties, produced by biotechnology
technique can be rapidly multiplied (in vitro propagated) by plant tissue culture technique.
Callogenesis, organogenesis and micropropagation techniques can be used to multiply
transgenic elite species in very short time. These techniques also eliminate the threats of disease
entry in a species during multiplication.
Sugarcane propagation by tissue culture technique is well appropriate because the main method
of plant production is vegetative in nature by stem cuttings called „setts‟.
To get benefit from tissue culture technique, in this research work three varieties (S-2002-US-
302, HSF-240 & HSF-242) of sugarcane were in vitro propagated through somatic embryoids
via intervening callus phase.
MATERIALS AND METHODS
Plant material: The explants of three varieties S-2002-US-302, HSF-240 and HSF-242 were
obtained from Ayub Agriculture Research Centre, Faisalabad. Inner whorls of leaves were used
as explants. The field collected plant material was washed several times with tap water with a
few drops of liquid soap followed by rinsing with autoclaved double distilled water. The outer
mature leaves were removed carefully the explant was surface sterilized to escape the threat of
contamination and innner leaf whorls of 3-9 mm were excised and inoculated on MS
(Murashige and Skoog, 1962) medium supplemented with different ratios of auxins and
cytokinins each singly and in combinations to find the optimum growth medium for in vitro
propagation of sugarcane via callogenesis and somatic embryogenesis.
Media formulation: Growth medium was prepared on MS formulation (MS basal salts
Macronutrients, Micronutrients, Iron EDTA and vitamins) with 3% sucrose and the media was
gelled with 1% Difco-Bacto agar after adjusting the pH at 5.5 to 5.7. The media was autoclaved
at 121°C for 20 min at 105 kPa and was inoculated with explants in complete aseptic cinditions.
The cultures were incubated at 23±2°C under 16-18hr light period (from fluorescent light tubes)
with 6-8hr dark period with light intensity of 3000-4000 lux.
Cultures were shifted to fresh media, regularly after three weeks, either with same
supplementation or with different. Proliferation rate and percentage of callus formation and
somatic embryoid formation was noted after each subculturing.
Callus induction: To study the sugarcane propagation via callogenesis, leaf tissue explants of all
varieties were cultured on MS media supplemented with four different concentrations of auxin
alone (in concentrations of 2,4-D 1- 4mg/l) and auxins in combination with cytokianins i-e. 2,4-
D & BAP (1+1, 2+1, 2+2, 2+3 & 1+2 mg/l) and BAP & IAA (2+2 & 3+2 mg/l). Data about
percentage of callus, form and color of callus was recorded after three weeks of incubation and
the time (in days) to induce callus formation was noted for each medium separately.

14
Somatic embryoid induction and plantlet formation:
Direct somatic embryogenesis: In this study, leaf tissue explants were cultured on MS medium
supplemented with different concentrations of auxin (2,4-D 1-4mg/l) and auxin-cytokinin
combinations in different ratios i-e. 2,4-D & BAP (1+1, 2+1, 2+2 & 2+3 mg/l) and BAP & IAA
(2+2 & 3+2 mg/l). Time taken (in days) to produce direct somatic embryos without intervening
phase of callus was noted and the percentage of direct somatic embryo induction and plant
regeneration from somatic embryos was calculated after six weeks of incubation in all three
varieties.
Indirect somatic embryogenesis: However indirect somatic embryogenesis via intervening
phase of embryogenic callus and number of regenerated plants were observed on the same type
of culture medium and after shifting into new selected media with supplementations different
from initial culture medium (auxin-cytokinin combinations). Percentage of indirect embryos
induction and plant regeneration was calculated after ten weeks of incubation.
The embryos produced were germinated into roots and shoots after certain weeks of inoculation.
To mediate plant regeneration through somatic embryos different media containing different
concentrations of hormones and their combinations were used and percentage of plant
regeneration was recorded.
Subculturing: Cultures were shifted to fresh media, regularly after three weeks, either with
same supplementation or with different. Proliferation rate, percentage of callus and somatic
embryoid formation was noted after each sub culturing.
RESULTS AND DISCUSSION
Effect of Auxin alone and Auxin-Cytokinin combinations on callogenesis
In immature leaf segments callus induction was observed within first week of incubation. HSF-
242 was observed to be latent in response to callus induction as compared to other two varieties;
HSF-240 responded earlier than others with higher percentage of callus formation. Among four
concentrations of auxin alone (2,4-D 1-4 mg/l) used, MS medium supplemented with 2,4-D
3mg/l proved to be the best for callus response with highest percentage of callus formation
(100% in S-2002-US-302 & HSF-240 and 90% in HSF-242) with least time (5,3 & 9 days
respectively) taken to induce callus formation (Table-1). 14 days old calli of S-2002-US-302,
HSF-240 & HSF-242 in 2,4-D 3mg/l are shown in Fig-1(a) to (c).
Many researchers like Liu et al., (1980), Ho and Vasil (1983) and Virupakshi et al., (2002) have
also used young leaf tissues of sugarcane as explant for callogenesis. Alam et al., (2003) used
MS with supplementation of 2,4-D (1-4 mg/l) and found 2,4-D 3mg/l more appropriate for
callus induction. Kharinarain et al., (1996) and Mannan & Amin (1999) found MS+2,4-D 3mg/l
as best medium for callusing in sugarcane. Fitch and Moor (1990), Somashekhar et al., (2000),
Lal, (2003) and Gandonou et al., (2005) maintained callus on MS medium with 2,4-D at 3 mg/l
and obtained good results. Gill et al., (2006) reported swelling in cultured leaf segments of
sugarcane before callus induction.
15
Two types of auxin-cytokinin combinations (2,4-D & BAP in concentration of 1+1, 2+1, 2+2 &
2+3 mg/l and BAP & IAA in 2+2 & 3+2 mg/l) were tested to check the potential of sugarcane
for callogenesis. S-2002-US-302 responded better to
(a) (b) (c)
Fig.1 (a) callus of S-2002-US-302, (b) callus of HSF-240 & (c) callus of HSF-242 (all are 14
days old).
MS medium supplemented with IAA+BAP 2+3mg/l than any other combination. In HSF-240 &
HSF-242 best callusing responses were exibited by 2,4-D & BAP in ratios of 2+2mg/l and
2+1mg/l.
Similar work was done by Kumari (2000) and has reported callus formation in sugarcane on MS
basal medium with various concentrations and combinations of different auxins and cytokinins.
Of the different media tested, the best response was found on MS with BAP + 2,4-D 1+2 mg/l
for callus formation.
Significant variability was observed in the form and colour of callus even in viability
(embryogenic calli produced plenty of plants through somatic embryoids) and proliferation rate
(the rate with which explant turned into callus tissue) of calli of different varieties developed in
growth medium with different supplementation as a result of hormonal action (detailed
observations are given in (Table-1).
Many researchers have reported variety of callus colors and texture types in many varieties of
sugarcane on different media from different explants i-e. Guiderdoni and Demarly (1988) found
nodular and friable, Zhou et al., (1995) reported compact and granular, Escalona et al., (1995)
observed compact and nodular, Fitch and Moore (1990) noted white and green colored and
Anbalagan et al., (2000) reported (a) loose, friable and non embryogenic, and (b) compact,
white, nodular and emryogenic calli.
Response to growth media with different supplementations lead to make two assumptions: first
that the time taken by explant to induce callus formation goes on decreasing with the increase in
concentration of auxin in medium upto specific concentration (3 mg/l) i-e, variety S-2002-US-
302 took 7, 6, 5 and 9 days, variety HSF-240 took 9, 7, 3 and 5 days and variety HSF-242 took
15, 15, 9 and 11 days in 2,4-D 1mg/l, 2mg/l, 3mg/l & 4mg/l respectively (Table-1); second that
auxins alone were more effective to produce fresh and viable calli as compared to auxins in

16
combination with cytokinins i-e, percentage of callus induction was higher in auxins than
auxins+cytokinins (Table-1).
Effect of subculturing on callus proliferation rate
The calli formed from leaf tissue explant of all varieties, called as the main cultures, were
subcultured on fresh MS medium with same supplementation as the main cultures, after every
three weeks upto four subcultures and the data of observations was collected upto fifteen weeks
of incubation. When the calli (the main cultures), formed in different media, were subcultured
they proliferated at their maximum rate after first and second subculture but turned brown, at
the end of third subculture and died after fourth subculture. The argument is supported with the
percentage of cultures those showed positive response (proliferated better than before
subcultured) i-e variety S-2002-US-302 showed 85, 60, 30 & 10%, variety HSF-240 showed
100, 80, 20 & 0%, and variety HSF-242 as 50, 15, 15 & 0% proliferation after first, second,
third and fourth subculture respectively (Text fig.1).
Effect of Auxins alone and Auxin-Cytokinin combinations on direct somatic
embryogenesis:
Initially the explants (young leaf segments) developed nodular outgrowths on the cut edges
when cultured on MS medium, which transformed into pro-embryoids. These pro-embryoids
developed into well-developed bipolar embryos within six weeks of incubation.
Direct embryogenic response was observed within 12-35 days of incubation in four different
concentrations of 2,4-D. Pro-embryos were observed at cut edges of leaf tissue (Fig.2) in 2,4-D
3mg/l within 12 and 18 days after incubation with 40% and 20% embryo induction (Table-2) in
varieties S-2002-US-302 and HSF-240 respectively. In other concentrations of 2,4-D embryos
induced later than 2,4-D 3mg/l and didn‟t support plenty of plantlets. The same behaviour was
true for both varieties. In variety HSF-242 no embryo induction was observed directly rather
whole of the explant cultured turned into embryogenic callus.
0102030405060708090
100
No. of
subculture
s
1st 2nd 3rd 4th
%age of cultures
showing prolifertion
response
Text f ig-1 Percentage response of
subculturing on callus proliferation in varieties
S-2002-US-302, HSF-240 & HSF-242
S- 2 0 0 2 - U S-
3 0 2
HSF- 2 4 0
HSF- 2 4 2

17
Fig.2 Direct embryogenesis in S-2002-US-302 in 2,4-D 3mg/l.
Among hormonal combinations, embryo induction was observed within 16-39 days and 2,4-
D+BAP 2+1 mg/l found most appropriate with 5% and 50% embryo induction within 39 and 16
days in S-2002-US-302 and HSF-240 respectively. 2,4-D+BAP 2+2 mg/l, induced embryoids
within 22 and 37 days with 5% and 10% in S-2002-US-302 and HSF-240 respectively (Table-
2). IAA+BAP combination didn‟t support direct somatic embryos at all in any variety.
Some other researchers have also used young leaf segments as explant for embryogenesis i-e.
Gill et al., (2006) used young leaf segments. Manickavasagam and Ganapathi (1998) also used
leaf segments and cultured on MS media supplemented with auxins alone (2,4-D 1-4mg/l) and
in combination with 0.5, 1.0 & 2.0mg/l BAP. He found that 2,4-D+BAP 2+1mg/l among
different combinations was best for direct embryogeesis.Niaz & Quraishi (2002) and Franklin et
al., (2006) obtained considerable results in 3-mg/l 2,4-D for embryogenesis.
Effect of Auxin alone and Auxin-Cytokinin combinations on indirect somatic
embryogenesis:
In variety S-2002-US-302 MS medium supplemented with 2,4-D 1- 4 mg/l was used to
investigate the effect of auxins alone on indirect somatic embryogenesis. In all concentrations of
2,4-D, 1-4mg/l the calluses were observed to induce somatic embryos in main culture (before
first sub-culture) within 16, 15, 14 & 20 days with 25, 50, 100 and 30% embryo induction
respectively (Table-3) but these embryos died with passage of time in successive subcultures
and showed no plant regeneration except in 2,4-D 3mg/l that seemed more appropriate and
produced plenty of plants Fig.3 (a) shows brown colored somatic embryoids on yellowish green
callus and root emergence is very clear and (b) shows shoot emergence through somatic
embryoids.

18
Fig.3 (a) Somatic embryoids in 21 days old culture in S-2002-US-302 in 2,4-D 3mg/l (b) plant
emergence through somatic embryoids in same medium in 40 days old culture.
Among diferent auxin-cytokinin combinations 2,4-D+BAP (2+3 mg/l) and IAA+ BAP
(2+3mg/l) showed best results. In 2,4-D+ BAP (2 + 3 mg/l) embryo formation started after 14
days of incubation with 65% embryo formation (Table-3).
In HSF-240 2,4-D 3mg/l was more appropriate among 2,4-D 1-4mg/l for embryo induction (70
%) and took least time (among auxins alone) to induce somatic embryoids (second day after 1st
subculture and 23 days of incubation) but these were not viable for plant regeneration. 2,4-
D+BAP 2+1 and 2+2 mg/l media proved best with 90 and 100% induction of most viable
embryoids within 20 & 18 days (Table-3), Fig.4 (a) shows yellow colored nodular embryos and
Fig.4 (b) plantlet emergence through these embryoids. IAA+ BAP (1+2 and 2+2 mg/l) also
showed good results.
(a) (b)
Fig. 4 (a) Somatic embryoids in 50 days old culture of HSF-240 in 2,4-D+BAP (2+2) mg/l, (b)
plant emergence through somatic embryoids in same medium in 70 days old culture.
In HSF-242, in contrary to rate of callus formation the rate of embryo induction and shoot
formation was too slow in different concentrations of 2,4-D as compared to auxin-cytokinin
combinations. None of the culture was observed to induce somatic embryos before subculture
(Table-3). 2,4-D+BAP (2+2 & 2+3 mg/l) combinations proved best for embryo induction (30 &
35% respectively, Table-3) and plant regeneration in this variety (Fig.5 a-b).
It was infered that the potential of leaf tissue explants for somatic embryo induction and plant
regeneration was found to be very high in all varieties, cultured on MS medium supplemented
with auxin-cytokinin combination and least in auxin alone except S-2002-US-302 which
showed very good percentage, rate of embryo induction and plant regeneration in auxin (2,4-D)
also. Direct embryogenesis showed rapid differentiation than that of indirect but the rate of
survival was higher in plants generated through indirect somatic embryogenesis.
Some other researchers i-e. Niaz and Quraishi (2002), Gill et al., (2004) and Ahloowalia &
Maretzki (1983) have also found that among auxins alone 2,4-D 3mg/l is most appropriate
medium for indirect somatic embyogenesis and plant regeneration in sugarcane.Ho and Vasil
(1983) has used young leaves of sugarcane for somatic embryogenesis on MS medium with 2,4-
D.

19
(b)
Fig.5 (a) Somatic embryoids in 105 days old culture of HSF-242 in 2,4-D+BAP (2+2) mg/l (b)
plant emergence through somatic embryoids in 2,4-D+BAP (2+3) mg/l in 155 days old culture.
Ahloowalia and Maretzki (1983) reported somatic embryogenesis on MS medium with 3mg/l 2,
4-D after 10 weeks of culture. Effect of auxin-cytokinin combination on indirect somatic
embryogenesis was studied by Manickavasagam and Ganapathi (1998) and they used 2, 4-D
alone (1-4mg/l) and in combination with BAP (0.5, 1.0 & 2.0mg/l) and found best results with
2, 4-D+BAP (2+1 mg/l).
Effect of sub-culturing on somatic embryogenesis and plant regeneration
Sub-culturing strongly affects the somatic embryogenesis and rate of plant regeneration through
somatic embryoids. Auxin (2,4-D) at the concentration of 3mg/l formed calli with highest rate
of proliferation and good percentage but these calluses didn‟t induce any embryo or plantlet
formation, even after several subcultures on medium of same supplementation. These calluses
were sub-cultured and shifted to new media with different supplementations i.e.
supplemented with auxin-cytokinin combinations. It was generally observed that sub-
culturing favors embryo induction and plant regeneration especially when cultures were
transferred from auxin alone (2,4-D) to auxin-cytokinin combination i.e. 2,4-D + BAP
(1+1, 2+1, 2+2, 2+3mg/l) and IAA+BAP (2+2, 2+3 mg/l) in S-2002-US-302, 2,4-D + BAP
(3+1, 1+1, 2+1, 2+2 mg/l)in HSF-240 and HSF-242. Two combinations, 2, 4-D + BAP (2 +
1, 2 + 2 & 2 + 3) and BAP + IAA (2 + 1 & 2 + 2) showed best results.

20
In S-2002-US-302 1st, 2
nd and 3
rd with 60, 100 and 90% response, in HSF-240 3
rd and 4
th with
90 & 60% (Fig.6 a & b) and in HSF-242 5th
and 6th
with 60 & 40% (Fig.7 a & b) subcultures
were more effective to enhance the rate of embryogenesis and plant regeneration (Text fig.2) .
(a) (b)
Fig.6 Effect of subculturing on somatic embryoids and plant formation in HSF-240 (a)
Response to 3rd
subculture 70 days old culture in 2,4-D+BAP 2+1mg/l (b) Response to 4th
subculture 85 days old culture in same medium.
Fig.7 Effect of subculturing on somatic embryoids and plant formation in HSF-242 (a)
Response to 5th
subculture 120 days old culture in 2,4-D+BAP 2+2mg/l (b) Response to 6th
subculture 145 days old culture in same medium.

21
Table-1 Effect of different concentrations of phytohormones and
combinations on callus initiation and its development in variety
S-2002-US-302, HSF-240 and HSF-242
Medium Conc.
mg/l
No. of
explant
cultured
Age of
culture
(weeks)
Days to callus
initiation after
incubation
%age of
callus
induction
Proliferatio
n rate
Color of
callus
Form of
callus
Viability
Varieties → 30
2
240 242 30
2
24
0
24
2
30
2
24
0
24
2
30
2
24
0
24
2
30
2
240 24
2
30
2
24
0
24
2
MS+2,4
-D
1.0
2.0
3.0
4.0
20
20
20
20
3
3
3
3
7
6
5
9
9
7
3
5
15
15
9
11
30
35
10
0
45
15
20
10
0
60
35
40
90
25
P
E
E
G
P
F
E
F
P
P
F
G
B
G
Y
B
B
B
D
Y
B
Y
Y
B
Y
B
P
Y
Y
F-
C
LC
LF
LC
LF
LF
LF
F
LC-
LF
LC-
LF
LF-
NF
NF
N
V
L
V
V
V
N
V
N
V
L
V
V
V
L
V
N
V
N
V
V
L
V
MS
+2,4-D+
BAP
1+1
2+1
2+2
2+3
1+2
20
20
20
20
20
3
3
3
3
3
10
8
5
10
-
-
4
7
3
5
12
10
9
18
-
30
45
40
20
-
-
85
90
95
35
25
60
45
25
-
P
F
F
F
-
-
G
E
F
P
F
F
P
P
-
D
G
FG
B-
Y
G
Y
-
-
O
Y
FY
Y
LB
F
Y
F
Y
Y
Y
-
LF
LF
LF
NF
-
-
L.
F
N.
F
F
L.
F
NF
NF
LC-
NF
LC-
NF
-
L
V
V
V
L
V
-
-
V
V
V
L
V
N
V
N
V
V
V
V
N
V
-
MS
+IAA+
BAP
2+2
2+3
20
20
3
3
14
20
-
-
-
-
40
90
-
-
-
-
F
E
-
-
-
-
D
B
G
Y
-
-
-
-
LF
NF
-
-
-
-
V
V
V
-
-
-
-
Abbreviations:
Conc. concentration
B: brown DB: dark brown LC-LF: less compact to less friable
P: poor YB: yellowishbrown FG: fresh green
LF-NF: less friable to nodular friable F: fair PY: pale yellow
DG: dark green LC-NF: less copact to nodular friable G: good
Y: yellow OY: orange yellow NF: nodular friable
E: excellent FY: fresh yellow BY: brownish yellow
GY: greenish yellow B-Y: brown to yellow DY: dark yellow
BY: brownish yellow

22
Table-2 Effect of different concentrations of phytohormones and
combinations on direct embryogenesis in variety
S-2002-US-302, HSF-240 and HSF-242
Medium Conc.
mg/l
No. of
explant
cultured
Age of
cultures
(weeks)
Days to embryo
induction after
incubation
%age of embryo
induction
Varieties → 302 240 242 302 240 242
MS+2,4-D 1.0
2.0
3.0
4.0
20
20
20
20
6
6
6
6
18
20
12
35
25
29
18
31
-
-
-
-
5
5
40
5
5
5
20
5
-
-
-
-
MS+2,4-
D+BAP
1+1
2+1
2+2
2+3
20
20
20
20
6
6
6
6
-
39
22
-
-
16
37
-
-
-
-
-
-
5
5
5
-
50
10
-
-
-
-
-
MS+IAA+BAP 2+2
2+3
20
20
6
6
-
-
-
-
-
-
-
-
-
-
-
-
Table-3 Effect of different concentrations of phytohormones and
combinations on callus initiation and its development in variety
S-2002-US-302, HSF-240 and HSF-242
Medium Conc.
mg/l
No. of
explant
cultured
Age of
culture
(weeks)
Days to embryo
induction after
incubation
Days to embryo
induction after
transfer
%age of embryo
induction
Color of callus
Varieties → 302 240 242 302 240 242 302 240 242 302 240 242
MS+
2,4-D
1.0
2.0
3.0
4.0
20
20
20
20
10
10
10
10
16
15
14
20
-
(50)
(23)
(40)
-
-
-
-
-
-
-
-
-
8(2)
2(1)
19(1)
-
-
-
-
25
50
100
30
5
55
70
60
-
-
-
-
+
+
3+
+
-
+
2+
+
-
-
-
-
MS+
2,4-
D+BAP
1+1
2+1
2+2
2+3
3+1
20
20
20
20
20
10
10
10
10
10
(44)
(37)
(25)
14
-
-
20
18
-
(50)
-
(150)
(110)
(108)
-
-
2(2)
16(1)
4(1)
-
-
-
-
-
8(2)
-
3(7)
15(5)
3(5)
-
35
45
20
65
-
-
90
100
-
40
-
15
30
35
-
0
+
+
3+
-
-
3+
3+
-
0
-
+
2+
2+
-
MS+
IAA+BAP
1+1
2+1
3+1
1+2
2+2
2+3
20
20
20
20
20
20
10
10
10
10
10
10
-
-
-
-
(37)
(27)
(91)
(96)
(106)
(31)
(23)
-
-
-
-
-
-
-
-
-
-
-
16(1)
6(1)
13(4)
18(4)
1(5)
10(1)
2(1)
-
-
-
-
-
-
-
-
-
-
-
55
70
40
40
20
70
90
-
-
-
-
-
-
-
-
-
-
-
2+
3+
+
+
+
2+
3+
-
-
-
-
-
-
-
Abbreviations:0: less than previous +: same as before subculturing
2+: doubled than previous 3+: tripled than previous
Days to embryo induction after incubation: In the ( ) the age of cultures is given and represents
induction after 1st subculture while without parenthesis represents before subculture.
Days to embryo induction after transfer: no. of subcultures is given in parenthesis.

23
REFERENCES
1. Ahloowalia, B.S. & A. Maretzki, 1983. Plant regeneration via somatic embryogenesis in
sugarcane. Plant Cell Reports, 2 (1), 21-25.
2. Alam, S.M. & M. A. Khan. 2001. The sugar industry plays a pivotal role in the national
economy of our country. Nuclear Institute of Agriculture, Tandojam, Pakistan.
3. Alam, R., S. A. Mannan, Z. Karim & M. N. Amin, 2003. Regeneration of sugarcane
(Sacchrum officinarum) plantlet from callus. Pakistan Sugar Journal, 18, 15-19.
4. Anbalagan, S., A. Kalmani & M. Sakila, 2000. In vitro propagation of sugarcane: nature of
callus, direct regeneration, regeneration through callus and morphological variations.
Research on Crops, 2, 138-140.
5. Escalona, M., R. Castillo, O. Concepcion, C. G. Barroto, J. C. Lorenzo, M. A. Daquinta,
1995. Influence of two callus types on the establishment of cell suspensions in sugarcane
(Sacchrum spp.). Centro Agricola, 22, 63-70.
6. Fitch, M.M.M. & P. H. Moore. 1990. Comparison of 2,4-D and picloram for selection of
long-term totipotent green callus cultures of sugarcane. Plant Cell, Tissue and Organ
Culture, 20, 157-168.
7. Franklin, G., S. Arvinth, C. J. Sheeba, M. Kanchana & N. Subramonian, 2006. Auxin
pretreatment promotes regeneration of sugarcane (Saccharum spp. hybrids) midrib segment
explants. Plant growth regulation, 50, 11-119.
8. Gandonou, C., J. Abrini, M. Idaomar & N. S. Senhaji, 2005. Response of sugarcane
(Saccharum sp.) varieties to embryogenic callus induction and in vitro salt stress. African
Journal of Biotechnology 4, 350-354.
9. Gill, N.K., R. Gill & S. S. Gosal, 2004. Factors enhancing somatic embryogenesis and
plant regeneration in sugarcane (Saccharum officinarum L.). Indian Journal of
Biotechnology, 3, 119-123.
10. Gill, R., P. K. Malhotra & S. S. Gosal, 2006. Direct plant regeneration from cultured young
leaf segments of sugarcane. Plant Cell, Tissue and Organ Culture, 84, 100205-100209.
11. Guiderdoni, E. & Y. Demarly, 1988. Histology of somatic embryogenesis in cultured leaf
segments of sugarcane plantlets. Plant Cell, Tissue and Organ Culture, 14, 71-88.
12. Ho, W.J. & I. K. Vasil, 1983. Somatic embryogenesis in sugarcane (Saccharum
officinarum L.) I. The morphology and physiology of callus formation and the ontogeny of
somatic embryos, 118, 169-180.
13. Kharinarain, R.P., Y. U. L. Dolikh & Y. U. L. Guzhov, 1996. Selection of media for mass
regeneration of sugarcane plants from callus culture. Russian Journal of Plant Physiology,
43, 97-100.
14. Kumari, R., V. K. Shahi & A. K. Singh, 2000. Callus formation in some genotypes of
sugarcane (Sacchrum officinarum L.). Journal of Applied Biology, 10, 149-151.
15. Lal, N. 2003. High frequency plant regeneration from sugarcane callus. Sugar Tech, 5, 89-
91.
16. Liu, M.C., W. H. Chen & S. C. Shih, 1980. Sites of sugarcane callus formation in young
leaf and stem tip explants. Seventeenth Congress of the International Society of Sugarcane
technologists, 1, 458-469.
17. Manickavasagam, M. & A. Ganapathi, 1998. Direct somatic embryogenesis and plant
regeneration from leaf explants of sugarcane. Indian Journal of Experimental Biology, 36
832-835.
18. Mannan, S.K.A. & M. N. Amin, 1999. Callus and shoot formation from leaf sheath of
sugarcane (Sacchrum officinarum L) in vitro. Indian Sugar, 49,187-192.

24
19. Murashige, T. & F. Skoog, 1962. A revised medium for rapid growth and bioassay with
tobacco tissue culture. Physiol Plant, 15,473-487.
20. Niaz, F. & A. Quraishi, 2002. Studies on Somatic Embryogenesis in Sugarcane. Online
Journal of Biological Sciences, 2, 67-69.
21. PSMA Annual report-2005.
22. Somashekhar, R., C. N. Sudheendra & S. A. Aparna, 2000. Callus induction in sugarcane
cultivars. Advances in Plant Sciences, 13, 119-122.
23. Virupakshi, S., B. R. Manjunatha & G. R. Naik, 2002. In vitro flower induction in callus
from a juvenile explant of sugarcane, Sacchrum officinarum L., Var. CoC 671. Current
Science, 83, 1195-1197.
24. Zhou, L.Z., C. M. Zhou, L. Q. Xia, Y. Q. Sheng, & Z. X. Qin, 1995. Plant regeneration
from protoplast of sugarcane. Acta Agriculturae Sinica, 2, 100-104.

25
DETERMINATION OF SITE SPECIFIC FERTILIZER REQUIREMENT OF
SUGARCANE AND INTERCROP (POTATO) UNDER SUGARCANE-BASED
CROPPING SYSTEM
G. C. Paul*, S. M. Bokhtiar, A. K. Azad and M. A. Mannan
** All correspondence should be addressed to: Soils and Nutrition Division,
Bangladesh Sugarcane Research Institute, Ishurdi-6620, Pabna, Bangladesh
ABSTRACT
A field experiment was conducted at Ishurdi under High Ganges River Floodplain
(AEZ 11) and Jamalpur under Young Brahmaputra and Jamuna Floodplain (AEZ 9)
soils with a view to determine the fertilizer requirements of cane and intercrop
(potato) and their economics under sugarcane based cropping systems. Cane yield was
enhanced (6-8%) when it was intercropped with potato for the residual effect of
applied fertilizer to intercrop. Gross return and gross margin was higher in cane
intercropped with potato over sole crop at both the locations. Intercropping potato
with sugarcane using BSRI‟98 rates of fertilizer for cane and potato followed by in
situ dhaincha incorporation gave higher economic benefit at Ishurdi and Jamalpur.
INTRODUCTION
Substantial advantage in yield from intercropping system is achieved compared to
sole cane due to synergistic effects of companion crops on each other by making
better use of agronomic management and residual advantage of applied fertilizer for
intercrops (Imam et al., 1990; Bokhtiar et al., 1995 and Willey et al., 1979).
Sugarcane plants have large lateral spread when fully-grown but initial rate of
increase in horizontal spread is rather slow. Generally sugarcane is cultivating with a
row spacing of 90 cm or more and much of this space remains unutilized for a period
of 100-120 days. Hence there is an ample scope to grow one or more intercrops in the
vacant space in between the rows. The sugarcane crop depletes a considerable amount
of fertilizer from soil. As a consequence soils loose its inherent ability to supply
nutrient for sustainable production. Yadav et al., 1987 reported that the organic matter
content of sugarcane soil increased due to companion cropping of pulses. The
combined return of cane and potato was always higher when both the crops were
planted together and received their full rates of fertilizer (Imam et al.,1990). The
importance of these intercropping systems is known, the trial was designed to verify
how different nutrient management options based on medium and high yield goals
influence its productivity, profitability and change in soil fertility.
MATERIALS AND METHODS
A field experiment was conducted in 2000-2001, 2001-02, 2002-03 and 2003-04
cropping seasons at Ishurdi under High Ganges River Floodplain (AEZ 11) and
Jamalpur under Young Brahmaputra and Jamuna Floodplain (AEZ 9) soils. The soil
characteristics of the experimental sites are given in table 4a,b. Each treatment
replicated three times in a randomized complete block design. Details of treatments

26
and the amount of fertilizers used for each treatment are given in Table 1. A 30-day
old single budded soil bed settlings with a row spacing of 1m and interplant spacing
of 0.5m were transplanted at Ishurdi (var. Isd 30) and Jamalpur (var. Isd 28) in
December and it was harvested after 13-months. The unit plot size was 8 m x 6m. One
line of potato (var. cardinal) tuber as intercrop was planted in between cane rows and
harvested after 90 days of plantation. Full dose of P, S, Zn as TSP, Gypsum and Zinc
sulphate were applied in trenches and thoroughly mixed with soils by spade prior to
transplanting of sugarcane settlings. One third of the quantities of N and K were top-
dressed after 20-30 days of settling transplantation. The rest amount of N and K
fertilizers was applied in two equal splits at tiller completion stage and grand growth
stage. Half of N, K and all other fertilizers for potato were applied at the vacant space
of two cane rows and mixed thoroughly with soils and remaining N and K were
applied as top dressing at 45 days of planting. The recommended crop management
practices were followed when required for cane and intercrop potato.
Table-1 Details of treatments and the amount of fertilizers (kg ha-1
) used in
each treatment in sugarcane + potato intercropping systems
Treatments Locations
Ishurdi Jamalpur
N P K S Zn GM
(Green
biomass)
N P K S Zn GM
(Green
biomass)
T1 Cane 130 35 60 20 3 - 120 40 70 25 2 -
T2 Cane 196 27 97 0 0 - 177 60 115 9 - -
T3 Cane 150 52 90 35 3 - 150 42 100 30 2 -
T4 Cane
Potato
130 35 60 20 3 - 120 40 702 25 2 -
50 10 20 0 0 - 50 10 25 10 - -
T5 Cane
Potato
150 52 90 35 3 - 150 42 100 30 2 -
69 16 40 0 0 - 50 10 40 0 0 -
T6 Cane
Potato
150 52 90 20 3 13, 500 150 42 100 30 2 15, 000
50 10 20 0 0 - 50 10 40 0 0 -
T1-Sole sugarcane (Fertilizer used for MYG as per FRG‟97 on AEZ basis), T2- Sole
sugarcane (Fertilizer used for HYG as per STB), T3- Sole sugarcane (Fertilizer used
as per BSRI‟98), T4- Sugarcane + potato (as per FRG‟97), T5- Sugarcane + potato (as
per BSRI‟98) and T6- Sugarcane + potato (as per BSRI‟98) followed by Dhaincha.
MYG-Moderate yield goal; STB- Soil test basis; BSRI-Bangladesh Sugarcane
Research Institute; FRG- Fertilizer Recommendation Guide
RESULTS AND DISCUSSION
Yield of sugarcane and intercrop (potato)
The effect of different fertilizer management options on the yield of cane and
intercrop (potato) is presented in Table 2. Fertilizers applied for MYG gave high yield
of sole cane (95.56 t ha-1
). Further increase the amount of fertilizer either soil test
basis or BSRI‟98 basis did not increase cane yield remarkably. Cane yield was higher
in intercropping system than sole crop and the highest cane yield was found in T5
(113.86 t ha-1
) which was 6% higher than the corresponding sole cane (T3). The
27
residual value of fertilizers applied in potato might be helped in increasing cane yield.
This finding was in close conformity with the finding of Verma and Bhoj (1980) who
reported that plots intercroppped with potato yielded more cane than plots with cane
alone and net profit from this plot was significantly higher than any other
intercropping combination. Highest potato yield of 7.99 t ha-1
was obtained in T6
treatment that received fertilizer as per BSRI‟98 followed by dhaincha. Cane
equivalent yield was influenced by cane yield but small variation in potato yield (0.84
t ha-1
between T5 and T6) largely influenced the corresponding cane equivalent yield.
The effect of GM in increasing cane yield was not evident.
Cost and return analysis
Gross margin increased with increase of cane equivalent yield and the highest was
with T6. BCR was lower in intercropping systems than sole crop because of higher
total variable cost with former systems (Table 3).
Soil fertility status
The status of soil pH, organic matter, total N, available P, K and S in initial soil as
well as post harvest soil are presented in Table 4a. There were not conspicuous
changes in organic matter and total N contents in soils. A little negative change in
available P with a positive change in available S was observed. However, the change
in available K was not conspicuous for the different fertilizer treatments.
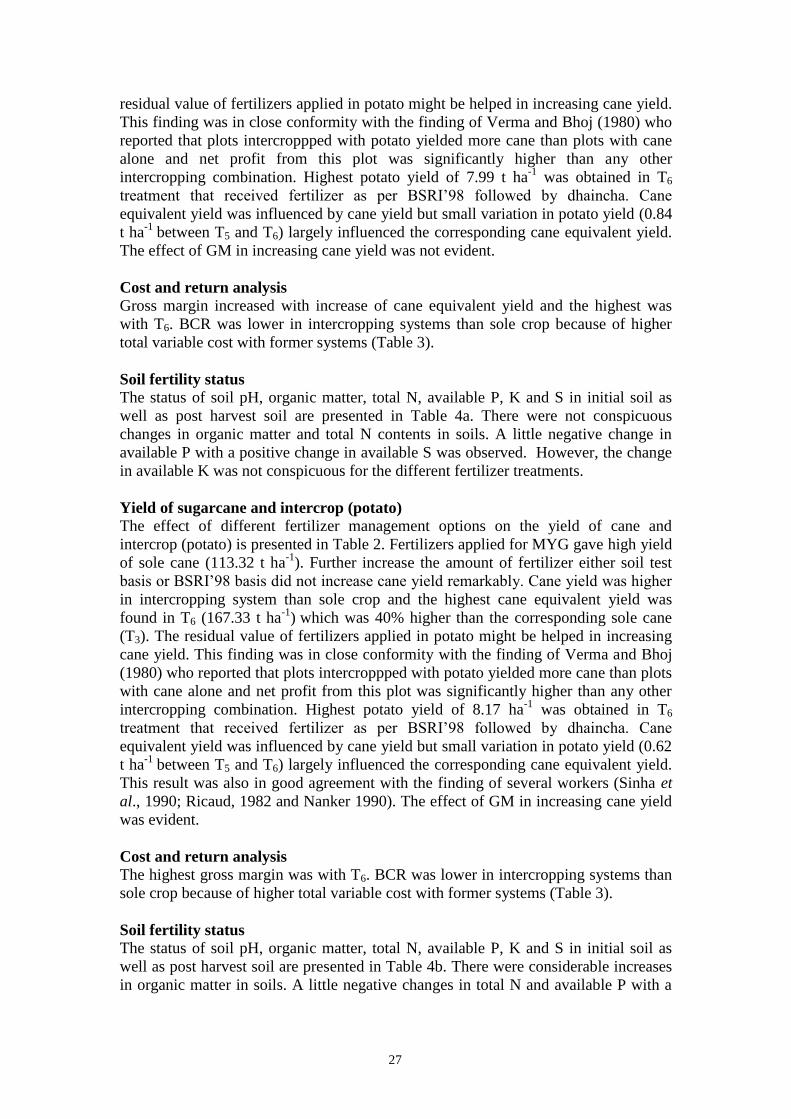
Yield of sugarcane and intercrop (potato)
The effect of different fertilizer management options on the yield of cane and
intercrop (potato) is presented in Table 2. Fertilizers applied for MYG gave high yield
of sole cane (113.32 t ha-1
). Further increase the amount of fertilizer either soil test
basis or BSRI‟98 basis did not increase cane yield remarkably. Cane yield was higher
in intercropping system than sole crop and the highest cane equivalent yield was
found in T6 (167.33 t ha-1
) which was 40% higher than the corresponding sole cane
(T3). The residual value of fertilizers applied in potato might be helped in increasing
cane yield. This finding was in close conformity with the finding of Verma and Bhoj
(1980) who reported that plots intercroppped with potato yielded more cane than plots
with cane alone and net profit from this plot was significantly higher than any other
intercropping combination. Highest potato yield of 8.17 ha-1
was obtained in T6
treatment that received fertilizer as per BSRI‟98 followed by dhaincha. Cane
equivalent yield was influenced by cane yield but small variation in potato yield (0.62
t ha-1
between T5 and T6) largely influenced the corresponding cane equivalent yield.
This result was also in good agreement with the finding of several workers (Sinha et
al., 1990; Ricaud, 1982 and Nanker 1990). The effect of GM in increasing cane yield
was evident.
Cost and return analysis
The highest gross margin was with T6. BCR was lower in intercropping systems than
sole crop because of higher total variable cost with former systems (Table 3).
Soil fertility status
The status of soil pH, organic matter, total N, available P, K and S in initial soil as
well as post harvest soil are presented in Table 4b. There were considerable increases
in organic matter in soils. A little negative changes in total N and available P with a

28
positive change in available S was observed where the changes in available K were
not conspicuous for the different fertilizer treatments.
In conclusion, it may be suggested that fertilizer application as per soil test value
(STV) basis against targeted yield would produce higher cane yield by 6 per cent over
MYG as per AEZ basis. In sugarcane-potato intercropping system, an increase of 6 to
8 per cent higher cane yield could be ensured over sole cane.
REFERENCES
1. Bokhtiar, S.M., M.A. Majid, and M.J. Islam. 1995. Fertilizer management for
sugarcane -potato intercropping in the Old Himalayan Piedmont plain soils of
Bangladesh. Bangladesh J. Sugarcane, 17:107-112.
2. Imam, S.A., A.H.M.D. Hossain, L.C. Sikka, and D.J. Midmore. 1990.
Agronomic management of potato/sugarcane intercropping and its implication.
Field Crop Research. Elsevier Science publishers.B.V., Amsterdam.25:111-122.
3. Nankar, J.T.1990. Scope and prospects for intercropping with sugarcane in
Maharastra State, India. Field Crops Research.25 (1): 123-132.
4. Recaud, C. 1982. Potato cultivation in sugarcane interlines in Mauritius. Research
objectives and development achievements. Revue-Agricola-et-Sucriere-de-I‟lle-
Maurice.61 (2):123-133.
5. Sinha, U.P., S.S. Sinha, and K.C. Jha. 1990. Intercropping of potato (Solanum
tuberosum) with sugarcane in relation to row arrangement and nitrogen levels.
Indian J. Agric. Sci., 60(50): 317-321.
6. Verma, R.N. and R.L. Bhoj. 1980. Intercropping of potato with autumn planted
sugarcane gives high profits in light soils. Indian Sug. Crops J., 7(4): 105-108.
7. Willey, R.W. 1979. Intercropping-its importance and need. Part I- Competition
and yield advantage. Field Crop Abstracts. 32:1-10.
8. Yadav, R.L., S.R. Prasad and Singh, K. 1987. Fertilizer requirement and row
arrangement of pulses in sugarcane based cropping systems. Indian J. Agron.
32(1): 80-84.

29
Table-2 Yield of sugarcane and potato intercrop as affected by different
fertilizer management options
Treat
ment
2000-01 2001-02 2002-03 2003-04 Mean
Yield (t ha-1
) Cane
equiva
lent
yield
(t ha-1
)
Yield (t ha-1
) Cane
equiva
lent
yield
(t ha-1
)
Yield (t ha-1
) Cane
equiva
lent
yield
(t ha-1
)
Yield (t ha-1
) Cane
equiva
lent
yield
(t ha-1
)
Cane Potato Cane Potato Cane Potato Cane Potato
Ishurdi
T1 105.47 - 105.47 90.93 - 90.93 93.93 - 93.93 91.92 - 91.92 95.56
T2 108.07 - 108.07 96.87 - 96.87 87.02 - 87.02 112.24 - 112.24 101.05
T3 112.45 - 112.45 104.61 - 104.61 103.21 - 103.21 110.00 - 110.00 107.57
T4 115.47 7.38 154.78 126.40 4.95 152.80 79.94 6.28 113.43 97.60 6.52 132.37 138.35
T5 126.46 8.06 169.13 121.14 5.88 152.50 88.04 7.21 126.49 119.79 7.43 159.42 151.89
T6 120.94 8.50 166.27 118.90 6.41 153.09 85.18 8.77 131.95 115.36 8.28 159.52 152.71
Jamalpur
T1 102.00 - 102.00 96.61 - 96.61 124.44 - 124.44 130.21 - 130.21 113.32
T2 112.80 - 112.80 95.15 - 95.15 136.66 - 136.66 139.11 - 139.11 120.93
T3 110.50 - 110.50 98.21 - 98.21 139.31 - 139.31 128.96 - 128.96 119.25
T4 106.30 5.05 133.33 103.12 5.78 133.95 147.36 7.91 189.55 152.29 7.88 194.32 162.79
T5 114.90 5.26 142.95 103.44 6.16 136.29 133.33 9.13 182.02 138.07 9.63 189.43 162.67
T6 110.60 6.19 143.61 101.95 6.38 135.98 137.36 9.55 188.29 145.31 10.56 201.63 167.33
Table-3 Cost and return analysis of different fertilizer management options
for sugarcane and potato intercropping systems (four years
average)
Treatment Cane
equivalent
yield
(t ha-1
)
Gross
Return
(Tk. ha-1
)
Total variable cost
(Cane + Potato
intercrop)
(Tk. ha-1
)
Gross
Margin
(Tk. ha-1
)
BCR
Ishurdi
T1 95.56 107505 29156 78349 3.69
T2 101.05 113681 31036 82645 3.66
T3 107.57 121016 31322 89694 3.86
T4 138.35 156644 46030 110614 3.40
T5 151.89 170876 48576 122300 3.52
T6 152.71 171799 49376 122423 3.48
Jamalpur
T1 113.32 127485 29,660 97825 4.30
T2 120.93 136046 31,208 104838 4.36
T3 119.25 134156 30,732 103424 4.37
T4 162.79 183139 46,851 136288 3.91
T5 162.67 183004 48,208 134796 3.80
T6 167.33 188246 49,308 138938 3.82
Price (Tk. / kg): Input: Urea = 6.50, TSP =14.00, MP =9.50, Gypsum =4.00, Zinc
sulphate = 60.00, MgO = 40.00, Potato = 11.00, Dhaincha=20.00, Labor = Tk 70
person1day
-1 Output: Sugarcane =1.125, Potato = 6.00

30
Table-4a Status of initial and post harvest soil as affected by different
fertilizer management options for sugarcane and intercrop
(potato) at Ishurdi
Cropping
season
Treatments pH Organic
matter
(%)
Total N
%
Available
P (ppm)
Available K
(meq 100-1
g
soil)
Available S
(ppm)
2000-
2001
Initial soil
7.8 1.30 0.06 23.0 0.19 12.0
Post harvest soil
7.5 1.28 0.065 21.0 0.17 15.0
7.6 1.29 0.07 21.5 0.18 16.0
7.5 1.28 0.07 21.0 0.18 16.5
7.7 1.31 0.075 22.0 0.20 16.5
7.7 1.29 0.07 22.5 0.18 17.0
7.5 1.30 0.07 21.0 0.19 17.0
2001-
2002
Initial soil
7.3 1.68 0.07 20.0 0.20 30.0
Post harvest soil
T1 7.5 1.45 0.065 21.0 0.19 28.0
T2 7.6 1.50 0.06 19.0 0.20 27.0
T3 7.5 1.43 0.07 19.5 0.18 28.0
T4 7.4 1.53 0.065 18.5 0.18 30.0
T5 7.4 1.50 0.065 19.0 0.419 29.0
T6 7.5 1.55 0.07 18.0 0.18 18.0
2002-
2003
Initial soil
7.7 0.96 0.070 21 0.17 17.0
Post harvest soil
T1 7.5 0.91 0.070 20 0.17 14.0
T2 7.6 0.85 0.070 20 0.18 14.0
T3 7.5 0.91 0.074 21 0.17 15.0
T4 7.7 0.85 0.074 23 0.18 16.5
T5 7.8 0.91 0.078 23 0.18 16.5
T6 7.7 0.97 0.078 21 0.18 14.0
2003-
2004
Initial soil
7.5 1.01 0.07 20.0 0.18 15.0
Post harvest soil
T1 7.5 0.91 0.06 19.0 0.18 16.0
T2 7.6 0.93 0.07 19.5 0.19 17.0
T3 7.5 0.98 0.07 19.0 0.18 17.0
T4 7.6 1.05 0.08 20.0 0.20 16.5
T5 7.6 1.01 0.08 21.0 0.19 17.0
T6 7.5 1.00 0.08 20.0 0.20 17.0

31
Table-4b Status of initial and post harvest soil as affected by different
fertilizer management options for sugarcane and intercrop
(potato) at Jamalpur
Cropping
season
Treatments pH Organic
matter
(%)
Total N
%
Availabl
e P
(ppm)
Available
K (meq 100-
1 g soil)
Available
S (ppm)
2000-
2001
Initial soil
5.5 0.78 0.07 24.0 0.17 25.0
Post harvest soil
T1 5.6 0.80 0.06 20.0 0.16 26.0
T2 5.6 0.82 0.065 21.0 0.17 26.0
T3 5.6 0.81 0.065 21.0 0.17 25.0
T4 5.7 0.82 0.07 21.5 0.19 27.0
T5 5.5 0.85 0.07 22.0 0.18 26.0
T6 5.5 0.84 0.075 22.0 0.18 26.0
2001-
2002
Initial soil
5.5 0.78 0.07 24.0 0.17 25.0
Post harvest soil
T1 5.6 0.80 0.06 22.0 0.18 22.0
T2 5.5 0.75 0.06 23.0 0.09 23.0
T3 5.7 0.76 0.065 21.0 0.17 22.0
T4 5.6 0.75 0.07 22.0 0.18 24.0
T5 5.5 0.78 0.065 23.0 0.17 23.0
T6 5.5 0.80 0.07 22.0 0.18 23.0
2002-
2003
Initial soil
5.5 0.78 0.06 22.0 0.14 18.0
Post harvest soil
T1 5.6 0.78 0.054 18.0 0.16 16.5
T2 5.6 0.78 0.060 20. 0.17 15.0
T3 5.7 0.71 0.066 20. 0.17 16.5
T4 5.7 0.71 0.072 21.0 0.16 18.0
T5 5.5 0.78 0.066 23.0 0.17 18.0
T6 5.5 0.85 0.073 21.0 0.16 16.5
2003-
2004
Initial soil
5.7 0.82 0.06 21.0 0.15 18.5
Post harvest soil
T1 5.6 0.80 0.07 20.0 0.16 19.0
T2 5.6 0.82 0.07 21.0 0.17 20.0
T3 5.7 0.81 0.06 22.0 0.16 18.0
T4 5.7 0.83 0.06 21.5 0.17 18.5
T5 5.6 0.85 0.07 22.0 0.17 19.0
T6 5.7 0.87 0.07 22.0 0.16 19.0

32
SUGAR INDUSTRY ABSTRACTS
By
M. Awais Qureshi & Dr. Shahid Afghan
AGRICULTURAL ENGINEERING
Sugarcane trash collection at the small farms in Southern India
H. Vincent Paul and M. Krishnamurthi
Proc. Int. Soc. Sugar Cane Technol., Vol. 26, 2007
To extend the operation of a bagasse based co-generation power plant, both the
procurement of supplementary fuels and the extending of the crushing season in the
sugar mill were required. The collection of sugarcane trash for use as supplementary
fuel was taken up at EID Parry sugar mill at Nellikuppam in Tamil Nadu, India on a
trial basis, to determine the viability of this strategy. Trials were done by windrowing
trash in the field and collecting and baling it, initially using small rectangular and
later, round hay balers. Windrowing was initially undertaken manually. However, a
mechanical rake was later used to windrow the trash for trials. Different baler types
were tested to find the factors impacting on baler productivity. Modifications were
undertaken to adapt the balers to suit Indian field conditions, and appropriate field
operating procedures were developed. Manual collection of trash was also introduced
at places near to the mill to increase the supply of trash to the mill. Both the small
rectangular balers and the round baler had similar outputs in the actual field
conditions experienced. The transport efficiency was lower with round bales as they
required specialized loading equipment and longer low bed trailers, which could not
effectively negotiate the narrow rural roads. Rectangular bales were manually loaded
and were simple to handle and transport. While the performance of balers was initially
good, performance declined in the second year primarily due to maintenance and wear
issues. Although the ability to bale trash was established, the throughput of the
equipment must be increased to achieve a viable operation. Apart from small field
size, several other field factors were also identified as obstacles to the baling and
transport of residues. Farm layouts and farming practices needed to be changed to suit
mechanised operations.
Mill-scale supply chain and logistics model integration for improved decision
support
P.Y. Le Gal1, C. N. Bezuidenhout and P.W.L. LYNE
Proc. Int. Soc. Sugar Cane Technol., Vol. 26, 2007
The management of cane procurement and general logistics at a mill scale remains
complex and contains valuable opportunities for improved efficiencies and cost
savings. In the past, several researchers have focused on different logistical and
supply chain issues. This paper reviews these works and attempts to synthesise
valuable modeling contributions towards a more holistic supply chain decision

33
support system. Three previously independent research projects that focused on
modeling supply chain and logistics issues at the Sezela sugar mill in South Africa are
reviewed. Firstly, a simulation logistic model was used to assess the impacts of
logistics on harvest-to-crush delays. Secondly, an optimisation model was used to
quantify the impacts of different management rules on transportation and mill
performance. Thirdly, a weekly supply chain model was used to estimate the
potential benefits of different management strategies on capacities, utilisation and
sugar production. The integration of short time stepped logistical models and larger
time stepped supply chain models are discussed in order to create a suitable decision
support environment that will assist mill scale management to assess the impacts of
their decisions at various levels across the supply chain and over extended periods of
time. An integrated modeling system, therefore, has the ability to assess the logistical
impacts of longer-term supply chain decisions, and vice versa. Integrated systems,
however, pose challenges in finding suitable input data and software interfaces. It is
concluded that an integrated supply chain modelling system, although difficult to
conceptualize and construct, offers real potential benefits to the optimal management
of sugar cane supply chains.
AGRICULTURAL AGRONOMY
Improving cane productivity with dual row planting in Mauritius
F.M. Ismael, S. Seeruttun, C. Barbe and A. Gaungoo
Proc. Int. Soc. Sugar Cane Technol., Vol. 26, 2007
Dual row planting, consisting of pairs of cane rows 0.5 m apart with 1.8 m between
their centres, was studied in twelve field trials between 1999 and 2004. Dual rows
were compared to the standard row spacing of 1.6 m. Two N fertiliser rates (normal
and + 25%) and two cane sett densities (normal and a reduced amount) were included
as treatments in the early trials whereas the response of sugarcane varieties to the new
spacing was evaluated later. Increases in cane yields with dual row planting varied
between 3% and 28% depending on cane varieties; M 1400/86 and R 579 were the
most responsive with a mean increase varying between 8% and 16%. Yields of plant
and ratoon cane showed that dual rows could be planted with an equivalent amount of
cane setts and using the same rate of fertiliser as for the conventional spacing. No
difference in sucrose content has been observed between the two spacings. Weed
management improved with dual rows; and critical periods of weed competition were
shortened by at least four weeks. Mechanised harvest of dual rows at some of the sites
showed that the pairs of rows can be cut simultaneously without any difficulty; the
efficiency of the machines also improved with less driving distance per hectare, less
turning time and a higher pour rate. Dual row planting is being increasingly adopted
as initial results from commercially planted fields are confirming the gain in
productivity.

34
New herbicide tank-mix, krismat® + dinamic®: a cost-effective broad-spectrum
pre-& post-emergence treatment for managing weeds in sugarcane
S. Seeruttun, C. Barbe and A. Gaungoo
Proc. Int. Soc. Sugar Cane Technol., Vol. 26, 2007
New weed management strategies are being developed to reduce the amount and cost
of herbicides used within the Mauritian sugar industry. One approach consists of
applying herbicides a few weeks after planting or harvest at the beginning of the
critical period of weed competition, with the goal of controlling emerged weeds and
providing long-term residual activity. With these objective, new herbicides Krismat
(trifloxysulfuron + ametryn) and Dinamic (amicarbazone) were tested alone or in
tank-mixes in both plant and ratoon cane. When applied pre-emergence to weeds,
Krismat (1.5.1.8 kg a.i./ha) and Dinamic (1.05 and 1.4 kg a.i./ha) were found to be
comparable to the standards. Krismat was less effective on Digitaria horizontalis and
D. timorensis while Dinamic did not control Cyperus rotundus, Paspalum spp. and
Kyllinga spp.; tank-mixing lower rates of the two herbicides overcame their
weaknesses while maintaining a residual activity over 14 to 16 weeks. With early
post-emergence applications, both Krismat and Dinamic were effective on many
broad-leaved weeds and some grasses. The efficacy of Krismat on Paspalum spp., C.
rotundus and other sedges, and that of Dinamic on Digitaria horizontalis
compensated for their individual inefficacies when they were tank-mixed. The tank-
mix, Krismat + Dinamic (1.5 + 0.875.1.05 kg a.i./ha) did not cause crop injury in
young plant or ratoon cane. The efficacy (pre- and post-emergence) of the new tank-
mix offers a new perspective for managing weeds in sugarcane, as delaying of the
first herbicide application will result in savings of at least one herbicide treatment per
season.
SUGARCANE BREEDING
Utilising genetic dissimilarity for planning of crosses in sugarcane
J. A. Bressiani, M.I. zucchi, J.A.G. Da Silva, C.A. Colombo, R. Vencovsky, M.G.A.
Landell, W.L. Burnquist and E.C. Ulian
Proc. Int. Soc. Sugar Cane Technol., Vol. 26, 2007
One of the most important sugarcane breeding issues is choice of parental genotypes.
Breeders have concentrated efforts in the search of the best method of parental
characterisation, both per se and by analysis of their progeny. They also have
estimated heritabilities, general and specific combining abilities, coefficient of
parentage and, more recently, genetic dissimilarity measures using molecular markers.
In this direction, we evaluated genetic relationships among a group of 45 parents,
taken at random from the available parental genotypes in Camamú, BA, Brazil. We
estimated genetic dissimilarities using the Jaccard similarity index and 206 alleles
obtained from 20 microsatellite loci (SSR). Sixty-four biparental crosses were planted
in a field trial. The families, and the parents of the families, were evaluated for height,
stalk diameter, stalk number, Brix, tonnes of cane, tonnes of Brix, and pithiness in a
three-replicate experiment with 56 seedlings per plot. We calculated plant cane
heterosis and correlations using genetic dissimilarities among the family data. The

35
results suggest that use of SSR genomic molecular markers as an auxiliary tool has
potential for prediction of performance of sugarcane crosses for stalk height, stalk
number, Brix, tonnes of cane, and tonnes of Brix.
Multivariate analysis to characterize cenicaña’s parental collection
H. Rangel, C. Moreno, A. Amaya, C. Viveros and J. Victoria
Proc. Int. Soc. Sugar Cane Technol., Vol. 26, 2007
There are 1174 clones in Cenicaña‟s parental collection which are used to preserve
genetic variability and create new combinations. Each clone is replicated three times
in plots of one row, 5 m long. The objectives of this research were to use statistical
analyses to characterise the collection and to divide the clone population into subsets
or genetic groups. Through the characterisation the genetic variability for 25
quantitative and 4 qualitative variables was determined. Using multivariate statistical
methods such as principal component analysis, canonical discriminant analysis,
cluster analysis and multiple correspondence analysis, six groups of cultivars with
similar characteristics within a group were found. According to the principal
component analysis, the first five components explained 66.5% of the total variability.
The cluster analysis accounted for 76.2% of the variation in the data with six groups.
Two canonical variables related to quality of the soluble solids and initial
development of the crop generated most of the differences between groups.
Population improvement is conducted using such groups to explore combinations for
specific environments according to the agro- ecological zones for the sugarcane crop
in the Cauca Valley, Colombia.
Sugarcane entomology crop losses due to two sugarcane stem borers in reunion
and South Africa
Francois-Regis Goebel and Mickael J. Way
Proc. Int. Soc. Sugar Cane Technol., Vol. 26, 2007
The impact on sugarcane yield of two key stem borer species, Chilo sacchariphagus
and Eldana saccharina, were investigated over a period of 10 years in Réunion Island
and South Africa. Replicated and randomised field plot trials were conducted.
Treatments consisted of pest exclusion using concentrated and repeated chemical
applications, of natural infestations, and of artificial inoculations to enhance these
infestations. The relationship between borer injury (measured as percent bored
internodes) and the corresponding stalk length and diameter, biomass, fibre and sugar
content were determined. Borer injury impaired the growth and reduced quality of
sugarcane stalks. C. sacchariphagus decreased stalk biomass to a greater extent than
sucrose content. E. saccharina injury reduced sucrose content and increased fibre
level, and affected to a lesser extent stalk biomass. Since E. saccharina typically
attacks sugarcane early during the main period of biomass accumulation and C.
sacchariphagus attacks later during the maturation phase, the timing of borer
infestations might explain these results. Numerous components of stalk quality were
negatively correlated to injury from both species. Chilo sacchariphagus impacted
mostly sugarcane biomass while E. saccharina decreased sucrose content. Crop loss

36
models, as well as the formulation of any IPM recommendation, would need to be
specific to the borer species.
Impact of the lesser cornstalk borer, elasmopalpus lignosellus, on sugarcane in
Tucuman, Argentina
A. R. Salvatore, E. M. Acosta, G. Lopez and E. Willink
Proc. Int. Soc. Sugar Cane Technol., Vol. 26, 2007
During the shoot stage, sugarcane in Argentina may be affected by the lesser cornstalk
borer, especially under high temperatures and low rainfall conditions. Larvae bore
into the shoot‟s basal area, producing galleries, and killing the shoot. The objective of
this work was to quantify the percentage of attacked shoots in different crop
conditions and to determine the impact of damage on growth and production of
sugarcane crops. Field observations showed differences in damage and impact
according to the cultural practices. Irrigated crops and those following green-cane
harvesting suffered almost no attack, while those under conventional practices
showed 7–57% of shoots attacked. After attack, stalk weights were reduced by 43%
and pol reduced by 13%, resulting in a loss of sugar yield of 55%. We conclude
irrigation and/or green-cane harvesting provide adequate ways to manage this pest.
MOLECULAR BIOLOGY
Identification and characterisation of sugarcane proteins required for
posttranscriptional gene silencing
J. W. Park, R. Huang and T.E. Mirkov
Proc. Int. Soc. Sugar Cane Technol., Vol. 26, 2007
HC-Pro is a well-known plant viral protein that suppresses RNA silencing in plants.
We confirmed that Sorghum mosaic virus (SrMV) infection in a transgenic sugarcane
line, showing posttranscriptional gene silencing, induced the expression of the
silenced transgene (GUS). Also, the introduction of SrMV P1/HC-Pro into another
transgenic line that is posttranscriptionally silenced for the SrMV coat protein (CP)
resulted in the accumulation of SrMV CP RNA. These data confirmed that SrMV
P1/HC-Pro acts as a suppressor of RNA silencing in sugarcane, one of the most
economically important crops worldwide. In order to investigate cellular
component(s) involved in RNA silencing and its suppression in sugarcane, HC-Pro
was used as bait in a yeast-two-hybrid assay to screen a cDNA expression library
constructed from a transgenic line of the sugarcane hybrid cultivar CP65-357 showing
RNA silencing for the SrMV CP gene. Yeast-two-hybrid screening identified several
cellular proteins as interactors with HC-Pro. One of these proteins is a ca. 22 KDa
protein that preferentially binds to ssRNA. In vitro binding assays such as pull-downs
and far-western assays further confirmed that SrMV HC-Pro interacts with the 22
KDa protein. Yeast-two-hybrid screening of the same cDNA expression library with
the 22 KDa protein identified a ca. 33 KDa protein as an interactor, which shows high
identity with 14-3-3 proteins. The involvement of these and other HC-Pro interacting
sugarcane proteins in RNA silencing and its suppression will be presented.

37
Understanding the concern about gm crops within the Australian population
and among sugarcane growers
L. M. Romanach,, J. Grice, M.K. Wegener1, and S.E. Morris
Proc. Int. Soc. Sugar Cane Technol., Vol. 26, 2007
The adoption of a novel technology, such as gene manipulation, in the improvement
of agricultural crops could contribute significantly to economic development and
reduce environmental pressure in sensitive areas. However, consumers in a number of
countries have expressed various concerns about the introduction of genetically
modified crops into the food chain. In order to establish the level of public
understanding about genetic modification of agricultural plants and assess the degree
of concern about using genetically modified organisms in Australian food production,
a mail survey of a sample of the general population and the cane growing community
in Queensland, Australia, was undertaken. There were 400 completed questionnaires
out of 1000 from the general public and 196 completed questionnaires out of 500
from cane growers. Results were analysed using Intercooled Stata 9 statistical
software and showed that, in general, respondents have a low level of knowledge
about the use of gene technology. The level of approval for the use of gene
technology in agriculture and in food production varied according to the type of
application and the benefits it might generate. Applications that involved non-food
products were more readily accepted than those involving food products.
Canegrowers were also more likely to approve of the technology than respondents
from the general public. However, a large percentage of people remain neutral in
regard to the use of such technology, probably due to their low level of knowledge
about it. As a result, there is a need to inform the public about this technology so they
can make their own decisions about the use of gene technology in
agriculture and in food production.
SUGARCANE PATHOLOGY
Sugarcane leaf yellows phytoplasma in Mauritius: molecular characterisation,
transmission and alternative hosts
N. Joomun, A. Dookun-Saumtally, S. Saumtally and S. Ganeshan
Proc. Int. Soc. Sugar Cane Technol., Vol. 26, 2007
Sugarcane leaf yellows phytoplasma (SCYP), which causes leaf yellows (LY) disease,
is commonly encountered in Mauritius. The objectives of this study were (1) to
identify the vector transmitting the phytoplasma (2) to characterise the phytoplasma
and (3) to identify alternative hosts harbouring the phytoplasma in sugarcane fields.
Screening of nucleic acid extracts from the sugarcane Delphacid planthopper,
Perkinsiella saccharicida by nested polymerase chain reaction (PCR) using universal
primers revealed the presence of a DNA fragment related to phytoplasmas. Molecular
characterisation using restriction enzymes showed that infection in the planthopper
could be due to the presence of more than one phytoplasma. Two PCR products
amplified from P. saccharicida were sequenced and found to belong to two separate
groups, namely the 16SrIII-Western X group and the aster yellows 16SrI group of

38
phytoplasmas. The former group was also observed in sugarcane and was not
previously recorded in this crop in Mauritius. These results indicate the possible
involvement of P.saccharicida as a vector of SCYP. The PCR technique was also
used to diagnose phytoplasmas in graminaceous weeds growing in sugarcane fields.
Fragments related to the Western X group were amplified from Sorghum
verticilliflorum.
Management of sugarcane cultivars imported into Colombia
J.I. Victoria, J.C. Angel, M.L. Guzmán and M. Oicatá
Proc. Int. Soc. Sugar Cane Technol., Vol. 26, 2007
Cenicaña imports sugarcane cultivars through a closed quarantine station (CQS) at
ICA-Mosquera (Cundinamarca) and an open quarantine station (OQS) at
Piedechinche (Cauca Valley). The cane cultivars that arrive at the CQS are sown in
plastic pots and placed in separate cubicles where they are evaluated during two 9.10-
month crop cycles. Plants are examined by several techniques including tissue blot
immunoassay (TBIA), dot blot immunoassay (DBIA), polymerase chain reaction
(PCR) and reverse transcriptase-polymerase chain reaction (RT-PCR) for Sugarcane
yellow leaf virus (SCYLV), Sugarcane mosaic virus (SCMV), Fiji disease virus
(FDV), Sugarcane streak mosaic virus (SCSMV), Xanthomonas albilineans and
Leifsonia xyli subsp. xyli. Plants that have shown no symptoms of diseases are then
transferred to CENICAÑA and sown in small pots in a glasshouse, and then placed in
a growth chamber for thermotherapy followed by in vitro culture of apical meristems
to eliminate microorganisms. This procedure prevents the introduction of plant
pathogens to Colombia. Thereafter, plantlets are transplanted to the OQS, grown for
nine months, and examined for leaf scald disease (LSD), ratoon stunt disease (RSD),
yellow leaf, Fiji disease, streak mosaic and mosaic by the above mentioned
techniques. Over a 26-year period, 1006 sugarcane cultivars from different countries
have been imported, and 20.3% in the CQS and 6.4% in the OQS were eliminated due
to sanitary problems. Thermotherapy and in vitro meristem culture have shown
excellent results, producing disease-free materials of 774 cultivars. Nevertheless
16.2% of the material entering OQS was eliminated due to infection by pathogens or
bad germination. The imported cultivars pass through this system and enter the germ
bank. Agronomical and characterisation trials are conducted to select those that may
be incorporated into the sugarcane breeding and improvement program of Cenicaña.
COPRODUCTS
Simulation and design of a bagasse gasifier
P.A. Hobson and J.A. Joyce
Proc. Int. Soc. Sugar Cane Technol., Vol. 26, 2007
An evaluation of options for the practical implementation of a novel biomass-
reforming concept has been carried out. This concept utilizes the potassium that
occurs naturally in biomass as a catalyst in cracking high molecular weight tars

39
produced during gasification to deliver a high quality syngas. One of the primary
objectives was to develop a process, which yielded a gas with the highest possible
fuel heating value, relative to that of the original bagasse fuel. This ratio is termed
cold gas efficiency (CGE). Initially, a first law of thermodynamics analysis (simple
mass/atomic species and energy balances) was carried out in which the preferred
operating regimes were identified in terms of basic process parameters. Both
deterministic and Monte Carlo analyses were performed using the first law models.
Key findings from this preliminary analysis included: beyond the minimum steam
requirement, maximum cold gas efficiency (CGE) is achieved by avoiding any further
increase in the ratio of steam to dry ash free (d.a.f.) bagasse; the theoretical minimum
steam requirement to fully convert all of the carbon in the bagasse to a gas of
maximum heating value is approximately 13.5 wt% of the fuel (d.a.f. basis); without
chemical recuperation, char/coke yields in excess of 12 wt% on a d.a.f. basis
(characteristic of the process in question) will lead to suppression of the CGE. The
Monte Carlo sensitivity analysis indicated a 90% probability of achieving a CGE of
between 62% and 85% given the range of process parameters considered. Five basic
concepts were evaluated for thermodynamic performance and engineering feasibility.
A preferred hybrid of these concepts was selected and a process model developed. A
second law approach (socalled „Pinch Analysis‟) was then applied to elucidate the
best heat recovery strategies. The optimised model was used to establish key
specifications in terms of bagasse and steam flows, heat transfer areas, pump
capacities and parasitic power requirements for a notional 5 MWth pilot plant. The
predicted performance figures of greater than 80% CGE and 12 MJ/m3 product gas
Lower Heating Value compare favourably with the values targeted at the onset of the
project and represent a major improvement on the performance expected from the
commonly proposed gasification designs.
Activities at sugar research and innovation
P. A. Hobson
Proc. Int. Soc. Sugar Cane Technol., Vol. 26, 2007
Sugar Research and Innovation (SRI) has been involved for some years in developing
aspects of bagasse gasification technology. This has been undertaken with the long-
term aim of implementing advanced cycle, high efficiency power generation in the
sugar industry or the production of a gaseous feedstock for alcohols and other
industrial commodities. Many of the R&D outcomes achieved at SRI in the area of
gasification can be traced back to the formation in 1998 of the Queensland Biomass
Integrated Gasification (QBIG) program. This program was set up to develop
gasification for boosting power generation in the sugar industry. Under the QBIG
program, major research projects were undertaken in the areas of bagasse and cane
trash gasification kinetics, ash characteristics in bagasse gasifiers, the development of
a continuous pressurised bagasse feeder, cane harvest residue recovery systems to
improve gasifier utilisation and economies of scale as well as a financial appraisal of
gasification for power generation. It became evident from this latter study that there
was significant scope for reducing costs via a staged and highly factory integrated
introduction of this technology, and a study was initiated to determine optimum
strategies for the large scale adoption of gasification technology across the industry.
On a more fundamental level, SRI has been collaborating with Hokkaido and Monash

40
universities in a project aimed at utilising the potassium that occurs naturally in
biomass as a catalyst in cracking high molecular weight tars produced during
gasification. This catalysed reforming process occurs at relatively low temperatures
(500°C to 700°C) and has the potential to deliver significant gasifier cost and
efficiency advantages. The role of SRI in this project has been to develop
computational fluid dynamics (CFD) and process models with which to implement
laboratory data in a thermodynamically optimised gasification cycle. This paper
draws together the R&D activities undertaken at SRI to provide a positive picture
with respect to the technical feasibility of implementing gasification technology for
power generation and highlights some of the financial barriers to the large scale
adoption of the technology in Australia.
FACTORY ENGINEERING
Simulation of the dynamic behaviour of a compartment of a continuous pan
D. J. Love
Proc. Int. Soc. Sugar Cane Technol., Vol. 26, 2007
A full grasp of continuous pan performance requires an understanding of the dynamic
behaviour of individual pan compartments. A dynamic mathematical model of a
continuous pan compartment has been developed and structured to be compatible with
the state space format used for control system studies. Using model parameters
obtained by fitting a steady state version of the model to tests on an industrial scale
pan, it is possible to use the dynamic model to simulate dynamic behaviour. The
simulated compartment performance shows complex behaviour, which is difficult to
interpret in terms of a conceptual understanding. A simpler heuristic analysis is able
to explain most of the detailed simulation in terms of three simple components, a
balance between feed and evaporation, the effect of crystal growth and the „washout‟
effect of massecuite flowing into and out of the compartment. The dynamic model is
also useful for investigating the behaviour of automatic control. This is demonstrated
by first simulating a tuning procedure that estimates appropriate tuning parameters for
a feedback controller. Using these parameters in the simulation of the behaviour of
feedback control using a PI controller shows that the physical limitation of a fully
closed feed valve results in a more damped response than the quarter amplitude
damping that would normally be expected.
Options for retrofitting white sugar milling (WSM) technology into existing raw
sugar factories
C. R. C. Jensen and S. M. Kitching
Proc. Int. Soc. Sugar Cane Technol., Vol. 26, 2007
Sugar Mill (WSM) technology produces EEC2 quality white sugar directly from raw
cane juice, thereby eliminating the refining process and its associated costs. In
addition, the WSM process unlocks the value of the sugars currently found in
molasses and produces a liquid fertiliser that is high in nitrogen and potassium. The
technology has been piloted successfully in South Africa and Brazil and, in 2005; the

41
first commercial scale WSM plant was built and commissioned at Felixton Mill in
South Africa. The technology applies membrane filtration, refrigeration, ion-exchange
demineralization and decolourisation to produce a high quality white juice. The WSM
technology can either be applied at a greenfield installation or, as is the case with
Felixton, retrofitted to an existing factory. The WSM technology effectively bridges
the gap between sugarcane milling and raw sugar refining. However, in doing so it
has to make refined quality sugar from a raw material with significantly higher levels
of impurities and of variable composition. Sugar factory designs vary from region to
region depending on the technology employed, cane quality, season length and market
requirements. Similarly, in designing the WSM process for a specific application,
these and other factors need to be taken into account. Furthermore, in contrast to the
seasonal operation of raw sugar mills, refineries generally operate all year round. This
paper presents a generalised WSM flow sheet that allows the back-end of the WSM
factory to be decoupled from the juice front-end, thereby facilitating year round
operations. Thereafter, various options for incorporating the generalised WSM flow
sheet into an existing sugar mill are discussed. The WSM Slipstream plant at Felixton
is presented as a specific example.