Embed Size (px)
Citation preview
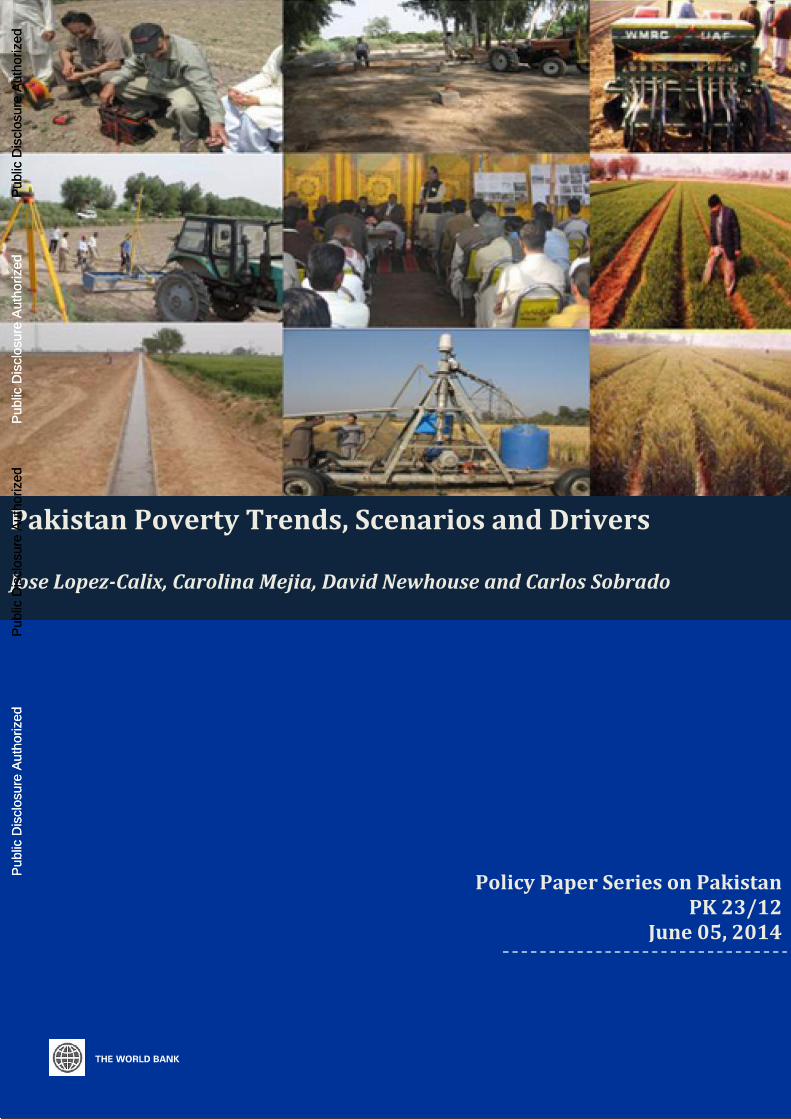
Pakistan Poverty Trends, Scenarios and Drivers
Jose Lopez-Calix, Carolina Mejia, David Newhouse and Carlos Sobrado
Policy Paper Series on PakistanPK 23/12
June 05, 2014
Pub
lic D
iscl
osur
e A
utho
rized
Pub
lic D
iscl
osur
e A
utho
rized
Pub
lic D
iscl
osur
e A
utho
rized
Pub
lic D
iscl
osur
e A
utho
rized
Pub
lic D
iscl
osur
e A
utho
rized
Pub
lic D
iscl
osur
e A
utho
rized
Pub
lic D
iscl
osur
e A
utho
rized
Pub
lic D
iscl
osur
e A
utho
rized
_______________________________________________
This publication is a product of the World Bank. It is part of a larger effort by the WorldBank to provide open access to its research and make a contribution to development policydiscussions in Pakistan and around the world. Working Papers are also posted on the Web athttp://econ.worldbank.org. Themainauthor may becontacted at [email protected].
Abstract
This policy paper examines recent poverty trends in Pakistan. Official statistics continue toindicate strong poverty reduction through 2010-11, thanks in large part to policies andinvestments that boosted productivity in the non-agricultural sector. Poverty fell a bit morethan other countries with similar rates of growth, as growth was slightly pro-poor and alsobenefited the bottom 40 percent. Alternative indicators such as access to public services havealso improved, though at a slower rate since 2008—the year of twin global and domesticcrises that hardly hit Pakistan. While increased productivity among non-agricultural workershas been a key factor driving poverty reduction, cash transfers through the Benazir IncomeSupport Program (BISP) and workers’ remittances from abroad also made moderatecontributions. Simulations suggest that higher growth rates would further accelerate povertyreduction, but would have smaller effects on attaining other Millennium Development Goals.
Despite this progress on poverty reductions, a major concern is that large numbers of peoplestill remain concentrated just above the poverty line, thus remaining vulnerable to evensmall shocks, like natural disasters. Furthermore, the Pakistani economy has failed to createenough salaried and non-agricultural jobs, and female labor force participation remainsunusually low by regional and worldwide standards. BISP cash transfers have helped reducepoverty and are well-targeted, but their coverage still is small; while remittances accruemainly to non-poor households. If Pakistan can address these remaining constraints and alsoachieve more rapid growth, in particular with less frequent load-shedding and high levels ofinvestment in human capital, the labor market has the potential to absorb new workers andfurther accelerate the improvement in living standards for the poor and near-poor.
This Working Paper disseminates the findings of work in progress to encourage the exchangeof ideas about development issues. An objective of the paper is to get the findings outquickly, even if the presentations are less than fully polished. The papers carry the names ofthe authors and should be cited accordingly. The findings, interpretations, and conclusionsexpressed in this paper are entirely those of the authors. They do not necessarily representthe views of the International Bank for Reconstruction and Development/World Bank andits affiliated organizations, or those of the Executive Directors of the World Bank or thegovernments they represent.
Pakistan Poverty Trends, Scenarios and Drivers
Jose Lopez-Calix, Carolina Mejia, David Newhouse and CarlosSobrado
This paper was prepared by Jose Lopez-Calix (SASEP), Carolina Mejia (SASEP), DavidNewhouse (SASEP), and Carlos Sobrado (PREM-PR). We thank Nobuo Yoshida for hiscontribution on Annexure 2, sharing previous PSLM data and providing overall guidance onhow to measure poverty in 2011 comparable to previous estimates; as well as RachidBenmessaoud, Ernesto May, Vinaya Swaroop, Anthony Cholst, and Uzma Basim for theirstrong encouragement and support.
Abbreviations and Acronyms
BISP Benazir Income Support Program
CCT Conditional Cash Transfer
CEM Country Economic Memorandum
CPI Consumer Price Index (CPI)
FY Fiscal Year
GDP Gross Domestic Product
HOI Human Opportunity Index
ILO International Labor Organization
KPK Khyber Pakhtunkhwa
MAMS Maquette for MDG Simulations
MDG Millennium Development Goals
PBS Pakistan Bureau of Statistics
PKR Pakistani Rupee
PPP Purchasing Power Parity
PSLM Pakistan Social and Living Standard Survey
UCT Unconditional Cash Transfer
US United States
WB World Bank
WDI World Development Indicators
Pakistan Poverty Trends, Scenarios and Drivers
1
Table of Contents
Recent Developments in Poverty and Shared Prosperity 3
Provincial Differences 11
Future Scenarios for Poverty Reduction 15
Drivers of Poverty Reduction: Jobs 18
Non-Labor Transfers 21
Conclusion 25
References 26
Annexure 1 – Vulnerability by Province 27
Annexure 2 – Measuring Poverty in Pakistan: General Characteristics and Limitations 28
Annexure 3 – Detailed Explanation of the Human Opportunity Index 31
Figures
Figure 1 Pakistan Had Made Great Progress Figure 1 in Reducing Poverty 3
Figure 2 According to the National Poverty Rate, progress has continued since 2002 4
Figure 3 Poverty Reduction of Countries with Similar Growth Rates 5
Figure 4 Average Change in Head Count Poverty Rate 5
Figure 5 A Large Share of Households are Clustered Near the Poverty line 6
Figure 6 A Large Share of the Population Remains Vulnerable 7
Figure 7 Growth Is Leading to Shared Prosperity 7
Figure 8 Shared Prosperity in Pakistan Compares Favorably with its Neighbors 8
Figure 9 Inequality has fallen in Pakistan since 2006 & is low by Regional Standards 8
Figure 10 Progress on Human Development Indicators Has Slowed 9
Figure 11 Trends in Head Count Poverty Rates by Province 11
Figure 12 Trends in Vulnerability by Province 12
Figure 13 Headcount Poverty Rates by Province and Urban/Rural Location in 2011 12
Figure 14 Trends in Inequality by Province 13
Figure 15 Rates of Electricity Access and Homeownership in 2011, by poverty status 14
Figure 16 Rates of Access to Toilets and Piped Water in 2011, by poverty status 14
Figure 17 Projected Poverty Rates under Two Growth Scenarios 16
Figure 18 Projected Vulnerability Rates under Two Growth Scenarios 16
Figure 19 MDG Projections, Pakistan, 2012-2018 17
Figure 20 Increased Returns to Non-farm Employment Non-labor Income 18
Figure 21 The Share of Workers in Salaried Jobs Declined 18
Figure 22 Link Between Agricultural Employment and Poverty 19
Figure 23 Labor Force Participation Rates by Gender 19
Figure 24 Female Labor Force Participation Rate 20
Figure 25 Coverage of Transfers in 2010, per capita consumption quintile & province 23
Figure 26 Simulated Effects of BISP on Headcount Poverty 24
Pakistan Poverty Trends, Scenarios and Drivers
2
Figure 27 Share of HHs near the poverty line, Pakistan 2002-2011, by province 27
Figure 28 Poverty Rates for Original & Adjusted Food Prices, Punjab, Urban & Rural,
Pakistan30
Tables
Table 1 Poverty Headcount Rates and 95% Confidence Intervals, Pakistan 4
Table 2 Average Consumption Growth Rates Projections in Pakistan 2011-2018 15
Table 3 Impact of Reported Cash Transfers: Remittances, National andZakat/Usher in Pakistan, 2010
22
Pakistan Poverty Trends, Scenarios and Drivers
3
Recent Developments in Poverty and Shared Prosperity
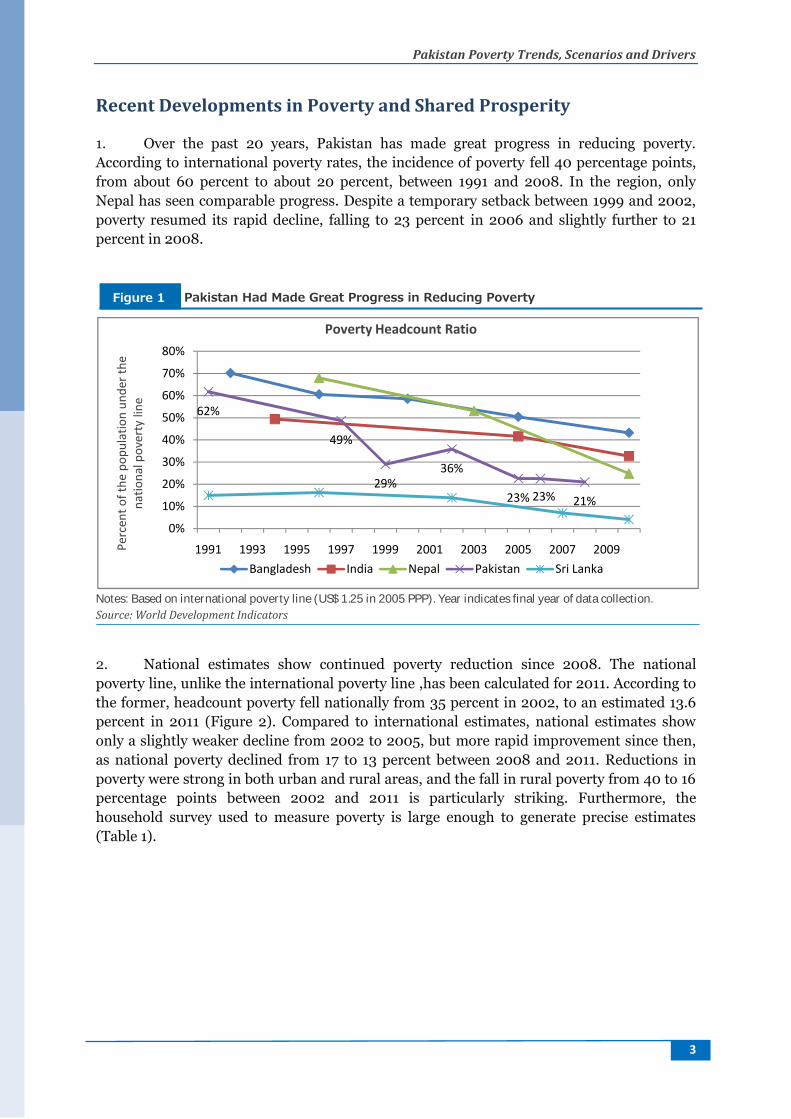
1. Over the past 20 years, Pakistan has made great progress in reducing poverty.According to international poverty rates, the incidence of poverty fell 40 percentage points,from about 60 percent to about 20 percent, between 1991 and 2008. In the region, onlyNepal has seen comparable progress. Despite a temporary setback between 1999 and 2002,poverty resumed its rapid decline, falling to 23 percent in 2006 and slightly further to 21percent in 2008.
Notes: Based on international poverty line (US$ 1.25 in 2005 PPP). Year indicates final year of data collection.Source: World Development Indicators
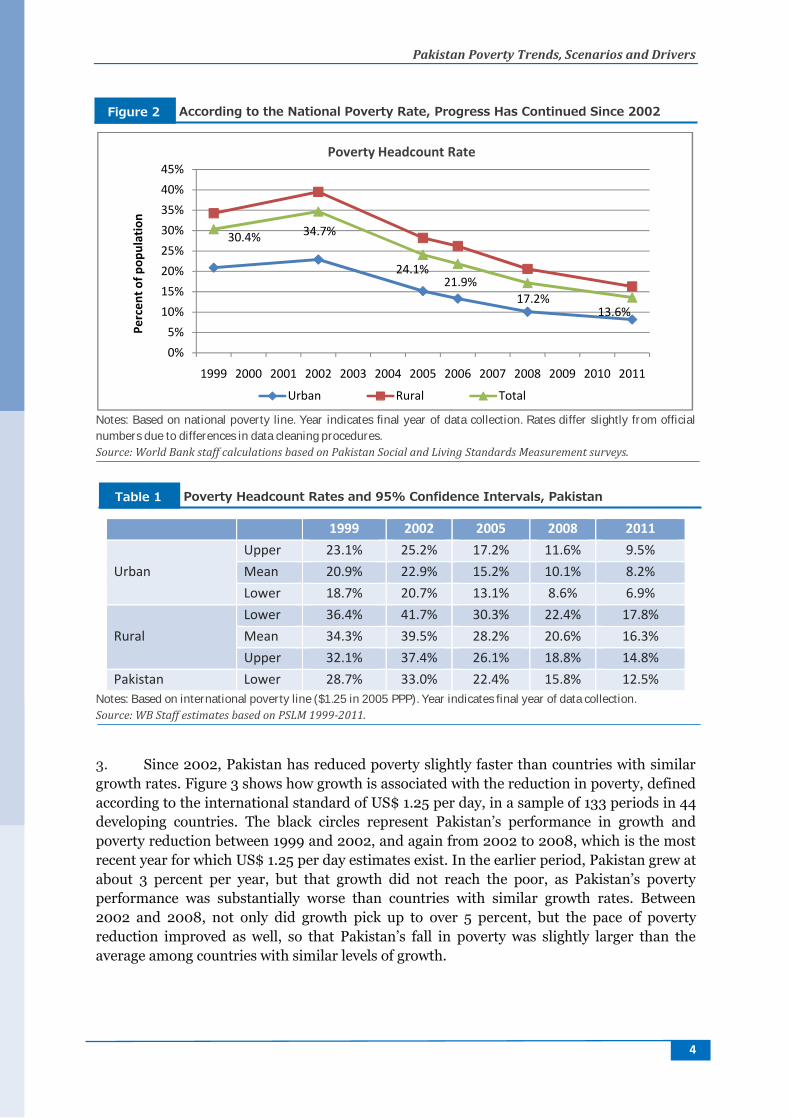
2. National estimates show continued poverty reduction since 2008. The nationalpoverty line, unlike the international poverty line ,has been calculated for 2011. According tothe former, headcount poverty fell nationally from 35 percent in 2002, to an estimated 13.6percent in 2011 (Figure 2). Compared to international estimates, national estimates showonly a slightly weaker decline from 2002 to 2005, but more rapid improvement since then,as national poverty declined from 17 to 13 percent between 2008 and 2011. Reductions inpoverty were strong in both urban and rural areas, and the fall in rural poverty from 40 to 16percentage points between 2002 and 2011 is particularly striking. Furthermore, thehousehold survey used to measure poverty is large enough to generate precise estimates(Table 1).
62%
49%
29%36%
23% 23% 21%
0%
10%
20%
30%
40%
50%
60%
70%
80%
1991 1993 1995 1997 1999 2001 2003 2005 2007 2009Perc
ent o
f the
pop
ulat
ion
unde
r the
natio
nal p
over
ty li
ne
Poverty Headcount Ratio
Bangladesh India Nepal Pakistan Sri Lanka
Pakistan Had Made Great Progress in Reducing PovertyFigure 1
Pakistan Poverty Trends, Scenarios and Drivers
4
Notes: Based on national poverty line. Year indicates final year of data collection. Rates differ slightly from officialnumbers due to differences in data cleaning procedures.Source: World Bank staff calculations based on Pakistan Social and Living Standards Measurement surveys.
1999 2002 2005 2008 2011
UrbanUpper 23.1% 25.2% 17.2% 11.6% 9.5%Mean 20.9% 22.9% 15.2% 10.1% 8.2%Lower 18.7% 20.7% 13.1% 8.6% 6.9%
RuralLower 36.4% 41.7% 30.3% 22.4% 17.8%Mean 34.3% 39.5% 28.2% 20.6% 16.3%Upper 32.1% 37.4% 26.1% 18.8% 14.8%
Pakistan Lower 28.7% 33.0% 22.4% 15.8% 12.5%Notes: Based on international poverty line ($1.25 in 2005 PPP). Year indicates final year of data collection.Source: WB Staff estimates based on PSLM 1999-2011.
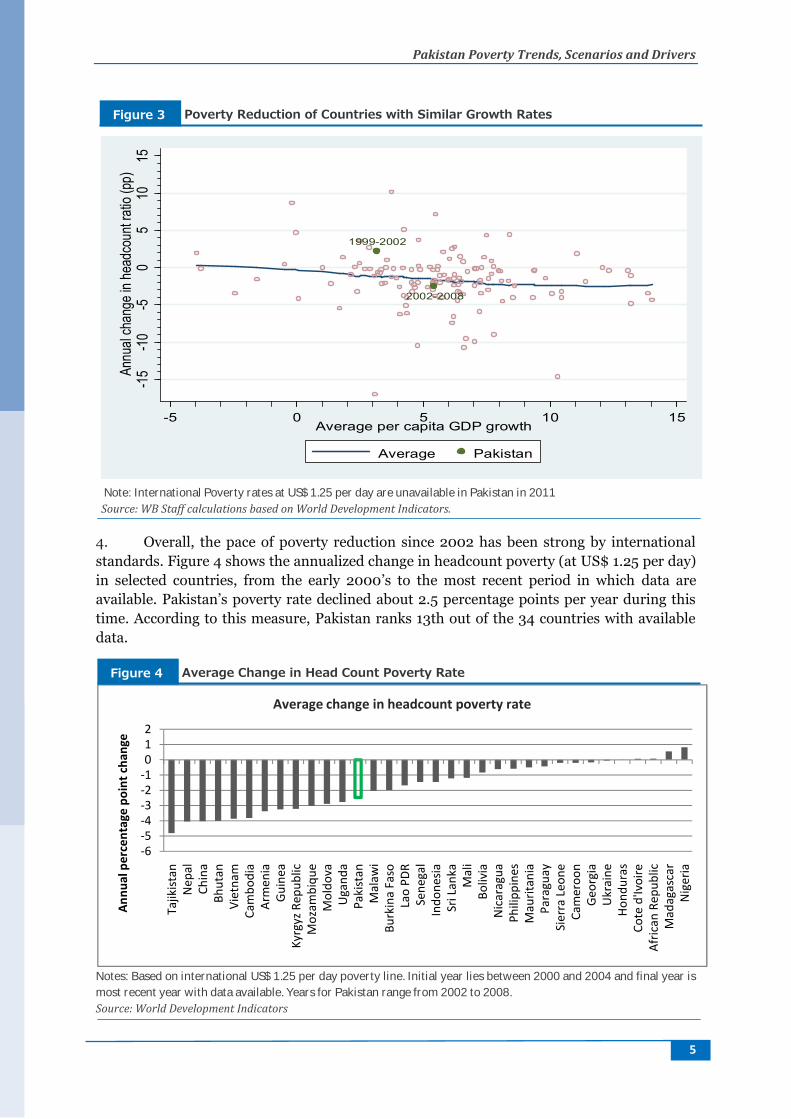
3. Since 2002, Pakistan has reduced poverty slightly faster than countries with similargrowth rates. Figure 3 shows how growth is associated with the reduction in poverty, definedaccording to the international standard of US$ 1.25 per day, in a sample of 133 periods in 44developing countries. The black circles represent Pakistan’s performance in growth andpoverty reduction between 1999 and 2002, and again from 2002 to 2008, which is the mostrecent year for which US$ 1.25 per day estimates exist. In the earlier period, Pakistan grew atabout 3 percent per year, but that growth did not reach the poor, as Pakistan’s povertyperformance was substantially worse than countries with similar growth rates. Between2002 and 2008, not only did growth pick up to over 5 percent, but the pace of povertyreduction improved as well, so that Pakistan’s fall in poverty was slightly larger than theaverage among countries with similar levels of growth.
30.4% 34.7%
24.1%21.9%
17.2%13.6%
0%5%
10%15%20%25%30%35%40%45%
1999 2000 2001 2002 2003 2004 2005 2006 2007 2008 2009 2010 2011
Perc
ent o
f pop
ulat
ion
Poverty Headcount Rate
Urban Rural Total
According to the National Poverty Rate, Progress Has Continued Since 2002Figure 2
Poverty Headcount Rates and 95% Confidence Intervals, PakistanTable 1
Pakistan Poverty Trends, Scenarios and Drivers
5
Note: International Poverty rates at US$ 1.25 per day are unavailable in Pakistan in 2011Source: WB Staff calculations based on World Development Indicators.
4. Overall, the pace of poverty reduction since 2002 has been strong by internationalstandards. Figure 4 shows the annualized change in headcount poverty (at US$ 1.25 per day)in selected countries, from the early 2000’s to the most recent period in which data areavailable. Pakistan’s poverty rate declined about 2.5 percentage points per year during thistime. According to this measure, Pakistan ranks 13th out of the 34 countries with availabledata.
Notes: Based on international US$ 1.25 per day poverty line. Initial year lies between 2000 and 2004 and final year ismost recent year with data available. Years for Pakistan range from 2002 to 2008.Source: World Development Indicators
1999-2002
2002-2008
-15
-10
-50
510
15An
nual
chan
ge in
head
coun
t rati
o (pp
)
-5 0 5 10 15Average per capita GDP growth
Average Pakistan
-6-5-4-3-2-1012
Tajik
istan
Nep
alCh
ina
Bhut
anVi
etna
mCa
mbo
dia
Arm
enia
Guin
eaKy
rgyz
Rep
ublic
Moz
ambi
que
Mol
dova
Uga
nda
Paki
stan
Mal
awi
Burk
ina
Faso
Lao
PDR
Sene
gal
Indo
nesia
Sri L
anka
Mal
iBo
livia
Nic
arag
uaPh
ilipp
ines
Mau
ritan
iaPa
ragu
aySi
erra
Leo
neCa
mer
oon
Geor
gia
Ukr
aine
Hond
uras
Cote
d'Iv
oire
Afric
an R
epub
licM
adag
asca
rN
iger
ia
Annu
al p
erce
ntag
e po
int c
hang
e
Average change in headcount poverty rate
Poverty Reduction of Countries with Similar Growth RatesFigure 3
Average Change in Head Count Poverty RateFigure 4
Pakistan Poverty Trends, Scenarios and Drivers
6
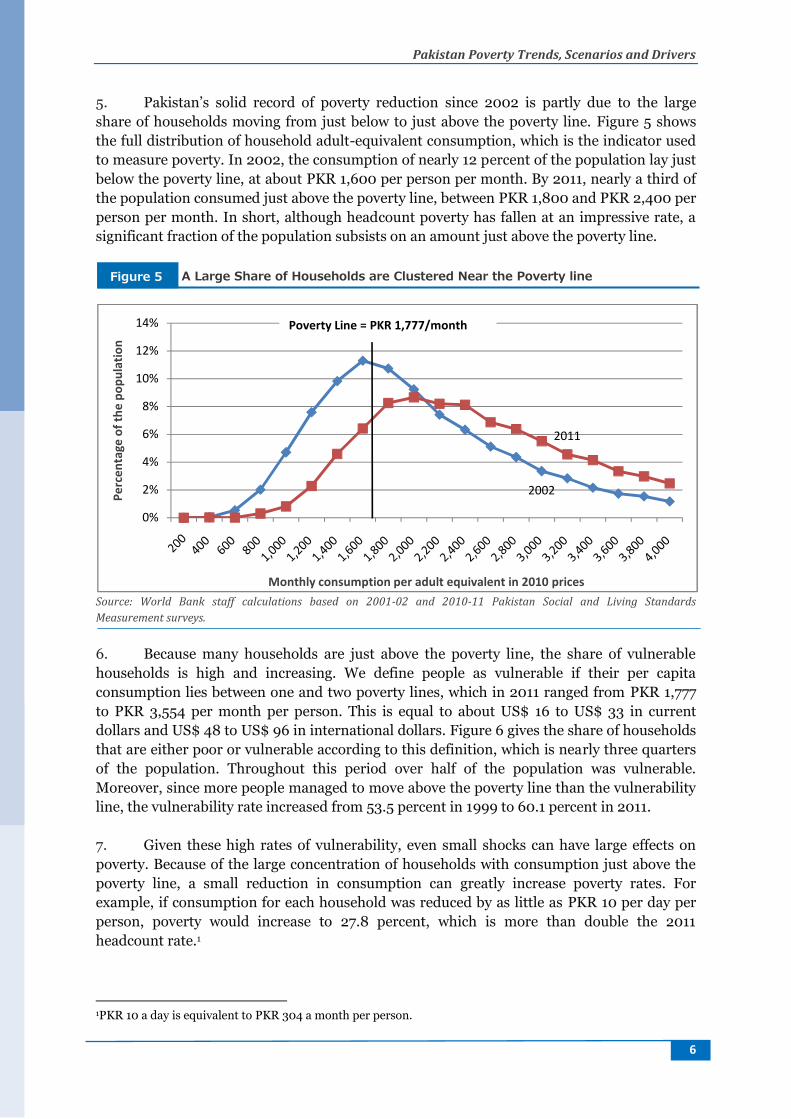
5. Pakistan’s solid record of poverty reduction since 2002 is partly due to the largeshare of households moving from just below to just above the poverty line. Figure 5 showsthe full distribution of household adult-equivalent consumption, which is the indicator usedto measure poverty. In 2002, the consumption of nearly 12 percent of the population lay justbelow the poverty line, at about PKR 1,600 per person per month. By 2011, nearly a third ofthe population consumed just above the poverty line, between PKR 1,800 and PKR 2,400 perperson per month. In short, although headcount poverty has fallen at an impressive rate, asignificant fraction of the population subsists on an amount just above the poverty line.
Source: World Bank staff calculations based on 2001-02 and 2010-11 Pakistan Social and Living StandardsMeasurement surveys.
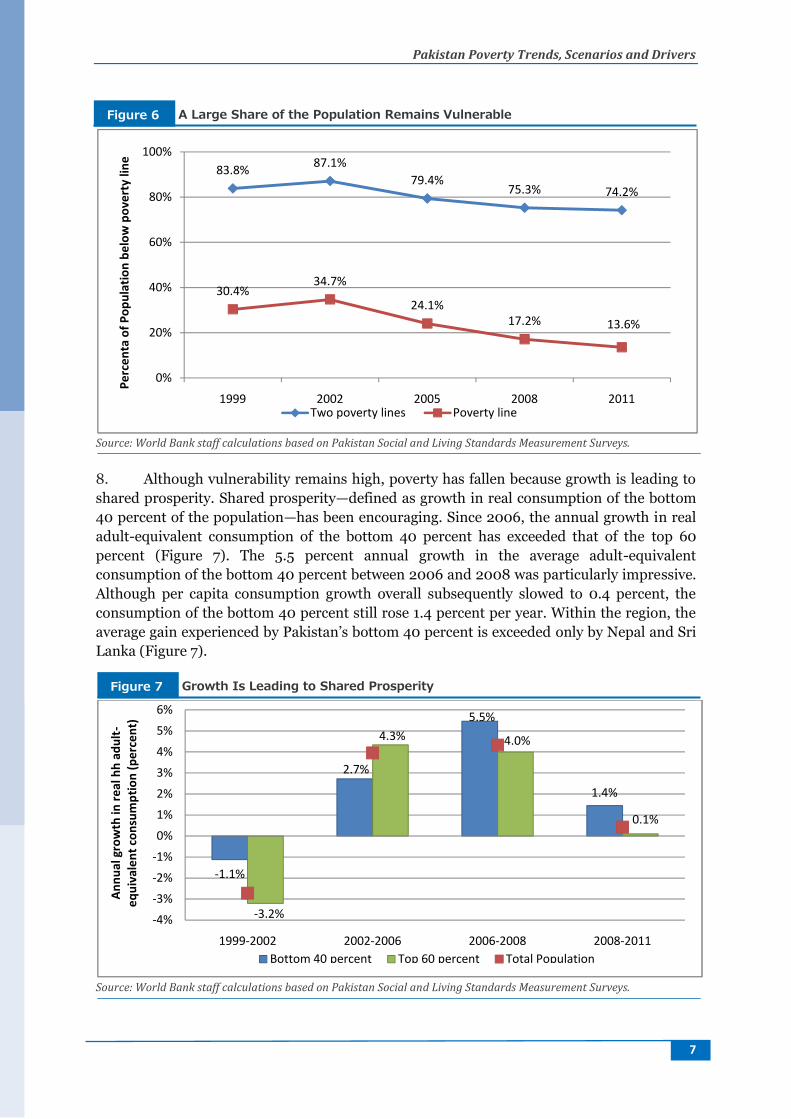
6. Because many households are just above the poverty line, the share of vulnerablehouseholds is high and increasing. We define people as vulnerable if their per capitaconsumption lies between one and two poverty lines, which in 2011 ranged from PKR 1,777to PKR 3,554 per month per person. This is equal to about US$ 16 to US$ 33 in currentdollars and US$ 48 to US$ 96 in international dollars. Figure 6 gives the share of householdsthat are either poor or vulnerable according to this definition, which is nearly three quartersof the population. Throughout this period over half of the population was vulnerable.Moreover, since more people managed to move above the poverty line than the vulnerabilityline, the vulnerability rate increased from 53.5 percent in 1999 to 60.1 percent in 2011.
7. Given these high rates of vulnerability, even small shocks can have large effects onpoverty. Because of the large concentration of households with consumption just above thepoverty line, a small reduction in consumption can greatly increase poverty rates. Forexample, if consumption for each household was reduced by as little as PKR 10 per day perperson, poverty would increase to 27.8 percent, which is more than double the 2011headcount rate.1
1PKR 10 a day is equivalent to PKR 304 a month per person.
2002
2011
0%
2%
4%
6%
8%
10%
12%
14%
Perc
enta
ge o
f the
pop
ulat
ion
Monthly consumption per adult equivalent in 2010 prices
Poverty Line = PKR 1,777/month
A Large Share of Households are Clustered Near the Poverty lineFigure 5
Pakistan Poverty Trends, Scenarios and Drivers
7
Source: World Bank staff calculations based on Pakistan Social and Living Standards Measurement Surveys.
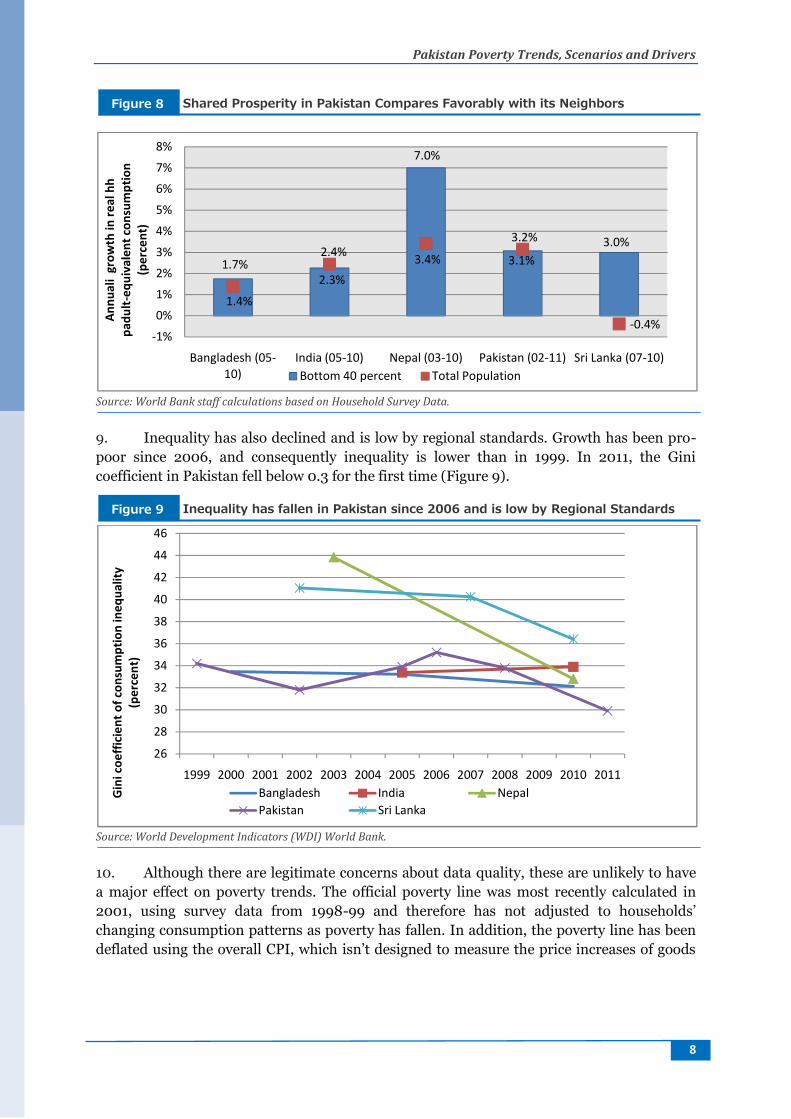
8. Although vulnerability remains high, poverty has fallen because growth is leading toshared prosperity. Shared prosperity—defined as growth in real consumption of the bottom40 percent of the population—has been encouraging. Since 2006, the annual growth in realadult-equivalent consumption of the bottom 40 percent has exceeded that of the top 60percent (Figure 7). The 5.5 percent annual growth in the average adult-equivalentconsumption of the bottom 40 percent between 2006 and 2008 was particularly impressive.Although per capita consumption growth overall subsequently slowed to 0.4 percent, theconsumption of the bottom 40 percent still rose 1.4 percent per year. Within the region, theaverage gain experienced by Pakistan’s bottom 40 percent is exceeded only by Nepal and SriLanka (Figure 7).
Source: World Bank staff calculations based on Pakistan Social and Living Standards Measurement Surveys.
83.8% 87.1%79.4%
75.3% 74.2%
30.4%34.7%
24.1%17.2% 13.6%
0%
20%
40%
60%
80%
100%
1999 2002 2005 2008 2011
Perc
enta
of P
opul
atio
n be
low
pov
erty
line
Two poverty lines Poverty line
-1.1%
2.7%
5.5%
1.4%
-3.2%
4.3% 4.0%
0.1%
-4%-3%-2%-1%0%1%2%3%4%5%6%
1999-2002 2002-2006 2006-2008 2008-2011
Annu
al g
row
th in
real
hh
adul
t-eq
uiva
lent
cons
umpt
ion
(per
cent
)
Bottom 40 percent Top 60 percent Total Population
A Large Share of the Population Remains VulnerableFigure 6
Growth Is Leading to Shared ProsperityFigure 7
Pakistan Poverty Trends, Scenarios and Drivers
8
Source: World Bank staff calculations based on Household Survey Data.
9. Inequality has also declined and is low by regional standards. Growth has been pro-poor since 2006, and consequently inequality is lower than in 1999. In 2011, the Ginicoefficient in Pakistan fell below 0.3 for the first time (Figure 9).
Source: World Development Indicators (WDI) World Bank.
10. Although there are legitimate concerns about data quality, these are unlikely to havea major effect on poverty trends. The official poverty line was most recently calculated in2001, using survey data from 1998-99 and therefore has not adjusted to households’changing consumption patterns as poverty has fallen. In addition, the poverty line has beendeflated using the overall CPI, which isn’t designed to measure the price increases of goods
1.7%2.3%
7.0%
3.1%3.0%
1.4%
2.4% 3.4%
3.2%
-0.4%-1%
0%
1%
2%
3%
4%
5%
6%
7%
8%
Bangladesh (05-10)
India (05-10) Nepal (03-10) Pakistan (02-11) Sri Lanka (07-10)
Annu
ali
grow
th in
real
hh
padu
lt-eq
uiva
lent
cons
umpt
ion
(per
cent
)
Bottom 40 percent Total Population
26
28
30
32
34
36
38
40
42
44
46
1999 2000 2001 2002 2003 2004 2005 2006 2007 2008 2009 2010 2011
Gini
coe
ffici
ent o
f con
sum
ptio
n in
equa
lity
(per
cent
)
Bangladesh India NepalPakistan Sri Lanka
Shared Prosperity in Pakistan Compares Favorably with its NeighborsFigure 8
Inequality has fallen in Pakistan since 2006 and is low by Regional StandardsFigure 9
Pakistan Poverty Trends, Scenarios and Drivers
9
consumed by the poor.2 Finally, data collection in Balochistan and Khyber Pakhtunkhwaprovinces face special challenges, raising questions about the quality of the data, particularlyfrom Balochistan. Annexure 2 describes these issues in greater detail.
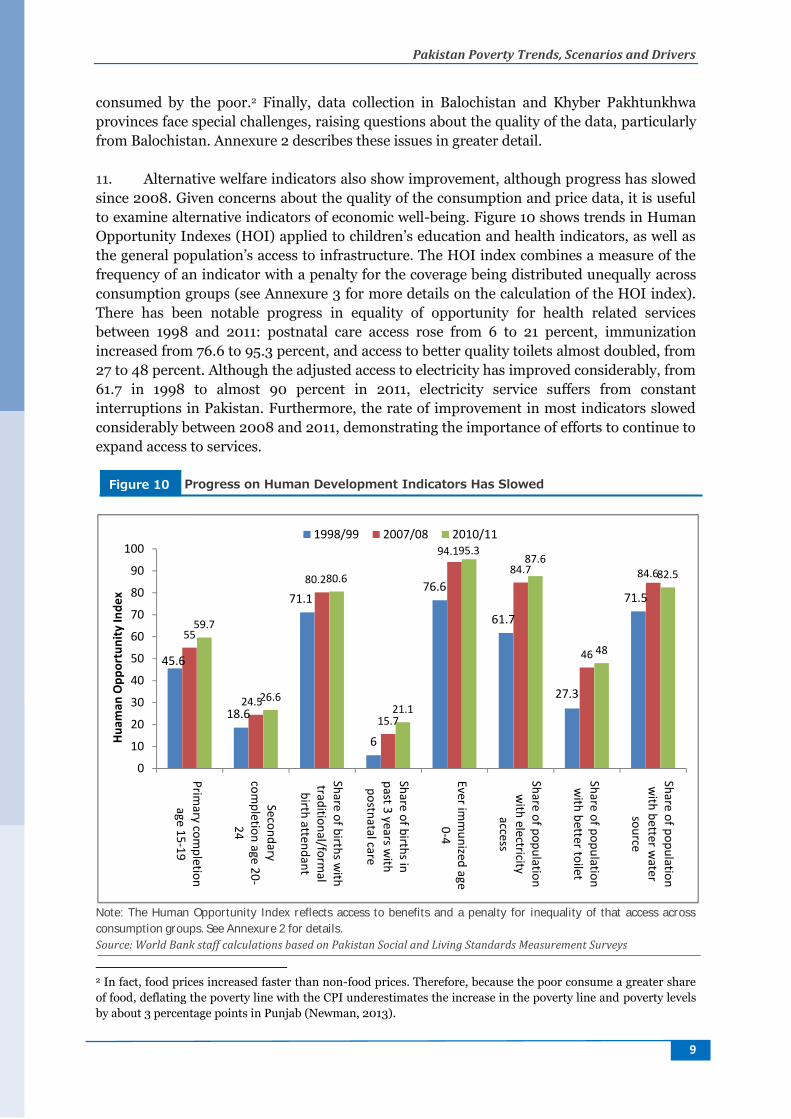
11. Alternative welfare indicators also show improvement, although progress has slowedsince 2008. Given concerns about the quality of the consumption and price data, it is usefulto examine alternative indicators of economic well-being. Figure 10 shows trends in HumanOpportunity Indexes (HOI) applied to children’s education and health indicators, as well asthe general population’s access to infrastructure. The HOI index combines a measure of thefrequency of an indicator with a penalty for the coverage being distributed unequally acrossconsumption groups (see Annexure 3 for more details on the calculation of the HOI index).There has been notable progress in equality of opportunity for health related servicesbetween 1998 and 2011: postnatal care access rose from 6 to 21 percent, immunizationincreased from 76.6 to 95.3 percent, and access to better quality toilets almost doubled, from27 to 48 percent. Although the adjusted access to electricity has improved considerably, from61.7 in 1998 to almost 90 percent in 2011, electricity service suffers from constantinterruptions in Pakistan. Furthermore, the rate of improvement in most indicators slowedconsiderably between 2008 and 2011, demonstrating the importance of efforts to continue toexpand access to services.
Note: The Human Opportunity Index reflects access to benefits and a penalty for inequality of that access acrossconsumption groups. See Annexure 2 for details.Source: World Bank staff calculations based on Pakistan Social and Living Standards Measurement Surveys
2 In fact, food prices increased faster than non-food prices. Therefore, because the poor consume a greater shareof food, deflating the poverty line with the CPI underestimates the increase in the poverty line and poverty levelsby about 3 percentage points in Punjab (Newman, 2013).
45.6
18.6
71.1
6
76.6
61.7
27.3
71.5
55
24.5
80.2
15.7
94.184.7
46
84.6
59.7
26.6
80.6
21.1
95.387.6
48
82.5
0
10
20
30
40
50
60
70
80
90
100
Primary com
pletionage 15-19
Secondarycom
pletion age 20-24
Share of births with
traditional/formal
birth attendant
Share of births inpast 3 years w
ithpostnatal care
Ever imm
unized age0-4
Share of populationw
ith electricityaccess
Share of populationw
ith better toilet
Share of populationw
ith better water
source
Huam
an O
ppor
tuni
ty In
dex
1998/99 2007/08 2010/11
Progress on Human Development Indicators Has SlowedFigure 10
Pakistan Poverty Trends, Scenarios and Drivers
10
12. Equal access to education seems to remain a major challenge in Pakistan, particularlyfor women. Despite an increase in the HOI for both primary and secondary educationcompletion between 1998 and 2011, secondary completion (adjusted for an equitable access)for youngsters aged 20-24 remains low, increasing from 18.6 percent in 1998 to 26.6 percentin 2011. Progress in expanding educational attainment will help further boost productivityand expand opportunities for young people to obtain more productive and stable jobs.
Pakistan Poverty Trends, Scenarios and Drivers
11
Provincial Differences
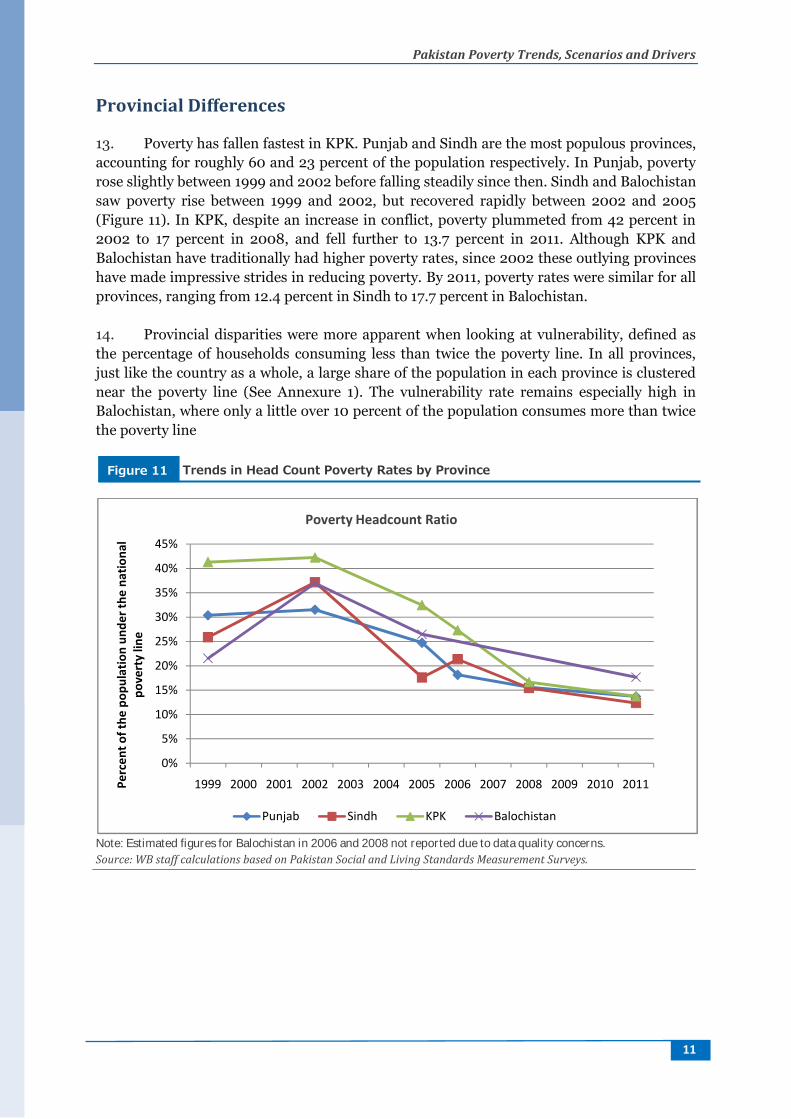
13. Poverty has fallen fastest in KPK. Punjab and Sindh are the most populous provinces,accounting for roughly 60 and 23 percent of the population respectively. In Punjab, povertyrose slightly between 1999 and 2002 before falling steadily since then. Sindh and Balochistansaw poverty rise between 1999 and 2002, but recovered rapidly between 2002 and 2005(Figure 11). In KPK, despite an increase in conflict, poverty plummeted from 42 percent in2002 to 17 percent in 2008, and fell further to 13.7 percent in 2011. Although KPK andBalochistan have traditionally had higher poverty rates, since 2002 these outlying provinceshave made impressive strides in reducing poverty. By 2011, poverty rates were similar for allprovinces, ranging from 12.4 percent in Sindh to 17.7 percent in Balochistan.
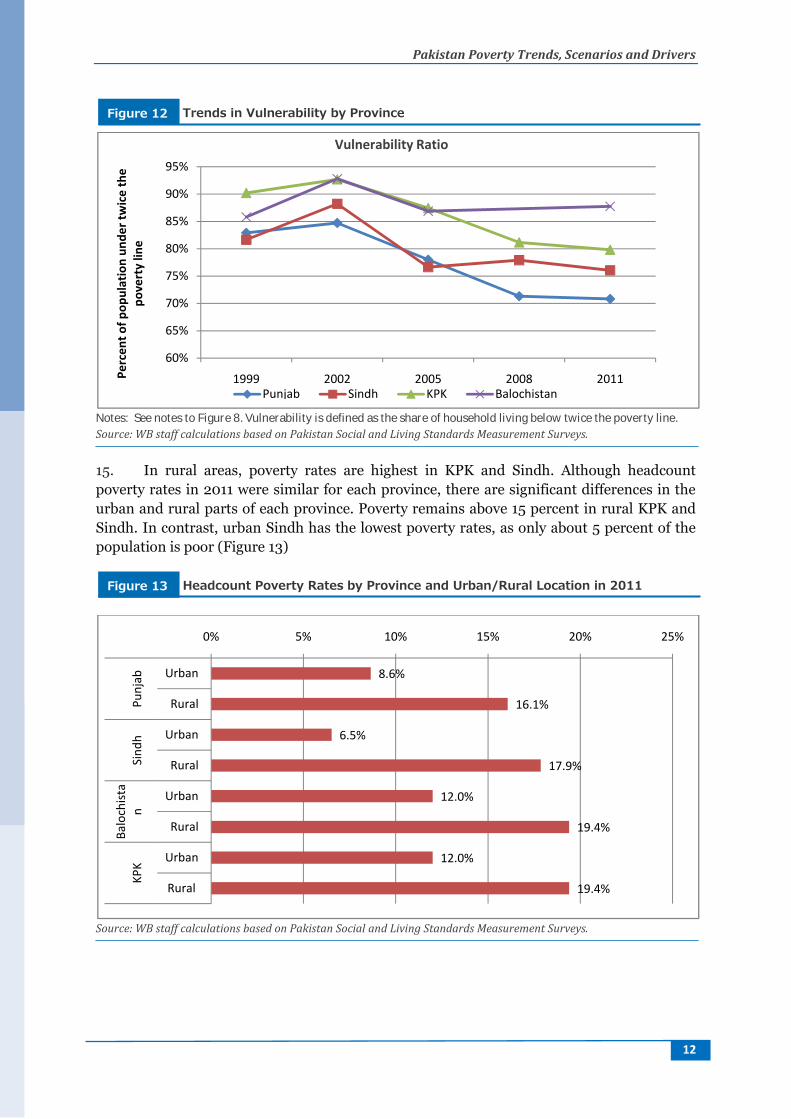
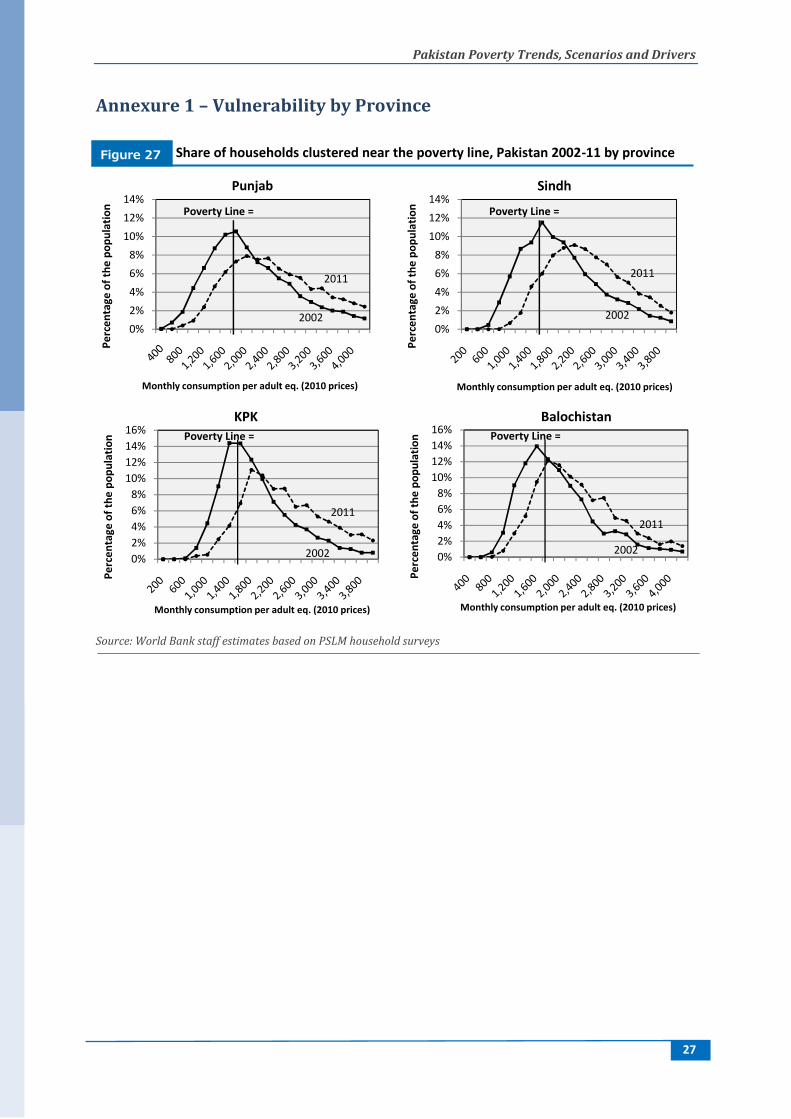
14. Provincial disparities were more apparent when looking at vulnerability, defined asthe percentage of households consuming less than twice the poverty line. In all provinces,just like the country as a whole, a large share of the population in each province is clusterednear the poverty line (See Annexure 1). The vulnerability rate remains especially high inBalochistan, where only a little over 10 percent of the population consumes more than twicethe poverty line
Note: Estimated figures for Balochistan in 2006 and 2008 not reported due to data quality concerns.Source: WB staff calculations based on Pakistan Social and Living Standards Measurement Surveys.
0%
5%
10%
15%
20%
25%
30%
35%
40%
45%
1999 2000 2001 2002 2003 2004 2005 2006 2007 2008 2009 2010 2011Perc
ent o
f the
pop
ulat
ion
unde
r the
nat
iona
lpo
vert
y lin
e
Poverty Headcount Ratio
Punjab Sindh KPK Balochistan
Trends in Head Count Poverty Rates by ProvinceFigure 11
Pakistan Poverty Trends, Scenarios and Drivers
12
Notes: See notes to Figure 8. Vulnerability is defined as the share of household living below twice the poverty line.Source: WB staff calculations based on Pakistan Social and Living Standards Measurement Surveys.
15. In rural areas, poverty rates are highest in KPK and Sindh. Although headcountpoverty rates in 2011 were similar for each province, there are significant differences in theurban and rural parts of each province. Poverty remains above 15 percent in rural KPK andSindh. In contrast, urban Sindh has the lowest poverty rates, as only about 5 percent of thepopulation is poor (Figure 13)
Source: WB staff calculations based on Pakistan Social and Living Standards Measurement Surveys.
60%
65%
70%
75%
80%
85%
90%
95%
1999 2002 2005 2008 2011Perc
ent o
f pop
ulat
ion
unde
r tw
ice
the
pove
rty
line
Vulnerability Ratio
Punjab Sindh KPK Balochistan
8.6%
16.1%
6.5%
17.9%
12.0%
19.4%
12.0%
19.4%
0% 5% 10% 15% 20% 25%
Urban
Rural
Urban
Rural
Urban
Rural
Urban
Rural
Punj
abSi
ndh
Balo
chist
an
KPK
Trends in Vulnerability by ProvinceFigure 12
Headcount Poverty Rates by Province and Urban/Rural Location in 2011Figure 13
Pakistan Poverty Trends, Scenarios and Drivers
13
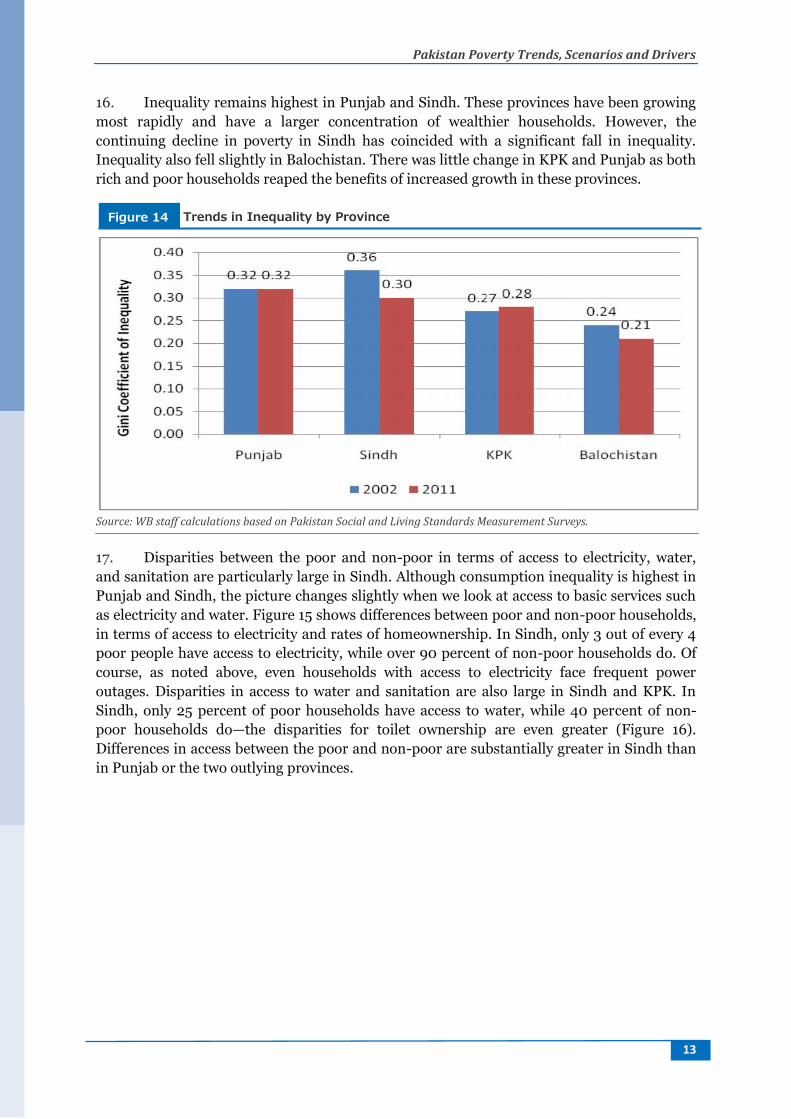
16. Inequality remains highest in Punjab and Sindh. These provinces have been growingmost rapidly and have a larger concentration of wealthier households. However, thecontinuing decline in poverty in Sindh has coincided with a significant fall in inequality.Inequality also fell slightly in Balochistan. There was little change in KPK and Punjab as bothrich and poor households reaped the benefits of increased growth in these provinces.
Source: WB staff calculations based on Pakistan Social and Living Standards Measurement Surveys.
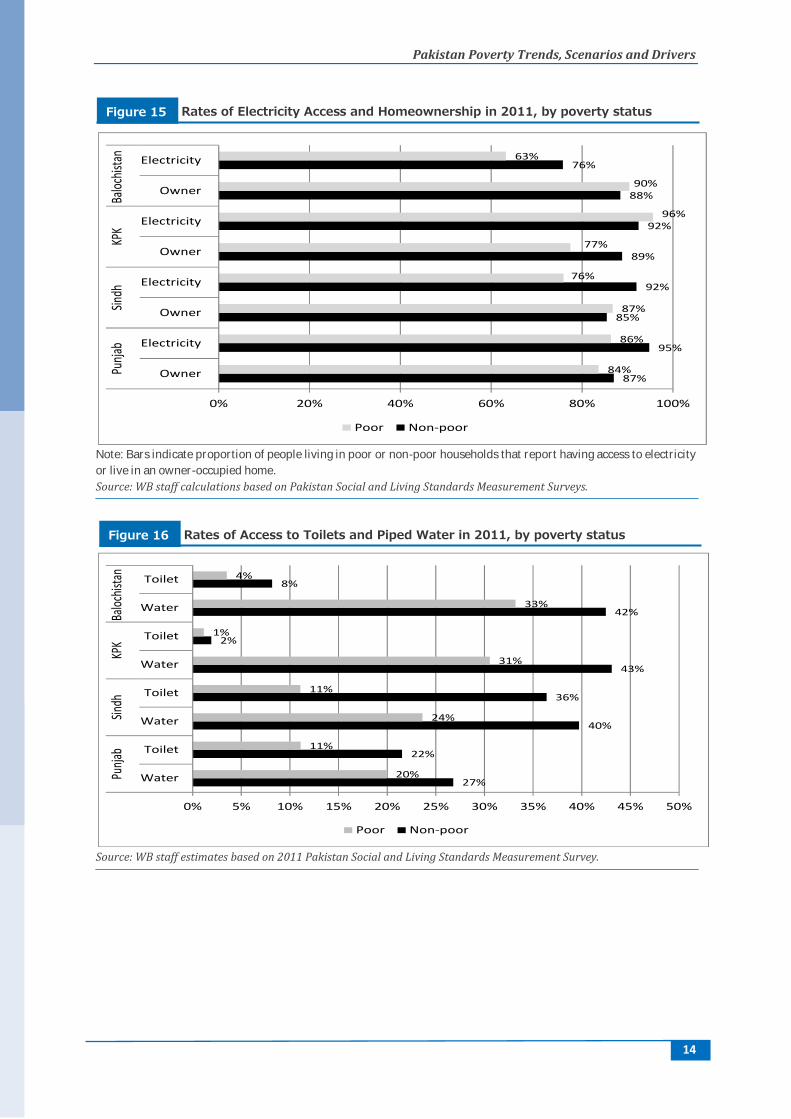
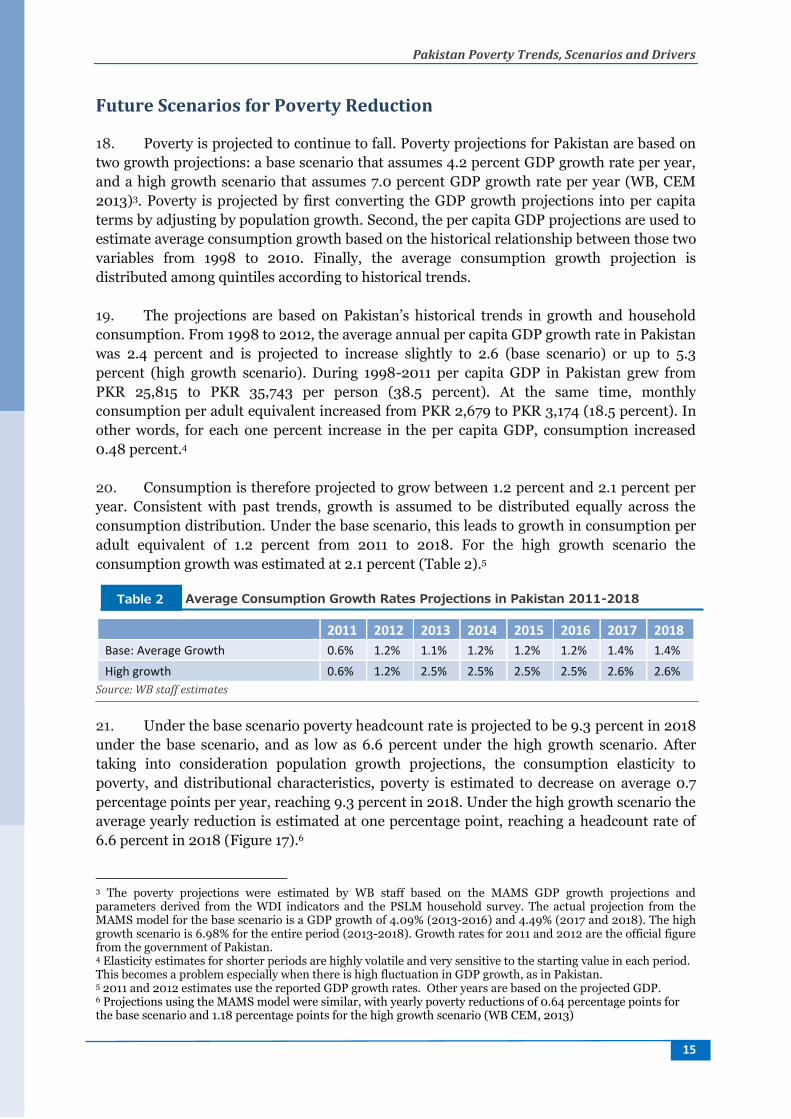
17. Disparities between the poor and non-poor in terms of access to electricity, water,and sanitation are particularly large in Sindh. Although consumption inequality is highest inPunjab and Sindh, the picture changes slightly when we look at access to basic services suchas electricity and water. Figure 15 shows differences between poor and non-poor households,in terms of access to electricity and rates of homeownership. In Sindh, only 3 out of every 4poor people have access to electricity, while over 90 percent of non-poor households do. Ofcourse, as noted above, even households with access to electricity face frequent poweroutages. Disparities in access to water and sanitation are also large in Sindh and KPK. InSindh, only 25 percent of poor households have access to water, while 40 percent of non-poor households do—the disparities for toilet ownership are even greater (Figure 16).Differences in access between the poor and non-poor are substantially greater in Sindh thanin Punjab or the two outlying provinces.
Trends in Inequality by ProvinceFigure 14
Pakistan Poverty Trends, Scenarios and Drivers
13
16. Inequality remains highest in Punjab and Sindh. These provinces have been growingmost rapidly and have a larger concentration of wealthier households. However, thecontinuing decline in poverty in Sindh has coincided with a significant fall in inequality.Inequality also fell slightly in Balochistan. There was little change in KPK and Punjab as bothrich and poor households reaped the benefits of increased growth in these provinces.
Source: WB staff calculations based on Pakistan Social and Living Standards Measurement Surveys.
17. Disparities between the poor and non-poor in terms of access to electricity, water,and sanitation are particularly large in Sindh. Although consumption inequality is highest inPunjab and Sindh, the picture changes slightly when we look at access to basic services suchas electricity and water. Figure 15 shows differences between poor and non-poor households,in terms of access to electricity and rates of homeownership. In Sindh, only 3 out of every 4poor people have access to electricity, while over 90 percent of non-poor households do. Ofcourse, as noted above, even households with access to electricity face frequent poweroutages. Disparities in access to water and sanitation are also large in Sindh and KPK. InSindh, only 25 percent of poor households have access to water, while 40 percent of non-poor households do—the disparities for toilet ownership are even greater (Figure 16).Differences in access between the poor and non-poor are substantially greater in Sindh thanin Punjab or the two outlying provinces.
Trends in Inequality by ProvinceFigure 14
Pakistan Poverty Trends, Scenarios and Drivers
14
Note: Bars indicate proportion of people living in poor or non-poor households that report having access to electricityor live in an owner-occupied home.Source: WB staff calculations based on Pakistan Social and Living Standards Measurement Surveys.
Source: WB staff estimates based on 2011 Pakistan Social and Living Standards Measurement Survey.
87%
95%
85%
92%
89%
92%
88%
76%
84%
86%
87%
76%
77%
96%
90%
63%
0% 20% 40% 60% 80% 100%
Owner
Electricity
Owner
Electricity
Owner
Electricity
Owner
Electricity
Punja
bSin
dhKP
KBa
lochis
tan
Poor Non-poor
27%
22%
40%
36%
43%
2%
42%
8%
20%
11%
24%
11%
31%
1%
33%
4%
0% 5% 10% 15% 20% 25% 30% 35% 40% 45% 50%
Water
Toilet
Water
Toilet
Water
Toilet
Water
Toilet
Punja
bSin
dhKP
KBa
lochis
tan
Poor Non-poor
Rates of Electricity Access and Homeownership in 2011, by poverty statusFigure 15
Rates of Access to Toilets and Piped Water in 2011, by poverty statusFigure 16
Pakistan Poverty Trends, Scenarios and Drivers
15
Future Scenarios for Poverty Reduction
18. Poverty is projected to continue to fall. Poverty projections for Pakistan are based ontwo growth projections: a base scenario that assumes 4.2 percent GDP growth rate per year,and a high growth scenario that assumes 7.0 percent GDP growth rate per year (WB, CEM2013)3. Poverty is projected by first converting the GDP growth projections into per capitaterms by adjusting by population growth. Second, the per capita GDP projections are used toestimate average consumption growth based on the historical relationship between those twovariables from 1998 to 2010. Finally, the average consumption growth projection isdistributed among quintiles according to historical trends.
19. The projections are based on Pakistan’s historical trends in growth and householdconsumption. From 1998 to 2012, the average annual per capita GDP growth rate in Pakistanwas 2.4 percent and is projected to increase slightly to 2.6 (base scenario) or up to 5.3percent (high growth scenario). During 1998-2011 per capita GDP in Pakistan grew fromPKR 25,815 to PKR 35,743 per person (38.5 percent). At the same time, monthlyconsumption per adult equivalent increased from PKR 2,679 to PKR 3,174 (18.5 percent). Inother words, for each one percent increase in the per capita GDP, consumption increased0.48 percent.4
20. Consumption is therefore projected to grow between 1.2 percent and 2.1 percent peryear. Consistent with past trends, growth is assumed to be distributed equally across theconsumption distribution. Under the base scenario, this leads to growth in consumption peradult equivalent of 1.2 percent from 2011 to 2018. For the high growth scenario theconsumption growth was estimated at 2.1 percent (Table 2).5
2011 2012 2013 2014 2015 2016 2017 2018Base: Average Growth 0.6% 1.2% 1.1% 1.2% 1.2% 1.2% 1.4% 1.4%High growth 0.6% 1.2% 2.5% 2.5% 2.5% 2.5% 2.6% 2.6%
Source: WB staff estimates
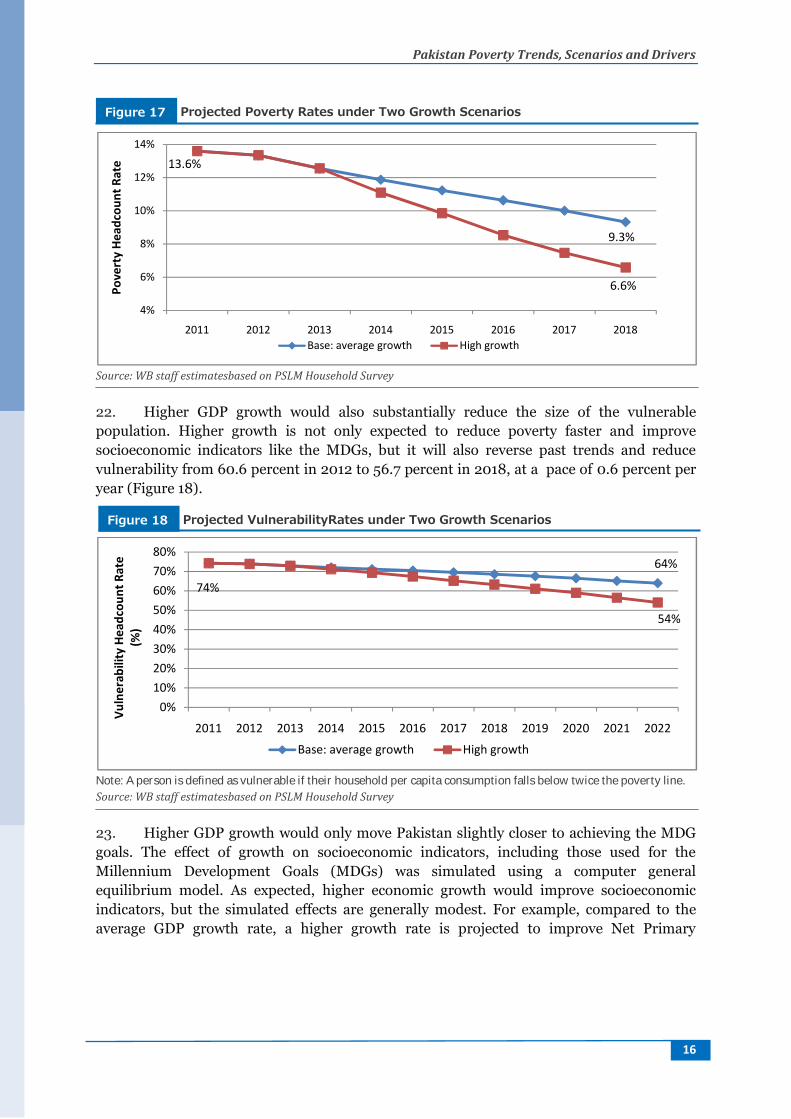
21. Under the base scenario poverty headcount rate is projected to be 9.3 percent in 2018under the base scenario, and as low as 6.6 percent under the high growth scenario. Aftertaking into consideration population growth projections, the consumption elasticity topoverty, and distributional characteristics, poverty is estimated to decrease on average 0.7percentage points per year, reaching 9.3 percent in 2018. Under the high growth scenario theaverage yearly reduction is estimated at one percentage point, reaching a headcount rate of6.6 percent in 2018 (Figure 17).6
3 The poverty projections were estimated by WB staff based on the MAMS GDP growth projections andparameters derived from the WDI indicators and the PSLM household survey. The actual projection from theMAMS model for the base scenario is a GDP growth of 4.09% (2013-2016) and 4.49% (2017 and 2018). The highgrowth scenario is 6.98% for the entire period (2013-2018). Growth rates for 2011 and 2012 are the official figurefrom the government of Pakistan.4 Elasticity estimates for shorter periods are highly volatile and very sensitive to the starting value in each period.This becomes a problem especially when there is high fluctuation in GDP growth, as in Pakistan.5 2011 and 2012 estimates use the reported GDP growth rates. Other years are based on the projected GDP.6 Projections using the MAMS model were similar, with yearly poverty reductions of 0.64 percentage points forthe base scenario and 1.18 percentage points for the high growth scenario (WB CEM, 2013)
Average Consumption Growth Rates Projections in Pakistan 2011-2018Table 2
Pakistan Poverty Trends, Scenarios and Drivers
16
Source: WB staff estimatesbased on PSLM Household Survey
22. Higher GDP growth would also substantially reduce the size of the vulnerablepopulation. Higher growth is not only expected to reduce poverty faster and improvesocioeconomic indicators like the MDGs, but it will also reverse past trends and reducevulnerability from 60.6 percent in 2012 to 56.7 percent in 2018, at a pace of 0.6 percent peryear (Figure 18).
Note: A person is defined as vulnerable if their household per capita consumption falls below twice the poverty line.Source: WB staff estimatesbased on PSLM Household Survey
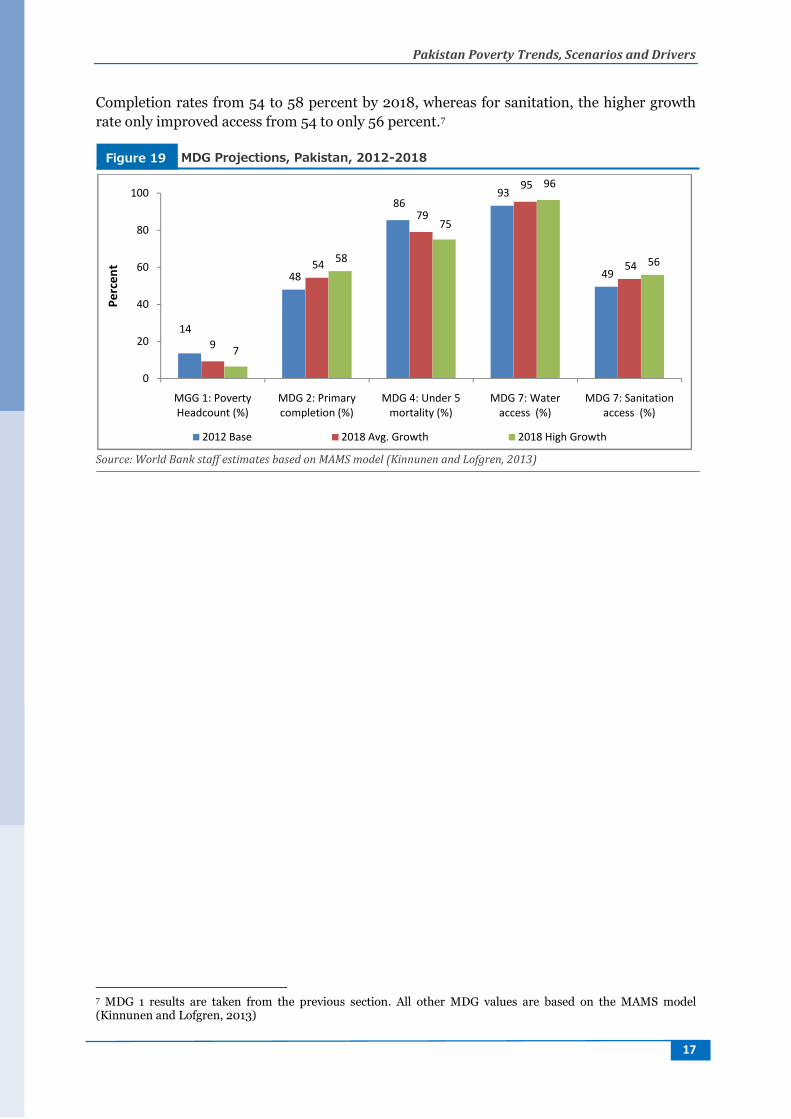
23. Higher GDP growth would only move Pakistan slightly closer to achieving the MDGgoals. The effect of growth on socioeconomic indicators, including those used for theMillennium Development Goals (MDGs) was simulated using a computer generalequilibrium model. As expected, higher economic growth would improve socioeconomicindicators, but the simulated effects are generally modest. For example, compared to theaverage GDP growth rate, a higher growth rate is projected to improve Net Primary
9.3%
13.6%
6.6%
4%
6%
8%
10%
12%
14%
2011 2012 2013 2014 2015 2016 2017 2018
Pove
rty
Head
coun
t Rat
e
Base: average growth High growth
64%
74%
54%
0%10%20%30%40%50%60%70%80%
2011 2012 2013 2014 2015 2016 2017 2018 2019 2020 2021 2022
Vuln
erab
ility
Hea
dcou
nt R
ate
(%)
Base: average growth High growth
Projected Poverty Rates under Two Growth ScenariosFigure 17
Projected VulnerabilityRates under Two Growth ScenariosFigure 18
Pakistan Poverty Trends, Scenarios and Drivers
17
Completion rates from 54 to 58 percent by 2018, whereas for sanitation, the higher growthrate only improved access from 54 to only 56 percent.7
Source: World Bank staff estimates based on MAMS model (Kinnunen and Lofgren, 2013)
7 MDG 1 results are taken from the previous section. All other MDG values are based on the MAMS model(Kinnunen and Lofgren, 2013)
14
48
8693
49
9
54
79
95
54
7
58
75
96
56
0
20
40
60
80
100
MGG 1: PovertyHeadcount (%)
MDG 2: Primarycompletion (%)
MDG 4: Under 5mortality (%)
MDG 7: Wateraccess (%)
MDG 7: Sanitationaccess (%)
Perc
ent
2012 Base 2018 Avg. Growth 2018 High Growth
MDG Projections, Pakistan, 2012-2018Figure 19
Pakistan Poverty Trends, Scenarios and Drivers
18
Drivers of Poverty Reduction: Jobs
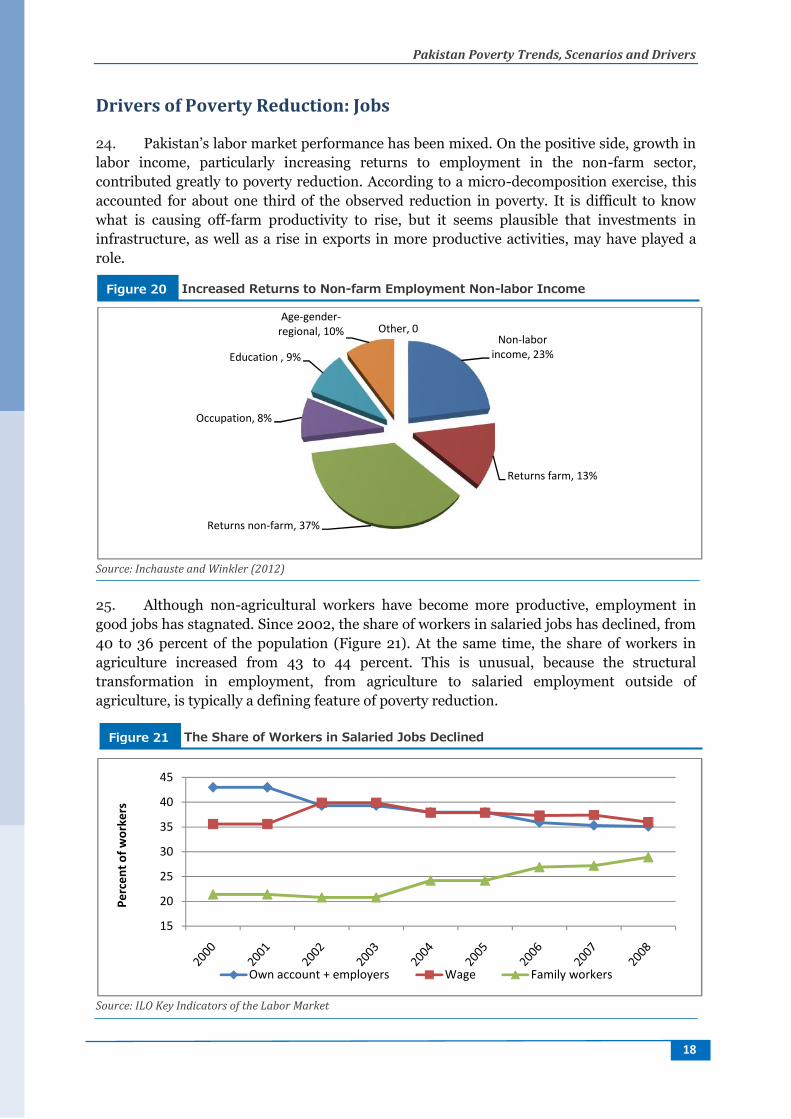
24. Pakistan’s labor market performance has been mixed. On the positive side, growth inlabor income, particularly increasing returns to employment in the non-farm sector,contributed greatly to poverty reduction. According to a micro-decomposition exercise, thisaccounted for about one third of the observed reduction in poverty. It is difficult to knowwhat is causing off-farm productivity to rise, but it seems plausible that investments ininfrastructure, as well as a rise in exports in more productive activities, may have played arole.
Source: Inchauste and Winkler (2012)
25. Although non-agricultural workers have become more productive, employment ingood jobs has stagnated. Since 2002, the share of workers in salaried jobs has declined, from40 to 36 percent of the population (Figure 21). At the same time, the share of workers inagriculture increased from 43 to 44 percent. This is unusual, because the structuraltransformation in employment, from agriculture to salaried employment outside ofagriculture, is typically a defining feature of poverty reduction.
Source: ILO Key Indicators of the Labor Market
Returns non-farm, 37%
Occupation, 8%
Education , 9%
Age-gender-regional, 10%
15
20
25
30
35
40
45
Perc
ent o
f wor
kers
Own account + employers
Increased Returns to Non-farm Employment Non-labor IncomeFigure 20
The Share of Workers in Salaried Jobs DeclinedFigure 21
Pakistan Poverty Trends, Scenarios and Drivers
18
Drivers of Poverty Reduction: Jobs
24. Pakistan’s labor market performance has been mixed. On the positive side, growth inlabor income, particularly increasing returns to employment in the non-farm sector,contributed greatly to poverty reduction. According to a micro-decomposition exercise, thisaccounted for about one third of the observed reduction in poverty. It is difficult to knowwhat is causing off-farm productivity to rise, but it seems plausible that investments ininfrastructure, as well as a rise in exports in more productive activities, may have played arole.
Source: Inchauste and Winkler (2012)
25. Although non-agricultural workers have become more productive, employment ingood jobs has stagnated. Since 2002, the share of workers in salaried jobs has declined, from40 to 36 percent of the population (Figure 21). At the same time, the share of workers inagriculture increased from 43 to 44 percent. This is unusual, because the structuraltransformation in employment, from agriculture to salaried employment outside ofagriculture, is typically a defining feature of poverty reduction.
Source: ILO Key Indicators of the Labor Market
Non-laborincome, 23%
Returns farm, 13%
Returns non-farm, 37%
Education , 9%
Age-gender-regional, 10% Other, 0
Own account + employers Wage Family workers
Increased Returns to Non-farm Employment Non-labor IncomeFigure 20
The Share of Workers in Salaried Jobs DeclinedFigure 21
Pakistan Poverty Trends, Scenarios and Drivers
18
Drivers of Poverty Reduction: Jobs
24. Pakistan’s labor market performance has been mixed. On the positive side, growth inlabor income, particularly increasing returns to employment in the non-farm sector,contributed greatly to poverty reduction. According to a micro-decomposition exercise, thisaccounted for about one third of the observed reduction in poverty. It is difficult to knowwhat is causing off-farm productivity to rise, but it seems plausible that investments ininfrastructure, as well as a rise in exports in more productive activities, may have played arole.
Source: Inchauste and Winkler (2012)
25. Although non-agricultural workers have become more productive, employment ingood jobs has stagnated. Since 2002, the share of workers in salaried jobs has declined, from40 to 36 percent of the population (Figure 21). At the same time, the share of workers inagriculture increased from 43 to 44 percent. This is unusual, because the structuraltransformation in employment, from agriculture to salaried employment outside ofagriculture, is typically a defining feature of poverty reduction.
Source: ILO Key Indicators of the Labor Market
Returns farm, 13%
Family workers
Increased Returns to Non-farm Employment Non-labor IncomeFigure 20
The Share of Workers in Salaried Jobs DeclinedFigure 21
Pakistan Poverty Trends, Scenarios and Drivers
19
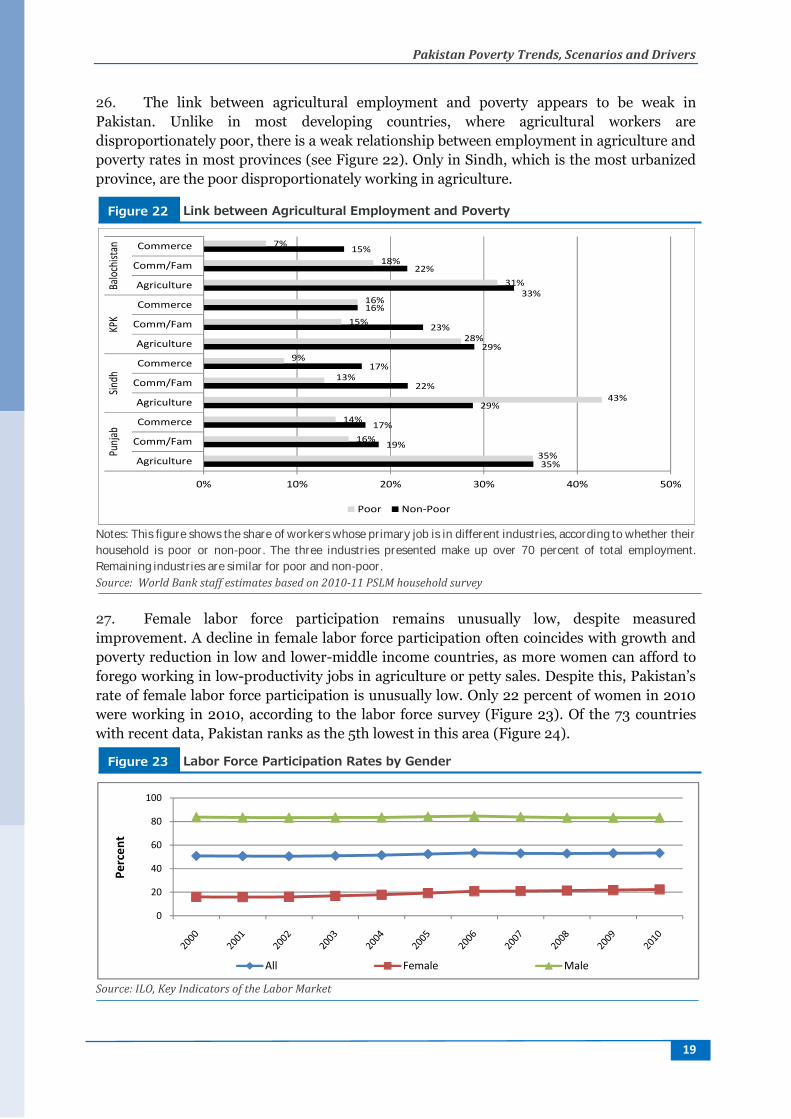
26. The link between agricultural employment and poverty appears to be weak inPakistan. Unlike in most developing countries, where agricultural workers aredisproportionately poor, there is a weak relationship between employment in agriculture andpoverty rates in most provinces (see Figure 22). Only in Sindh, which is the most urbanizedprovince, are the poor disproportionately working in agriculture.
Notes: This figure shows the share of workers whose primary job is in different industries, according to whether theirhousehold is poor or non-poor. The three industries presented make up over 70 percent of total employment.Remaining industries are similar for poor and non-poor.Source: World Bank staff estimates based on 2010-11 PSLM household survey
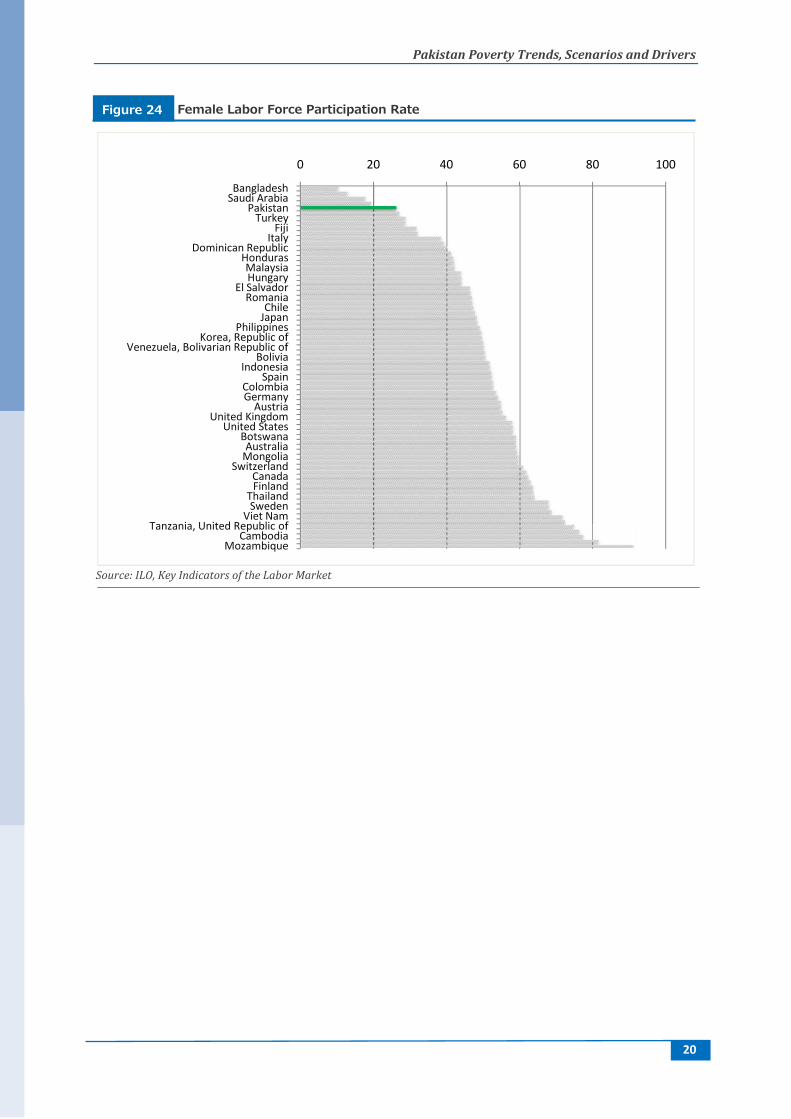
27. Female labor force participation remains unusually low, despite measuredimprovement. A decline in female labor force participation often coincides with growth andpoverty reduction in low and lower-middle income countries, as more women can afford toforego working in low-productivity jobs in agriculture or petty sales. Despite this, Pakistan’srate of female labor force participation is unusually low. Only 22 percent of women in 2010were working in 2010, according to the labor force survey (Figure 23). Of the 73 countrieswith recent data, Pakistan ranks as the 5th lowest in this area (Figure 24).
Source: ILO, Key Indicators of the Labor Market
35%
19%
17%
29%
22%
17%
29%
23%
16%33%
22%
15%
35%
16%
14%
43%
13%
9%
28%
15%
16%
31%
18%
7%
0% 10% 20% 30% 40% 50%
Agriculture
Comm/Fam
Commerce
Agriculture
Comm/Fam
Commerce
Agriculture
Comm/Fam
Commerce
Agriculture
Comm/Fam
Commerce
Punj
abSin
dhKP
KBa
lochis
tan
Poor Non-Poor
0
20
40
60
80
100
Perc
ent
All Female Male
Link between Agricultural Employment and PovertyFigure 22
Labor Force Participation Rates by GenderFigure 23
Pakistan Poverty Trends, Scenarios and Drivers
20
Source: ILO, Key Indicators of the Labor Market
BangladeshSaudi Arabia
PakistanTurkey
FijiItaly
Dominican RepublicHondurasMalaysiaHungary
El SalvadorRomania
ChileJapan
PhilippinesKorea, Republic of
Venezuela, Bolivarian Republic ofBolivia
IndonesiaSpain
ColombiaGermany
AustriaUnited Kingdom
United StatesBotswanaAustralia
MongoliaSwitzerland
CanadaFinland
ThailandSweden
Viet NamTanzania, United Republic of
CambodiaMozambique
Female Labor Force Participation RateFigure 24
Pakistan Poverty Trends, Scenarios and Drivers
20
Source: ILO, Key Indicators of the Labor Market
0 20 40 60
BangladeshSaudi Arabia
PakistanTurkey
FijiItaly
Dominican RepublicHondurasMalaysiaHungary
El SalvadorRomania
ChileJapan
PhilippinesKorea, Republic of
Venezuela, Bolivarian Republic ofBolivia
IndonesiaSpain
ColombiaGermany
AustriaUnited Kingdom
United StatesBotswanaAustralia
MongoliaSwitzerland
CanadaFinland
ThailandSweden
Viet NamTanzania, United Republic of
CambodiaMozambique
Female Labor Force Participation RateFigure 24
Pakistan Poverty Trends, Scenarios and Drivers
20
Source: ILO, Key Indicators of the Labor Market
80 100
Female Labor Force Participation RateFigure 24
Pakistan Poverty Trends, Scenarios and Drivers
21
Non-Labor Transfers
28. Because of scarcity of good jobs, non-labor transfers are playing an important role inreducing poverty. Four types of cash transfers are considered: international remittances,domestic transfers from family and friends, transfers from Zakat/Usher, and transfers fromthe Benazir Income Support Program (BISP). The first three are reported by households inthe data, and in theory cover all private transfers in addition to Zakat/Usher. The BISPfigures, on the other hand, come from simulations based on eligibility rules.8 Meanwhile, theBISP is a large targeted Unconditional Cash Transfer (UCT) Program launched after the2007-08 food crisis to improve the living conditions of the poor.9
29. Overall, reported cash transfers are common in Pakistan, especially remittances fromthose outside the country and people in KPK province. In 2011, 16.1 percent of thepopulation lived in a household that reported receiving international remittances, nationaltransfers, or Zakat/Usher.10International remittances alone are reported by one in tenpersons in Pakistan. Cash transfers are most common in KPK, where more than one out ofthree persons received some form of transfer. But they are also quite common in Punjab,where almost one in five persons did.
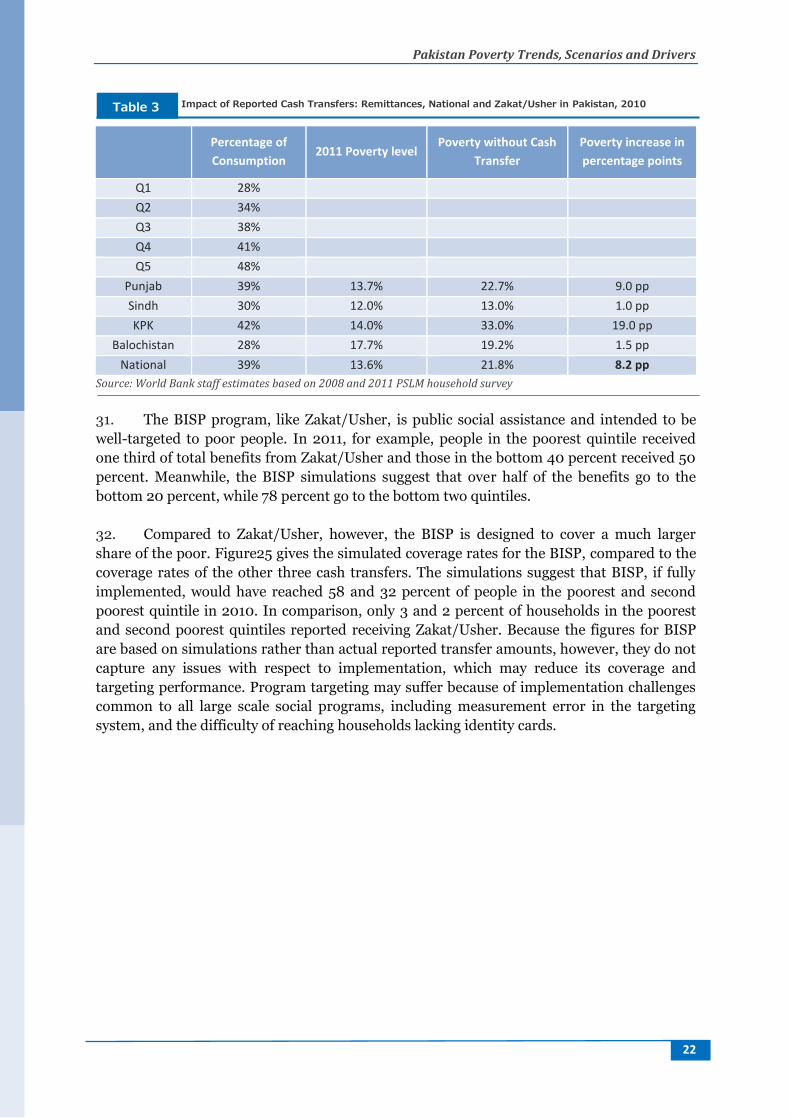
30. Cash transfers represent an important share of households’ budget and contribute tosignificantly reducing poverty in Punjab and KPK. Cash transfers received by householdsrepresented from 28 percent of household consumption (poorest) up to 48 percent ofconsumption (richest quintile)11. Assuming households did not receive any cash transfers in2010, poverty would have been 8.2 percentage points higher in Pakistan, more than doublein KPK and close to two thirds higher in Punjab (Table 3).
8 Zakat/Usher is a form of publicly-run charity, particularly targeted at orphans and widows and distributed bylocal government committees and other institutions. The objective behind the system of Zakat is to providefinancial assistance to the needy, indigent and the poor, with special consideration given to widows and orphans.The collection of Zakat is based on a compulsory levy from eleven types of assets including formal savings andinvestment instruments, securities, annuities, life insurance policies and provident funds (2.5 percent). Thedisbursement of Zakat takes place by transfer of funds to the Provincial Zakat Council which in turn transfers it toDistrict Zakat Committees. The actual disbursement is made at local level through Local Zakat Committees andother institutions.9 As the program is gradually rolling out to the bottom 22% population, total disbursement has increased fromPKR 16.04 billion in FY 2009-10 to PKR 44.11 billion in FY 2012-13. In FY 2013-14, the amount of transfer will beincreased from PKR 1,000 to PKR 1,200. Currently, 5 million families have been enrolled into the program andefforts to enroll the remaining 2.2 million families are under way. Some of the reasons for the remaining 2.2million are the lack of Computerized National Identify Cards with female heads of the eligible families, which isone of the conditions of enrolment.10 BISP is not included in this aggregate because the BISP results are based on simulations while receipts of theother three transfers are directly reported by households.11 The percentages are those of households receiving cash transfers and not of all households in the country.
Pakistan Poverty Trends, Scenarios and Drivers
22
Percentage ofConsumption
2011 Poverty levelPoverty without Cash
TransferPoverty increase inpercentage points
Q1 28%Q2 34%Q3 38%Q4 41%Q5 48%
Punjab 39% 13.7% 22.7% 9.0 ppSindh 30% 12.0% 13.0% 1.0 ppKPK 42% 14.0% 33.0% 19.0 pp
Balochistan 28% 17.7% 19.2% 1.5 ppNational 39% 13.6% 21.8% 8.2 pp
Source: World Bank staff estimates based on 2008 and 2011 PSLM household survey
31. The BISP program, like Zakat/Usher, is public social assistance and intended to bewell-targeted to poor people. In 2011, for example, people in the poorest quintile receivedone third of total benefits from Zakat/Usher and those in the bottom 40 percent received 50percent. Meanwhile, the BISP simulations suggest that over half of the benefits go to thebottom 20 percent, while 78 percent go to the bottom two quintiles.
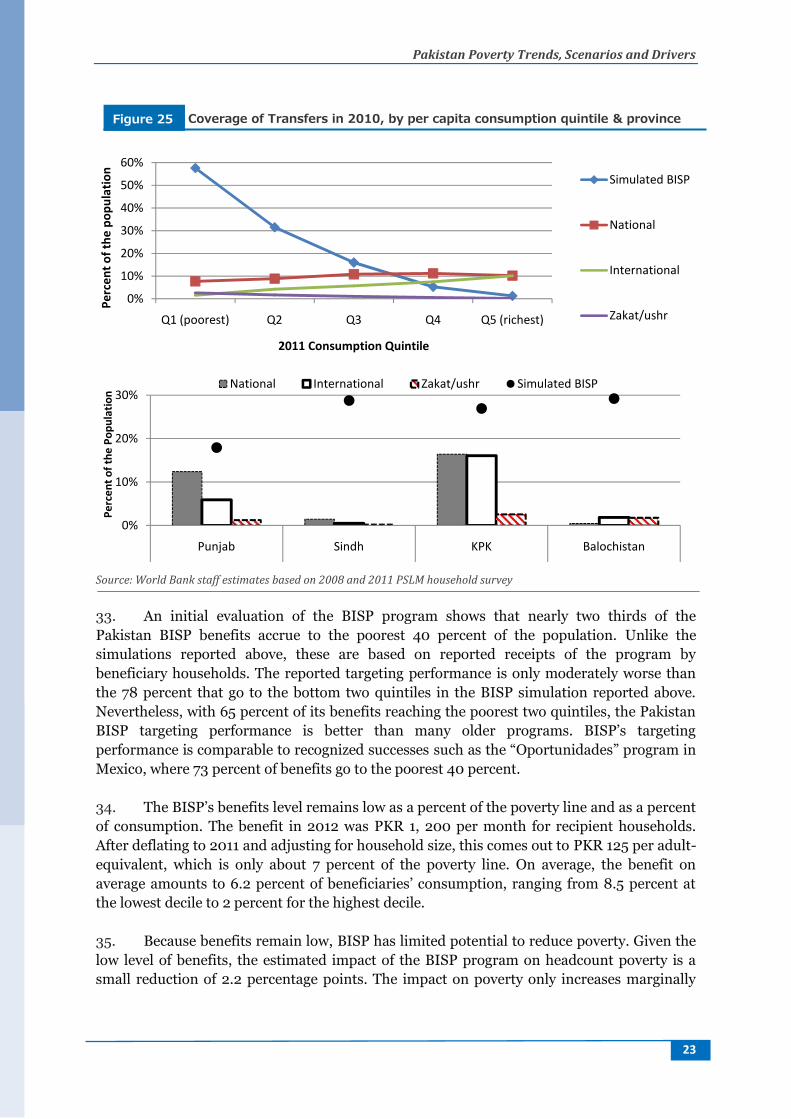
32. Compared to Zakat/Usher, however, the BISP is designed to cover a much largershare of the poor. Figure25 gives the simulated coverage rates for the BISP, compared to thecoverage rates of the other three cash transfers. The simulations suggest that BISP, if fullyimplemented, would have reached 58 and 32 percent of people in the poorest and secondpoorest quintile in 2010. In comparison, only 3 and 2 percent of households in the poorestand second poorest quintiles reported receiving Zakat/Usher. Because the figures for BISPare based on simulations rather than actual reported transfer amounts, however, they do notcapture any issues with respect to implementation, which may reduce its coverage andtargeting performance. Program targeting may suffer because of implementation challengescommon to all large scale social programs, including measurement error in the targetingsystem, and the difficulty of reaching households lacking identity cards.
Impact of Reported Cash Transfers: Remittances, National and Zakat/Usher in Pakistan, 2010Table 3
Pakistan Poverty Trends, Scenarios and Drivers
23
Source: World Bank staff estimates based on 2008 and 2011 PSLM household survey
33. An initial evaluation of the BISP program shows that nearly two thirds of thePakistan BISP benefits accrue to the poorest 40 percent of the population. Unlike thesimulations reported above, these are based on reported receipts of the program bybeneficiary households. The reported targeting performance is only moderately worse thanthe 78 percent that go to the bottom two quintiles in the BISP simulation reported above.Nevertheless, with 65 percent of its benefits reaching the poorest two quintiles, the PakistanBISP targeting performance is better than many older programs. BISP’s targetingperformance is comparable to recognized successes such as the “Oportunidades” program inMexico, where 73 percent of benefits go to the poorest 40 percent.
34. The BISP’s benefits level remains low as a percent of the poverty line and as a percentof consumption. The benefit in 2012 was PKR 1, 200 per month for recipient households.After deflating to 2011 and adjusting for household size, this comes out to PKR 125 per adult-equivalent, which is only about 7 percent of the poverty line. On average, the benefit onaverage amounts to 6.2 percent of beneficiaries’ consumption, ranging from 8.5 percent atthe lowest decile to 2 percent for the highest decile.
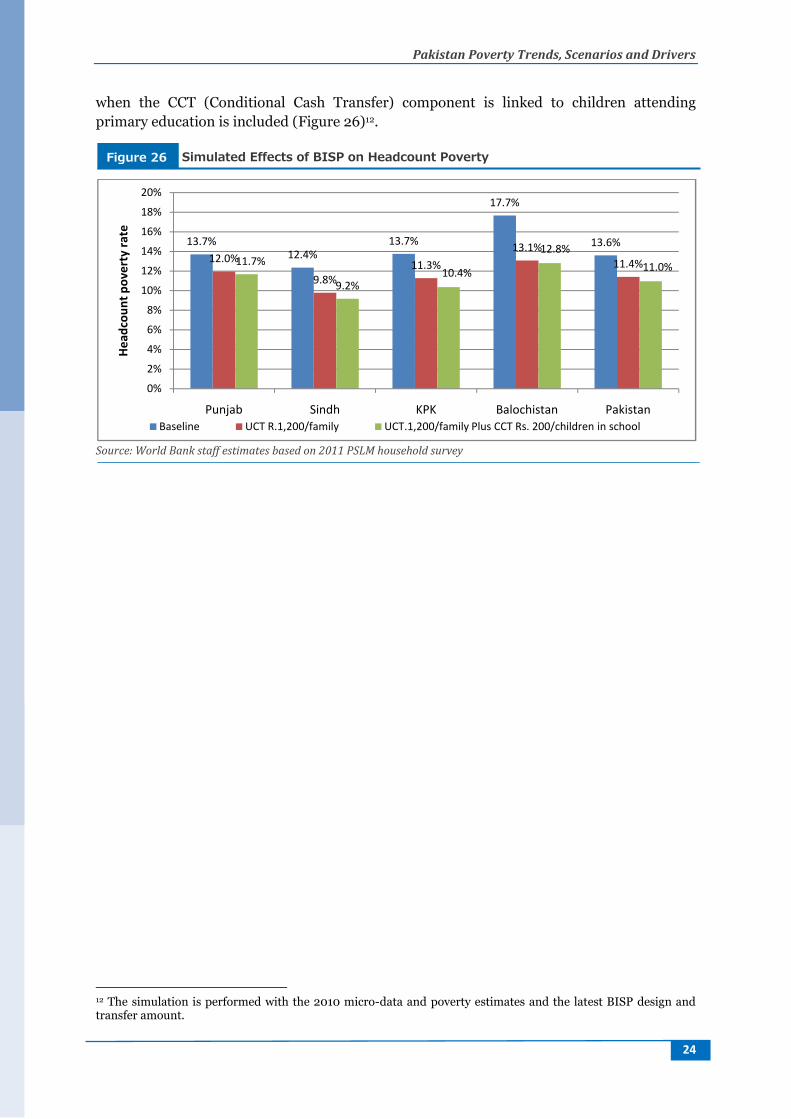
35. Because benefits remain low, BISP has limited potential to reduce poverty. Given thelow level of benefits, the estimated impact of the BISP program on headcount poverty is asmall reduction of 2.2 percentage points. The impact on poverty only increases marginally
0%
10%
20%
30%
40%
50%
60%
Q1 (poorest) Q2 Q3 Q4 Q5 (richest)
Perc
ent o
f the
pop
ulat
ion
2011 Consumption Quintile
Simulated BISP
National
International
Zakat/ushr
0%
10%
20%
30%
Punjab Sindh KPK Balochistan
Perc
ent o
f the
Pop
ulat
ion
National International Zakat/ushr Simulated BISP
Coverage of Transfers in 2010, by per capita consumption quintile & provinceFigure 25
Pakistan Poverty Trends, Scenarios and Drivers
24
when the CCT (Conditional Cash Transfer) component is linked to children attendingprimary education is included (Figure 26)12.
Source: World Bank staff estimates based on 2011 PSLM household survey
12 The simulation is performed with the 2010 micro-data and poverty estimates and the latest BISP design andtransfer amount.
13.7%12.4%
13.7%
17.7%
13.6%12.0%
9.8%11.3%
13.1%11.4%11.7%
9.2%10.4%
12.8%11.0%
0%
2%
4%
6%
8%
10%
12%
14%
16%
18%
20%
Punjab Sindh KPK Balochistan Pakistan
Head
coun
t pov
erty
rate
Baseline UCT R.1,200/family UCT.1,200/family Plus CCT Rs. 200/children in school
Simulated Effects of BISP on Headcount PovertyFigure 26
Pakistan Poverty Trends, Scenarios and Drivers
25
Conclusion
36. Although Pakistan has made tangible progress in reducing poverty, addressingadditional obstacles could accelerate the rise in living standards for the poor. Overall,Pakistan has made impressive strides in reducing poverty, particularly since 2002. Growthhas been generally pro-poor, which has pulled a large number of people just above thepoverty line. Provincial disparities in poverty have largely disappeared, thanks to strongpoverty reduction in KPK, as well as Balochistan (if that province’s data can be trusted). Thereduction in poverty has largely been driven by a more productive non-agricultural sector,possibly linked to past investments in infrastructure, improvements in technology, andincreased openness to trade.
37. On the other hand, Pakistan’s labor market is struggling to broaden access to goodjobs. Surprisingly, in a growing economy with substantial poverty reduction, the share ofsalaried and non-agricultural jobs is shrinking. Female labor force participation remains low,particularly by international standards. Because the labor market is struggling, rates ofvulnerability to poverty remain very high, and private transfers and internationalremittances are playing a large role in reducing poverty. While these transfers are helping liftlarge numbers of poor households just above the line, they are not well targeted to the poor.The BISP, a public transfer program, is much better targeted to the poor, but because of itssmall size it has only a limited effect on poverty.
38. Pakistan has made solid progress against poverty in the last decade, thanks in part topast policies and investment that have boosted productivity in the non-agricultural sector. IfPakistan can continue to address the remaining constraints to more rapid growth, such asfrequent load-shedding and low levels of investment in human capital, the labor market hasthe potential to greatly accelerate the improvement in living standards for the poor.
Pakistan Poverty Trends, Scenarios and Drivers
26
References
Cheema , I. A. A Profile of Poverty in Pakistan. Centre for Research on Poverty Reductionand Income Distribution Planning Commission, Islamabad. November 2005
Deaton, A., and S. Zaidi. 2002. “Guidelines for Consumption Aggregates for WelfareAnalysis.” Living Standard Measurement Study Working Paper 135, World Bank,Washington DC. 1998
Inchauste, Gabriela, and Hernan Winkler,2012,"Decomposing Distributional Changes inPakistan."Background paper to Fostering Employment with Inclusive Growth Report,World Bank, Washington, DC.
Kinnunen, Jouko, and Hans Lofgren, 2013, “Infrastructure for Growth and HumanDevelopment in Pakistan: A Simulation Analysis of Fiscal Policy Options”, World BankPolicy Research Working Paper 6554.
Newman, John, 2013, “Resolvable Issues Relate to Poverty Estimates in Pakistan”, mimeo
Pakistan Poverty Trends, Scenarios and Drivers
27
Annexure 1 – Vulnerability by Province
Source: World Bank staff estimates based on PSLM household surveys
2002
2011
0%2%4%6%8%
10%12%14%
Perc
enta
ge o
f the
pop
ulat
ion
Monthly consumption per adult eq. (2010 prices)
Punjab
Poverty Line =
2002
2011
0%2%4%6%8%
10%12%14%
Perc
enta
ge o
f the
pop
ulat
ion
Monthly consumption per adult eq. (2010 prices)
Sindh
Poverty Line =
2002
2011
0%2%4%6%8%
10%12%14%16%
Perc
enta
ge o
f the
pop
ulat
ion
Monthly consumption per adult eq. (2010 prices)
KPKPoverty Line =
2002
2011
0%2%4%6%8%
10%12%14%16%
Perc
enta
ge o
f the
pop
ulat
ion
Monthly consumption per adult eq. (2010 prices)
BalochistanPoverty Line =
Share of households clustered near the poverty line, Pakistan 2002-11 by provinceFigure 27
Pakistan Poverty Trends, Scenarios and Drivers
28
Annexure 2 - Measuring Poverty in Pakistan: General Characteristicsand Limitations
Currently, the Pakistan Bureau of Statistics (PBS) collects consumption data every threeyears to estimate poverty rates at the national level as well as for four major provinces. Toimprove comparability of the data over time, PBS has minimized changes in theconsumption module since 1998-99 when the first integrated household survey wasimplemented. Since then, consumption data was collected in 2001-02, 2004-05, 2005-06,2007-08, and 2010-11. To avoid seasonality of consumption, PBS collects consumption dataover the entire year. The survey is known as the “Pakistan Social and Living StandardsMeasurement (PSLM)” and is similar in spirit to the Living Standards Measurement Surveysconducted by the World Bank.
The PBS created an official poverty line using a simple food energy intake approach, with the1998-99 data, and then slightly modified it using the 2001-02 data. The official poverty linesare currently updated using the 2001-02 official poverty line and inflation rates from theConsumer Price Index (CPI). For each round, only the national poverty line is updated andspatial price adjustments are done using food unit values from the PSLM, following therecommendation of Deaton and Zahidi (1998). Household expenditures are deflatedaccording to spatial price differences and adjusted using a simple adult equivalence scale. Anindividual is deemed to be poor if his or her household expenditure per adult equivalencescale, following spatial price adjustments, lies below the national poverty line. Furtherdetails and some robustness tests are described in Cheema (2005).
Although the PBS carries out the data collection, poverty estimation has been carried out bythe Planning Commission in collaboration with the United Nations DevelopmentProgramme (UNDP). Before official poverty estimates are announced, a technical committeemeeting is usually convened to discuss reliability of the poverty estimates. The technicalcommittee meeting is often chaired by representatives from the Planning Commission andtends to include invited experts from the World Bank. Indeed, experts from the World Bankwere invited to discuss revisions of the 2001-02 poverty estimates and poverty estimates for2004-05, 2005-06, and 2007-08. The World Bank experts reviewed the poverty estimatesprepared by the Planning Commission in 2007-08 but the estimates of were not publishedofficially.
Limitations of Official Methodology
Inflation over time may not be measured accurately. As mentioned above, PBS collects pricedata for CPI only from big cities. As a result, inflation estimates based on CPI are likelysubject to urban biases. Also, since food price inflation can be very different from non-foodprice inflation, inflation adjustments might need to take into account changes in food sharesbetween areas and over time.
Spatial price adjustments for expenditure are carried out using unit prices for food availablein the PSLM. Since PBS only collects CPI price data for large cities, there is no informationon rural non food prices. As a result, spatial price adjustments are based entirely on foodprices and its reliability declines when food and non-food prices change at a different rateover time.
Pakistan Poverty Trends, Scenarios and Drivers
29
PBS has not collected a population census data since 1998. The lack of more recentpopulation census reduces reliability of the sampling frame used to select the PSLMhouseholds and determine population weights. Even for the 1998-99 survey, the sampling ofBalochistan was in question due to a large share of nomad population in the province. It islikely that large fluctuation of poverty incidence in Balochistan can be attributed to the weaksampling frame. In the case of Balochistan, this problem is aggravated by the fact that it is avast territory with a highly dispersed population, which makes it very difficult to collect data.Similarly, as pointed out by Newman (2013), migration and conflict may have alsoaggravated the sampling problem in Khyber Pakhtunkhwa (KPK) in the last few years.
The current format of the questionnaire does not include enough information to estimate aflow of services from consumer durables. As a result, the official methodology does notinclude any information of spending for consumer durables except for costs of repairs. As theshare of non-food consumption increases in Pakistan, consumption estimates withoutdurable goods become more unreliable. It is important to include more information in thequestionnaire on consumer durables so that analysts can estimate the flow of services fromconsumer durables.
The poverty line has not been updated in several years. As mentioned above, the officialpoverty line of 2001-02 was estimated using the food energy intake approach. Since the cost-of-basic needs approach is currently dominant in the developing world and the currentpoverty line is already more than 10 years old, it is a good time to re-estimate a new officialpoverty line. In theory, as long as a unique poverty line is estimated, there should not be ahuge difference in the level of the poverty line between the food energy intake approach andthe cost-of-basic needs approach if the calorie threshold is set at the same level. But, achange in the food share is likely to increase the level of the poverty line, which reflects anincrease in basic needs.
Potential Impact of Methodological Limitations
Food prices have been increasing more than non-food prices, which could lead to biaseswhen calculating poverty line values and headcount poverty rates. Newman (2013) provideshard evidence of this problem for the province of Punjab. He adjusts the povertymeasurement with different prices indexes for food and non-food (constructed frominformation on the general CPI, the food price index and the share of food in the generalCPI).
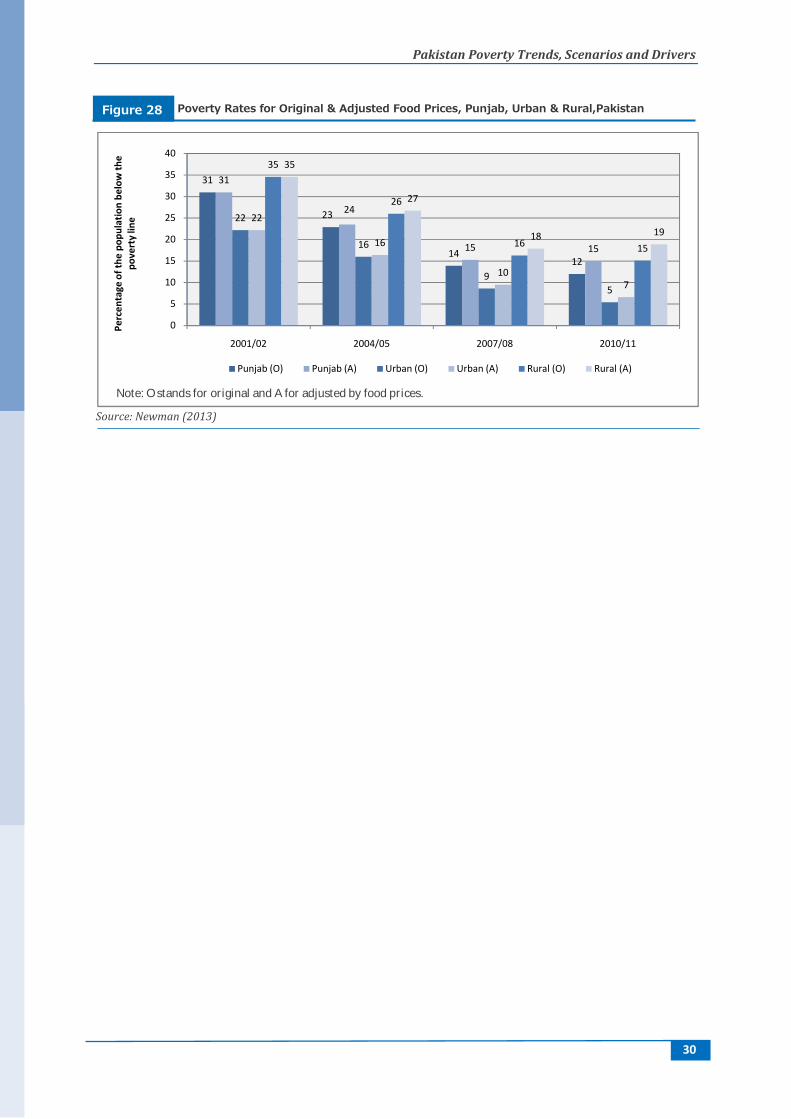
Comparing the original and the adjusted poverty headcount estimates, shows almost nodifference in 2004-06, increasing differences by 2007-08 and significant changes by 2010-11(Figure 28). The gap between the headcount rates increases after 2007, when the food pricesstart to increase relative to the non-food component. For 2011, the difference in levels equalsto 3 percentage points at Punjab and it is larger for rural than for urban Punjab (4 versus 2percentage points). More importantly, the adjustment modifies the trends between 2008 and2011 from decreasing poverty in Punjab (14 to 12 percent) no change (15 percent in bothperiods). The changes are even greater for rural households from an original decrease inheadcount poverty (16 to 15 percent), while according to adjusted estimate poverty increasesin rural households from 18 to 19 percent.
Pakistan Poverty Trends, Scenarios and Drivers
30
Source: Newman (2013)
31
23
1412
31
24
15 15
22
16
95
22
16
107
35
26
16 15
35
27
18 19
0
5
10
15
20
25
30
35
40
2001/02 2004/05 2007/08 2010/11
Perc
enta
ge o
f the
pop
ulat
ion
belo
w th
epo
vert
y lin
e
Punjab (O) Punjab (A) Urban (O) Urban (A) Rural (O) Rural (A)Note: O stands for original and A for adjusted by food prices.
Poverty Rates for Original & Adjusted Food Prices, Punjab, Urban & Rural,PakistanFigure 28
Pakistan Poverty Trends, Scenarios and Drivers
31
Annexure 3 - Detailed explanation of the Human Opportunity Index
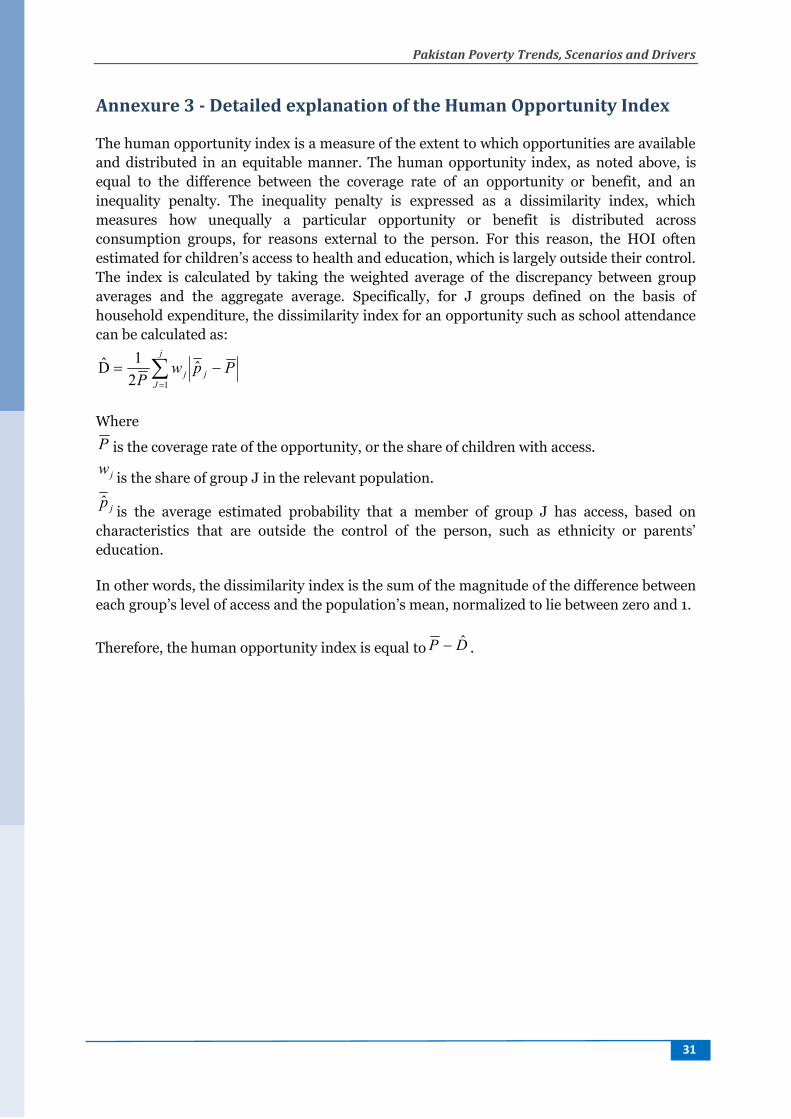
The human opportunity index is a measure of the extent to which opportunities are availableand distributed in an equitable manner. The human opportunity index, as noted above, isequal to the difference between the coverage rate of an opportunity or benefit, and aninequality penalty. The inequality penalty is expressed as a dissimilarity index, whichmeasures how unequally a particular opportunity or benefit is distributed acrossconsumption groups, for reasons external to the person. For this reason, the HOI oftenestimated for children’s access to health and education, which is largely outside their control.The index is calculated by taking the weighted average of the discrepancy between groupaverages and the aggregate average. Specifically, for J groups defined on the basis ofhousehold expenditure, the dissimilarity index for an opportunity such as school attendancecan be calculated as:
j
Jjj Ppw
P 1
ˆ21D̂
Where
P is the coverage rate of the opportunity, or the share of children with access.
jw is the share of group J in the relevant population.
jp̂ is the average estimated probability that a member of group J has access, based oncharacteristics that are outside the control of the person, such as ethnicity or parents’education.
In other words, the dissimilarity index is the sum of the magnitude of the difference betweeneach group’s level of access and the population’s mean, normalized to lie between zero and 1.
Therefore, the human opportunity index is equal to DP ˆ .