Embed Size (px)
Citation preview

Population & Health Working Paper Series
PIDE-CPHSP-5
PA K I S TA N I N S T I T U T E O F D E V E L O P M E N T E C O N O M I C S
Health and Economic Consequences of Overweight and Obesity Among
Adults in Pakistan
Maryam Naeem Satti
Durr-e-Nayab
Mahmood Khalid

Population & Health Working Paper Series
PIDE-CPHSP-5
Health and Economic Consequences of Overweight and Obesity Among
Adults in Pakistan
Maryam Naeem Satti
Pakistan Institute of Development Economics, Islamabad
Durr-e-Nayab Pakistan Institute of Development Economics, Islamabad
and
Mahmood Khalid Pakistan Institute of Development Economics, Islamabad
PAKISTAN INSTITUTE OF DEVELOPMENT ECONOMICS
ISLAMABAD
2015

All rights reserved. No part of this publication may be reproduced, stored in a retrieval system or
transmitted in any form or by any means electronic, mechanical, photocopying, recording or
otherwise without prior permission of the Publications Division, Pakistan Institute of Development
Economics, P. O. Box 1091, Islamabad 44000.
© Pakistan Institute of Development
Economics, 2015.
Pakistan Institute of Development Economics
Islamabad, Pakistan
E-mail: [email protected]
Website: http://www.pide.org.pk
Fax: +92-51-9248065
Designed, composed, and finished at the Publications Division, PIDE.

C O N T E N T S
Page
Abstract v
1. Introduction 1
2. Theoretical Foundation and Review of Literature 2
3. Data and Methodology 3
4. Health Consequences of Overweight and Obesity 8
5. Economic Consequences of Overweight and Obesity 12
6. Conclusion 17
Appendices 18
References 21
List of Tables
Table 1. Percentage of Adults having Specific Illnesses by BMI
Categories 9
Table 2. Mean Days Estimates of Disease Intensity by Nutritional
Status 10
Table 3. Result of Binary Logistic Regression for Determinants of
Obesity Co-morbidities 11
Table 4. Relative Risks with 95 percent Confidence Intervals (CI)
and PAFs of Selected Obesity Co-morbidities for
Overweight and Obese Adults 13
Table 5. Annual Cost (Total and Average) Attributable to
Overweight and Obesity for year 2010, in Rupees 14
Table 6. Scaling-up of Annual Cost Attributable to Overweight and
Obesity to the Whole Population (in Rupees) 16
List of Figures
Figure 1. Percentage of Adults Suffered from a Disease by
Nutritional Status 8

ABSTRACT
Overweight and obesity is a global problem carrying immense health and
economic consequences on individuals’ lives. It is of utmost importance
especially in the context of Pakistan, which is facing the double burden of
nutrition and disease. The present study ascertains the possible consequences of
overweight and obesity among adult population using Pakistan Panel Household
Survey for 2010. The findings show a negative association between weight and
health by yielding higher prevalence and intensity of disease among excess
weight than non-excess weight adults. The cost of illness methodology is
adopted in the study by considering the two major obesity co-morbidities i.e.
heart disease and diabetes. The results indicate that a sizeable proportion, 22
percent, and the cost incurred by the individuals for these co-morbidities is
attributed to overweight and obesity. According to the results, the share of direct
cost for heart diseases and diabetes attributable to excess weight is 16 percent of
the national total health expenditure in Pakistan. The annual direct cost came out
to be 0.4 percent of GDP, while estimates of indirect cost are 1.9 percent of the
country’s GDP. This creates a huge cost burden on oversized individuals.
Therefore, it is high time that strategies in the country’s health plans are
included concerning control and prevention of overweight and obesity. This will
provide a roadmap to a sustainable health care system and increased economic
wellbeing of individuals.
JEL Classification: I12, I15
Keywords: Overweight, Obesity, Cost of Illness, Productivity Loss

1. INTRODUCTION*
Overweight and obesity is a global health problem. The rise in the
prevalence of overweight and obesity since the 1980s has reached to an alarming
situation for every nation [Ng, et al. (2014)]. The extent of overweight and
obesity varies widely across different regions given their environment,
sociocultural context, economic situation, food habits and lifestyle. Its
prevalence is highly apparent in industrialised countries where more than half of
the adult population is overweight and obese. Yet, the rates are also alarmingly
high in developing countries. Presently the developing economies of the world
are not only facing the problem of underweight population but are also at risk of
excess weight; contributing to the double burden of malnutrition [Schmidhuber
and Shetty (2005)].
The developed world has long since replaced nutritious diet with high
caloric food. Moreover, physical inactivity is highly prevalent in these
societies due to the invention of labour and time saving devices both at home
and outside. All of this makes life sedentary leading to increased prevalence
of obesity. [Blaylock, Smallwood, Kassel, Variyam and Aldrich (1999)].
The countries which are undergoing transition have now also started to
imitate the diet pattern and sedentary life style of developed nations.
Additionally, increasing urbanisation in these countries is also connected to
changing behaviour related to the standard of living and food intake. All of
this is contributing in the rise of overweight and obesity problem in the less
developed economies also.
The overweight and obesity problem has immense social, health and
economic consequences on the population [Wolf and Colditz (1998)]. The
association between health and obesity has been established since long in the
literature. Apart from the fact that these are risk factors for various
communicable diseases, these also decrease the quality of life and increase
morbidity and mortality. Evidence shows that around the world 3.4 million
deaths in 2010were attributed to overweight and obesity [Lim, et al. (2012)]. It
also involves greater expense; both in terms of medical bills and loss of
productivity, due to the burden of disease on individuals and families. Excess
weight is common in both children and adults, but, adults are the most
vulnerable group to excess weight and the co-morbidities1 related to it.
Acknowledgements: The study completed with the financial support from the GIZ, Health
Sector Support Programme, Pakistan. 1Co-morbidity is defined as the occurrence of an additional disease along with a primary
disease or risk factor.

2
According to a global disease burden research, Pakistan is ranked 9th
among 188 countries in carrying obese population, in terms of absolute numbers
[Ng, et al. (2014)]. Recent evidence from Pakistan suggests that 40 percent of
Pakistani women of reproductive age are either overweight or obese [Pakistan
Demographic and Health Survey (PDHS) (2012-13)]. Given the high prevalence
of excess weight in Pakistan and its association with health, it is worthwhile to
explore its health risks to human life especially in adult age. Moreover, the
related medical care cost and productivity losses due to health risks are useful in
estimating its economic burden for the country. This will aid policy makers for
priority setting in the health sector given limited resource allocation to health in
the country.
2. THEORETICAL FOUNDATION AND REVIEW
OF LITERATURE
The relationship between health and nutrition is complex. On the one
hand an individual with lower weight is liable to fall a prey to disease, while, on
the other an overweight individual is also susceptible to diseases. Both of these
conditions create disutility not only due to morbidity but also due to low self
estimation due to physical appearance. The health production function includes
inputs like nutritional status (N), medical inputs (M) and health services
consumed (S), food intake (F) and leisure time (L) [Grossman (1977)].
H = H (N, M, S, F, L; Ԑ)
The function emphasises the importance of nutrition as an input for
individuals’ health. Excess weight exerts several health consequences on human
life. The co-morbidities related to excess weight are mostly chronic in nature
including Diabetes, Hypertension, Dyslipidaemia, Breathlessness, Sleep apnoea,
Gall bladder disease, Coronary heart disease, Osteoarthritis, Hyperuricaemia,
Cancer, Low back pain, Pregnancy complications, Impaired fertility, Fetal
defects etc. Among these diseases, the value of relative risk is much higher for
Diabetes and Hypertension among obese population that is greater than three
times2 [Haslam, Sattar, and Lean (2006)]. Certain other complications including
pulmonary, gastrointestinal and structural abnormalities are also linked with
excess weight [Kinuqasa, et al. (1984); Stenius-Aarniala, et al. (2000); Daniels
(2006)].
Weight loss in obese population can contribute to several long term health
benefits. Evidence suggests that a 10 percent weight loss can contribute to 40-60
percent decrease in Diabetes incidence and 10mm Hg decrease in blood pressure
of hypertensive patients. In addition, it can also increase life expectancy by
2The value of Relative Risk for a disease when greater than 1 indicates higher risk of that
disease in overweight and obese individual as compared to non-overweight and non-obese
individual.

3
decreasing mortality which is related to obesity co-morbidities, by more than 40
percent [Haslam, et al. (2006)]. Due to the higher number of chronic illnesses
associated with obesity, it is now considered as one of the leading causes of
mortality around the world [Ezzati, Martin, Skjold, Hoorn, and Murray (2006)].
Due to the severe health consequences of overweight and obesity, higher
medical costs are associated with it. This cost places a huge burden on
individuals and families in the form of high out of pocket expenses. Excess
weight and the co-morbidities related to it are chronic in nature which makes the
economic cost a constant burden on the family budget. The cost of obesity can
occur in the form of direct cost which is incurred directly on a disease including
treatment and transportation cost [Muller-Riemenschneider, Reinhold,
Berghofer, and Willich (2010)]. An indirect cost can also be incurred which
captures the disease related productivity loss which can result in the form of
morbidity, disability and mortality. It can result in job absenteeism, early
retirement, unemployment, bed days, restricted activity days and even premature
mortality i.e. death before life expectancy.
A study of United States reveals that the direct cost of eight diseases i.e.
Type 2 Diabetes, Coronary heart diseases, Hypertension, Gallbladder diseases,
Osteoarthritis, Breast, Endometrial and Colon cancer, attributable to obesity is
5.7 percent of their national health expenditure. However, out of this direct cost
attributable to obesity, 63 percent is only due to obesity related Diabetes [Wolf
and Colditz (1998)]. Another study on United States attributes 9.1 percent of
national medical spending to overweight and obesity [Finkelstein, Fiebelkorn,
and Wang (2003)]. Most of the literature claims that indirect cost accountable to
excess weight is higher even than the direct cost. Pitayatienanan, et al. (2014)
estimate indirect cost attributable to obesity in Thailand through job absenteeism
and mortality. According to the results, the share of indirect cost in the total cost
is 54 percent. Furthermore, both direct and indirect cost due to obesity accounts
for 1.5 percent of total health expenditure and 0.13 percent of GDP in Thailand.
Another cost component i.e., intangible cost is also associated with excess
weight. This aspect of cost focuses on the decline in the patient’s quality of life
because of suffering from a disease. However, this aspect is not commonly captured
in the studies because of its subjective nature and estimation difficulties [Rice
(1967); Tarricone (2006)]. A number of studies on overweight and obesity have
been conducted in Pakistan but most of these focus on the prevalence and
determinants of obesity [Rehman, et al. (2003); Mushtaq, et al. (2011); Ahmed,
Laghari, Naseer, and Mehraj (2013)].The economic consequences and the cost of
obesity has remained an unattended area of obesity research in Pakistan.
3. DATA AND METHODOLOGY
The study uses the dataset of Pakistan Panel Household Survey [PPHS]
conducted in 2010 by Pakistan Institute of Development Economics. The dataset

4
contains nutritional information i.e. weight and height measured for individuals.
Further, a rich health module is present in the data for estimating both health
consequences of excess weight and cost of illness attributable to it.
The unit of analysis of the present study is adults of age 18 years and
above. The reason for using adults is that they are more susceptible to excess
weight and its related co-morbidities like Diabetes, Heart diseases etc. [Haslam,
et al. (2006); Janssen (2012)]. Prevalence of overweight and obesity is estimated
using Body Mass Index [BMI] which is defined as weight in kilograms divided
by the square of the height in metres. Individuals having BMI between 25-
29.9are classified as overweight and BMI ≥ 30 as obese3 [WHO (2000)].
For capturing the health consequences of overweight and obesity,
indicators used here are: Prevalence of general or chronic illness and intensity of
illness are measured through episodes and duration of illness, and days of
hospitalisation. Both bivariate and multivariate analysis is performed. Binary
logistic regression is performed to see whether overweight and obesity is a
significant factor in developing a chronic disease. The dependent variable here is
the presence of obesity co-morbidity (heart diseases and diabetes) which is in
two categories, Yes or No. This dependent variable can be determined by
various explanatory variables including overweight and obesity. Therefore,
along with excess weight, certain other relevant independent variables are
identified from the literature [Brown, et al. (2003); Dedkhard (2006)] including:
age, gender, education, marital status, region, province, wealth status, number of
chronic disease patients in the family, food consumption pattern, eating-out,
working status and BMI index categories.
For the purpose of estimating the cost of an illness which is attributable to
overweight and obesity, the cost of illness methodology is used [Wolf and
Colditz (1998); Sander and Bergemann (2003); Moffatt, et al. (2011)]. This
method is extensively used in health economic literature for highlighting the role
of a risk factor, here overweight and obesity, in developing a disease and
eventually affecting society. The prevalence-based approach is used for the
present study which looks both at the prevalence of a disease and the cost
incurred on it in one particular year. Hence, the time frame for the study is one
year i.e. 2010, which is the data survey year.
Literature links many diseases with obesity but for the present study two
co-morbidities of obesity are selected which are diabetes and heart disease. This
selection of limited diseases is a conservative approach which is chosen due to
non-availability of data. However, this conservative approach is justified as
these two diseases are strongly associated with obesity in the literature [Janssen
3According to WHO expert consultation (2004), BMI cut-offs for Asian population are 23-
24.9 kg/m2 for overweight and >25 kg/m2 for obesity but for the purpose of worldwide comparison
and using the nationally representative survey data, study intended to use international cut-offs like
certain other studies: Dennis, et al. (2006); NNS (2011); PDHS (2012-13).
5
(2012)]. Given the data limitations we are taking only the individual’s
perspective on cost for the present study. However, this perspective is important
in the case of developing countries like Pakistan where major cost burden lies on
the individuals and families i.e. 61 percent of out of pocket expenditure in the
total health expenditure [Pakistan Bureau of Statistics (PBS) (2010)]. This
perspective will articulate how much of the cost of a disease an individual has to
bear for having excess weight.
Both the direct and indirect costs are estimated in the study. The direct
cost is further divided into two: Direct medical cost including the individuals’
out of pocket spending, directly on medical expense i.e. prescription cost,
pharmaceutical cost and cost on laboratory tests and hospitalisation, while the
indirect medical cost is on transportation. Information related to direct medical
cost is given in the data in the form of self-reported health expenditure during
the last year. However, the data on transportation cost is measured indirectly
using information from two different sections.
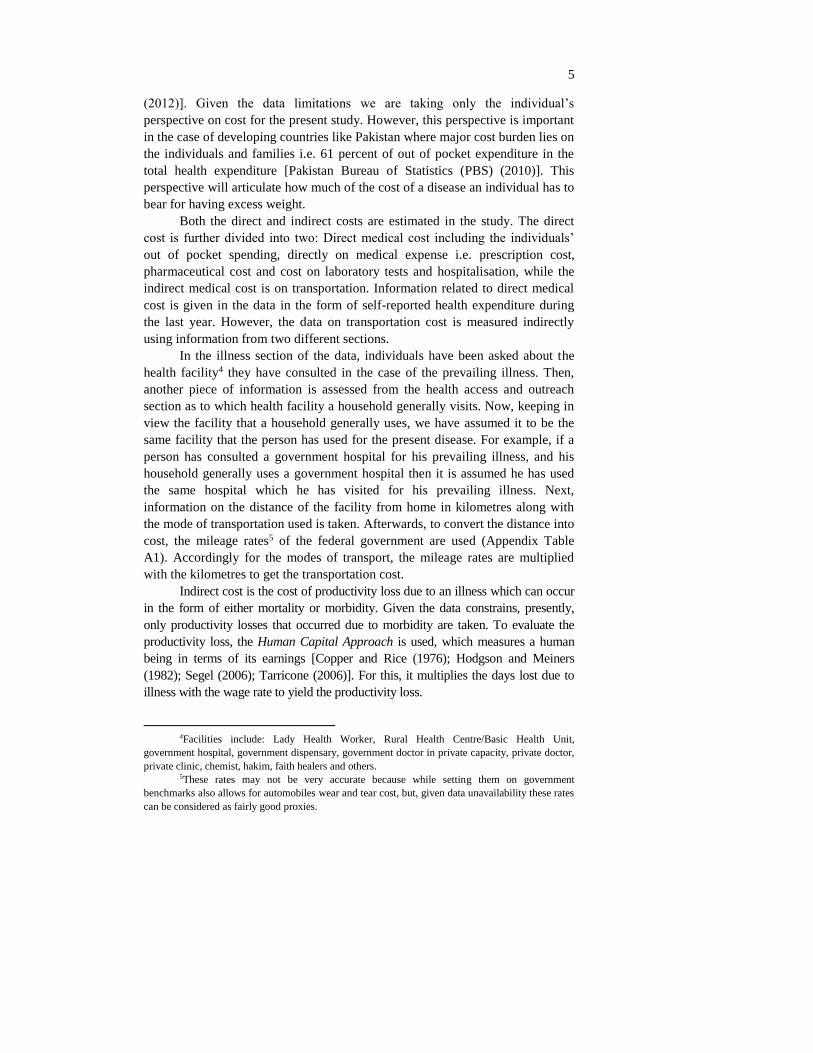
In the illness section of the data, individuals have been asked about the
health facility4 they have consulted in the case of the prevailing illness. Then,
another piece of information is assessed from the health access and outreach
section as to which health facility a household generally visits. Now, keeping in
view the facility that a household generally uses, we have assumed it to be the
same facility that the person has used for the present disease. For example, if a
person has consulted a government hospital for his prevailing illness, and his
household generally uses a government hospital then it is assumed he has used
the same hospital which he has visited for his prevailing illness. Next,
information on the distance of the facility from home in kilometres along with
the mode of transportation used is taken. Afterwards, to convert the distance into
cost, the mileage rates5 of the federal government are used (Appendix Table
A1). Accordingly for the modes of transport, the mileage rates are multiplied
with the kilometres to get the transportation cost.
Indirect cost is the cost of productivity loss due to an illness which can occur
in the form of either mortality or morbidity. Given the data constrains, presently,
only productivity losses that occurred due to morbidity are taken. To evaluate the
productivity loss, the Human Capital Approach is used, which measures a human
being in terms of its earnings [Copper and Rice (1976); Hodgson and Meiners
(1982); Segel (2006); Tarricone (2006)]. For this, it multiplies the days lost due to
illness with the wage rate to yield the productivity loss.
4Facilities include: Lady Health Worker, Rural Health Centre/Basic Health Unit,
government hospital, government dispensary, government doctor in private capacity, private doctor,
private clinic, chemist, hakim, faith healers and others. 5These rates may not be very accurate because while setting them on government
benchmarks also allows for automobiles wear and tear cost, but, given data unavailability these rates
can be considered as fairly good proxies.

6
i.e.,
Indirect cost due to morbidity = time lost due to illness × wage rate
Firstly, for calculating the days lost due to illness various methods can be
used including job absenteeism, unproductive work time lost etc. [Mattke,
Balakrishnan, Bergamo, Newberry, (2007); Lensberg, Drummond, Danchenko,
Despiegel and Francois (2013)]. Among these a method used here is perceived
impairment which directly asks the individuals how much of their normal day
routine is being hindered due to illness [Mattke, et al. (2007)]. In the present
data, individuals were asked the same question and the response was reported in
the form of number of days with disturbed the routine due to illness. Therefore,
this information is used here as a proxy for time lost due to illness.
Individuals in the data have different working status including employed,
unemployed, housewives, students, the elderly and those neither working nor
looking for work. For the employed individuals we can take their actual wages
but for others not working we have to approximate a wage rate [Rice (1967);
Cooper and Rice (1976); Tarricone (2006)]. For the unemployed persons there
are two possibilities: If unemployment is due to a disease, it is assumed that had
the person been working, he would have got the same wage as the person with
similar characteristics working in the labour market [Rice (1967)]. Therefore,
wages of the employed persons in the data with similar age, sex and education
as that of unemployed persons are picked and applied here after adjusting for the
national unemployment rate (1 minus the unemployment rate) in the country.
However, if the unemployed is due to any reason other than illness then the zero
wage rate is applied.
For the housewives, two methods have been used in the literature i.e.
replacement cost6 and opportunity cost [Cooper and Rice (1976)]. The
opportunity cost, preferred for the present study, assumes that if a woman takes
up household work instead of employment, she would be getting the same wage
as the person of similar characteristics in the labour market. Hence age, sex and
education specific wages are applied here. For evaluating students we will have
to capture their future lost income due to current illness [Cooper and Rice
(1976)]. So, for them gender specific mean wages for the educated population
are taken as a proxy. Lastly, for the elderly and persons neither working nor
willing to work, we can assume that they might have been provided informal
care [Tarricone (2006)]. So, the market replacement cost of providing informal
care can be applied for them. Given data availability, the mean wage rate for the
industry is used to evaluate this group.
The evaluation of productivity loss through the human capital approach
provides us with indirect cost estimates. However, literature shows these
6Replacement cost offers a women wage rate equal to a domestic servant.

7
estimates can be overestimated because it is not the actual loss but the potential
productivity loss [Tarricone (2006)]. Thus the self-reported nature of the disease
and days lost due to illness, assumptions made to calculate the transportation
cost, the conservative approach to select diseases and using only the single study
perspective, can be considered to be the limitations of the study.
The steps involved in the prevalence based cost of illness approach to
measure cost of illness attributable to overweight and obesity are described
below [Wolf and Colditz (1998); Brimingham, et al. (1999); Sander and
Bergemann (2003); Konnopka, Bodemann, and Konig (2011); Moffatt, et al.
(2011); Janssen (2012)]:
(1) Estimating prevalence of overweight and obesity (It is measured from
the data through BMI. Prevalence of overweight and obesity is 21 and
9 percent respectively).
(2) Estimating the Relative Risk7 [RR] for selected co-morbidities: It is
calculated by dividing the prevalence of a particular illness in the
overweight and obese versus the non-overweight and non-obese. The
relative risk, when greater than one, will indicate high risk of heart
disease and diabetes in overweight and obese population as compared
to normal or underweight individuals. The procedure is also described
in Appendix Table A2. The Confidence Interval [CI] around Relative
risk is also calculated.8
(3) Calculating Population Attributable Fractions [PAFs] using formula: 𝑃(𝑅𝑅−1)
[𝑃(𝑅𝑅−1)+1] ; where P is the proportion of the overweight and obese
population and RR is the relative risk of a disease in the overweight
and obese population. PAF tells us how much of the proportion of
illness is attributable to overweight and obesity. Both the relative risk
and PAFs are calculated separately for the overweight and obese
population for selected diseases. Results can then be added to see the
combined effect of excess weight.
(4) Estimating the direct and indirect cost for selected illnesses as
described above in detail.
7Relative risk is the comparison of the risk of a disease in exposed group i.e. having the risk
factor (which is being overweight and obese for the present analysis) to that of unexposed group
[Indrayan (2012)]. 8For calculating the confidence interval, firstly log natural (ln) for the relative risks (RR) are
estimates. Secondly, standard error (S.E) for the ln(RR) is computed using formula: √1
𝐴−
1
𝐴+𝐵+
1
𝐶−
1
𝐶+𝐷. Thirdly, formula for 95 percent confidence interval is used: ln(RR)±1.96×S.E[ln(RR)]. Lastly,
taking anti-logarithm for two values computed using confidence interval formula will give upper and
lower limits of confidence interval for relative risk [Birmingham, Muller, Palepu, Spinelli, and Anis
(1999)].

8
(5) Finally, multiplying PAFs with the cost of illness will yield the cost
of illness attributable to overweight and obesity.
After calculating the cost of illness attributable to overweight and obesity,
the results are scaled-up for the whole population. One way deterministic
sensitivity analysis is performed on the results which cover-up the possible
biases in cost estimation caused due to the assumptions made. For this purpose
only one core parameter i.e. the relative risks for the selected diseases, is both
increased and decreased by different percentages arbitrarily, say by 5, 10, 15 and
20 percent and then the change in cost is observed.
4. HEALTH CONSEQUENCES OF OVERWEIGHT
AND OBESITY
Using the data it is first investigated whether obese and overweight
persons are more likely to get sick. Next, it is further probed which type of
disease is mostly prevalent in those individuals. Results show that the majority
i.e. 37 percent of overweight and 47 percent of obese adults suffered from any
disease during the last year, while, this percentage is 34 for normal weight
individuals (Figure 1). This shows a high prevalence of illness among over
weight individuals.
Fig. 1. Percentage of Adults Suffered from a Disease
by Nutritional Status
Source: Authors’ Computation from PPHS dataset, 2010.
While looking at the type of diseases mostly suffered by over weight
individuals, results came in consistent with the literature [Haslam, et al. (2006);
Konnopka, et al. (2011)]. The diseases which are highly prevalent in overweight
and obese adults came out to be cardiovascular diseases and diabetes (Table 1).
The prevalence of heart disease is 19 and 24 percent for overweight and obese
Underweight Normal weight Overweight Obese
39
3437
47

9
adults respectively, while it is merely 12 percent for normal weight individuals.
Similarly, the prevalence of diabetes is 6 and 9 percent for overweight and obese
individuals and only 4 percent for normal weight adults. This indicates a huge
difference in the occurrence of both diseases among normal and over weight
individuals.
Table 1
Percentage of Adults having Specific Illnesses by BMI Categories
Illness Type
BMI Categories
Total Underweight Normal Weight Overweight Obese
Heart Diseases 10.4 12.0 18.7 24.2 14.6
Diabetes 2.1 3.6 6.3 8.5 4.5
Reproductive Problems 6.4 6.0 8.5 6.3 6.6
Respiratory Problems/TB 12.0 5.4 3.6 4.9 5.9
Hepatitis/Jaundice 6.2 4.9 6.2 4.7 5.3
Intestinal/Renal/Kidney problems 8.1 6.8 6.4 6.5 6.8
Others1 54.7 61.4 50.2 45.0 56.2
Total 100 100 100 100 100
Chi-square Value: 0.00. 1Others category of illness includes fever, measles, injury, mental illness, sight problems and other
disabilities.
Authors’ Computation from PPHS dataset (2010).
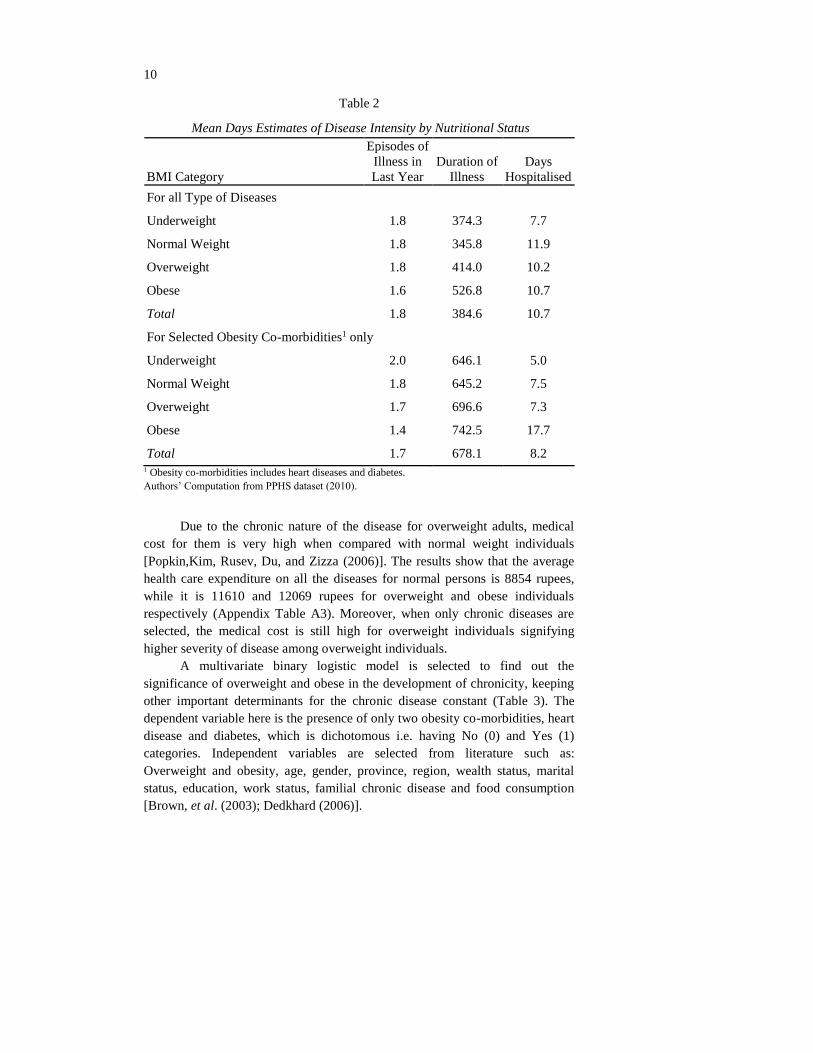
Table 2 provides the differences of mean episodes of illness, mean
duration of illness, and mean hospitalised days between normal and excess
weight individuals. This information is first taken for all the diseases and then
for only those individuals who have the two obesity co-morbidities i.e. heart
diseases and diabetes. According to the results, on average the duration of
illnesses 346 days for normal weight whereas it is 414 and 527 days for the
overweight and obese. These differences further become prominent when only
obesity co-morbidities are selected (Table 2).
The results for the mean hospitalised days do not show any prominent
difference when all the diseases are covered but the results for chronic patients
show a particular trend. It can be seen from the table that the chronic patients
who are obese stay hospitalised for 17 days on average. Conversely, the chronic
patients who have normal weight spend only 8 days on average in hospital,
showing a huge difference in the length of stay between obese and non-obese
patients (Table 2). Only the results of episodes of illness are in favour of obese
individuals as they report fewer episodes of illness compared to normal weight
individuals.
10
Table 2
Mean Days Estimates of Disease Intensity by Nutritional Status
BMI Category
Episodes of
Illness in
Last Year
Duration of
Illness
Days
Hospitalised
For all Type of Diseases
Underweight 1.8 374.3 7.7
Normal Weight 1.8 345.8 11.9
Overweight 1.8 414.0 10.2
Obese 1.6 526.8 10.7
Total 1.8 384.6 10.7
For Selected Obesity Co-morbidities1 only
Underweight 2.0 646.1 5.0
Normal Weight 1.8 645.2 7.5
Overweight 1.7 696.6 7.3
Obese 1.4 742.5 17.7
Total 1.7 678.1 8.2 1 Obesity co-morbidities includes heart diseases and diabetes.
Authors’ Computation from PPHS dataset (2010).
Due to the chronic nature of the disease for overweight adults, medical
cost for them is very high when compared with normal weight individuals
[Popkin,Kim, Rusev, Du, and Zizza (2006)]. The results show that the average
health care expenditure on all the diseases for normal persons is 8854 rupees,
while it is 11610 and 12069 rupees for overweight and obese individuals
respectively (Appendix Table A3). Moreover, when only chronic diseases are
selected, the medical cost is still high for overweight individuals signifying
higher severity of disease among overweight individuals.
A multivariate binary logistic model is selected to find out the
significance of overweight and obese in the development of chronicity, keeping
other important determinants for the chronic disease constant (Table 3). The
dependent variable here is the presence of only two obesity co-morbidities, heart
disease and diabetes, which is dichotomous i.e. having No (0) and Yes (1)
categories. Independent variables are selected from literature such as:
Overweight and obesity, age, gender, province, region, wealth status, marital
status, education, work status, familial chronic disease and food consumption
[Brown, et al. (2003); Dedkhard (2006)].

11
Table 3
Result of Binary Logistic Regression for Determinants of
Obesity Co-morbidities
Explanatory Variables B Coefficient Significance Value Odd Ratio
Overweight (BMI 25-29.9) Adults1 0.381* 0.00 1.464
Obese (BMI=> 30) Adults 0.593* 0.00 1.810
Age (in single years) 0.036* 0.00 1.036
Female Adults2 0.154 0.33 1.167
Province – Sindh3 0.222* 0.05 1.249
Province – KPK 0.761* 0.00 2.141
Province – Balochistan –0.590* 0.00 0.554
Rural Residents4 –0.539* 0.00 0.583
Poor Wealth Status5 –0.337* 0.02 0.714
Currently Married6 0.530* 0.03 1.699
Separated/Divorced/Widowed 0.527 0.06 1.694
Education (in Single Years) 0.024 0.12 1.024
Work Status – Students7 –0.508 0.38 0.601
Work Status –Other not in Labour Force –0.380 0.08 0.684
Work Status – Unemployed –0.351 0.33 0.704
Work Status –Non-manual Workers –0.030 0.92 0.970
Work Status –Manual Workers –0.263 0.08 0.769
Consumption of Grains (in kg) –0.007 0.39 0.993
Consumption of Pulses (in kg) –0.534 0.07 0.586
Consumption of Oil (in Litres) 0.061 0.80 1.063
Consumption of Dairy Products (in Litres) –0.007 0.70 0.993
Consumption of Meat (in kg) 0.208 0.20 1.231
Consumption of Eggs (in Numbers) 0.023 0.58 1.023
Consumption of Soft Drinks (in Numbers) 0.099 0.25 1.104
Consumption of Sugar (in kg) –0.047 0.72 0.954
Consumption of Vegetables and Fruits (in kg) –0.047 0.47 0.954
Number of Family Members with Co-morbidity 0.475* 0.00 1.607
Constant –3.485* 0.00 0.031
Model Chi-square 495.280
Model Significance 0.00
Log likelihood 3237.208
Cox and Snell R2 0.121
Nagelkerke R2 0.195
Predicted Percentage 82.1
Reference Categories: 1Adults with BMI<25, 2Male adults, 3Adults in Punjab province, 4Urban
residents, 5Adults of non- poor wealth status, 6Adults who are never married, 7Housewives.
*Indicates significance of a variable; Variables in Continuous form are in Italics.
Authors’ Computation from PPHS dataset, 2010.
12
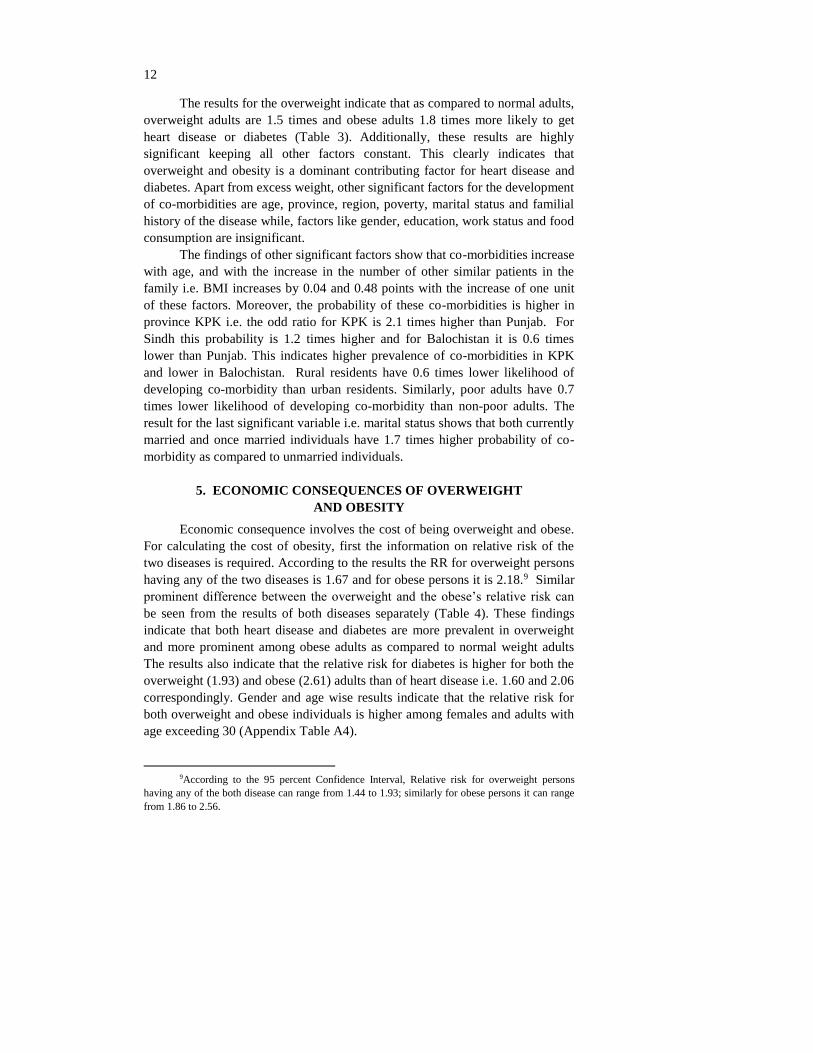
The results for the overweight indicate that as compared to normal adults,
overweight adults are 1.5 times and obese adults 1.8 times more likely to get
heart disease or diabetes (Table 3). Additionally, these results are highly
significant keeping all other factors constant. This clearly indicates that
overweight and obesity is a dominant contributing factor for heart disease and
diabetes. Apart from excess weight, other significant factors for the development
of co-morbidities are age, province, region, poverty, marital status and familial
history of the disease while, factors like gender, education, work status and food
consumption are insignificant.
The findings of other significant factors show that co-morbidities increase
with age, and with the increase in the number of other similar patients in the
family i.e. BMI increases by 0.04 and 0.48 points with the increase of one unit
of these factors. Moreover, the probability of these co-morbidities is higher in
province KPK i.e. the odd ratio for KPK is 2.1 times higher than Punjab. For
Sindh this probability is 1.2 times higher and for Balochistan it is 0.6 times
lower than Punjab. This indicates higher prevalence of co-morbidities in KPK
and lower in Balochistan. Rural residents have 0.6 times lower likelihood of
developing co-morbidity than urban residents. Similarly, poor adults have 0.7
times lower likelihood of developing co-morbidity than non-poor adults. The
result for the last significant variable i.e. marital status shows that both currently
married and once married individuals have 1.7 times higher probability of co-
morbidity as compared to unmarried individuals.
5. ECONOMIC CONSEQUENCES OF OVERWEIGHT
AND OBESITY
Economic consequence involves the cost of being overweight and obese.
For calculating the cost of obesity, first the information on relative risk of the
two diseases is required. According to the results the RR for overweight persons
having any of the two diseases is 1.67 and for obese persons it is 2.18.9 Similar
prominent difference between the overweight and the obese’s relative risk can
be seen from the results of both diseases separately (Table 4). These findings
indicate that both heart disease and diabetes are more prevalent in overweight
and more prominent among obese adults as compared to normal weight adults
The results also indicate that the relative risk for diabetes is higher for both the
overweight (1.93) and obese (2.61) adults than of heart disease i.e. 1.60 and 2.06
correspondingly. Gender and age wise results indicate that the relative risk for
both overweight and obese individuals is higher among females and adults with
age exceeding 30 (Appendix Table A4).
9According to the 95 percent Confidence Interval, Relative risk for overweight persons
having any of the both disease can range from 1.44 to 1.93; similarly for obese persons it can range
from 1.86 to 2.56.

13
Table 4
Relative Risks with 95 percent Confidence Intervals (CI) and PAFs of Selected
Obesity Co-morbidities for Overweight and Obese Adults
Diseases
Relative Risks PAFs
Overweight Obesity Overweight Obesity Total
Heart Disease 1.60 (1.34 - 1.90)2 2.06 (1.70 - 2.50) 11.2 8.5 19.6
Diabetes 1.93 (1.39 - 2.69) 2.61 (1.81 - 3.76) 16.5 12.3 28.7
Any disease 1.67 (1.44 - 1.93) 2.18 (1.86 - 2.56) 12.4 9.3 21.7 1Any disease refers to any of the heart disease or diabetes. 2CI are shown in brackets.
PAFs are converted into percentages by multiplying with 100.
Authors’ Computation from PPHS dataset (2010).
Through estimated relative risks, Population Attributable Fractions are
calculated using the formula mentioned in the methodology chapter.10 PAFs are
estimated to see what proportion of the disease is caused by overweight and
obesity. The results show that 11 percent of overall heart disease in the adult
population is caused by overweight, while 9 percent is due to obesity, summing
up to 20 percent of heart disease attributable to overweight and obesity.
Similarly for diabetes, 17 percent of the disease is caused by overweight and 12
percent is due to obesity, totalling 29 percent due to diabetes (Table 4).
The findings show that relative risk is higher for obesity than for
overweight; here, PAF percentages are higher in overweight than in obese. This
higher proportion of the diseases attributable to overweight than obesity is due
to high prevalence of overweight in population. The findings also indicate that
excess weight is a more dominant risk factor for diabetes than for heart disease.
These results are consistent with that of the literature [Birmingham, et al.
(1999)]. Overall, for both the diseases, 22 percent of the disease is attributable to
excess weight which is a very high proportion (Table 4). PAF percentages, when
seen for both genders separately, show that disease burden due to excess weight
is higher for females than for males for both the diseases (Appendix Table A5).
Results for disease cost show that the average out of pocket medical
expense for diabetes is 19364 rupees, while, the average indirect medical cost
i.e. transportation cost, is 117 rupees; a total of 19481 rupees of direct cost.
Similar cost for heart diseases is Rs 13685 and 125 respectively, a total of Rs
13810 (Table 5). This shows a higher average direct cost for diabetes; however,
the total cost is higher for heart diseases. The reason for this higher total cost is
higher prevalence for heart diseases than diabetes in the population. Yet, the
results of average cost show that diabetes is a more costly disease than heart
diseases. Similar results can be seen in international literature [Wolf and Colditz
(1998); Pitayatienanan, et al. (2014)].
10Formula for PAF =
𝑃(𝑅𝑅−1)
[𝑃(𝑅𝑅−1)+1] ; which is later converted to percentages by multiplying with 100.

14
The findings also suggest that all the cost categories are higher for
diabetes as compared to heart diseases. A similar trend can be seen for average
productivity cost which is also higher for diabetes (Table 5). Moreover, results
for total (both direct and indirect) average cost are 144255 rupees for diabetes
and 68155 rupees for heart diseases; making the average total cost of 86478
rupees for both diseases per annum.
Table 5
Annual Cost (Total and Average) Attributable to Overweight and
Obesity for year 2010, in Rupees
Disease by Cost
Total Disease
Cost
Cost Attributable to
Overweight
Cost Attributable to
Obesity
Sum of Overweight
and Obesity Cost
Total Average Total Average Total Average Total Average
Heart Disease
Direct Medical Cost 11,263,051 13685 1,258,083 1529 952,854 1158 2,210,937 2686
Indirect Medical Cost1 102,639 125 11,465 14 8,683 11 20,148 24
Direct Cost 11,365,690 13810 1,269,548 1543 961,537 1168 2,231,085 2711
Indirect Cost 44,726,048 54345 4,995,900 6070 3,783,824 4598 8,779,723 10668
Total Cost 56,091,738 68155 6,265,447 7613 4,745,361 5766 11,010,808 13379
Diabetes
Direct Medical Cost 5,053,922 19364 831,876 3187 619,611 2374 1,451,486 5561
Indirect Medical Cost 30,542 117 5,027 19 3,744 14 8,772 34
Direct Cost 5,084,464 19481 836,903 3207 623,355 2388 1,460,258 5595
Indirect Cost 32,566,172 124775 5,360,392 20538 3,992,613 15297 9,353,005 35835
Total Cost 37,650,636 144255 6,197,295 23744 4,615,968 17686 10,813,263 41430
Any Disease
Direct Medical Cost 16,316,973 15053 2,089,958 4716 1,572,465 3532 3,662,423 8248
Indirect Medical Cost 133,181 123 16,492 33 12,428 25 28,920 58
Direct Cost 16,450,154 15175 2,106,450 4749 1,584,893 3557 3,691,343 8306
Indirect Cost 77,292,220 71303 10,356,291 26608 7,776,436 19895 18,132,728 46503
Total Cost 93,742,374 86478 12,462,742 31357 9,361,329 23452 21,824,071 54809
1Indirect medical cost includes transportation cost only.
Authors’ Computation from PPHS dataset, 2010.
Among these total and average costs, the proportion of cost attributable to
overweight and obesity is calculated by multiplying total cost with PAFs. The
results show that for heart diseases on average Rs 1543 is attributable to
overweight and Rs 1168 to obesity. The total, Rs 2711 as part of Rs 13810 of
average direct cost is attributable to excess weight. Similarly in total average direct
cost of Rs 19481for diabetes, 5595 rupees is attributable to excess weight. Similar
results can be seen for indirect cost in Table 5.6. Overall, amongst Rs 86478 of
total average cost for both diseases, rupees 54809 are attributable to excess weight.

15
It is also interesting to see the share of the average costs in the mean
income of an individual. According to PPHS data, the yearly mean income of an
individual in Pakistan is 1,36,359 rupees [PPHS Dataset (2010)]. Conforming to
it, the share of direct cost of both co-morbidities comes to 11 percent11 of the
income. Likewise, the direct cost of both co-morbidities attributable to
overweight and obesity is 6 percent12 of the income of an individual. The
breakdown of average direct and indirect cost for both diseases attributable to
overweight and obesity is derived according to the wealth status. The results
show greatly reduced cost, both direct and indirect, in poor as compared to non-
poor categories (Appendix Table A6).
The above cited costs attributable to overweight and obesity are
calculated from the sampled population of a nationally representative data on
which the average costs are scaled up so that the total cost due to excess weight
for both diseases can be estimated for the whole population. For undertaking this
exercise, certain information like total population, national health expenditure,
private health expenditure and Gross Domestic Product of Pakistan, is retrieved
from external sources (Table 6). Average costs attributable to obesity and
prevalence of diseases are extracted from the survey data.
The results show that among the total population of Pakistan of age 15
years and above13 i.e. 112 millions, 16 million are suffering from heart diseases
and 5 million from diabetes. This sick population is then multiplied by the
average direct, indirect and total cost of heart diseases and diabetes which is
attributable to overweight and obesity. The results demonstrate that in Pakistan
the direct out of pocket cost which is attributable to excess weight incurred by
the patients of heart disease is 44 million rupees, while, for diabetes it is 28
million rupees. A total of 72 million rupees’ direct cost on both diseases is due
to excess weight (Table 6). Results of sensitivity analysis show that this direct
cost can be as low as 43 billion rupees and as high as 99 billion (Appendix Table
A7). However, the productivity losses due to both of these diseases are
estimated up to 356 million rupees as a result of excess weight. Sensitivity
analysis shows that it can decrease up to 217 billion and increase up to 482
billion, with the variation in relative risks by different percentages.14 Therefore,
the total direct and indirect cost of both illnesses attributable to excess weight is
429 million rupees.
11Share is calculated as: (15175/136359)*100. 12Share is calculated as: (8306/136359)*100. 13Adult population 15+ of Pakistan is taken and children are excluded because the present
study is on adults of age 18+. Data of total population was not available for age 18+ that is why age
15+ is taken. 14Detailed results for sensitivity analysis i.e. variations in relative risk values, population
attributable fractions percentages, average and total costs, can be seen in Table A7 in Appendix.

16
Table 6
Scaling-up of Annual Cost Attributable to Overweight and Obesity to
the Whole Population (in Rupees)
Average Cost1 Percent/
Number
Direct cost of heart disease
due to overweight
1543 Prevalence of heart Disease2 14.6%
Direct cost of heart disease
due to obesity
1168 Prevalence of diabetes2 4.5%
Indirect cost of heart disease
due to overweight
6070 Population (age 15+) of Pakistan3 112,547,050
Indirect cost of heart disease
due to obesity
4598 Population with heart disease4 16,431,869
Direct cost of diabetes due to
overweight
3207 Population with diabetes4 5,064,617
Direct cost of diabetes due to
obesity
2388 National health expenditure5 448,403,000,
000
Indirect cost of diabetes due
to overweight
20538 Private Out of pocket
expenditure5
271,757,000,
000
Indirect cost of diabetes due
to obesity
15297 Gross Domestic Product [GDP]3 18,276,440,
000,000
Scaled-up Total
Cost6
Percent7
Direct cost of heart disease
due to excess weight
44,545,438,925 Share of direct cost in total cost 16.9%
Indirect cost of heart disease
due to excess weight
175,294,366,558 Share of indirect cost in total cost 83.0%
Direct cost of diabetes due to
excess weight
28,335,813,985 Share of direct cost of both
diseases due to excess weight in
national health expenditure
16.2%
Indirect cost of diabetes due
to excess weight
181,491,911,049 Share of direct cost of both
diseases due to excess weight in
private out of pocket expenditure
26.8%
Direct cost for both diseases
due to excess weight
72,881,252,911 Share of direct cost of both
diseases due to excess weight in
GDP
0.40%
Indirect cost for both diseases
due to excess weight
356,786,277,607 Share of indirect cost of both
diseases due to excess weight in
GDP
1.95%
Total cost for both diseases
due to excess weight
429,667,530,518 Share of total cost of both diseases
due to excess weight in GDP
2.35%
1 Average cost is extracted from data, taken from Table 5. 2 Prevalence of heart diseases and diabetes are extracted from the data, taken from Table 1. 3Taken from Economic Survey of Pakistan (2014), and value is for year 2010 at market prices. 4 Population of Pakistan multiplied with the prevalence of diseases. 5 Expenditures are taken from National Health Accounts of Pakistan, for year 2010. 6 Required average costs are multiplied with the required population of patients; direct and indirect
costs are added in the end to get total cost. 7 Share of direct/indirect costs are calculated by divided with total cost and multiplied with 100;
shares in national expenditures and GDP are calculated by multiplying it with costs.
Authors’ Computation from PPHS dataset, 2010.

17
Productivity losses are a massive burden as cost of illness when compared
with the direct cost i.e. the share of direct cost is 17 percent and that of indirect
cost is 83 percent. These huge differences between direct and indirect cost are
also consistent with the present literature [Popkin, et al. (2006)]. However, some
literature also shows contradictory results by estimating lesser indirect than
direct cost [Sander and Bergemann (2003); Moffat, et al. (2011); Pitayatienanan,
et al. (2014)]. This huge amount of indirect cost might be overestimated due to
two reasons. First, due to the self-reported nature of days lost due to illness
which is measured in terms of perceived impairment reported by the patient.
Individuals suffering from illness may claim much higher impaired days for
their illness. Secondly, using the human capital approach to measure indirect
cost yields potential productivity loss, not the actual loss, because it also
estimates non-paid, informal or household work.
To assess the disease burden due to excess weight, its share has been
measured in both the national and private health expenditure of Pakistan. The
share of only direct cost is seen here, because in the national figures indirect cost
is not captured. The results reveal that the share of direct cost for heart diseases
and diabetes due to excess weight in national total health expenditure is 16
percent. Similarly, among the national private out of pocket expenses, 27
percent is the share of direct cost on heart diseases and diabetes.. The share in
GDP for direct cost is 0.4 percent and 1.9 percent for indirect cost; that is 2.3
percent of the total cost for the two diseases due to excess weight (Table 6).
6. CONCLUSION
Body weight is strongly co-related with health. According to evidence
available from the literature, there is a negative association between weight and
health. Results show that excess weight increases disease prevalence and its
intensity when duration of illness increases as well as hospitalised days.
Overweight and obesity is a major risk factor for certain chronic diseases. The
prevalence of heart diseases and diabetes is higher in overweight and obese
individuals as compared to normal weight individuals. It is estimated that 22
percent portion of these two diseases can be attributed to overweight and obesity.
Results also show that a sizeable proportion of illness cost incurred by the
individuals for these co-morbidities is attributed to overweight and obesity. The
total direct cost for both diseases is estimated at 72 billion rupees per annum due
to excess weight, while the indirect cost estimate is 356 billion rupees in
Pakistan. The share of direct cost for both diseases due to excess weight is
extracted from the National Health Expenditures which is 16percent. This share
is 26 percent for private out of pocket expenditure and 0.4 percent of the GDP
for Pakistan. These results indicate a huge disease burden attributed to
overweight and obesity. By preventing overweight and obesity we can both
lower the disease and cost burden on overweight individuals.

18
The study provides a comprehensive understanding of the health risks of
overweight and obesity to adults in Pakistan. It also gives evidence of a huge economic
burden due to this health problem. Certain behavioural changes are needed to avoid the
health problems related to overweight and obesity. Health professionals should stress
on lifestyle changes in their patients suffering from weight problems or with other co-
morbidities related to it. Moreover, insurance schemes should be launched to lighten
the burden of treatment cost on the patients through involvement of the health sector in
prevention of obesity and overweight problem.
APPENDIX
Table A1
Mileage Allowances for Government Employees
(i) Personal Car/Taxi Rs. 10/- per k.m.
(ii) Motor Cycle/Scooter Rs. 4/- per k.m.
(iii) Bicycle/Animal Back Rs. 2/- per k.m.
(iv) Public Transport Rs. 2.5/- per k.m.
Federal Government of Pakistan, 2010.
Table A2
Formula, Calculation Process and Interpretation for Relative Risk
Table A3
Mean Health Care Expenditure (in Rupees) on Illness by Nutritional Status
BMI Category
Expenditure on
consultation
Expenditure on
medicines
Expenditure on
hospitalisation/ lab tests
Total
expenditure
For all type of diseases
Underweight 1133 6547 1125 8804 Normal weight 1186 6702 967 8854
Overweight 1438 8780 1392 11610
Obese 2189 8226 1655 12069 Total 1345 7298 1157 9800
For selected obesity co-morbidities only
Underweight 3048 10608 1834 15490 Normal weight 1950 8070 1253 11273
Overweight 2081 13319 2206 17605
Obese 4014 10695 2645 17354 Total 2484 10293 1843 14619

19
Table A4
Relative Risks for Selected Obesity Co-morbidities for Overweight and Obese
Adults by Age and Gender and the Confidence Intervals for Relative Risks
Diseases/Age/Gender Overweight Obesity
Males
Heart Disease
18-29 1.92 (0.66 - 5.63) −
30-49 1.64 (0.85 - 3.16) 2.30 (0.95 - 5.59)
50+ 1.18 (0.80 - 1.76) 1.54 (0.93 - 2.57)
Total 1.46 (1.05 - 2.02) 1.81 (1.15 - 2.84)
Diabetes
18-29 − −
30-49 2.46 (0.87 - 6.92) −
50+ 1.47 (0.74 - 2.91) 2.17 (0.93 - 5.04)
Total 1.92 (1.09 - 3.39) 2.01 (0.86 - 4.67)
Any Disease
18-29 1.78 (0.61 - 5.18) −
30-49 1.84 (1.08 - 3.14) 1.72 (0.73 - 4.10)
50+ 1.25 (0.91 - 1.73) 1.70 (1.15 - 2.51)
Total 1.56 (1.19 - 2.05) 1.86 (1.27 - 2.70)
Females
Heart Disease
18-29 0.50 (0.18 - 1.37) 1.24 (0.47 - 3.30)
30-49 1.24 (0.84 - 1.84) 2.61 (1.88 - 3.61)
50+ 1.76 (1.37 - 2.27) 1.35 (0.97 - 1.88)
Total 1.64 (1.33 - 2.01) 2.06 (1.65 - 2.57)
Diabetes
18-29 − 3.26 (0.37 - 28.51)
30-49 1.38 (0.65 - 2.95) 2.68 (1.36 - 5.27)
50+ 1.77 (1.09 - 2.87) 1.89 (1.09 - 3.28)
Total 1.94 (1.29 - 2.91) 2.74 (1.80 - 4.18)
Any Disease
18-29 0.46 (0.17 - 1.24) 1.42 (0.59 - 3.38)
30-49 1.27 (0.91 - 1.78) 2.62 (1.98 - 3.46)
50+ 1.77 (1.44 - 2.16) 1.48 (1.15 - 1.92)
Total 1.70 (1.43 - 2.02) 2.21 (1.84 - 2.64)

20
Table A5
Population Attributable Fractions (in Percentages) for Diseases for
Overweight and Obese Adults by Gender
Diseases/Gender Overweight Obesity Total
Total
Heart Disease 11.2 (6.7 - 15.9) 8.5 (5.7 - 11.6) 19.6 (12.4 - 27.5)
Diabetes 16.5 (7.6 - 26.3) 12.3 (6.5 - 19.4) 28.7 (14.2 - 45.7)
Any Disease 12.4 (8.5 - 16.5) 9.3 (6.9 - 12.0) 21.7 (15.5 - 28.4)
Male
Heart Disease 8.8 (1.1 - 17.7) 6.6 (1.3 - 13.8) 15.4 (2.4 - 31.5)
Diabetes 16.2 (1.8 - 33.5) 8.1 (0 - 24.2) 24.3 (1.8 - 57.8)
Any Disease 10.6 (3.9 - 18.1) 6.9 (2.3 - 12.9) 17.5 (6.2 - 31.0)
Female
Heart Disease 11.8 (6.5 - 17.6) 8.5 (5.4 - 12.0) 20.3 (11.9 - 29.6)
Diabetes 16.5 (5.8 - 28.7) 13.2 (6.5 - 21.7) 29.7 (12.3 - 50.4)
Any disease 12.9 (8.2 - 17.8) 9.5 (6.8 - 12.5) 22.3 (15.0 - 30.3)
Note: Lower and higher limited of PAFs according to the CI of relative risks are given in brackets.
Table A6
Annual Average cost (in Rupees) Attributable to Overweight and
Obesity by Wealth Status
Average Cost
Total Non-poor Poor
Direct cost of heart disease due to overweight 1543 1627 898
Direct cost of heart disease due to obesity 1168 1232 680
Indirect cost of heart disease due to overweight 6070 6523 2306
Indirect cost of heart disease due to obesity 4598 4941 1747
Direct cost of diabetes due to overweight 3207 3308 2287
Direct cost of diabetes due to obesity 2388 2464 1704
Indirect cost of diabetes due to overweight 20538 19169 5500
Indirect cost of diabetes due to obesity 15297 14278 4097

21
Table A7
Results of Sensitivity Analysis Parameters by
Disease
20%
decrease
15%
decrease
10%
decrease
5%
decrease Original
5%
increase
10%
increase
15%
increase
20%
increase
Heart Disease
RR overweight 1.28 1.36 1.44 1.52 1.60 1.68 1.76 1.84 1.92
RR obesity 1.65 1.75 1.86 1.96 2.06 2.17 2.27 2.37 2.48
PAF overweight 5.5% 8.4% 8.4% 9.8% 11.2% 12.5% 13.7% 15.0% 16.2%
PAF obesity 5.4% 6.9% 6.9% 7.7% 8.5% 9.2% 9.9% 10.7% 11.4%
Average direct cost
overweight 762 966 1164 1356 1543 1723 1899 2069 2235
Average indirect
cost overweight 2998 3802 4581 5337 6070 6782 7472 8141 8795
Average direct cost
obesity 739 850 958 1064 1168 1272 1373 1472 1571
Average indirect
cost obesity 2910 3343 3769 4188 4598 5005 5404 5793 6182
Diabetes
RR overweight 1.55 1.64 1.74 1.84 1.93 2.03 2.13 2.22 2.32
RR obesity 2.09 2.22 2.35 2.48 2.61 2.74 2.87 3.00 3.13
PAF overweight 10.4% 13.5% 13.5% 15.0% 16.5% 17.9% 19.2% 20.5% 21.8%
PAF obesity 8.6% 10.5% 10.5% 11.4% 12.3% 13.1% 14.0% 14.8% 15.6%
Average direct cost
overweight 2017 2330 2633 2925 3207 3479 3744 3997 4246
Average indirect
cost overweight 12917 14926 16865 18736 20538 22285 23980 25604 27196
Average direct cost
obesity 1680 1863 2042 2217 2388 2558 2722 2883 3043
Average indirect
cost obesity 10763 11932 13077 14200 15297 16383 17435 18467 19489
Any Disease
RR overweight 1.34 1.42 1.50 1.59 1.67 1.75 1.84 1.92 2.00
RR obesity 1.75 1.85 1.96 2.07 2.18 2.29 2.40 2.51 2.62
PAF overweight 6.6% 9.6% 9.6% 11.0% 12.4% 13.7% 15.0% 16.3% 17.5%
PAF obesity 6.1% 7.7% 7.7% 8.5% 9.3% 10.1% 10.9% 11.6% 12.3%
Average direct cost
overweight 2779 3297 3797 4281 4749 5203 5643 6066 6481
Average indirect
cost overweight 15915 18728 21446 24073 26608 29067 31451 33745 35991
Average direct cost
obesity 2420 2712 3000 3281 3557 3830 4095 4355 4614
Average indirect
cost obesity 13673 15275 16846 18388 19895 21388 22839 24260 25671
Direct Scaled-up
Cost
43,393,45
6,829
51,072,74
8,136
58,543,46
7,134
65,814,56
2,639
72,881,25
2,911
79,795,54
8,679
86,511,90
7,732
93,031,17
6,344
99,454,04
3,487
Indirect Scaled-up
Cost
217,007,4
52,743
253,434,2
02,161
288,855,3
35,877
323,314,6
71,238
356,786,2
77,607
389,526,8
55,337
421,321,8
61,085
452,162,8
59,269
482,544,8
92,490
Share of Direct
Cost in Health
Expenditure
9.7% 11.4% 13.1% 14.7% 16.3% 17.8% 19.3% 20.7% 22.2%
REFERENCES
Ahmed, J., A. Laghari, M. Naseer, and V. Mehraj (2013) Prevalence of and
Factors Associated with Obesity among Pakistani School Children: A
School-based, Cross-sectional Study. Eastern Mediterranean Health Journal
19:3, 242–247.
Birmingham, C. L., J. L. Muller, A. Palepu, J. J. Spinelli, and A. H. Anis
(1999) The Cost of Obesity in Canada. Canadian Medical Association
Journal (CMJA) 160:4, 483–88.

22
Blaylock, J., D. Smallwood, K. Kassel, J. Variyam, and L. Aldrich (1999)
Economics, Food Choices, and Nutrition. Food Polic 24:2-3, 269–286.
Brown, A. F., S. L. Ettner, J. Piette, M. Weinberger, E. Gregg, M. F. Shapiro, A.
J. Karter, M. Safford, B. Waitzfelder, P. A. Prata, and G. L. Beckles (2004)
Socioeconomic Position and Health among Persons with Diabetes Mellitus:
A Conceptual Framework and Review of the Literature. Epidemiologic
Reviews 26, 63–77.
Copper, B. S. and D. P. Rice (1976) The Economic Cost of Illness Revisited.
Social Security Bulletin 39, 21–36.
Daniels, S. R. (2006) The Consequences of Childhood Overweight and Obesity.
The Future of Children 16:1, 47–67.
Dedkhard, S. (2006) Risk Factors of Cardiovascular Disease in Rural Thai
Women (Doctoral dissertation). The University of Arizona: United States.
Retrieved from http://w3.nursing.arizona.edu/Library/Dedkhard_S.pdf
Dennis, B., K. Aziz, L. She, A. Faruqui, C. Davis, T. Manolio, G. Burke, and
S. Aziz (2006) High Rates of Obesity and Cardiovascular Disease Risk
Factors in Lower Middle Class Community in Pakistan: The Metroville
Health Study. Journal of Pakistan Medical Association 56:6, 267–272.
Ezzati, M., H. Martin, S. Skjold, S. V. Hoorn, and C. J. L. Murray (2006)
Trends in National and State-Level Obesity in the USA after Correction for
Self-Report Bias: Analysis of Health Surveys. Journal of the Royal Society
of Medicine 99:5, 250–257.
Finkelstein, E. A., L. C. Fiebelkorn, and G. Wang (2003) National Medical
Spending Attributable to Overweight and Obesity: How Much, and Who’s
Paying? Health Affairs (Millwood), Web Exclusive W3, 219–226.
Grossman, M. (1977) On the Concept of Health Capital and the Demand for
Health. Journal of Political Economy 80, 223–255.
Guo, X., B. A. Warden, S. Paeratakul, and G. A. Bray (2004). Healthy Eating
Index and Obesity. European Journal of Clinical Nutrition 58:1580–1586.
Haslam, D., N. Sattar, and M. Lean (2006) ABC of Obesity: Obesity-Time to
Wake Up. British Medical Journal 333:7569, 640–642.
Hodgson, T. A., and M. R. Meiners (1982) Cost-of-Illness Methodology: A
Guide to Current Practices and Procedures. The Milbank Memorial Fund
Quarterly. Health and Society 60:3, 429–462.
Indrayan, A. (2008) Relative Risk, Odds Ratio, Attributable Risk and Number
Needed to Treat. Medical Biostatistics (2nd Edition). New York: CRC
Press.
Janssen, I. (2012) Health Care Costs of Physical Inactivity in Canadian Adults.
Applied Physiology, Nutrition and Metabolism 37:4, 803–806.
Khan, M. H., H. Khan, G. Sarwar, B. Iftikhar, A. Jan, M. Naimat-ullah, and A.
Gul (2008) Study of Obese Persons Profile at D.I. Khan, NWFP, Pakistan.
Gomal Journal of Medical Sciences 6:2, 77–80.

23
Kinugasa, A., K. Tsunamoto, N. Furukawa, T. Sawada, T. Kusunoki, and N.
Shimada (1984) Fatty Liver and its Fibrous Changes Found in Simple
Obesity of Children. Journal of Pediatric Gastroenterology and Nutrition
3:3, 408–14.
Konnopka, A., M. Bödemann, and H. H. König (2011). Health Burden and
Costs of Obesity and Overweight in Germany.European Journal of Health
Economics: HEPAC. Health Economic in Health and Care 12, 345–352.
Lensberg, B. R., M. F. Drummond, N. Danchenko, N. Despiegel, and C.
Francois (2013) Challenges in Measuring and Valuing Productivity Costs,
and their Relevance in Mood Disorders. Clinico Economics and Outcome
Researc 5, 565–573.
Lim, S.S., et al. (2012) A Comparative Risk Assessment of Burden of Disease
and Injury Attributable to 67 Risk Factors and Risk Factor Clusters in 21
Regions, 1990–2010: A Systematic Analysis for the Global Burden of
Disease Study 2010. Lancet 380:9859, 2224–2260.
Mattke, S., A., Balakrishnan, G. Bergamo, and S. J. Newberry (2007). A Review
of Methods to Measure Health-related Productivity Loss. The American
Journal of Managed Care 13:4, 211–217.
Moffatt, E., L. G. Shack, G. J. Petz, J. K. Sauvé, K. Hayward, and R. Colman
(2011) The Cost of Obesity and Overweight in 2005: A Case Study of
Alberta, Canada. Canadian Journal of Public Health 102:2, 144–148.
Muller-Riemenschneider, F., T. Reinhold, A. Berghofer, and S. N. Willich
(2008) Health-Economic Burden of Obesity in Europe. European Journal of
Epidemiology 23:8, 499–509.
Mushtaq, M. U., S. Gull, U. Shahid, M. M. Shafique, H. M. Abdullah, M. A.
Shad, and A. M. Siddiqui (2011) Family-based Factors Associated with
Overweight and Obesity among Pakistani Primary School Children. Bio
Medical Central Pediatrics 11:114.
National Institute of Population Studies (2013) Nutrition of Children and
Women. In Pakistan Demographic and Health Survey 20012-13 (pp. 163).
Islamabad, Pakistan: National Institute of Population Studies and Macro
International Inc.
Ng, M., et al. (2014) Global, Regional, and National Prevalence of Overweight
and Obesity in Children and Adults during 1980–2013: A Systematic
Analysis for the Global Burden of Disease Study 2013. Lancet 384, 766–81.
Pakistan Bureau of Statistics (2010) National Health Accounts 2009-10.
Pakistan Bureau of Statistics, Government of Pakistan.
Pakistan, Government of (2010) Office Memorandum: Revision of Basic Pay
Scales, Allowances and Pension of Civil Employees of Federal Government,
Government of Pakistan, Finance Division.
Pakistan, Government of (2012) Pakistan Economic Survey, 2011-12. Finance
Division, Economic Advisor’s Wing: Islamabad, Government of Pakistan.

24
Pitayatienanan, P., R. Butchon, J. Yothasamut, W. Aekplakorn, Y.
Teerawattananon, N. Suksomboon, and M. Thavorncharoensap (2014).
Economic Cost of Obesity in Thailand: A Retrospective Cost-of-illness
Study. BMC Health Services Research 14:146.
Popkin, B.M., S. Kim, E. R. Rusev, S. Du, and C. Zizza (2006) Measuring the
Full Economic Cost of Diet, Physical Activity and Obesity Related Chronic
Diseases. Obesity Reviews 7, 271-293.
Rehman, T., Z. Rizvi, U. Siddiqui, S. Ahmad, A. Sophie, M. Siddiqui, O.
Saeed, Q. Kizilbash, A. Shaikh, A. Lakhani, and A. Shakoor (2003) Obesity
in Adolescents of Pakistan. Journal of Pakistan Medical Association 53:7,
315–319.
Rice, D. P. (1967) Estimating the Cost of Illness. American Journal of Public
Health 57:3, 424–440.
Sander, B. and R. Bergemann (2003) Economic Burden of Obesity and Its
Complications in Germany. The European Journal of Health Economics 4:
4, 248–253.
Schmidhuber, J. and P. Shetty (2005) Nutrition Transition, Obesity and Non-
communicable Diseases: Drivers, Outlook and Concerns. SCN News 29, 13–
19. Food and Agriculture Organisation of the UN.
Segel, J. E. (2006) Cost-of-Illness Studies: A Primer. RTI-UNC Centre of
Excellence in Health Promotion Economics, RTI International.
SteniusAarniala, B., T. Poussa, J. Kvarnström, E. Grönlund, M. Ylikahri, and P.
Mustajoki (2000) Immediate and Long Term Effects of Weight Reduction in
Obese People with Asthma: Randomised Controlled Study. British Medical
Journal 320, 827–32.
Tarricone, R. (2006) Cost-of-illness Analysis: What Room in Health
Economics? Health Policy 77, 51–63.
Walter, S. D. (1976) The Estimation and Interpretation of Attributable Risk in
Health Research. Biometrics 32:4, 829–849.
Wolf, A. M. and G. A. Colditz (1998).Current Estimates of the Economic Cost
of Obesity in the United States. Obesity Research 6:2, 97–105.
World Bank (2010) World Bank Databank for Year 2010: Population of
Pakistan (age 15 year and above). The World Bank Group.
World Health Organisation (2000) Obesity: Preventing and Managing the
Global Epidemic. World Health Organisation Technical Report Series, 894:
Geneva.
World Health Organisation (2004) Appropriate Body Mass Index for Asian
Populations and its Implications for Policy and Intervention Strategies.
(Expert Consultation) Lancet 363, 157–63.
World Health Organisation (2014) Global Data base on Body Mass Index. BMI
distribution in Pakistan, 1994.World Health Organisation.