Embed Size (px)
Citation preview

DISCLOSURE APPENDIX CONTAINS ANALYST CERTIFICATIONS AND THE STATUS OF NON-US ANALYSTS. U.S. Disclosure: Credit Suisse does and seeks to do business with companies covered in its research reports. As a result, investors should be aware that the Firm may have a conflict of interest that could affect the objectivity of this report. Investors should consider this report as only a single factor in making their investment decision.
11 November 2010Asia Pacific/Pakistan
Equity ResearchEnergy
Pakistan Energy Sector ASSUMING COVERAGE
To ride on rising power tariffs Figure 1: Tariffs will cover 92% of electricity generation costs by June 2011
0
2
4
6
8
10
12
FY03
FY04
FY05
FY06
FY07
FY08
FY09
FY10
1QFY
11
FY11
Consumer tariff Avg generation costPRs/Kw
Source: Company data, Credit Suisse estimates
■ Tides are turning against circular debt: Circular debt (inter-corporate debt) has blemished the return profile of Pakistan Energy stocks over the past two years. The problem arose when the cash-starved government kept electricity prices below cost recovery levels and delayed payments of subsidies, thus forcing companies to cut payouts. But now, as power tariffs play catch up with electricity generation costs, we believe the circular debt is nearing a conclusion. Hence, we expect energy stocks to gradually return to their historical payout ratios from FY11.
■ Tariffs to increase to cover 92% of costs by June 2011: Having twice missed the deadline to eliminate power subsidies, the IMF has refused to release the remaining tranches of US$3.4 bn under the Stand-By Agreement. The government is now expected to play by IMF’s suggestions and hike tariffs in FY11. Press reports also suggest another 17% tariff hike.
■ Cheapest in the region: Pakistan energy sector companies are among the region’s cheapest. With dividend payments due to gradually normalise from FY11, we expect energy stocks to move to their historical valuation multiples.
■ PSO, PPL and HUBCO top picks: We assume coverage of the Pakistan Energy sector with an OVERWEIGHT; we have OUTPERFORM ratings on PPL (TP PRs246), PSO (TP PRs381) and OGDC (TP PRs 173). We also initiate coverage of Hub Power Company with OUTPERFORM (TP PRs 49). PSO, PPL and HUBCO are trading at a 50-70% discount to regional valuation multiples and are 12-40% below their average P/E, with dividend yields in the range of 5.4-15%.
Research Analysts Raza Rawjani 65 6212 3035

11 November 2010
Pakistan Energy Sector 2
Focus charts and tables Figure 2: Pakistan energy sector’s company profiles Figure 3: Tariffs can rise further; tariffs higher in 2003
Company Profile OGDC Oil & Gas Development Co. (OGDC) is the largest E&P
company in Pakistan accounting for 26% of total production, 40% of reserves (1.6 bn boe) and 35% of awarded acreage.
PPL Pakistan Petroleum is the 2nd largest gas producer in Pakistan accounting for 24% of total gas production and reserves. Recently, the company has increased its exploration activities to replenish its reserves.
PSO Pakistan State Oil (PSO) is the largest OMC in Pakistan, having a market share of 70%.
HUBCO Hub Power Co. (HUBCO), which received the deal of decade award in 1999, is a 1200 MW IPP. Two new projects, a 214 MW oil fired IPP and 84MW hydro IPP are also in pipeline.
0.000
0.002
0.004
0.006
0.008
0.010
0.012
0.014
FY03
FY04
FY05
FY06
FY07
FY08
FY09
FY10
1QFY
11
FY11
E
(%)Tariffs as % age GDP per capita were higher in 2003 than what theywill be in 2011
Source: Company data, Credit Suisse estimates Source: Company data, Credit Suisse estimates
Figure 4: Net circular debt during the past two years Figure 5: Div. yields to rise after circular debt resolution
-
50
100
150
200
250
Oct-0
8
Mar-0
9
Jun-0
9
Jul-0
9
Aug-
09
Sep-
09
Oct-0
9
Nov-0
9
Dec-0
9
Jan-1
0
Feb-
10
Mar-1
0
Apr-1
0
July-
10
Sept-
10
PRs bn1st TFC of PRs80bn 2nd TFC of PRs 80bn
+ Auto. Tariff adjustments start
Tariffs increased 18%
Tariffs increased 6%Tariffs increased 12% Tariffs increased 7.6%
-
5
10
15
20
25
FY08 FY09 FY10 FY11E FY12E FY13E
PSO PPL OGDC HUBC
%
Source: Company data Source: Company data, Credit Suisse estimates
Figure 6: Valuation matrix Mkt cap Share price Upside P/E (x) P/B (x) ROE (%) Div. yield (%) (US$ mn) Rating current target (%) FY11E FY12E FY11E FY12E FY11E FY12E FY11E FY12E
PPL.KA 1,741 O 193.0 246 27 7.3 7.1 2.3 2.0 35 30 5.7 7.3PSO.KA 1,007 O 281.7 381 35 5.2 4.3 1.3 1.1 28 29 6.7 16.3HPWR.KA 742 O 33.5 49 46 6.2 4.9 1.3 1.2 21 25 14.9 16.9OGDC.KA 7,337 O 158.1 173 9 10.4 9.6 3.4 2.9 37 33 3.9 6.3Source: Credit Suisse estimates
11 November 2010
Pakistan Energy Sector 3
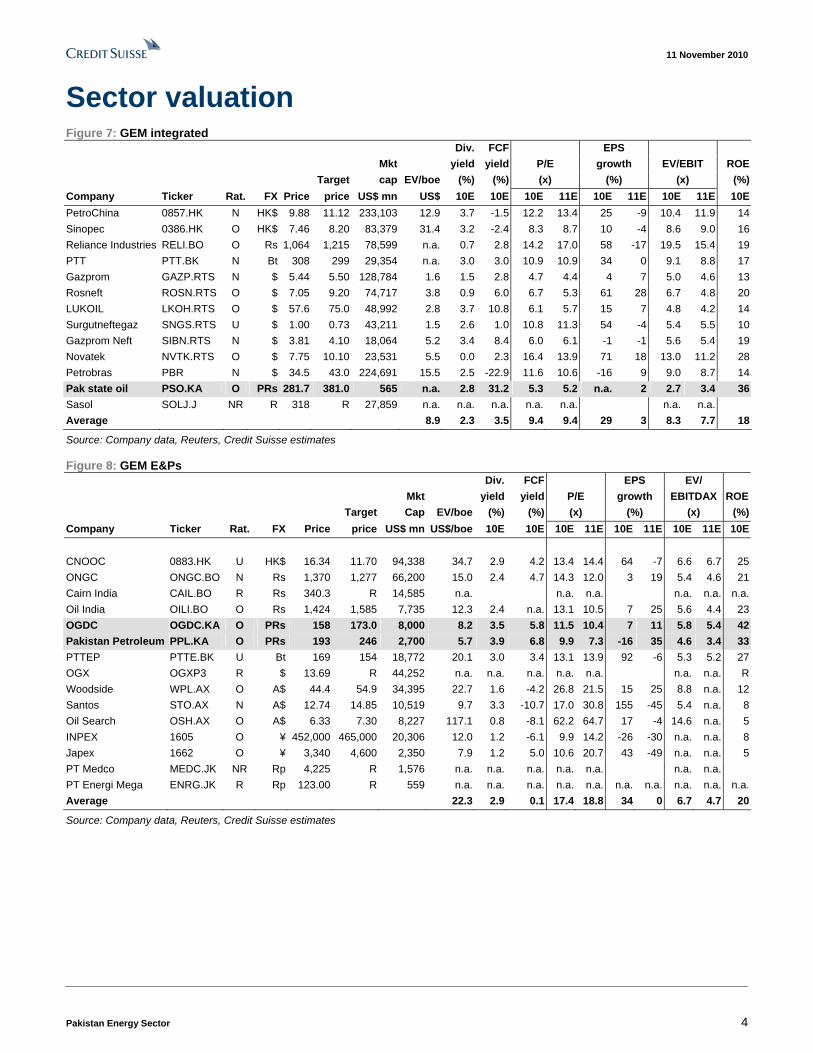
To ride on rising power tariffs Circular debt blemished the return profile of Pakistan energy stocks as it dented the payout profiles of most companies. But now, as power tariffs play catch up with electricity generation costs, we believe circular debt is past its tipping point and is finally dwindling toward its end. Thus, we expect energy stocks to gradually return to their historical payout ratios starting FY11.
Likely resolution of circular debt in FY11 Since Pakistan’s participation in the IMF programme, electricity tariffs have increased 58% and now cover for 75% of all generation costs. With the IMF insisting upon sealing the gap between electricity tariffs and generation costs and with fiscal health of the government too fragile to carry on with electricity subsidies, we believe the government is left with no option but to increase electricity tariffs in FY11 by 15-20%. This should: 1) restrict accumulation of fresh circular debt to manageable levels, 2) limit electricity differentials in FY11 to PRs130 bn – almost half of that in FY10, 3) bring tariffs to a level where they cover 90-95% of all generation costs by June FY11, and 4) ensure long-term sustainability of the sector. Pakistan’s intention of entering into another IMF programme once the current one ends puts further pressure on the government to abide by IMF’s conditions of eliminating electricity subsidies by FY11. The whole scenario benefits the energy sector the most as improving cash flows due to higher tariffs will allow resumption of routine operations and bring back the high payouts.
Rising tariffs to bring back dividends The energy sector companies emerge as the biggest beneficiary of the electricity tariff increase, as improving cash profile of the sector will bring back the historical payouts. During FY09-10, part payments on account of electricity subsidies (the total electricity subsidy during FY09-10 was PRs430 bn, but the government paid only 60% of it) created a cash draught in sector. The energy sector managed the cash deficit by delaying payments to upstream companies, resorting to short-term borrowing and decreasing payouts – which declined by 28-66% during the period. But now, as electricity tariffs play catch up with generation costs, we believe payouts will gradually rise back to the historical average of 50-80% starting FY11-12.
Assuming coverage with an OVERWEIGHT We assume coverage of the Pakistan energy sector with an OVERWEIGHT stance and with OUTPERFORM ratings on PPL (revised target price of PRs 246), PSO (revised target price of PRs381) and OGDC (a revised target price of PRs173). We also initiate coverage of Hub Power Company with an OUTPERFORM rating (target price PRs 49). Pakistan energy sector companies are among the cheapest in the region. During FY09-10, absence of high payouts was the restraining factor for the sector to trace back to historical valuation multiples. As the dividend payments gradually normalise from FY11, we expect energy stocks to move to their historical valuation multiples.
PSO, PPL and HUBCO are our top picks Our top picks in the the sector are PSO, PPL and HUBCO. The stocks are trading at 50-70% discount to regional valuation multiples and 12-40% below their average P/Es, with dividend yields in the range of 5.4-15%.
Increase in electricity tariffs to restrict circular debt growth in FY11
Energy companies emerge as the biggest beneficiary of these tariff hikes as improving cash flows of the sector will make space for routine operations and higher payouts
Assuming coverage with OVERWEIGHT. PSO, PPL and HUBCO are our top picks
11 November 2010
Pakistan Energy Sector 4
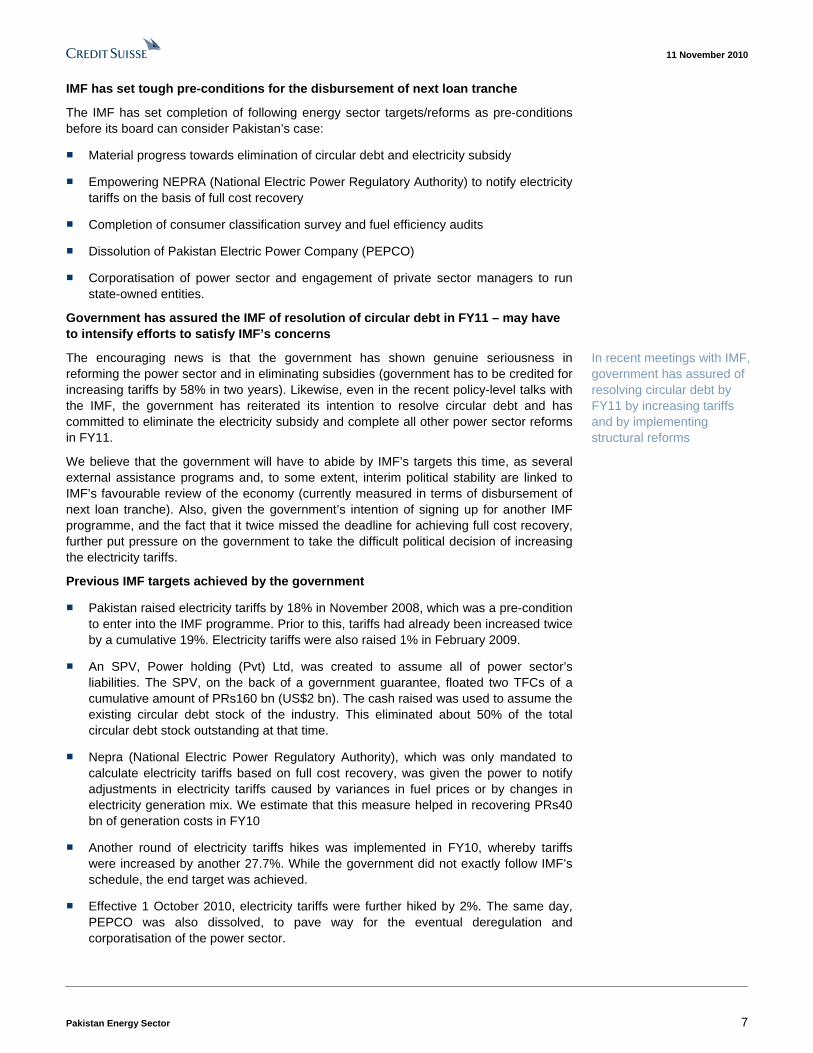
Sector valuation Figure 7: GEM integrated Div. FCF EPS Mkt yield yield P/E growth EV/EBIT ROE Target cap EV/boe (%) (%) (x) (%) (x) (%)Company Ticker Rat. FX Price price US$ mn US$ 10E 10E 10E 11E 10E 11E 10E 11E 10EPetroChina 0857.HK N HK$ 9.88 11.12 233,103 12.9 3.7 -1.5 12.2 13.4 25 -9 10.4 11.9 14Sinopec 0386.HK O HK$ 7.46 8.20 83,379 31.4 3.2 -2.4 8.3 8.7 10 -4 8.6 9.0 16Reliance Industries RELI.BO O Rs 1,064 1,215 78,599 n.a. 0.7 2.8 14.2 17.0 58 -17 19.5 15.4 19PTT PTT.BK N Bt 308 299 29,354 n.a. 3.0 3.0 10.9 10.9 34 0 9.1 8.8 17Gazprom GAZP.RTS N $ 5.44 5.50 128,784 1.6 1.5 2.8 4.7 4.4 4 7 5.0 4.6 13Rosneft ROSN.RTS O $ 7.05 9.20 74,717 3.8 0.9 6.0 6.7 5.3 61 28 6.7 4.8 20LUKOIL LKOH.RTS O $ 57.6 75.0 48,992 2.8 3.7 10.8 6.1 5.7 15 7 4.8 4.2 14Surgutneftegaz SNGS.RTS U $ 1.00 0.73 43,211 1.5 2.6 1.0 10.8 11.3 54 -4 5.4 5.5 10Gazprom Neft SIBN.RTS N $ 3.81 4.10 18,064 5.2 3.4 8.4 6.0 6.1 -1 -1 5.6 5.4 19Novatek NVTK.RTS O $ 7.75 10.10 23,531 5.5 0.0 2.3 16.4 13.9 71 18 13.0 11.2 28Petrobras PBR N $ 34.5 43.0 224,691 15.5 2.5 -22.9 11.6 10.6 -16 9 9.0 8.7 14Pak state oil PSO.KA O PRs 281.7 381.0 565 n.a. 2.8 31.2 5.3 5.2 n.a. 2 2.7 3.4 36Sasol SOLJ.J NR R 318 R 27,859 n.a. n.a. n.a. n.a. n.a. n.a. n.a.Average 8.9 2.3 3.5 9.4 9.4 29 3 8.3 7.7 18
Source: Company data, Reuters, Credit Suisse estimates
Figure 8: GEM E&Ps Div. FCF EPS EV/ Mkt yield yield P/E growth EBITDAX ROE Target Cap EV/boe (%) (%) (x) (%) (x) (%)Company Ticker Rat. FX Price price US$ mn US$/boe 10E 10E 10E 11E 10E 11E 10E 11E 10E CNOOC 0883.HK U HK$ 16.34 11.70 94,338 34.7 2.9 4.2 13.4 14.4 64 -7 6.6 6.7 25ONGC ONGC.BO N Rs 1,370 1,277 66,200 15.0 2.4 4.7 14.3 12.0 3 19 5.4 4.6 21Cairn India CAIL.BO R Rs 340.3 R 14,585 n.a. n.a. n.a. n.a. n.a. n.a.Oil India OILI.BO O Rs 1,424 1,585 7,735 12.3 2.4 n.a. 13.1 10.5 7 25 5.6 4.4 23OGDC OGDC.KA O PRs 158 173.0 8,000 8.2 3.5 5.8 11.5 10.4 7 11 5.8 5.4 42Pakistan Petroleum PPL.KA O PRs 193 246 2,700 5.7 3.9 6.8 9.9 7.3 -16 35 4.6 3.4 33PTTEP PTTE.BK U Bt 169 154 18,772 20.1 3.0 3.4 13.1 13.9 92 -6 5.3 5.2 27OGX OGXP3 R $ 13.69 R 44,252 n.a. n.a. n.a. n.a. n.a. n.a. n.a. RWoodside WPL.AX O A$ 44.4 54.9 34,395 22.7 1.6 -4.2 26.8 21.5 15 25 8.8 n.a. 12Santos STO.AX N A$ 12.74 14.85 10,519 9.7 3.3 -10.7 17.0 30.8 155 -45 5.4 n.a. 8Oil Search OSH.AX O A$ 6.33 7.30 8,227 117.1 0.8 -8.1 62.2 64.7 17 -4 14.6 n.a. 5INPEX 1605 O ¥ 452,000 465,000 20,306 12.0 1.2 -6.1 9.9 14.2 -26 -30 n.a. n.a. 8Japex 1662 O ¥ 3,340 4,600 2,350 7.9 1.2 5.0 10.6 20.7 43 -49 n.a. n.a. 5PT Medco MEDC.JK NR Rp 4,225 R 1,576 n.a. n.a. n.a. n.a. n.a. n.a. n.a.PT Energi Mega ENRG.JK R Rp 123.00 R 559 n.a. n.a. n.a. n.a. n.a. n.a. n.a. n.a. n.a. n.a.Average 22.3 2.9 0.1 17.4 18.8 34 0 6.7 4.7 20
Source: Company data, Reuters, Credit Suisse estimates

11 November 2010
Pakistan Energy Sector 5
Circular debt resolution in FY11 Since Pakistan’s participation in the IMF programme, electricity tariffs have increased 58% and now cover for 75% of all generation costs. With the IMF insisting upon sealing the gap between electricity tariffs and generation costs, and with fiscal health of the government too fragile to carry on with electricity subsidies, we believe the government is left with no option but to increase electricity tariffs in FY11 by 15-20%. This should: 1) restrict accumulation of fresh circular debt to manageable levels, 2) limit electricity differentials in FY11 to PRs130 bn – almost half of that in FY10, 3) bring tariffs to a level where they cover 90-95% of all generation costs by June FY11, and 4) ensure long-term sustainability of the sector. Pakistan’s intention of entering into another IMF programme once the current one ends puts further pressure on the government to abide by IMF’s conditions of eliminating electricity subsidies by FY11. The whole scenario benefits the energy sector the most as improving cash flows due to higher tariffs will allow resumption of routine operations and bring back the high payouts.
What is circular debt? Circular debt is basically inter-company debt within the Pakistan energy sector that accrued as a result of electricity tariffs being kept below cost recovery levels. It started with the government’s inability to finance electricity subsidy; this inability trickled down the entire energy chain in the form of partial and delayed payments to electricity producers and fuel suppliers. Now, the repayment of working capital financing is also linked to it.
Pakistan is among the few developing countries that have a high percentage of electricity generated from gas and fuel oil (more than 60%). Gas to the power sector is provided through the use of indigenous deposits (gas is explored by E&P companies and transmitted by gas distribution companies), while nearly 75% of fuel oil is imported (oil marketing companies import fuel oil for power generation). Hence, a high percentage of electricity generation cost is linked to oil price.
This gas and fuel oil is sold to power generation companies (government-owned as well as independent power producers, or IPPs), which in turn sell their output to a central body –the Central Power Purchasing Authority (CPPA) – at the rate negotiated in the power purchasing agreement. The purchase of this electricity and the negotiated price is both guaranteed by the government. In almost all cases, the negotiated price is basically cost plus pricing, where the power producer is guaranteed a fixed return on his investment along with payments of all costs. Costs for a power generation company are basically fuel costs (90%-plus) and O&M costs. Hence, it is obvious that a power producer can only make fuel supply payments if it is promptly reimbursed by the government for such payments.
The government, after buying electricity from these companies, notifies a consumer price based on its social, political and economic objectives, and sells electricity to consumers through several government-owned distribution companies (Discos). Traditionally, the government has always notified tariffs below generation costs, but the difference has been relatively miniscule and hence easier to finance.
However, more recently, the difference between the notified price and generation cost widened to about 33% of generation costs, and, as a result, the government had to finance a large stock of the subsidy, which in FY10 is estimated to be around PRs230 bn (US$2.7 bn) or about 1.58% of GDP.
Multiple facets of circular debt
Circular debt is a compound of many problems.
Circular debt is basically inter-corporate debt that has accrued because electricity tariffs are below cost recovery levels, while government is delaying subsidy payments
As more than 60% of electricity in Pakistan is produced from gas or oil, when electricity tariffs did not increase in line with the rise in oil prices, it burdened the government with massive subsidies
And delayed/partial payment of subsidies by a cash-strapped government forced downstream companies to delay payments to upstream companies

11 November 2010
Pakistan Energy Sector 6
The principal problem is government’s inability to finance electricity subsidy payments. The government has traditionally subsidised electricity tariffs. However, the quantum of subsidies rose when the oil price spiked in FY07-08. Any benefits of the oil price plunge that followed were limited due to rupee depreciation. The government, which was already running high twin account deficits, found it difficult to finance the increased subsidies. Consequently, payments to electricity producers got delayed and resulted in a cash draught in the entire energy chain.
The second problem is the incapacity of electricity distribution companies to collect bills. Distribution companies have had a hard time in collecting payments from other government bodies and from certain geographical locations. Though it is a relatively small problem, but accumulation of unpaid bills from such customers compounded the problem in FY08-09.
Figure 9: Recovery rates for distribution companies IESCO LESCO GEPCO FESCO MEPCO PESCO HESCO QESCORecovery rate (%) 96 92 96 97 95.8 85 59.8 58Market share (%) 10 19 8 11 13 11 7 6
Source: Nepra
Another problem is that distribution companies have high transmission and distribution (T&D) losses. T&D losses in Pakistan are around 22%. Although a certain part of these losses is theft, but underinvestment, poor infrastructure and infrequent maintenance are also to be blamed.
Figure 10: Transmission and distribution losses in Pakistan IESCO LESCO GEPCO FESCO MEPCO PESCO HESCO QESCO KESCT&D loss (%) 11 13 11 11 18 38 35 20 36Market share (%) 10 19 8 11 13 11 7 6 13
Source: Nepra
The last problem is more structural. Pakistan has high dependence on furnace oil for its electricity needs, which tends to increase the electricity generation cost. This has to shift to cheaper alternatives in the long run.
IMF is pushing for elimination of electricity subsidies Pakistan has already missed the revised deadline of August 2010 to eliminate subsidies
Pakistan has now twice missed the deadline set by the IMF for eliminating electricity subsidies.
Initially, Pakistan had committed to the IMF to remove electricity tariff subsidies by June 2009. But fearing that the price increase will be politically too costly, the government backed out of the agreement and negotiated a year extension of this deadline (new deadline was August 2010).
However, even after a 32% increase in electricity tariffs, the government was unable to achieve cost recovery, and missed the second deadline of August 2010 as well.
As a result, pressure from IMF has escalated and disbursement of further loan tranches has been deferred
The IMF has now adopted a stricter stance for the government after most of the FY10 policy targets were missed (fiscal deficit was 6.3% as against a target of 5.1%, net borrowing from SBP was PRs44 bn versus a target of zero net borrowing, non resolution of circular debt, value added tax was not imposed). Along with this, the international lender has also delayed the disbursement of the fifth loan tranche (disbursement was originally planned in August 2010) and has informed the government that it will need to show material progress with respect to the implementation of Value Added Tax and resolution of circular debt, before Pakistan’s case can be pursued further.
Factors responsible for rise of circular debt: (i) delay in subsidy payments from government, (ii) high bad debts, (iii) high T&D losses, and (iv) high dependence on furnace oil for electricity needs
Pakistan has now twice missed the deadline for eliminating electricity subsidies. IMF may not allow further relaxations
As a result, the IMF has now adopted a stricter stance and delayed the disbursement of further loan tranches
11 November 2010
Pakistan Energy Sector 7
IMF has set tough pre-conditions for the disbursement of next loan tranche
The IMF has set completion of following energy sector targets/reforms as pre-conditions before its board can consider Pakistan’s case:
■ Material progress towards elimination of circular debt and electricity subsidy
■ Empowering NEPRA (National Electric Power Regulatory Authority) to notify electricity tariffs on the basis of full cost recovery
■ Completion of consumer classification survey and fuel efficiency audits
■ Dissolution of Pakistan Electric Power Company (PEPCO)
■ Corporatisation of power sector and engagement of private sector managers to run state-owned entities.
Government has assured the IMF of resolution of circular debt in FY11 – may have to intensify efforts to satisfy IMF’s concerns
The encouraging news is that the government has shown genuine seriousness in reforming the power sector and in eliminating subsidies (government has to be credited for increasing tariffs by 58% in two years). Likewise, even in the recent policy-level talks with the IMF, the government has reiterated its intention to resolve circular debt and has committed to eliminate the electricity subsidy and complete all other power sector reforms in FY11.
We believe that the government will have to abide by IMF’s targets this time, as several external assistance programs and, to some extent, interim political stability are linked to IMF’s favourable review of the economy (currently measured in terms of disbursement of next loan tranche). Also, given the government’s intention of signing up for another IMF programme, and the fact that it twice missed the deadline for achieving full cost recovery, further put pressure on the government to take the difficult political decision of increasing the electricity tariffs.
Previous IMF targets achieved by the government
■ Pakistan raised electricity tariffs by 18% in November 2008, which was a pre-condition to enter into the IMF programme. Prior to this, tariffs had already been increased twice by a cumulative 19%. Electricity tariffs were also raised 1% in February 2009.
■ An SPV, Power holding (Pvt) Ltd, was created to assume all of power sector’s liabilities. The SPV, on the back of a government guarantee, floated two TFCs of a cumulative amount of PRs160 bn (US$2 bn). The cash raised was used to assume the existing circular debt stock of the industry. This eliminated about 50% of the total circular debt stock outstanding at that time.
■ Nepra (National Electric Power Regulatory Authority), which was only mandated to calculate electricity tariffs based on full cost recovery, was given the power to notify adjustments in electricity tariffs caused by variances in fuel prices or by changes in electricity generation mix. We estimate that this measure helped in recovering PRs40 bn of generation costs in FY10
■ Another round of electricity tariffs hikes was implemented in FY10, whereby tariffs were increased by another 27.7%. While the government did not exactly follow IMF’s schedule, the end target was achieved.
■ Effective 1 October 2010, electricity tariffs were further hiked by 2%. The same day, PEPCO was also dissolved, to pave way for the eventual deregulation and corporatisation of the power sector.
In recent meetings with IMF, government has assured of resolving circular debt by FY11 by increasing tariffs and by implementing structural reforms
11 November 2010
Pakistan Energy Sector 8
Gap of 25% still exists between costs, power tariffs Our calculation suggests that there is still a gap of PRs2.38/unit in electricity generation costs (PRs9.75/unit as per 4Q FY10 Nepra determination) and notified tariffs (PRs7.37/unit). This translates into a required tariff increase of 32% to attain cost recovery.
For FY11, we believe that the generation costs will stay at this level, as our calculations show that any increase in generation costs due to higher fixed payments to new IPPs and rental plants will be offset by fuel and efficiency savings from new plants.
Figure 11: Fuel savings from new IPPs will make up for higher capacity payments (PRs mn) 1Q FY11 2Q FY11 3Q FY11 4Q FY11Fuel savings @PRs7.3/unit from gas plants (will be used to replace HSFO plants) 8,564 16,030 14,073 10,302Efficiency savings from new oil plants at PRs1.35/unit (will be used to replace inefficient oil plants) 1,497 2,334 1,980 1,980Increase in capacity payments 7,924 20,740 22,775 21,175Net impact 2,138 (2,376) (6,722) (8,892)
Source: Nepra, Credit Suisse estimates
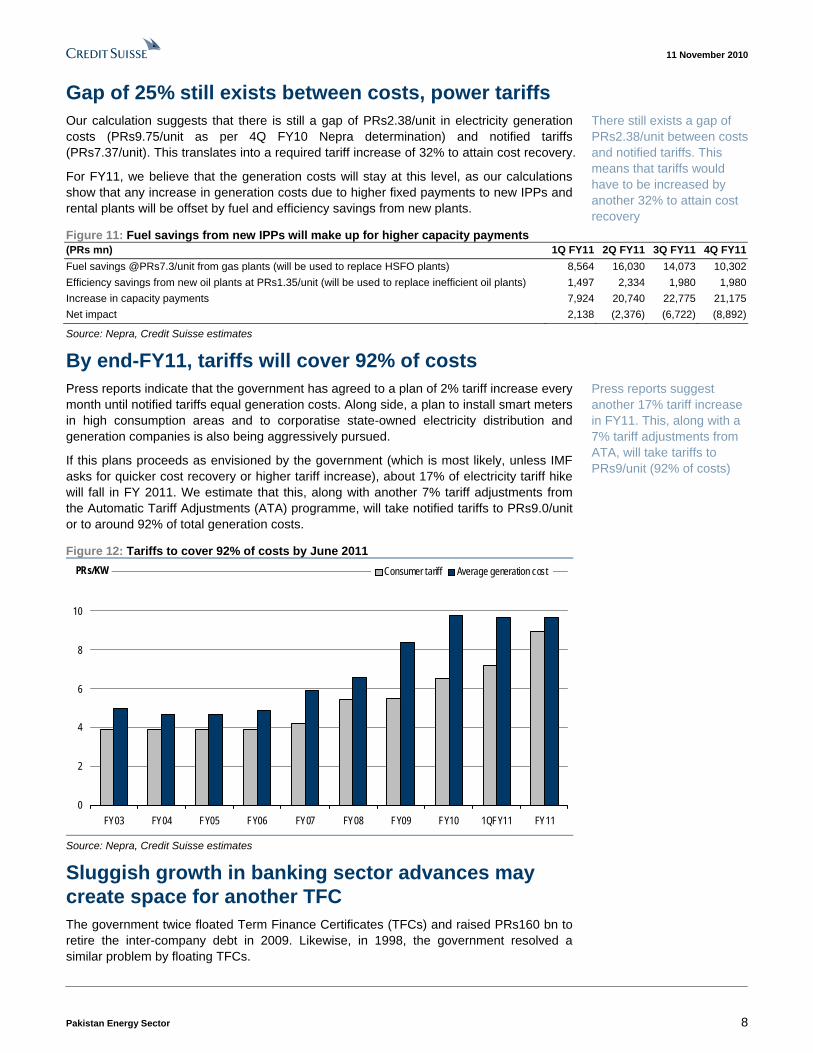
By end-FY11, tariffs will cover 92% of costs Press reports indicate that the government has agreed to a plan of 2% tariff increase every month until notified tariffs equal generation costs. Along side, a plan to install smart meters in high consumption areas and to corporatise state-owned electricity distribution and generation companies is also being aggressively pursued.
If this plans proceeds as envisioned by the government (which is most likely, unless IMF asks for quicker cost recovery or higher tariff increase), about 17% of electricity tariff hike will fall in FY 2011. We estimate that this, along with another 7% tariff adjustments from the Automatic Tariff Adjustments (ATA) programme, will take notified tariffs to PRs9.0/unit or to around 92% of total generation costs.
Figure 12: Tariffs to cover 92% of costs by June 2011
0
2
4
6
8
10
12
FY03 FY04 FY05 FY06 FY07 FY08 FY09 FY10 1QFY11 FY11
Consumer tariff Average generation costPRs/KW
Source: Nepra, Credit Suisse estimates
Sluggish growth in banking sector advances may create space for another TFC The government twice floated Term Finance Certificates (TFCs) and raised PRs160 bn to retire the inter-company debt in 2009. Likewise, in 1998, the government resolved a similar problem by floating TFCs.
There still exists a gap of PRs2.38/unit between costs and notified tariffs. This means that tariffs would have to be increased by another 32% to attain cost recovery
Press reports suggest another 17% tariff increase in FY11. This, along with a 7% tariff adjustments from ATA, will take tariffs to PRs9/unit (92% of costs)

11 November 2010
Pakistan Energy Sector 9
Our Pakistan bank sector analyst believes that the current high interest rate scenario will lead to subdued growth in advances and make banks invest more into government treasuries. This scarcity of investment avenues can likely pave way for another power sector TFC, which will offer banks higher return than other investment options.
Tariffs as a percentage of per-capita GDP higher in 2003 We calculate that even after a proposed 20-25% increase in power tariffs, tariffs as a percentage of GDP per capita will be lower than they were in 2003 because total inflation during the period rose by about 105%, while tariffs during the period grew only by 72%.
Figure 13: Tariffs can rise further; tariffs higher in 2003 Figure 14: Power tariff increase has lagged inflation
0.000
0.002
0.004
0.006
0.008
0.010
0.012
0.014
FY03
FY04
FY05
FY06
FY07
FY08
FY09
FY10
1QFY
11
FY11
E
(%)Tariffs as %age GDP per capita were higher in 2003 than what theywill be in 2011
-
20
40
60
80
100
120
FY03 FY04 FY05 FY06 FY07 FY08 FY09 FY10
Cumulative inc in CPI Cumulative inc in power tariffs
Source: Economic survey, Credit Suisse estimates Source: Economic survey, Credit Suisse estimates
11 November 2010
Pakistan Energy Sector 10
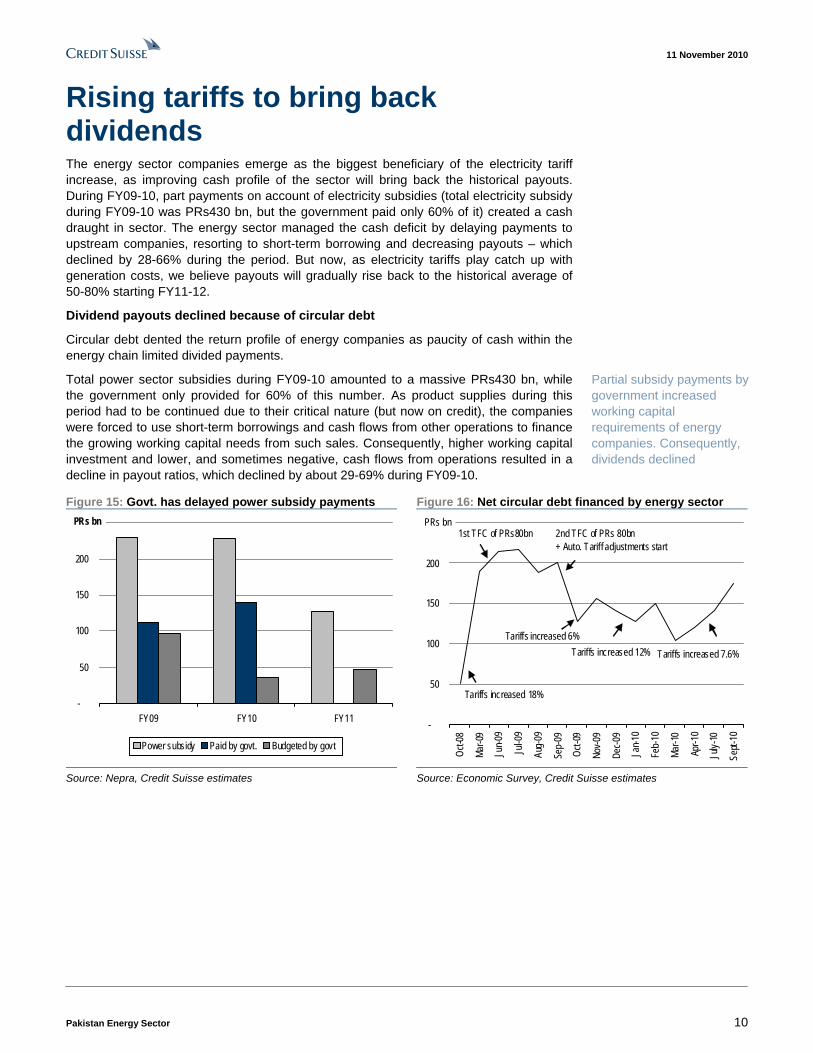
Rising tariffs to bring back dividends The energy sector companies emerge as the biggest beneficiary of the electricity tariff increase, as improving cash profile of the sector will bring back the historical payouts. During FY09-10, part payments on account of electricity subsidies (total electricity subsidy during FY09-10 was PRs430 bn, but the government paid only 60% of it) created a cash draught in sector. The energy sector managed the cash deficit by delaying payments to upstream companies, resorting to short-term borrowing and decreasing payouts – which declined by 28-66% during the period. But now, as electricity tariffs play catch up with generation costs, we believe payouts will gradually rise back to the historical average of 50-80% starting FY11-12.
Dividend payouts declined because of circular debt
Circular debt dented the return profile of energy companies as paucity of cash within the energy chain limited divided payments.
Total power sector subsidies during FY09-10 amounted to a massive PRs430 bn, while the government only provided for 60% of this number. As product supplies during this period had to be continued due to their critical nature (but now on credit), the companies were forced to use short-term borrowings and cash flows from other operations to finance the growing working capital needs from such sales. Consequently, higher working capital investment and lower, and sometimes negative, cash flows from operations resulted in a decline in payout ratios, which declined by about 29-69% during FY09-10.
Figure 15: Govt. has delayed power subsidy payments Figure 16: Net circular debt financed by energy sector
-
50
100
150
200
250
FY09 FY10 FY11
Power subsidy Paid by govt. Budgeted by govt
PRs bn
-
50
100
150
200
250
Oct-0
8
Mar-0
9
Jun-0
9
Jul-0
9
Aug-
09
Sep-
09
Oct-0
9
Nov-0
9
Dec-0
9
Jan-1
0
Feb-
10
Mar-1
0
Apr-1
0
July-
10
Sept-
10
PRs bn1st TFC of PRs80bn 2nd TFC of PRs 80bn
+ Auto. Tariff adjustments start
Tariffs increased 18%
Tariffs increased 6%Tariffs increased 12% Tariffs increased 7.6%
Source: Nepra, Credit Suisse estimates Source: Economic Survey, Credit Suisse estimates
Partial subsidy payments by government increased working capital requirements of energy companies. Consequently, dividends declined

11 November 2010
Pakistan Energy Sector 11
Working capital investments increased due to circular debt
Figure 17: Trade receivables and payables for PSO Figure 18: Trade receivables and payables for OGDC
-
20
40
60
80
100
120
140
160
180
4qFy
06
2qFy
07
4qFy
07
2qFy
08
4qFy
08
2qFy
09
4qFy
09
2qFy
10
4qFy
10
Trade receivables Trade payables
PRs bn
-102030405060708090
100
4qFy
06
2qFy
07
4qFy
07
2qFy
08
4qFy
08
2qFy
09
4qFy
09
2qFy
10
4qFy
10
Trade receivables Trade payables
PRs bn
Source: Company data Source: Company data
Figure 19: Trade receivables and payables for PPL Figure 20: Trade receivables and payables for HUBCO
-
5
10
15
20
25
30
35
40
4qFy
06
2qFy
07
4qFy
07
2qFy
08
4qFy
08
2qFy
09
4qFy
09
2qFy
10
4qFy
10
Trade receivables Trade payables
PRs bn
-
10
20
30
40
50
60
70
80
4qFy
06
2qFy
07
4qFy
07
2qFy
08
4qFy
08
2qFy
09
4qFy
09
2qFy
10
4qFy
10
Trade receivables Trade payables
PRs bn
Source: Company data Source: Company data
Power sector reforms to improve energy sector’s cash flows FY11 and FY12 should be better years for the energy sector because:
■ Tariffs have increased 58% over the past two years and now cover 76% of the generation costs. Whereas in the beginning of FY10, tariffs only covered 57% of the generation costs.
■ The government plans to increase tariffs by another 17% in FY11 and implement other structural reforms in sector. With the proposed tariff increase, FY11 subsidy will be around PRs130 bn – much lower than PRs230 bn in FY09 and FY10.
■ Per unit generation cost is also expected to come down due to better water availability, allowing for optimal hydel generation. Moreover, with some of the energy conservation/gas curtailment measures expected to continue throughout the year, abundant supply of gas will be available for power generation, thereby limiting the use of costlier fuels.
Power sector reforms and 58% tariff increases brought over the past two years will restrict circular debt growth and will make space for routine operations and higher payouts
11 November 2010
Pakistan Energy Sector 12
■ Court cases against electricity tariff hikes have been resolved; this should further augment cash flows.
■ The mechanism of the ATA (tariffs are monthly adjusted for fuel price and fuel mix changes) will prevent reoccurrence of circular debt of such magnitude.
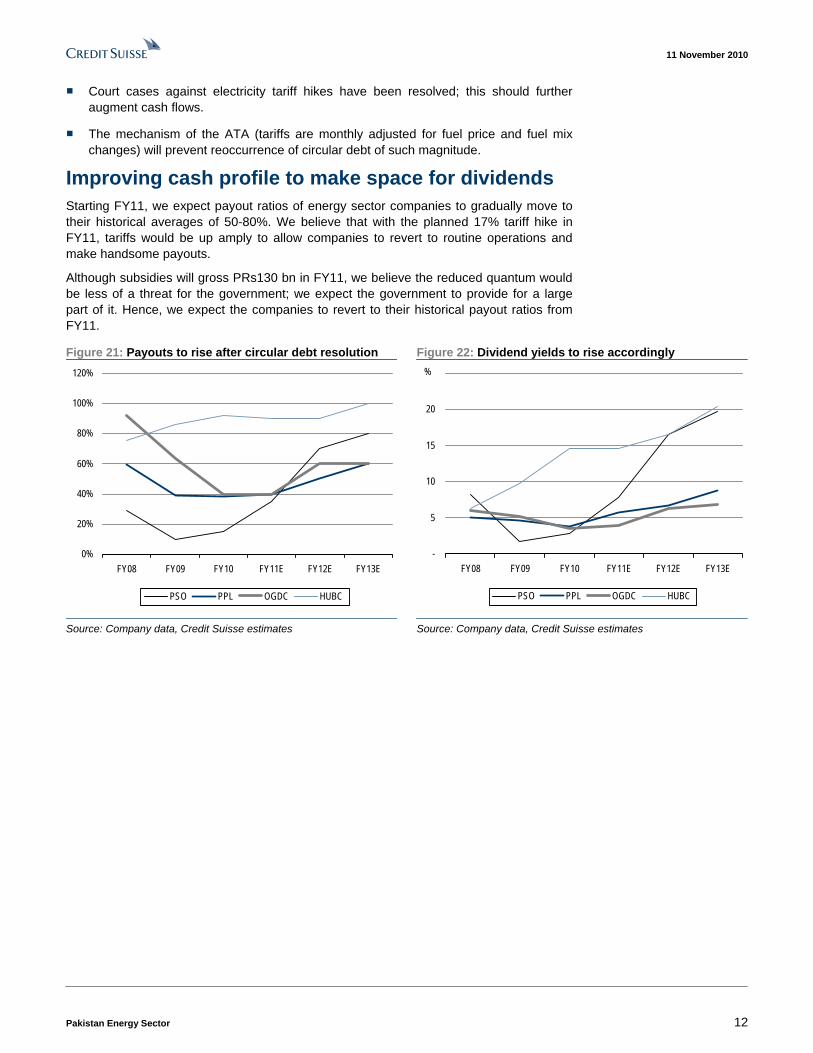
Improving cash profile to make space for dividends Starting FY11, we expect payout ratios of energy sector companies to gradually move to their historical averages of 50-80%. We believe that with the planned 17% tariff hike in FY11, tariffs would be up amply to allow companies to revert to routine operations and make handsome payouts.
Although subsidies will gross PRs130 bn in FY11, we believe the reduced quantum would be less of a threat for the government; we expect the government to provide for a large part of it. Hence, we expect the companies to revert to their historical payout ratios from FY11.
Figure 21: Payouts to rise after circular debt resolution Figure 22: Dividend yields to rise accordingly
0%
20%
40%
60%
80%
100%
120%
FY08 FY09 FY10 FY11E FY12E FY13E
PSO PPL OGDC HUBC
-
5
10
15
20
25
FY08 FY09 FY10 FY11E FY12E FY13E
PSO PPL OGDC HUBC
%
Source: Company data, Credit Suisse estimates Source: Company data, Credit Suisse estimates

11 November 2010
Pakistan Energy Sector 13
Assuming coverage with an OVERWEIGHT We assume coverage of the Pakistan energy sector with an OVERWEIGHT stance and with OUTPERFORM ratings on PPL (revised target price of PRs 246), PSO (revised target price of PRs381) & OGDC (revised target price of PRs 173) We also initiate coverage of Hub Power Company with an OUTPERFORM rating (target price PRs 49). Pakistan energy sector companies are among the cheapest in the region. During FY09-10, absence of high payouts restrained the sector to trace back their historical valuation multiples. With the dividend payments expected to normalise from FY11, we expect energy stocks to return to their historical valuation multiples.
Valuation methodology We have used average historical multiples to value Pakistan energy sector companies. Specifically, we have used historical dividend yields to value downstream companies, as prices for downstream companies appear to be more responsive to dividends than to earnings. For upstream companies, we use the historical price-to-earning ratio.
In coming up with a target multiple, we have not included the valuation multiples after June 2008, as it was from July 2008 that the problem of circular debt started affecting the energy companies and dented the valuation multiples.
We value downstream companies on dividend yield
We value downstream companies on dividend yields as prices for downstream companies historically appear to be more responsive to dividend payouts.
Pakistan State Oil
Based on a target yield of 8.54%, our December 2011 target price for PSO is PRs381. Our target dividend yield of 8.54% is the average of forward dividend yields from July 1998 to June 2008.
Figure 23: PSO’s valuation matrix Target P/E at Div yield EV/EBITDA EPS DPS Target price (TP) target price at target price at target price FY11 FY12 FY11 FY12 D/Y Dec-11 FY11 FY12 FY11 FY12 FY11 FY12PSO 54 66 19 46 8.5 381 7.07 5.81 4.95 12.05 4.14 3.39
Source: Company data, Credit Suisse estimates
Figure 24: Forward dividend yield for PSO Figure 25: Forward P/E for PSO
-
2
4
6
8
10
12
14
16
18
20
Jul-9
7
Jul-9
8
Jul-9
9
Jul-0
0
Jul-0
1
Jul-0
2
Jul-0
3
Jul-0
4
Jul-0
5
Jul-0
6
Jul-0
7
Jul-0
8
Jul-0
9
Jul-1
0
(%)
Target D/Y = 8.54
Avg D/Y = 8.09
0
2
4
6
8
10
12
14
16
18
20
Jul-9
7
Jul-9
8
Jul-9
9
Jul-0
0
Jul-0
1
Jul-0
2
Jul-0
3
Jul-0
4
Jul-0
5
Jul-0
6
Jul-0
7
Jul-0
8
Jul-0
9
Jul-1
0P/E
Average PE = 8.4x
Source: Bloomberg, Credit Suisse estimates Source: Bloomberg, Credit Suisse estimates
We have valued Pakistan’s energy sector on historical multiples
We value PSO with a target dividend yield of 8.54% with December 2011 target price of PRs381
11 November 2010
Pakistan Energy Sector 14
Hub Power Company
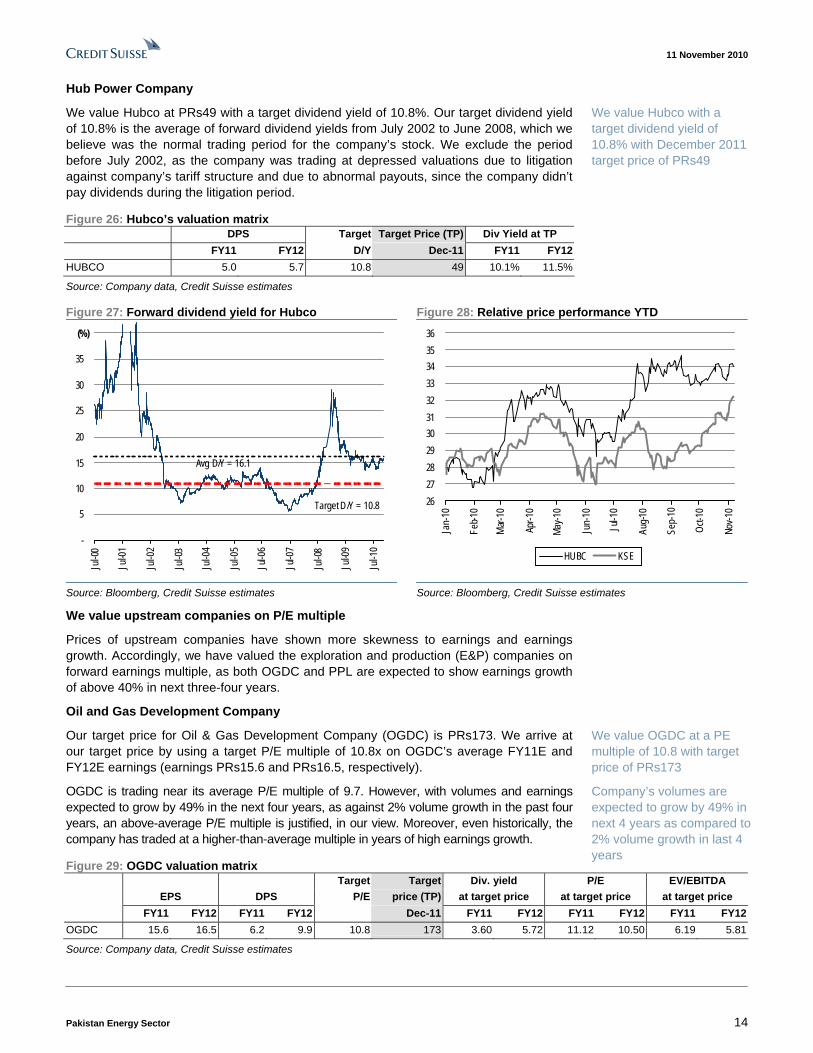
We value Hubco at PRs49 with a target dividend yield of 10.8%. Our target dividend yield of 10.8% is the average of forward dividend yields from July 2002 to June 2008, which we believe was the normal trading period for the company’s stock. We exclude the period before July 2002, as the company was trading at depressed valuations due to litigation against company’s tariff structure and due to abnormal payouts, since the company didn’t pay dividends during the litigation period.
Figure 26: Hubco’s valuation matrix DPS Target Target Price (TP) Div Yield at TP FY11 FY12 D/Y Dec-11 FY11 FY12 HUBCO 5.0 5.7 10.8 49 10.1% 11.5%
Source: Company data, Credit Suisse estimates
Figure 27: Forward dividend yield for Hubco Figure 28: Relative price performance YTD
-
5
10
15
20
25
30
35
40
Jul-0
0
Jul-0
1
Jul-0
2
Jul-0
3
Jul-0
4
Jul-0
5
Jul-0
6
Jul-0
7
Jul-0
8
Jul-0
9
Jul-1
0
(%)
Avg D/Y = 16.1
Target D/Y = 10.8
2627282930313233343536
Jan-
10
Feb-1
0
Mar-
10
Apr-1
0
May-1
0
Jun-
10
Jul-1
0
Aug-1
0
Sep-
10
Oct-1
0
Nov-1
0
HUBC KSE
Source: Bloomberg, Credit Suisse estimates Source: Bloomberg, Credit Suisse estimates
We value upstream companies on P/E multiple
Prices of upstream companies have shown more skewness to earnings and earnings growth. Accordingly, we have valued the exploration and production (E&P) companies on forward earnings multiple, as both OGDC and PPL are expected to show earnings growth of above 40% in next three-four years.
Oil and Gas Development Company
Our target price for Oil & Gas Development Company (OGDC) is PRs173. We arrive at our target price by using a target P/E multiple of 10.8x on OGDC’s average FY11E and FY12E earnings (earnings PRs15.6 and PRs16.5, respectively).
OGDC is trading near its average P/E multiple of 9.7. However, with volumes and earnings expected to grow by 49% in the next four years, as against 2% volume growth in the past four years, an above-average P/E multiple is justified, in our view. Moreover, even historically, the company has traded at a higher-than-average multiple in years of high earnings growth.
Figure 29: OGDC valuation matrix Target Target Div. yield P/E EV/EBITDA EPS DPS P/E price (TP) at target price at target price at target price FY11 FY12 FY11 FY12 Dec-11 FY11 FY12 FY11 FY12 FY11 FY12OGDC 15.6 16.5 6.2 9.9 10.8 173 3.60 5.72 11.12 10.50 6.19 5.81
Source: Company data, Credit Suisse estimates
We value Hubco with a target dividend yield of 10.8% with December 2011 target price of PRs49
We value OGDC at a PE multiple of 10.8 with target price of PRs173
Company’s volumes are expected to grow by 49% in next 4 years as compared to 2% volume growth in last 4 years

11 November 2010
Pakistan Energy Sector 15
Figure 30: OGDC forward P/E Figure 31: OGDC forward dividend yield
0
5
10
15
20
25
Jan-
04
Jul-0
4
Jan-
05
Jul-0
5
Jan-
06
Jul-0
6
Jan-0
7
Jul-0
7
Jan-
08
Jul-0
8
Jan-
09
Jul-0
9
Jan-
10
Jul-1
0
PE x
target PE = 10.8x
avg PE = 9.77
Periods of high earnings growth
-
2
4
6
8
10
12
14
16
18
Jan-0
4
Jul-0
4
Jan-
05
Jul-0
5
Jan-
06
Jul-0
6
Jan-
07
Jul-0
7
Jan-
08
Jul-0
8
Jan-
09
Jul-0
9
Jan-
10
Jul-1
0
%
Avg D/Y = 7.6%
Source: Bloomberg, Credit Suisse estimates Source: Bloomberg, Credit Suisse estimates
Pakistan Petroleum Limited
We assume coverage of PPL with a revised target price of PRs246. With earnings expected to grow 64% over the next four years, we shift our valuation methodology to P/E multiple-based valuation. We use a target P/E of 9.2x (average historical P/E) on average earnings for FY11E and FY12E (add avg EPS) to value PPL.
Figure 32: PPL’s valuation matrix Target Div P/E EV/EBITDAX price yield at at at EPS DPS - FY11 Target (TP) target price target price target price FY11 FY12 FY11 FY12 P/E Dec-11 FY11 FY12 FY11 FY12 FY11 FY12 PPL 26.4 27.0 11 14 9.2 246 4.48 5.70 9.32 9.09 4.64 4.42
Source: Company data, Credit Suisse estimates
Figure 33: Historical forward P/E multiple for PPL Figure 34: Historical forward P/E multiple for PPL
0
2
4
6
8
10
12
14
16
18
20
Jul-0
4
Jan-
05
Jul-0
5
Jan-
06
Jul-0
6
Jan-0
7
Jul-0
7
Jan-
08
Jul-0
8
Jan-0
9
Jul-0
9
Jan-
10
Jul-1
0
PE x
target PE = 9.2x
avg PE = 8.2x
-
2
4
6
8
10
12
14
Jul-0
4
Jan-
05
Jul-0
5
Jan-
06
Jul-0
6
Jan-
07
Jul-0
7
Jan-0
8
Jul-0
8
Jan-
09
Jul-0
9
Jan-1
0
Jul-1
0
%
average D/Y = 5.4%
Source: Bloomberg, Credit Suisse estimates Source: Bloomberg, Credit Suisse estimates
We value PPL at a P/E of 9.2x, with target price of PRs246
The company’s earnings are expected to grow 64% over the next four years
11 November 2010
Pakistan Energy Sector 16
Asia Pacific / PakistanOil & Gas Refining & Marketing
Pakistan State Oil Company Ltd (PSO.KA / PSO PA)
ASSUMING COVERAGE
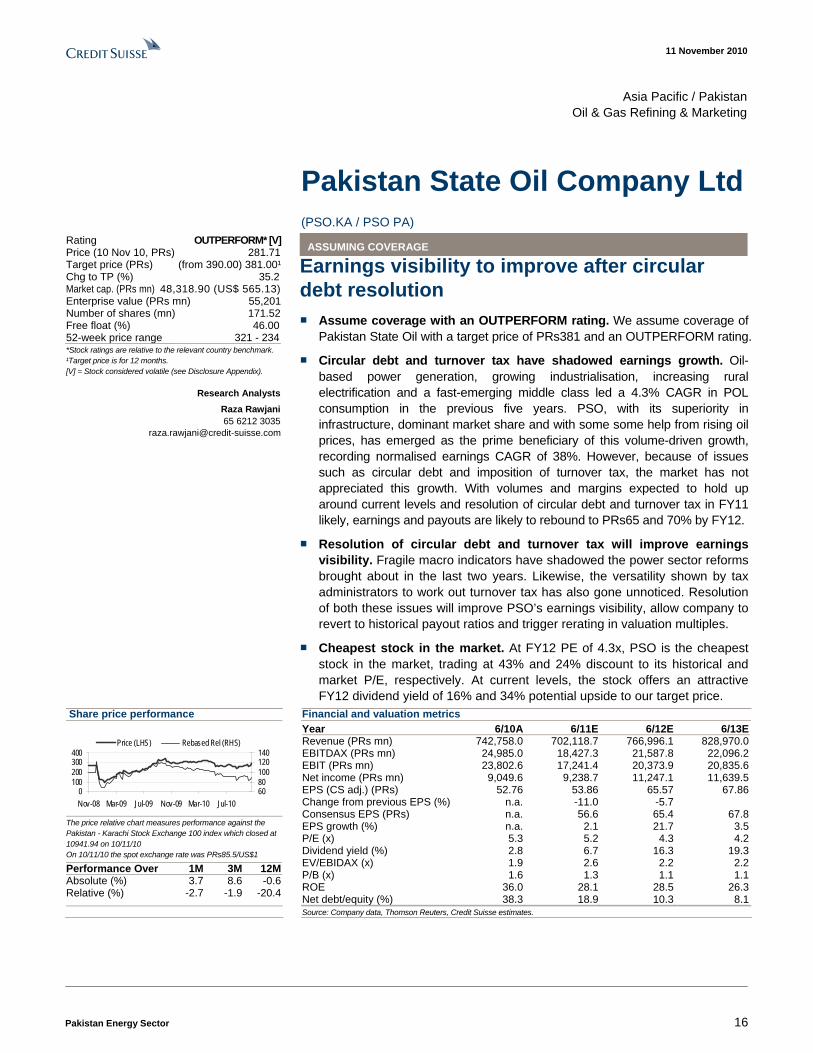
Earnings visibility to improve after circular debt resolution ■ Assume coverage with an OUTPERFORM rating. We assume coverage of
Pakistan State Oil with a target price of PRs381 and an OUTPERFORM rating.
■ Circular debt and turnover tax have shadowed earnings growth. Oil-based power generation, growing industrialisation, increasing rural electrification and a fast-emerging middle class led a 4.3% CAGR in POL consumption in the previous five years. PSO, with its superiority in infrastructure, dominant market share and with some some help from rising oil prices, has emerged as the prime beneficiary of this volume-driven growth, recording normalised earnings CAGR of 38%. However, because of issues such as circular debt and imposition of turnover tax, the market has not appreciated this growth. With volumes and margins expected to hold up around current levels and resolution of circular debt and turnover tax in FY11 likely, earnings and payouts are likely to rebound to PRs65 and 70% by FY12.
■ Resolution of circular debt and turnover tax will improve earnings visibility. Fragile macro indicators have shadowed the power sector reforms brought about in the last two years. Likewise, the versatility shown by tax administrators to work out turnover tax has also gone unnoticed. Resolution of both these issues will improve PSO’s earnings visibility, allow company to revert to historical payout ratios and trigger rerating in valuation multiples.
■ Cheapest stock in the market. At FY12 PE of 4.3x, PSO is the cheapest stock in the market, trading at 43% and 24% discount to its historical and market P/E, respectively. At current levels, the stock offers an attractive FY12 dividend yield of 16% and 34% potential upside to our target price.
Share price performance
0100200300400
Nov-08 Mar-09 Jul-09 Nov-09 Mar-10 Jul-106080100120140
Price (LHS) Rebased Rel (RHS)
The price relative chart measures performance against the Pakistan - Karachi Stock Exchange 100 index which closed at 10941.94 on 10/11/10 On 10/11/10 the spot exchange rate was PRs85.5/US$1
Performance Over 1M 3M 12M Absolute (%) 3.7 8.6 -0.6 Relative (%) -2.7 -1.9 -20.4
Financial and valuation metrics
Year 6/10A 6/11E 6/12E 6/13ERevenue (PRs mn) 742,758.0 702,118.7 766,996.1 828,970.0EBITDAX (PRs mn) 24,985.0 18,427.3 21,587.8 22,096.2EBIT (PRs mn) 23,802.6 17,241.4 20,373.9 20,835.6Net income (PRs mn) 9,049.6 9,238.7 11,247.1 11,639.5EPS (CS adj.) (PRs) 52.76 53.86 65.57 67.86Change from previous EPS (%) n.a. -11.0 -5.7Consensus EPS (PRs) n.a. 56.6 65.4 67.8EPS growth (%) n.a. 2.1 21.7 3.5P/E (x) 5.3 5.2 4.3 4.2Dividend yield (%) 2.8 6.7 16.3 19.3EV/EBIDAX (x) 1.9 2.6 2.2 2.2P/B (x) 1.6 1.3 1.1 1.1ROE 36.0 28.1 28.5 26.3Net debt/equity (%) 38.3 18.9 10.3 8.1
Source: Company data, Thomson Reuters, Credit Suisse estimates.
*Stock ratings are relative to the relevant country benchmark. ¹Target price is for 12 months. [V] = Stock considered volatile (see Disclosure Appendix).
Research Analysts Raza Rawjani 65 6212 3035
Rating OUTPERFORM* [V] Price (10 Nov 10, PRs) 281.71 Target price (PRs) (from 390.00) 381.00¹ Chg to TP (%) 35.2 Market cap. (PRs mn) 48,318.90 (US$ 565.13) Enterprise value (PRs mn) 55,201 Number of shares (mn) 171.52 Free float (%) 46.00 52-week price range 321 - 234
11 November 2010
Pakistan Energy Sector 17
Earnings visibility to improve after circular debt resolution Oil-based power generation, growing industrialisation, increasing rural electrification and a fast-emerging middle class led a 4.3% CAGR in POL consumption in the previous five years. PSO, with its superiority in infrastructure, dominant market share and a some help from rising oil prices, has emerged as the prime beneficiary of this volume-driven growth, recording normalised earnings CAGR of 38%. However, because of issues such as circular debt and imposition of turnover tax, the market has not appreciated this growth. With volumes and margins expected to hold up around current levels and resolution of circular debt and turnover tax expected in FY11, earnings and payouts are likely to rebound to PRs65 and 70% by FY12
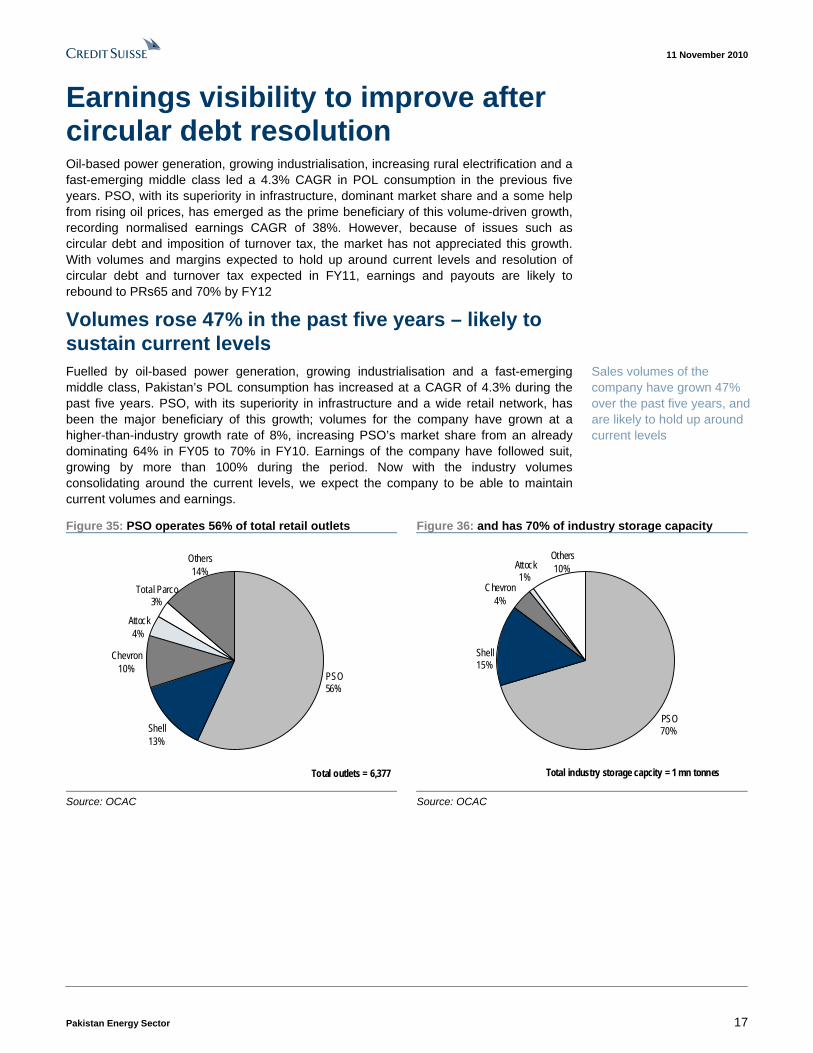
Volumes rose 47% in the past five years – likely to sustain current levels Fuelled by oil-based power generation, growing industrialisation and a fast-emerging middle class, Pakistan’s POL consumption has increased at a CAGR of 4.3% during the past five years. PSO, with its superiority in infrastructure and a wide retail network, has been the major beneficiary of this growth; volumes for the company have grown at a higher-than-industry growth rate of 8%, increasing PSO’s market share from an already dominating 64% in FY05 to 70% in FY10. Earnings of the company have followed suit, growing by more than 100% during the period. Now with the industry volumes consolidating around the current levels, we expect the company to be able to maintain current volumes and earnings.
Figure 35: PSO operates 56% of total retail outlets Figure 36: and has 70% of industry storage capacity
PSO56%
Shell13%
Chevron10%
Others14%
Total Parco3%
Attock4%
Total outlets = 6,377
PSO70%
Attock1%
Others10%
Chevron4%
Shell15%
Total industry storage capcity = 1 mn tonnes
Source: OCAC Source: OCAC
Sales volumes of the company have grown 47% over the past five years, and are likely to hold up around current levels

11 November 2010
Pakistan Energy Sector 18
Figure 37: PSO handles 70% of total industry volumes… Figure 38: …and sells 85-88% of total furnace oil
-
5
10
15
20
25
FY08 FY09 FY10 FY11E FY12E FY13E
Industry PSO
mn tonnes
-
2
4
6
8
10
12
FY08 FY09 FY10 FY11E FY12E FY13E
Industry PSO
mn tonnes
Source: Company data, Credit Suisse estimates Source: Company data, Credit Suisse estimates
High oil prices have increased absolute margins; expect reduced policy overhang Owing to the rising oil prices, PSO’s absolute per tonne gross margins have increased at 21% CAGR over the past three years – from PRs1,042/t in FY07 to PRs1,828/t in FY10. This is despite the fact that the government has routinely intervened to keep the margins of regulated products in check. However, going forward, further negative intervention by the government is unlikely, as: (i) the government in its last policy change has fixed OMC margins in rupee terms for all regulated products and (ii) current margins as a percentage of ex refinery price are at, or near, their lowest levels.
In our model, we have assumed a 7% cut in PSO’s gross margin over FY11 due to increased competition in the de-regulated product segment and recent policy change for the regulated product segment. But we believe that the current margins in the regulated product segments are unsustainable and will be revised upwards in the due course of time. Hence, we model that margins will grow at rupee depreciation rate after FY12.
Figure 39: Per tonne gross margin for PSO is at its peak Figure 40: Regulated product margins are at/near bottom
-200400600800
1,0001,2001,4001,6001,8002,000
FY07 FY08 FY09 FY10 FY11E FY12E FY13E
Gross margin per tonne
0%
1%
2%
3%
4%
5%
6%
7%
8%
3QFY06 2QFY07 1QFY08 4QFY08 3QFY09 2QFY10 1QFY11
Mogas HOBC HSD
Source: Company data, Credit Suisse estimates Source: Company data, Credit Suisse estimates
Rising oil prices have increased the company’s gross margins by 75% over the past three years
We expect 7% decline in margins in FY11 due to increased competition and revision in regulated product margins

11 November 2010
Pakistan Energy Sector 19
Core earnings have increased 1.5 times, but remain underappreciated due to low payouts The massive growth in volumes and margins has had a multiplier effect on earnings, which, as a result, has increased 1.5x over the past three years to PRs72/share (FY10 normalised earnings). But this growth has been underappreciated by the market due to issues of circular debt and imposition of 1% turnover tax, which have resulted in declining payouts.
Figure 41: Normalised EPS has doubled in past three years…
Figure 42: …but payouts have declined due to circular debt
-
10
20
30
40
50
60
70
80
FY04 FY05 FY06 FY07 FY08 FY09 FY10
Normalised EPS Dividends
PRs/share
0%
10%
20%
30%
40%
50%
60%
70%
80%
90%
FY04 FY05 FY06 FY07 FY08 FY09 FY10
Source: Company data Source: Company data
Circular debt is basically inter-company debt within the Pakistan energy sector, which has accrued as a result of electricity tariffs being kept below cost recovery levels. This in turn has resulted in a cash draught in energy sector due to non payment of subsidies by the government. Turnover tax on the other hand is the minimum tax that any company has to pay. For PSO, this means an effective tax rate in the range of 45-50%.
Figure 43: Work capital investments have increased due to circular debt
Figure 44: Resolution of turnover tax will decrease effective tax rate
-20
-15
-10
-5
0
5
10
15
20
25
30
4qFy
06
2qFy
07
4qFy
07
2qFy
08
4qFy
08
2qFy
09
4qFy
09
2qFy
10
4qFy
10
PRs bn+ve value shows investmentinto working capital
0%
10%
20%
30%
40%
50%
60%
FY11E FY12E FY13E FY14E FY15E
Effective tax rate Effective tax rate if 1% turnover tax is applied
Source: Company data Source: Company data, Credit Suisse estimates
Due to volume and margin increase, core earnings have increased 1.5 times

11 November 2010
Pakistan Energy Sector 20
Turnover tax near resolution, circular debt resolution is next; payouts should increase Although a formal notification is awaited, press reports suggest that the government has already approved the reduction in turnover tax to 0.5% for all companies having sales greater than PRs1 bn. We believe this measure will improve earnings visibility of the company in the near term and will also reduce the policy overhang and uncertainty over company’s rock-solid earning profile. Additionally, a likely reversal of PRs16/share in tax expense will further increase FY11 earnings.
Now the only looming issue hindering company’s stock price growth is circular debt. But, as discussed earlier, circular debt will be less of a concern after FY11 because: (i) the government is determined to eliminate electricity subsidies and has already committed to the IMF to carry out reforms in the electricity sector, (ii) current tariffs cover 75% of generation costs versus 67% in FY10, and (iii) by FY11, electricity tariffs are expected to increase by another 17% and cover 92% of electricity generation costs.
We believe that with resolution of both these issues, earnings visibility of PSO’s should improve. Also higher cash flows as a result of circular debt resolution will allow company to resume routine operations and revert to historical payout ratios.
Assuming coverage with an OUTPERFORM We assume coverage of Pakistan State Oil with a revised target price of PRs381.
With resumption of normal payouts the biggest catalyst for the company’s stock price, we shift our valuation methodology and value PSO at a target dividend yield of 8.5%.
Figure 45: PSO valuation matrix Target P/E at Div yield at EV/EBITDA at EPS DPS Target price (TP) target price target price target price FY11 FY12 FY11 FY12 D/Y Dec-11 FY11 FY12 FY11 FY12 FY11 FY12PSO 54 66 19 46 8.5 381 7.07 5.81 4.95 12.05 4.14 3.39
Source: Credit Suisse estimates
The company is currently trading at 24% discount to market P/E of 7x. Furthermore, the stock price of the company has also lagged the market in recent times due to issues of circular debt and turnover tax, and at current price offers 34% return to our target price.
Figure 46: Change from previous estimates New estimates Previous estimates Rating TP EPS FY11E EPS FY12E Rating TP EPS FY11E EPS FY12EPSO O 381 53.9 65.6 O 390 60.5 69.5
Source: Credit Suisse estimates
Press reports indicate that the government has approved the reduction in turnover tax for large-size companies
We expect circular debt resolution in FY11; this will increase earnings visibility, which was lacking in previous years
We value PSO with a target dividend yield of 8.54%, with target price of PRs 407
11 November 2010
Pakistan Energy Sector 21
Risks Adverse oil price movements can lower company margins
As prices of petroleum products move broadly in line with oil prices, adverse oil price movements can cause product prices to decrease, which can decrease company margins on de-regulated products. Likewise, lower oil prices may even prompt the government to lower margins on regulated products.
Furthermore, adverse oil price movements can also result in inventory losses for the company.
Rapid rupee depreciation
Since the company normally gets 14 days of credit period from international suppliers, a rapid rupee depreciation can result in high exchange losses for the company.
Circular debt may not get resolved
The company has been among the worst affected entities because of circular debt. Hence if the resolution of circular debt prolongs, company’s earnings and payouts will continue to suffer until circular debt gets resolved.
Government may not exempt OMCs from turnover tax
Under the current tax regime, PSO is liable to pay taxes at a rate of 1% of its net revenues. If the company does not get an exemption from this regime, effective tax rate for the company will increase to 45-50% from the current 35%.
Regulatory risk
Prices and OMC margins for certain petroleum products are notified by the government. Hence, there is a risk that the government, in order to meet its political and social objectives, may revise margins of regulated products in a way which is detrimental to the company.
Political risks
The government of Pakistan is the majority owner of PSO. Hence, as a majority shareholder, the government may pursue some of its macroeconomic and social activities through the company. As a result, the company can engage in certain activities which may not be based purely on commercial considerations.
11 November 2010
Pakistan Energy Sector 22
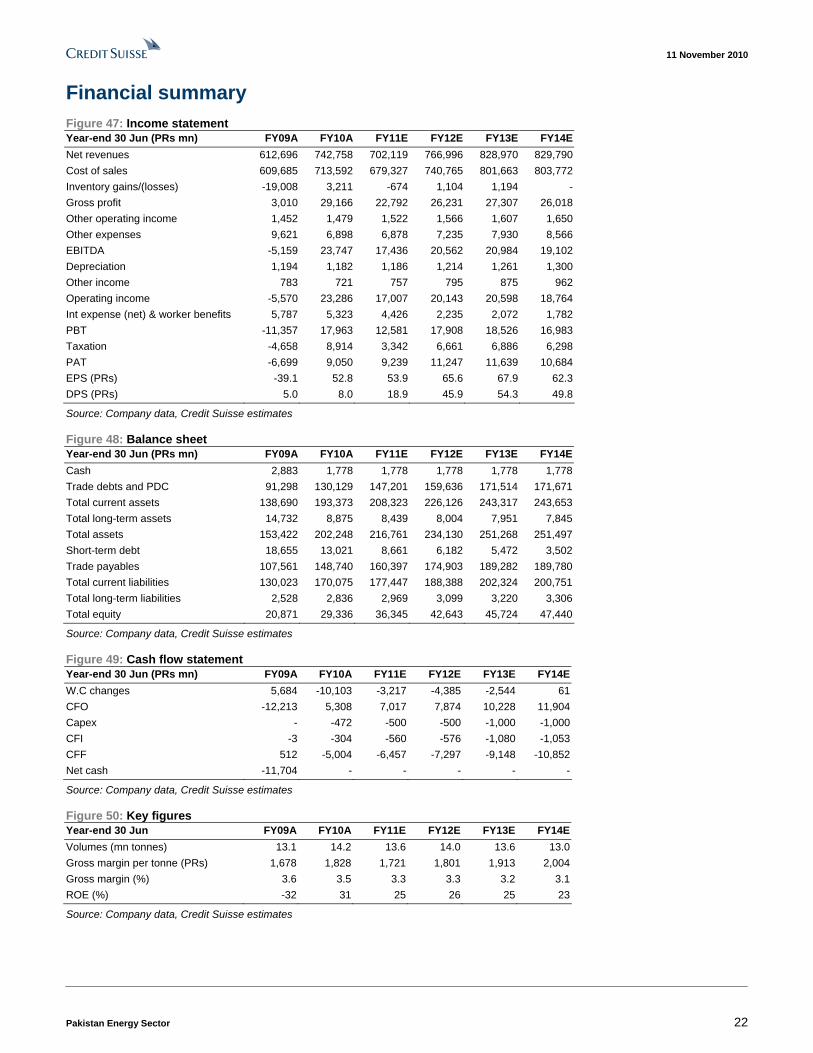
Financial summary Figure 47: Income statement Year-end 30 Jun (PRs mn) FY09A FY10A FY11E FY12E FY13E FY14E Net revenues 612,696 742,758 702,119 766,996 828,970 829,790 Cost of sales 609,685 713,592 679,327 740,765 801,663 803,772 Inventory gains/(losses) -19,008 3,211 -674 1,104 1,194 - Gross profit 3,010 29,166 22,792 26,231 27,307 26,018 Other operating income 1,452 1,479 1,522 1,566 1,607 1,650 Other expenses 9,621 6,898 6,878 7,235 7,930 8,566 EBITDA -5,159 23,747 17,436 20,562 20,984 19,102 Depreciation 1,194 1,182 1,186 1,214 1,261 1,300 Other income 783 721 757 795 875 962 Operating income -5,570 23,286 17,007 20,143 20,598 18,764 Int expense (net) & worker benefits 5,787 5,323 4,426 2,235 2,072 1,782 PBT -11,357 17,963 12,581 17,908 18,526 16,983 Taxation -4,658 8,914 3,342 6,661 6,886 6,298 PAT -6,699 9,050 9,239 11,247 11,639 10,684 EPS (PRs) -39.1 52.8 53.9 65.6 67.9 62.3 DPS (PRs) 5.0 8.0 18.9 45.9 54.3 49.8
Source: Company data, Credit Suisse estimates
Figure 48: Balance sheet Year-end 30 Jun (PRs mn) FY09A FY10A FY11E FY12E FY13E FY14E Cash 2,883 1,778 1,778 1,778 1,778 1,778 Trade debts and PDC 91,298 130,129 147,201 159,636 171,514 171,671 Total current assets 138,690 193,373 208,323 226,126 243,317 243,653 Total long-term assets 14,732 8,875 8,439 8,004 7,951 7,845 Total assets 153,422 202,248 216,761 234,130 251,268 251,497 Short-term debt 18,655 13,021 8,661 6,182 5,472 3,502 Trade payables 107,561 148,740 160,397 174,903 189,282 189,780 Total current liabilities 130,023 170,075 177,447 188,388 202,324 200,751 Total long-term liabilities 2,528 2,836 2,969 3,099 3,220 3,306 Total equity 20,871 29,336 36,345 42,643 45,724 47,440
Source: Company data, Credit Suisse estimates
Figure 49: Cash flow statement Year-end 30 Jun (PRs mn) FY09A FY10A FY11E FY12E FY13E FY14EW.C changes 5,684 -10,103 -3,217 -4,385 -2,544 61CFO -12,213 5,308 7,017 7,874 10,228 11,904Capex - -472 -500 -500 -1,000 -1,000CFI -3 -304 -560 -576 -1,080 -1,053CFF 512 -5,004 -6,457 -7,297 -9,148 -10,852Net cash -11,704 - - - - -
Source: Company data, Credit Suisse estimates
Figure 50: Key figures Year-end 30 Jun FY09A FY10A FY11E FY12E FY13E FY14EVolumes (mn tonnes) 13.1 14.2 13.6 14.0 13.6 13.0Gross margin per tonne (PRs) 1,678 1,828 1,721 1,801 1,913 2,004Gross margin (%) 3.6 3.5 3.3 3.3 3.2 3.1ROE (%) -32 31 25 26 25 23
Source: Company data, Credit Suisse estimates
11 November 2010
Pakistan Energy Sector 23
Asia Pacific / PakistanPower
Hub Power Company (HPWR.KA / HUBC PA)
INITIATION
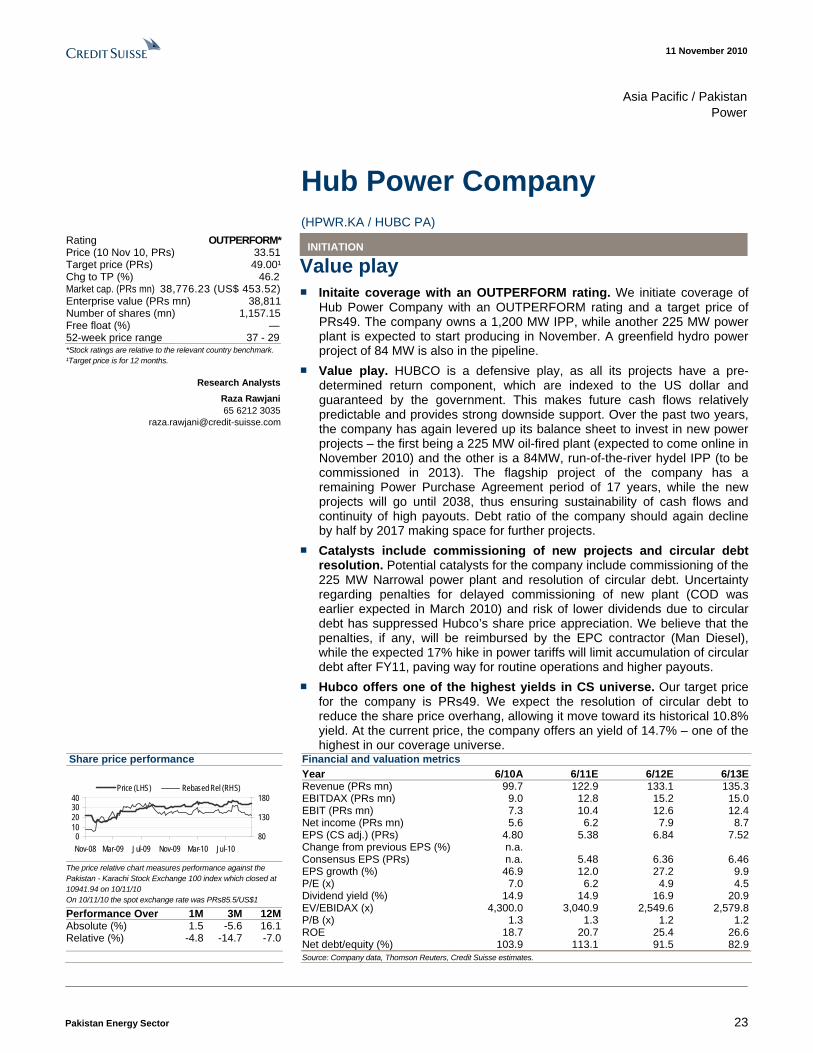
Value play ■ Initaite coverage with an OUTPERFORM rating. We initiate coverage of
Hub Power Company with an OUTPERFORM rating and a target price of PRs49. The company owns a 1,200 MW IPP, while another 225 MW power plant is expected to start producing in November. A greenfield hydro power project of 84 MW is also in the pipeline.
■ Value play. HUBCO is a defensive play, as all its projects have a pre-determined return component, which are indexed to the US dollar and guaranteed by the government. This makes future cash flows relatively predictable and provides strong downside support. Over the past two years, the company has again levered up its balance sheet to invest in new power projects – the first being a 225 MW oil-fired plant (expected to come online in November 2010) and the other is a 84MW, run-of-the-river hydel IPP (to be commissioned in 2013). The flagship project of the company has a remaining Power Purchase Agreement period of 17 years, while the new projects will go until 2038, thus ensuring sustainability of cash flows and continuity of high payouts. Debt ratio of the company should again decline by half by 2017 making space for further projects.
■ Catalysts include commissioning of new projects and circular debt resolution. Potential catalysts for the company include commissioning of the 225 MW Narrowal power plant and resolution of circular debt. Uncertainty regarding penalties for delayed commissioning of new plant (COD was earlier expected in March 2010) and risk of lower dividends due to circular debt has suppressed Hubco’s share price appreciation. We believe that the penalties, if any, will be reimbursed by the EPC contractor (Man Diesel), while the expected 17% hike in power tariffs will limit accumulation of circular debt after FY11, paving way for routine operations and higher payouts.
■ Hubco offers one of the highest yields in CS universe. Our target price for the company is PRs49. We expect the resolution of circular debt to reduce the share price overhang, allowing it move toward its historical 10.8% yield. At the current price, the company offers an yield of 14.7% – one of the highest in our coverage universe.
Share price performance
010203040
Nov-08 Mar-09 Jul-09 Nov-09 Mar-10 Jul-1080
130
180Price (LHS) Rebased Rel (RHS)
The price relative chart measures performance against the Pakistan - Karachi Stock Exchange 100 index which closed at 10941.94 on 10/11/10 On 10/11/10 the spot exchange rate was PRs85.5/US$1
Performance Over 1M 3M 12M Absolute (%) 1.5 -5.6 16.1 Relative (%) -4.8 -14.7 -7.0
Financial and valuation metrics
Year 6/10A 6/11E 6/12E 6/13ERevenue (PRs mn) 99.7 122.9 133.1 135.3EBITDAX (PRs mn) 9.0 12.8 15.2 15.0EBIT (PRs mn) 7.3 10.4 12.6 12.4Net income (PRs mn) 5.6 6.2 7.9 8.7EPS (CS adj.) (PRs) 4.80 5.38 6.84 7.52Change from previous EPS (%) n.a. Consensus EPS (PRs) n.a. 5.48 6.36 6.46EPS growth (%) 46.9 12.0 27.2 9.9P/E (x) 7.0 6.2 4.9 4.5Dividend yield (%) 14.9 14.9 16.9 20.9EV/EBIDAX (x) 4,300.0 3,040.9 2,549.6 2,579.8P/B (x) 1.3 1.3 1.2 1.2ROE 18.7 20.7 25.4 26.6Net debt/equity (%) 103.9 113.1 91.5 82.9
Source: Company data, Thomson Reuters, Credit Suisse estimates.
*Stock ratings are relative to the relevant country benchmark. ¹Target price is for 12 months.
Research Analysts Raza Rawjani 65 6212 3035
Rating OUTPERFORM* Price (10 Nov 10, PRs) 33.51 Target price (PRs) 49.00¹ Chg to TP (%) 46.2 Market cap. (PRs mn) 38,776.23 (US$ 453.52) Enterprise value (PRs mn) 38,811 Number of shares (mn) 1,157.15 Free float (%) — 52-week price range 37 - 29

11 November 2010
Pakistan Energy Sector 24
Value play HUBCO is a defensive play, as all its projects have a pre-determined return component, which are indexed to the US dollar and guaranteed by the government. This makes future cash flows relatively predictable and provides strong downside support. Over the past two years, the company has again levered up its balance sheet to invest in new power projects – the first being a 225 MW oil-fired plant (expected to come online in November 2010) and the other is a 84MW, run-of-the-river hydel IPP (to be commissioned in 2013). The flagship project of the company (a 1,200 MW oil-fired power plant) has a remaining Power Purchase Agreement period of 17 years, while the new projects will go until 2038, thus ensuring sustainability of cash flows and continuity of high payouts. Debt ratio of the company should again decline by half by 2017 making space for future projects.
Predictable cash flows limit downside Like all IPPs in Pakistan, Hub Power Company has a predetermined return component for all its power projects; this makes cash flows predictable and provides downside support. The payments made to the company under this structure are: (1) independent of capacity utilisation, (2) defined in US dollars (3) indexed to the US CPI (only for company’s flagship 1,200 MW power project), and (4) are guaranteed by the government. Almost all other costs incurred by the company, including fuel costs and O&M costs are passed through. Even the debt assumed by company for financing power projects is passed through.
Figure 51: Annual projected return per share for Hub Power Company IPPs
-
2
4
6
8
10
12
14
16
18
20
FY 20
11
FY 20
13
FY 20
15
FY 20
17
FY 20
19
FY 20
21
FY 2
023
FY 20
25
FY 20
27
FY 20
29
FY 20
31
FY 20
33
FY 2
035
FY 20
37
PRs/share
Hubco 1,200 MW plantPayments indexed to US CPI & US$Project ends 2027
Hubco 214 MW Narrowl plantPayments indexed to US$Project ends 2035
Hubco 84 MW Hydro IPPPayments indexed to US$Project ends 2038
Source: PPIB, Credit Suisse estimates
New projects to contribute to dividends from 2014 We expect the contributions from the new projects (Narrowal and Laraib) to start reflecting in dividends from FY14.
Hubco Narrowal Project
The Narrowal project is expected to achieve commercial operations date (COD) in November 2010. However, we do not see the project to contribute toward final dividends until FY14, as the ROE component of the tariff structure will first be used to make the interest and principal repayments (25% equity component of the project has been raised as debt on company’s balance sheet). Hence, dividend contributions from the Narrowal project will be back-loaded.
Hubco has predetermined return component, which is indexed to USD and guaranteed by the government. Thus, cash flows are easier to predict
The company has levered its balance sheet to invest into new projects. We expect contribution from new projects to start from FY14
11 November 2010
Pakistan Energy Sector 25
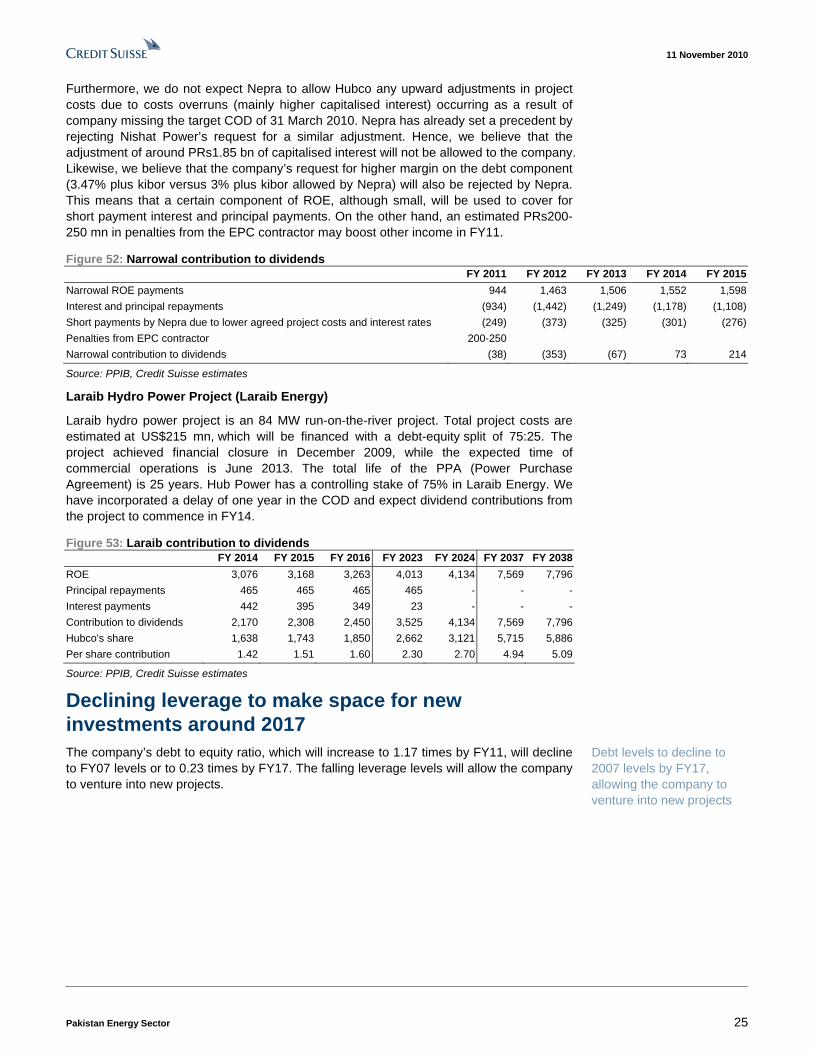
Furthermore, we do not expect Nepra to allow Hubco any upward adjustments in project costs due to costs overruns (mainly higher capitalised interest) occurring as a result of company missing the target COD of 31 March 2010. Nepra has already set a precedent by rejecting Nishat Power’s request for a similar adjustment. Hence, we believe that the adjustment of around PRs1.85 bn of capitalised interest will not be allowed to the company. Likewise, we believe that the company’s request for higher margin on the debt component (3.47% plus kibor versus 3% plus kibor allowed by Nepra) will also be rejected by Nepra. This means that a certain component of ROE, although small, will be used to cover for short payment interest and principal payments. On the other hand, an estimated PRs200-250 mn in penalties from the EPC contractor may boost other income in FY11.
Figure 52: Narrowal contribution to dividends FY 2011 FY 2012 FY 2013 FY 2014 FY 2015Narrowal ROE payments 944 1,463 1,506 1,552 1,598Interest and principal repayments (934) (1,442) (1,249) (1,178) (1,108)Short payments by Nepra due to lower agreed project costs and interest rates (249) (373) (325) (301) (276)Penalties from EPC contractor 200-250 Narrowal contribution to dividends (38) (353) (67) 73 214
Source: PPIB, Credit Suisse estimates
Laraib Hydro Power Project (Laraib Energy)
Laraib hydro power project is an 84 MW run-on-the-river project. Total project costs are estimated at US$215 mn, which will be financed with a debt-equity split of 75:25. The project achieved financial closure in December 2009, while the expected time of commercial operations is June 2013. The total life of the PPA (Power Purchase Agreement) is 25 years. Hub Power has a controlling stake of 75% in Laraib Energy. We have incorporated a delay of one year in the COD and expect dividend contributions from the project to commence in FY14.
Figure 53: Laraib contribution to dividends FY 2014 FY 2015 FY 2016 FY 2023 FY 2024 FY 2037 FY 2038 ROE 3,076 3,168 3,263 4,013 4,134 7,569 7,796 Principal repayments 465 465 465 465 - - - Interest payments 442 395 349 23 - - - Contribution to dividends 2,170 2,308 2,450 3,525 4,134 7,569 7,796 Hubco's share 1,638 1,743 1,850 2,662 3,121 5,715 5,886 Per share contribution 1.42 1.51 1.60 2.30 2.70 4.94 5.09
Source: PPIB, Credit Suisse estimates
Declining leverage to make space for new investments around 2017 The company’s debt to equity ratio, which will increase to 1.17 times by FY11, will decline to FY07 levels or to 0.23 times by FY17. The falling leverage levels will allow the company to venture into new projects.
Debt levels to decline to 2007 levels by FY17, allowing the company to venture into new projects

11 November 2010
Pakistan Energy Sector 26
Figure 54: Declining leverage will make space for new projects in FY17-18
-
5,000
10,000
15,000
20,000
25,000
30,000
35,000
40,000FY
99
FY00
FY01
FY02
FY03
FY04
FY05
FY06
FY07
FY08
FY09
FY10
FY11
FY12
FY13
FY14
FY15
FY16
FY17
FY18
-
0.20
0.40
0.60
0.80
1.00
1.20
1.40
1.60
Debt D/E (RHS)
New Projects
PRs mn (x)
Source: Credit Suisse estimates
Dividends have held up despite circular debt The company has been able to manage its mounting circular debt receivables by withholding payments of its fuel supplier (PSO.KA) and through higher short-term borrowings (Figure 57). Consequently, dividends have not suffered as they have in the case of upstream companies. Furthermore, a rising tariff structure has also supported dividend payouts.
Figure 55: Dividends have held up Figure 56: Increased debt and payable days have financed circular debt
-
1
2
3
4
5
6
7
8
FY05
FY06
FY07
FY08
FY09
FY10
FY11
FY12
FY13
FCF/share DPS
PRs/share
(8,000)
(3,000)
2,000
7,000
12,000
17,000
22,000
27,000
FY08 FY09 FY10
Chng in payables Chng in ST debt Chng in receivables
PRs mn
Source: Company data, Credit Suisse estimates Source: Company data, Credit Suisse estimates
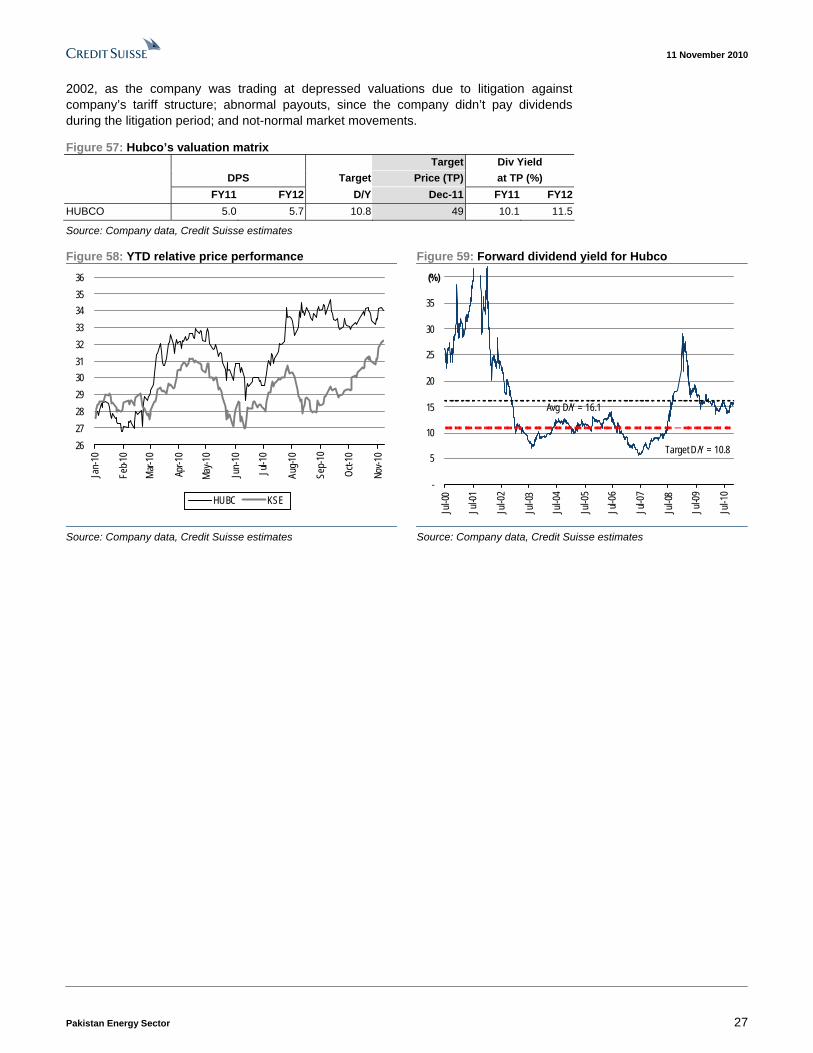
Initiate coverage with an OUTPERFORM We initiate coverage of Hub Power Company with a target price of PRs49 and an OUTPERFORM rating. The company is currently trading at a FY11 dividend yield of 14.9%.
We value Hubco at PRs49 with a target dividend yield of 10.8%. Our target dividend yield of 10.8% is the average of forward dividend yields from July 2002 to June 2008, which we believe was the normal trading period for the stock. We exclude the period before July
Hubco has financed delayed payments from government by delaying payments to fuel suppliers and by assuming short-term debt. Hence, dividends have not suffered
We value Hubco with a target dividend yield of 10.8%, with target price of PRs49
11 November 2010
Pakistan Energy Sector 27
2002, as the company was trading at depressed valuations due to litigation against company’s tariff structure; abnormal payouts, since the company didn’t pay dividends during the litigation period; and not-normal market movements.
Figure 57: Hubco’s valuation matrix Target Div Yield DPS Target Price (TP) at TP (%) FY11 FY12 D/Y Dec-11 FY11 FY12 HUBCO 5.0 5.7 10.8 49 10.1 11.5
Source: Company data, Credit Suisse estimates
Figure 58: YTD relative price performance Figure 59: Forward dividend yield for Hubco
2627282930313233343536
Jan-
10
Feb-1
0
Mar-
10
Apr-1
0
May-1
0
Jun-
10
Jul-1
0
Aug-1
0
Sep-
10
Oct-1
0
Nov-1
0
HUBC KSE
-
5
10
15
20
25
30
35
40
Jul-0
0
Jul-0
1
Jul-0
2
Jul-0
3
Jul-0
4
Jul-0
5
Jul-0
6
Jul-0
7
Jul-0
8
Jul-0
9
Jul-1
0
(%)
Avg D/Y = 16.1
Target D/Y = 10.8
Source: Company data, Credit Suisse estimates Source: Company data, Credit Suisse estimates

11 November 2010
Pakistan Energy Sector 28
Risks Revision in power purchase agreement
The government may unilaterally revise the power purchase agreement in a way which can hurt future earnings. Possible amendments can be lower tariffs or removal of USD indexation.
Imposition of income tax
Company’s earnings are currently exempt from paying income tax. However, the government may force the company to pay income tax in the future.
Delay in new projects
There is a possibility that the new projects the company is working on may not materialise in time. As a result, the company may have to pay certain penalties to PPIB.
No growth beyond current projects
The company’s flagship project has a remaining project life of 17 years, while the new projects of the company will go until 2038. Beyond this, the company has not announced any projects.
Circular debt may not get resolved
Circular debt has affected the company’s operations and payout capacity to a certain extent. Hence, a delay in the circular debt resolution can result in lower payouts.

11 November 2010
Pakistan Energy Sector 29
Financial summary Figure 60: Income statement Year-end 30 Jun (PRs mn) FY 2009 FY 2010 FY 2011E FY 2012E FY 2013E PRs/USD 78 84 89 93 95 Revenue 82,784 99,694 122,898 133,140 135,337 Op. costs 74,995 90,309 109,643 117,340 119,668 Gross profit 7,789 9,385 13,255 15,800 15,669 EBITDA 7,446 9,018 12,751 15,209 15,031 Depreciation 1,709 1,721 2,339 2,651 2,658 EBIT 5,737 7,296 10,412 12,558 12,373 Financial charges 2,095 1,794 4,279 4,731 3,746 PAT 3,781 5,556 6,223 7,916 8,697 EPS (PRs) 3.27 4.80 5.38 6.84 7.52 Adj. EPS (PRs) 2.42 3.95 3.54 4.02 4.69 DPS (PRs) 3.3 5.0 5.0 5.7 7.0
Source: Company data, Credit Suisse estimates
Figure 61: Balance sheet Year-end 30 Jun (PRs mn) FY 2009 FY 2010 FY 2011E FY 2012E FY 2013ECash 1,034 809 1,000 1,000 1,000 Trade debts 46,629 66,712 84,322 74,109 62,890 Other current assets 3,964 2,937 4,446 4,627 4,735 Fixed assets 38,559 52,237 51,643 50,044 48,060 Total assets 90,186 122,696 141,411 129,780 116,685 Trade payable 41,992 55,606 67,075 57,567 47,719 Short-term debt 3,582 6,744 8,217 6,513 8,162 Long-term debt 12,320 25,100 27,059 23,793 20,527 Other liabilities 2,759 5,364 8,746 9,860 6,865 Equity 29,532 29,881 30,314 32,046 33,413
Source: Company data, Credit Suisse estimates
Figure 62: Cash flow statement Year-end 30 Jun (PRs mn) FY 2009 FY 2010 FY 2011E FY 2012E FY 2013E EBITDA 7,446 9,018 12,751 15,209 15,031 Working capital changes 7,516 (5,181) (8,053) (3,052) (5,479) CFO 14,963 3,837 4,699 12,157 9,552 Capex (5,668) (13,453) (1,032) (126) (130) CFI (6,181) (14,817) (2,150) (1,004) (604) Change in LT debt 4,049 12,780 1,959 (3,266) (3,266) Change in ST debt (9,745) 3,161 1,474 (1,704) 1,649 Dividends (2,716) (5,194) (5,791) (6,184) (7,330) CFF (8,412) 10,748 (2,358) (11,154) (8,948) Net cash 370 (231) 191 - -
Source: Company data, Credit Suisse estimates
Figure 63: Ratio analysis Ratios (%) FY 2009 FY 2010 FY 2011E FY 2012E FY 2013EGross margin 9 9 11 12 12EBITDA margin 9 9 10 11 11Net margin 5 6 5 6 6Debt to equity (x) 0.54 1.07 1.16 0.95 0.86 Debt to assets (x) 0.18 0.26 0.25 0.23 0.25
Source: Company data, Credit Suisse estimates

11 November 2010
Pakistan Energy Sector 30
Asia Pacific / PakistanOil & Gas Exploration & Production
Oil & Gas Development Company (OGDC.KA / OGDC PA)
ASSUMING COVERAGE
Belated volume resurgence ■ Assume coverage with an OUTPERFORM rating. We are assuming
coverage of OGDC with a revised target price of 173 and an OUTPERFORM rating.
■ Production growth finally materialising. Oil and Gas Development Co. (OGDC) is all set for a volume renaissance during FY11-14E, whereby total production of the company will increase 49%, underpinning a similar increase in earnings. The growth will be driven by the homecoming of the long-awaited development projects in Qadirpur, Uch, Sinjhoro and Kunar Pasakhi deep fields. Once online, these projects will add incremental 32 mn boe to total production. The growth story is further augmented by the surge in production from Mela, Nashpa and Tal fields. Full production potential of these discoveries is expected in FY11-15E – when total production from these fields should nearly double to 9 mn boe in FY15 from 5 mn boe in FY10.
■ Catalysts. Resolution of circular debt, commencement of production from development projects and improvement of security situation in potential exploration areas are key catalyst for the company..
■ 49% earnings growth justify a higher PE multiple. OGDC is currently trading near its average PE multiple of 9.7. However, with volumes and earnings expected to grow by 49% in the next four years as against a 2% volume growth in the last four years, an above average PE multiple is justified, in our view. Even historically, in years of high earnings growth, the company has traded at a higher than average P/E multiple.
Share price performance
050
100150200
Nov-08 Mar-09 Jul-09 Nov-09 Mar-10 Jul-1060
110
160Price (LHS) Rebased Rel (RHS)
The price relative chart measures performance against the Pakistan - Karachi Stock Exchange 100 index which closed at 10941.94 on 10/11/10 On 10/11/10 the spot exchange rate was PRs85.5/US$1
Performance Over 1M 3M 12M Absolute (%) 7.7 12.0 55.7 Relative (%) 1.0 1.2 24.7
Financial and valuation metrics
Year 6/10A 6/11E 6/12E 6/13ERevenue (PRs mn) 125,843.0 137,091.3 147,068.3 157,081.6EBITDAX (PRs mn) 109,463.5 118,227.1 125,982.1 133,303.0EBIT (PRs mn) 91,122.4 98,103.4 106,292.6 116,171.9Net income (PRs mn) 59,177.1 65,385.2 70,982.8 77,421.2EPS (CS adj.) (PRs) 13.76 15.20 16.50 18.00Change from previous EPS (%) n.a. -9.9 -13.4Consensus EPS (PRs) n.a. 15.0 16.5 16.4EPS growth (%) 6.5 10.5 8.6 9.1P/E (x) 11.5 10.4 9.6 8.8Dividend yield (%) 3.5 3.9 6.3 6.8EV/EBIDAX (x) 6.2 5.7 5.4 5.1P/B (x) 4.3 3.4 2.9 2.6ROE 41.7 36.8 33.0 31.3Net debt/equity (%) net cash net cash net cash net cash
Source: Company data, Thomson Reuters, Credit Suisse estimates.
*Stock ratings are relative to the relevant country benchmark. ¹Target price is for 12 months.
Research Analysts Raza Rawjani 65 6212 3035
Prashant Gokhale 852 2101 6944
Rating OUTPERFORM* Price (10 Nov 10, PRs) 158.06 Target price (PRs) (from 131.00) 173.00¹ Chg to TP (%) 9.5 Market cap. (PRs mn) 679,805 (US$ 7,951) Enterprise value (PRs mn) 666,477 Number of shares (mn) 4,300.93 Free float (%) 14.98 52-week price range 159 - 100

11 November 2010
Pakistan Energy Sector 31
Belated volume resurgence Homecoming of major development projects and production from discoveries made over the past four years should underpin a cumulative 49% growth in OGDC’s volumes over the next four years. Earnings should follow suit with a similar jump. The setting would be similar to FY05-06, wherein a 24% increase in volumes with a little help from rising oil price doubled earnings and stock price, and supported an aggressive exploration programme.
Now, as the company again ventures on a volume-driven growth trajectory (cumulative volume growth after 2006 was only 2.3%), we raise our target price to PRs173 and maintain our OUTPERFORM rating.
Production volumes to rise 49% by FY14E OGDC is all set for a volume renaissance, as the company’s production is expected to increase by 49% in the next four years versus a growth of 2.3% in the previous four years. This growth will be driven by the completion of development projects in Qadirpur, Uch, Sinjhoro and Kunar Pasakhi deep fields, which in total will add 32mn boe to company’s production. Another 4mn boe will come from ramp up of production in Mela, Nashpa and Tal fields.
Homecoming of development projects
We expect the major development projects of the company – (i) Qadirpur compression, (ii) Uch II development, (iii) Sinjhoro development, (iv) Dakhni expansion and (v) KPD-TAY (Kunnar Pasakhi deep – Tando Allah Yar) – to come online in the next four years. These projects were originally scheduled to come online/get awarded during 2008-09. But due to technical difficulties and legal battles, the company was not able to keep up with the timeline.
Most of these hurdles have now been sorted out by company, and management expects completion of all these projects in next 18-24 months. Though we are convinced that the homecoming of these projects is near, we still take a conservative stance and model in completion of the above projects to go until FY14.
Figure 64: Company guidance on development projects Completion Project Expected incremental production date Status Qadirpur Maintain plateau at 650 mmcf/d Feb-08 Compressors were installed in September 2010; production
ramp up expected from November 2010 Uch 200 mmcf/d Jun-08 18 months after award of contract; award of contract expected
soon Sinjhoro 25-30mmcf/d gas, 3,000-3,500 bbls/d oil Jan-07 Completion expected in June 2011 Kunar Pasakhi TAY 284 mmcf/d gas, 4,400 bbls/d oil 2008* Award of contract expected soon; completion expected in May
2012 Dhakni 12 mmcf/d gas, 720 bbls/d oil Mar-07 Completion expected in October 2011
*award of contract Source: Company data, Credit Suisse estimates
Kohat block to achieve optimal production levels by 2015
MOL Pakistan, which is the operator for Tal block, estimates peak production from the field to come in 2015. During 2010-2012, the company plans to drill three new exploration wells, two appraisal wells and four development wells. The company also plans to install a new 150 mmcf/d capacity processing train at Manazali CPF to process Makori field gas. This will take total processing capacity of the field to 520 mmcf/d by 2012.
Likewise, exploratory and development work at Nashpa and Mela fields is still not finished. An appraisal well Nashpa-2 is being drilled in the Nashpa field and can result in upward revision of reserve estimates. Initial reserve estimates of the field, based on only one well, are 10.4 mn barrels of oil. Similarly, Mela-3, a development well is also expected to commence production in 2Q FY11 and could add 1,200 barrels of oil per day.
Completion of the long-awaited development projects, along with ramp up of production from new fields, should increase volumes 49% over the next four years
Major development projects to come online are Qadirpur compression, Uch II, Sinjhoro, Kunnar Pasakhi Deep and Dakhni expanison
Ramp of production in Kohat block will further augment volume growth

11 November 2010
Pakistan Energy Sector 32
Aggressive exploration plans… Pakistan has a large sedimentary basin of 827,268 sq km, which is largely unexplored (only 31% of the area is currently licensed out with three exploration wells per 1,000 sq km versus around seven for the US), has a history of large discoveries and has an above-average success rate (29% for wildcats versus 25% globally).
Figure 65: Map of OGDC’s exploration blocks
Source: Company data
OGDC appears well positioned to take advantage of the large sedimentary basin. It is currently active in 43 concessions (35 as an operator and 8 as a JV partner) and accounts for about 35% of total awarded acreage. Exploration record of the company is also impeccable, boasting of 50% of all explorations over the past five years and 35% of total exploration in Pakistan.
For FY11, the company has announced a capex plan of US$800 mn. This includes US$380 mn for drilling 48 wells, US$230 mn for development projects and US$190 mn for acquisition of new assets. The drilling target of 48 wells includes 11 exploratory wells, which are subject to availability of security clearance. The company has maintained an
Pakistan has a large, unexplored sedimentary basin and OGDC is well positioned to take advantage of it. The company is active in 43 concessions and drilled 50% of all exploratory wells during the past four years
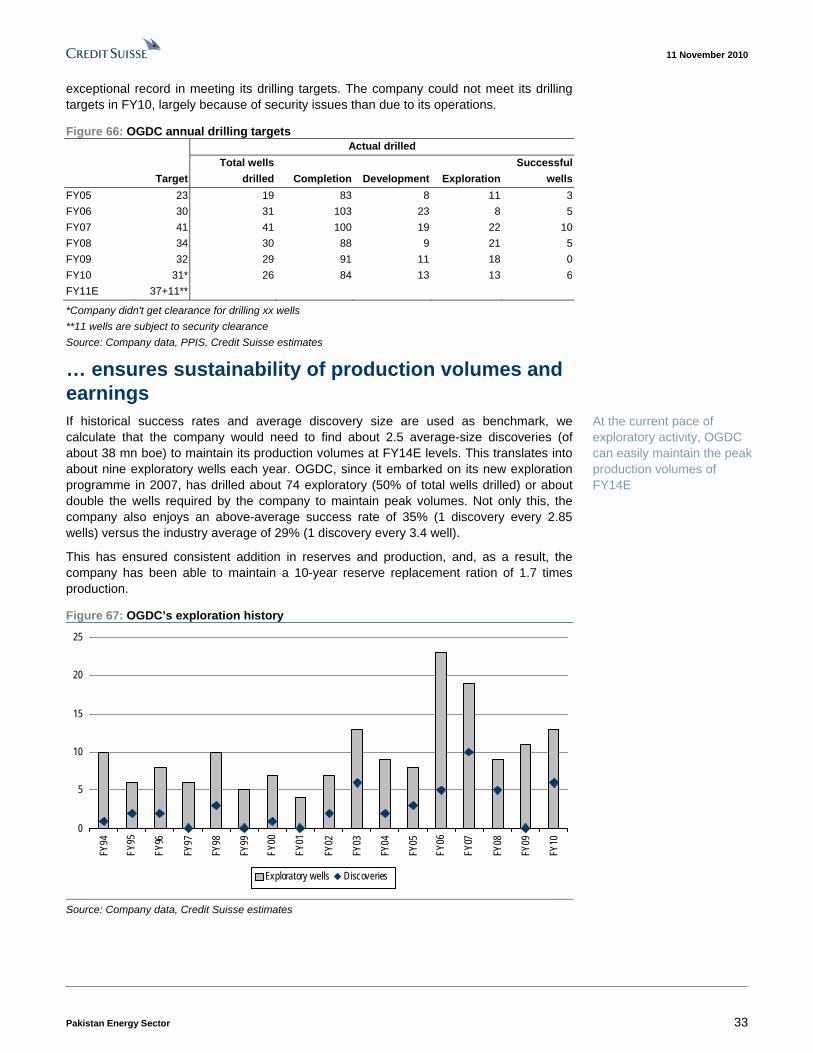
11 November 2010
Pakistan Energy Sector 33
exceptional record in meeting its drilling targets. The company could not meet its drilling targets in FY10, largely because of security issues than due to its operations.
Figure 66: OGDC annual drilling targets Actual drilled Total wells Successful Target drilled Completion Development Exploration wells FY05 23 19 83 8 11 3 FY06 30 31 103 23 8 5 FY07 41 41 100 19 22 10 FY08 34 30 88 9 21 5 FY09 32 29 91 11 18 0 FY10 31* 26 84 13 13 6 FY11E 37+11**
*Company didn't get clearance for drilling xx wells **11 wells are subject to security clearance Source: Company data, PPIS, Credit Suisse estimates
… ensures sustainability of production volumes and earnings If historical success rates and average discovery size are used as benchmark, we calculate that the company would need to find about 2.5 average-size discoveries (of about 38 mn boe) to maintain its production volumes at FY14E levels. This translates into about nine exploratory wells each year. OGDC, since it embarked on its new exploration programme in 2007, has drilled about 74 exploratory (50% of total wells drilled) or about double the wells required by the company to maintain peak volumes. Not only this, the company also enjoys an above-average success rate of 35% (1 discovery every 2.85 wells) versus the industry average of 29% (1 discovery every 3.4 well).
This has ensured consistent addition in reserves and production, and, as a result, the company has been able to maintain a 10-year reserve replacement ration of 1.7 times production.
Figure 67: OGDC’s exploration history
0
5
10
15
20
25
FY94
FY95
FY96
FY97
FY98
FY99
FY00
FY01
FY02
FY03
FY04
FY05
FY06
FY07
FY08
FY09
FY10
Exploratory wells Discoveries
Source: Company data, Credit Suisse estimates
At the current pace of exploratory activity, OGDC can easily maintain the peak production volumes of FY14E
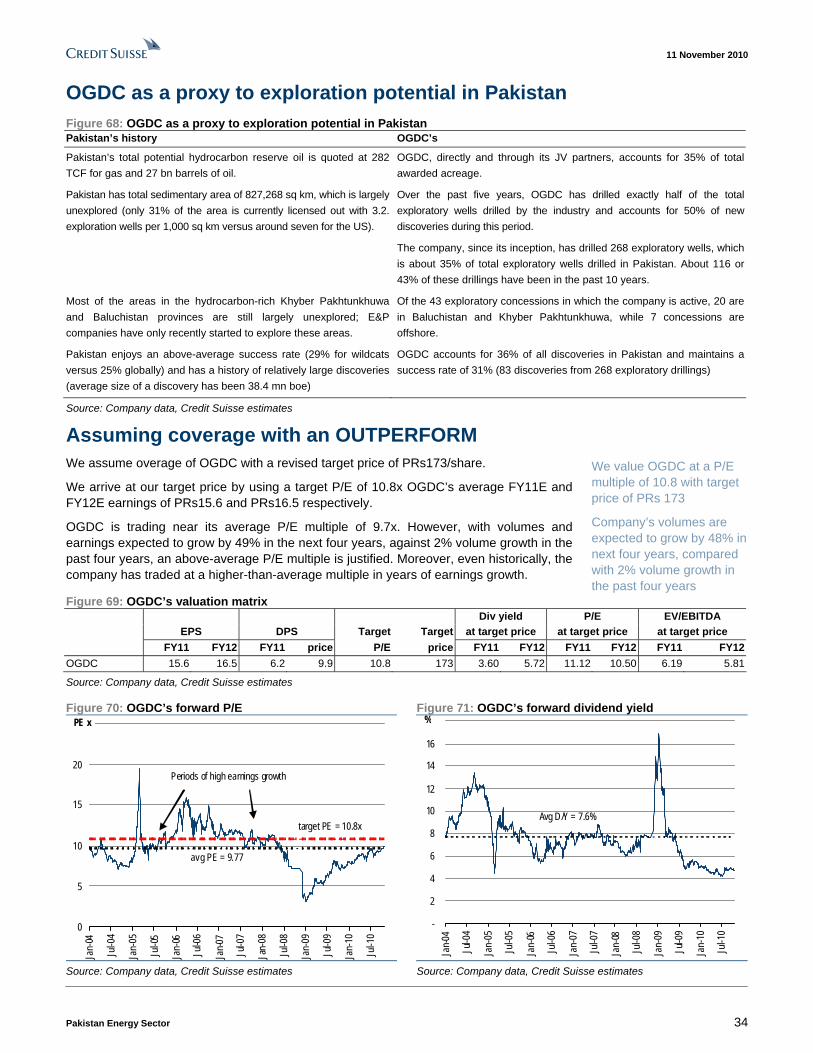
11 November 2010
Pakistan Energy Sector 34
OGDC as a proxy to exploration potential in Pakistan Figure 68: OGDC as a proxy to exploration potential in Pakistan Pakistan’s history OGDC’s
Pakistan’s total potential hydrocarbon reserve oil is quoted at 282TCF for gas and 27 bn barrels of oil.
OGDC, directly and through its JV partners, accounts for 35% of total awarded acreage.
Pakistan has total sedimentary area of 827,268 sq km, which is largely unexplored (only 31% of the area is currently licensed out with 3.2. exploration wells per 1,000 sq km versus around seven for the US).
Over the past five years, OGDC has drilled exactly half of the total exploratory wells drilled by the industry and accounts for 50% of new discoveries during this period.
The company, since its inception, has drilled 268 exploratory wells, which is about 35% of total exploratory wells drilled in Pakistan. About 116 or 43% of these drillings have been in the past 10 years.
Most of the areas in the hydrocarbon-rich Khyber Pakhtunkhuwa and Baluchistan provinces are still largely unexplored; E&P companies have only recently started to explore these areas.
Of the 43 exploratory concessions in which the company is active, 20 are in Baluchistan and Khyber Pakhtunkhuwa, while 7 concessions are offshore.
Pakistan enjoys an above-average success rate (29% for wildcats versus 25% globally) and has a history of relatively large discoveries (average size of a discovery has been 38.4 mn boe)
OGDC accounts for 36% of all discoveries in Pakistan and maintains a success rate of 31% (83 discoveries from 268 exploratory drillings)
Source: Company data, Credit Suisse estimates
Assuming coverage with an OUTPERFORM We assume overage of OGDC with a revised target price of PRs173/share.
We arrive at our target price by using a target P/E of 10.8x OGDC’s average FY11E and FY12E earnings of PRs15.6 and PRs16.5 respectively.
OGDC is trading near its average P/E multiple of 9.7x. However, with volumes and earnings expected to grow by 49% in the next four years, against 2% volume growth in the past four years, an above-average P/E multiple is justified. Moreover, even historically, the company has traded at a higher-than-average multiple in years of earnings growth.
Figure 69: OGDC’s valuation matrix Div yield P/E EV/EBITDA EPS DPS Target Target at target price at target price at target price FY11 FY12 FY11 price P/E price FY11 FY12 FY11 FY12 FY11 FY12OGDC 15.6 16.5 6.2 9.9 10.8 173 3.60 5.72 11.12 10.50 6.19 5.81
Source: Company data, Credit Suisse estimates
Figure 70: OGDC’s forward P/E Figure 71: OGDC’s forward dividend yield
0
5
10
15
20
25
Jan-
04
Jul-0
4
Jan-
05
Jul-0
5
Jan-
06
Jul-0
6
Jan-0
7
Jul-0
7
Jan-
08
Jul-0
8
Jan-
09
Jul-0
9
Jan-
10
Jul-1
0
PE x
target PE = 10.8x
avg PE = 9.77
Periods of high earnings growth
-
2
4
6
8
10
12
14
16
18
Jan-0
4
Jul-0
4
Jan-
05
Jul-0
5
Jan-
06
Jul-0
6
Jan-
07
Jul-0
7
Jan-
08
Jul-0
8
Jan-
09
Jul-0
9
Jan-
10
Jul-1
0%
Avg D/Y = 7.6%
Source: Company data, Credit Suisse estimates Source: Company data, Credit Suisse estimates
We value OGDC at a P/E multiple of 10.8 with target price of PRs 173
Company’s volumes are expected to grow by 48% in next four years, compared with 2% volume growth in the past four years

11 November 2010
Pakistan Energy Sector 35
Figure 72: Change from previous estimates New estimates Previous estimates Rating TP EPS FY11E EPS FY12E Rating TP EPS FY11E EPS FY12EOGDC O 173 15.2 16.5 O 131 16.9 19.1
Source: Company data, Credit Suisse estimates
Risks Adverse oil price movements
OGDC is in the business of oil and gas exploration, and hence all of its revenues are directly or indirectly linked to oil price. Therefore, adverse movements in oil price can negatively affect the company’s earnings, exploration plans and stock price.
Operational risks
■ The company may not be able to recover hydrocarbons from its fields due to technical difficulties or due to underperformance of any field.
■ The company’s future exploration activities may not be as successful as they have been in the past, or may not be successful at all, and could hence stall the company’s growth.
Political risks
The government of Pakistan is the majority owner of OGDC. As a majority shareholder, it may pursue some of its macroeconomic and social activities through the company. As a result, the company can engage in certain activities, which may not be based purely on commercial considerations.
Security risks
In the past, some of the company’s installed facilities in certain areas have been targeted by miscreants/local tribes. Therefore, some of the fields face the risk of temporary disruptions due to such attacks.
A large part of company’s future exploration programme also depends on the security situation in these areas. Unavailability of security clearance may lead to the company falling short of its drilling targets, which can adversely affect the company’s future growth.
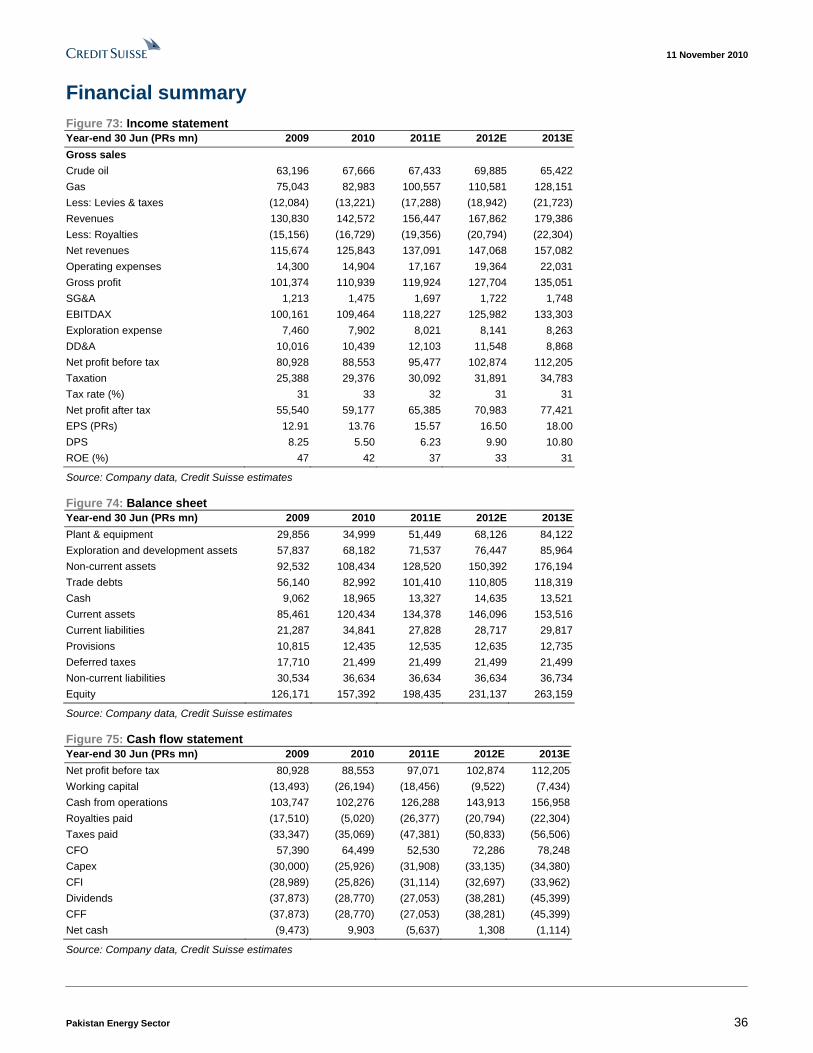
11 November 2010
Pakistan Energy Sector 36
Financial summary Figure 73: Income statement Year-end 30 Jun (PRs mn) 2009 2010 2011E 2012E 2013E Gross sales Crude oil 63,196 67,666 67,433 69,885 65,422 Gas 75,043 82,983 100,557 110,581 128,151 Less: Levies & taxes (12,084) (13,221) (17,288) (18,942) (21,723) Revenues 130,830 142,572 156,447 167,862 179,386 Less: Royalties (15,156) (16,729) (19,356) (20,794) (22,304) Net revenues 115,674 125,843 137,091 147,068 157,082 Operating expenses 14,300 14,904 17,167 19,364 22,031 Gross profit 101,374 110,939 119,924 127,704 135,051 SG&A 1,213 1,475 1,697 1,722 1,748 EBITDAX 100,161 109,464 118,227 125,982 133,303 Exploration expense 7,460 7,902 8,021 8,141 8,263 DD&A 10,016 10,439 12,103 11,548 8,868 Net profit before tax 80,928 88,553 95,477 102,874 112,205 Taxation 25,388 29,376 30,092 31,891 34,783 Tax rate (%) 31 33 32 31 31 Net profit after tax 55,540 59,177 65,385 70,983 77,421 EPS (PRs) 12.91 13.76 15.57 16.50 18.00 DPS 8.25 5.50 6.23 9.90 10.80 ROE (%) 47 42 37 33 31
Source: Company data, Credit Suisse estimates
Figure 74: Balance sheet Year-end 30 Jun (PRs mn) 2009 2010 2011E 2012E 2013E Plant & equipment 29,856 34,999 51,449 68,126 84,122 Exploration and development assets 57,837 68,182 71,537 76,447 85,964 Non-current assets 92,532 108,434 128,520 150,392 176,194 Trade debts 56,140 82,992 101,410 110,805 118,319 Cash 9,062 18,965 13,327 14,635 13,521 Current assets 85,461 120,434 134,378 146,096 153,516 Current liabilities 21,287 34,841 27,828 28,717 29,817 Provisions 10,815 12,435 12,535 12,635 12,735 Deferred taxes 17,710 21,499 21,499 21,499 21,499 Non-current liabilities 30,534 36,634 36,634 36,634 36,734 Equity 126,171 157,392 198,435 231,137 263,159
Source: Company data, Credit Suisse estimates
Figure 75: Cash flow statement Year-end 30 Jun (PRs mn) 2009 2010 2011E 2012E 2013ENet profit before tax 80,928 88,553 97,071 102,874 112,205Working capital (13,493) (26,194) (18,456) (9,522) (7,434)Cash from operations 103,747 102,276 126,288 143,913 156,958Royalties paid (17,510) (5,020) (26,377) (20,794) (22,304)Taxes paid (33,347) (35,069) (47,381) (50,833) (56,506)CFO 57,390 64,499 52,530 72,286 78,248Capex (30,000) (25,926) (31,908) (33,135) (34,380)CFI (28,989) (25,826) (31,114) (32,697) (33,962)Dividends (37,873) (28,770) (27,053) (38,281) (45,399)CFF (37,873) (28,770) (27,053) (38,281) (45,399)Net cash (9,473) 9,903 (5,637) 1,308 (1,114)
Source: Company data, Credit Suisse estimates

11 November 2010
Pakistan Energy Sector 37
Asia Pacific / PakistanOil & Gas Exploration & Production
Pakistan Petroleum Ltd (PPL.KA / PPL PA)
ASSUMING COVERAGE
Gearing up for growth ■ Assuming coverage with OUTPERFORM. We are assuming coverage of
Pakistan Petroleum Limited with an OUTPERFORM rating and a revised target price of PRs246, implying 27% potential upside.
■ Gearing up to grow. The company recently acquired 14 exploration blocks – the highest by any company last year – taking the total number of concessions to 32. With this, seismic data collection has also significantly increased over the past two years, with potential leads to be explored over the next two-three years. With better-than-industry success ratio of 1:2.8 over the past 11 years, high hopes are attached to company’s exploration programme.
■ High reserves ensure sustainable production. Being the largest gas producer in Pakistan and accounting for 22% of country’s total reserves, the company offers a blend of stable earnings and growth. Stability should come from gas sales, which account for 95% of total volumes priced to a slab-based pricing structure, which absorbs 60-70% of oil price movements, while growth should come from the recent oil-heavy discoveries, which should drive 47% growth over FY11-FY14E earnings. With revenues pegged to the USD, a depreciating rupee should further augment earnings growth.
■ Trading at a discount to region. We value the PPL at 9.2x average forward earnings with a target price of PRs 246. The company is trading at 9% discount to its historical P/E and 51% discount to the regional 2011 PE, despite offering higher dividend yield and an exploration option on one of the most under-explored areas of the region.
Share price performance
050
100150200
Nov-08 Mar-09 Jul-09 Nov-09 Mar-10 Jul-1080100120140160
Price (LHS) Rebased Rel (RHS)
The price relative chart measures performance against the Pakistan - Karachi Stock Exchange 100 index which closed at 10941.94 on 10/11/10 On 10/11/10 the spot exchange rate was PRs85.5/US$1
Performance Over 1M 3M 12M Absolute (%) 7.8 13.3 41.7 Relative (%) 1.1 2.4 13.4
Financial and valuation metrics
Year 6/10A 6/11E 6/12E 6/13ERevenue (PRs mn) 52,885.5 67,378.3 70,195.7 75,061.8EBITDAX (PRs mn) 42,081.4 56,898.0 59,652.8 64,387.7EBIT (PRs mn) 34,612.5 48,658.6 49,673.2 52,855.5Net income (PRs mn) 23,320.5 31,494.9 32,284.8 34,315.5EPS (CS adj.) (PRs) 19.52 26.36 27.02 28.72Change from previous EPS (%) n.a. -8.6 -6.1Consensus EPS (PRs) n.a. 26.9 28.9 26.7EPS growth (%) -15.8 35.1 2.5 6.3P/E (x) 9.9 7.3 7.1 6.7Dividend yield (%) 3.9 5.7 7.3 8.8EV/EBIDAX (x) 5.5 4.1 3.9 3.6P/B (x) 2.9 2.3 2.0 1.7ROE 32.6 35.0 29.7 27.4Net debt/equity (%) net cash net cash net cash net cash
Source: Company data, Thomson Reuters, Credit Suisse estimates.
*Stock ratings are relative to the relevant country benchmark. ¹Target price is for 12 months.
Research Analysts Raza Rawjani 65 6212 3035
Rating OUTPERFORM* Price (10 Nov 10, PRs) 193.00 Target price (PRs) (from 190.00) 246.00¹ Chg to TP (%) 27.5 Market cap. (PRs mn) 230,631 (US$ 2,697) Enterprise value (PRs mn) 201,152 Number of shares (mn) 1,194.98 Free float (%) 21.00 52-week price range 211 - 136
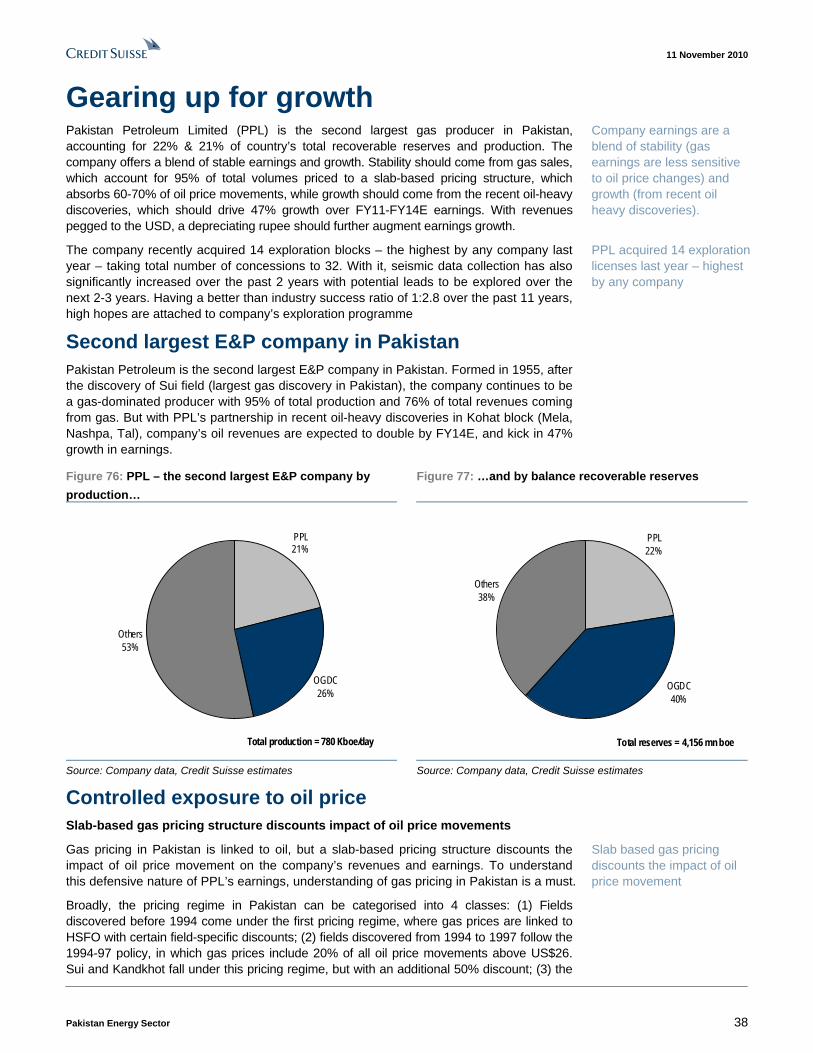
11 November 2010
Pakistan Energy Sector 38
Gearing up for growth Pakistan Petroleum Limited (PPL) is the second largest gas producer in Pakistan, accounting for 22% & 21% of country’s total recoverable reserves and production. The company offers a blend of stable earnings and growth. Stability should come from gas sales, which account for 95% of total volumes priced to a slab-based pricing structure, which absorbs 60-70% of oil price movements, while growth should come from the recent oil-heavy discoveries, which should drive 47% growth over FY11-FY14E earnings. With revenues pegged to the USD, a depreciating rupee should further augment earnings growth.
The company recently acquired 14 exploration blocks – the highest by any company last year – taking total number of concessions to 32. With it, seismic data collection has also significantly increased over the past 2 years with potential leads to be explored over the next 2-3 years. Having a better than industry success ratio of 1:2.8 over the past 11 years, high hopes are attached to company’s exploration programme
Second largest E&P company in Pakistan Pakistan Petroleum is the second largest E&P company in Pakistan. Formed in 1955, after the discovery of Sui field (largest gas discovery in Pakistan), the company continues to be a gas-dominated producer with 95% of total production and 76% of total revenues coming from gas. But with PPL’s partnership in recent oil-heavy discoveries in Kohat block (Mela, Nashpa, Tal), company’s oil revenues are expected to double by FY14E, and kick in 47% growth in earnings.
Figure 76: PPL – the second largest E&P company by production…
Figure 77: …and by balance recoverable reserves
PPL21%
OGDC26%
Others53%
Total production = 780 Kboe/day
PPL22%
Others38%
OGDC40%
Total reserves = 4,156 mn boe
Source: Company data, Credit Suisse estimates Source: Company data, Credit Suisse estimates
Controlled exposure to oil price Slab-based gas pricing structure discounts impact of oil price movements
Gas pricing in Pakistan is linked to oil, but a slab-based pricing structure discounts the impact of oil price movement on the company’s revenues and earnings. To understand this defensive nature of PPL’s earnings, understanding of gas pricing in Pakistan is a must.
Broadly, the pricing regime in Pakistan can be categorised into 4 classes: (1) Fields discovered before 1994 come under the first pricing regime, where gas prices are linked to HSFO with certain field-specific discounts; (2) fields discovered from 1994 to 1997 follow the 1994-97 policy, in which gas prices include 20% of all oil price movements above US$26. Sui and Kandkhot fall under this pricing regime, but with an additional 50% discount; (3) the
Company earnings are a blend of stability (gas earnings are less sensitive to oil price changes) and growth (from recent oil heavy discoveries).
PPL acquired 14 exploration licenses last year – highest by any company
Slab based gas pricing discounts the impact of oil price movement
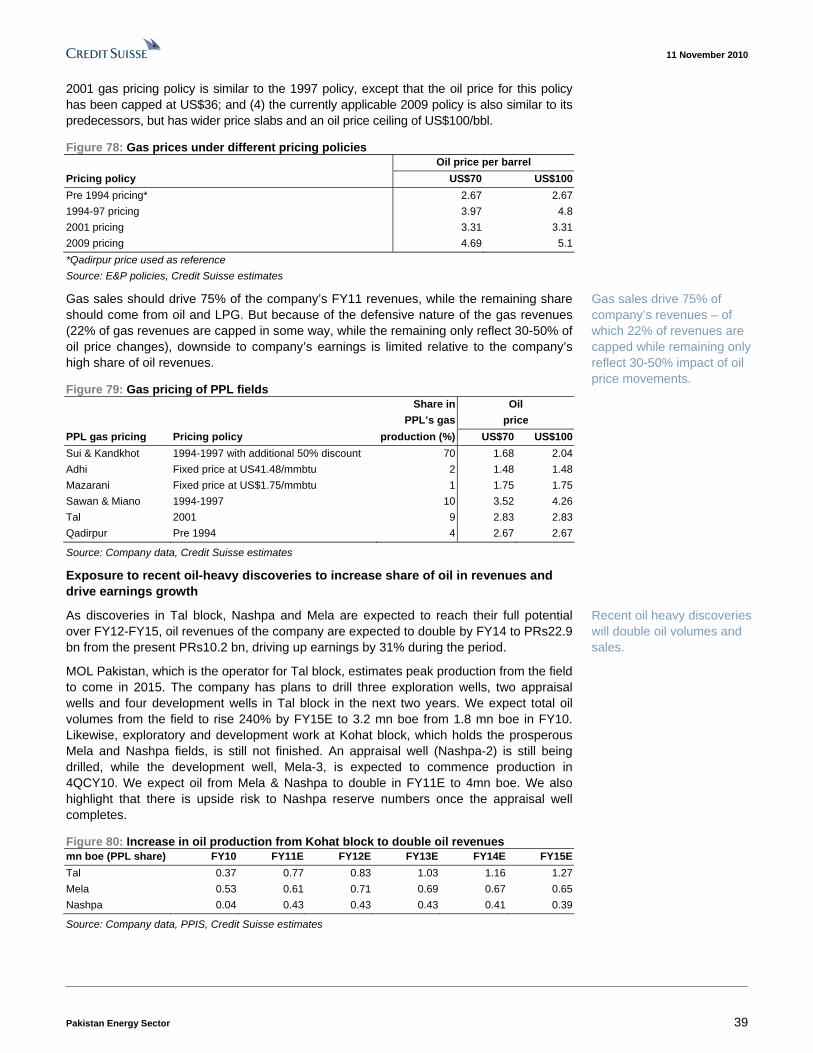
11 November 2010
Pakistan Energy Sector 39
2001 gas pricing policy is similar to the 1997 policy, except that the oil price for this policy has been capped at US$36; and (4) the currently applicable 2009 policy is also similar to its predecessors, but has wider price slabs and an oil price ceiling of US$100/bbl.
Figure 78: Gas prices under different pricing policies Oil price per barrel Pricing policy US$70 US$100 Pre 1994 pricing* 2.67 2.67 1994-97 pricing 3.97 4.8 2001 pricing 3.31 3.31 2009 pricing 4.69 5.1 *Qadirpur price used as reference Source: E&P policies, Credit Suisse estimates
Gas sales should drive 75% of the company’s FY11 revenues, while the remaining share should come from oil and LPG. But because of the defensive nature of the gas revenues (22% of gas revenues are capped in some way, while the remaining only reflect 30-50% of oil price changes), downside to company’s earnings is limited relative to the company’s high share of oil revenues.
Figure 79: Gas pricing of PPL fields Share in Oil PPL’s gas price PPL gas pricing Pricing policy production (%) US$70 US$100 Sui & Kandkhot 1994-1997 with additional 50% discount 70 1.68 2.04 Adhi Fixed price at US41.48/mmbtu 2 1.48 1.48 Mazarani Fixed price at US$1.75/mmbtu 1 1.75 1.75 Sawan & Miano 1994-1997 10 3.52 4.26 Tal 2001 9 2.83 2.83 Qadirpur Pre 1994 4 2.67 2.67
Source: Company data, Credit Suisse estimates
Exposure to recent oil-heavy discoveries to increase share of oil in revenues and drive earnings growth
As discoveries in Tal block, Nashpa and Mela are expected to reach their full potential over FY12-FY15, oil revenues of the company are expected to double by FY14 to PRs22.9 bn from the present PRs10.2 bn, driving up earnings by 31% during the period.
MOL Pakistan, which is the operator for Tal block, estimates peak production from the field to come in 2015. The company has plans to drill three exploration wells, two appraisal wells and four development wells in Tal block in the next two years. We expect total oil volumes from the field to rise 240% by FY15E to 3.2 mn boe from 1.8 mn boe in FY10. Likewise, exploratory and development work at Kohat block, which holds the prosperous Mela and Nashpa fields, is still not finished. An appraisal well (Nashpa-2) is still being drilled, while the development well, Mela-3, is expected to commence production in 4QCY10. We expect oil from Mela & Nashpa to double in FY11E to 4mn boe. We also highlight that there is upside risk to Nashpa reserve numbers once the appraisal well completes.
Figure 80: Increase in oil production from Kohat block to double oil revenues mn boe (PPL share) FY10 FY11E FY12E FY13E FY14E FY15E Tal 0.37 0.77 0.83 1.03 1.16 1.27 Mela 0.53 0.61 0.71 0.69 0.67 0.65 Nashpa 0.04 0.43 0.43 0.43 0.41 0.39
Source: Company data, PPIS, Credit Suisse estimates
Gas sales drive 75% of company’s revenues – of which 22% of revenues are capped while remaining only reflect 30-50% impact of oil price movements.
Recent oil heavy discoveries will double oil volumes and sales.
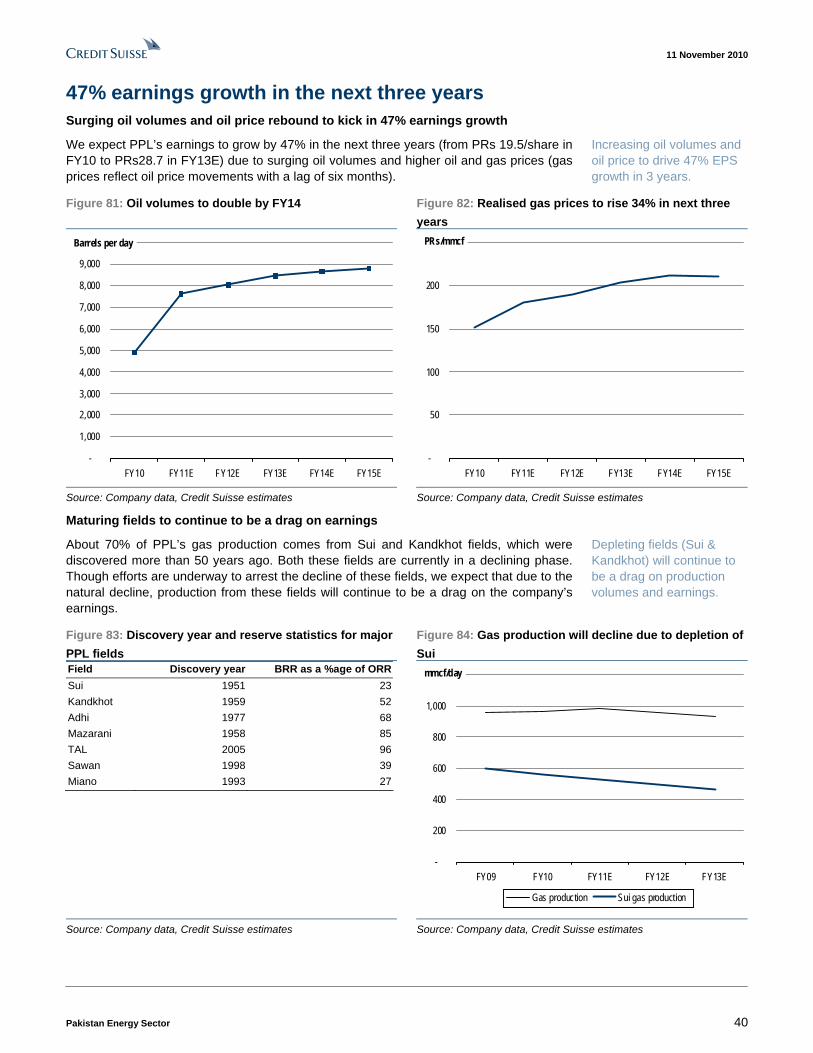
11 November 2010
Pakistan Energy Sector 40
47% earnings growth in the next three years Surging oil volumes and oil price rebound to kick in 47% earnings growth
We expect PPL’s earnings to grow by 47% in the next three years (from PRs 19.5/share in FY10 to PRs28.7 in FY13E) due to surging oil volumes and higher oil and gas prices (gas prices reflect oil price movements with a lag of six months).
Figure 81: Oil volumes to double by FY14 Figure 82: Realised gas prices to rise 34% in next three years
-
1,000
2,000
3,000
4,000
5,000
6,000
7,000
8,000
9,000
10,000
FY10 FY11E FY12E FY13E FY14E FY15E
Barrels per day
-
50
100
150
200
250
FY10 FY11E FY12E FY13E FY14E FY15E
PRs/mmcf
Source: Company data, Credit Suisse estimates Source: Company data, Credit Suisse estimates
Maturing fields to continue to be a drag on earnings
About 70% of PPL’s gas production comes from Sui and Kandkhot fields, which were discovered more than 50 years ago. Both these fields are currently in a declining phase. Though efforts are underway to arrest the decline of these fields, we expect that due to the natural decline, production from these fields will continue to be a drag on the company’s earnings.
Figure 83: Discovery year and reserve statistics for major PPL fields
Figure 84: Gas production will decline due to depletion of Sui
Field Discovery year BRR as a %age of ORRSui 1951 23Kandkhot 1959 52Adhi 1977 68Mazarani 1958 85TAL 2005 96Sawan 1998 39Miano 1993 27
-
200
400
600
800
1,000
1,200
FY09 FY10 FY11E FY12E FY13E
Gas production Sui gas production
mmcf/day
Source: Company data, Credit Suisse estimates Source: Company data, Credit Suisse estimates
Increasing oil volumes and oil price to drive 47% EPS growth in 3 years.
Depleting fields (Sui & Kandkhot) will continue to be a drag on production volumes and earnings.
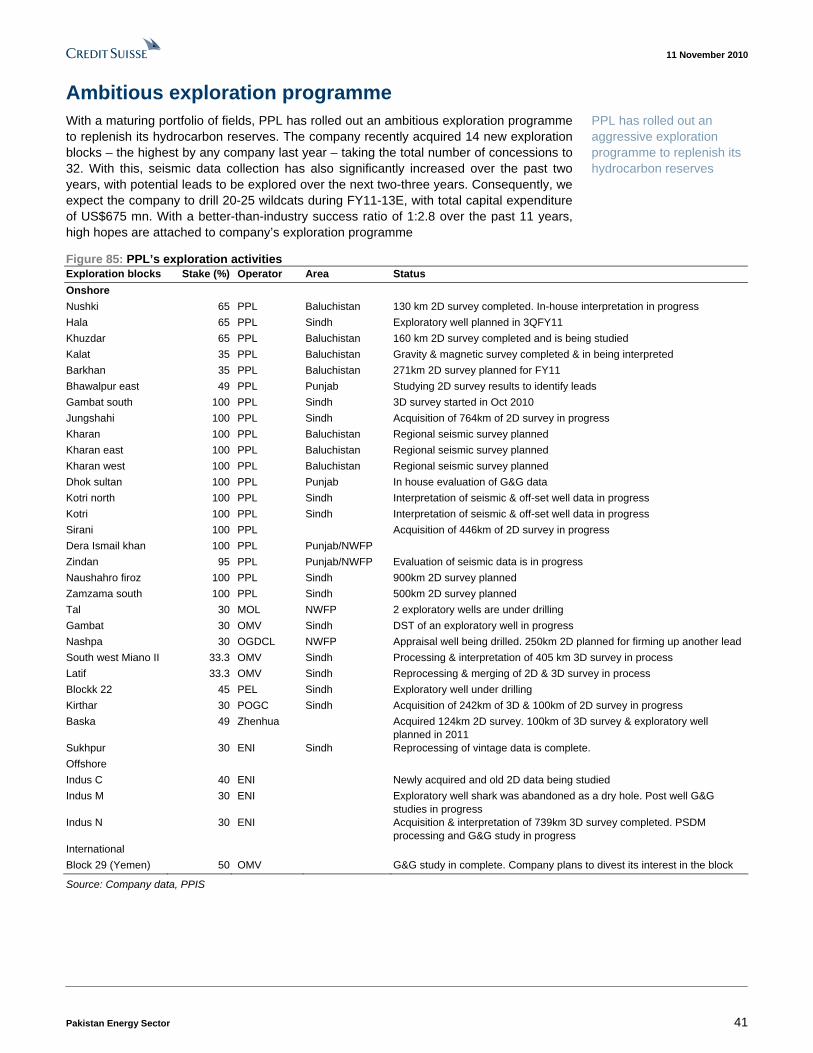
11 November 2010
Pakistan Energy Sector 41
Ambitious exploration programme With a maturing portfolio of fields, PPL has rolled out an ambitious exploration programme to replenish its hydrocarbon reserves. The company recently acquired 14 new exploration blocks – the highest by any company last year – taking the total number of concessions to 32. With this, seismic data collection has also significantly increased over the past two years, with potential leads to be explored over the next two-three years. Consequently, we expect the company to drill 20-25 wildcats during FY11-13E, with total capital expenditure of US$675 mn. With a better-than-industry success ratio of 1:2.8 over the past 11 years, high hopes are attached to company’s exploration programme
Figure 85: PPL’s exploration activities Exploration blocks Stake (%) Operator Area Status Onshore Nushki 65 PPL Baluchistan 130 km 2D survey completed. In-house interpretation in progress Hala 65 PPL Sindh Exploratory well planned in 3QFY11 Khuzdar 65 PPL Baluchistan 160 km 2D survey completed and is being studied Kalat 35 PPL Baluchistan Gravity & magnetic survey completed & in being interpreted Barkhan 35 PPL Baluchistan 271km 2D survey planned for FY11 Bhawalpur east 49 PPL Punjab Studying 2D survey results to identify leads Gambat south 100 PPL Sindh 3D survey started in Oct 2010 Jungshahi 100 PPL Sindh Acquisition of 764km of 2D survey in progress Kharan 100 PPL Baluchistan Regional seismic survey planned Kharan east 100 PPL Baluchistan Regional seismic survey planned Kharan west 100 PPL Baluchistan Regional seismic survey planned Dhok sultan 100 PPL Punjab In house evaluation of G&G data Kotri north 100 PPL Sindh Interpretation of seismic & off-set well data in progress Kotri 100 PPL Sindh Interpretation of seismic & off-set well data in progress Sirani 100 PPL Acquisition of 446km of 2D survey in progress Dera Ismail khan 100 PPL Punjab/NWFP Zindan 95 PPL Punjab/NWFP Evaluation of seismic data is in progress Naushahro firoz 100 PPL Sindh 900km 2D survey planned Zamzama south 100 PPL Sindh 500km 2D survey planned Tal 30 MOL NWFP 2 exploratory wells are under drilling Gambat 30 OMV Sindh DST of an exploratory well in progress Nashpa 30 OGDCL NWFP Appraisal well being drilled. 250km 2D planned for firming up another lead South west Miano II 33.3 OMV Sindh Processing & interpretation of 405 km 3D survey in process Latif 33.3 OMV Sindh Reprocessing & merging of 2D & 3D survey in process Blockk 22 45 PEL Sindh Exploratory well under drilling Kirthar 30 POGC Sindh Acquisition of 242km of 3D & 100km of 2D survey in progress Baska 49 Zhenhua Acquired 124km 2D survey. 100km of 3D survey & exploratory well
planned in 2011 Sukhpur 30 ENI Sindh Reprocessing of vintage data is complete. Offshore Indus C 40 ENI Newly acquired and old 2D data being studied Indus M 30 ENI Exploratory well shark was abandoned as a dry hole. Post well G&G
studies in progress Indus N 30 ENI Acquisition & interpretation of 739km 3D survey completed. PSDM
processing and G&G study in progress International Block 29 (Yemen) 50 OMV G&G study in complete. Company plans to divest its interest in the block
Source: Company data, PPIS
PPL has rolled out an aggressive exploration programme to replenish its hydrocarbon reserves

11 November 2010
Pakistan Energy Sector 42
Figure 86: Map of PPL’s producing and exploration blocks
Source: Company data
Strong balance sheet and reserve life of 15 years to support exploration programmes
PPL has a strong, cash flush and unlevered balance sheet. As per 1Q FY11 accounts, the company had net cash of PRs26/share. Reserve life of 15 and 14 years for gas and oil, respectively, also ensures company’s capacity to support its exploration programme while maintaining dividend payout.
Assuming coverage; revise target price to PRs246 We assume coverage of PPL with a revised target price of PRs246. With earnings expected to grow 47% over the next three years, we shift our valuation methodology to earnings multiple-based valuation. We use a target P/E multiple of 9.2x (average historical P/E) average earnings for FY11E and FY12E of PRs26.4 and PRs27 respectively to value PPL.
Figure 87: PPL’s valuation matrix Target Target Div yield PE at EV/EBITDAX EPS DPS P/E price at target price target price at target price FY11 FY12 FY11 FY12 Dec-11 FY11 FY12 FY11 FY12 FY11 FY12PPL 26.4 27.0 11 14 9.2 246 4.48 5.70 9.32 9.09 4.64 4.42
Source: Company data, Credit Suisse estimates
Strong balance sheet and reserve life to support exploration programme
Assuming coverage with OUTPERFORM rating

11 November 2010
Pakistan Energy Sector 43
Figure 88: Change from previous estimates New estimates Previous estimates Rating TP EPS FY11E EPS FY12E Rating TP EPS FY11E EPS FY12EPPL O 246 26.4 27 O 190 28.83 28.75
Source: Company data, Credit Suisse estimates
Risks Adverse oil price movements
PPL is in the business of oil and gas exploration; hence, all of its revenues are directly or indirectly linked to oil price. Therefore, adverse movements in oil price can negatively affect the company’s earnings, exploration plans and stock price.
Operational risks
■ The company may not be able to recover hydrocarbons from its fields due to technical difficulties or due to underperformance of any field.
■ The company’s future exploration activities may not be as successful as they have been in the past, or may not be successful at all, and could hence stall the company’s growth.
Political risks
The government of Pakistan is the majority owner of PPL. As a majority shareholder, the government may pursue some of its macroeconomic and social activities through the company. As a result, the company can engage in certain activities, which may not be based purely on commercial considerations.
Security risks
In the past, some of the company’s installed facilities in certain areas have been targeted by miscreants/local tribes. Therefore, some of the fields face the risk of temporary disruptions due to such attacks.
A large part of company’s future exploration programme also depends on the security situation in these areas. Unavailability of security clearance may lead to the company falling short of its drilling targets, which can adversely affect the company’s future growth.
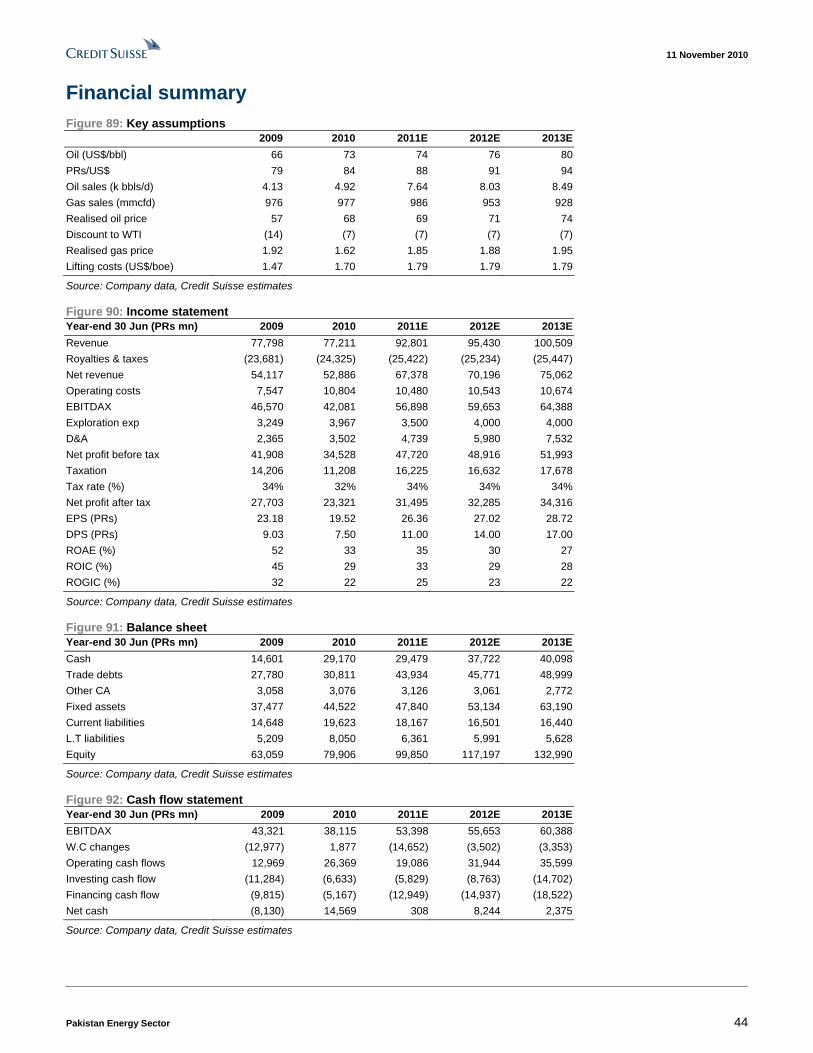
11 November 2010
Pakistan Energy Sector 44
Financial summary Figure 89: Key assumptions 2009 2010 2011E 2012E 2013E Oil (US$/bbl) 66 73 74 76 80 PRs/US$ 79 84 88 91 94 Oil sales (k bbls/d) 4.13 4.92 7.64 8.03 8.49 Gas sales (mmcfd) 976 977 986 953 928 Realised oil price 57 68 69 71 74 Discount to WTI (14) (7) (7) (7) (7) Realised gas price 1.92 1.62 1.85 1.88 1.95 Lifting costs (US$/boe) 1.47 1.70 1.79 1.79 1.79
Source: Company data, Credit Suisse estimates
Figure 90: Income statement Year-end 30 Jun (PRs mn) 2009 2010 2011E 2012E 2013E Revenue 77,798 77,211 92,801 95,430 100,509 Royalties & taxes (23,681) (24,325) (25,422) (25,234) (25,447) Net revenue 54,117 52,886 67,378 70,196 75,062 Operating costs 7,547 10,804 10,480 10,543 10,674 EBITDAX 46,570 42,081 56,898 59,653 64,388 Exploration exp 3,249 3,967 3,500 4,000 4,000 D&A 2,365 3,502 4,739 5,980 7,532 Net profit before tax 41,908 34,528 47,720 48,916 51,993 Taxation 14,206 11,208 16,225 16,632 17,678 Tax rate (%) 34% 32% 34% 34% 34% Net profit after tax 27,703 23,321 31,495 32,285 34,316 EPS (PRs) 23.18 19.52 26.36 27.02 28.72 DPS (PRs) 9.03 7.50 11.00 14.00 17.00 ROAE (%) 52 33 35 30 27 ROIC (%) 45 29 33 29 28 ROGIC (%) 32 22 25 23 22
Source: Company data, Credit Suisse estimates
Figure 91: Balance sheet Year-end 30 Jun (PRs mn) 2009 2010 2011E 2012E 2013E Cash 14,601 29,170 29,479 37,722 40,098 Trade debts 27,780 30,811 43,934 45,771 48,999 Other CA 3,058 3,076 3,126 3,061 2,772 Fixed assets 37,477 44,522 47,840 53,134 63,190 Current liabilities 14,648 19,623 18,167 16,501 16,440 L.T liabilities 5,209 8,050 6,361 5,991 5,628 Equity 63,059 79,906 99,850 117,197 132,990
Source: Company data, Credit Suisse estimates
Figure 92: Cash flow statement Year-end 30 Jun (PRs mn) 2009 2010 2011E 2012E 2013E EBITDAX 43,321 38,115 53,398 55,653 60,388 W.C changes (12,977) 1,877 (14,652) (3,502) (3,353) Operating cash flows 12,969 26,369 19,086 31,944 35,599 Investing cash flow (11,284) (6,633) (5,829) (8,763) (14,702) Financing cash flow (9,815) (5,167) (12,949) (14,937) (18,522) Net cash (8,130) 14,569 308 8,244 2,375
Source: Company data, Credit Suisse estimates

11 November 2010
Pakistan Energy Sector 45
Companies Mentioned (Price as of 10 Nov 10) Hub Power Company (HPWR.KA, PRs33.51, OUTPERFORM, TP PRs49) Oil & Gas Development Company (OGDC.KA, PRs158.06, OUTPERFORM, TP PRs173.00) Pakistan Petroleum Ltd (PPL.KA, PRs193, OUTPERFORM, TP PRs246.00) Pakistan State Oil Company Ltd (PSO.KA, PRs281.71, OUTPERFORM [V], TP PRs381.00)
Disclosure Appendix Important Global Disclosures Raza Rawjani & Prashant Gokhale each certify, with respect to the companies or securities that he or she analyzes, that (1) the views expressed in this report accurately reflect his or her personal views about all of the subject companies and securities and (2) no part of his or her compensation was, is or will be directly or indirectly related to the specific recommendations or views expressed in this report. See the Companies Mentioned section for full company names. 3-Year Price, Target Price and Rating Change History Chart for HPWR.KA HPWR.KA Closing
Price Target
Price
Initiation/ Date (PRs) (PRs) Rating Assumption
0
5
10
15
20
25
30
35
12-Nov-
07
12-Jan
-08
12-Mar-
08
12-May-
08
12-Jul
-08
12-Sep-
08
12-Nov-
08
12-Jan
-09
12-Mar-0
9
12-May-
09
12-Jul
-09
12-Sep-
09
12-Nov-
09
12-Jan
-10
12-Mar-1
0
12-May-
10
12-Jul
-10
12-Sep-
10
Closing Price Target Price Initiation/Assumption Rating
PRs
O=Outperform; N=Neutral; U=Underperform; R=Restricted; NR=Not Rated; NC=Not Covered
3-Year Price, Target Price and Rating Change History Chart for OGDC.KA OGDC.KA Closing
Price Target
Price
Initiation/ Date (PRs) (PRs) Rating Assumption 29-Apr-08 136.2 157 20-May-08 129 176 22-Aug-08 108.2 138 N 18-Feb-09 53.56 76 17-Aug-09 92.6 115 O 15-Dec-09 108 131 X
157
176
138
76
115
131
15-Dec-09
O
N
40
60
80
100
120
140
160
12-Nov-
07
12-Jan
-08
12-Mar-
08
12-May-
08
12-Jul
-08
12-Sep-
08
12-Nov-
08
12-Jan
-09
12-Mar-0
9
12-May-
09
12-Jul
-09
12-Sep-
09
12-Nov-
09
12-Jan
-10
12-Mar-1
0
12-May-
10
12-Jul
-10
12-Sep-
10
Closing Price Target Price Initiation/Assumption Rating
PRs
O=Outperform; N=Neutral; U=Underperform; R=Restricted; NR=Not Rated; NC=Not Covered
3-Year Price, Target Price and Rating Change History Chart for PPL.KA PPL.KA Closing
Price Target
Price
Initiation/ Date (PRs) (PRs) Rating Assumption 21-May-09 118.056 172.917 O X 25-Jun-09 130.694 180.556 14-Oct-09 160.5 190
173181
190
21-May-09
O
69
89
109
129
149
169
189
209
12-Nov-
07
12-Jan
-08
12-Mar-
08
12-May-
08
12-Jul
-08
12-Sep-
08
12-Nov-
08
12-Jan
-09
12-Mar-0
9
12-May-
09
12-Jul
-09
12-Sep-
09
12-Nov-
09
12-Jan
-10
12-Mar-1
0
12-May-
10
12-Jul
-10
12-Sep-
10
Closing Price Target Price Initiation/Assumption Rating
PRs
O=Outperform; N=Neutral; U=Underperform; R=Restricted; NR=Not Rated; NC=Not Covered

11 November 2010
Pakistan Energy Sector 46
3-Year Price, Target Price and Rating Change History Chart for PSO.KA PSO.KA Closing
Price Target
Price
Initiation/ Date (PRs) (PRs) Rating Assumption 18-Sep-08 279.99 452 O 19-Sep-08 X 27-Nov-08 267.49 271 N 13-Jan-09 121.76 268 O 16-Apr-09 213 300 27-May-09 207.5 290 24-Jun-09 207.1 330 16-Oct-09 339.26 390
452
271 268300 290
330
390
19-Sep-08 O
NO
96
146
196
246
296
346
396
446
496
12-Nov-
07
12-Jan
-08
12-Mar-
08
12-May-
08
12-Jul
-08
12-Sep-
08
12-Nov-
08
12-Jan
-09
12-Mar-0
9
12-May-
09
12-Jul
-09
12-Sep-
09
12-Nov-
09
12-Jan
-10
12-Mar-1
0
12-May-
10
12-Jul
-10
12-Sep-
10
Closing Price Target Price Initiation/Assumption Rating
PRs
O=Outperform; N=Neutral; U=Underperform; R=Restricted; NR=Not Rated; NC=Not Covered
The analyst(s) responsible for preparing this research report received compensation that is based upon various factors including Credit Suisse's total revenues, a portion of which are generated by Credit Suisse's investment banking activities. Analysts’ stock ratings are defined as follows: Outperform (O): The stock’s total return is expected to outperform the relevant benchmark* by at least 10-15% (or more, depending on perceived risk) over the next 12 months. Neutral (N): The stock’s total return is expected to be in line with the relevant benchmark* (range of ±10-15%) over the next 12 months. Underperform (U): The stock’s total return is expected to underperform the relevant benchmark* by 10-15% or more over the next 12 months. *Relevant benchmark by region: As of 29th May 2009, Australia, New Zealand, U.S. and Canadian ratings are based on (1) a stock’s absolute total return potential to its current share price and (2) the relative attractiveness of a stock’s total return potential within an analyst’s coverage universe**, with Outperforms representing the most attractive, Neutrals the less attractive, and Underperforms the least attractive investment opportunities. Some U.S. and Canadian ratings may fall outside the absolute total return ranges defined above, depending on market conditions and industry factors. For Latin American, Japanese, and non-Japan Asia stocks, ratings are based on a stock’s total return relative to the average total return of the relevant country or regional benchmark; for European stocks, ratings are based on a stock’s total return relative to the analyst's coverage universe**. For Australian and New Zealand stocks a 22% and a 12% threshold replace the 10-15% level in the Outperform and Underperform stock rating definitions, respectively, subject to analysts’ perceived risk. The 22% and 12% thresholds replace the +10-15% and -10-15% levels in the Neutral stock rating definition, respectively, subject to analysts’ perceived risk. **An analyst's coverage universe consists of all companies covered by the analyst within the relevant sector. Restricted (R): In certain circumstances, Credit Suisse policy and/or applicable law and regulations preclude certain types of communications, including an investment recommendation, during the course of Credit Suisse's engagement in an investment banking transaction and in certain other circumstances. Volatility Indicator [V]: A stock is defined as volatile if the stock price has moved up or down by 20% or more in a month in at least 8 of the past 24 months or the analyst expects significant volatility going forward.
Analysts’ coverage universe weightings are distinct from analysts’ stock ratings and are based on the expected performance of an analyst’s coverage universe* versus the relevant broad market benchmark**: Overweight: Industry expected to outperform the relevant broad market benchmark over the next 12 months. Market Weight: Industry expected to perform in-line with the relevant broad market benchmark over the next 12 months. Underweight: Industry expected to underperform the relevant broad market benchmark over the next 12 months. *An analyst’s coverage universe consists of all companies covered by the analyst within the relevant sector. **The broad market benchmark is based on the expected return of the local market index (e.g., the S&P 500 in the U.S.) over the next 12 months. Credit Suisse’s distribution of stock ratings (and banking clients) is:
Global Ratings Distribution Outperform/Buy* 46% (62% banking clients) Neutral/Hold* 41% (59% banking clients) Underperform/Sell* 12% (52% banking clients) Restricted 2%
*For purposes of the NYSE and NASD ratings distribution disclosure requirements, our stock ratings of Outperform, Neutral, and Underperform most closely correspond to Buy, Hold, and Sell, respectively; however, the meanings are not the same, as our stock ratings are determined on a relative basis. (Please refer to definitions above.) An investor's decision to buy or sell a security should be based on investment objectives, current holdings, and other individual factors.
Credit Suisse’s policy is to update research reports as it deems appropriate, based on developments with the subject company, the sector or the market that may have a material impact on the research views or opinions stated herein. Credit Suisse's policy is only to publish investment research that is impartial, independent, clear, fair and not misleading. For more detail please refer to Credit Suisse's Policies for Managing Conflicts of Interest in connection with Investment Research: http://www.csfb.com/research-and-analytics/disclaimer/managing_conflicts_disclaimer.html
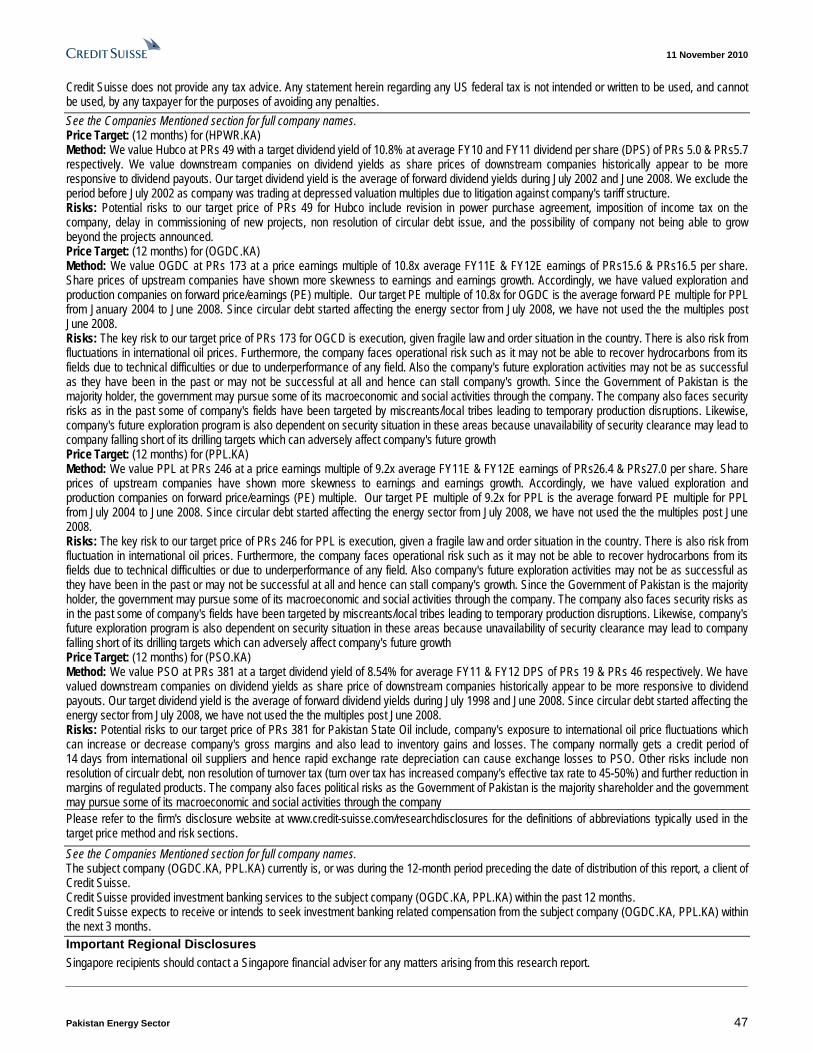
11 November 2010
Pakistan Energy Sector 47
Credit Suisse does not provide any tax advice. Any statement herein regarding any US federal tax is not intended or written to be used, and cannot be used, by any taxpayer for the purposes of avoiding any penalties. See the Companies Mentioned section for full company names. Price Target: (12 months) for (HPWR.KA) Method: We value Hubco at PRs 49 with a target dividend yield of 10.8% at average FY10 and FY11 dividend per share (DPS) of PRs 5.0 & PRs5.7 respectively. We value downstream companies on dividend yields as share prices of downstream companies historically appear to be more responsive to dividend payouts. Our target dividend yield is the average of forward dividend yields during July 2002 and June 2008. We exclude the period before July 2002 as company was trading at depressed valuation multiples due to litigation against company's tariff structure. Risks: Potential risks to our target price of PRs 49 for Hubco include revision in power purchase agreement, imposition of income tax on the company, delay in commissioning of new projects, non resolution of circular debt issue, and the possibility of company not being able to grow beyond the projects announced. Price Target: (12 months) for (OGDC.KA) Method: We value OGDC at PRs 173 at a price earnings multiple of 10.8x average FY11E & FY12E earnings of PRs15.6 & PRs16.5 per share. Share prices of upstream companies have shown more skewness to earnings and earnings growth. Accordingly, we have valued exploration and production companies on forward price/earnings (PE) multiple. Our target PE multiple of 10.8x for OGDC is the average forward PE multiple for PPL from January 2004 to June 2008. Since circular debt started affecting the energy sector from July 2008, we have not used the the multiples post June 2008. Risks: The key risk to our target price of PRs 173 for OGCD is execution, given fragile law and order situation in the country. There is also risk from fluctuations in international oil prices. Furthermore, the company faces operational risk such as it may not be able to recover hydrocarbons from its fields due to technical difficulties or due to underperformance of any field. Also the company's future exploration activities may not be as successful as they have been in the past or may not be successful at all and hence can stall company's growth. Since the Government of Pakistan is the majority holder, the government may pursue some of its macroeconomic and social activities through the company. The company also faces security risks as in the past some of company's fields have been targeted by miscreants/local tribes leading to temporary production disruptions. Likewise, company's future exploration program is also dependent on security situation in these areas because unavailability of security clearance may lead to company falling short of its drilling targets which can adversely affect company's future growth Price Target: (12 months) for (PPL.KA) Method: We value PPL at PRs 246 at a price earnings multiple of 9.2x average FY11E & FY12E earnings of PRs26.4 & PRs27.0 per share. Share prices of upstream companies have shown more skewness to earnings and earnings growth. Accordingly, we have valued exploration and production companies on forward price/earnings (PE) multiple. Our target PE multiple of 9.2x for PPL is the average forward PE multiple for PPL from July 2004 to June 2008. Since circular debt started affecting the energy sector from July 2008, we have not used the the multiples post June 2008. Risks: The key risk to our target price of PRs 246 for PPL is execution, given a fragile law and order situation in the country. There is also risk from fluctuation in international oil prices. Furthermore, the company faces operational risk such as it may not be able to recover hydrocarbons from its fields due to technical difficulties or due to underperformance of any field. Also company's future exploration activities may not be as successful as they have been in the past or may not be successful at all and hence can stall company's growth. Since the Government of Pakistan is the majority holder, the government may pursue some of its macroeconomic and social activities through the company. The company also faces security risks as in the past some of company's fields have been targeted by miscreants/local tribes leading to temporary production disruptions. Likewise, company's future exploration program is also dependent on security situation in these areas because unavailability of security clearance may lead to company falling short of its drilling targets which can adversely affect company's future growth Price Target: (12 months) for (PSO.KA) Method: We value PSO at PRs 381 at a target dividend yield of 8.54% for average FY11 & FY12 DPS of PRs 19 & PRs 46 respectively. We have valued downstream companies on dividend yields as share price of downstream companies historically appear to be more responsive to dividend payouts. Our target dividend yield is the average of forward dividend yields during July 1998 and June 2008. Since circular debt started affecting the energy sector from July 2008, we have not used the the multiples post June 2008. Risks: Potential risks to our target price of PRs 381 for Pakistan State Oil include, company's exposure to international oil price fluctuations which can increase or decrease company's gross margins and also lead to inventory gains and losses. The company normally gets a credit period of 14 days from international oil suppliers and hence rapid exchange rate depreciation can cause exchange losses to PSO. Other risks include non resolution of circualr debt, non resolution of turnover tax (turn over tax has increased company's effective tax rate to 45-50%) and further reduction in margins of regulated products. The company also faces political risks as the Government of Pakistan is the majority shareholder and the government may pursue some of its macroeconomic and social activities through the company Please refer to the firm's disclosure website at www.credit-suisse.com/researchdisclosures for the definitions of abbreviations typically used in the target price method and risk sections.
See the Companies Mentioned section for full company names. The subject company (OGDC.KA, PPL.KA) currently is, or was during the 12-month period preceding the date of distribution of this report, a client of Credit Suisse. Credit Suisse provided investment banking services to the subject company (OGDC.KA, PPL.KA) within the past 12 months. Credit Suisse expects to receive or intends to seek investment banking related compensation from the subject company (OGDC.KA, PPL.KA) within the next 3 months. Important Regional Disclosures Singapore recipients should contact a Singapore financial adviser for any matters arising from this research report.
11 November 2010
Pakistan Energy Sector 48
The analyst(s) involved in the preparation of this report have not visited the material operations of the subject company (HPWR.KA, OGDC.KA, PPL.KA, PSO.KA) within the past 12 months. Restrictions on certain Canadian securities are indicated by the following abbreviations: NVS--Non-Voting shares; RVS--Restricted Voting Shares; SVS--Subordinate Voting Shares. Individuals receiving this report from a Canadian investment dealer that is not affiliated with Credit Suisse should be advised that this report may not contain regulatory disclosures the non-affiliated Canadian investment dealer would be required to make if this were its own report. For Credit Suisse Securities (Canada), Inc.'s policies and procedures regarding the dissemination of equity research, please visit http://www.csfb.com/legal_terms/canada_research_policy.shtml. As of the date of this report, Credit Suisse acts as a market maker or liquidity provider in the equities securities that are the subject of this report. Principal is not guaranteed in the case of equities because equity prices are variable. Commission is the commission rate or the amount agreed with a customer when setting up an account or at anytime after that. To the extent this is a report authored in whole or in part by a non-U.S. analyst and is made available in the U.S., the following are important disclosures regarding any non-U.S. analyst contributors: The non-U.S. research analysts listed below (if any) are not registered/qualified as research analysts with FINRA. The non-U.S. research analysts listed below may not be associated persons of CSSU and therefore may not be subject to the NASD Rule 2711 and NYSE Rule 472 restrictions on communications with a subject company, public appearances and trading securities held by a research analyst account. • Raza Rawjani, non-U.S. analyst, is a research analyst employed by Credit Suisse AG, Singapore Branch. • Prashant Gokhale, non-U.S. analyst, is a research analyst employed by Credit Suisse (Hong Kong) Limited. For Credit Suisse disclosure information on other companies mentioned in this report, please visit the website at www.credit-suisse.com/researchdisclosures or call +1 (877) 291-2683. Disclaimers continue on next page.

11 November 2010Asia Pacific / Pakistan
Equity Research
This report is not directed to, or intended for distribution to or use by, any person or entity who is a citizen or resident of or located in any locality, state, country or other jurisdiction where such distribution, publication, availability or use would be contrary to law or regulation or which would subject Credit Suisse AG, the Swiss bank, or its subsidiaries or its affiliates (“CS”) to any registration or licensing requirement within such jurisdiction. All material presented in this report, unless specifically indicated otherwise, is under copyright to CS. None of the material, nor its content, nor any copy of it, may be altered in any way, transmitted to, copied or distributed to any other party, without the prior express written permission of CS. All trademarks, service marks and logos used in this report are trademarks or service marks or registered trademarks or service marks of CS or its affiliates. The information, tools and material presented in this report are provided to you for information purposes only and are not to be used or considered as an offer or the solicitation of an offer to sell or to buy or subscribe for securities or other financial instruments. CS may not have taken any steps to ensure that the securities referred to in this report are suitable for any particular investor. CS will not treat recipients as its customers by virtue of their receiving the report. The investments or services contained or referred to in this report may not be suitable for you and it is recommended that you consult an independent investment advisor if you are in doubt about such investments or investment services. Nothing in this report constitutes investment, legal, accounting or tax advice or a representation that any investment or strategy is suitable or appropriate to your individual circumstances or otherwise constitutes a personal recommendation to you. CS does not offer advice on the tax consequences of investment and you are advised to contact an independent tax adviser. Please note in particular that the bases and levels of taxation may change. CS believes the information and opinions in the Disclosure Appendix of this report are accurate and complete. Information and opinions presented in the other sections of the report were obtained or derived from sources CS believes are reliable, but CS makes no representations as to their accuracy or completeness. Additional information is available upon request. CS accepts no liability for loss arising from the use of the material presented in this report, except that this exclusion of liability does not apply to the extent that liability arises under specific statutes or regulations applicable to CS. This report is not to be relied upon in substitution for the exercise of independent judgment. CS may have issued, and may in the future issue, a trading call regarding this security. Trading calls are short term trading opportunities based on market events and catalysts, while stock ratings reflect investment recommendations based on expected total return over a 12-month period as defined in the disclosure section. Because trading calls and stock ratings reflect different assumptions and analytical methods, trading calls may differ directionally from the stock rating. In addition, CS may have issued, and may in the future issue, other reports that are inconsistent with, and reach different conclusions from, the information presented in this report. Those reports reflect the different assumptions, views and analytical methods of the analysts who prepared them and CS is under no obligation to ensure that such other reports are brought to the attention of any recipient of this report. CS is involved in many businesses that relate to companies mentioned in this report. These businesses include specialized trading, risk arbitrage, market making, and other proprietary trading. Past performance should not be taken as an indication or guarantee of future performance, and no representation or warranty, express or implied, is made regarding future performance. Information, opinions and estimates contained in this report reflect a judgement at its original date of publication by CS and are subject to change without notice. The price, value of and income from any of the securities or financial instruments mentioned in this report can fall as well as rise. The value of securities and financial instruments is subject to exchange rate fluctuation that may have a positive or adverse effect on the price or income of such securities or financial instruments. Investors in securities such as ADR’s, the values of which are influenced by currency volatility, effectively assume this risk. Structured securities are complex instruments, typically involve a high degree of risk and are intended for sale only to sophisticated investors who are capable of understanding and assuming the risks involved. The market value of any structured security may be affected by changes in economic, financial and political factors (including, but not limited to, spot and forward interest and exchange rates), time to maturity, market conditions and volatility, and the credit quality of any issuer or reference issuer. Any investor interested in purchasing a structured product should conduct their own investigation and analysis of the product and consult with their own professional advisers as to the risks involved in making such a purchase. Some investments discussed in this report have a high level of volatility. High volatility investments may experience sudden and large falls in their value causing losses when that investment is realised. Those losses may equal your original investment. Indeed, in the case of some investments the potential losses may exceed the amount of initial investment, in such circumstances you may be required to pay more money to support those losses. Income yields from investments may fluctuate and, in consequence, initial capital paid to make the investment may be used as part of that income yield. Some investments may not be readily realisable and it may be difficult to sell or realise those investments, similarly it may prove difficult for you to obtain reliable information about the value, or risks, to which such an investment is exposed. This report may provide the addresses of, or contain hyperlinks to, websites. Except to the extent to which the report refers to website material of CS, CS has not reviewed the linked site and takes no responsibility for the content contained therein. Such address or hyperlink (including addresses or hyperlinks to CS’s own website material) is provided solely for your convenience and information and the content of the linked site does not in any way form part of this document. Accessing such website or following such link through this report or CS’s website shall be at your own risk. This report is issued and distributed in Europe (except Switzerland) by Credit Suisse Securities (Europe) Limited, One Cabot Square, London E14 4QJ, England, which is regulated in the United Kingdom by The Financial Services Authority (“FSA”). This report is being distributed in Germany by Credit Suisse Securities (Europe) Limited Niederlassung Frankfurt am Main regulated by the Bundesanstalt fuer Finanzdienstleistungsaufsicht ("BaFin"). This report is being distributed in the United States by Credit Suisse Securities (USA) LLC ; in Switzerland by Credit Suisse AG; in Canada by Credit Suisse Securities (Canada), Inc.; in Brazil by Banco de Investimentos Credit Suisse (Brasil) S.A. or its affiliates; in Mexico by Banco Credit Suisse (México), S.A. (transactions related to the securities mentioned in this report will only be effected in compliance with applicable regulation); in Japan by Credit Suisse Securities (Japan) Limited, Financial Instrument Firm, Director-General of Kanto Local Finance Bureau (Kinsho) No. 66, a member of Japan Securities Dealers Association, The Financial Futures Association of Japan, Japan Securities Investment Advisers Association; elsewhere in Asia/Pacific by whichever of the following is the appropriately authorised entity in the relevant jurisdiction: Credit Suisse (Hong Kong) Limited, Credit Suisse Equities (Australia) Limited , Credit Suisse Securities (Thailand) Limited, Credit Suisse Securities (Malaysia) Sdn Bhd, Credit Suisse AG, Singapore Branch, Credit Suisse Securities (India) Private Limited, Credit Suisse Securities (Europe) Limited, Seoul Branch, Credit Suisse AG, Taipei Securities Branch, PT Credit Suisse Securities Indonesia, and elsewhere in the world by the relevant authorised affiliate of the above. Research on Taiwanese securities produced by Credit Suisse AG, Taipei Securities Branch has been prepared by a registered Senior Business Person. Research provided to residents of Malaysia is authorised by the Head of Research for Credit Suisse Securities (Malaysia) Sdn. Bhd., to whom they should direct any queries on +603 2723 2020. In jurisdictions where CS is not already registered or licensed to trade in securities, transactions will only be effected in accordance with applicable securities legislation, which will vary from jurisdiction to jurisdiction and may require that the trade be made in accordance with applicable exemptions from registration or licensing requirements. Non-U.S. customers wishing to effect a transaction should contact a CS entity in their local jurisdiction unless governing law permits otherwise. U.S. customers wishing to effect a transaction should do so only by contacting a representative at Credit Suisse Securities (USA) LLC in the U.S. Please note that this report was originally prepared and issued by CS for distribution to their market professional and institutional investor customers. Recipients who are not market professional or institutional investor customers of CS should seek the advice of their independent financial advisor prior to taking any investment decision based on this report or for any necessary explanation of its contents. This research may relate to investments or services of a person outside of the UK or to other matters which are not regulated by the FSA or in respect of which the protections of the FSA for private customers and/or the UK compensation scheme may not be available, and further details as to where this may be the case are available upon request in respect of this report. Any Nielsen Media Research material contained in this report represents Nielsen Media Research's estimates and does not represent facts. NMR has neither reviewed nor approved this report and/or any of the statements made herein. If this report is being distributed by a financial institution other than Credit Suisse AG, or its affiliates, that financial institution is solely responsible for distribution. Clients of that institution should contact that institution to effect a transaction in the securities mentioned in this report or require further information. This report does not constitute investment advice by Credit Suisse to the clients of the distributing financial institution, and neither Credit Suisse AG, its affiliates, and their respective officers, directors and employees accept any liability whatsoever for any direct or consequential loss arising from their use of this report or its content. Copyright 2010 CREDIT SUISSE AG and/or its affiliates. All rights reserved.
CREDIT SUISSE (Hong Kong) Limited Asia/Pacific: +852 2101-6000