Embed Size (px)
Citation preview
ELSEVIER Environmental Pollution 99 (1998) 29-36
ENVIRONMENTAL POLLUTION
Polycyclic aromatic hydrocarbon (PAH) dispersion and deposition to vegetation and soil following a large scale chemical fire
A.A. Meharg, J. Wright, H. Dyke, D. Osborn Institute of Terrestrial Ecology, Monks Wood, Abbots Ripton, Huntingdon, Cambridgeshire PE17 2LS, UK
Received 25 June 1997; accepted 29 October 1997
Abstract
Polycyclic aromatic hydrocarbons (PAHs) were determined in soil and vegetation following a large scale chemical fire involving 10 000 ton of polypropylene. In comparison with sites outside the plume from the fire, PAH concentrations were elevated in grass shoots (by up to 70-fold) and in soil (by up to 370-fold). The pattern of PAH dispersion under the plume was dependent on the physical-chemical properties of individual PAHs. The lighter, least hydrophobic PAHs were dispersed into the environment at greater distances than heavier, more hydrophobic PAHs. At the most distant sampling point (4.5 km) under the plume, the low molecular weight PAHs were still considerably elevated in vegetation samples compared to control sites. Dispersion appeared to be regulated by the compounds partitioning between the vapour and particulate phase, with dry particulate deposition occurring closer to the fire source than gaseous deposition. For all PAHs, the fire resulted in greater contamination of soils compared to grasses, with the relative ratio of plant/soil contamination decreasing as hydrophobicity increased. © 1998 Elsevier Science Ltd. All rights reserved.
Keywords." Chemical accident; Grass; PAHs; Plastics fire; Pollutant deposition; Soil
I. Introduction
Fires involving organic chemicals can produce com- plex cocktails of semi-volatile organic pollutants, including polycyclic aromatic hydrocarbons (PAHs) (Mitera and Michal, 1985; Levin, 1987; Wheatley et al., 1993) and dioxins and furans (Meharg and Osborn, 1995; Meharg et al., 1997). The potential for pollutant dispersion and deposition from smoke plumes generated by massive fires may be considerable (Ghoniem et al., 1993; Meharg and Osborn, 1995). Dispersion of pollu- tants generated by chemical fires will be complex, prin- cipally as the large range of physical-chemical properties of individual pollutants within smoke-plume mixtures will result in differential spatial and temporal distributions of these contaminants within the receiving environment (Meharg and French, 1995). This com- plexity is exacerbated as pyrolysis and combustion con- ditions will vary throughout the course of fires, leading to temporal fluctuations in pollutant production (Meharg, 1994).
Atmospheric monitoring for background and point source levels of semi-volatile organics all show strong
0269-7491/98/$19.00 © 1998 Elsevier Science Ltd. All rights reserved. PII : S0269-7491 (97)00180-2
dependence on physical-chemical properties with respect to their affinities for gas phase and dry particu- late phase (Harrison and Jones, 1995; Tremolada et al., 1996). In the absence of precipitation, chemical fallout from smoke plumes will be as dry-gas deposition or as dry-particulate deposition. For terrestrial ecosystems, vegetation and soil will be the initial receptors for both particulate and gaseous atmospheric pollutants (Simo- nich and Hites, 1994, 1995). Soil and plant shoot con- tamination from atmospheric deposition is the major route of entry of semi-volatile compounds released by accidents into agricultural and wildlife food chains (Meharg et al., 1997).
PAHs are common pollutants produced by a wide variety of combustion sources, including the incomplete combustion and pyrolysis of a wide range of plastics (Levin, 1987), including polypropylene (Mitera and Michal, 1985; Fardell et al., 1986; Wheatley et al., 1993). An opportunity arose to investigate the factors regulat- ing environmental distribution of PAHs following a massive chemical fire involving 10000ton of poly- propylene. Both grass shoots and soils were analysed for 16 PAHs (the standard World Health Organisation
30 A.A. Meharg et al./ Environmental Pollution 99 (1998) 29-36
PAH base set; USDHHS, 1995,a b) along a transect bisecting the smoke plume. Spatial PAH deposition, and the ratio of vegetation/soil contamination were modelled using physical-chemical descriptors.
2. Materials and methods
2.1. Accident description
The fire started in a warehouse on the 9/10/95 at 05.35 h and was extinguished by 14.40 h. The warehouse was used to store 10 000 ton of polypropylene in pelleted form for moulding. Following the incident, information on plume direction and width, and the wind speed throughout the fire was obtained from the U K Meteor- ological Office's Chemnet service (Bennett and Weston, 1989).
Surface wind speed from 08.40--11.40h at 180 ° was 2 8 k m h -1 with gusts up to 38kmh-1; average mixed layer wind speed was 3 5 k m h - l from 200 °, air tem- perature was 15°C rising to 19°C, humidity 85%, pre- cipitation nil and depth of mixed layer was 1 500 m. The surface wind speed from 11.40-14.40h at 190 ° was 30 km h -1 with gusts up to 40 km h - l , slowly decreasing to 2 0 k m h -1 with gusts to 3 0 k m h -1. Average mixed layer wind speed was 4 0 k m h -I from 210 ° gradually decreasing to 3 5 k m h -1. Air temperature was 19°C ris- ing to 22°C, precipitation nil and depth of mixed layer was 15 000 m.
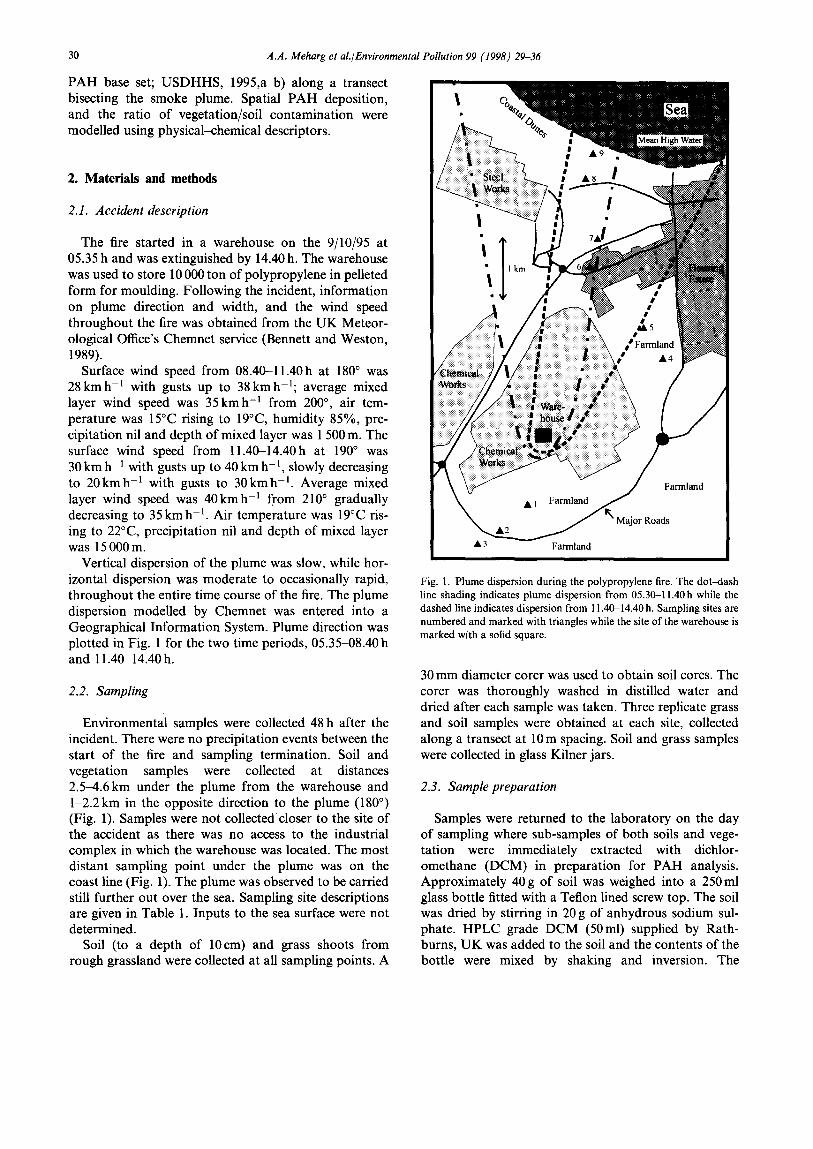
Vertical dispersion of the plume was slow, while hor- izontal dispersion was moderate to occasionally rapid, throughout the entire time course of the fire. The plume dispersion modelled by Chemnet was entered into a Geographical Information System. Plume direction was plotted in Fig. 1 for the two time periods, 05.35-08.40 h and 11.40-14.40 h.
2.2. Sampling
Environmental samples were collected 48 h after the incident. There were no precipitation events between the start of the fire and sampling termination. Soil and vegetation samples were collected at distances 2.5-4.6km under the plume from the warehouse and 1-2.2km in the opposite direction to the plume (180 °) (Fig. 1). Samples were not collected closer to the site of the accident as there was no access to the industrial complex in which the warehouse was located. The most distant sampling point under the plume was on the coast line (Fig. 1). The plume was observed to be carried still further out over the sea. Sampling site descriptions are given in Table 1. Inputs to the sea surface were not determined.
Soil (to a depth of 10cm) and grass shoots from rough grassland were collected at all sampling points. A
Fig. 1. Plume dispersion during the polypropylene fire. The dot-dash line shading indicates plume dispersion from 05.30-11.40h while the dashed line indicates dispersion from 11.40-14.40 h. Sampling sites are numbered and marked with triangles while the site of the warehouse is marked with a solid square.
30 mm diameter corer was used to obtain soil cores. The corer was thoroughly washed in distilled water and dried after each sample was taken. Three replicate grass and soil samples were obtained at each site, collected along a transect at 10m spacing. Soil and grass samples were collected in glass Kilner jars.
2.3. Sample preparation
Samples were returned to the laboratory on the day of sampling where sub-samples of both soils and vege- tation were immediately extracted with dichlor- omethane (DCM) in preparation for PAH analysis. Approximately 40 g of soil was weighed into a 250 ml glass bottle fitted with a Teflon lined screw top. The soil was dried by stirring in 20 g of anhydrous sodium sul- phate. HPLC grade DCM (50ml) supplied by Rath- burns, U K was added to the soil and the contents of the bottle were mixed by shaking and inversion. The
A.A. Meharg et al./Environmental Pollution 99 (1998) 29-36
Table 1 Site and soil descriptions for sampling points shown in Fig. 1
31
Sampling site Distance from warehouse Site description Soil type (kin)
1 1.0 rough grassland boulder clay 2 1.9 rough grassland boulder clay 3 1.6 rough grassland boulder clay 4 2.4 tilled silty clay 5 2.5 tilled silty clay 6 3.0 wasteland silty clay 7 3.2 wasteland impacted clay 8 4.0 fixed dune sand 9 4.5 dune sand
samples were left overnight before continuing the extraction procedure. The soil was then extracted another 4 times with 50ml aliquots of DCM. Sample blanks consisted of empty Kilner jars taken out and opened in the field. Subsequent extraction and sample treatment of blanks was identical to the extraction pro- cedures outlined above. There was one blank for soils and one blank for vegetation.
Approximately 20 g of vegetation were weighed into a 500ml Kilner jar to which 100ml of DCM (HPLC grade) was added and the contents of the jar were mixed by swirling. The samples were left overnight before continuing the extraction procedure. The vegetation was then extracted by the same extraction procedure a fur- ther 4 times.
Both the soil and grass DCM extracts were trans- ferred to a 500ml Kuderna-danish flask via a funnel containing 10g of anhydrous sodium sulphate. The extract in the Kuderna-danish flask was reduced to 2.5ml in a water bath at 55°C. The volume of the extract was reduced to exactly 2ml using a stream of electron capture grade nitrogen (British Oxygen Com- pany, UK).
Clean-up was carried out by alumina column chro- matography. The alumina was prepared by decontami- nation in a muffle furnace at 700°C for 4 h followed by deactivation with the addition of 5% water (w/w). The alumina column consisted of 3.5g of deactivated alu- mina packed into a 7 mm diameter glass column.
Extract (200 #l) was placed on the column and the PAHs eluted with 5ml of hexane. The eluant was reduced to 0.5 ml under a stream of nitrogen. An inter- nal standard of 2,6-dichlorobenzonitrile was added to the samples to give a final concentration 0.5/zgm1-1.
Recovery and blank samples were included with each batch of soil and vegetation samples. Material used to calculate recoveries was soil and vegetation from a rural site. This material was spiked with a PAH mixture and extracted identically to the samples. Unspiked samples of the material used to calculate recoveries were also analysed to subtract background levels from the spiked material. Recoveries were run with every 15 samples.
Sub-samples of soil and vegetation samples were dried at 70°C to a constant weight and this information was used to report PAH data on a dry weight basis.
2.4. P A H analysis
The GC-MS model was a Hewlett Packard (UK) 5890 gas chromatograph interfaced to a 5972 mass selective detector. An autosampler was used to inject 5 #1 of sample. The injection technique was split/split- less at 250°C. The column was a 30m×0.25mm id HP5 MS fitted with a 5 m×0.25mm id deactivated retention gap. The carrier gas was helium held at 1.75mlmin -I throughout the run by electronic pressure control. The column oven was held at 40°C for 2min and then ramped at 10°Cmin -1 to 300°C. The mass spectrometer was run in select ion mode. The 3 most abundant ions were monitored for each compound except for naph- thalene where only 2 ions were monitored. The PAHs determined are reported in Table 2.
The identity of a chromatographic peak was identi- fied by comparison of the peak's relative retention time with the relative retention times of peaks in the stan- dard. This operation was performed automatically by the GC-MS chromatography data system and chroma- tograms were checked manually by overlaying the stan- dard and sample chromatograms. Retention time of the internal standard was used to correct for variation in retention time. Comparison of the ion ratios of the rele- vant standard peak with the ion ratios of the unknown in the sample were used as confirmation of peak iden- tity. The peak area of the most abundant of the three ions monitored (target ion) was used for all quantitative calculations.
3. Results and discussion
Levels of 16 PAHs in soils and vegetation at the dif- ferent sampling points were determined and related to the plume distribution plot (Fig. 1). The graphs illus- trating the PAH distribution (Fig. 2) are ranked in
32 A.A. Meharg et al./Environmental Pollution 99 (1998) 29-36
Table 2 Log octanol-water partitioning coefficients (Kow) and Henry 's law constants (H) for the PAHs analysed following the accident. Physical- chemical parameters were obtained from US Dept Health H u m a n Services U S D H H S (1995a, b)
PAH log Kow Vapour pressure H (kPa) (atm m 3 mo l - i)
Naphthalene 3.29 0.012 4.60x 10 -4 Acenaphthene 3.98 5.81 × 10 -4 3.98 x 10 -3 Acenaphthylene 4.07 0.004 1.45x 10 -3 Fluorene 4.18 4.16×10 -5 1.00x 10 -4 Anthracene 4.45 2.26× 10 -6 1.77x 10 -5 Phenanthrene 4.45 9.04× 10 -5 2.56x 10 -5 Pyrene 4.88 3.33×10 -7 4.88x10 -5 Fluoranthene 4.90 6.66x 10 -7 6.30x 10 -6 Chrysene 5.16 8.38x10 - s 1.05x 10 -6 Benzo(a)anthracene 5.61 2.93 × 10 -9 1.00x 10 -6 Benzo(b)fluoranthrene 6.04 6.66x 10 - s 1.22x 10 -5 Benzo(k)fluoranthrene 6.06 7.86x 10 -12 3.87× 10 -5 Benzo(a)pyrene 6.06 7.45x 10 - l ° 4.90x 10 -7 Benzo(g,h,i)perylene 6.50 1.39×10 -I1 1.44x 10 -7 Indeno(l,2,3-c,d)pyrene 6.58 1.33 x 10 -12 6.90x 10 -8 Dibenzo(a,h)anthracene 6.84 1.33 × 10-N 7.30x 10 - s
order of increasing log octanol-water partitioning coef- ficient (Kow) Kow values are given in Table 2.
3.1. P A H levels in vegetation
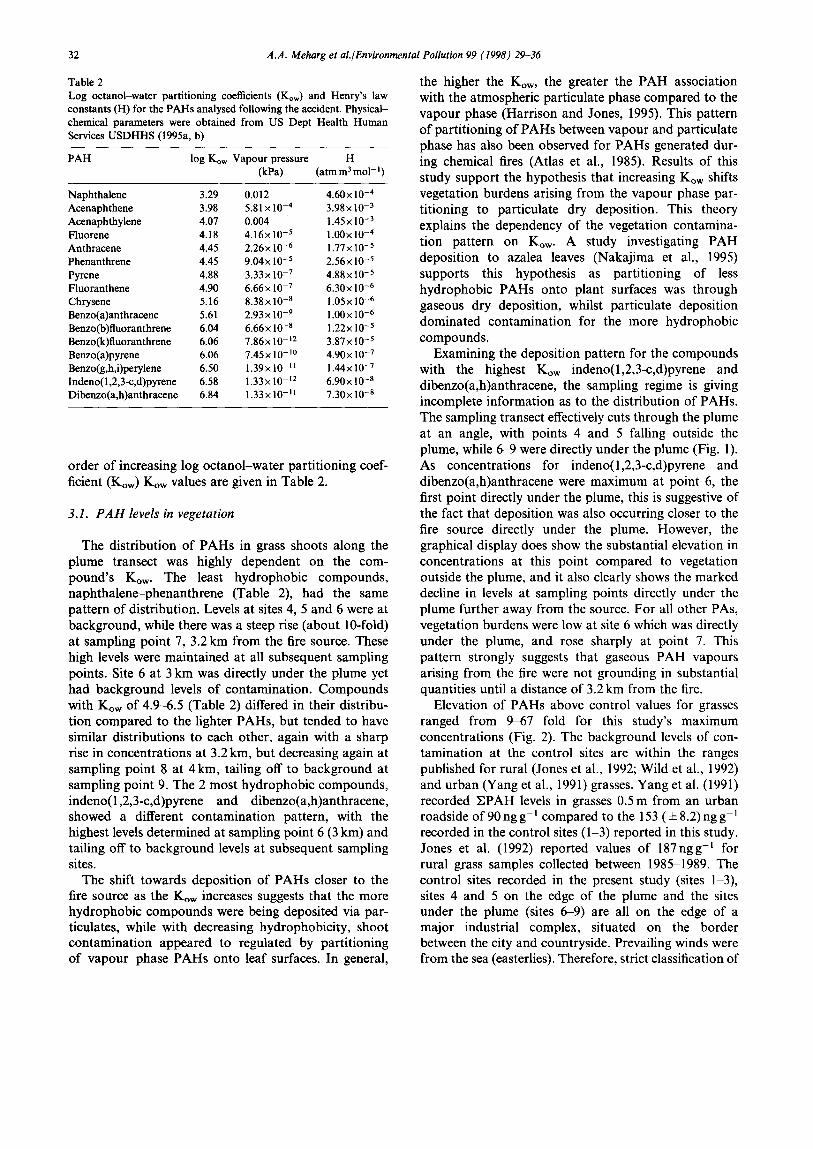
The distribution of PAHs in grass shoots along the plume transect was highly dependent on the com- pound's Kow. The least hydrophobic compounds, naphthalene-phenanthrene (Table 2), had the same pattern of distribution. Levels at sites 4, 5 and 6 were at background, while there was a steep rise (about 10-fold) at sampling point 7, 3.2 km from the fire source. These high levels were maintained at all subsequent sampling points. Site 6 at 3 km was directly under the plume yet had background levels of contamination. Compounds with Kow of 4.9--6.5 (Table 2) differed in their distribu- tion compared to the lighter PAHs, but tended to have similar distributions to each other, again with a sharp rise in concentrations at 3.2 km, but decreasing again at sampling point 8 at 4 kin, tailing off to background at sampling point 9. The 2 most hydrophobie compounds, indeno(1,2,3-c,d)pyrene and dibenzo(a,h)anthracene, showed a different contamination pattern, with the highest levels determined at sampling point 6 (3 km) and tailing off to background levels at subsequent sampling sites.
The shift towards deposition of PAHs closer to the fire source as the Kow increases suggests that the more hydrophobic compounds were being deposited via par- ticulates, while with decreasing hydrophobicity, shoot contamination appeared to regulated by partitioning of vapour phase PAHs onto leaf surfaces. In general,
the higher the Kow, the greater the PAH association with the atmospheric particulate phase compared to the vapour phase (Harrison and Jones, 1995). This pattern of partitioning of PAHs between vapour and particulate phase has also been observed for PAHs generated dur- ing chemical fires (Atlas et al., 1985). Results of this study support the hypothesis that increasing Kow shifts vegetation burdens arising from the vapour phase par- titioning to particulate dry deposition. This theory explains the dependency of the vegetation contamina- tion pattern on Kow. A study investigating PAH deposition to azalea leaves (Nakajima et al., 1995) supports this hypothesis as partitioning of less hydrophobic PAHs onto plant surfaces was through gaseous dry deposition, whilst particulate deposition dominated contamination for the more hydrophobic compounds.
Examining the deposition pattern for the compounds with the highest Kow indeno(l,2,3-c,d)pyrene and dibenzo(a,h)anthracene, the sampling regime is giving incomplete information as to the distribution of PAHs. The sampling transect effectively cuts through the plume at an angle, with points 4 and 5 falling outside the plume, while 6-9 were directly under the plume (Fig. 1). As concentrations for indeno(1,2,3-c,d)pyrene and dibenzo(a,h)anthracene were maximum at point 6, the first point directly under the plume, this is suggestive of the fact that deposition was also occurring closer to the fire source directly under the plume. However, the graphical display does show the substantial elevation in concentrations at this point compared to vegetation outside the plume, and it also clearly shows the marked decline in levels at sampling points directly under the plume further away from the source. For all other PAs, vegetation burdens were low at site 6 which was directly under the plume, and rose sharply at point 7. This pattern strongly suggests that gaseous PAH vapours arising from the fire were not grounding in substantial quantities until a distance of 3.2 km from the fire.
Elevation of PAHs above control values for grasses ranged from 9-67 fold for this study's maximum concentrations (Fig. 2). The background levels of con- tamination at the control sites are within the ranges published for rural (Jones et al., 1992; Wild et al., 1992) and urban (Yang et al., 1991) grasses. Yang et al. (1991) recorded Y~PAH levels in grasses 0.5 m from an urban roadside of 90 ng g- 1 compared to the 153 ( + 8.2) ng g-i recorded in the control sites (1-3) reported in this study. Jones et al. (1992) reported values of 187ngg -l for rural grass samples collected between 1985-1989. The control sites recorded in the present study (sites 1-3), sites 4 and 5 on the edge of the plume and the sites under the plume (sites 6-9) are all on the edge of a major industrial complex, situated on the border between the city and countryside. Prevailing winds were from the sea (easterlies). Therefore, strict classification of
A.A. Meharg et al./Environmental Pollution 99 (1998) 29-36 33
laphthalene
36 27 18 9 0
105 79 53
A 25 0
' 01 O~ 4-
C _o
! u 120 t - O 90 0 60 ~ 3o o,. o o
16oo 1200 800 400
o
125 94 63 31 0
115 2000 86 1 500 58 1 000 29 0
acenaphthene
acenaphthylene
luorene
mthracene / ~ / . ~ ~
100 75 50 25 O0
36 27 18 9 0
40 30 20 10 0
20 15 10 5 0
490 368 245 123
0
~henanthrene 360
"~ 270 180 9O 0
2600 ~ 420 1950 315 1300 210 650 105
0 - 0 luoranthene
2600 ~ j 440 1950 330 1300 220 650 110
0 0 2 0 2.5 30 35 40 4 5 50
1400 1050 700 350
0
2000 1500 1000
chrysene ~ 300
t 225 150
500 ~_ 75 0 - 0
fenz°(a)anthr~[ 180
. . . . 0
~enzo(b)fluoranthene 240 180 120
500 60 "0 0 . . . . . . . . . . . O
~enzo(k)fluoranthene "0 12oo 140 900 105 o n 600 70 300 35 =~
0 . . . . . . 0 benzo(a)pyrene ,
1200 - ~ . 80 = 60 900
600 40 300 20 -
0 0 ~z ~enzo(g, h,i)pe/~.e ~-. l :~
300 t 6.0 225 i 45
75 ! 1.5 0 I 0.0
650 ndeno(1,2,3-~)pyrene . . . . . . . . t 10.0
325 5.0 163 2.5
0 ~ O0
2400120018006000 i Jibenzo(a,h)a ~ hracene - 4 0 } !~ iL 9362718
2 0 2 5 3 0 3 5 40 45 5 0
distance (km) distance (km)
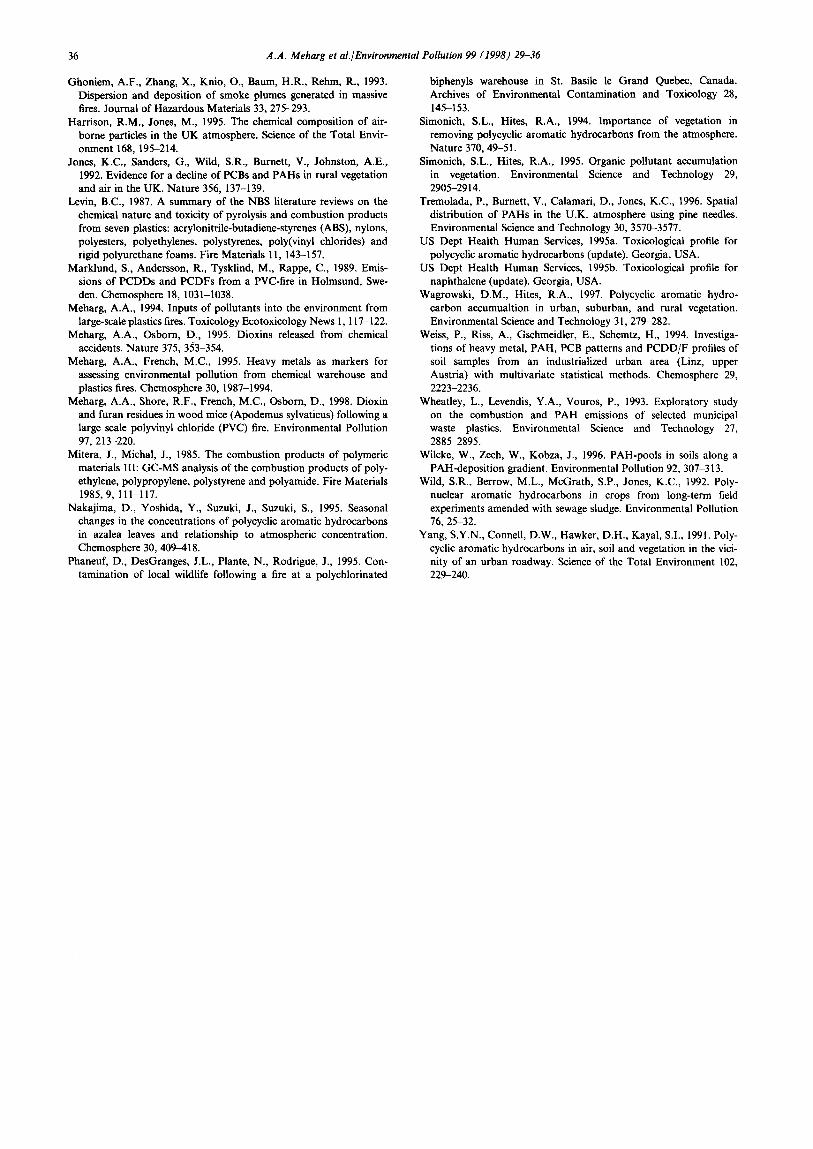
Fig. 2. Plots of shoot (triangles and dashed line) and soil (circles and solid lines) for PAHs along the sampling transect illustrated in Fig. 1. Closed symbols are for samples under the plume and open symbols for controls collected at 180 ° to the direction of the plume. Each point is the average of 3 replicate determinations ± the standard error of the mean. Plant and soil levels were scaled so that maximum concentration for each PAH appeared at the same position on the y-axis.
these sites as urban, suburban and rural is not possible given the local demography and weather patterns.
It was possible that other point sources of PAH pol- lution contributed considerably to soil and vegetation burdens. Such point sources could have included the nearby steel works, chemical plants and roads (Fig. 1). However, as these sources have been in existence for considerable lengths of time, if they were continuous sources of PAHs there should be greater elevation in soil burdens at sampling sites near these installations compared to more remote sampling points. This is not the case at sites 1-3 and 8 and 9 which were all near
potential point sources (Fig. 2), indicating that the accident was responsible for the considerable elevation in soil levels at sites 6 and 7 and in vegetation at sites 6-9.
The ZPAH recorded for vegetation at the most con- taminated site (2365ngg -1) exceeds any literature reports of background levels of PAHs in grasses, though levels in other vegetation types from urban/suburban areas are at or about the levels recorded in this study. A study on urban/suburban maple (Wagrowski and Hites, 1997) and pine (Tremolada et al., 1996) recorded/zg -1 levels of EPAHs in leaves and needles. However, the cuticular wax content, particularly for pine, is much
34 A.A. Meharg et al./Environrnental Pollution 99 (1998) 29-36
higher than for grasses and, therefore, comparisons between grass and tree leaves may be misleading.
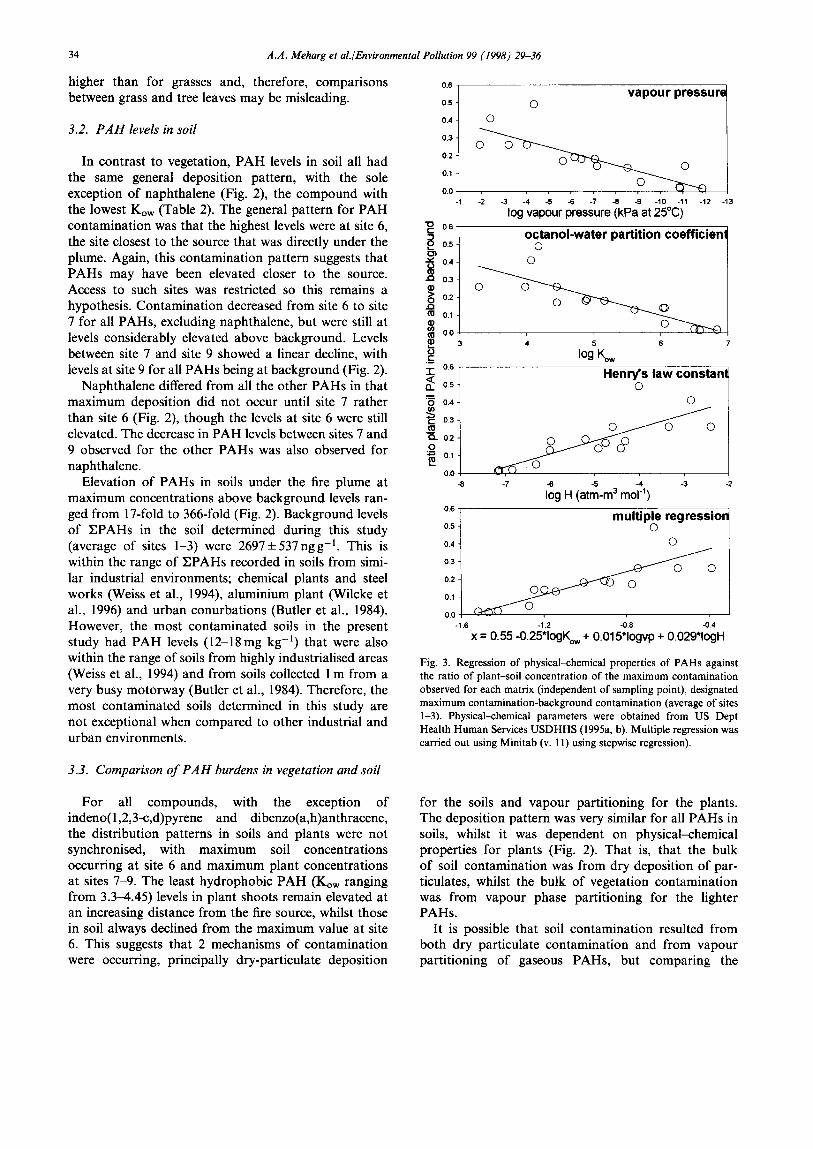
3.2. P A H levels in soil
In contrast to vegetation, PAH levels in soil all had the same general deposition pattern, with the sole exception of naphthalene (Fig. 2), the compound with the lowest Kow (Table 2). The general pattern for PAH contamination was that the highest levels were at site 6, the site closest to the source that was directly under the plume. Again, this contamination pattern suggests that PAHs may have been elevated closer to the source. Access to such sites was restricted so this remains a hypothesis. Contamination decreased from site 6 to site 7 for all PAHs, excluding naphthalene, but were still at levels considerably elevated above background. Levels between site 7 and site 9 showed a linear decline, with levels at site 9 for all PAHs being at background (Fig. 2).
Naphthalene differed from all the other PAHs in that maximum deposition did not occur until site 7 rather than site 6 (Fig. 2), though the levels at site 6 were still elevated. The decrease in PAH levels between sites 7 and 9 observed for the other PAHs was also observed for naphthalene.
Elevation of PAHs in soils under the fire plume at maximum concentrations above background levels ran- ged from 17-fold to 366-fold (Fig. 2). Background levels of EPAHs in the soil determined during this study (average of sites 1-3) were 2697+537ngg -1. This is within the range of EPAHs recorded in soils from simi- lar industrial environments; chemical plants and steel works (Weiss et al., 1994), aluminium plant (Wilcke et al., 1996) and urban conurbations (Butler et al., 1984). However, the most contaminated soils in the present study had PAH levels (12-18mg kg -1) that were also within the range of soils from highly industrialised areas (Weiss et al., 1994) and from soils collected 1 m from a very busy motorway (Butler et al., 1984). Therefore, the most contaminated soils determined in this study are not exceptional when compared to other industrial and urban environments.
0.6-
0.5-
0.4-
0.3.
0.2"
0.1
0.0 -1
0.6"
vapour pressure o
o
-2 -3 -4 -5 -6 -7 -8 -9 -10 -11 -12 -13
log vapour pressure (kPa at 25°C)
- I O 0.5. 131) -~ 0.4.
J~ 0 . 3 O~ (~ 0 . 2
tO 0.1 11) ~O 0.0
U
"1- 0.6 < Q.. 0.5 "~ 0.4
~ 13.3
Q- 0.2 O ~ 0.1
0.0
octanol-water partition coefficienl o
o
o
o
4 5 6
log Kow
-6 -2
Henry's law constant o
o
o ~ o
-7 -6 -5 -4 -3 log H (atm-m 3 tool ~)
0.6 multiple regression o.s 0 0.4 0
0.3 .......-@''~ O 0 0.2 ~ 0 0.1
o.o - p ~ ' ' 1 0 -1.6 -1.2 =0.8 -0.4
x--- 0.55 -0.25*lOgKow + 0.015*logvp + 0.029*logH
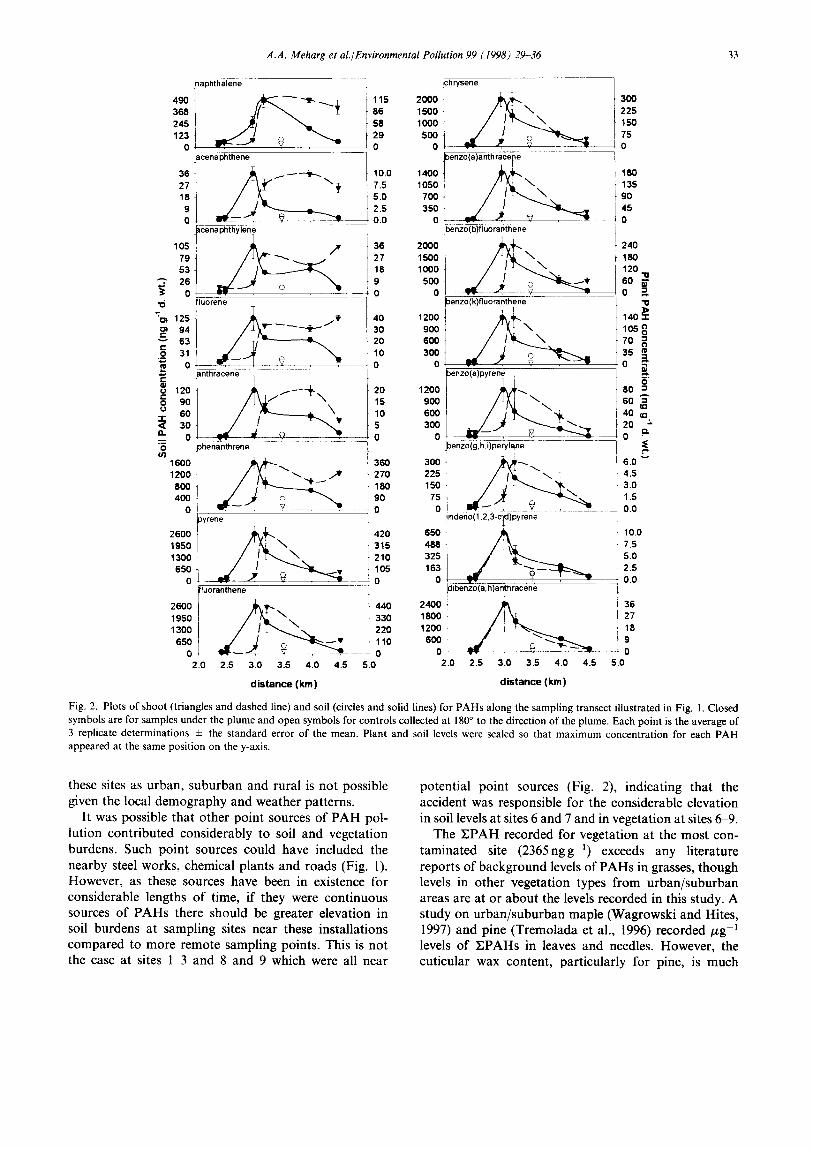
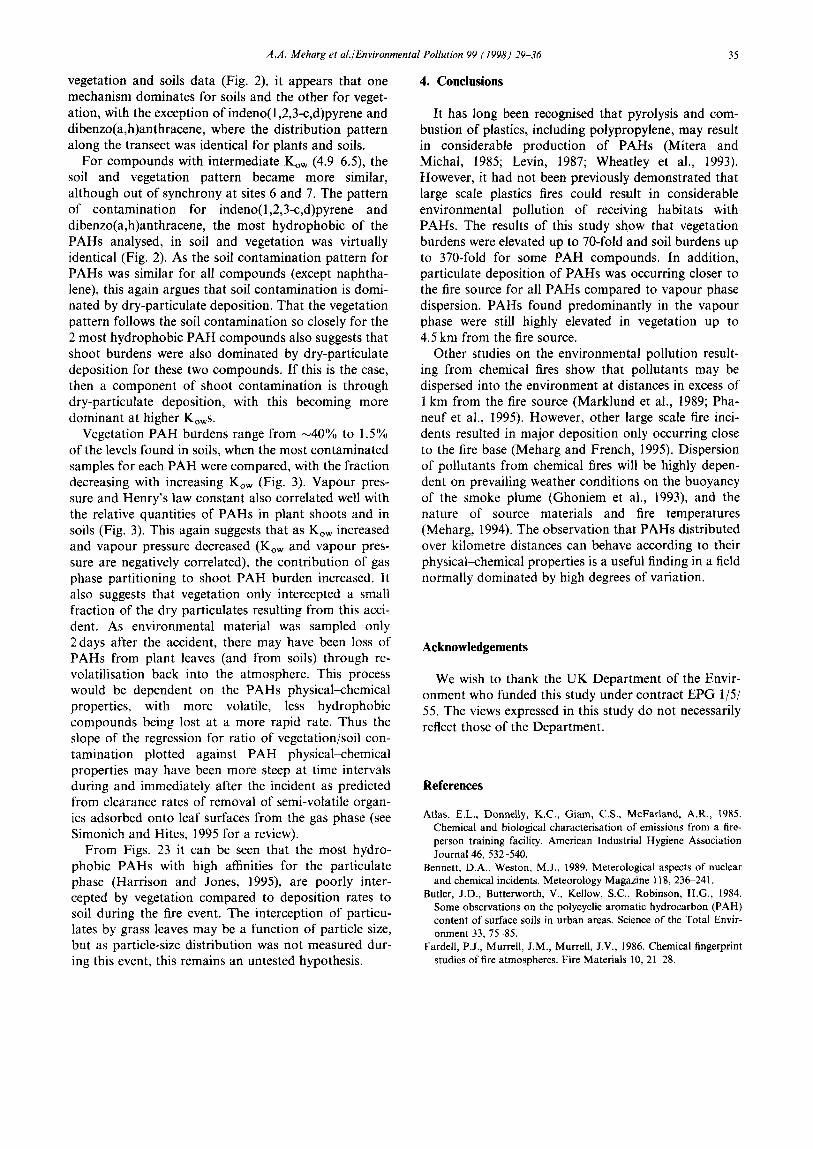
Fig. 3. Regression of physical-chemical properties of PAHs against the ratio of plant-soil concentration of the maximum contamination observed for each matrix (independent of sampling point), designated maximum contamination-background contamination (average of sites 1-3). Physical-chemical parameters were obtained from US Dept Health Human Services USDHHS (1995a, b). Multiple regression was carried out using Minitab (v. 11) using stepwise regression).
3.3. Comparison o f P A H burdens in vegetation and soil
For all compounds, with the exception of indeno(1,2,3-c,d)pyrene and dibenzo(a,h)anthracene, the distribution patterns in soils and plants were not synchronised, with maximum soil concentrations occurring at site 6 and maximum plant concentrations at sites 7-9. The least hydrophobic PAH (Kow ranging from 3.3-4.45) levels in plant shoots remain elevated at an increasing distance from the fire source, whilst those in soil always declined from the maximum value at site 6. This suggests that 2 mechanisms of contamination were occurring, principally dry-particulate deposition
for the soils and vapour partitioning for the plants. The deposition pattern was very similar for all PAHs in soils, whilst it was dependent on physical-chemical properties for plants (Fig. 2). That is, that the bulk of soil contamination was from dry deposition of par- ticulates, whilst the bulk of vegetation contamination was from vapour phase partitioning for the lighter PAHs.
It is possible that soil contamination resulted from both dry particulate contamination and from vapour partitioning of gaseous PAHs, but comparing the
A.A. Meharg et al./Environmental Pollution 99 (1998) 29-36 35
vegetation and soils data (Fig. 2), it appears that one mechanism dominates for soils and the other for veget- ation, with the exception of indeno(1,2,3-c,d)pyrene and dibenzo(a,h)anthracene, where the distribution pattern along the transect was identical for plants and soils.
For compounds with intermediate Kow (4.9-6.5), the soil and vegetation pattern became more similar, although out of synchrony at sites 6 and 7. The pattern of contamination for indeno(1,2,3-c,d)pyrene and dibenzo(a,h)anthracene, the most hydrophobic of the PAHs analysed, in soil and vegetation was virtually identical (Fig. 2). As the soil contamination pattern for PAHs was similar for all compounds (except naphtha- lene), this again argues that soil contamination is domi- nated by dry-particulate deposition. That the vegetation pattern follows the soil contamination so closely for the 2 most hydrophobic PAH compounds also suggests that shoot burdens were also dominated by dry-particulate deposition for these two compounds. If this is the case, then a component of shoot contamination is through dry-particulate deposition, with this becoming more dominant at higher Ko,~s.
Vegetation PAH burdens range from ~40% to 1.5% of the levels found in soils, when the most contaminated samples for each PAH were compared, with the fraction decreasing with increasing Kow (Fig. 3). Vapour pres- sure and Henry's law constant also correlated well with the relative quantities of PAHs in plant shoots and in soils (Fig. 3). This again suggests that as Kow increased and vapour pressure decreased (Kow and vapour pres- sure are negatively correlated), the contribution of gas phase partitioning to shoot PAH burden increased. It also suggests that vegetation only intercepted a small fraction of the dry particulates resulting from this acci- dent. As environmental material was sampled only 2 days after the accident, there may have been loss of PAHs from plant leaves (and from soils) through re- volatilisation back into the atmosphere. This process would be dependent on the PAHs physical-chemical properties, with more volatile, less hydrophobic compounds being lost at a more rapid rate. Thus the slope of the regression for ratio of vegetation/soil con- tamination plotted against PAH physical--chemical properties may have been more steep at time intervals during and immediately after the incident as predicted from clearance rates of removal of semi-volatile organ- ics adsorbed onto leaf surfaces from the gas phase (see Simonich and Hites, 1995 for a review).
From Figs. 23 it can be seen that the most hydro- phobic PAHs with high affinities for the particulate phase (Harrison and Jones, 1995), are poorly inter- cepted by vegetation compared to deposition rates to soil during the fire event. The interception of particu- lates by grass leaves may be a function of particle size, but as particle-size distribution was not measured dur- ing this event, this remains an untested hypothesis.
4. Conclusions
It has long been recognised that pyrolysis and com- bustion of plastics, including polypropylene, may result in considerable production of PAHs (Mitera and Michal, 1985; Levin, 1987; Wheatley et al., 1993). However, it had not been previously demonstrated that large scale plastics fires could result in considerable environmental pollution of receiving habitats with PAHs. The results of this study show that vegetation burdens were elevated up to 70-fold and soil burdens up to 370-fold for some PAH compounds. In addition, particulate deposition of PAHs was occurring closer to the fire source for all PAHs compared to vapour phase dispersion. PAHs found predominantly in the vapour phase were still highly elevated in vegetation up to 4.5 km from the fire source.
Other studies on the environmental pollution result- ing from chemical fires show that pollutants may be dispersed into the environment at distances in excess of 1 km from the fire source (Marklund et al., 1989; Pha- neuf et al., 1995). However, other large scale fire inci- dents resulted in major deposition only occurring close to the fire base (Meharg and French, 1995). Dispersion of pollutants from chemical fires will be highly depen- dent on prevailing weather conditions on the buoyancy of the smoke plume (Ghoniem et al., 1993), and the nature of source materials and fire temperatures (Meharg, 1994). The observation that PAHs distributed over kilometre distances can behave according to their physical-chemical properties is a useful finding in a field normally dominated by high degrees of variation.
Acknowledgements
We wish to thank the UK Department of the Envir- onment who funded this study under contract EPG 1/5/ 55. The views expressed in this study do not necessarily reflect those of the Department.
References
Atlas, E.L., Donnelly, K.C., Giam, C.S., McFarland, A.R., 1985. Chemical and biological characterisation of emissions from a fire- person training facility. American Industrial Hygiene Association Journal 46, 532-540.
Bennett, D.A., Weston, M.J., 1989. Meterological aspects of nuclear and chemical incidents, Meteorology Magazine 118, 236-241.
Butler, J.D., Butterworth, V., Kellow, S.C., Robinson, H.G., 1984. Some observations on the polycyclic aromatic hydrocarbon (PAH) content of surface soils in urban areas. Science of the Total Envir- onment 33, 75-85.
FardeU, P.J., Murrell, J.M., Murrell, J.V., 1986. Chemical fingerprint studies of fire atmospheres. Fire Materials I0, 21-28.
36 A.A. Meharg et al./ Environmental Pollution 99 (1998) 29-36
Ghoniem, A.F., Zhang, X., Knio, O., Baum, H.R., Rehm, R., 1993. Dispersion and deposition of smoke plumes generated in massive fires. Journal of Hazardous Materials 33, 275-293.
Harrison, R.M., Jones, M., 1995. The chemical composition of air- borne particles in the UK atmosphere. Science of the Total Envir- onment 168, 195-214.
Jones, K.C., Sanders, G., Wild, S.R., Burnett, V., Johnston, A.E., 1992. Evidence for a decline of PCBs and PAHs in rural vegetation and air in the UK. Nature 356, 137-139.
Levin, B.C., 1987. A summary of the NBS literature reviews on the chemical nature and toxicity of pyrolysis and combustion products from seven plastics: acrylonitrile-butadiene-styrenes (ABS), nylons, polyesters, polyethylenes, polystyrenes, poly(vinyl chlorides) and rigid polyurethane foams. Fire Materials 11, 143-157.
Marklund, S., Andersson, R., Tysklind, M., Rappe, C., 1989. Emis- sions of PCDDs and PCDFs from a PVC-fire in Holmsund, Swe- den. Chemosphere 18, 1031-1038.
Meharg, A.A., 1994. Inputs of pollutants into the environment from large-scale plastics fires. Toxicology Ecotoxicology News 1, 117-122.
Meharg, A.A., Osborn, D., 1995. Dioxins released from chemical accidents. Nature 375, 323-354.
Meharg, A.A., French, M.C., 1995. Heavy metals as markers for assessing environmental pollution from chemical warehouse and plastics fires. Chemosphere 30, 1987-1994.
Meharg, A.A., Shore, R.F., French, M.C., Osborn, D., 1998. Dioxin and furan residues in wood mice (Apodemus sylvaticus) following a large scale polyvinyl chloride (PVC) fire. Environmental Pollution 97, 213-220.
Mitera, J., Michal, J., 1985. The combustion products of polymeric materials III: GC-MS analysis of the combustion products of poly- ethylene, polypropylene, polystyrene and polyamide. Fire Materials 1985, 9, 111-117.
Nakajima, D., Yoshida, Y., Suzuki, J., Suzuki, S., 1995. Seasonal changes in the concentrations of polycyclic aromatic hydrocarbons in azalea leaves and relationship to atmospheric concentration. Chemosphere 30, 409-418.
Phaneuf, D., DesGranges, J.L., Plante, N., Rodrigue, J., 1995. Con- tamination of local wildlife following a fire at a polychlorinated
biphenyls warehouse in St. Basile le Grand Quebec, Canada. Archives of Environmental Contamination and Toxicology 28, 145-153.
Simonich, S.L., Hites, R.A., 1994. Importance of vegetation in removing polycyclic aromatic hydrocarbons from the atmosphere. Nature 370, 49-51.
Simonich, S.L., Hires, R.A., 1995. Organic pollutant accumulation in vegetation. Environmental Science and Technology 29, 2905-2914.
Tremolada, P., Burnett, V., Calamari, D., Jones, K.C., 1996. Spatial distribution of PAHs in the U.K. atmosphere using pine needles. Environmental Science and Technology 30, 3570-3577.
US Dept Health Human Services, 1995a. Toxicological profile for polycyclic aromatic hydrocarbons (update). Georgia, USA.
US Dept Health Human Services, 1995b. Toxicological profile for naphthalene (update). Georgia, USA.
Wagrowski, D.M., Hires, R.A., 1997. Polycyclic aromatic hydro- carbon accumualtion in urban, suburban, and rural vegetation. Environmental Science and Technology 31,279-282.
Weiss, P., Riss, A., Gschmeidler, E., Schemtz, H., 1994. Investiga- tions of heavy metal, PAH, PCB patterns and PCDD/F profiles of soil samples from an industrialized urban area (Linz, upper Austria) with multivariate statistical methods. Chemosphere 29, 2223-2236.
Wheatley, L., Levendis, Y.A., Vouros, P., 1993. Exploratory study on the combustion and PAH emissions of selected municipal waste plastics. Environmental Science and Technology 27, 2885-2895.
Wilcke, W., Zeeh, W., Kobza, J., 1996. PAH-pools in soils along a PAH-deposition gradient. Environmental Pollution 92, 307-313.
Wild, S.R., Berrow, M.L., McGrath, S.P., Jones, K.C., 1992. Poly- nuclear aromatic hydrocarbons in crops from long-term field experiments amended with sewage sludge. Environmental Pollution 76, 25-32.
Yang, S.Y.N., Connell, D.W., Hawker, D.H., Kayal, S.I., 1991. Poly- cyclic aromatic hydrocarbons in air, soil and vegetation in the vici- nity of an urban roadway. Science of the Total Environment 102, 229-240.