Embed Size (px)
Citation preview
Title Finite Element Analysis of the INEEL PM-2A Holding Tanks .
Calc. No. ST-468 Rev. 0 Sheet 1 of 22 .
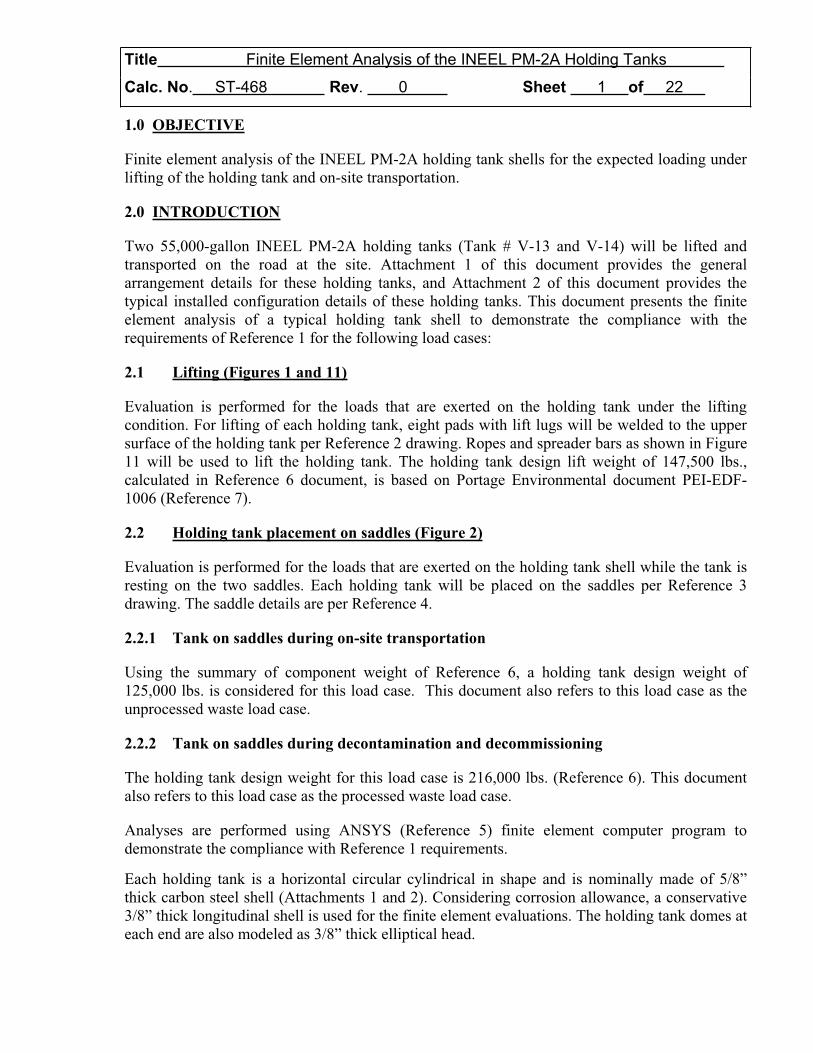
1.0 OBJECTIVE
Finite element analysis of the INEEL PM-2A holding tank shells for the expected loading under
lifting of the holding tank and on-site transportation.
2.0 INTRODUCTION
Two 55,000-gallon INEEL PM-2A holding tanks (Tank # V-13 and V-14) will be lifted and
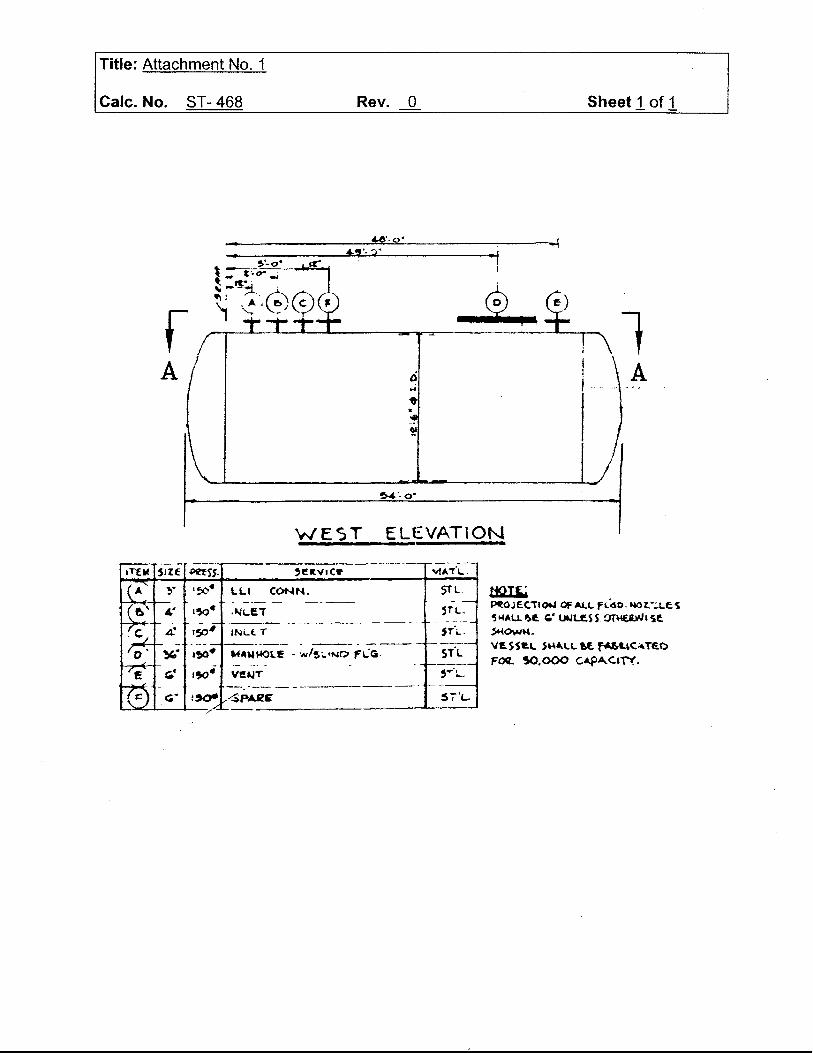
transported on the road at the site. Attachment 1 of this document provides the general
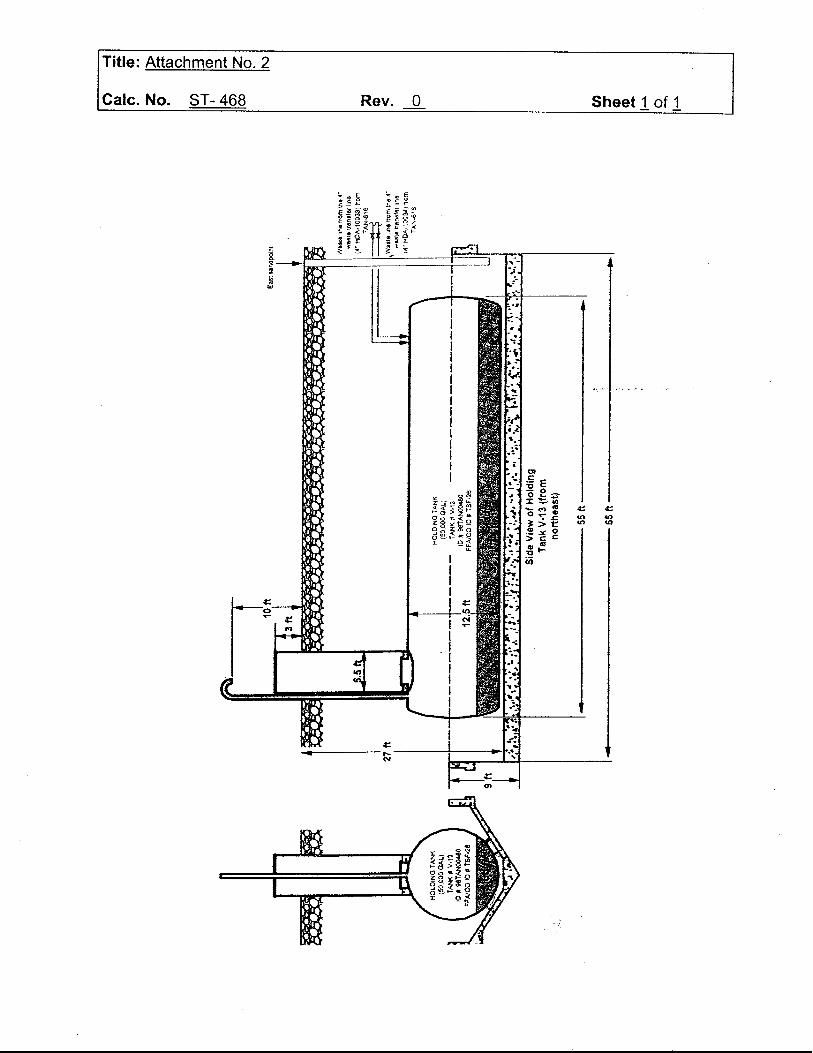
arrangement details for these holding tanks, and Attachment 2 of this document provides the
typical installed configuration details of these holding tanks. This document presents the finite
element analysis of a typical holding tank shell to demonstrate the compliance with the
requirements of Reference 1 for the following load cases:
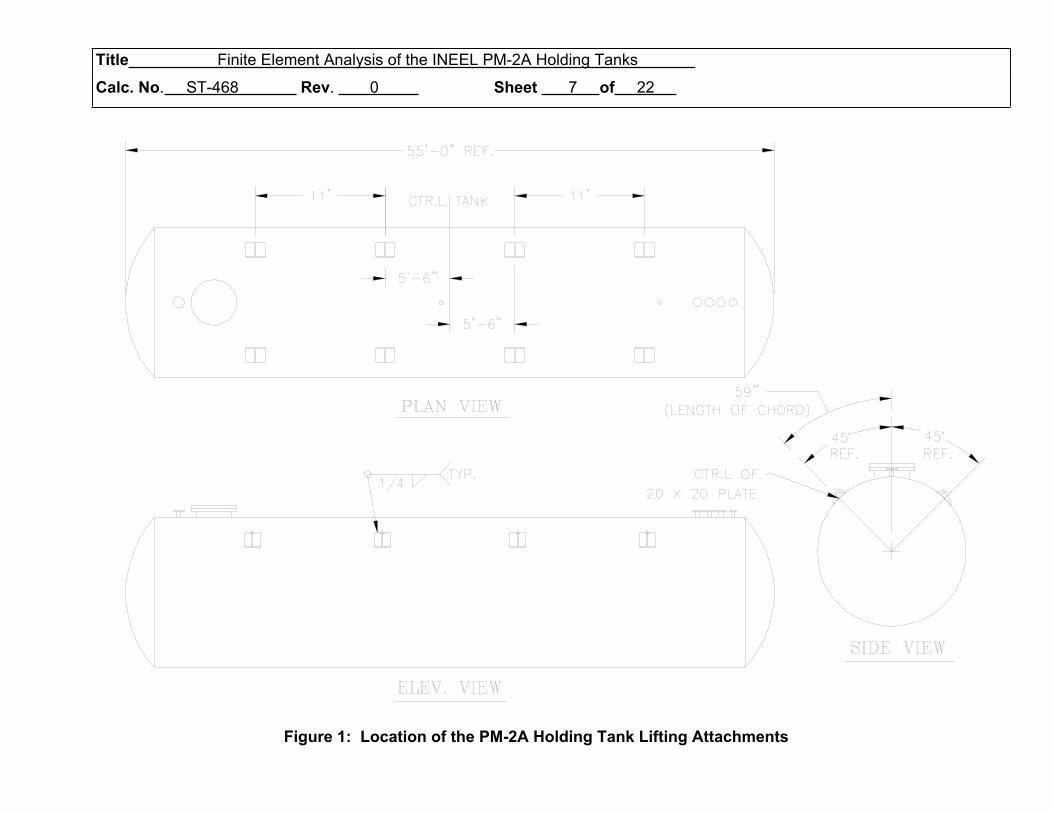
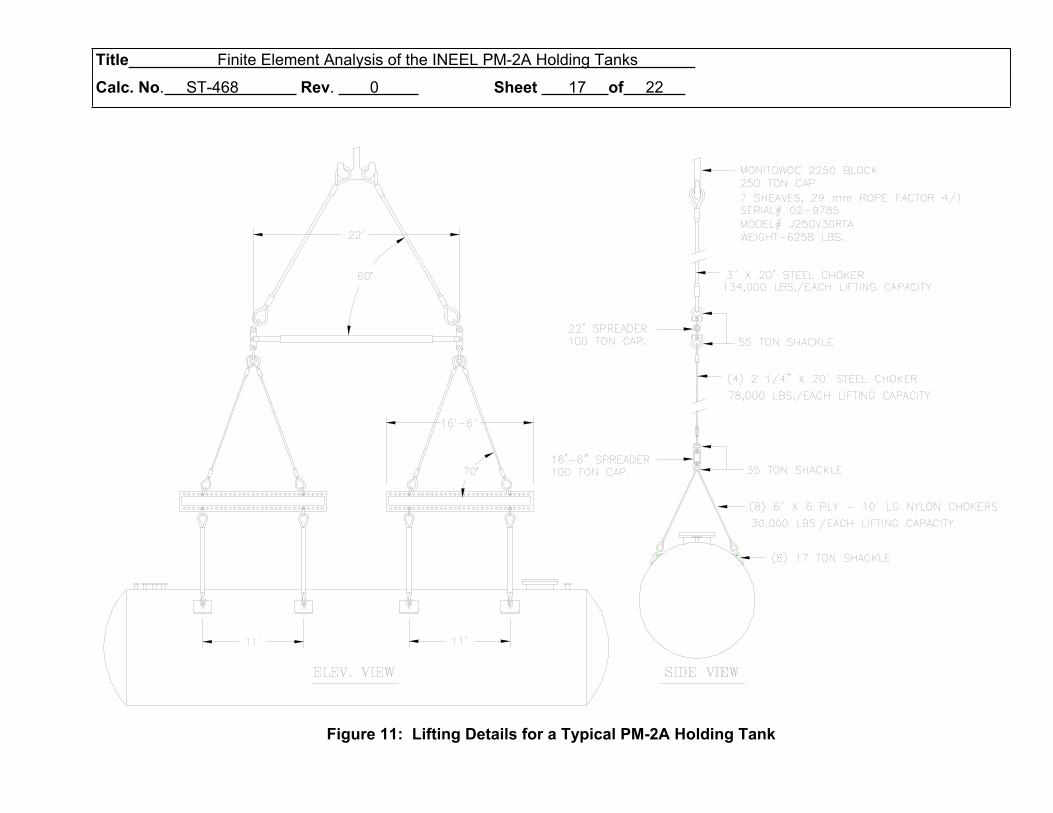
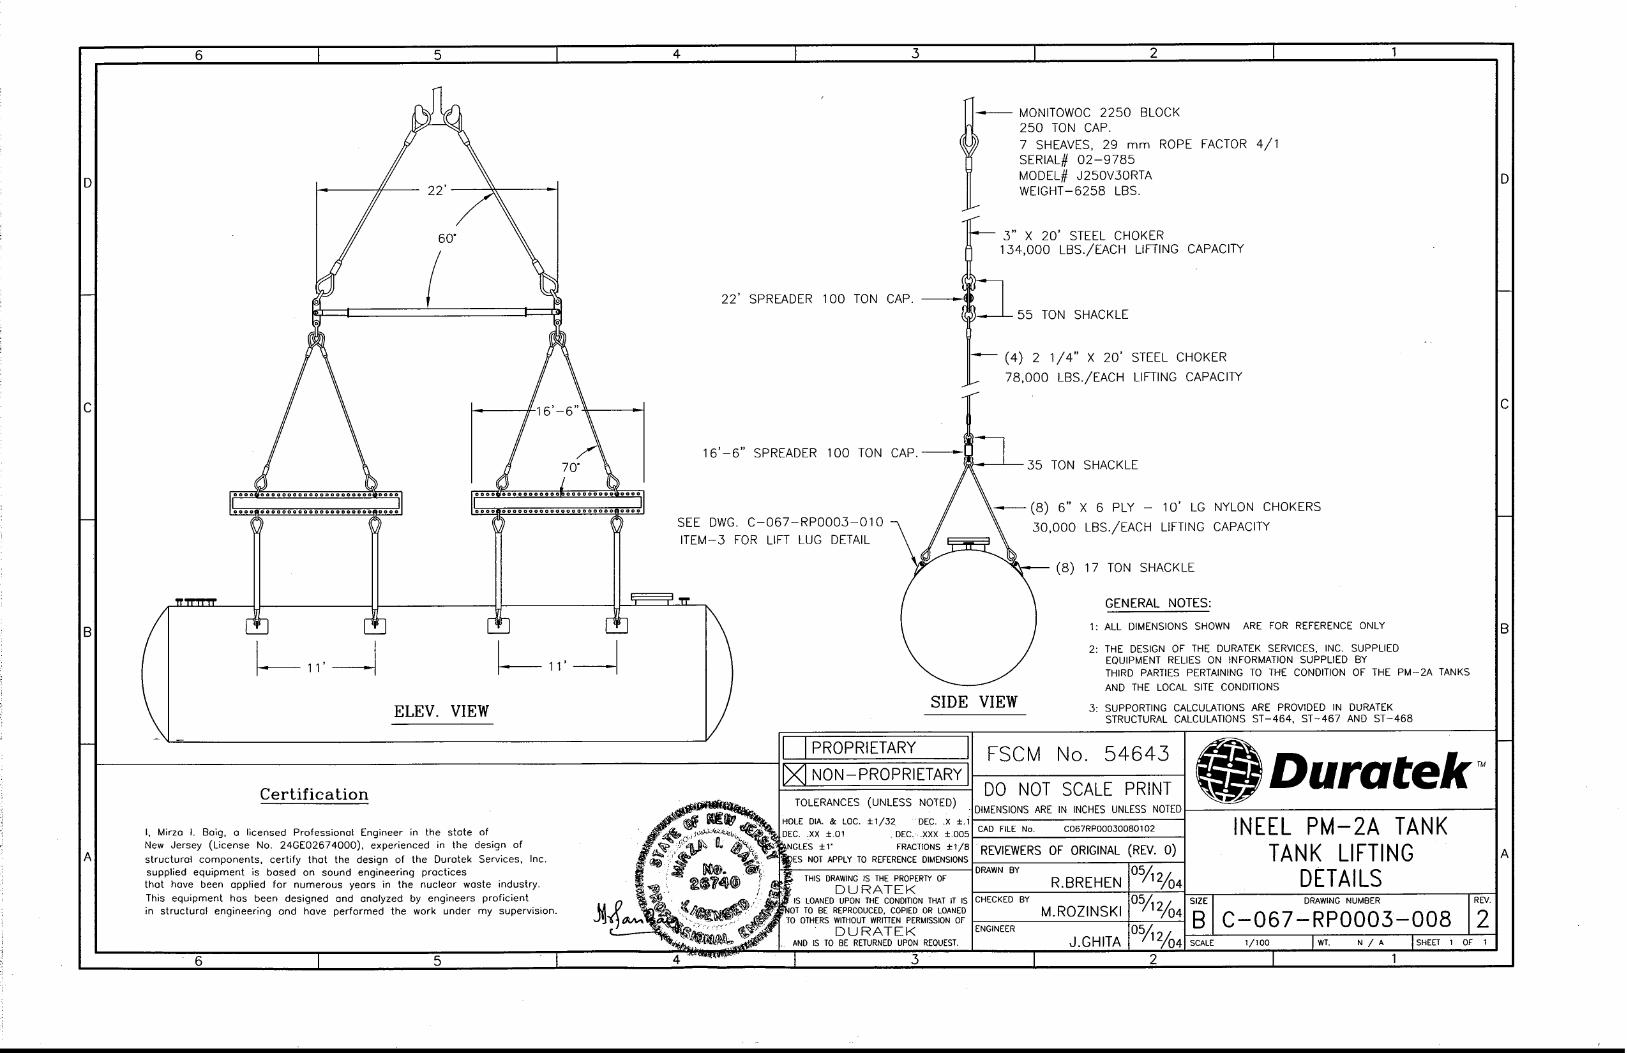
2.1 Lifting (Figures 1 and 11)
Evaluation is performed for the loads that are exerted on the holding tank under the lifting
condition. For lifting of each holding tank, eight pads with lift lugs will be welded to the upper
surface of the holding tank per Reference 2 drawing. Ropes and spreader bars as shown in Figure
11 will be used to lift the holding tank. The holding tank design lift weight of 147,500 lbs.,
calculated in Reference 6 document, is based on Portage Environmental document PEI-EDF-
1006 (Reference 7).
2.2 Holding tank placement on saddles (Figure 2)
Evaluation is performed for the loads that are exerted on the holding tank shell while the tank is
resting on the two saddles. Each holding tank will be placed on the saddles per Reference 3
drawing. The saddle details are per Reference 4.
2.2.1 Tank on saddles during on-site transportation
Using the summary of component weight of Reference 6, a holding tank design weight of
125,000 lbs. is considered for this load case. This document also refers to this load case as the
unprocessed waste load case.
2.2.2 Tank on saddles during decontamination and decommissioning
The holding tank design weight for this load case is 216,000 lbs. (Reference 6). This document
also refers to this load case as the processed waste load case.
Analyses are performed using ANSYS (Reference 5) finite element computer program to
demonstrate the compliance with Reference 1 requirements.
Each holding tank is a horizontal circular cylindrical in shape and is nominally made of 5/8”
thick carbon steel shell (Attachments 1 and 2). Considering corrosion allowance, a conservative
3/8” thick longitudinal shell is used for the finite element evaluations. The holding tank domes at
each end are also modeled as 3/8” thick elliptical head.
Title Finite Element Analysis of the INEEL PM-2A Holding Tanks .
Calc. No. ST-468 Rev. 0 Sheet 2 of 22 .
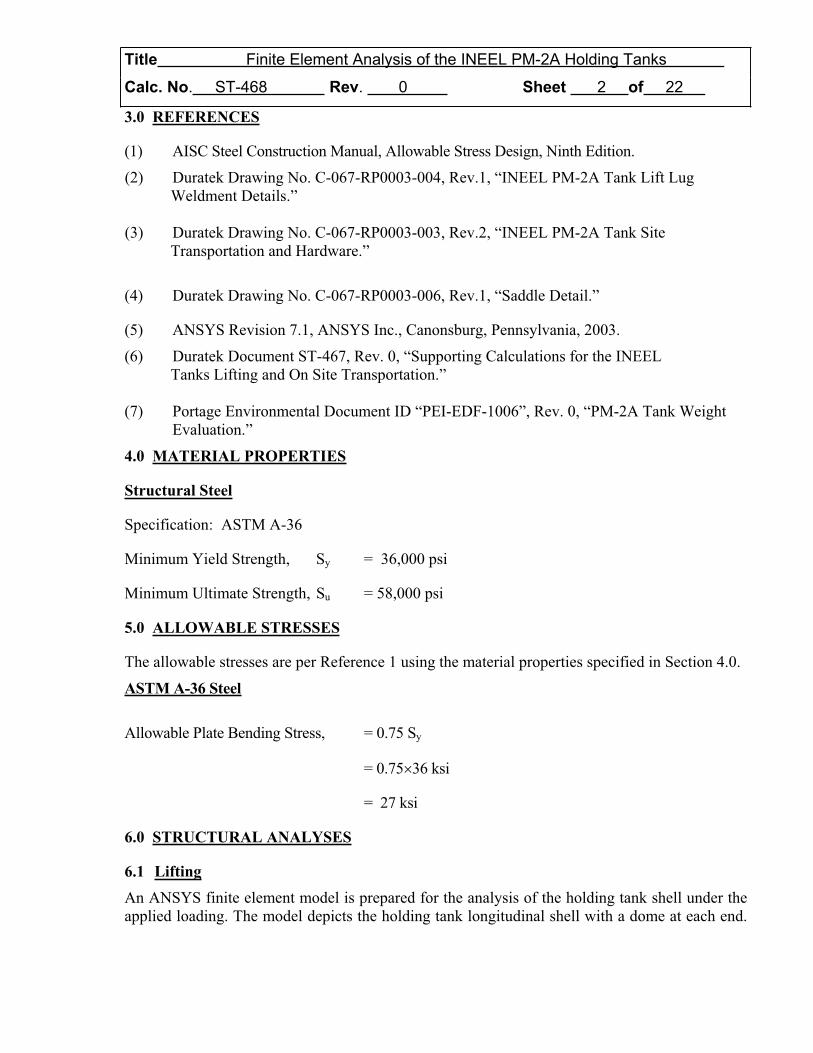
3.0 REFERENCES
(1) AISC Steel Construction Manual, Allowable Stress Design, Ninth Edition.
(2) Duratek Drawing No. C-067-RP0003-004, Rev.1, “INEEL PM-2A Tank Lift Lug
Weldment Details.”
(3) Duratek Drawing No. C-067-RP0003-003, Rev.2, “INEEL PM-2A Tank Site
Transportation and Hardware.”
(4) Duratek Drawing No. C-067-RP0003-006, Rev.1, “Saddle Detail.”
(5) ANSYS Revision 7.1, ANSYS Inc., Canonsburg, Pennsylvania, 2003.
(6) Duratek Document ST-467, Rev. 0, “Supporting Calculations for the INEEL
Tanks Lifting and On Site Transportation.”
(7) Portage Environmental Document ID “PEI-EDF-1006”, Rev. 0, “PM-2A Tank Weight
Evaluation.”
4.0 MATERIAL PROPERTIES
Structural Steel
Specification: ASTM A-36
Minimum Yield Strength, Sy = 36,000 psi
Minimum Ultimate Strength, Su = 58,000 psi
5.0 ALLOWABLE STRESSES
The allowable stresses are per Reference 1 using the material properties specified in Section 4.0.
ASTM A-36 Steel
Allowable Plate Bending Stress, = 0.75 Sy
= 0.75 36 ksi
= 27 ksi
6.0 STRUCTURAL ANALYSES
6.1 Lifting
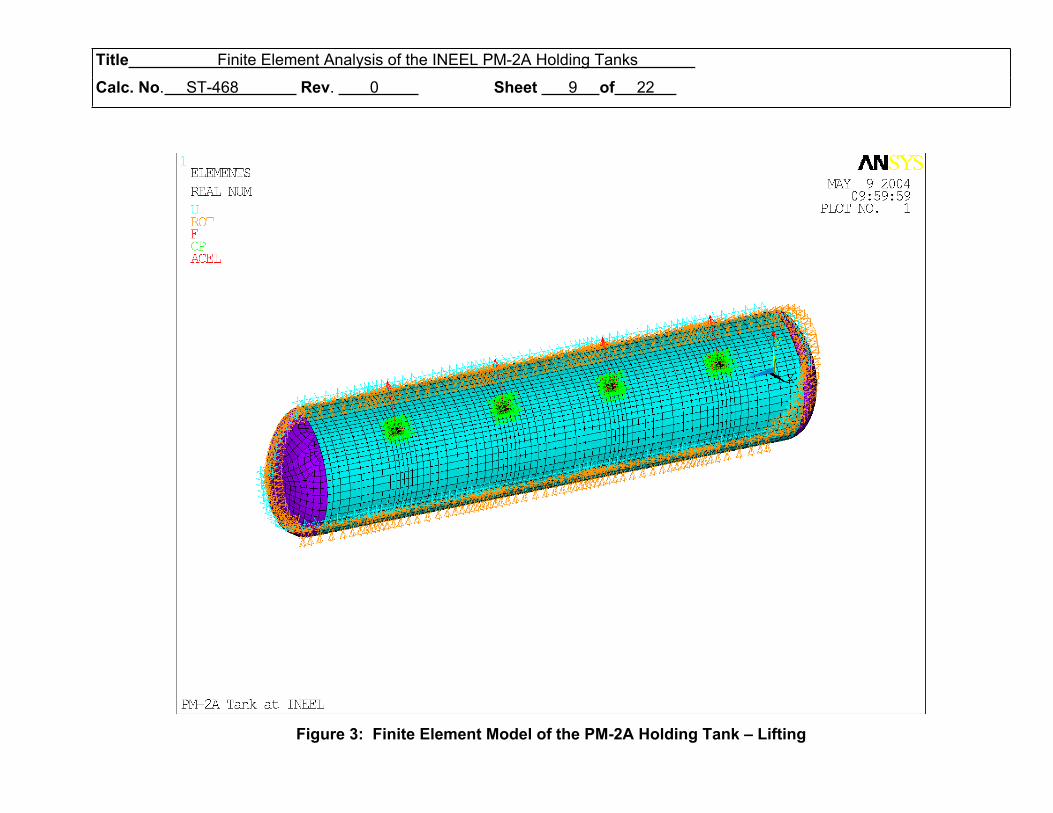
An ANSYS finite element model is prepared for the analysis of the holding tank shell under the
applied loading. The model depicts the holding tank longitudinal shell with a dome at each end.
Title Finite Element Analysis of the INEEL PM-2A Holding Tanks .
Calc. No. ST-468 Rev. 0 Sheet 3 of 22 .
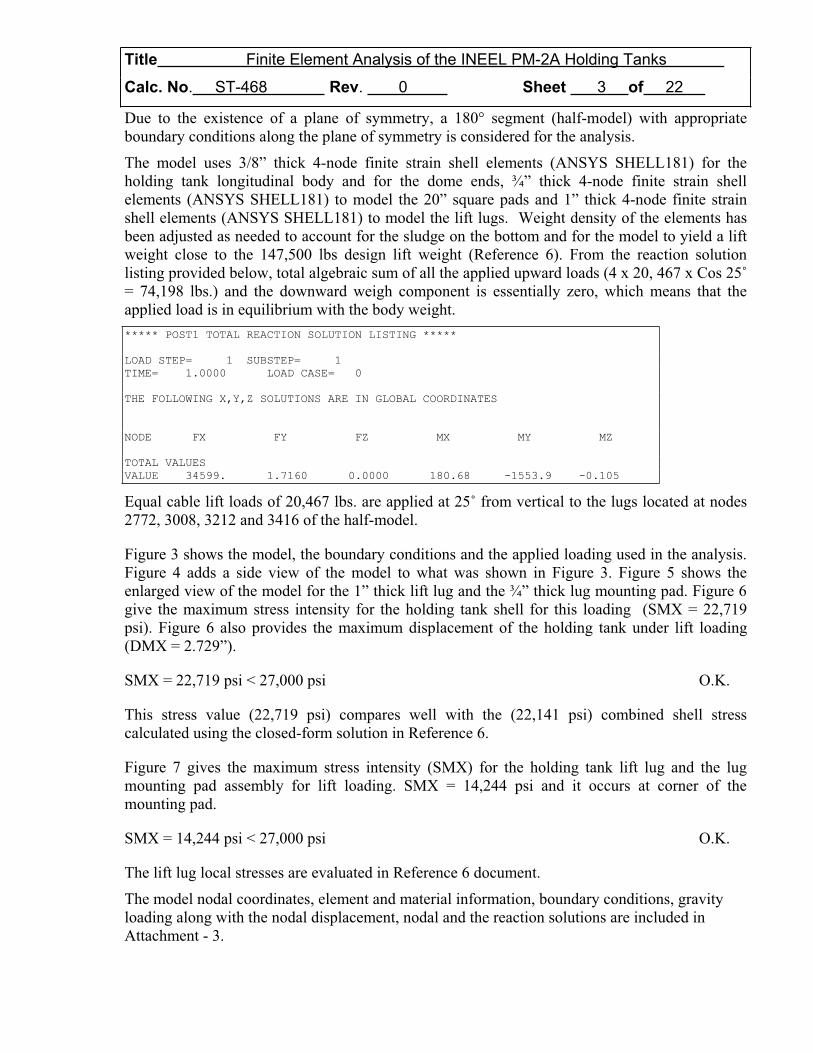
Due to the existence of a plane of symmetry, a 180 segment (half-model) with appropriate
boundary conditions along the plane of symmetry is considered for the analysis.
The model uses 3/8” thick 4-node finite strain shell elements (ANSYS SHELL181) for the
holding tank longitudinal body and for the dome ends, ¾” thick 4-node finite strain shell
elements (ANSYS SHELL181) to model the 20” square pads and 1” thick 4-node finite strain
shell elements (ANSYS SHELL181) to model the lift lugs. Weight density of the elements has
been adjusted as needed to account for the sludge on the bottom and for the model to yield a lift
weight close to the 147,500 lbs design lift weight (Reference 6). From the reaction solution
listing provided below, total algebraic sum of all the applied upward loads (4 x 20, 467 x Cos 25˚
= 74,198 lbs.) and the downward weigh component is essentially zero, which means that the
applied load is in equilibrium with the body weight.
***** POST1 TOTAL REACTION SOLUTION LISTING *****
LOAD STEP= 1 SUBSTEP= 1
TIME= 1.0000 LOAD CASE= 0
THE FOLLOWING X,Y,Z SOLUTIONS ARE IN GLOBAL COORDINATES
NODE FX FY FZ MX MY MZ
TOTAL VALUES
VALUE 34599. 1.7160 0.0000 180.68 -1553.9 -0.105
Equal cable lift loads of 20,467 lbs. are applied at 25˚ from vertical to the lugs located at nodes
2772, 3008, 3212 and 3416 of the half-model.
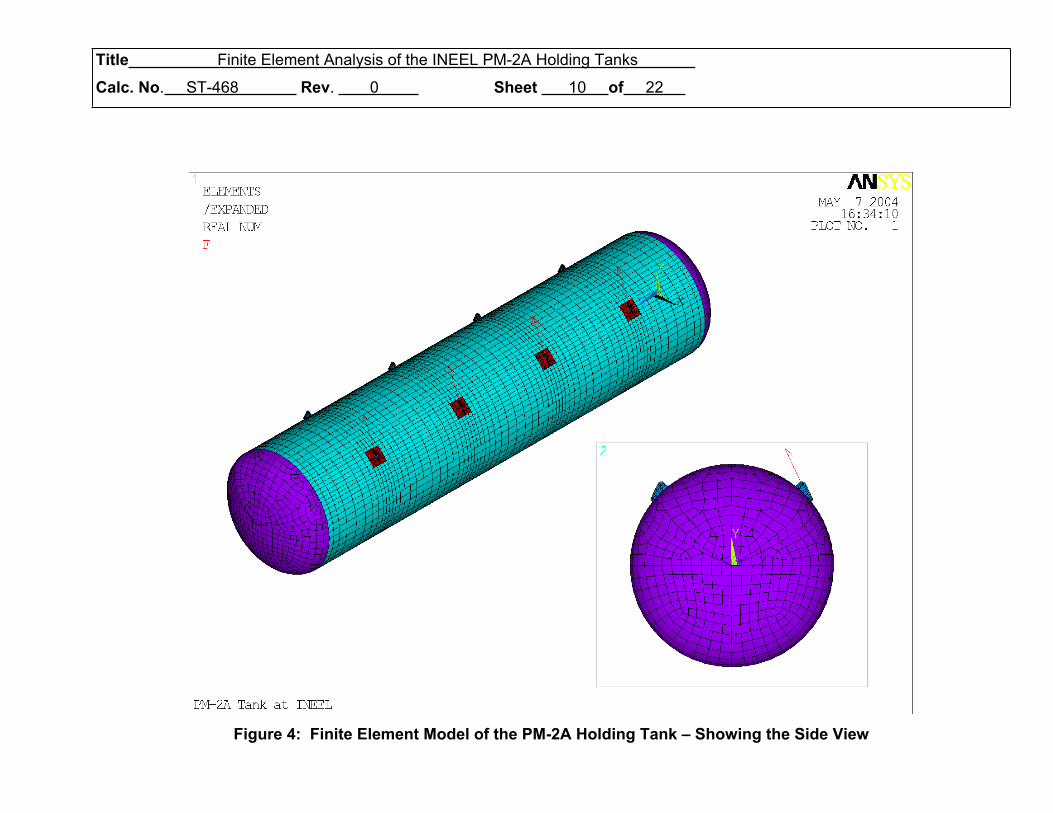
Figure 3 shows the model, the boundary conditions and the applied loading used in the analysis.
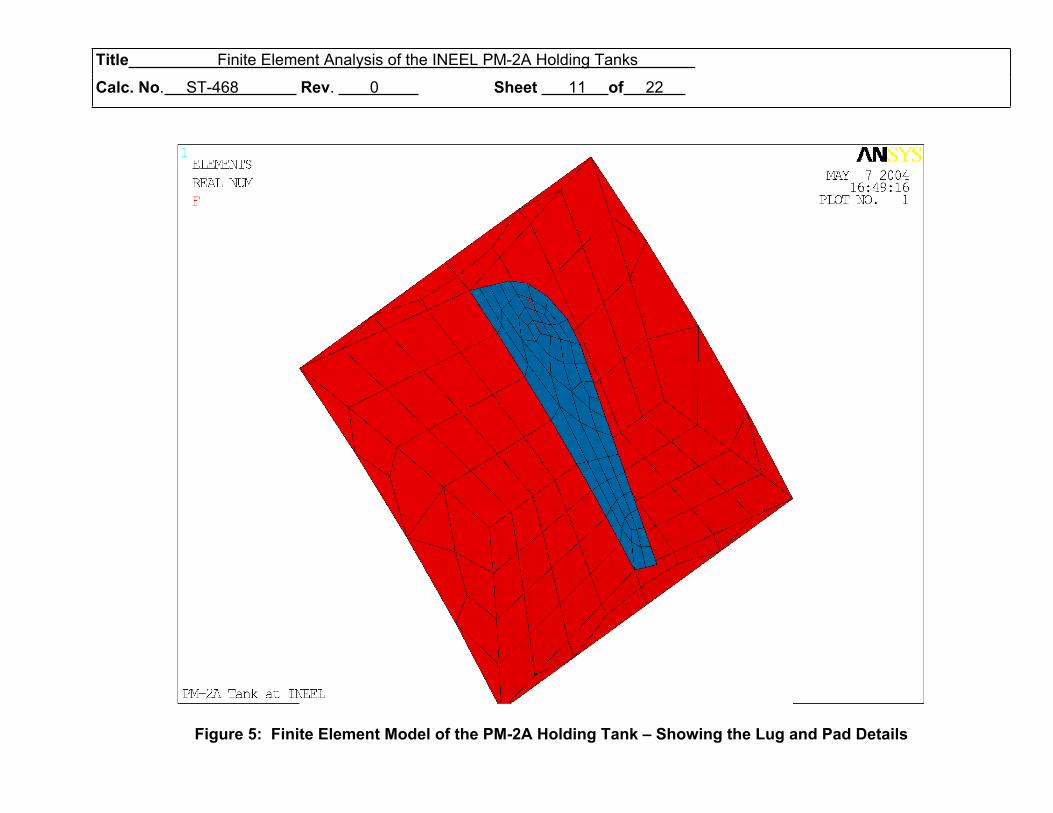
Figure 4 adds a side view of the model to what was shown in Figure 3. Figure 5 shows the
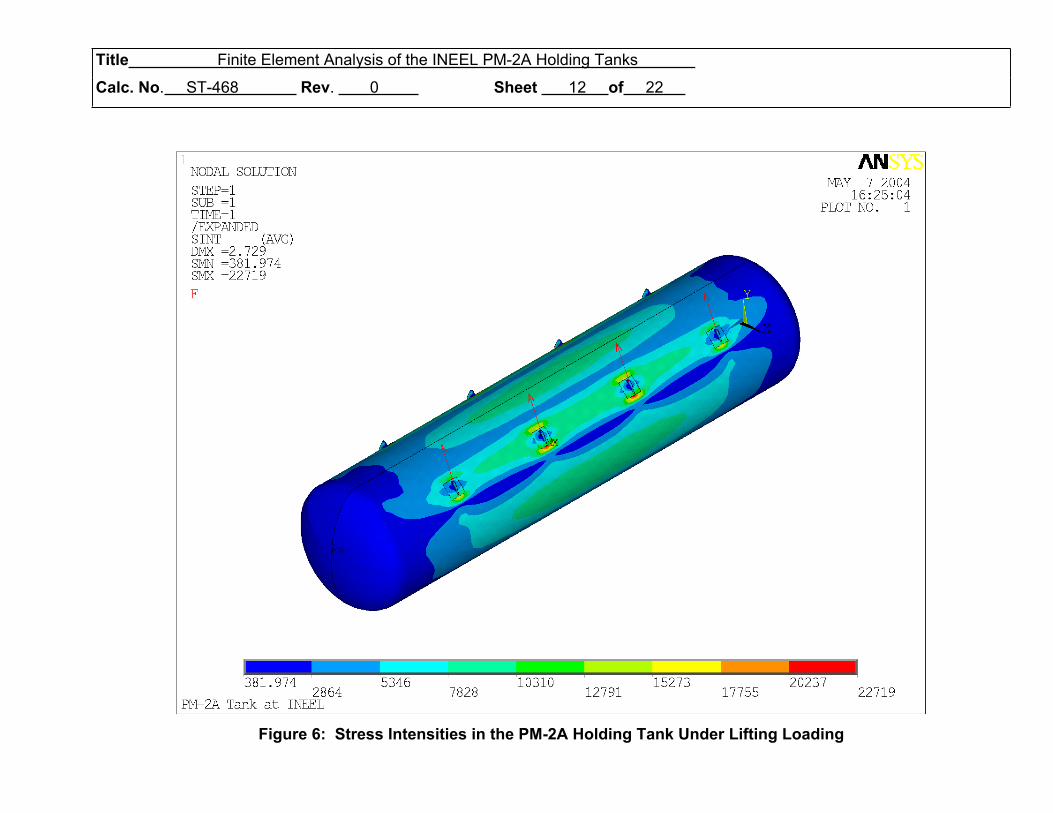
enlarged view of the model for the 1” thick lift lug and the ¾” thick lug mounting pad. Figure 6
give the maximum stress intensity for the holding tank shell for this loading (SMX = 22,719
psi). Figure 6 also provides the maximum displacement of the holding tank under lift loading
(DMX = 2.729”).
SMX = 22,719 psi < 27,000 psi O.K.
This stress value (22,719 psi) compares well with the (22,141 psi) combined shell stress
calculated using the closed-form solution in Reference 6.
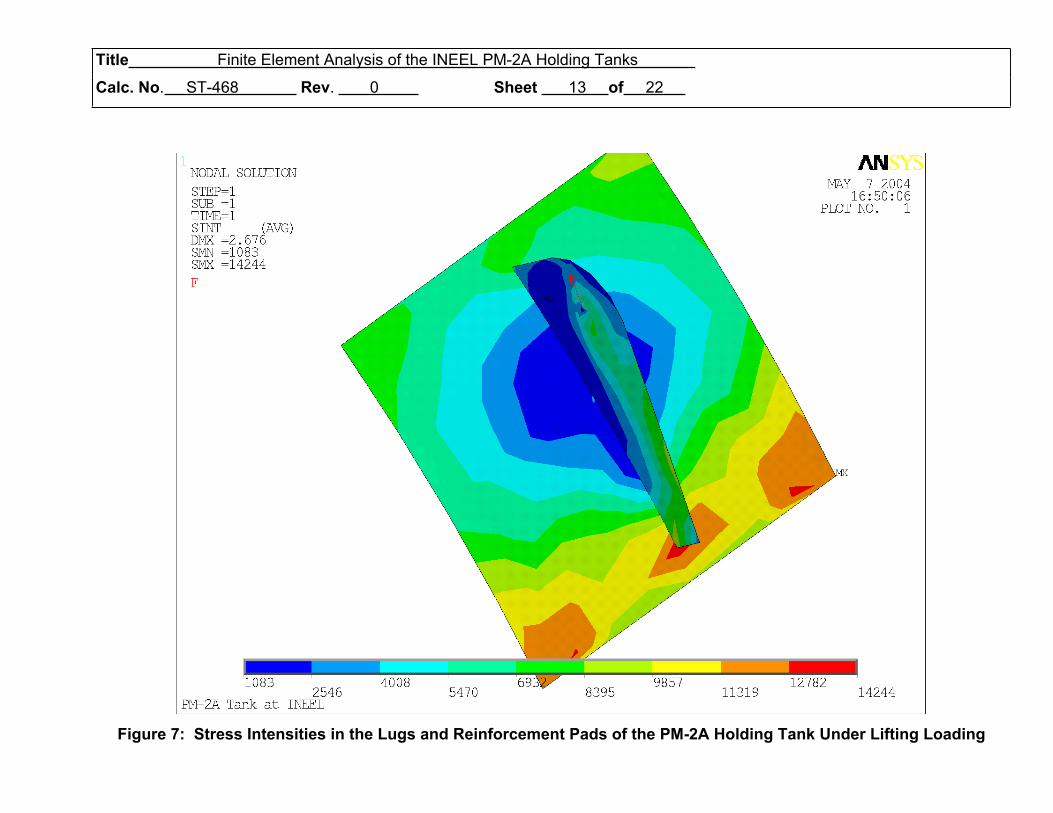
Figure 7 gives the maximum stress intensity (SMX) for the holding tank lift lug and the lug
mounting pad assembly for lift loading. SMX = 14,244 psi and it occurs at corner of the
mounting pad.
SMX = 14,244 psi < 27,000 psi O.K.
The lift lug local stresses are evaluated in Reference 6 document.
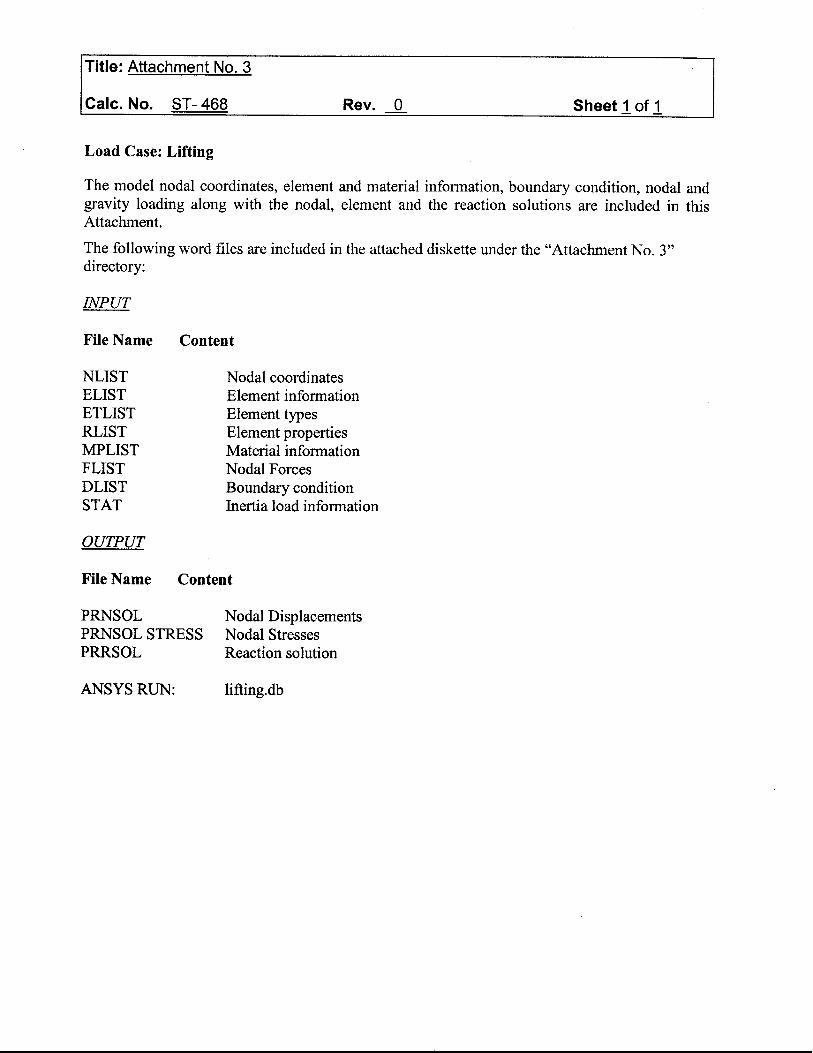
The model nodal coordinates, element and material information, boundary conditions, gravity
loading along with the nodal displacement, nodal and the reaction solutions are included in
Attachment - 3.
Title Finite Element Analysis of the INEEL PM-2A Holding Tanks .
Calc. No. ST-468 Rev. 0 Sheet 4 of 22 .
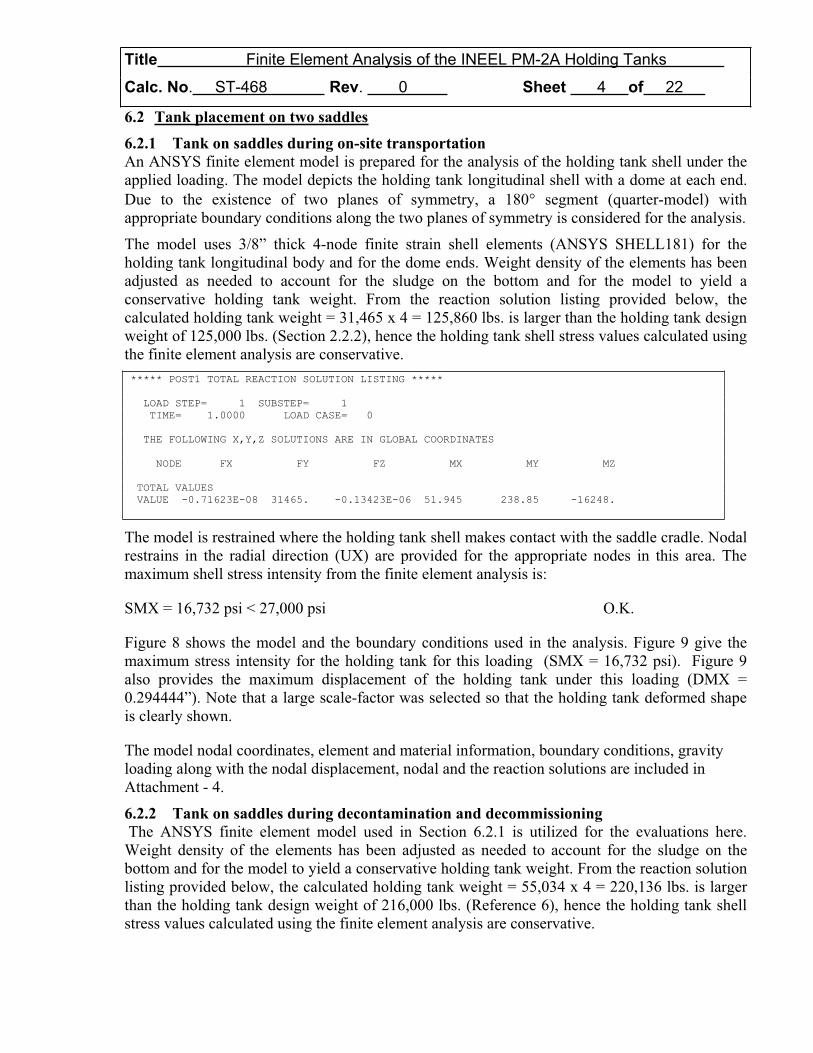
6.2 Tank placement on two saddles
6.2.1 Tank on saddles during on-site transportation
An ANSYS finite element model is prepared for the analysis of the holding tank shell under the
applied loading. The model depicts the holding tank longitudinal shell with a dome at each end.
Due to the existence of two planes of symmetry, a 180 segment (quarter-model) with
appropriate boundary conditions along the two planes of symmetry is considered for the analysis.
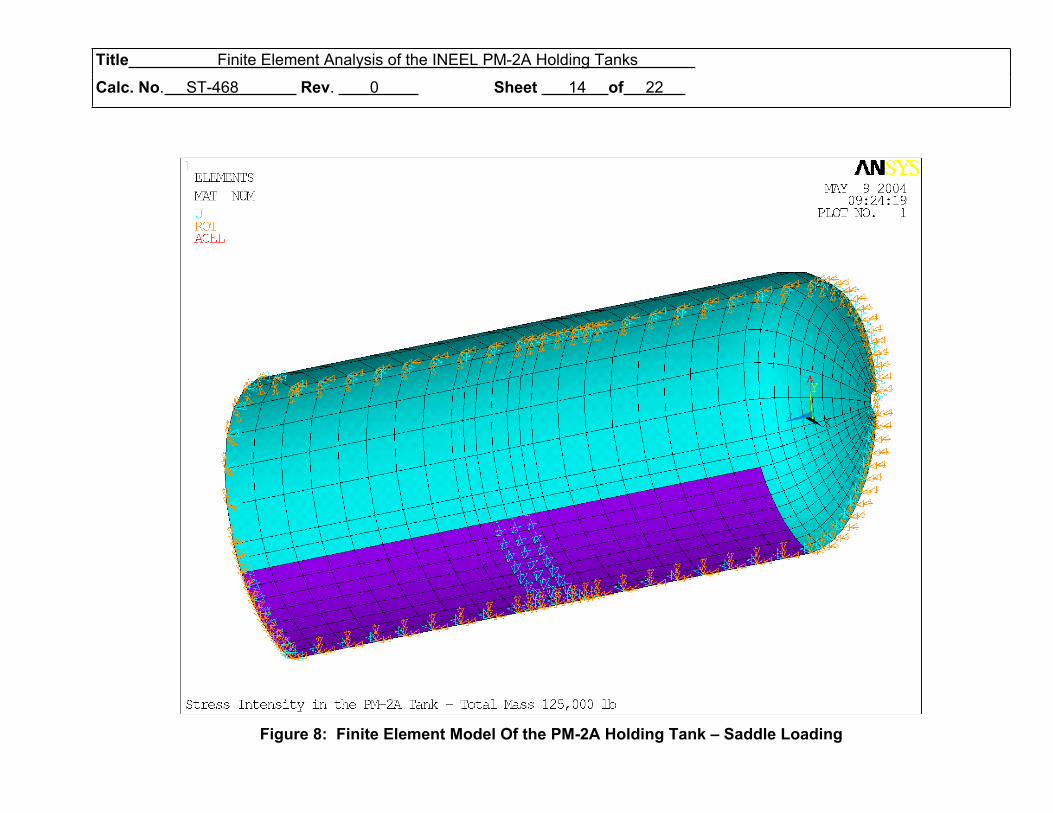
The model uses 3/8” thick 4-node finite strain shell elements (ANSYS SHELL181) for the
holding tank longitudinal body and for the dome ends. Weight density of the elements has been
adjusted as needed to account for the sludge on the bottom and for the model to yield a
conservative holding tank weight. From the reaction solution listing provided below, the
calculated holding tank weight = 31,465 x 4 = 125,860 lbs. is larger than the holding tank design
weight of 125,000 lbs. (Section 2.2.2), hence the holding tank shell stress values calculated using
the finite element analysis are conservative.
***** POST1 TOTAL REACTION SOLUTION LISTING *****
LOAD STEP= 1 SUBSTEP= 1
TIME= 1.0000 LOAD CASE= 0
THE FOLLOWING X,Y,Z SOLUTIONS ARE IN GLOBAL COORDINATES
NODE FX FY FZ MX MY MZ
TOTAL VALUES
VALUE -0.71623E-08 31465. -0.13423E-06 51.945 238.85 -16248.
The model is restrained where the holding tank shell makes contact with the saddle cradle. Nodal
restrains in the radial direction (UX) are provided for the appropriate nodes in this area. The
maximum shell stress intensity from the finite element analysis is:
SMX = 16,732 psi < 27,000 psi O.K.
Figure 8 shows the model and the boundary conditions used in the analysis. Figure 9 give the
maximum stress intensity for the holding tank for this loading (SMX = 16,732 psi). Figure 9
also provides the maximum displacement of the holding tank under this loading (DMX =
0.294444”). Note that a large scale-factor was selected so that the holding tank deformed shape
is clearly shown.
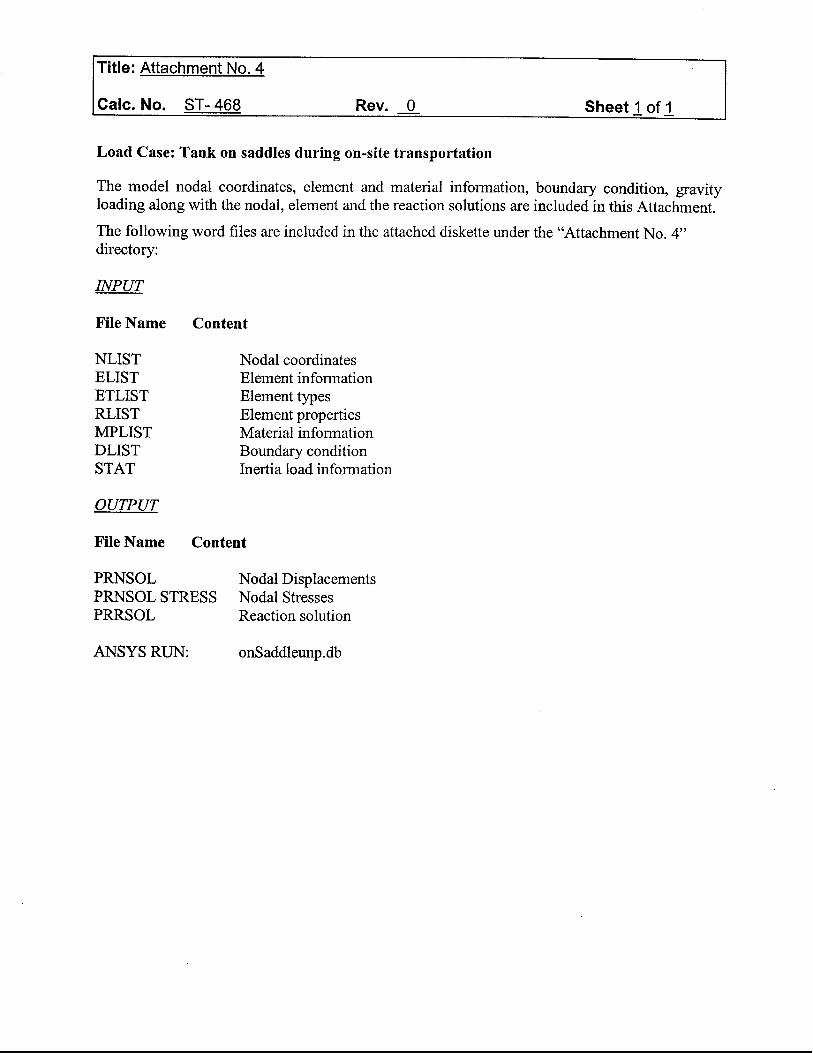
The model nodal coordinates, element and material information, boundary conditions, gravity
loading along with the nodal displacement, nodal and the reaction solutions are included in
Attachment - 4.
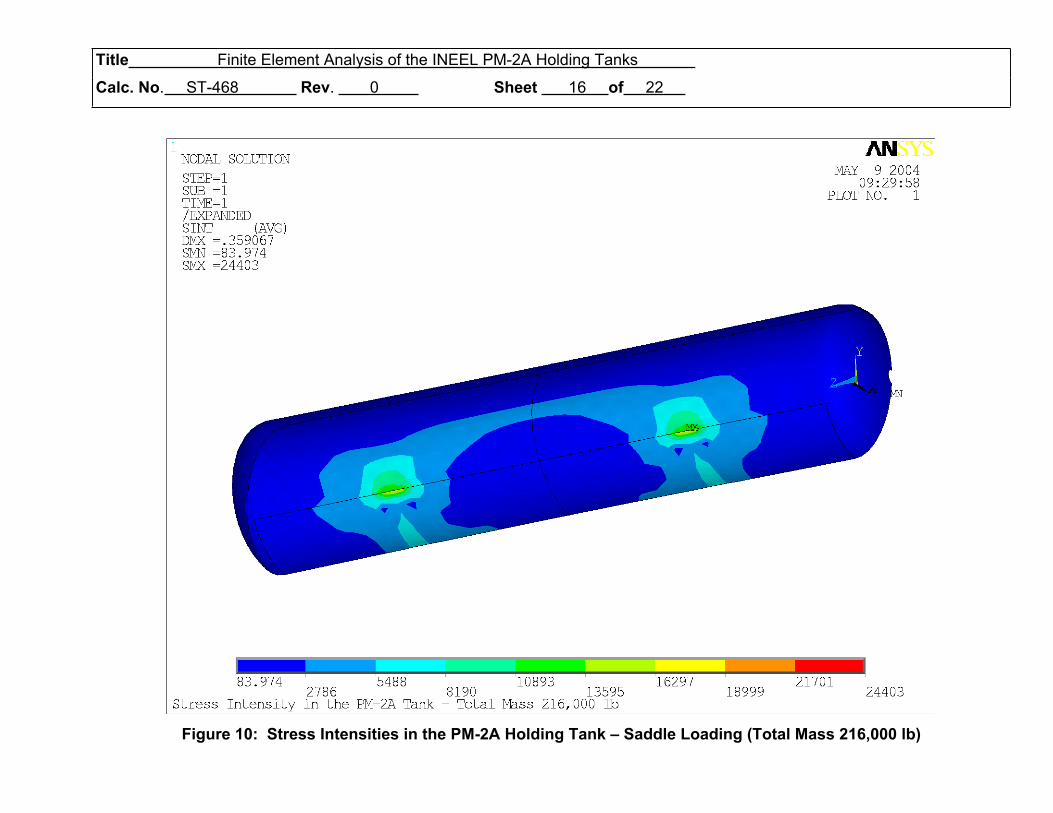
6.2.2 Tank on saddles during decontamination and decommissioning
The ANSYS finite element model used in Section 6.2.1 is utilized for the evaluations here.
Weight density of the elements has been adjusted as needed to account for the sludge on the
bottom and for the model to yield a conservative holding tank weight. From the reaction solution
listing provided below, the calculated holding tank weight = 55,034 x 4 = 220,136 lbs. is larger
than the holding tank design weight of 216,000 lbs. (Reference 6), hence the holding tank shell
stress values calculated using the finite element analysis are conservative.
Title Finite Element Analysis of the INEEL PM-2A Holding Tanks .
Calc. No. ST-468 Rev. 0 Sheet 5 of 22 .
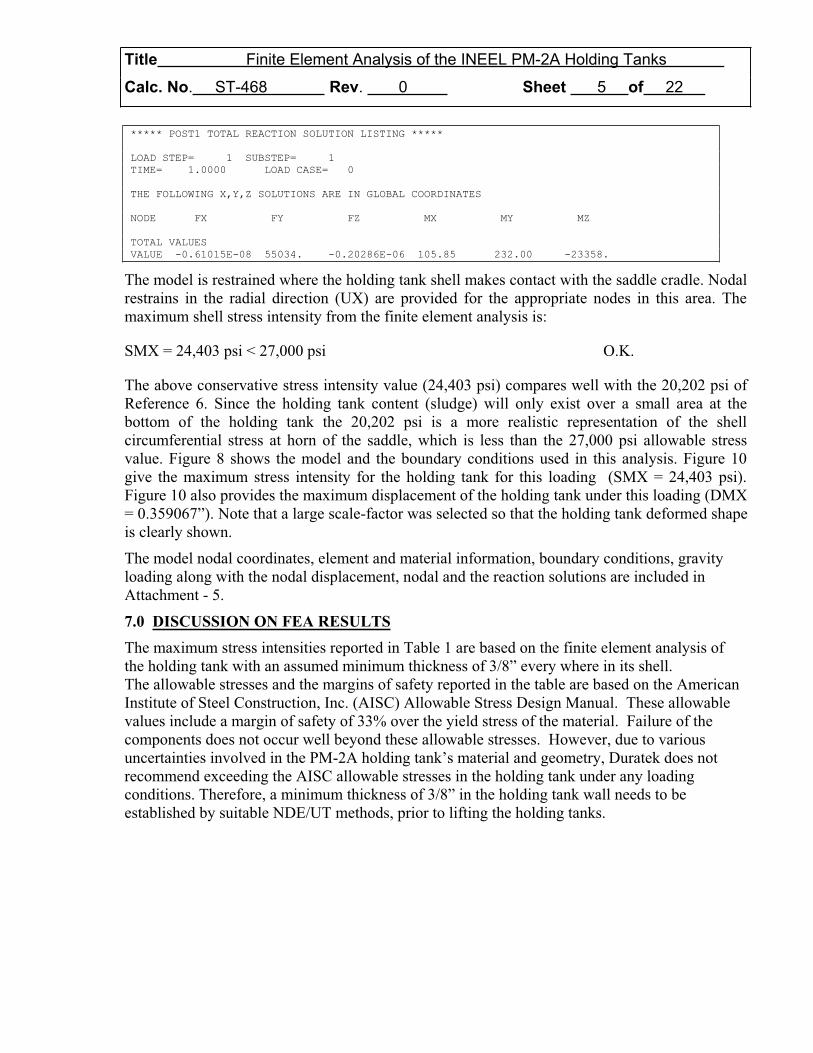
***** POST1 TOTAL REACTION SOLUTION LISTING *****
LOAD STEP= 1 SUBSTEP= 1
TIME= 1.0000 LOAD CASE= 0
THE FOLLOWING X,Y,Z SOLUTIONS ARE IN GLOBAL COORDINATES
NODE FX FY FZ MX MY MZ
TOTAL VALUES
VALUE -0.61015E-08 55034. -0.20286E-06 105.85 232.00 -23358.
The model is restrained where the holding tank shell makes contact with the saddle cradle. Nodal
restrains in the radial direction (UX) are provided for the appropriate nodes in this area. The
maximum shell stress intensity from the finite element analysis is:
SMX = 24,403 psi < 27,000 psi O.K.
The above conservative stress intensity value (24,403 psi) compares well with the 20,202 psi of
Reference 6. Since the holding tank content (sludge) will only exist over a small area at the
bottom of the holding tank the 20,202 psi is a more realistic representation of the shell
circumferential stress at horn of the saddle, which is less than the 27,000 psi allowable stress
value. Figure 8 shows the model and the boundary conditions used in this analysis. Figure 10
give the maximum stress intensity for the holding tank for this loading (SMX = 24,403 psi).
Figure 10 also provides the maximum displacement of the holding tank under this loading (DMX
= 0.359067”). Note that a large scale-factor was selected so that the holding tank deformed shape
is clearly shown.
The model nodal coordinates, element and material information, boundary conditions, gravity
loading along with the nodal displacement, nodal and the reaction solutions are included in
Attachment - 5.
7.0 DISCUSSION ON FEA RESULTS
The maximum stress intensities reported in Table 1 are based on the finite element analysis of
the holding tank with an assumed minimum thickness of 3/8” every where in its shell.
The allowable stresses and the margins of safety reported in the table are based on the American
Institute of Steel Construction, Inc. (AISC) Allowable Stress Design Manual. These allowable
values include a margin of safety of 33% over the yield stress of the material. Failure of the
components does not occur well beyond these allowable stresses. However, due to various
uncertainties involved in the PM-2A holding tank’s material and geometry, Duratek does not
recommend exceeding the AISC allowable stresses in the holding tank under any loading
conditions. Therefore, a minimum thickness of 3/8” in the holding tank wall needs to be
established by suitable NDE/UT methods, prior to lifting the holding tanks.
Title Finite Element Analysis of the INEEL PM-2A Holding Tanks .
Calc. No. ST-468 Rev. 0 Sheet 6 of 22 .
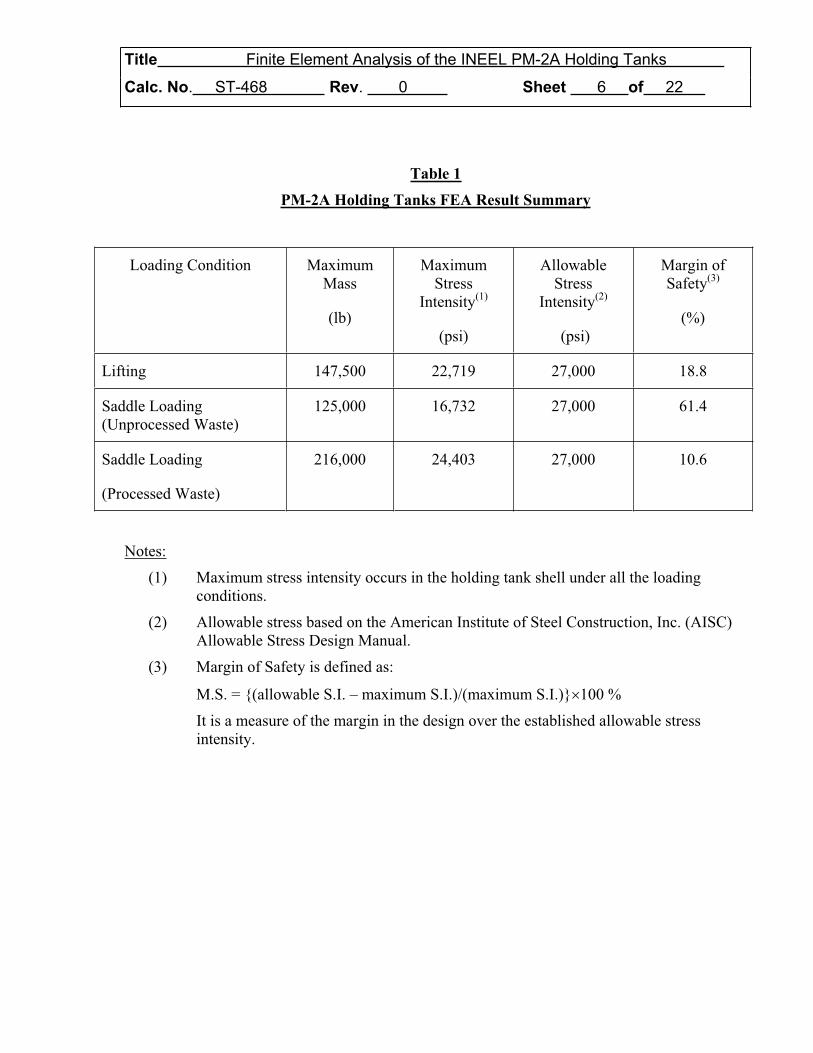
Table 1
PM-2A Holding Tanks FEA Result Summary
Loading Condition Maximum
Mass
(lb)
Maximum
Stress
Intensity(1)
(psi)
Allowable
Stress
Intensity(2)
(psi)
Margin of
Safety(3)
(%)
Lifting 147,500 22,719 27,000 18.8
Saddle Loading
(Unprocessed Waste)
125,000 16,732 27,000 61.4
Saddle Loading
(Processed Waste)
216,000 24,403 27,000 10.6
Notes:
(1) Maximum stress intensity occurs in the holding tank shell under all the loading
conditions.
(2) Allowable stress based on the American Institute of Steel Construction, Inc. (AISC)
Allowable Stress Design Manual.
(3) Margin of Safety is defined as:
M.S. = {(allowable S.I. – maximum S.I.)/(maximum S.I.)} 100 %
It is a measure of the margin in the design over the established allowable stress
intensity.
Title Finite Element Analysis of the INEEL PM-2A Holding Tanks .
Calc. No. ST-468 Rev. 0 Sheet 7 of 22 .
Figure 1: Location of the PM-2A Holding Tank Lifting Attachments

Title Finite Element Analysis of the INEEL PM-2A Holding Tanks .
Calc. No. ST-468 Rev. 0 Sheet 8 of 22 .
Figure 2: Arrangement of the PM-2A Holding Tank on Saddles
Title Finite Element Analysis of the INEEL PM-2A Holding Tanks .
Calc. No. ST-468 Rev. 0 Sheet 9 of 22 .
Figure 3: Finite Element Model of the PM-2A Holding Tank – Lifting
Title Finite Element Analysis of the INEEL PM-2A Holding Tanks .
Calc. No. ST-468 Rev. 0 Sheet 10 of 22 .
Figure 4: Finite Element Model of the PM-2A Holding Tank – Showing the Side View
Title Finite Element Analysis of the INEEL PM-2A Holding Tanks .
Calc. No. ST-468 Rev. 0 Sheet 11 of 22 .
Figure 5: Finite Element Model of the PM-2A Holding Tank – Showing the Lug and Pad Details
Title Finite Element Analysis of the INEEL PM-2A Holding Tanks .
Calc. No. ST-468 Rev. 0 Sheet 12 of 22 .
Figure 6: Stress Intensities in the PM-2A Holding Tank Under Lifting Loading
Title Finite Element Analysis of the INEEL PM-2A Holding Tanks .
Calc. No. ST-468 Rev. 0 Sheet 13 of 22 .
Figure 7: Stress Intensities in the Lugs and Reinforcement Pads of the PM-2A Holding Tank Under Lifting Loading
Title Finite Element Analysis of the INEEL PM-2A Holding Tanks .
Calc. No. ST-468 Rev. 0 Sheet 14 of 22 .
Figure 8: Finite Element Model Of the PM-2A Holding Tank – Saddle Loading

Title Finite Element Analysis of the INEEL PM-2A Holding Tanks .
Calc. No. ST-468 Rev. 0 Sheet 15 of 22 .
Figure 9: Stress Intensities in the PM-2A Holding Tank – Saddle Loading (Total Mass 125,000 lb)
Title Finite Element Analysis of the INEEL PM-2A Holding Tanks .
Calc. No. ST-468 Rev. 0 Sheet 16 of 22 .
Figure 10: Stress Intensities in the PM-2A Holding Tank – Saddle Loading (Total Mass 216,000 lb)
Title Finite Element Analysis of the INEEL PM-2A Holding Tanks .
Calc. No. ST-468 Rev. 0 Sheet 17 of 22 .
Figure 11: Lifting Details for a Typical PM-2A Holding Tank

Document ID:Revision ID:
Effective Date:
EDF-2606 112/02/04
Engineering Design File
PROJECT NO. 23095
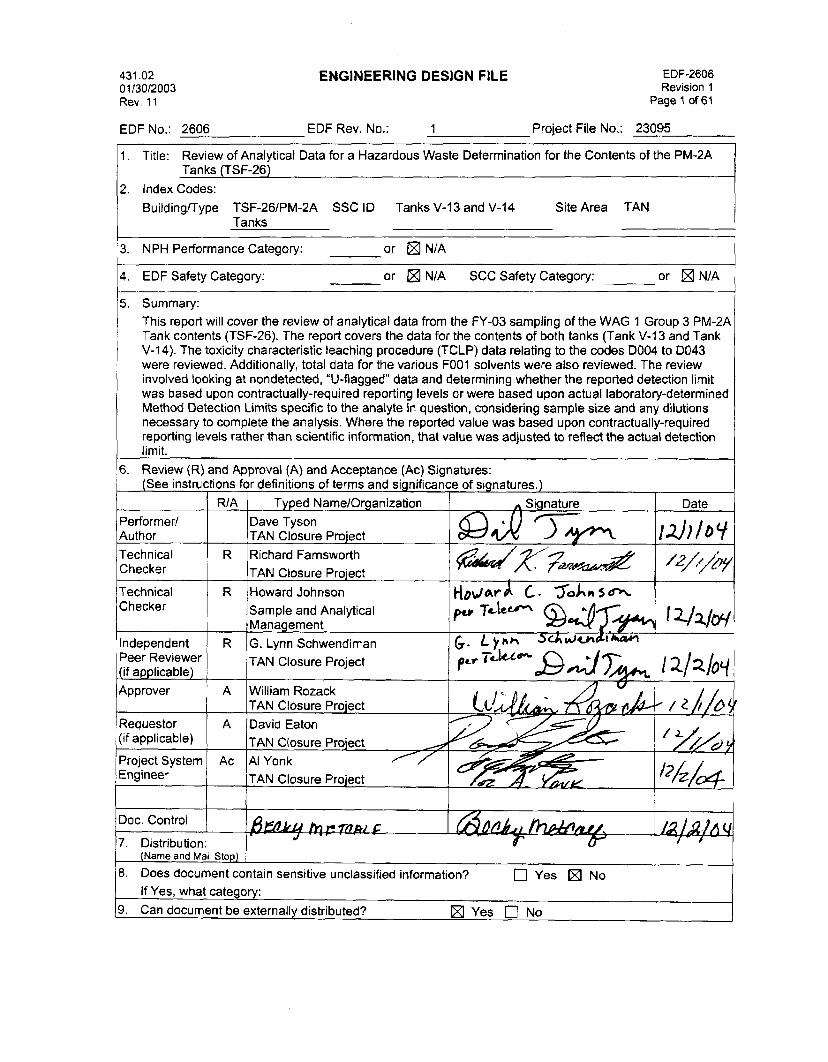
Review of Analytical Data for a Hazardous Waste Determination for the Contents of the PM-2A Tanks (TSF-26)
Form 412.14 10/9/2003 Rev. 05
431.02 01/30/2003 Rev. 11
ENGINEERING DESIGN FILE EDF-2606Revision 1
Page 2 of 61
EDF No.: 2606 EDF Rev. No.: 0 Project File No.: 23095
1. Title: Waste Generator Services Closure Report for the Contents of the PM-2A Tanks (TSF-26)
2. Index Codes:
Building/Type TSF-26/PM-2A Tanks
SSC ID Tanks V-13 and V-14 Site Area TAN
10. Uniform File Code: 0250; 6102 Disposition Authority: see LST-9
Record Retention Period: see LST-9
11. For QA Records Classification Only: Lifetime Nonpermanent Permanent
Item and activity to which the QA Record apply:
12. NRC related? Yes No
Registered Professional Engineer's Stamp (if required) 13.
431.02 01/30/2003 Rev. 11
ENGINEERING DESIGN FILE EDF-2606Revision 1
Page 3 of 61
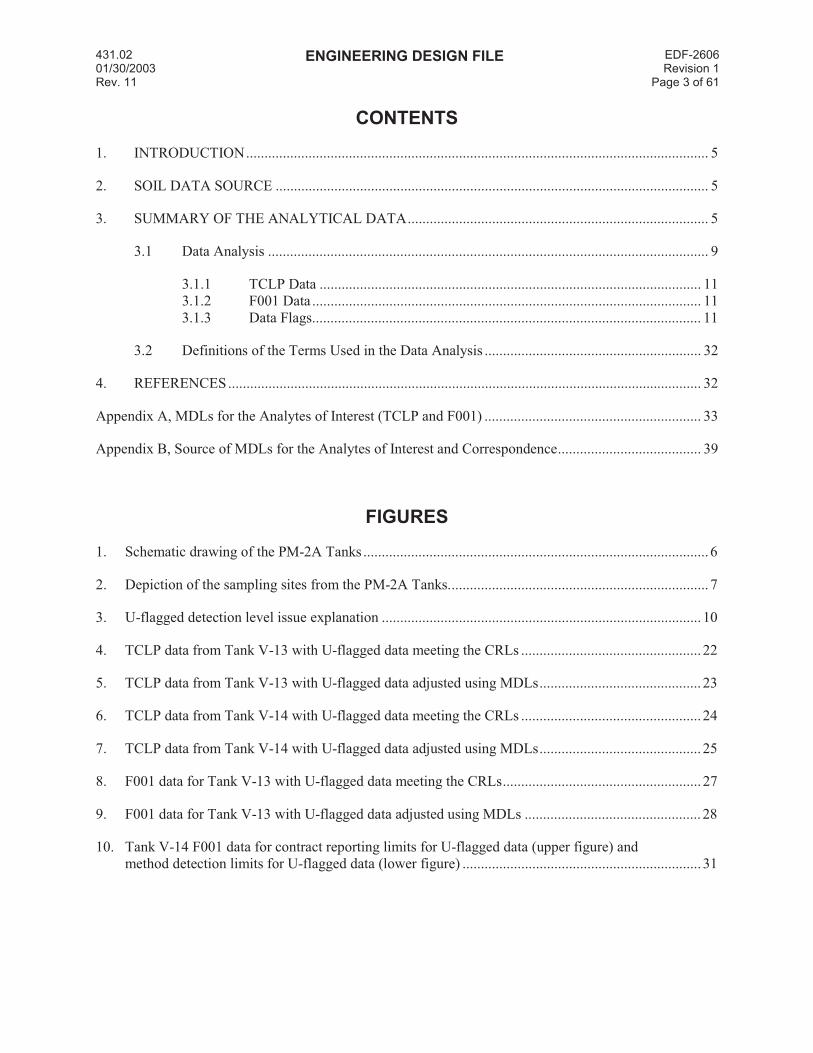
CONTENTS
1. INTRODUCTION.............................................................................................................................. 5
2. SOIL DATA SOURCE ...................................................................................................................... 5
3. SUMMARY OF THE ANALYTICAL DATA.................................................................................. 5
3.1 Data Analysis ........................................................................................................................ 9
3.1.1 TCLP Data ........................................................................................................ 11
3.1.2 F001 Data .......................................................................................................... 11
3.1.3 Data Flags.......................................................................................................... 11
3.2 Definitions of the Terms Used in the Data Analysis ........................................................... 32
4. REFERENCES................................................................................................................................. 32
Appendix A, MDLs for the Analytes of Interest (TCLP and F001) ........................................................... 33
Appendix B, Source of MDLs for the Analytes of Interest and Correspondence....................................... 39
FIGURES
1. Schematic drawing of the PM-2A Tanks .............................................................................................. 6
2. Depiction of the sampling sites from the PM-2A Tanks....................................................................... 7
3. U-flagged detection level issue explanation ....................................................................................... 10
4. TCLP data from Tank V-13 with U-flagged data meeting the CRLs ................................................. 22
5. TCLP data from Tank V-13 with U-flagged data adjusted using MDLs............................................ 23
6. TCLP data from Tank V-14 with U-flagged data meeting the CRLs ................................................. 24
7. TCLP data from Tank V-14 with U-flagged data adjusted using MDLs............................................ 25
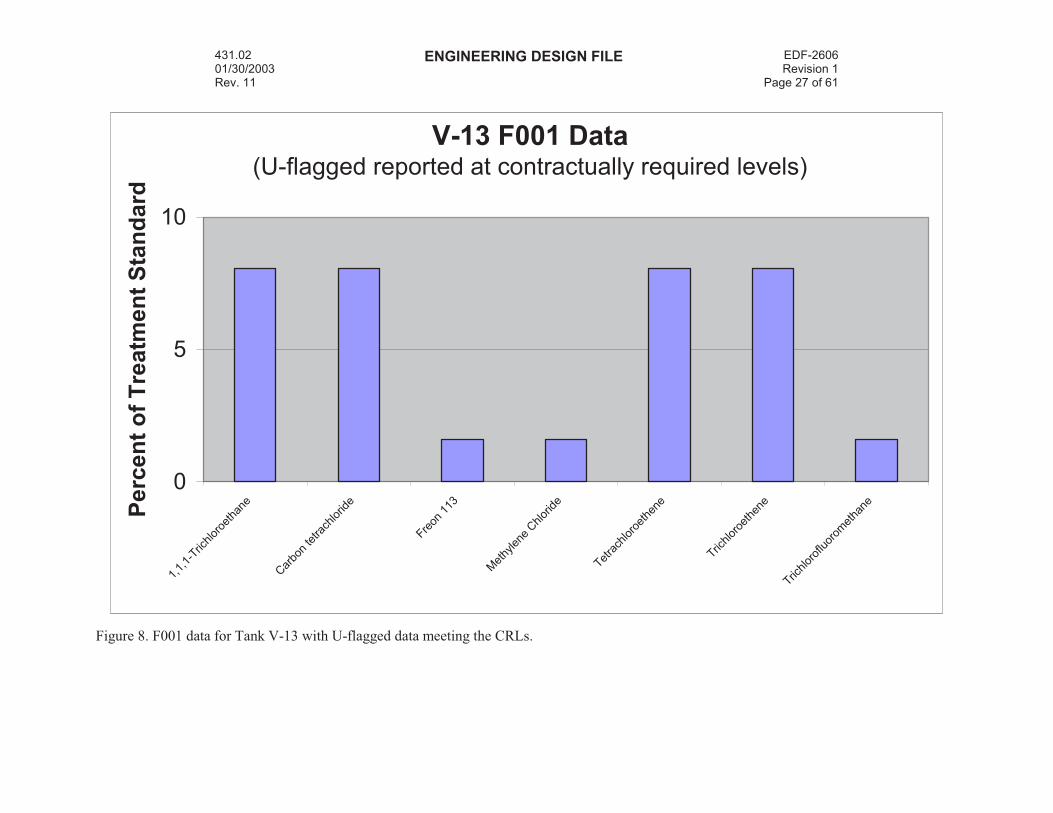
8. F001 data for Tank V-13 with U-flagged data meeting the CRLs...................................................... 27
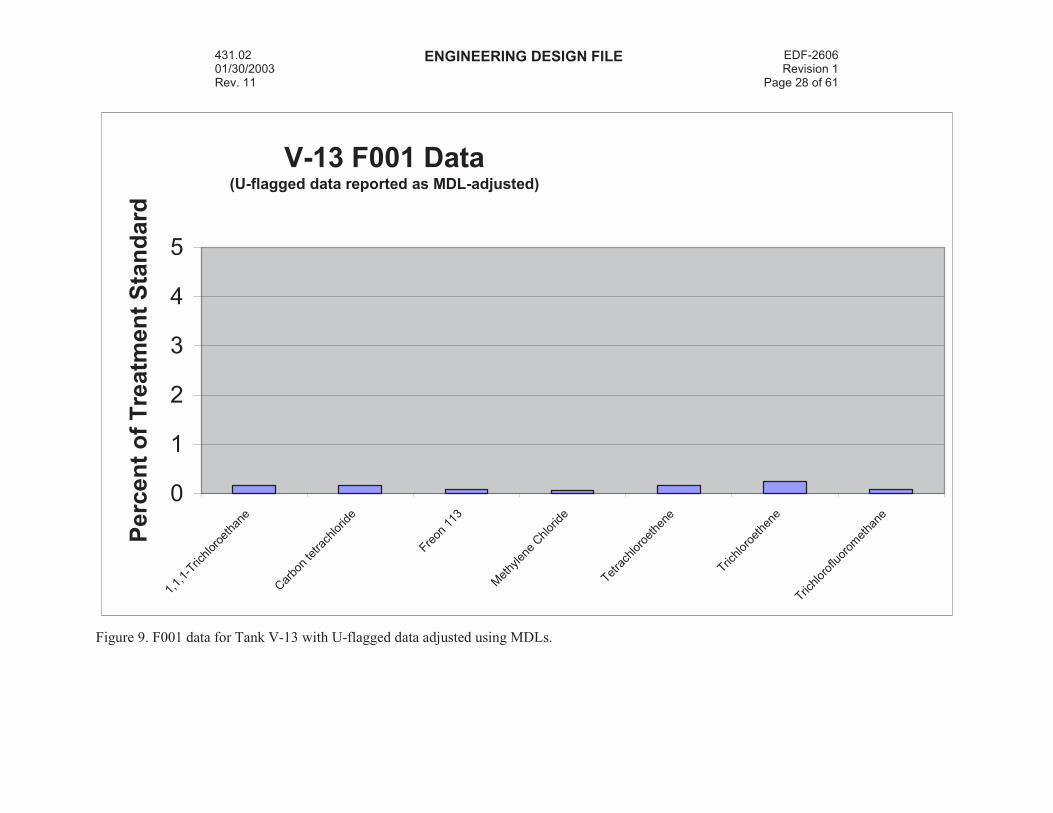
9. F001 data for Tank V-13 with U-flagged data adjusted using MDLs ................................................ 28
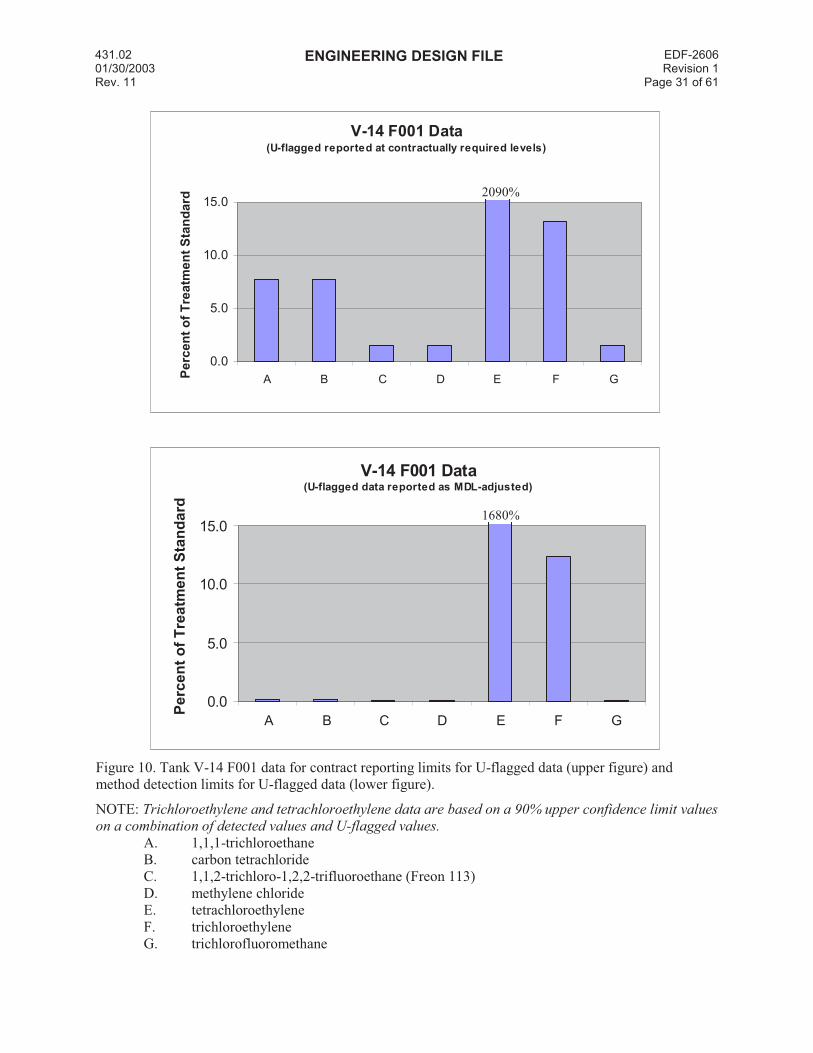
10. Tank V-14 F001 data for contract reporting limits for U-flagged data (upper figure) and
method detection limits for U-flagged data (lower figure) ................................................................. 31
431.02 01/30/2003 Rev. 11
ENGINEERING DESIGN FILE EDF-2606Revision 1
Page 4 of 61
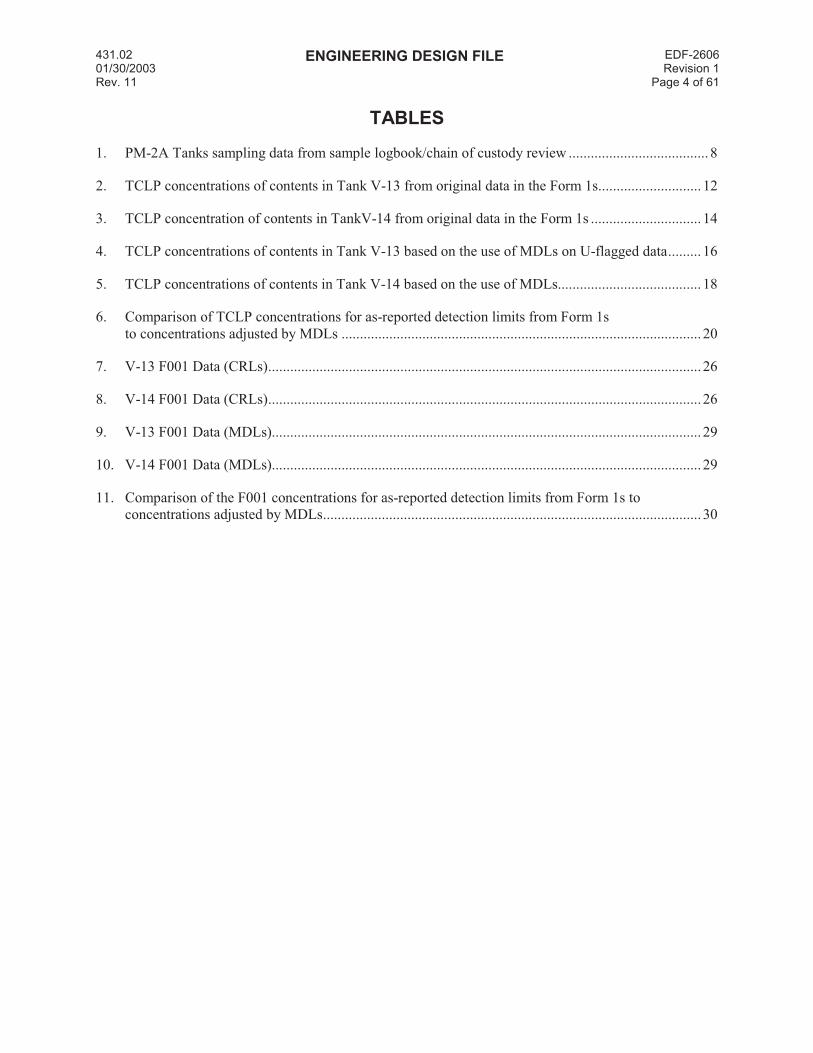
TABLES
1. PM-2A Tanks sampling data from sample logbook/chain of custody review ...................................... 8
2. TCLP concentrations of contents in Tank V-13 from original data in the Form 1s............................ 12
3. TCLP concentration of contents in TankV-14 from original data in the Form 1s .............................. 14
4. TCLP concentrations of contents in Tank V-13 based on the use of MDLs on U-flagged data......... 16
5. TCLP concentrations of contents in Tank V-14 based on the use of MDLs....................................... 18
6. Comparison of TCLP concentrations for as-reported detection limits from Form 1s
to concentrations adjusted by MDLs .................................................................................................. 20
7. V-13 F001 Data (CRLs)...................................................................................................................... 26
8. V-14 F001 Data (CRLs)...................................................................................................................... 26
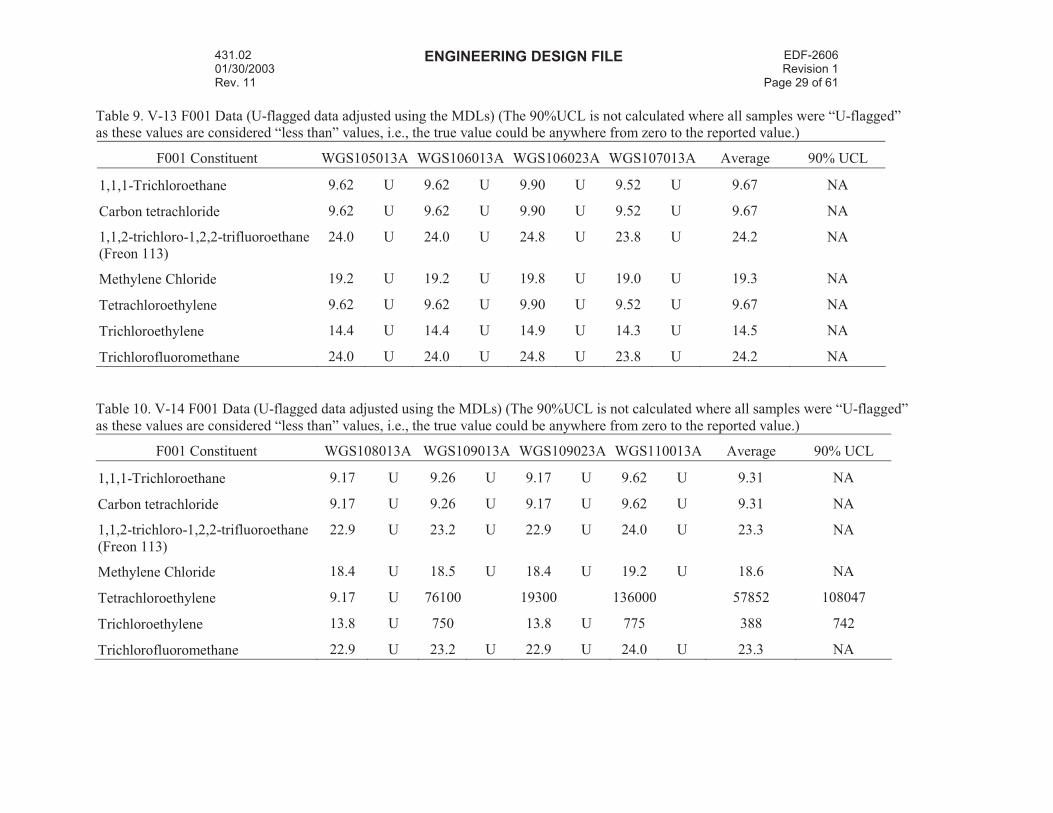
9. V-13 F001 Data (MDLs)..................................................................................................................... 29
10. V-14 F001 Data (MDLs)..................................................................................................................... 29
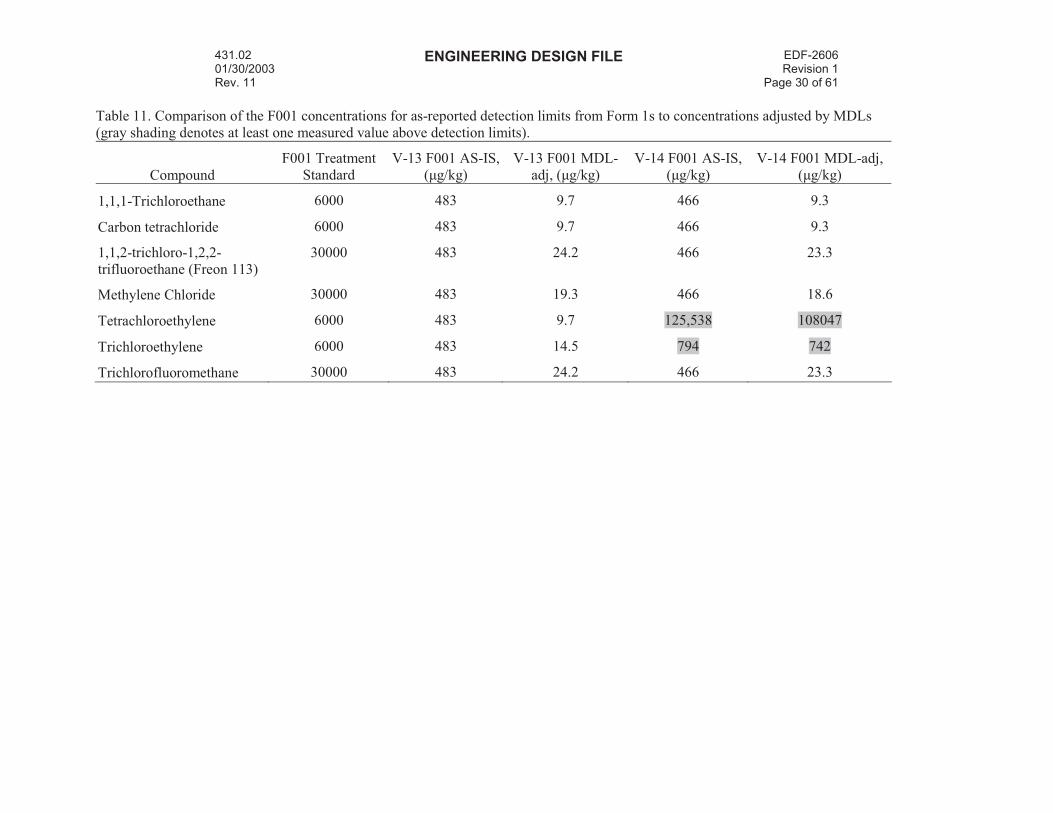
11. Comparison of the F001 concentrations for as-reported detection limits from Form 1s to
concentrations adjusted by MDLs....................................................................................................... 30
431.02 01/30/2003 Rev. 11
ENGINEERING DESIGN FILE EDF-2606Revision 1
Page 5 of 61
Review of Analytical Data for a Hazardous Waste Determination for the Contents of the
PM-2A Tanks (TSF-26)
1. INTRODUCTION
This report will cover the review of data used for characterization of the Waste Area Group
(WAG) 1 Group 3 PM-2A Tanks (TSF-26) contents. A field sampling plan (FSP) detailed the sampling
that occurred during FY-03 (INEEL 2003). The data obtained from that sampling campaign was
summarized for the contents of both tanks (Tank V-13 and Tank V-14) in an Engineering Design File
(EDF) that was used by Waste Generator Service (WGS) organization (Tyson 2004). This report will
expand upon that EDF to examine the toxicity characteristic leaching procedure (TCLP) data related to
the codes D004 to D043. Additionally, total data for the various F001 solvents will also be presented
for comparison with F001 treatment standards. The review of this data is targeted at the nondetected,
“U-flagged” data.
This report will cover the review of analytical data from the FY-03 sampling of the WAG 1
Group 3 PM-2A Tank contents (TSF-26). The report covers the data for the contents of both tanks
(Tank V-13 and Tank V-14). The TCLP data relating to the codes D004 to D043 were reviewed.
Additionally, total data for the various F001 solvents were also reviewed. The review involved looking
at nondetected, “U-flagged” data and determining whether the reported detection limit was based upon
contractually-required reporting levels or were based upon actual laboratory-determined Method
Detection Limits (MDLs) specific to the analyte in question, considering sample size and any dilutions
necessary to complete the analysis. Where the reported value for “U-flagged” data was based upon
contractually-required reporting levels, that value was replaced with an estimate of the maximum value
that would have been labeled with a “U-flag” (i.e. not detected). These new values are based upon
laboratory-specific Method Detection Limits taking into consideration adjustments for variations in
sample mass, concentration volume, and dilutions. The revised values more adequately depict the upper
limits of concentrations that these “U-flagged” data could exhibit. Previous reports (Wells 2004,
Farnsworth 2004) have used MDLs to re-evaluate the magnitude of nondetect data to aid in making waste
determinations. This EDF will use a similar approach for representing the nondetect values.
2. SOIL DATA SOURCE
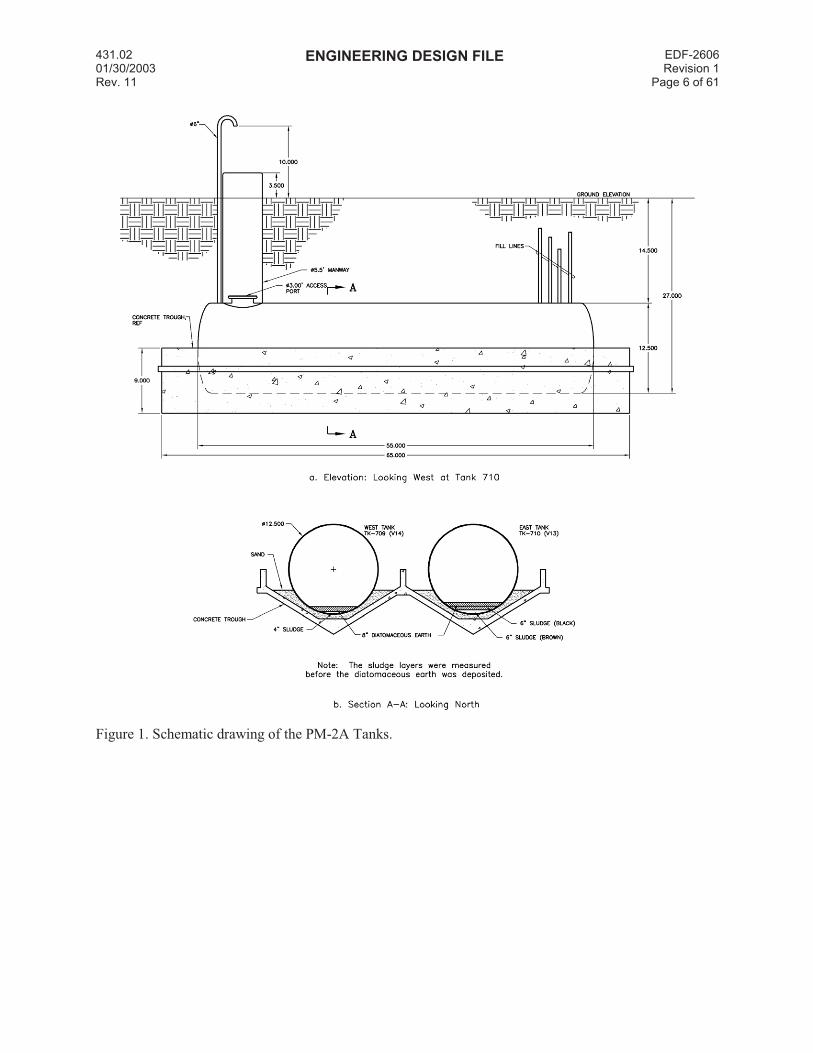
During the FY-03 CERCLA fielding sampling campaign, contents from both of the PM-2A Tanks
were sampled (Tanks V-13 and V-14, see Figure 1). Four composite samples were removed from each of
the tanks. The locations of the sampling sites are provided in Figure 2. Table 1 provides the samplers’
notes of the sampling activity.
3. SUMMARY OF THE ANALYTICAL DATA
The analytical results for the PM-2A Tanks contents are summarized in an EDF (Tyson 2004).
Limitations and validation (L&V) reports were obtained for the various analysis groups (volatile organics,
metals, etc.). That EDF provides the references to these L&V reports.
As was previously mentioned, four composite samples were taken from each tank.
431.02 01/30/2003 Rev. 11
ENGINEERING DESIGN FILE EDF-2606Revision 1
Page 6 of 61
Figure 1. Schematic drawing of the PM-2A Tanks.
431.02 01/30/2003 Rev. 11
ENGINEERING DESIGN FILE EDF-2606Revision 1
Page 7 of 61
Manway end of tank
1
2
******3*****(starts at 4.4 to 6.6 ft)
4
5
6
7
8
9
10
11
12
******13******(from 26.4 to 28.8 ft)
14
15
16
17
18
19
20
21
22
******23******(from 48.8 to 51 ft)
24
25
Inlet end of tank
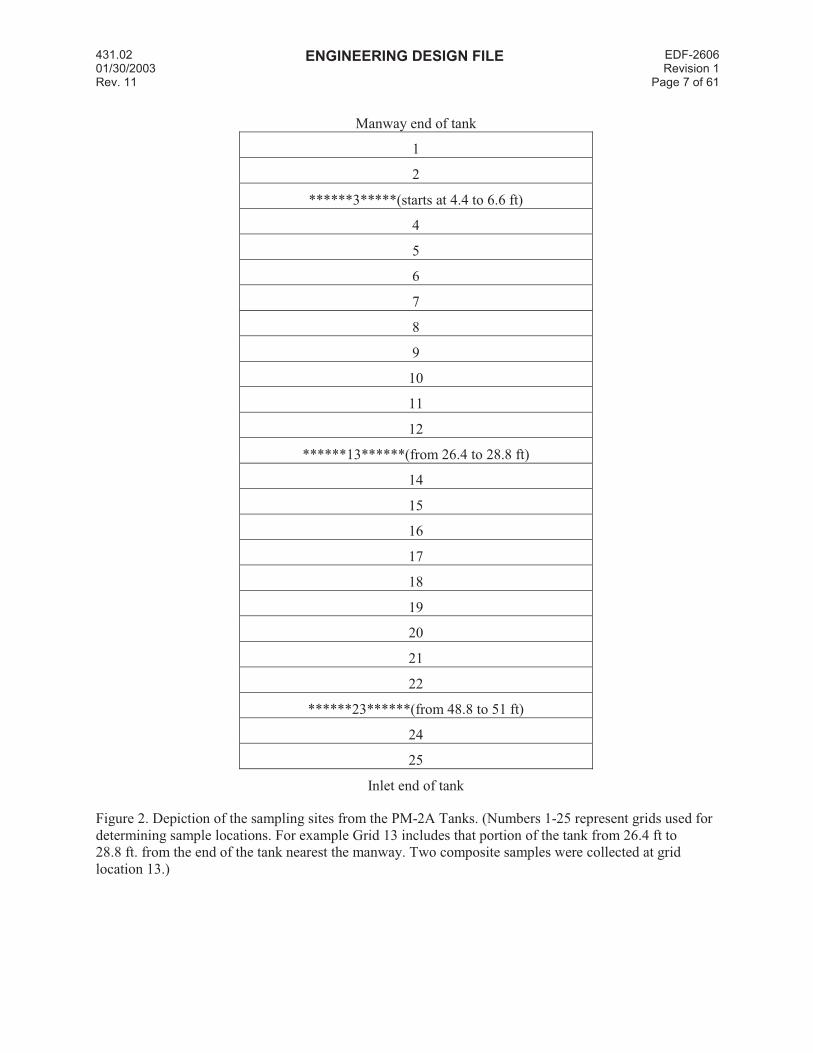
Figure 2. Depiction of the sampling sites from the PM-2A Tanks. (Numbers 1-25 represent grids used for
determining sample locations. For example Grid 13 includes that portion of the tank from 26.4 ft to
28.8 ft. from the end of the tank nearest the manway. Two composite samples were collected at grid
location 13.)
431.02 01/30/2003 Rev. 11
ENGINEERING DESIGN FILE EDF-2606Revision 1
Page 8 of 61
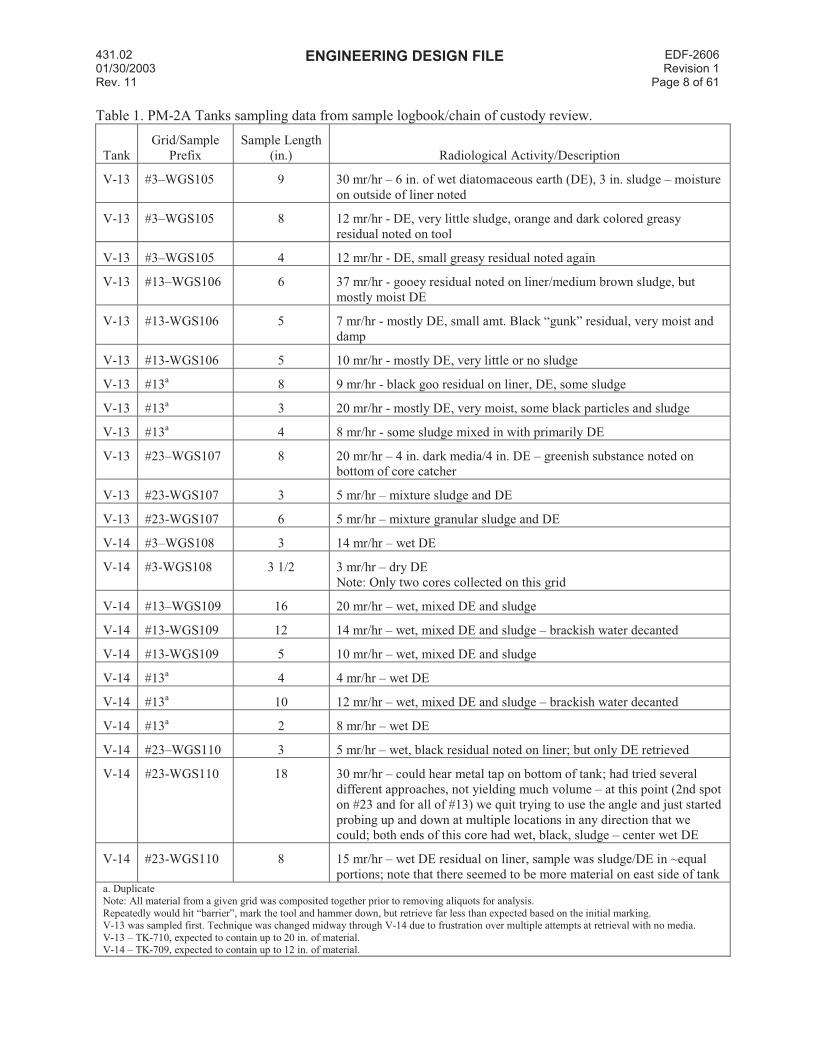
Table 1. PM-2A Tanks sampling data from sample logbook/chain of custody review.
Tank
Grid/Sample
Prefix
Sample Length
(in.) Radiological Activity/Description
V-13 #3–WGS105 9 30 mr/hr – 6 in. of wet diatomaceous earth (DE), 3 in. sludge – moisture
on outside of liner noted
V-13 #3–WGS105 8 12 mr/hr - DE, very little sludge, orange and dark colored greasy
residual noted on tool
V-13 #3–WGS105 4 12 mr/hr - DE, small greasy residual noted again
V-13 #13–WGS106 6 37 mr/hr - gooey residual noted on liner/medium brown sludge, but
mostly moist DE
V-13 #13-WGS106 5 7 mr/hr - mostly DE, small amt. Black “gunk” residual, very moist and
damp
V-13 #13-WGS106 5 10 mr/hr - mostly DE, very little or no sludge
V-13 #13a 8 9 mr/hr - black goo residual on liner, DE, some sludge
V-13 #13a 3 20 mr/hr - mostly DE, very moist, some black particles and sludge
V-13 #13a 4 8 mr/hr - some sludge mixed in with primarily DE
V-13 #23–WGS107 8 20 mr/hr – 4 in. dark media/4 in. DE – greenish substance noted on
bottom of core catcher
V-13 #23-WGS107 3 5 mr/hr – mixture sludge and DE
V-13 #23-WGS107 6 5 mr/hr – mixture granular sludge and DE
V-14 #3–WGS108 3 14 mr/hr – wet DE
V-14 #3-WGS108 3 1/2 3 mr/hr – dry DE
Note: Only two cores collected on this grid
V-14 #13–WGS109 16 20 mr/hr – wet, mixed DE and sludge
V-14 #13-WGS109 12 14 mr/hr – wet, mixed DE and sludge – brackish water decanted
V-14 #13-WGS109 5 10 mr/hr – wet, mixed DE and sludge
V-14 #13a 4 4 mr/hr – wet DE
V-14 #13a 10 12 mr/hr – wet, mixed DE and sludge – brackish water decanted
V-14 #13a 2 8 mr/hr – wet DE
V-14 #23–WGS110 3 5 mr/hr – wet, black residual noted on liner; but only DE retrieved
V-14 #23-WGS110 18 30 mr/hr – could hear metal tap on bottom of tank; had tried several
different approaches, not yielding much volume – at this point (2nd spot
on #23 and for all of #13) we quit trying to use the angle and just started
probing up and down at multiple locations in any direction that we
could; both ends of this core had wet, black, sludge – center wet DE
V-14 #23-WGS110 8 15 mr/hr – wet DE residual on liner, sample was sludge/DE in ~equal
portions; note that there seemed to be more material on east side of tank a. Duplicate
Note: All material from a given grid was composited together prior to removing aliquots for analysis.
Repeatedly would hit “barrier”, mark the tool and hammer down, but retrieve far less than expected based on the initial marking.V-13 was sampled first. Technique was changed midway through V-14 due to frustration over multiple attempts at retrieval with no media.
V-13 – TK-710, expected to contain up to 20 in. of material. V-14 – TK-709, expected to contain up to 12 in. of material.
431.02 01/30/2003 Rev. 11
ENGINEERING DESIGN FILE EDF-2606Revision 1
Page 9 of 61
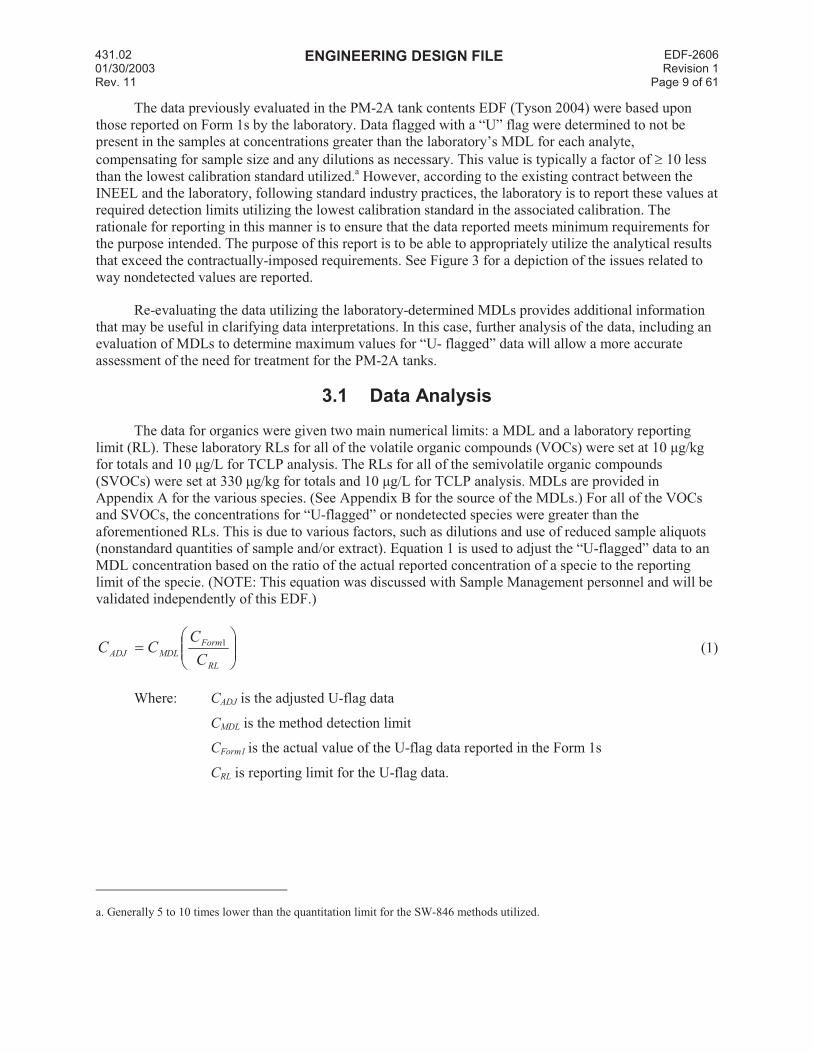
The data previously evaluated in the PM-2A tank contents EDF (Tyson 2004) were based upon
those reported on Form 1s by the laboratory. Data flagged with a “U” flag were determined to not be
present in the samples at concentrations greater than the laboratory’s MDL for each analyte,
compensating for sample size and any dilutions as necessary. This value is typically a factor of 10 less
than the lowest calibration standard utilized.a However, according to the existing contract between the
INEEL and the laboratory, following standard industry practices, the laboratory is to report these values at
required detection limits utilizing the lowest calibration standard in the associated calibration. The
rationale for reporting in this manner is to ensure that the data reported meets minimum requirements for
the purpose intended. The purpose of this report is to be able to appropriately utilize the analytical results
that exceed the contractually-imposed requirements. See Figure 3 for a depiction of the issues related to
way nondetected values are reported.
Re-evaluating the data utilizing the laboratory-determined MDLs provides additional information
that may be useful in clarifying data interpretations. In this case, further analysis of the data, including an
evaluation of MDLs to determine maximum values for “U- flagged” data will allow a more accurate
assessment of the need for treatment for the PM-2A tanks.
3.1 Data Analysis
The data for organics were given two main numerical limits: a MDL and a laboratory reporting
limit (RL). These laboratory RLs for all of the volatile organic compounds (VOCs) were set at 10 µg/kg
for totals and 10 µg/L for TCLP analysis. The RLs for all of the semivolatile organic compounds
(SVOCs) were set at 330 µg/kg for totals and 10 µg/L for TCLP analysis. MDLs are provided in
Appendix A for the various species. (See Appendix B for the source of the MDLs.) For all of the VOCs
and SVOCs, the concentrations for “U-flagged” or nondetected species were greater than the
aforementioned RLs. This is due to various factors, such as dilutions and use of reduced sample aliquots
(nonstandard quantities of sample and/or extract). Equation 1 is used to adjust the “U-flagged” data to an
MDL concentration based on the ratio of the actual reported concentration of a specie to the reporting
limit of the specie. (NOTE: This equation was discussed with Sample Management personnel and will be
validated independently of this EDF.)
RL
Form
MDLADJC
CCC 1
(1)
Where: CADJ is the adjusted U-flag data
CMDL is the method detection limit
CForm1 is the actual value of the U-flag data reported in the Form 1s
CRL is reporting limit for the U-flag data.
a. Generally 5 to 10 times lower than the quantitation limit for the SW-846 methods utilized.
431.02 01/30/2003 Rev. 11
ENGINEERING DESIGN FILE EDF-2606Revision 1
Page 10 of 61
Below Detection Level Estimated Values Calibrated Range Above Calibration Range
MDL RQL
0 1 10100 1000
Below Detection Level Estimated Values Calibrated Range Above Calibration Range
MDL RQL
0 1 10100 1000
Below Detection Level Estimated Values Calibrated Range Above Calibration Range
MDL RQL
0 1 10100 1000
Below Detection Level Estimated Values Calibrated Range Above Calibration Range
MDL RQL
0 1 10100 1000
Below Detection Level Estimated Values Calibrated Range Above Calibration Range
MDL RQL
0 1 10100 1000
Below Detection Level Estimated Values Calibrated Range Above Calibration Range
MDL RQL
0 1 10100 1000
Actual Value Less Than
Method Detection Level
(data lost in noise)
Estimated Values Calibrated Range Above Calibration Range
MDL RQL
0 1 10100 1000
Too concentrated,
requires dilution
and re-analysis
Valid readings
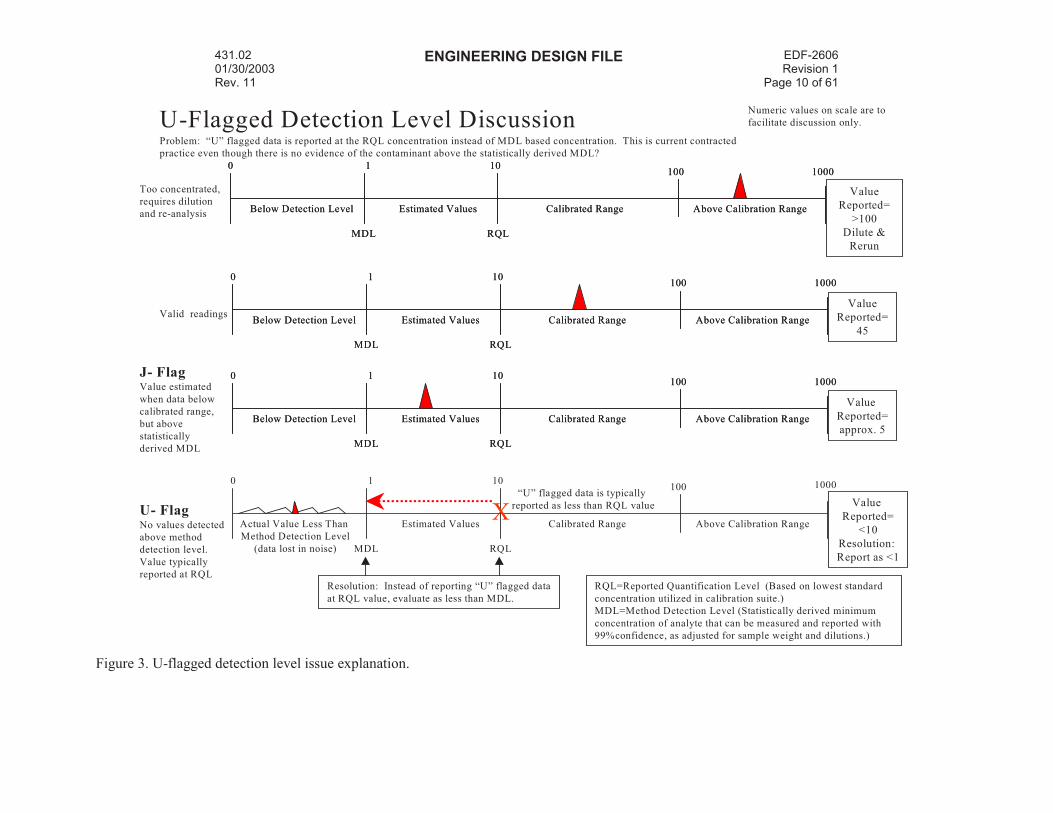
J- FlagValue estimated
when data below
calibrated range,
but above
statistically
derived MDL
U- FlagNo values detected
above method
detection level.
Value typically
reported at RQL
X“U” flagged data is typically
reported as less than RQL value
Numeric values on scale are to
facilitate discussion only.
Value
Reported=
>100
Dilute &
Rerun
Value
Reported=
45
Value
Reported=
approx. 5
Value
Reported=
<10
Resolution:
Report as <1
Resolution: Instead of reporting “U” flagged data
at RQL value, evaluate as less than MDL.
U-Flagged Detection Level Discussion
RQL=Reported Quantification Level (Based on lowest standard
concentration utilized in calibration suite.)
MDL=Method Detection Level (Statistically derived minimum
concentration of analyte that can be measured and reported with
99%confidence, as adjusted for sample weight and dilutions.)
Problem: “U” flagged data is reported at the RQL concentration instead of MDL based concentration. This is current contracted
practice even though there is no evidence of the contaminant above the statistically derived MDL?
Figure 3. U-flagged detection level issue explanation.
431.02 01/30/2003 Rev. 11
ENGINEERING DESIGN FILE EDF-2606Revision 1
Page 11 of 61
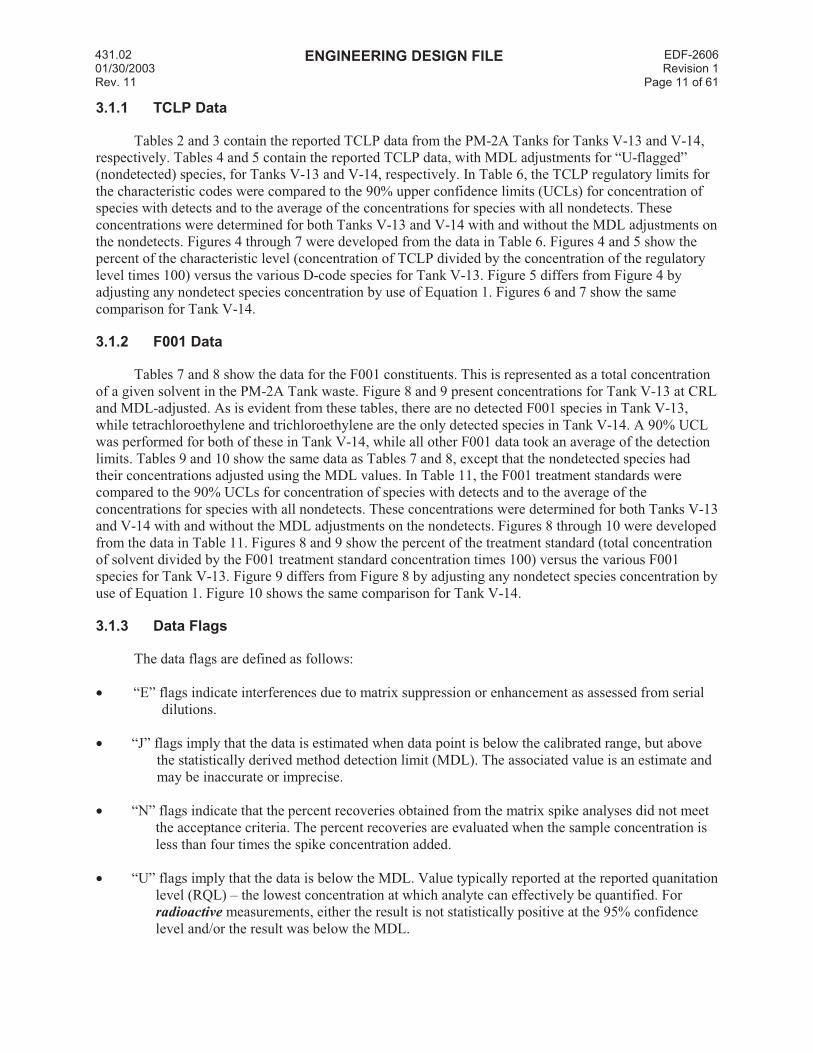
3.1.1 TCLP Data
Tables 2 and 3 contain the reported TCLP data from the PM-2A Tanks for Tanks V-13 and V-14,
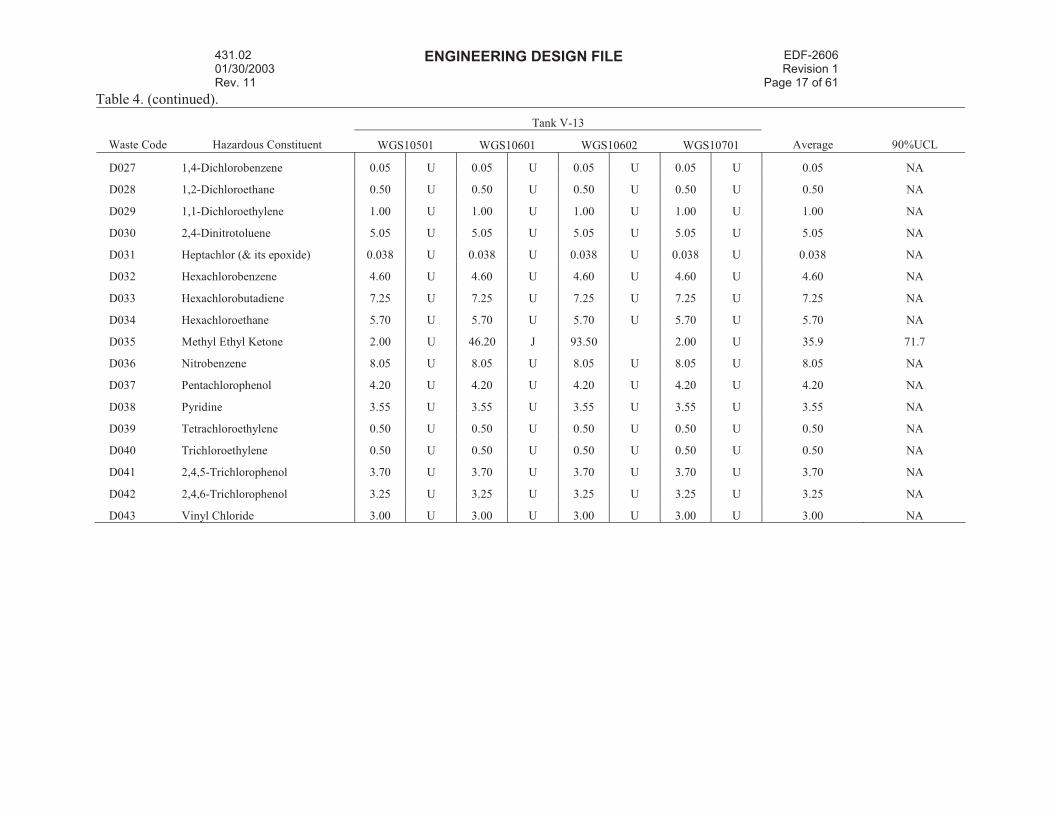
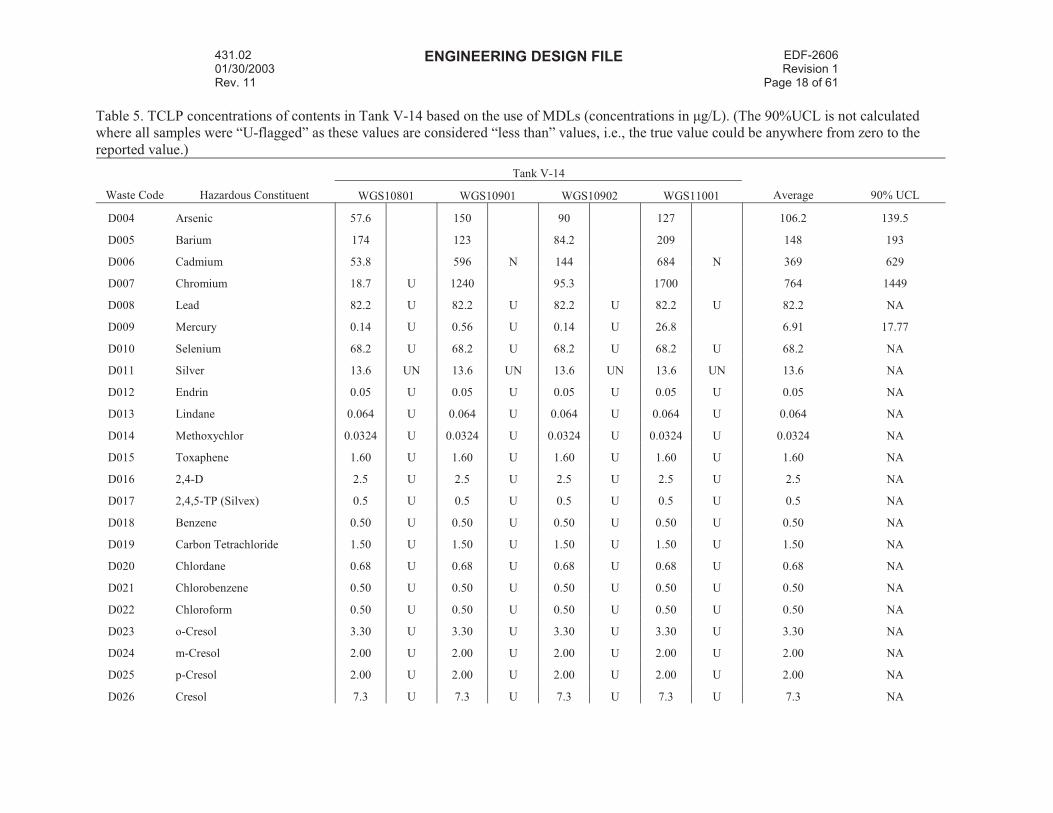
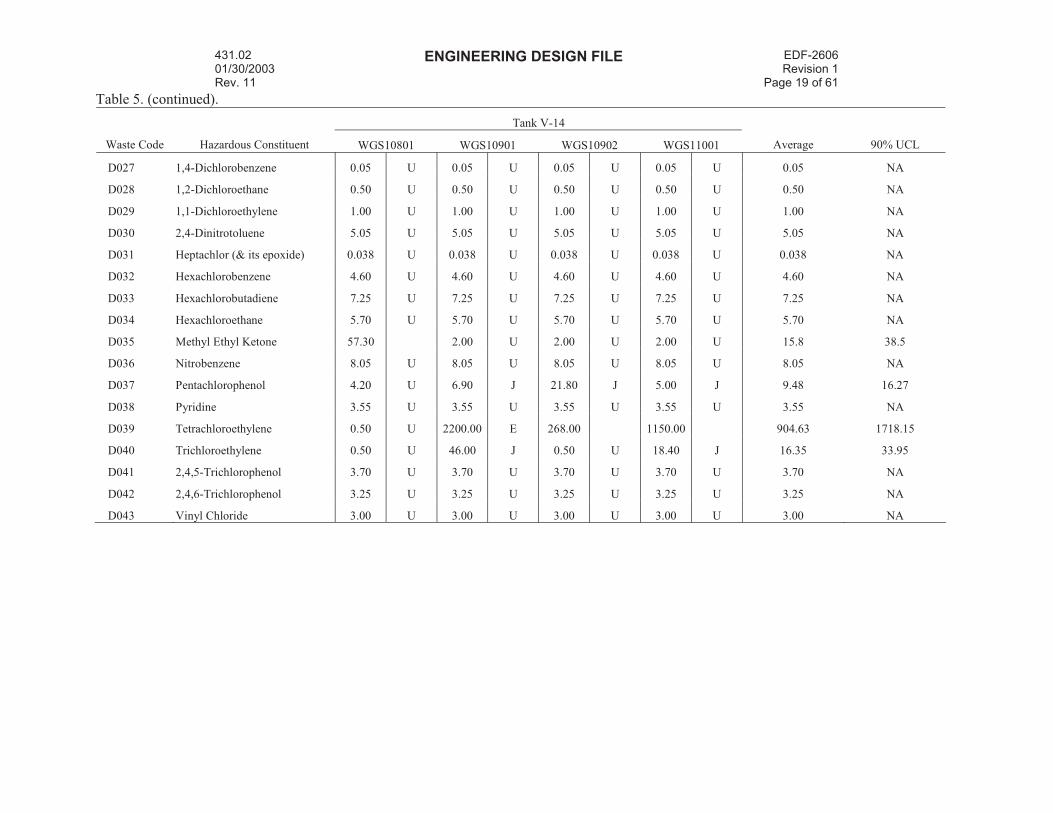
respectively. Tables 4 and 5 contain the reported TCLP data, with MDL adjustments for “U-flagged”
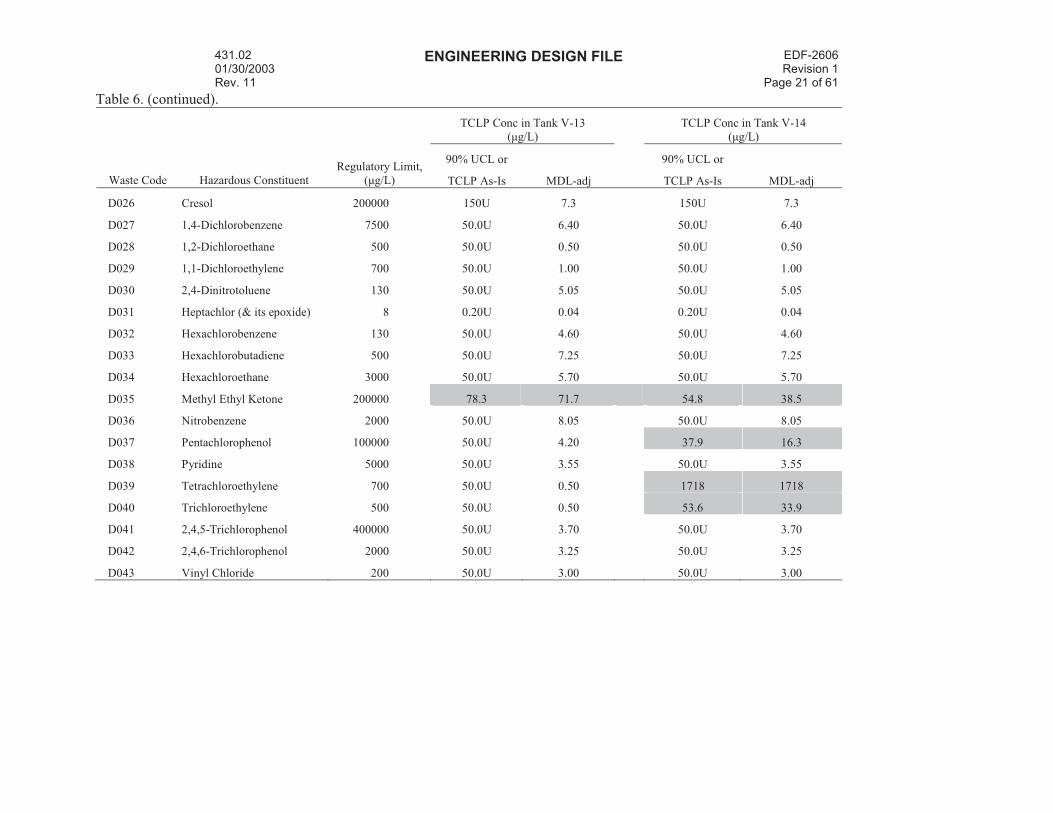
(nondetected) species, for Tanks V-13 and V-14, respectively. In Table 6, the TCLP regulatory limits for
the characteristic codes were compared to the 90% upper confidence limits (UCLs) for concentration of
species with detects and to the average of the concentrations for species with all nondetects. These
concentrations were determined for both Tanks V-13 and V-14 with and without the MDL adjustments on
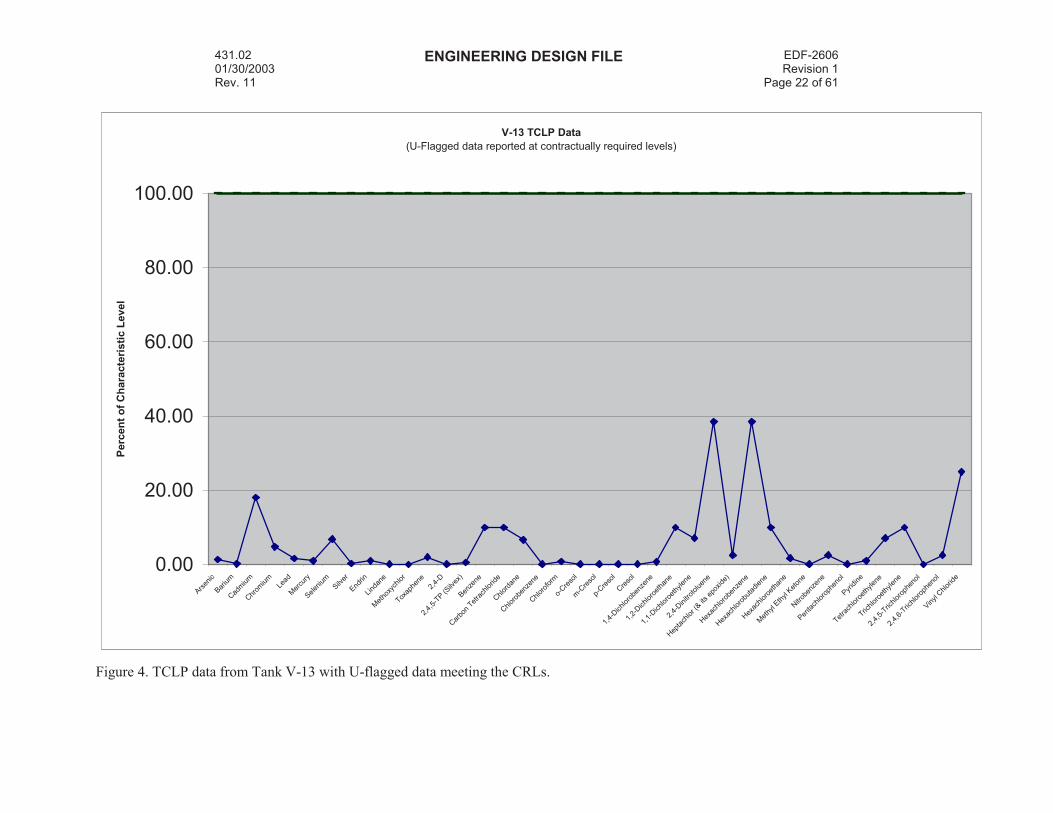
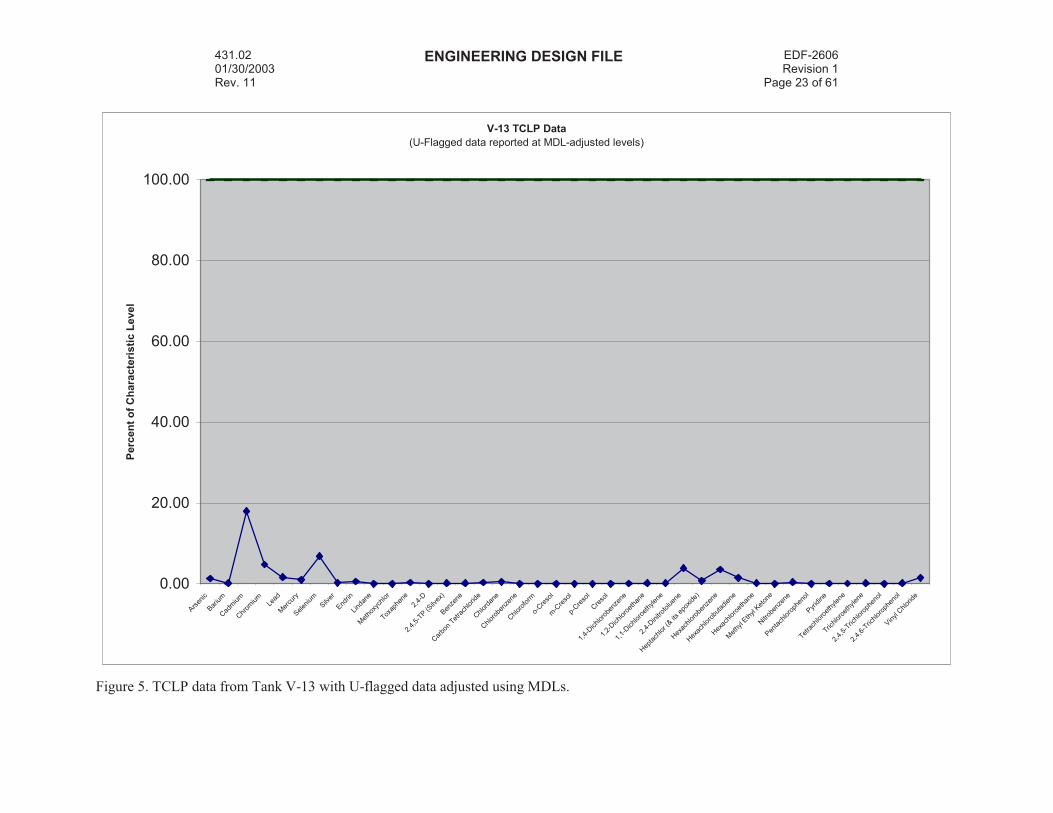
the nondetects. Figures 4 through 7 were developed from the data in Table 6. Figures 4 and 5 show the
percent of the characteristic level (concentration of TCLP divided by the concentration of the regulatory
level times 100) versus the various D-code species for Tank V-13. Figure 5 differs from Figure 4 by
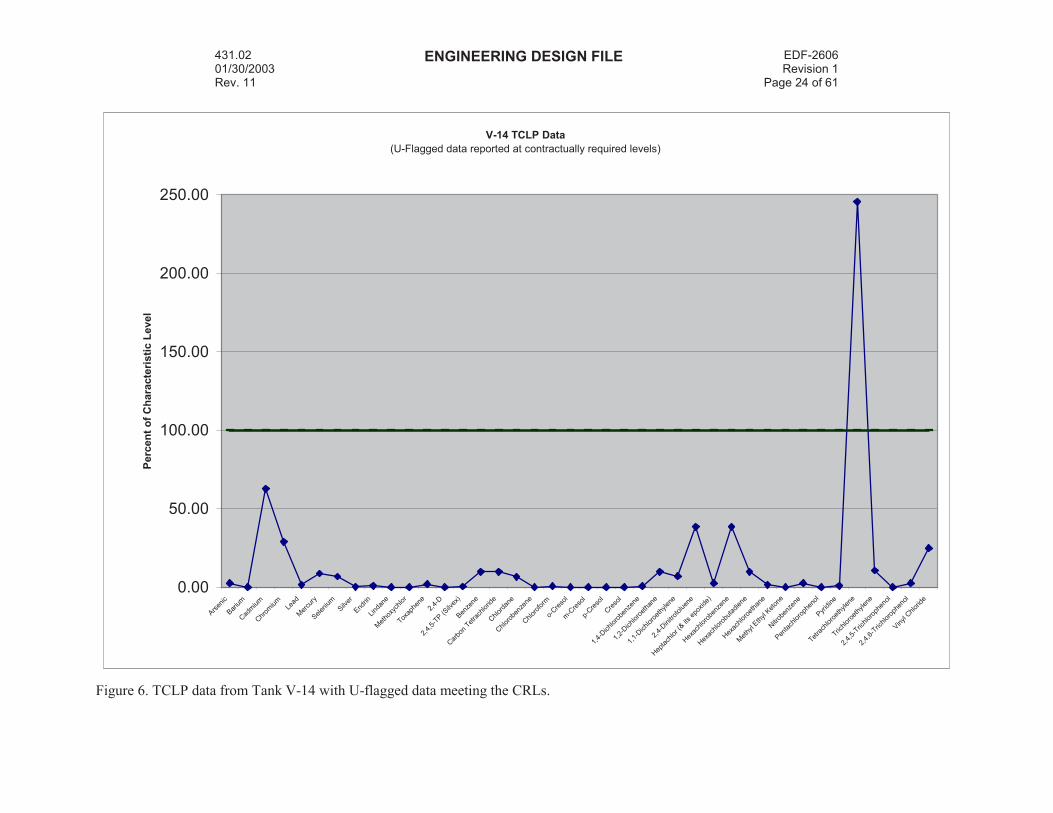
adjusting any nondetect species concentration by use of Equation 1. Figures 6 and 7 show the same
comparison for Tank V-14.
3.1.2 F001 Data
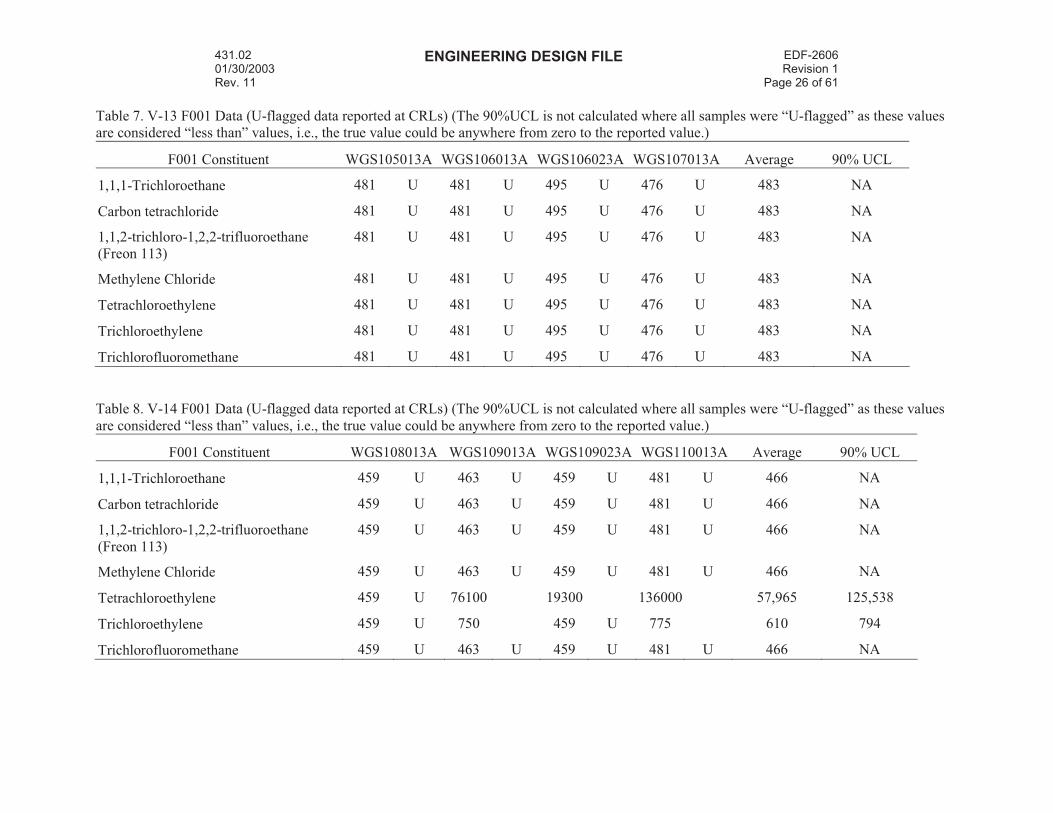
Tables 7 and 8 show the data for the F001 constituents. This is represented as a total concentration
of a given solvent in the PM-2A Tank waste. Figure 8 and 9 present concentrations for Tank V-13 at CRL
and MDL-adjusted. As is evident from these tables, there are no detected F001 species in Tank V-13,
while tetrachloroethylene and trichloroethylene are the only detected species in Tank V-14. A 90% UCL
was performed for both of these in Tank V-14, while all other F001 data took an average of the detection
limits. Tables 9 and 10 show the same data as Tables 7 and 8, except that the nondetected species had
their concentrations adjusted using the MDL values. In Table 11, the F001 treatment standards were
compared to the 90% UCLs for concentration of species with detects and to the average of the
concentrations for species with all nondetects. These concentrations were determined for both Tanks V-13
and V-14 with and without the MDL adjustments on the nondetects. Figures 8 through 10 were developed
from the data in Table 11. Figures 8 and 9 show the percent of the treatment standard (total concentration
of solvent divided by the F001 treatment standard concentration times 100) versus the various F001
species for Tank V-13. Figure 9 differs from Figure 8 by adjusting any nondetect species concentration by
use of Equation 1. Figure 10 shows the same comparison for Tank V-14.
3.1.3 Data Flags
The data flags are defined as follows:
“E” flags indicate interferences due to matrix suppression or enhancement as assessed from serial
dilutions.
“J” flags imply that the data is estimated when data point is below the calibrated range, but above
the statistically derived method detection limit (MDL). The associated value is an estimate and
may be inaccurate or imprecise.
“N” flags indicate that the percent recoveries obtained from the matrix spike analyses did not meet
the acceptance criteria. The percent recoveries are evaluated when the sample concentration is
less than four times the spike concentration added.
“U” flags imply that the data is below the MDL. Value typically reported at the reported quanitation
level (RQL) – the lowest concentration at which analyte can effectively be quantified. For
radioactive measurements, either the result is not statistically positive at the 95% confidence
level and/or the result was below the MDL.
431.02 01/30/2003 Rev. 11
ENGINEERING DESIGN FILE EDF-2606Revision 1
Page 12 of 61
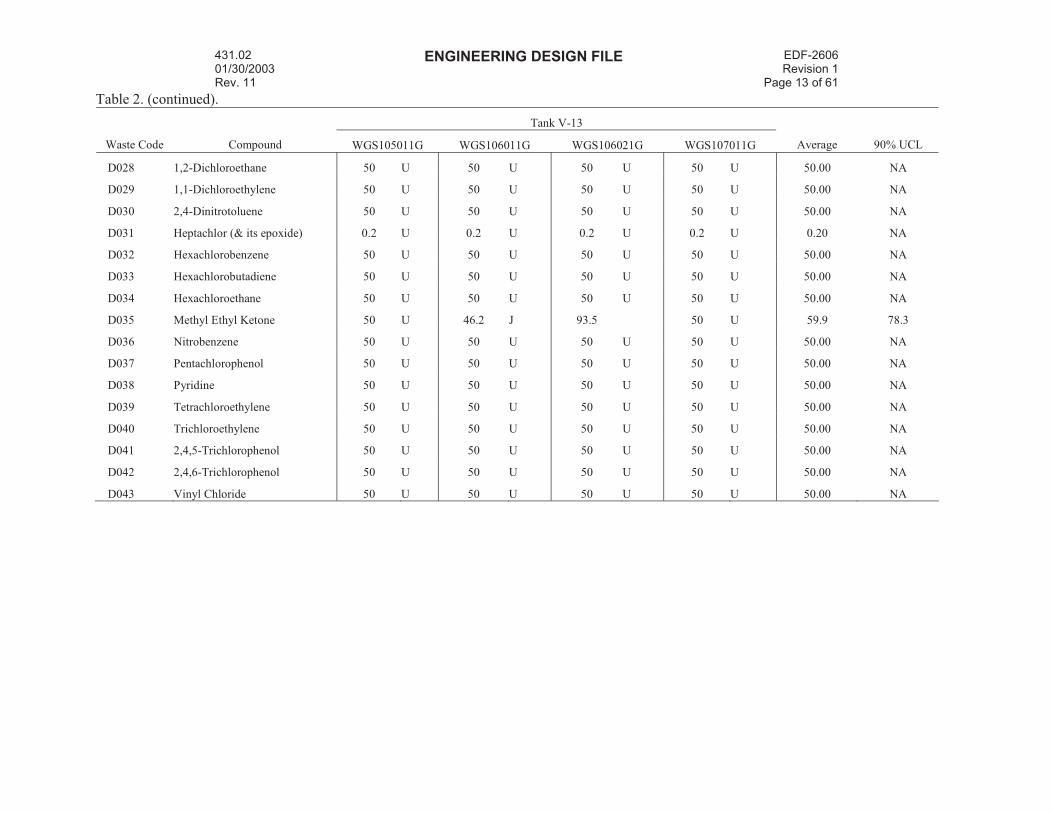
Table 2. TCLP concentrations of contents in Tank V-13 from original data in the Form 1s (concentrations in µg/L). (The 90%UCL is not
calculated where all samples were “U-flagged” as these values are considered “less than” values, i.e., the true value could be anywhere from zero
to the reported value.)
Tank V-13
Waste Code Compound WGS105011G WGS106011G WGS106021G WGS107011G Average 90% UCL
D004 Arsenic 38 64.7 68.7 30.7 50.5 66.1
D005 Barium 151 164 185 193 173 189
D006 Cadmium 182 110 178 139 152 180
D007 Chromium 102 61.8 93.6 317 144 239
D008 Lead 82.2 U 82.2 U 82.2 U 82.2 U 82.2 NA
D009 Mercury 2.28 1.18 0.598 1.35 1.35 1.92
D010 Selenium 68.2 U 68.2 U 68.2 U 68.2 U 68.2 NA
D011 Silver 13.6 UN 13.6 UN 13.6 UN 13.6 UN 13.6 NA
D012 Endrin 0.2 U 0.2 U 0.2 U 0.2 U 0.20 NA
D013 Lindane 0.1 U 0.1 U 0.1 U 0.1 U 0.10 NA
D014 Methoxychlor 0.2 U 0.2 U 0.2 U 0.2 U 0.20 NA
D015 Toxaphene 10 U 10 U 10 U 10 U 10.00 NA
D016 2,4-D 5 U 5 U 5 U 5 U 5.00 NA
D017 2,4,5-TP (Silvex) 5 U 5 U 5 U 5 U 5.00 NA
D018 Benzene 50 U 50 U 50 U 50 U 50.00 NA
D019 Carbon tetrachloride 50 U 50 U 50 U 50 U 50.00 NA
D020 Chlordane 2 U 2 U 2 U 2 U 2.00 NA
D021 Chlorobenzene 50 U 50 U 50 U 50 U 50.00 NA
D022 Chloroform 50 U 50 U 50 U 50 U 50.00 NA
D023 o-Cresol 50 U 50 U 50 U 50 U 50.00 NA
D024 m-Cresol 50 U 50 U 50 U 50 U 50.00 NA
D025 p-Cresol 50 U 50 U 50 U 50 U 50.00 NA
D026 Cresol 150 U 150 U 150 U 150 U 150.0 NA
D027 1,4-Dichlorobenzene 50 U 50 U 50 U 50 U 50.00 NA
431.02 01/30/2003 Rev. 11
ENGINEERING DESIGN FILE EDF-2606Revision 1
Page 13 of 61
Table 2. (continued).
Tank V-13
Waste Code Compound WGS105011G WGS106011G WGS106021G WGS107011G Average 90% UCL
D028 1,2-Dichloroethane 50 U 50 U 50 U 50 U 50.00 NA
D029 1,1-Dichloroethylene 50 U 50 U 50 U 50 U 50.00 NA
D030 2,4-Dinitrotoluene 50 U 50 U 50 U 50 U 50.00 NA
D031 Heptachlor (& its epoxide) 0.2 U 0.2 U 0.2 U 0.2 U 0.20 NA
D032 Hexachlorobenzene 50 U 50 U 50 U 50 U 50.00 NA
D033 Hexachlorobutadiene 50 U 50 U 50 U 50 U 50.00 NA
D034 Hexachloroethane 50 U 50 U 50 U 50 U 50.00 NA
D035 Methyl Ethyl Ketone 50 U 46.2 J 93.5 50 U 59.9 78.3
D036 Nitrobenzene 50 U 50 U 50 U 50 U 50.00 NA
D037 Pentachlorophenol 50 U 50 U 50 U 50 U 50.00 NA
D038 Pyridine 50 U 50 U 50 U 50 U 50.00 NA
D039 Tetrachloroethylene 50 U 50 U 50 U 50 U 50.00 NA
D040 Trichloroethylene 50 U 50 U 50 U 50 U 50.00 NA
D041 2,4,5-Trichlorophenol 50 U 50 U 50 U 50 U 50.00 NA
D042 2,4,6-Trichlorophenol 50 U 50 U 50 U 50 U 50.00 NA
D043 Vinyl Chloride 50 U 50 U 50 U 50 U 50.00 NA
431.02 01/30/2003 Rev. 11
ENGINEERING DESIGN FILE EDF-2606Revision 1
Page 14 of 61
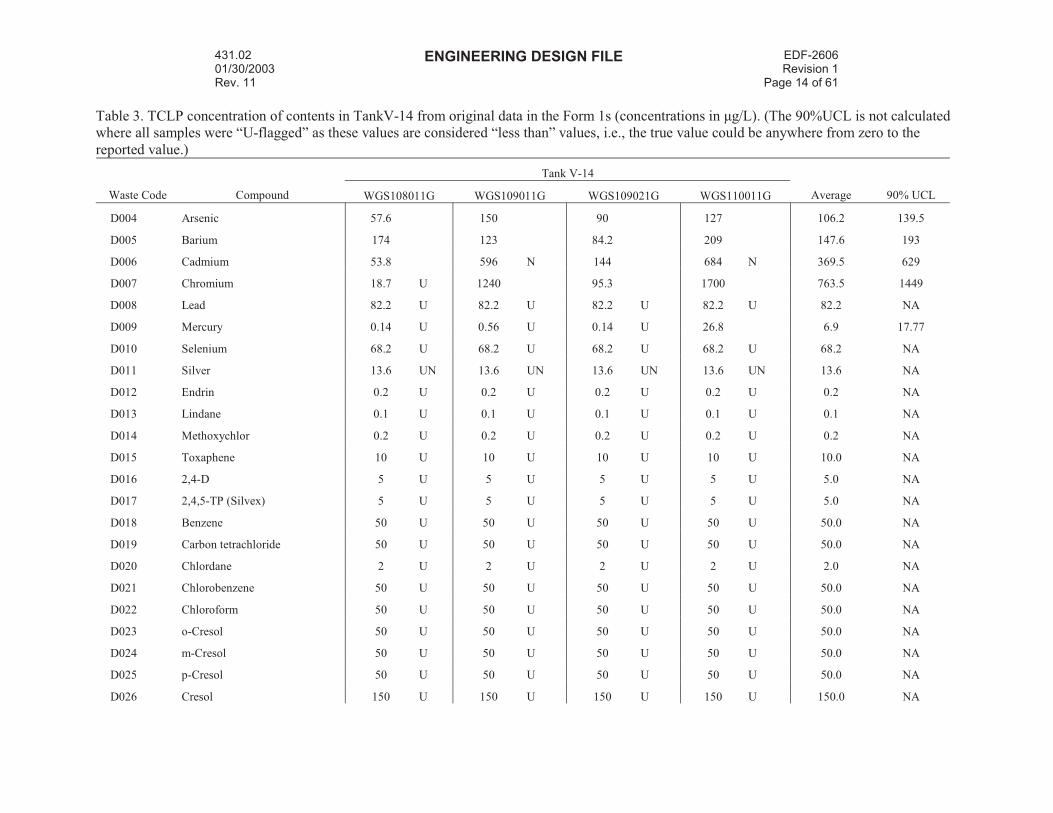
Table 3. TCLP concentration of contents in TankV-14 from original data in the Form 1s (concentrations in µg/L). (The 90%UCL is not calculated
where all samples were “U-flagged” as these values are considered “less than” values, i.e., the true value could be anywhere from zero to the
reported value.)
Tank V-14
Waste Code Compound WGS108011G WGS109011G WGS109021G WGS110011G Average 90% UCL
D004 Arsenic 57.6 150 90 127 106.2 139.5
D005 Barium 174 123 84.2 209 147.6 193
D006 Cadmium 53.8 596 N 144 684 N 369.5 629
D007 Chromium 18.7 U 1240 95.3 1700 763.5 1449
D008 Lead 82.2 U 82.2 U 82.2 U 82.2 U 82.2 NA
D009 Mercury 0.14 U 0.56 U 0.14 U 26.8 6.9 17.77
D010 Selenium 68.2 U 68.2 U 68.2 U 68.2 U 68.2 NA
D011 Silver 13.6 UN 13.6 UN 13.6 UN 13.6 UN 13.6 NA
D012 Endrin 0.2 U 0.2 U 0.2 U 0.2 U 0.2 NA
D013 Lindane 0.1 U 0.1 U 0.1 U 0.1 U 0.1 NA
D014 Methoxychlor 0.2 U 0.2 U 0.2 U 0.2 U 0.2 NA
D015 Toxaphene 10 U 10 U 10 U 10 U 10.0 NA
D016 2,4-D 5 U 5 U 5 U 5 U 5.0 NA
D017 2,4,5-TP (Silvex) 5 U 5 U 5 U 5 U 5.0 NA
D018 Benzene 50 U 50 U 50 U 50 U 50.0 NA
D019 Carbon tetrachloride 50 U 50 U 50 U 50 U 50.0 NA
D020 Chlordane 2 U 2 U 2 U 2 U 2.0 NA
D021 Chlorobenzene 50 U 50 U 50 U 50 U 50.0 NA
D022 Chloroform 50 U 50 U 50 U 50 U 50.0 NA
D023 o-Cresol 50 U 50 U 50 U 50 U 50.0 NA
D024 m-Cresol 50 U 50 U 50 U 50 U 50.0 NA
D025 p-Cresol 50 U 50 U 50 U 50 U 50.0 NA
D026 Cresol 150 U 150 U 150 U 150 U 150.0 NA
431.02 01/30/2003 Rev. 11
ENGINEERING DESIGN FILE EDF-2606Revision 1
Page 15 of 61
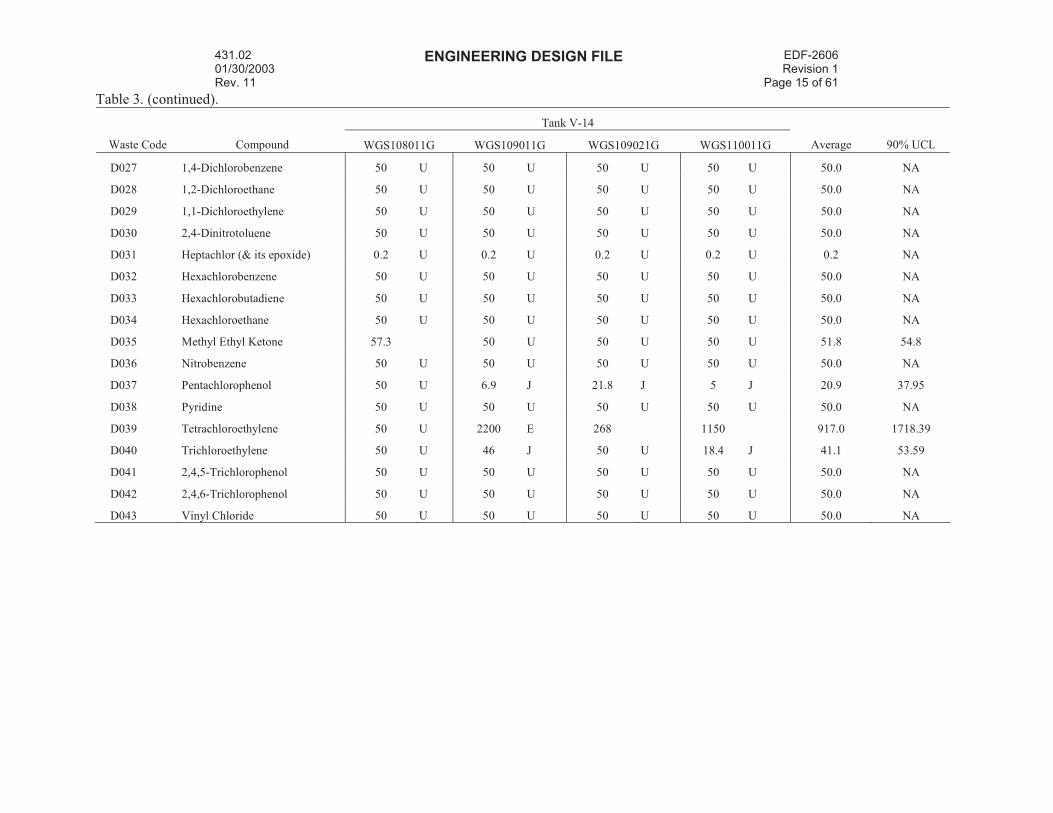
Table 3. (continued).
Tank V-14
Waste Code Compound WGS108011G WGS109011G WGS109021G WGS110011G Average 90% UCL
D027 1,4-Dichlorobenzene 50 U 50 U 50 U 50 U 50.0 NA
D028 1,2-Dichloroethane 50 U 50 U 50 U 50 U 50.0 NA
D029 1,1-Dichloroethylene 50 U 50 U 50 U 50 U 50.0 NA
D030 2,4-Dinitrotoluene 50 U 50 U 50 U 50 U 50.0 NA
D031 Heptachlor (& its epoxide) 0.2 U 0.2 U 0.2 U 0.2 U 0.2 NA
D032 Hexachlorobenzene 50 U 50 U 50 U 50 U 50.0 NA
D033 Hexachlorobutadiene 50 U 50 U 50 U 50 U 50.0 NA
D034 Hexachloroethane 50 U 50 U 50 U 50 U 50.0 NA
D035 Methyl Ethyl Ketone 57.3 50 U 50 U 50 U 51.8 54.8
D036 Nitrobenzene 50 U 50 U 50 U 50 U 50.0 NA
D037 Pentachlorophenol 50 U 6.9 J 21.8 J 5 J 20.9 37.95
D038 Pyridine 50 U 50 U 50 U 50 U 50.0 NA
D039 Tetrachloroethylene 50 U 2200 E 268 1150 917.0 1718.39
D040 Trichloroethylene 50 U 46 J 50 U 18.4 J 41.1 53.59
D041 2,4,5-Trichlorophenol 50 U 50 U 50 U 50 U 50.0 NA
D042 2,4,6-Trichlorophenol 50 U 50 U 50 U 50 U 50.0 NA
D043 Vinyl Chloride 50 U 50 U 50 U 50 U 50.0 NA
431.02 01/30/2003 Rev. 11
ENGINEERING DESIGN FILE EDF-2606Revision 1
Page 16 of 61
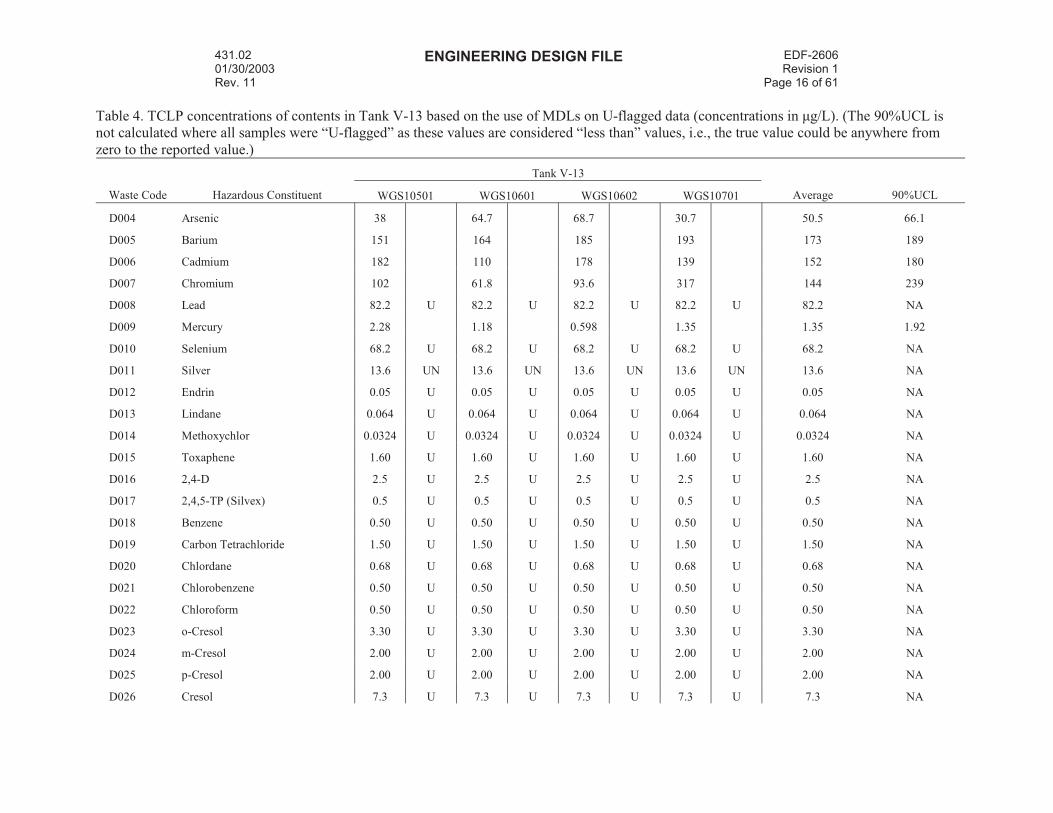
Table 4. TCLP concentrations of contents in Tank V-13 based on the use of MDLs on U-flagged data (concentrations in µg/L). (The 90%UCL is
not calculated where all samples were “U-flagged” as these values are considered “less than” values, i.e., the true value could be anywhere from
zero to the reported value.)
Tank V-13
Waste Code Hazardous Constituent WGS10501 WGS10601 WGS10602 WGS10701 Average 90%UCL
D004 Arsenic 38 64.7 68.7 30.7 50.5 66.1
D005 Barium 151 164 185 193 173 189
D006 Cadmium 182 110 178 139 152 180
D007 Chromium 102 61.8 93.6 317 144 239
D008 Lead 82.2 U 82.2 U 82.2 U 82.2 U 82.2 NA
D009 Mercury 2.28 1.18 0.598 1.35 1.35 1.92
D010 Selenium 68.2 U 68.2 U 68.2 U 68.2 U 68.2 NA
D011 Silver 13.6 UN 13.6 UN 13.6 UN 13.6 UN 13.6 NA
D012 Endrin 0.05 U 0.05 U 0.05 U 0.05 U 0.05 NA
D013 Lindane 0.064 U 0.064 U 0.064 U 0.064 U 0.064 NA
D014 Methoxychlor 0.0324 U 0.0324 U 0.0324 U 0.0324 U 0.0324 NA
D015 Toxaphene 1.60 U 1.60 U 1.60 U 1.60 U 1.60 NA
D016 2,4-D 2.5 U 2.5 U 2.5 U 2.5 U 2.5 NA
D017 2,4,5-TP (Silvex) 0.5 U 0.5 U 0.5 U 0.5 U 0.5 NA
D018 Benzene 0.50 U 0.50 U 0.50 U 0.50 U 0.50 NA
D019 Carbon Tetrachloride 1.50 U 1.50 U 1.50 U 1.50 U 1.50 NA
D020 Chlordane 0.68 U 0.68 U 0.68 U 0.68 U 0.68 NA
D021 Chlorobenzene 0.50 U 0.50 U 0.50 U 0.50 U 0.50 NA
D022 Chloroform 0.50 U 0.50 U 0.50 U 0.50 U 0.50 NA
D023 o-Cresol 3.30 U 3.30 U 3.30 U 3.30 U 3.30 NA
D024 m-Cresol 2.00 U 2.00 U 2.00 U 2.00 U 2.00 NA
D025 p-Cresol 2.00 U 2.00 U 2.00 U 2.00 U 2.00 NA
D026 Cresol 7.3 U 7.3 U 7.3 U 7.3 U 7.3 NA
431.02 01/30/2003 Rev. 11
ENGINEERING DESIGN FILE EDF-2606Revision 1
Page 17 of 61
Table 4. (continued).
Tank V-13
Waste Code Hazardous Constituent WGS10501 WGS10601 WGS10602 WGS10701 Average 90%UCL
D027 1,4-Dichlorobenzene 0.05 U 0.05 U 0.05 U 0.05 U 0.05 NA
D028 1,2-Dichloroethane 0.50 U 0.50 U 0.50 U 0.50 U 0.50 NA
D029 1,1-Dichloroethylene 1.00 U 1.00 U 1.00 U 1.00 U 1.00 NA
D030 2,4-Dinitrotoluene 5.05 U 5.05 U 5.05 U 5.05 U 5.05 NA
D031 Heptachlor (& its epoxide) 0.038 U 0.038 U 0.038 U 0.038 U 0.038 NA
D032 Hexachlorobenzene 4.60 U 4.60 U 4.60 U 4.60 U 4.60 NA
D033 Hexachlorobutadiene 7.25 U 7.25 U 7.25 U 7.25 U 7.25 NA
D034 Hexachloroethane 5.70 U 5.70 U 5.70 U 5.70 U 5.70 NA
D035 Methyl Ethyl Ketone 2.00 U 46.20 J 93.50 2.00 U 35.9 71.7
D036 Nitrobenzene 8.05 U 8.05 U 8.05 U 8.05 U 8.05 NA
D037 Pentachlorophenol 4.20 U 4.20 U 4.20 U 4.20 U 4.20 NA
D038 Pyridine 3.55 U 3.55 U 3.55 U 3.55 U 3.55 NA
D039 Tetrachloroethylene 0.50 U 0.50 U 0.50 U 0.50 U 0.50 NA
D040 Trichloroethylene 0.50 U 0.50 U 0.50 U 0.50 U 0.50 NA
D041 2,4,5-Trichlorophenol 3.70 U 3.70 U 3.70 U 3.70 U 3.70 NA
D042 2,4,6-Trichlorophenol 3.25 U 3.25 U 3.25 U 3.25 U 3.25 NA
D043 Vinyl Chloride 3.00 U 3.00 U 3.00 U 3.00 U 3.00 NA
431.02 01/30/2003 Rev. 11
ENGINEERING DESIGN FILE EDF-2606Revision 1
Page 18 of 61
Table 5. TCLP concentrations of contents in Tank V-14 based on the use of MDLs (concentrations in µg/L). (The 90%UCL is not calculated
where all samples were “U-flagged” as these values are considered “less than” values, i.e., the true value could be anywhere from zero to the
reported value.)
Tank V-14
Waste Code Hazardous Constituent WGS10801 WGS10901 WGS10902 WGS11001 Average 90% UCL
D004 Arsenic 57.6 150 90 127 106.2 139.5
D005 Barium 174 123 84.2 209 148 193
D006 Cadmium 53.8 596 N 144 684 N 369 629
D007 Chromium 18.7 U 1240 95.3 1700 764 1449
D008 Lead 82.2 U 82.2 U 82.2 U 82.2 U 82.2 NA
D009 Mercury 0.14 U 0.56 U 0.14 U 26.8 6.91 17.77
D010 Selenium 68.2 U 68.2 U 68.2 U 68.2 U 68.2 NA
D011 Silver 13.6 UN 13.6 UN 13.6 UN 13.6 UN 13.6 NA
D012 Endrin 0.05 U 0.05 U 0.05 U 0.05 U 0.05 NA
D013 Lindane 0.064 U 0.064 U 0.064 U 0.064 U 0.064 NA
D014 Methoxychlor 0.0324 U 0.0324 U 0.0324 U 0.0324 U 0.0324 NA
D015 Toxaphene 1.60 U 1.60 U 1.60 U 1.60 U 1.60 NA
D016 2,4-D 2.5 U 2.5 U 2.5 U 2.5 U 2.5 NA
D017 2,4,5-TP (Silvex) 0.5 U 0.5 U 0.5 U 0.5 U 0.5 NA
D018 Benzene 0.50 U 0.50 U 0.50 U 0.50 U 0.50 NA
D019 Carbon Tetrachloride 1.50 U 1.50 U 1.50 U 1.50 U 1.50 NA
D020 Chlordane 0.68 U 0.68 U 0.68 U 0.68 U 0.68 NA
D021 Chlorobenzene 0.50 U 0.50 U 0.50 U 0.50 U 0.50 NA
D022 Chloroform 0.50 U 0.50 U 0.50 U 0.50 U 0.50 NA
D023 o-Cresol 3.30 U 3.30 U 3.30 U 3.30 U 3.30 NA
D024 m-Cresol 2.00 U 2.00 U 2.00 U 2.00 U 2.00 NA
D025 p-Cresol 2.00 U 2.00 U 2.00 U 2.00 U 2.00 NA
D026 Cresol 7.3 U 7.3 U 7.3 U 7.3 U 7.3 NA
431.02 01/30/2003 Rev. 11
ENGINEERING DESIGN FILE EDF-2606Revision 1
Page 19 of 61
Table 5. (continued).
Tank V-14
Waste Code Hazardous Constituent WGS10801 WGS10901 WGS10902 WGS11001 Average 90% UCL
D027 1,4-Dichlorobenzene 0.05 U 0.05 U 0.05 U 0.05 U 0.05 NA
D028 1,2-Dichloroethane 0.50 U 0.50 U 0.50 U 0.50 U 0.50 NA
D029 1,1-Dichloroethylene 1.00 U 1.00 U 1.00 U 1.00 U 1.00 NA
D030 2,4-Dinitrotoluene 5.05 U 5.05 U 5.05 U 5.05 U 5.05 NA
D031 Heptachlor (& its epoxide) 0.038 U 0.038 U 0.038 U 0.038 U 0.038 NA
D032 Hexachlorobenzene 4.60 U 4.60 U 4.60 U 4.60 U 4.60 NA
D033 Hexachlorobutadiene 7.25 U 7.25 U 7.25 U 7.25 U 7.25 NA
D034 Hexachloroethane 5.70 U 5.70 U 5.70 U 5.70 U 5.70 NA
D035 Methyl Ethyl Ketone 57.30 2.00 U 2.00 U 2.00 U 15.8 38.5
D036 Nitrobenzene 8.05 U 8.05 U 8.05 U 8.05 U 8.05 NA
D037 Pentachlorophenol 4.20 U 6.90 J 21.80 J 5.00 J 9.48 16.27
D038 Pyridine 3.55 U 3.55 U 3.55 U 3.55 U 3.55 NA
D039 Tetrachloroethylene 0.50 U 2200.00 E 268.00 1150.00 904.63 1718.15
D040 Trichloroethylene 0.50 U 46.00 J 0.50 U 18.40 J 16.35 33.95
D041 2,4,5-Trichlorophenol 3.70 U 3.70 U 3.70 U 3.70 U 3.70 NA
D042 2,4,6-Trichlorophenol 3.25 U 3.25 U 3.25 U 3.25 U 3.25 NA
D043 Vinyl Chloride 3.00 U 3.00 U 3.00 U 3.00 U 3.00 NA

431.02 01/30/2003 Rev. 11
ENGINEERING DESIGN FILE EDF-2606Revision 1
Page 20 of 61
Table 6. Comparison of TCLP concentrations for 90% UCL or as-reported detection limits from Form 1s to concentrations adjusted by MDLs
(gray shading denotes at least one measured value above detection limits).
TCLP Conc in Tank V-13
(µg/L)
TCLP Conc in Tank V-14
(µg/L)
Waste Code Hazardous Constituent
Regulatory Limit,
(µg/L)
90% UCL or
TCLP As-Is MDL-adj
90% UCL or
TCLP As-Is MDL-adj
D004 Arsenic 5000 66.1 na 139.5 na
D005 Barium 100000 189 na 193 na
D006 Cadmium 1000 180 na 629 na
D007 Chromium 5000 239 na 1449 na
D008 Lead 5000 82.2U na 82.2U na
D009 Mercury 200 1.92 na 17.8 na
D010 Selenium 1000 68.2U na 68.2U na
D011 Silver 5000 13.6UN na 13.6UN na
D012 Endrin 20 0.20U 0.05 0.20U 0.05
D013 Lindane 400 0.10U 0.06 0.10U 0.06
D014 Methoxychlor 10000 0.20U 0.03 0.20U 0.03
D015 Toxaphene 500 10.0U 1.60 10.0U 1.60
D016 2,4-D 10000 5.00U 2.5 5.00U 2.5
D017 2,4,5-TP (Silvex) 1000 5.00U 0.5 5.00U 0.5
D018 Benzene 500 50.0U 0.50 50.0U 0.50
D019 Carbon Tetrachloride 500 50.0U 1.50 50.0U 1.50
D020 Chlordane 30 2.00U 0.68 2.00U 0.68
D021 Chlorobenzene 100000 50.0U 0.50 50.0U 0.50
D022 Chloroform 6000 50.0U 0.50 50.0U 0.50
D023 o-Cresol 200000 50.0U 3.30 50.0U 3.30
D024 m-Cresol 200000 50.0U 2.00 50.0U 2.00
D025 p-Cresol 200000 50.0U 2.00 50.0U 2.00
431.02 01/30/2003 Rev. 11
ENGINEERING DESIGN FILE EDF-2606Revision 1
Page 21 of 61
Table 6. (continued).
TCLP Conc in Tank V-13
(µg/L)
TCLP Conc in Tank V-14
(µg/L)
Waste Code Hazardous Constituent
Regulatory Limit,
(µg/L)
90% UCL or
TCLP As-Is MDL-adj
90% UCL or
TCLP As-Is MDL-adj
D026 Cresol 200000 150U 7.3 150U 7.3
D027 1,4-Dichlorobenzene 7500 50.0U 6.40 50.0U 6.40
D028 1,2-Dichloroethane 500 50.0U 0.50 50.0U 0.50
D029 1,1-Dichloroethylene 700 50.0U 1.00 50.0U 1.00
D030 2,4-Dinitrotoluene 130 50.0U 5.05 50.0U 5.05
D031 Heptachlor (& its epoxide) 8 0.20U 0.04 0.20U 0.04
D032 Hexachlorobenzene 130 50.0U 4.60 50.0U 4.60
D033 Hexachlorobutadiene 500 50.0U 7.25 50.0U 7.25
D034 Hexachloroethane 3000 50.0U 5.70 50.0U 5.70
D035 Methyl Ethyl Ketone 200000 78.3 71.7 54.8 38.5
D036 Nitrobenzene 2000 50.0U 8.05 50.0U 8.05
D037 Pentachlorophenol 100000 50.0U 4.20 37.9 16.3
D038 Pyridine 5000 50.0U 3.55 50.0U 3.55
D039 Tetrachloroethylene 700 50.0U 0.50 1718 1718
D040 Trichloroethylene 500 50.0U 0.50 53.6 33.9
D041 2,4,5-Trichlorophenol 400000 50.0U 3.70 50.0U 3.70
D042 2,4,6-Trichlorophenol 2000 50.0U 3.25 50.0U 3.25
D043 Vinyl Chloride 200 50.0U 3.00 50.0U 3.00
431.02 01/30/2003 Rev. 11
ENGINEERING DESIGN FILE EDF-2606Revision 1
Page 22 of 61
V-13 TCLP Data
(U-Flagged data reported at contractually required levels)
0.00
20.00
40.00
60.00
80.00
100.00
Arsen
icBar
ium
Cad
miu
mC
hrom
ium
Lead
Mer
cury
Selen
ium
Silver
Endrin
Lind
ane
Met
hoxy
chlo
rTox
aphe
ne
2,4-
D
2,4,
5-TP (S
ilvex
)Ben
zene
Car
bon
Tetra
chlo
ride
Chl
orda
ne
Chl
orob
enze
neC
hlor
ofor
mo-
Cre
sol
m-C
reso
lp-
Cre
sol
Cre
sol
1,4-
Dic
hlor
oben
zene
1,2-
Dic
hlor
oeth
ane
1,1-
Dic
hlor
oeth
ylen
e
2,4-
Din
itrot
olue
ne
Hep
tach
lor (
& it
s ep
oxid
e)
Hex
achl
orob
enze
ne
Hex
achl
orob
utad
iene
Hex
achl
oroe
than
e
Met
hyl E
thyl
Ket
one
Nitr
oben
zene
Penta
chlo
roph
enol
Pyrid
ine
Tetra
chlo
roet
hyle
ne
Trichl
oroe
thyl
ene
2,4,
5-Tric
hlor
ophe
nol
2,4,
6-Tric
hlor
ophe
nol
Vinyl
Chl
orid
e
Perc
en
t o
f C
hara
cte
risti
c L
evel
Figure 4. TCLP data from Tank V-13 with U-flagged data meeting the CRLs.
431.02 01/30/2003 Rev. 11
ENGINEERING DESIGN FILE EDF-2606Revision 1
Page 23 of 61
V-13 TCLP Data
(U-Flagged data reported at MDL-adjusted levels)
0.00
20.00
40.00
60.00
80.00
100.00
Ars
enic
Bar
ium
Cad
miu
mC
hrom
ium
Lead
Mer
cury
Sel
eniu
m
Silv
erE
ndrin
Lind
ane
Met
hoxy
chlo
rTox
aphe
ne
2,4-
D
2,4,
5-TP (S
ilvex
)B
enze
ne
Car
bon
Tetra
chlo
ride
Chl
orda
ne
Chl
orob
enze
neC
hlor
ofor
mo-
Cre
sol
m-C
reso
lp-
Cre
sol
Cre
sol
1,4-
Dic
hlor
oben
zene
1,2-
Dic
hlor
oeth
ane
1,1-
Dic
hlor
oeth
ylen
e
2,4-
Din
itrot
olue
ne
Hep
tach
lor (&
its
epox
ide)
Hex
achl
orob
enze
ne
Hex
achl
orob
utad
iene
Hex
achl
oroe
than
e
Met
hyl E
thyl
Ket
one
Nitr
oben
zene
Pen
tach
loro
phen
olP
yrid
ine
Tetra
chlo
roet
hyle
ne
Trichl
oroe
thyl
ene
2,4,
5-Tric
hlor
ophe
nol
2,4,
6-Tric
hlor
ophe
nol
Vin
ylC
hlor
ide
Perc
en
t o
f C
hara
cte
risti
c L
evel
Figure 5. TCLP data from Tank V-13 with U-flagged data adjusted using MDLs.
431.02 01/30/2003 Rev. 11
ENGINEERING DESIGN FILE EDF-2606Revision 1
Page 24 of 61
V-14 TCLP Data
(U-Flagged data reported at contractually required levels)
0.00
50.00
100.00
150.00
200.00
250.00
Ars
enic
Bar
ium
Cad
miu
mC
hrom
ium
Lead
Mer
cury
Sel
eniu
m
Silv
erE
ndrin
Lind
ane
Met
hoxy
chlo
rTox
aphe
ne
2,4-
D
2,4,
5-TP (S
ilvex
)B
enze
ne
Car
bon
Tetra
chlo
ride
Chl
orda
ne
Chl
orob
enze
neC
hlor
ofor
mo-
Cre
sol
m-C
reso
lp-
Cre
sol
Cre
sol
1,4-
Dic
hlor
oben
zene
1,2-
Dic
hlor
oeth
ane
1,1-
Dic
hlor
oeth
ylen
e
2,4-
Din
itrot
olue
ne
Hep
tach
lor (&
its
epox
ide)
Hex
achl
orob
enze
ne
Hex
achl
orob
utad
iene
Hex
achl
oroe
than
e
Met
hyl E
thyl
Ket
one
Nitr
oben
zene
Pen
tach
loro
phen
olP
yrid
ine
Tetra
chlo
roet
hyle
ne
Trichl
oroe
thyl
ene
2,4,
5-Tric
hlor
ophe
nol
2,4,
6-Tric
hlor
ophe
nol
Vin
ylC
hlor
ide
Perc
en
t o
f C
hara
cte
risti
c L
evel
Figure 6. TCLP data from Tank V-14 with U-flagged data meeting the CRLs.

431.02 01/30/2003 Rev. 11
ENGINEERING DESIGN FILE EDF-2606Revision 1
Page 25 of 61
V-14 TCLP Data
(U-flagged data reported at MDL-adjusted levels)
0.00
50.00
100.00
150.00
200.00
250.00
Ars
enic
Bar
ium
Cad
miu
mC
hrom
ium
Lead
Mer
cury
Sel
eniu
m
Silv
erE
ndrin
Lind
ane
Met
hoxy
chlo
rTox
aphe
ne
2,4-
D
2,4,
5-TP (S
ilvex
)B
enze
ne
Car
bon
Tetra
chlo
ride
Chl
orda
ne
Chl
orob
enze
neC
hlor
ofor
mo-
Cre
sol
m-C
reso
lp-
Cre
sol
Cre
sol
1,4-
Dic
hlor
oben
zene
1,2-
Dic
hlor
oeth
ane
1,1-
Dic
hlor
oeth
ylen
e
2,4-
Din
itrot
olue
ne
Hep
tach
lor (&
its
epox
ide)
Hex
achl
orob
enze
ne
Hex
achl
orob
utad
iene
Hex
achl
oroe
than
e
Met
hyl E
thyl
Ket
one
Nitr
oben
zene
Pen
tach
loro
phen
olP
yrid
ine
Tetra
chlo
roet
hyle
ne
Trichl
oroe
thyl
ene
2,4,
5-Tric
hlor
ophe
nol
2,4,
6-Tric
hlor
ophe
nol
Vin
ylC
hlor
ide
Perc
en
t o
f C
hara
cte
risti
c L
evel
Figure 7. TCLP data from Tank V-14 with U-flagged data adjusted using MDLs.
431.02 01/30/2003 Rev. 11
ENGINEERING DESIGN FILE EDF-2606Revision 1
Page 26 of 61
Table 7. V-13 F001 Data (U-flagged data reported at CRLs) (The 90%UCL is not calculated where all samples were “U-flagged” as these values
are considered “less than” values, i.e., the true value could be anywhere from zero to the reported value.)
F001 Constituent WGS105013A WGS106013A WGS106023A WGS107013A Average 90% UCL
1,1,1-Trichloroethane 481 U 481 U 495 U 476 U 483 NA
Carbon tetrachloride 481 U 481 U 495 U 476 U 483 NA
1,1,2-trichloro-1,2,2-trifluoroethane
(Freon 113)
481 U 481 U 495 U 476 U 483 NA
Methylene Chloride 481 U 481 U 495 U 476 U 483 NA
Tetrachloroethylene 481 U 481 U 495 U 476 U 483 NA
Trichloroethylene 481 U 481 U 495 U 476 U 483 NA
Trichlorofluoromethane 481 U 481 U 495 U 476 U 483 NA
Table 8. V-14 F001 Data (U-flagged data reported at CRLs) (The 90%UCL is not calculated where all samples were “U-flagged” as these values
are considered “less than” values, i.e., the true value could be anywhere from zero to the reported value.)
F001 Constituent WGS108013A WGS109013A WGS109023A WGS110013A Average 90% UCL
1,1,1-Trichloroethane 459 U 463 U 459 U 481 U 466 NA
Carbon tetrachloride 459 U 463 U 459 U 481 U 466 NA
1,1,2-trichloro-1,2,2-trifluoroethane
(Freon 113)
459 U 463 U 459 U 481 U 466 NA
Methylene Chloride 459 U 463 U 459 U 481 U 466 NA
Tetrachloroethylene 459 U 76100 19300 136000 57,965 125,538
Trichloroethylene 459 U 750 459 U 775 610 794
Trichlorofluoromethane 459 U 463 U 459 U 481 U 466 NA
431.02 01/30/2003 Rev. 11
ENGINEERING DESIGN FILE EDF-2606Revision 1
Page 27 of 61
V-13 F001 Data (U-flagged reported at contractually required levels)
0
5
10
1,1,
1-Tric
hlor
oeth
ane
Car
bon
tetra
chlo
ride
Freon
113
Met
hyle
neC
hlor
ide
Tetra
chlo
roet
hene
Trichl
oroe
then
e
Trichl
orof
luor
omet
haneP
erc
en
t o
f T
reatm
en
t S
tan
dard
Figure 8. F001 data for Tank V-13 with U-flagged data meeting the CRLs.
431.02 01/30/2003 Rev. 11
ENGINEERING DESIGN FILE EDF-2606Revision 1
Page 28 of 61
V-13 F001 Data (U-flagged data reported as MDL-adjusted)
0
1
2
3
4
5
1,1,
1-Tric
hlor
oeth
ane
Car
bon
tetra
chlo
ride
Freon
113
Met
hyle
ne C
hlor
ide
Tetra
chlo
roet
hene
Trichl
oroe
then
e
Trichl
orof
luor
omet
hane
Perc
en
t o
f T
reatm
en
t S
tan
dard
Figure 9. F001 data for Tank V-13 with U-flagged data adjusted using MDLs.
431.02 01/30/2003 Rev. 11
ENGINEERING DESIGN FILE EDF-2606Revision 1
Page 29 of 61
Table 9. V-13 F001 Data (U-flagged data adjusted using the MDLs) (The 90%UCL is not calculated where all samples were “U-flagged”
as these values are considered “less than” values, i.e., the true value could be anywhere from zero to the reported value.)
F001 Constituent WGS105013A WGS106013A WGS106023A WGS107013A Average 90% UCL
1,1,1-Trichloroethane 9.62 U 9.62 U 9.90 U 9.52 U 9.67 NA
Carbon tetrachloride 9.62 U 9.62 U 9.90 U 9.52 U 9.67 NA
1,1,2-trichloro-1,2,2-trifluoroethane
(Freon 113)
24.0 U 24.0 U 24.8 U 23.8 U 24.2 NA
Methylene Chloride 19.2 U 19.2 U 19.8 U 19.0 U 19.3 NA
Tetrachloroethylene 9.62 U 9.62 U 9.90 U 9.52 U 9.67 NA
Trichloroethylene 14.4 U 14.4 U 14.9 U 14.3 U 14.5 NA
Trichlorofluoromethane 24.0 U 24.0 U 24.8 U 23.8 U 24.2 NA
Table 10. V-14 F001 Data (U-flagged data adjusted using the MDLs) (The 90%UCL is not calculated where all samples were “U-flagged”
as these values are considered “less than” values, i.e., the true value could be anywhere from zero to the reported value.)
F001 Constituent WGS108013A WGS109013A WGS109023A WGS110013A Average 90% UCL
1,1,1-Trichloroethane 9.17 U 9.26 U 9.17 U 9.62 U 9.31 NA
Carbon tetrachloride 9.17 U 9.26 U 9.17 U 9.62 U 9.31 NA
1,1,2-trichloro-1,2,2-trifluoroethane
(Freon 113)
22.9 U 23.2 U 22.9 U 24.0 U 23.3 NA
Methylene Chloride 18.4 U 18.5 U 18.4 U 19.2 U 18.6 NA
Tetrachloroethylene 9.17 U 76100 19300 136000 57852 108047
Trichloroethylene 13.8 U 750 13.8 U 775 388 742
Trichlorofluoromethane 22.9 U 23.2 U 22.9 U 24.0 U 23.3 NA
431.02 01/30/2003 Rev. 11
ENGINEERING DESIGN FILE EDF-2606Revision 1
Page 30 of 61
Table 11. Comparison of the F001 concentrations for as-reported detection limits from Form 1s to concentrations adjusted by MDLs
(gray shading denotes at least one measured value above detection limits).
Compound
F001 Treatment
Standard
V-13 F001 AS-IS,
(µg/kg)
V-13 F001 MDL-
adj, (µg/kg)
V-14 F001 AS-IS,
(µg/kg)
V-14 F001 MDL-adj,
(µg/kg)
1,1,1-Trichloroethane 6000 483 9.7 466 9.3
Carbon tetrachloride 6000 483 9.7 466 9.3
1,1,2-trichloro-1,2,2-
trifluoroethane (Freon 113)
30000 483 24.2 466 23.3
Methylene Chloride 30000 483 19.3 466 18.6
Tetrachloroethylene 6000 483 9.7 125,538 108047
Trichloroethylene 6000 483 14.5 794 742
Trichlorofluoromethane 30000 483 24.2 466 23.3
431.02 01/30/2003 Rev. 11
ENGINEERING DESIGN FILE EDF-2606Revision 1
Page 31 of 61
V-14 F001 Data (U-flagged reported at contractually required levels)
0.0
5.0
10.0
15.0
A B C D E F GPe
rce
nt
of
Tre
atm
en
t S
tan
da
rd
V-14 F001 Data (U-flagged data reported as MDL-adjusted)
0.0
5.0
10.0
15.0
A B C D E F G
Pe
rce
nt
of
Tre
atm
en
t S
tan
da
rd
Figure 10. Tank V-14 F001 data for contract reporting limits for U-flagged data (upper figure) and
method detection limits for U-flagged data (lower figure).
NOTE: Trichloroethylene and tetrachloroethylene data are based on a 90% upper confidence limit values on a combination of detected values and U-flagged values.
A. 1,1,1-trichloroethane
B. carbon tetrachloride
C. 1,1,2-trichloro-1,2,2-trifluoroethane (Freon 113)
D. methylene chloride
E. tetrachloroethylene
F. trichloroethylene
G. trichlorofluoromethane
2090%
1680%
431.02 01/30/2003 Rev. 11
ENGINEERING DESIGN FILE EDF-2606Revision 1
Page 32 of 61
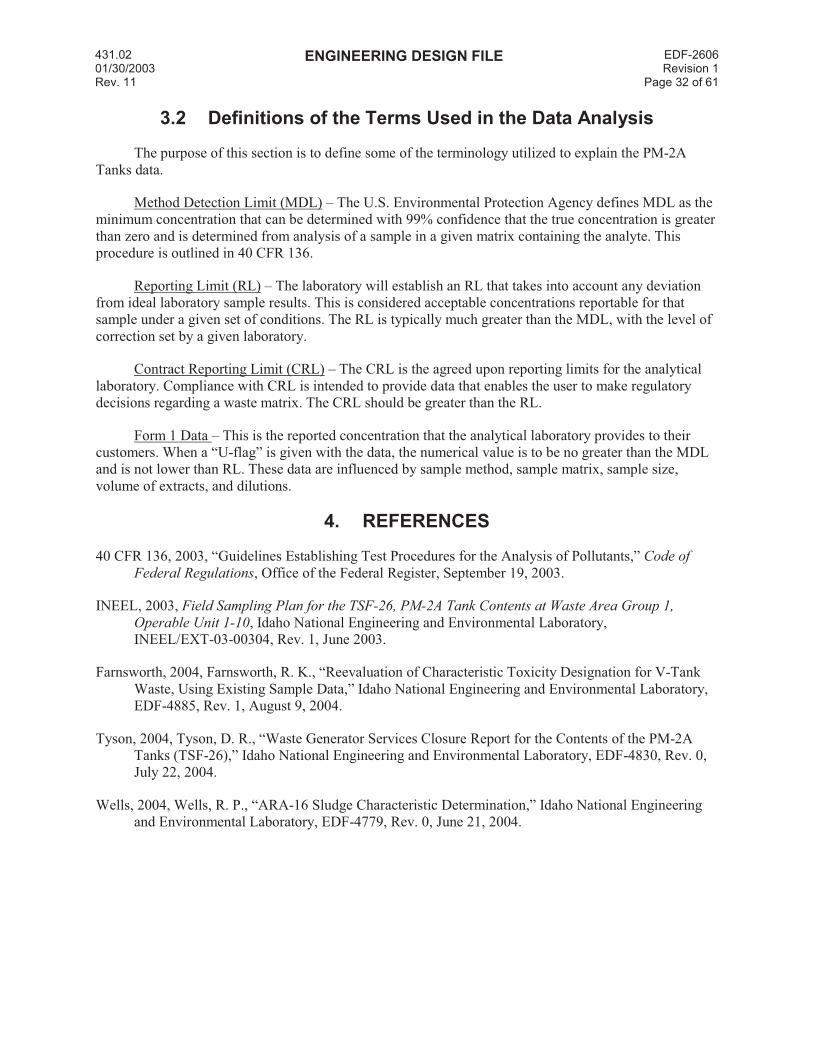
3.2 Definitions of the Terms Used in the Data Analysis
The purpose of this section is to define some of the terminology utilized to explain the PM-2A
Tanks data.
Method Detection Limit (MDL) – The U.S. Environmental Protection Agency defines MDL as the
minimum concentration that can be determined with 99% confidence that the true concentration is greater
than zero and is determined from analysis of a sample in a given matrix containing the analyte. This
procedure is outlined in 40 CFR 136.
Reporting Limit (RL) – The laboratory will establish an RL that takes into account any deviation
from ideal laboratory sample results. This is considered acceptable concentrations reportable for that
sample under a given set of conditions. The RL is typically much greater than the MDL, with the level of
correction set by a given laboratory.
Contract Reporting Limit (CRL) – The CRL is the agreed upon reporting limits for the analytical
laboratory. Compliance with CRL is intended to provide data that enables the user to make regulatory
decisions regarding a waste matrix. The CRL should be greater than the RL.
Form 1 Data – This is the reported concentration that the analytical laboratory provides to their
customers. When a “U-flag” is given with the data, the numerical value is to be no greater than the MDL
and is not lower than RL. These data are influenced by sample method, sample matrix, sample size,
volume of extracts, and dilutions.
4. REFERENCES
40 CFR 136, 2003, “Guidelines Establishing Test Procedures for the Analysis of Pollutants,” Code of
Federal Regulations, Office of the Federal Register, September 19, 2003.
INEEL, 2003, Field Sampling Plan for the TSF-26, PM-2A Tank Contents at Waste Area Group 1,
Operable Unit 1-10, Idaho National Engineering and Environmental Laboratory,
INEEL/EXT-03-00304, Rev. 1, June 2003.
Farnsworth, 2004, Farnsworth, R. K., “Reevaluation of Characteristic Toxicity Designation for V-Tank
Waste, Using Existing Sample Data,” Idaho National Engineering and Environmental Laboratory,
EDF-4885, Rev. 1, August 9, 2004.
Tyson, 2004, Tyson, D. R., “Waste Generator Services Closure Report for the Contents of the PM-2A
Tanks (TSF-26),” Idaho National Engineering and Environmental Laboratory, EDF-4830, Rev. 0,
July 22, 2004.
Wells, 2004, Wells, R. P., “ARA-16 Sludge Characteristic Determination,” Idaho National Engineering
and Environmental Laboratory, EDF-4779, Rev. 0, June 21, 2004.
431.02 01/30/2003 Rev. 11
ENGINEERING DESIGN FILE EDF-2606Revision 1
Page 33 of 61
Appendix A
MDLs for the Analytes of Interest (TCLP and F001)
431.02 01/30/2003 Rev. 11
ENGINEERING DESIGN FILE EDF-2606Revision 1
Page 34 of 61
This page intentionally left blank.
431.02 01/30/2003 Rev. 11
ENGINEERING DESIGN FILE EDF-2606Revision 1
Page 35 of 61
Appendix A
MDLs for the Analytes of Interest (TCLP and F001)
In order to adjust the U-flag data reported by the analytical laboratories, as reported in the Form 1s,
both MDLs and RLs are needed to perform the adjustment, per Equation 1 of this EDF. This Appendix
contains the MDLs and RLs for the VOCs (Table A-1), the MDLs and RLs for SVOCs (Table A-2) and
the TCLP MDLs and RLs (Table A-3).
431.02 01/30/2003 Rev. 11
ENGINEERING DESIGN FILE EDF-2606Revision 1
Page 36 of 61
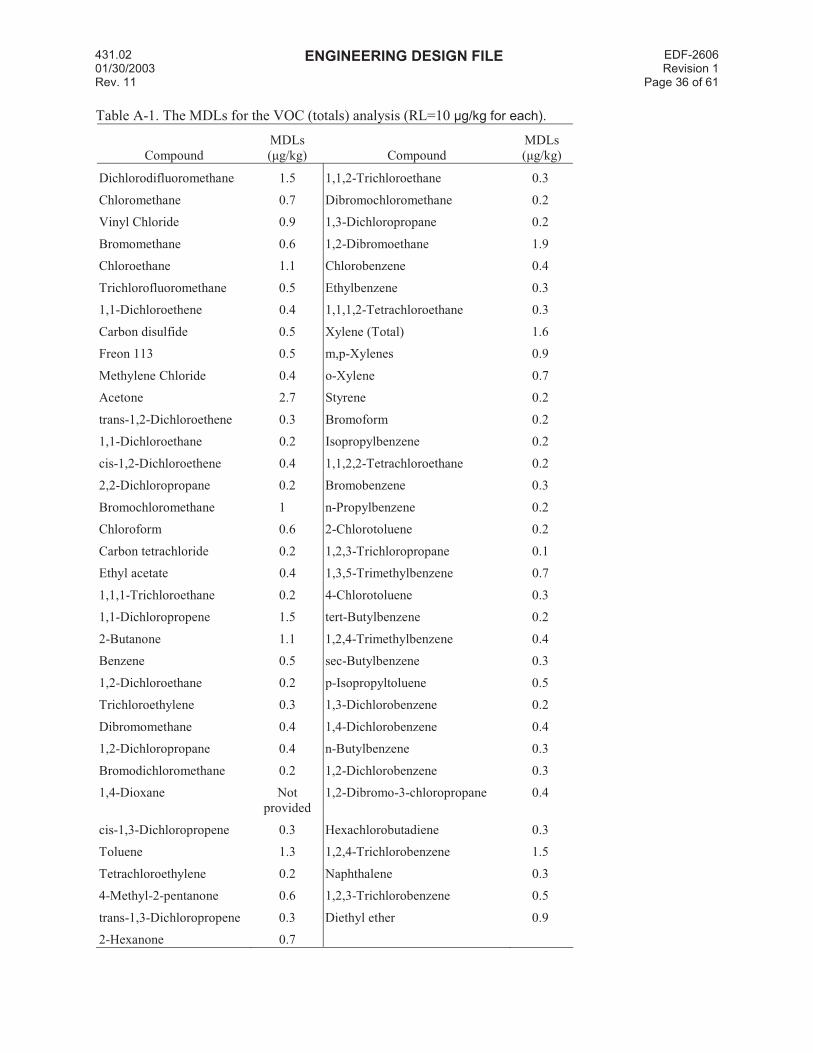
Table A-1. The MDLs for the VOC (totals) analysis (RL=10 µg/kg for each).
Compound
MDLs
(µg/kg) Compound
MDLs
(µg/kg)
Dichlorodifluoromethane 1.5 1,1,2-Trichloroethane 0.3
Chloromethane 0.7 Dibromochloromethane 0.2
Vinyl Chloride 0.9 1,3-Dichloropropane 0.2
Bromomethane 0.6 1,2-Dibromoethane 1.9
Chloroethane 1.1 Chlorobenzene 0.4
Trichlorofluoromethane 0.5 Ethylbenzene 0.3
1,1-Dichloroethene 0.4 1,1,1,2-Tetrachloroethane 0.3
Carbon disulfide 0.5 Xylene (Total) 1.6
Freon 113 0.5 m,p-Xylenes 0.9
Methylene Chloride 0.4 o-Xylene 0.7
Acetone 2.7 Styrene 0.2
trans-1,2-Dichloroethene 0.3 Bromoform 0.2
1,1-Dichloroethane 0.2 Isopropylbenzene 0.2
cis-1,2-Dichloroethene 0.4 1,1,2,2-Tetrachloroethane 0.2
2,2-Dichloropropane 0.2 Bromobenzene 0.3
Bromochloromethane 1 n-Propylbenzene 0.2
Chloroform 0.6 2-Chlorotoluene 0.2
Carbon tetrachloride 0.2 1,2,3-Trichloropropane 0.1
Ethyl acetate 0.4 1,3,5-Trimethylbenzene 0.7
1,1,1-Trichloroethane 0.2 4-Chlorotoluene 0.3
1,1-Dichloropropene 1.5 tert-Butylbenzene 0.2
2-Butanone 1.1 1,2,4-Trimethylbenzene 0.4
Benzene 0.5 sec-Butylbenzene 0.3
1,2-Dichloroethane 0.2 p-Isopropyltoluene 0.5
Trichloroethylene 0.3 1,3-Dichlorobenzene 0.2
Dibromomethane 0.4 1,4-Dichlorobenzene 0.4
1,2-Dichloropropane 0.4 n-Butylbenzene 0.3
Bromodichloromethane 0.2 1,2-Dichlorobenzene 0.3
1,4-Dioxane Not
provided
1,2-Dibromo-3-chloropropane 0.4
cis-1,3-Dichloropropene 0.3 Hexachlorobutadiene 0.3
Toluene 1.3 1,2,4-Trichlorobenzene 1.5
Tetrachloroethylene 0.2 Naphthalene 0.3
4-Methyl-2-pentanone 0.6 1,2,3-Trichlorobenzene 0.5
trans-1,3-Dichloropropene 0.3 Diethyl ether 0.9
2-Hexanone 0.7
431.02 01/30/2003 Rev. 11
ENGINEERING DESIGN FILE EDF-2606Revision 1
Page 37 of 61
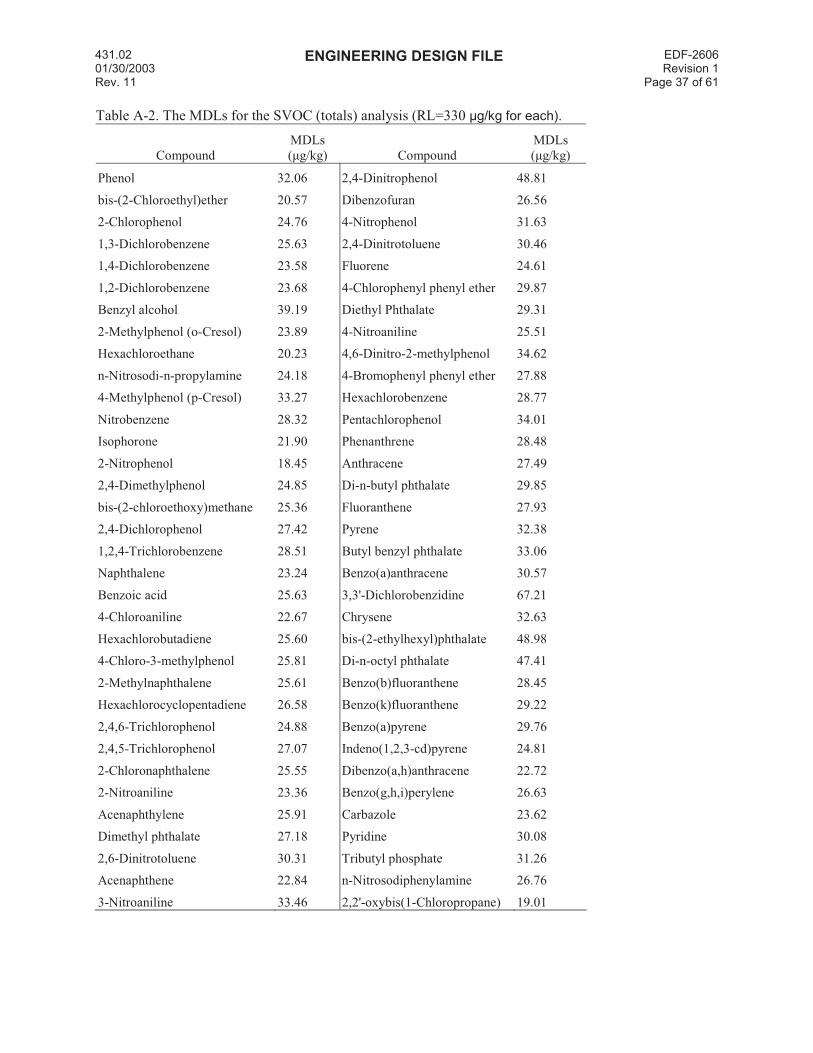
Table A-2. The MDLs for the SVOC (totals) analysis (RL=330 µg/kg for each).
Compound
MDLs
(µg/kg) Compound
MDLs
(µg/kg)
Phenol 32.06 2,4-Dinitrophenol 48.81
bis-(2-Chloroethyl)ether 20.57 Dibenzofuran 26.56
2-Chlorophenol 24.76 4-Nitrophenol 31.63
1,3-Dichlorobenzene 25.63 2,4-Dinitrotoluene 30.46
1,4-Dichlorobenzene 23.58 Fluorene 24.61
1,2-Dichlorobenzene 23.68 4-Chlorophenyl phenyl ether 29.87
Benzyl alcohol 39.19 Diethyl Phthalate 29.31
2-Methylphenol (o-Cresol) 23.89 4-Nitroaniline 25.51
Hexachloroethane 20.23 4,6-Dinitro-2-methylphenol 34.62
n-Nitrosodi-n-propylamine 24.18 4-Bromophenyl phenyl ether 27.88
4-Methylphenol (p-Cresol) 33.27 Hexachlorobenzene 28.77
Nitrobenzene 28.32 Pentachlorophenol 34.01
Isophorone 21.90 Phenanthrene 28.48
2-Nitrophenol 18.45 Anthracene 27.49
2,4-Dimethylphenol 24.85 Di-n-butyl phthalate 29.85
bis-(2-chloroethoxy)methane 25.36 Fluoranthene 27.93
2,4-Dichlorophenol 27.42 Pyrene 32.38
1,2,4-Trichlorobenzene 28.51 Butyl benzyl phthalate 33.06
Naphthalene 23.24 Benzo(a)anthracene 30.57
Benzoic acid 25.63 3,3'-Dichlorobenzidine 67.21
4-Chloroaniline 22.67 Chrysene 32.63
Hexachlorobutadiene 25.60 bis-(2-ethylhexyl)phthalate 48.98
4-Chloro-3-methylphenol 25.81 Di-n-octyl phthalate 47.41
2-Methylnaphthalene 25.61 Benzo(b)fluoranthene 28.45
Hexachlorocyclopentadiene 26.58 Benzo(k)fluoranthene 29.22
2,4,6-Trichlorophenol 24.88 Benzo(a)pyrene 29.76
2,4,5-Trichlorophenol 27.07 Indeno(1,2,3-cd)pyrene 24.81
2-Chloronaphthalene 25.55 Dibenzo(a,h)anthracene 22.72
2-Nitroaniline 23.36 Benzo(g,h,i)perylene 26.63
Acenaphthylene 25.91 Carbazole 23.62
Dimethyl phthalate 27.18 Pyridine 30.08
2,6-Dinitrotoluene 30.31 Tributyl phosphate 31.26
Acenaphthene 22.84 n-Nitrosodiphenylamine 26.76
3-Nitroaniline 33.46 2,2'-oxybis(1-Chloropropane) 19.01
431.02 01/30/2003 Rev. 11
ENGINEERING DESIGN FILE EDF-2606Revision 1
Page 38 of 61
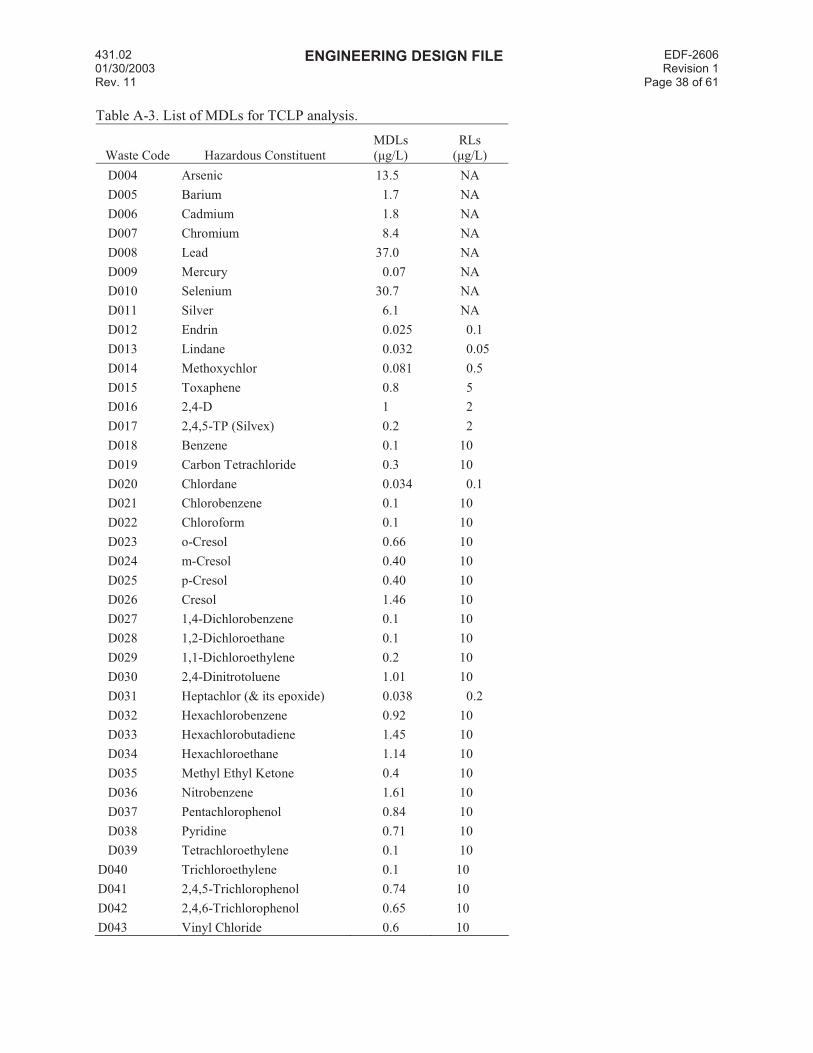
Table A-3. List of MDLs for TCLP analysis.
Waste Code Hazardous Constituent
MDLs
(µg/L)
RLs
(µg/L)
D004 Arsenic 13.5 NA
D005 Barium 1.7 NA
D006 Cadmium 1.8 NA
D007 Chromium 8.4 NA
D008 Lead 37.0 NA
D009 Mercury 0.07 NA
D010 Selenium 30.7 NA
D011 Silver 6.1 NA
D012 Endrin 0.025 0.1
D013 Lindane 0.032 0.05
D014 Methoxychlor 0.081 0.5
D015 Toxaphene 0.8 5
D016 2,4-D 1 2
D017 2,4,5-TP (Silvex) 0.2 2
D018 Benzene 0.1 10
D019 Carbon Tetrachloride 0.3 10
D020 Chlordane 0.034 0.1
D021 Chlorobenzene 0.1 10
D022 Chloroform 0.1 10
D023 o-Cresol 0.66 10
D024 m-Cresol 0.40 10
D025 p-Cresol 0.40 10
D026 Cresol 1.46 10
D027 1,4-Dichlorobenzene 0.1 10
D028 1,2-Dichloroethane 0.1 10
D029 1,1-Dichloroethylene 0.2 10
D030 2,4-Dinitrotoluene 1.01 10
D031 Heptachlor (& its epoxide) 0.038 0.2
D032 Hexachlorobenzene 0.92 10
D033 Hexachlorobutadiene 1.45 10
D034 Hexachloroethane 1.14 10
D035 Methyl Ethyl Ketone 0.4 10
D036 Nitrobenzene 1.61 10
D037 Pentachlorophenol 0.84 10
D038 Pyridine 0.71 10
D039 Tetrachloroethylene 0.1 10
D040 Trichloroethylene 0.1 10
D041 2,4,5-Trichlorophenol 0.74 10
D042 2,4,6-Trichlorophenol 0.65 10
D043 Vinyl Chloride 0.6 10
431.02 01/30/2003 Rev. 11
ENGINEERING DESIGN FILE EDF-2606Revision 1
Page 39 of 61
Appendix B
Source of MDLs for the Analytes of Interest and Correspondence

431.02 01/30/2003 Rev. 11
ENGINEERING DESIGN FILE EDF-2606Revision 1
Page 40 of 61
This page intentionally left blank.
431.02 01/30/2003 Rev. 11
ENGINEERING DESIGN FILE EDF-2606Revision 1
Page 41 of 61
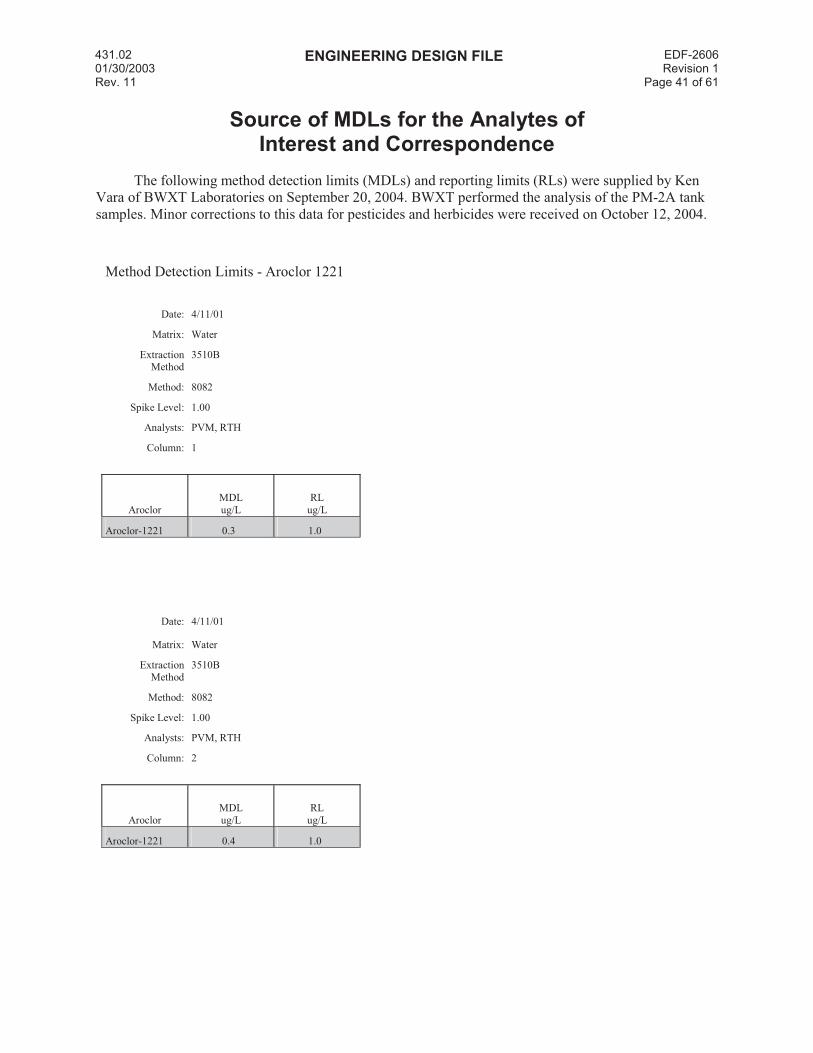
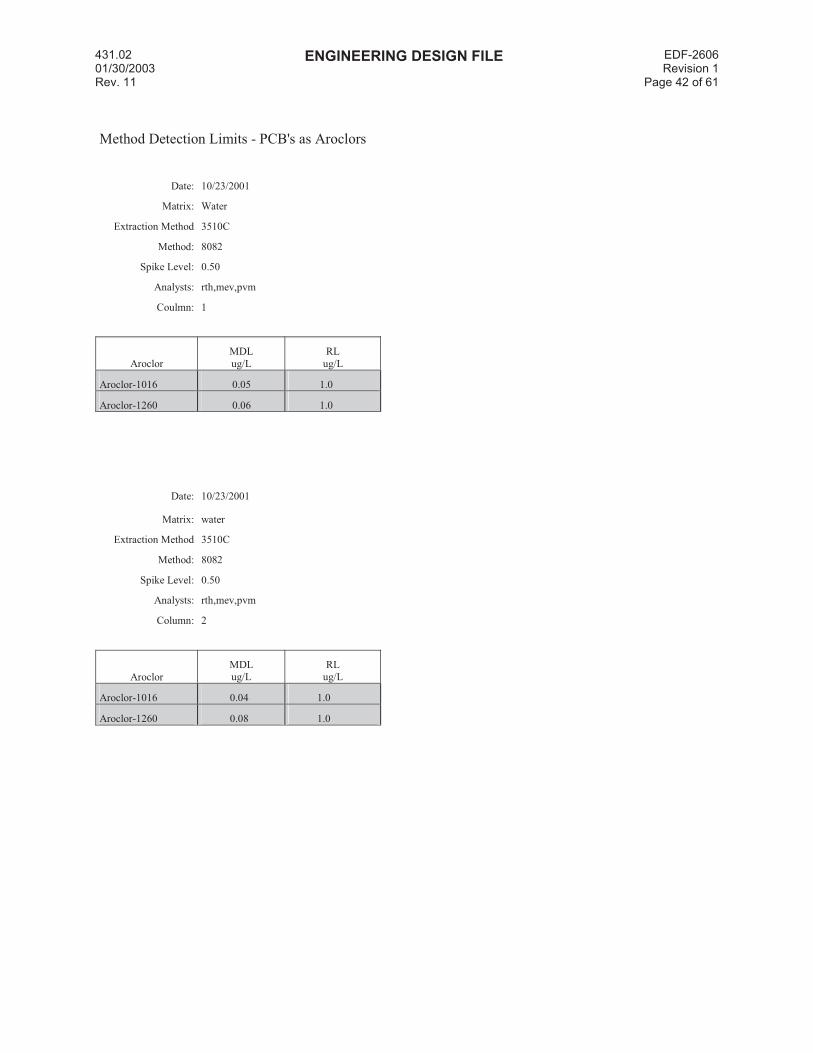
Source of MDLs for the Analytes of Interest and Correspondence
The following method detection limits (MDLs) and reporting limits (RLs) were supplied by Ken
Vara of BWXT Laboratories on September 20, 2004. BWXT performed the analysis of the PM-2A tank
samples. Minor corrections to this data for pesticides and herbicides were received on October 12, 2004.
Method Detection Limits - Aroclor 1221
Date: 4/11/01
Matrix: Water
Extraction Method
3510B
Method: 8082
Spike Level: 1.00
Analysts: PVM, RTH
Column: 1
Aroclor
MDL
ug/L
RL
ug/L
Aroclor-1221 0.3 1.0
Date: 4/11/01
Matrix: Water
Extraction Method
3510B
Method: 8082
Spike Level: 1.00
Analysts: PVM, RTH
Column: 2
Aroclor
MDL
ug/L
RL
ug/L
Aroclor-1221 0.4 1.0
431.02 01/30/2003 Rev. 11
ENGINEERING DESIGN FILE EDF-2606Revision 1
Page 42 of 61
Method Detection Limits - PCB's as Aroclors
Date: 10/23/2001
Matrix: Water
Extraction Method 3510C
Method: 8082
Spike Level: 0.50
Analysts: rth,mev,pvm
Coulmn: 1
Aroclor
MDL
ug/L
RL
ug/L
Aroclor-1016 0.05 1.0
Aroclor-1260 0.06 1.0
Date: 10/23/2001
Matrix: water
Extraction Method 3510C
Method: 8082
Spike Level: 0.50
Analysts: rth,mev,pvm
Column: 2
Aroclor
MDL ug/L
RL ug/L
Aroclor-1016 0.04 1.0
Aroclor-1260 0.08 1.0
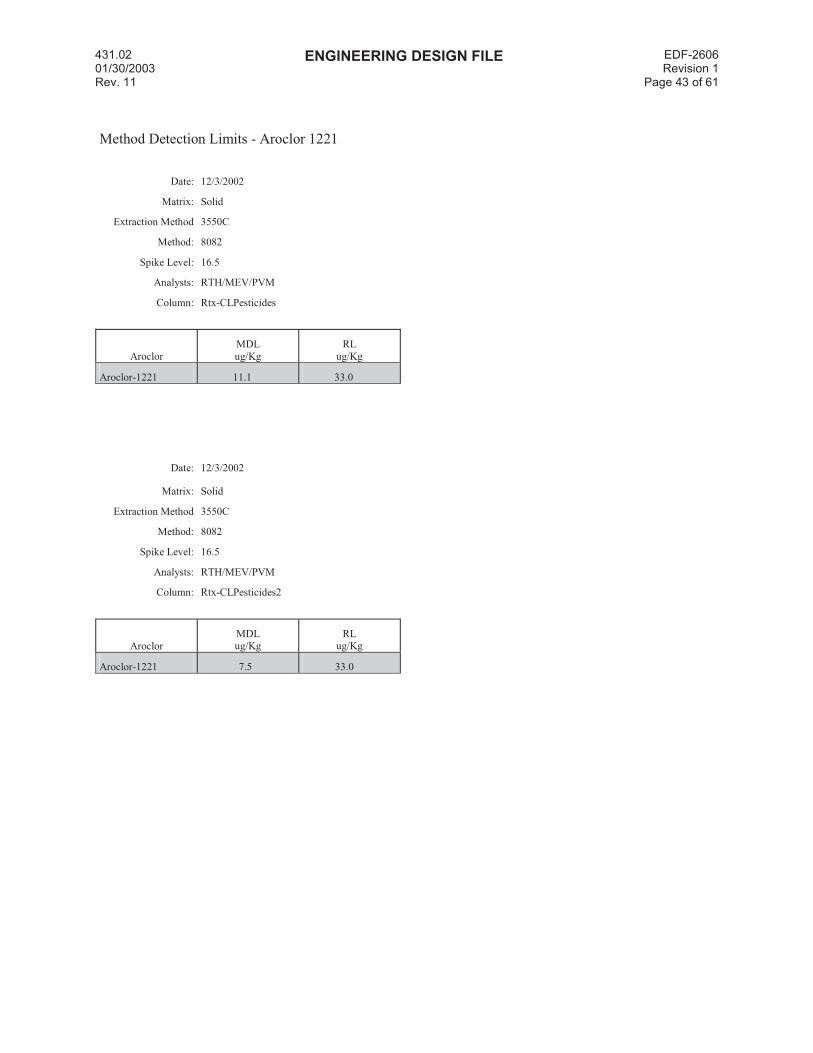
431.02 01/30/2003 Rev. 11
ENGINEERING DESIGN FILE EDF-2606Revision 1
Page 43 of 61
Method Detection Limits - Aroclor 1221
Date: 12/3/2002
Matrix: Solid
Extraction Method 3550C
Method: 8082
Spike Level: 16.5
Analysts: RTH/MEV/PVM
Column: Rtx-CLPesticides
Aroclor
MDL
ug/Kg
RL
ug/Kg
Aroclor-1221 11.1 33.0
Date: 12/3/2002
Matrix: Solid
Extraction Method 3550C
Method: 8082
Spike Level: 16.5
Analysts: RTH/MEV/PVM
Column: Rtx-CLPesticides2
Aroclor
MDL ug/Kg
RL ug/Kg
Aroclor-1221 7.5 33.0

431.02 01/30/2003 Rev. 11
ENGINEERING DESIGN FILE EDF-2606Revision 1
Page 44 of 61
Method Detection Limits - Aroclor 1232
Date: 12/9/2002
Matrix: Solid
Extraction Method 3550C
Method: 8082
Spike Level: 16.5
Analysts: RTH/MEV/PVM
Column: Rtx-CLPesticides
Aroclor
MDL
ug/Kg
RL
ug/Kg
Aroclor-1232 4.2 33.0
Date: 12/9/2002
Matrix: Solid
Extraction Method 3550C
Method: 8082
Spike Level: 16.5
Analysts: RTH/MEV/PVM
Column: Rtx-CLPesticides2
Aroclor
MDL ug/Kg
RL ug/Kg
Aroclor-1232 2.5 33.0

431.02 01/30/2003 Rev. 11
ENGINEERING DESIGN FILE EDF-2606Revision 1
Page 45 of 61
Method Detection Limits - Aroclor 1242
Date: 12/9/2002
Matrix: Solid
Extraction Method 3550C
Method: 8082
Spike Level: 16.5
Analysts: RTH/MEV/PVM
Column: Rtx-CLPesticides
Aroclor
MDL
ug/Kg
RL
ug/Kg
Aroclor-1242 4.4 33.0
Date: 12/9/2002
Matrix: Solid
Extraction Method 3550C
Method: 8082
Spike Level: 16.5
Analysts: RTH/MEV/PVM
Column: Rtx-CLPesticides2
Aroclor
MDL ug/Kg
RL ug/Kg
Aroclor-1242 5.0 33.0

431.02 01/30/2003 Rev. 11
ENGINEERING DESIGN FILE EDF-2606Revision 1
Page 46 of 61
Method Detection Limits - Aroclor 1248
Date: 12/11/2002
Matrix: Solid
Extraction Method 3550C
Method: 8082
Spike Level: 16.5
Analysts: RTH/MEV/PVM
Column: Rtx-CLPesticides
Aroclor
MDL
ug/Kg
RL
ug/Kg
Aroclor-1248 14.5 33.0
Date: 12/11/2002
Matrix: Solid
Extraction Method 3550C
Method: 8082
Spike Level: 16.5
Analysts: RTH/MEV/PVM
Column: Rtx-CLPesticides2
Aroclor
MDL ug/Kg
RL ug/Kg
Aroclor-1248 16.1 33.0

431.02 01/30/2003 Rev. 11
ENGINEERING DESIGN FILE EDF-2606Revision 1
Page 47 of 61
Method Detection Limits - Aroclor 1254
Date: 12/11/2002
Matrix: Solid
Extraction Method 3550C
Method: 8082
Spike Level: 16.5
Analysts: RTH/MEV/PVM
Column: Rtx-CLPesticides
Aroclor
MDL
ug/Kg
RL
ug/Kg
Aroclor-1254 14.5 33.0
Date: 12/11/2002
Matrix: Solid
Extraction Method 3550C
Method: 8082
Spike Level: 16.5
Analysts: RTH/MEV/PVM
Column: Rtx-CLPesticides2
Aroclor
MDL ug/Kg
RL ug/Kg
Aroclor-1254 13.8 33.0
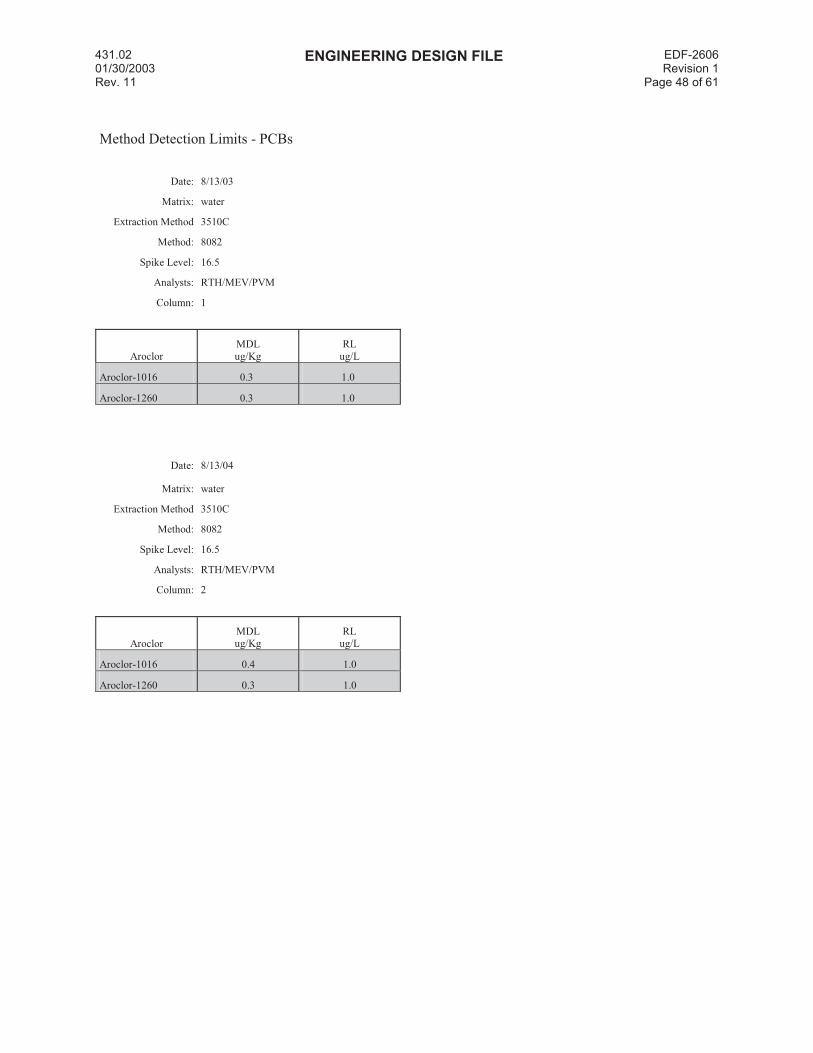
431.02 01/30/2003 Rev. 11
ENGINEERING DESIGN FILE EDF-2606Revision 1
Page 48 of 61
Method Detection Limits - PCBs
Date: 8/13/03
Matrix: water
Extraction Method 3510C
Method: 8082
Spike Level: 16.5
Analysts: RTH/MEV/PVM
Column: 1
Aroclor
MDL
ug/Kg
RL
ug/L
Aroclor-1016 0.3 1.0
Aroclor-1260 0.3 1.0
Date: 8/13/04
Matrix: water
Extraction Method 3510C
Method: 8082
Spike Level: 16.5
Analysts: RTH/MEV/PVM
Column: 2
Aroclor
MDL ug/Kg
RL ug/L
Aroclor-1016 0.4 1.0
Aroclor-1260 0.3 1.0
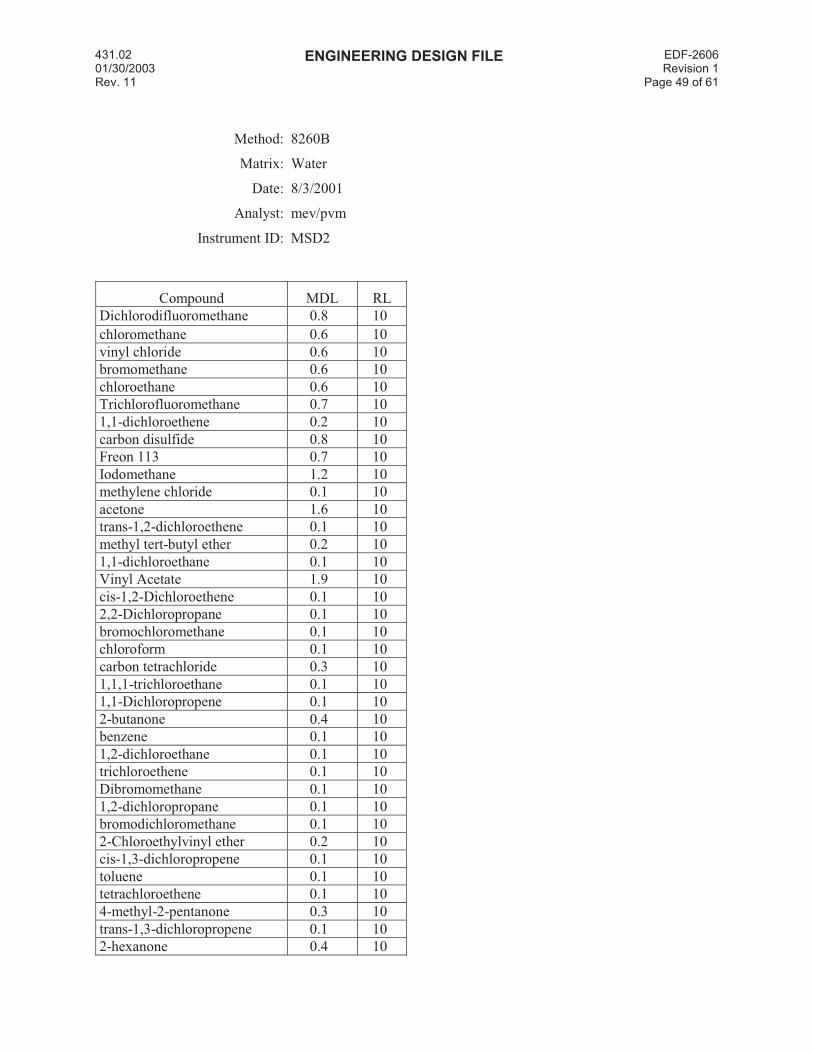
431.02 01/30/2003 Rev. 11
ENGINEERING DESIGN FILE EDF-2606Revision 1
Page 49 of 61
Method: 8260B
Matrix: Water
Date: 8/3/2001
Analyst: mev/pvm
Instrument ID: MSD2
Compound MDL RL
Dichlorodifluoromethane 0.8 10
chloromethane 0.6 10
vinyl chloride 0.6 10
bromomethane 0.6 10
chloroethane 0.6 10
Trichlorofluoromethane 0.7 10
1,1-dichloroethene 0.2 10
carbon disulfide 0.8 10
Freon 113 0.7 10
Iodomethane 1.2 10
methylene chloride 0.1 10
acetone 1.6 10
trans-1,2-dichloroethene 0.1 10
methyl tert-butyl ether 0.2 10
1,1-dichloroethane 0.1 10
Vinyl Acetate 1.9 10
cis-1,2-Dichloroethene 0.1 10
2,2-Dichloropropane 0.1 10
bromochloromethane 0.1 10
chloroform 0.1 10
carbon tetrachloride 0.3 10
1,1,1-trichloroethane 0.1 10
1,1-Dichloropropene 0.1 10
2-butanone 0.4 10
benzene 0.1 10
1,2-dichloroethane 0.1 10
trichloroethene 0.1 10
Dibromomethane 0.1 10
1,2-dichloropropane 0.1 10
bromodichloromethane 0.1 10
2-Chloroethylvinyl ether 0.2 10
cis-1,3-dichloropropene 0.1 10
toluene 0.1 10
tetrachloroethene 0.1 10
4-methyl-2-pentanone 0.3 10
trans-1,3-dichloropropene 0.1 10
2-hexanone 0.4 10
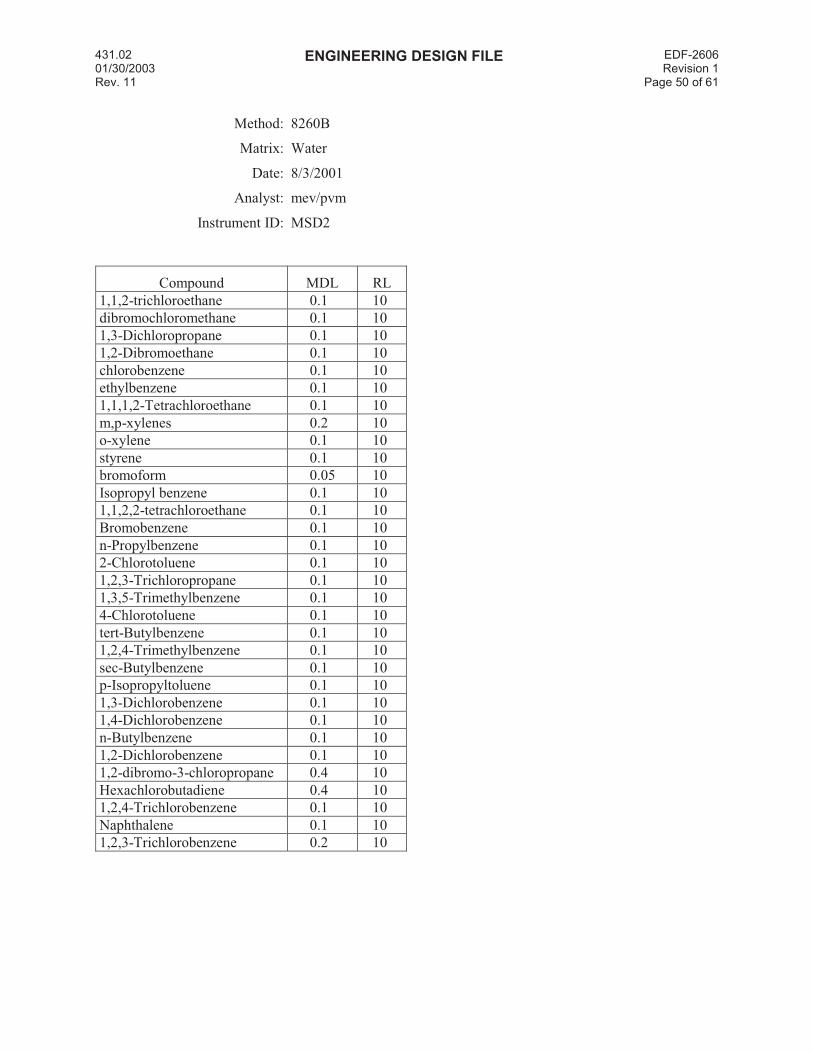
431.02 01/30/2003 Rev. 11
ENGINEERING DESIGN FILE EDF-2606Revision 1
Page 50 of 61
Method: 8260B
Matrix: Water
Date: 8/3/2001
Analyst: mev/pvm
Instrument ID: MSD2
Compound MDL RL
1,1,2-trichloroethane 0.1 10
dibromochloromethane 0.1 10
1,3-Dichloropropane 0.1 10
1,2-Dibromoethane 0.1 10
chlorobenzene 0.1 10
ethylbenzene 0.1 10
1,1,1,2-Tetrachloroethane 0.1 10
m,p-xylenes 0.2 10
o-xylene 0.1 10
styrene 0.1 10
bromoform 0.05 10
Isopropyl benzene 0.1 10
1,1,2,2-tetrachloroethane 0.1 10
Bromobenzene 0.1 10
n-Propylbenzene 0.1 10
2-Chlorotoluene 0.1 10
1,2,3-Trichloropropane 0.1 10
1,3,5-Trimethylbenzene 0.1 10
4-Chlorotoluene 0.1 10
tert-Butylbenzene 0.1 10
1,2,4-Trimethylbenzene 0.1 10
sec-Butylbenzene 0.1 10
p-Isopropyltoluene 0.1 10
1,3-Dichlorobenzene 0.1 10
1,4-Dichlorobenzene 0.1 10
n-Butylbenzene 0.1 10
1,2-Dichlorobenzene 0.1 10
1,2-dibromo-3-chloropropane 0.4 10
Hexachlorobutadiene 0.4 10
1,2,4-Trichlorobenzene 0.1 10
Naphthalene 0.1 10
1,2,3-Trichlorobenzene 0.2 10
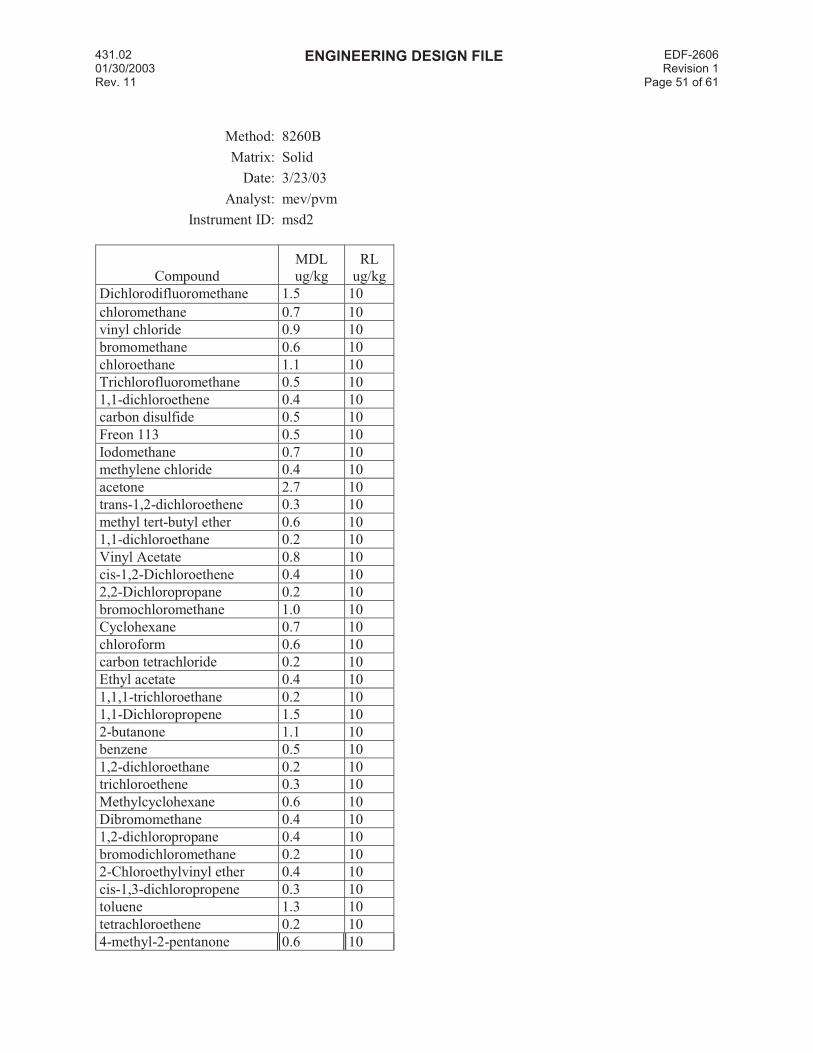
431.02 01/30/2003 Rev. 11
ENGINEERING DESIGN FILE EDF-2606Revision 1
Page 51 of 61
Method: 8260B
Matrix: Solid
Date: 3/23/03
Analyst: mev/pvm
Instrument ID: msd2
Compound
MDL
ug/kg
RL
ug/kg
Dichlorodifluoromethane 1.5 10
chloromethane 0.7 10
vinyl chloride 0.9 10
bromomethane 0.6 10
chloroethane 1.1 10
Trichlorofluoromethane 0.5 10
1,1-dichloroethene 0.4 10
carbon disulfide 0.5 10
Freon 113 0.5 10
Iodomethane 0.7 10
methylene chloride 0.4 10
acetone 2.7 10
trans-1,2-dichloroethene 0.3 10
methyl tert-butyl ether 0.6 10
1,1-dichloroethane 0.2 10
Vinyl Acetate 0.8 10
cis-1,2-Dichloroethene 0.4 10
2,2-Dichloropropane 0.2 10
bromochloromethane 1.0 10
Cyclohexane 0.7 10
chloroform 0.6 10
carbon tetrachloride 0.2 10
Ethyl acetate 0.4 10
1,1,1-trichloroethane 0.2 10
1,1-Dichloropropene 1.5 10
2-butanone 1.1 10
benzene 0.5 10
1,2-dichloroethane 0.2 10
trichloroethene 0.3 10
Methylcyclohexane 0.6 10
Dibromomethane 0.4 10
1,2-dichloropropane 0.4 10
bromodichloromethane 0.2 10
2-Chloroethylvinyl ether 0.4 10
cis-1,3-dichloropropene 0.3 10
toluene 1.3 10
tetrachloroethene 0.2 10
4-methyl-2-pentanone 0.6 10
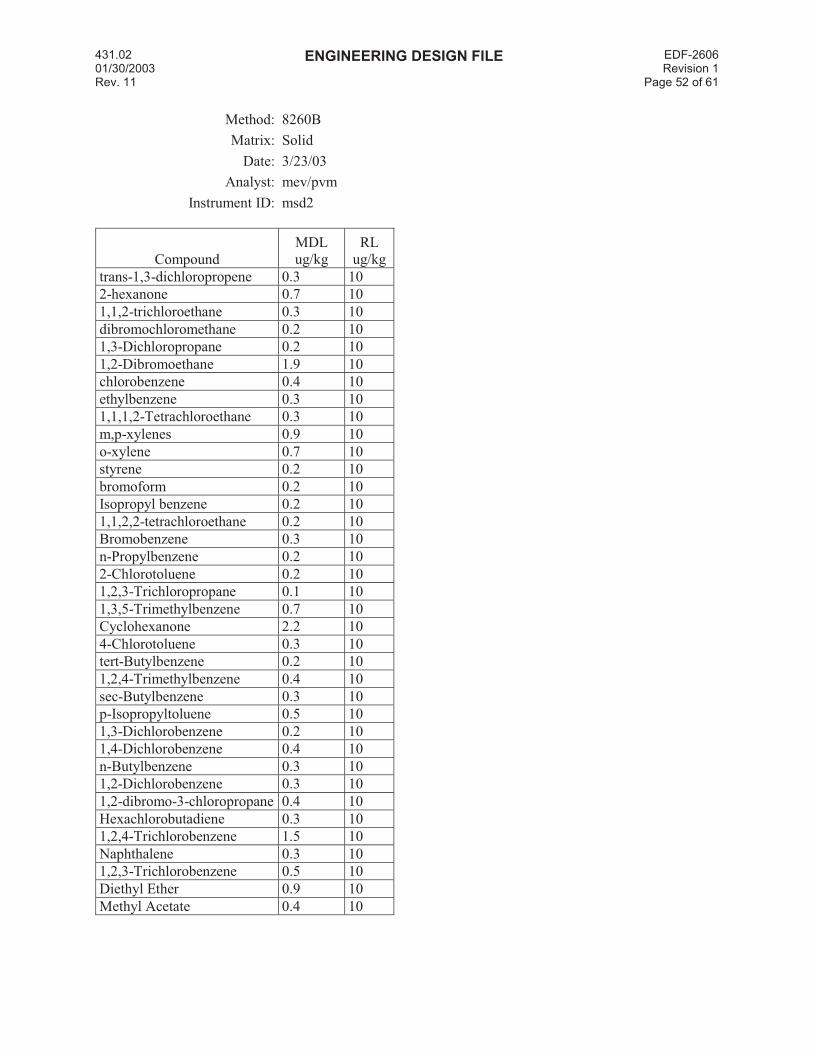
431.02 01/30/2003 Rev. 11
ENGINEERING DESIGN FILE EDF-2606Revision 1
Page 52 of 61
Method: 8260B
Matrix: Solid
Date: 3/23/03
Analyst: mev/pvm
Instrument ID: msd2
Compound
MDL
ug/kg
RL
ug/kg
trans-1,3-dichloropropene 0.3 10
2-hexanone 0.7 10
1,1,2-trichloroethane 0.3 10
dibromochloromethane 0.2 10
1,3-Dichloropropane 0.2 10
1,2-Dibromoethane 1.9 10
chlorobenzene 0.4 10
ethylbenzene 0.3 10
1,1,1,2-Tetrachloroethane 0.3 10
m,p-xylenes 0.9 10
o-xylene 0.7 10
styrene 0.2 10
bromoform 0.2 10
Isopropyl benzene 0.2 10
1,1,2,2-tetrachloroethane 0.2 10
Bromobenzene 0.3 10
n-Propylbenzene 0.2 10
2-Chlorotoluene 0.2 10
1,2,3-Trichloropropane 0.1 10
1,3,5-Trimethylbenzene 0.7 10
Cyclohexanone 2.2 10
4-Chlorotoluene 0.3 10
tert-Butylbenzene 0.2 10
1,2,4-Trimethylbenzene 0.4 10
sec-Butylbenzene 0.3 10
p-Isopropyltoluene 0.5 10
1,3-Dichlorobenzene 0.2 10
1,4-Dichlorobenzene 0.4 10
n-Butylbenzene 0.3 10
1,2-Dichlorobenzene 0.3 10
1,2-dibromo-3-chloropropane 0.4 10
Hexachlorobutadiene 0.3 10
1,2,4-Trichlorobenzene 1.5 10
Naphthalene 0.3 10
1,2,3-Trichlorobenzene 0.5 10
Diethyl Ether 0.9 10
Methyl Acetate 0.4 10
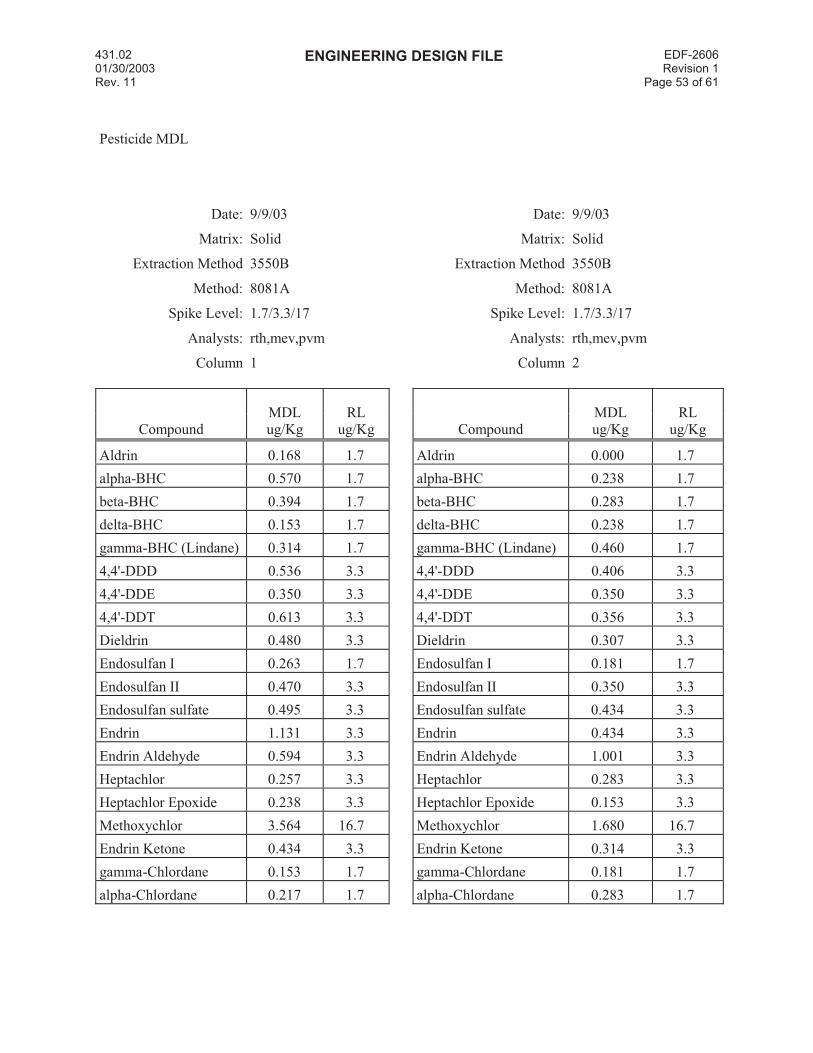
431.02 01/30/2003 Rev. 11
ENGINEERING DESIGN FILE EDF-2606Revision 1
Page 53 of 61
Pesticide MDL
Date: 9/9/03 Date: 9/9/03
Matrix: Solid Matrix: Solid
Extraction Method 3550B Extraction Method 3550B
Method: 8081A Method: 8081A
Spike Level: 1.7/3.3/17 Spike Level: 1.7/3.3/17
Analysts: rth,mev,pvm Analysts: rth,mev,pvm
Column 1 Column 2
Compound
MDL
ug/Kg
RL
ug/Kg Compound
MDL
ug/Kg
RL
ug/Kg
Aldrin 0.168 1.7 Aldrin 0.000 1.7
alpha-BHC 0.570 1.7 alpha-BHC 0.238 1.7
beta-BHC 0.394 1.7 beta-BHC 0.283 1.7
delta-BHC 0.153 1.7 delta-BHC 0.238 1.7
gamma-BHC (Lindane) 0.314 1.7 gamma-BHC (Lindane) 0.460 1.7
4,4'-DDD 0.536 3.3 4,4'-DDD 0.406 3.3
4,4'-DDE 0.350 3.3 4,4'-DDE 0.350 3.3
4,4'-DDT 0.613 3.3 4,4'-DDT 0.356 3.3
Dieldrin 0.480 3.3 Dieldrin 0.307 3.3
Endosulfan I 0.263 1.7 Endosulfan I 0.181 1.7
Endosulfan II 0.470 3.3 Endosulfan II 0.350 3.3
Endosulfan sulfate 0.495 3.3 Endosulfan sulfate 0.434 3.3
Endrin 1.131 3.3 Endrin 0.434 3.3
Endrin Aldehyde 0.594 3.3 Endrin Aldehyde 1.001 3.3
Heptachlor 0.257 3.3 Heptachlor 0.283 3.3
Heptachlor Epoxide 0.238 3.3 Heptachlor Epoxide 0.153 3.3
Methoxychlor 3.564 16.7 Methoxychlor 1.680 16.7
Endrin Ketone 0.434 3.3 Endrin Ketone 0.314 3.3
gamma-Chlordane 0.153 1.7 gamma-Chlordane 0.181 1.7
alpha-Chlordane 0.217 1.7 alpha-Chlordane 0.283 1.7
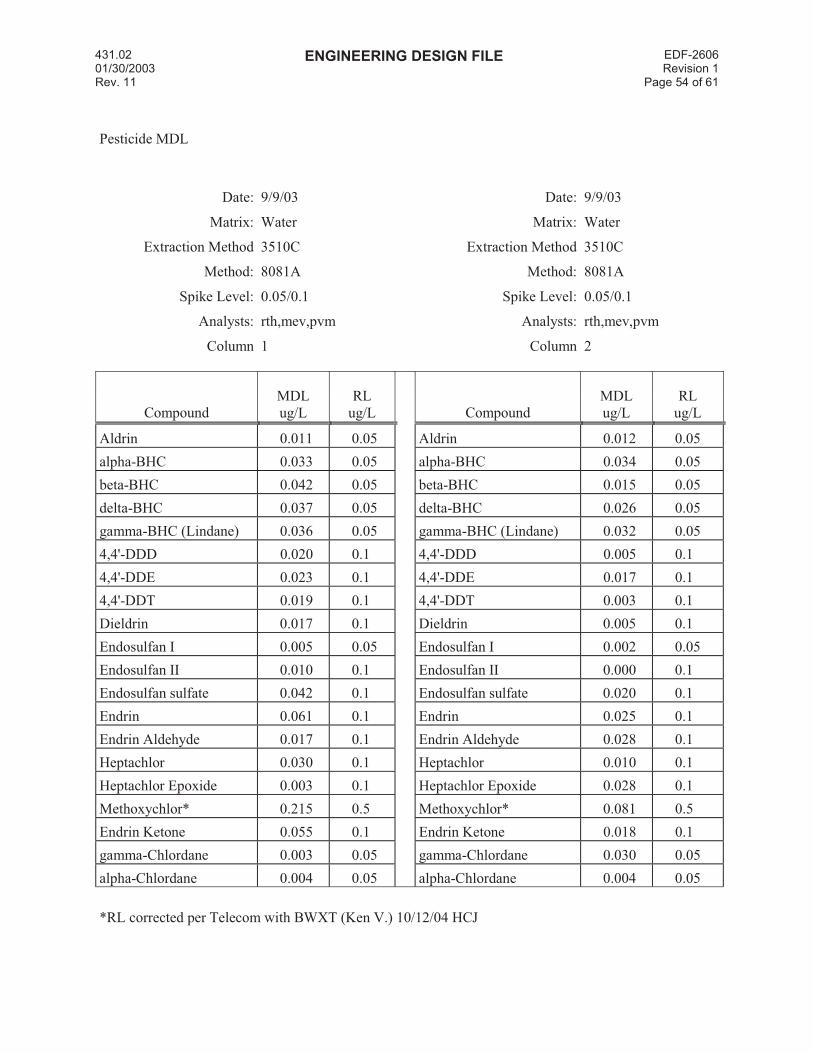
431.02 01/30/2003 Rev. 11
ENGINEERING DESIGN FILE EDF-2606Revision 1
Page 54 of 61
Pesticide MDL
Date: 9/9/03 Date: 9/9/03
Matrix: Water Matrix: Water
Extraction Method 3510C Extraction Method 3510C
Method: 8081A Method: 8081A
Spike Level: 0.05/0.1 Spike Level: 0.05/0.1
Analysts: rth,mev,pvm Analysts: rth,mev,pvm
Column 1 Column 2
Compound
MDL
ug/L
RL
ug/L Compound
MDL
ug/L
RL
ug/L
Aldrin 0.011 0.05 Aldrin 0.012 0.05
alpha-BHC 0.033 0.05 alpha-BHC 0.034 0.05
beta-BHC 0.042 0.05 beta-BHC 0.015 0.05
delta-BHC 0.037 0.05 delta-BHC 0.026 0.05
gamma-BHC (Lindane) 0.036 0.05 gamma-BHC (Lindane) 0.032 0.05
4,4'-DDD 0.020 0.1 4,4'-DDD 0.005 0.1
4,4'-DDE 0.023 0.1 4,4'-DDE 0.017 0.1
4,4'-DDT 0.019 0.1 4,4'-DDT 0.003 0.1
Dieldrin 0.017 0.1 Dieldrin 0.005 0.1
Endosulfan I 0.005 0.05 Endosulfan I 0.002 0.05
Endosulfan II 0.010 0.1 Endosulfan II 0.000 0.1
Endosulfan sulfate 0.042 0.1 Endosulfan sulfate 0.020 0.1
Endrin 0.061 0.1 Endrin 0.025 0.1
Endrin Aldehyde 0.017 0.1 Endrin Aldehyde 0.028 0.1
Heptachlor 0.030 0.1 Heptachlor 0.010 0.1
Heptachlor Epoxide 0.003 0.1 Heptachlor Epoxide 0.028 0.1
Methoxychlor* 0.215 0.5 Methoxychlor* 0.081 0.5
Endrin Ketone 0.055 0.1 Endrin Ketone 0.018 0.1
gamma-Chlordane 0.003 0.05 gamma-Chlordane 0.030 0.05
alpha-Chlordane 0.004 0.05 alpha-Chlordane 0.004 0.05
*RL corrected per Telecom with BWXT (Ken V.) 10/12/04 HCJ

431.02 01/30/2003 Rev. 11
ENGINEERING DESIGN FILE EDF-2606Revision 1
Page 55 of 61
Method Detection Limits - Toxaphene
Date: 9/9/03
Matrix: Water*
Extraction Method 3550C
Method: 8081A
Spike Level: 5.0
Analysts: RTH/MEV/PVM
Column: 1
Aroclor
MDL
ug/L
RL
ug/L
Toxaphene 0.7 5.0
Date: 9/9/03
Matrix: Water*
Extraction Method 3550C
Method: 8081A
Spike Level: 5.0
Analysts: RTH/MEV/PVM
Column: 2
Aroclor
MDL ug/L
RL ug/L
Toxaphene 0.8 5.0
*Corrected to Water per Telecom with BWXT. 10/12/04 HCJ
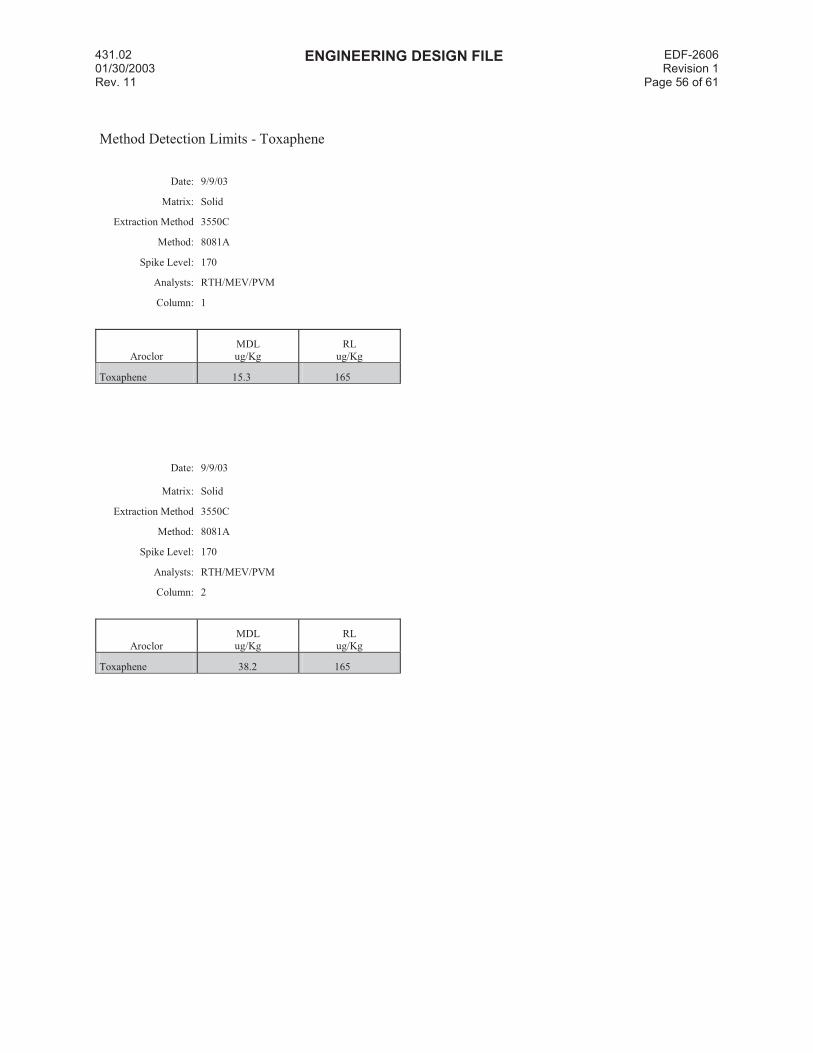
431.02 01/30/2003 Rev. 11
ENGINEERING DESIGN FILE EDF-2606Revision 1
Page 56 of 61
Method Detection Limits - Toxaphene
Date: 9/9/03
Matrix: Solid
Extraction Method 3550C
Method: 8081A
Spike Level: 170
Analysts: RTH/MEV/PVM
Column: 1
Aroclor
MDL
ug/Kg
RL
ug/Kg
Toxaphene 15.3 165
Date: 9/9/03
Matrix: Solid
Extraction Method 3550C
Method: 8081A
Spike Level: 170
Analysts: RTH/MEV/PVM
Column: 2
Aroclor
MDL ug/Kg
RL ug/Kg
Toxaphene 38.2 165
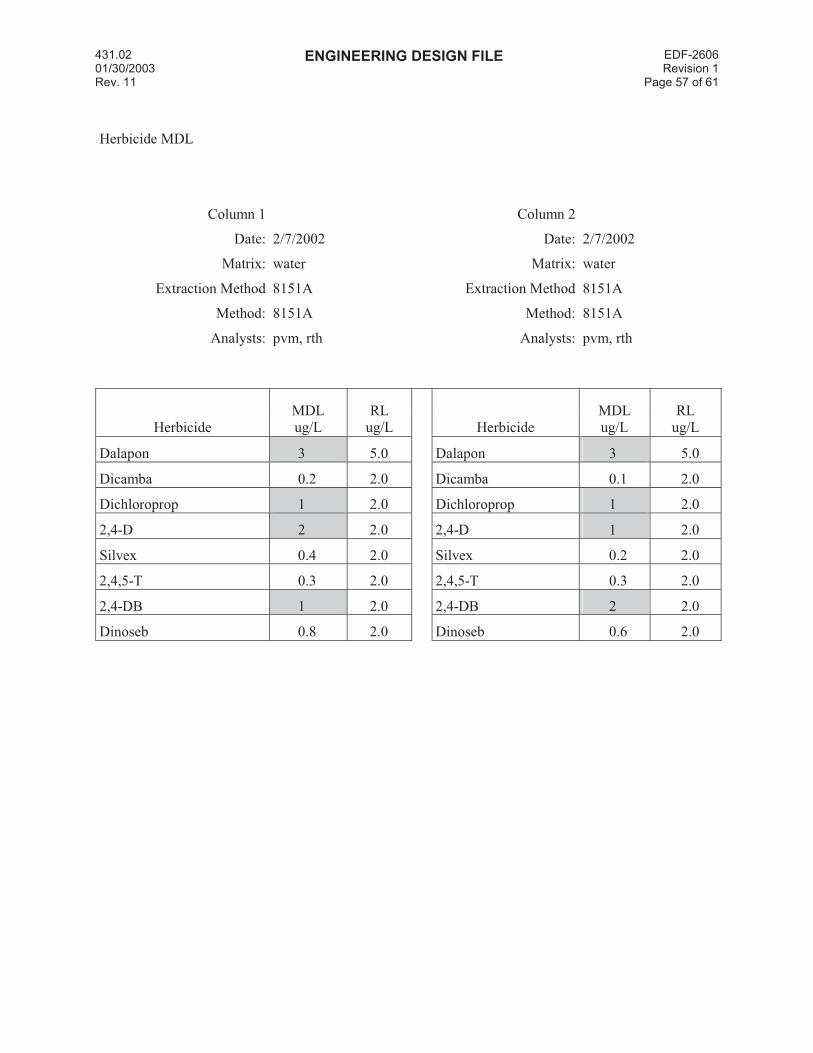
431.02 01/30/2003 Rev. 11
ENGINEERING DESIGN FILE EDF-2606Revision 1
Page 57 of 61
Herbicide MDL
Column 1 Column 2
Date: 2/7/2002 Date: 2/7/2002
Matrix: water Matrix: water
Extraction Method 8151A Extraction Method 8151A
Method: 8151A Method: 8151A
Analysts: pvm, rth Analysts: pvm, rth
Herbicide
MDL
ug/L
RL
ug/L Herbicide
MDL
ug/L
RL
ug/L
Dalapon 3 5.0 Dalapon 3 5.0
Dicamba 0.2 2.0 Dicamba 0.1 2.0
Dichloroprop 1 2.0 Dichloroprop 1 2.0
2,4-D 2 2.0 2,4-D 1 2.0
Silvex 0.4 2.0 Silvex 0.2 2.0
2,4,5-T 0.3 2.0 2,4,5-T 0.3 2.0
2,4-DB 1 2.0 2,4-DB 2 2.0
Dinoseb 0.8 2.0 Dinoseb 0.6 2.0
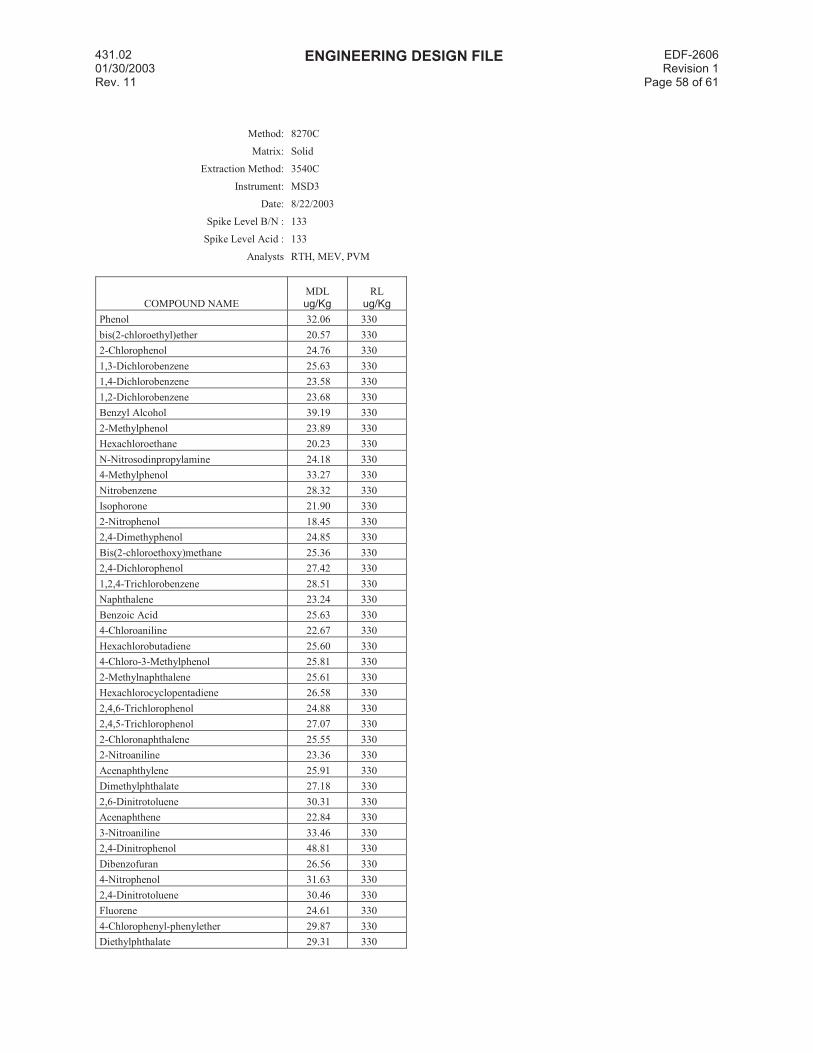
431.02 01/30/2003 Rev. 11
ENGINEERING DESIGN FILE EDF-2606Revision 1
Page 58 of 61
Method: 8270C
Matrix: Solid
Extraction Method: 3540C
Instrument: MSD3
Date: 8/22/2003
Spike Level B/N : 133
Spike Level Acid : 133
Analysts RTH, MEV, PVM
COMPOUND NAME
MDL
ug/KgRL
ug/Kg
Phenol 32.06 330
bis(2-chloroethyl)ether 20.57 330
2-Chlorophenol 24.76 330
1,3-Dichlorobenzene 25.63 330
1,4-Dichlorobenzene 23.58 330
1,2-Dichlorobenzene 23.68 330
Benzyl Alcohol 39.19 330
2-Methylphenol 23.89 330
Hexachloroethane 20.23 330
N-Nitrosodinpropylamine 24.18 330
4-Methylphenol 33.27 330
Nitrobenzene 28.32 330
Isophorone 21.90 330
2-Nitrophenol 18.45 330
2,4-Dimethyphenol 24.85 330
Bis(2-chloroethoxy)methane 25.36 330
2,4-Dichlorophenol 27.42 330
1,2,4-Trichlorobenzene 28.51 330
Naphthalene 23.24 330
Benzoic Acid 25.63 330
4-Chloroaniline 22.67 330
Hexachlorobutadiene 25.60 330
4-Chloro-3-Methylphenol 25.81 330
2-Methylnaphthalene 25.61 330
Hexachlorocyclopentadiene 26.58 330
2,4,6-Trichlorophenol 24.88 330
2,4,5-Trichlorophenol 27.07 330
2-Chloronaphthalene 25.55 330
2-Nitroaniline 23.36 330
Acenaphthylene 25.91 330
Dimethylphthalate 27.18 330
2,6-Dinitrotoluene 30.31 330
Acenaphthene 22.84 330
3-Nitroaniline 33.46 330
2,4-Dinitrophenol 48.81 330
Dibenzofuran 26.56 330
4-Nitrophenol 31.63 330
2,4-Dinitrotoluene 30.46 330
Fluorene 24.61 330
4-Chlorophenyl-phenylether 29.87 330
Diethylphthalate 29.31 330
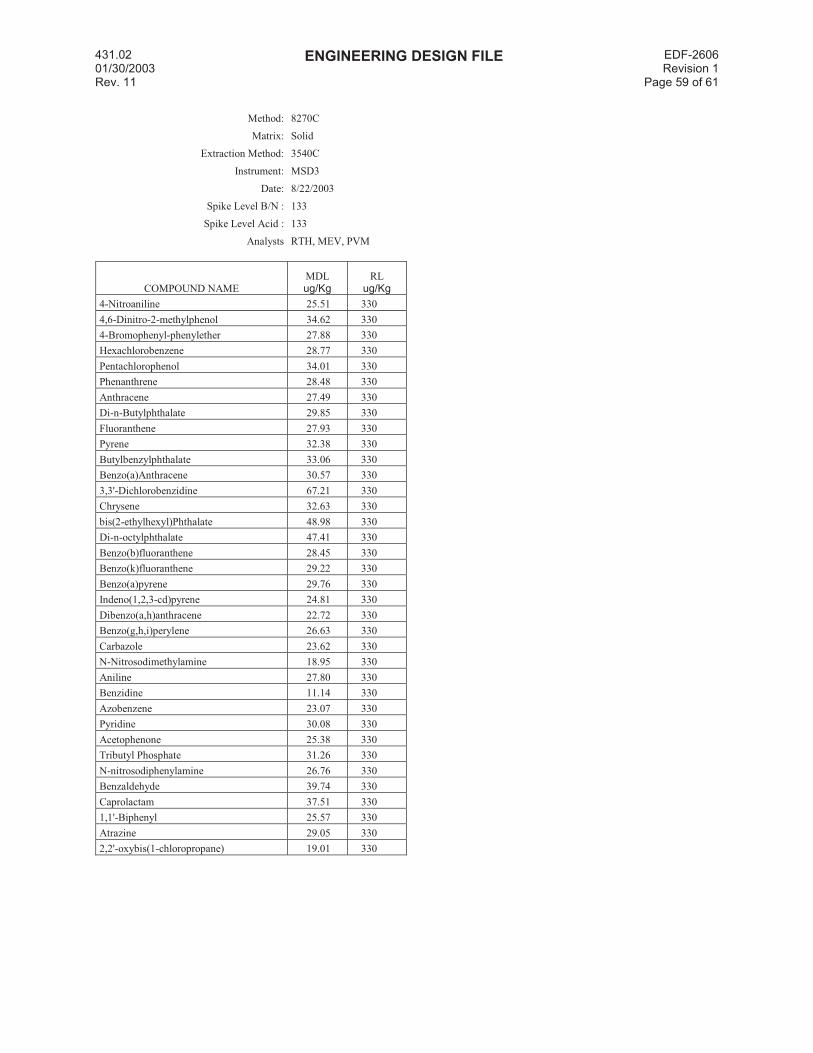
431.02 01/30/2003 Rev. 11
ENGINEERING DESIGN FILE EDF-2606Revision 1
Page 59 of 61
Method: 8270C
Matrix: Solid
Extraction Method: 3540C
Instrument: MSD3
Date: 8/22/2003
Spike Level B/N : 133
Spike Level Acid : 133
Analysts RTH, MEV, PVM
COMPOUND NAME
MDL
ug/KgRL
ug/Kg
4-Nitroaniline 25.51 330
4,6-Dinitro-2-methylphenol 34.62 330
4-Bromophenyl-phenylether 27.88 330
Hexachlorobenzene 28.77 330
Pentachlorophenol 34.01 330
Phenanthrene 28.48 330
Anthracene 27.49 330
Di-n-Butylphthalate 29.85 330
Fluoranthene 27.93 330
Pyrene 32.38 330
Butylbenzylphthalate 33.06 330
Benzo(a)Anthracene 30.57 330
3,3'-Dichlorobenzidine 67.21 330
Chrysene 32.63 330
bis(2-ethylhexyl)Phthalate 48.98 330
Di-n-octylphthalate 47.41 330
Benzo(b)fluoranthene 28.45 330
Benzo(k)fluoranthene 29.22 330
Benzo(a)pyrene 29.76 330
Indeno(1,2,3-cd)pyrene 24.81 330
Dibenzo(a,h)anthracene 22.72 330
Benzo(g,h,i)perylene 26.63 330
Carbazole 23.62 330
N-Nitrosodimethylamine 18.95 330
Aniline 27.80 330
Benzidine 11.14 330
Azobenzene 23.07 330
Pyridine 30.08 330
Acetophenone 25.38 330
Tributyl Phosphate 31.26 330
N-nitrosodiphenylamine 26.76 330
Benzaldehyde 39.74 330
Caprolactam 37.51 330
1,1'-Biphenyl 25.57 330
Atrazine 29.05 330
2,2'-oxybis(1-chloropropane) 19.01 330
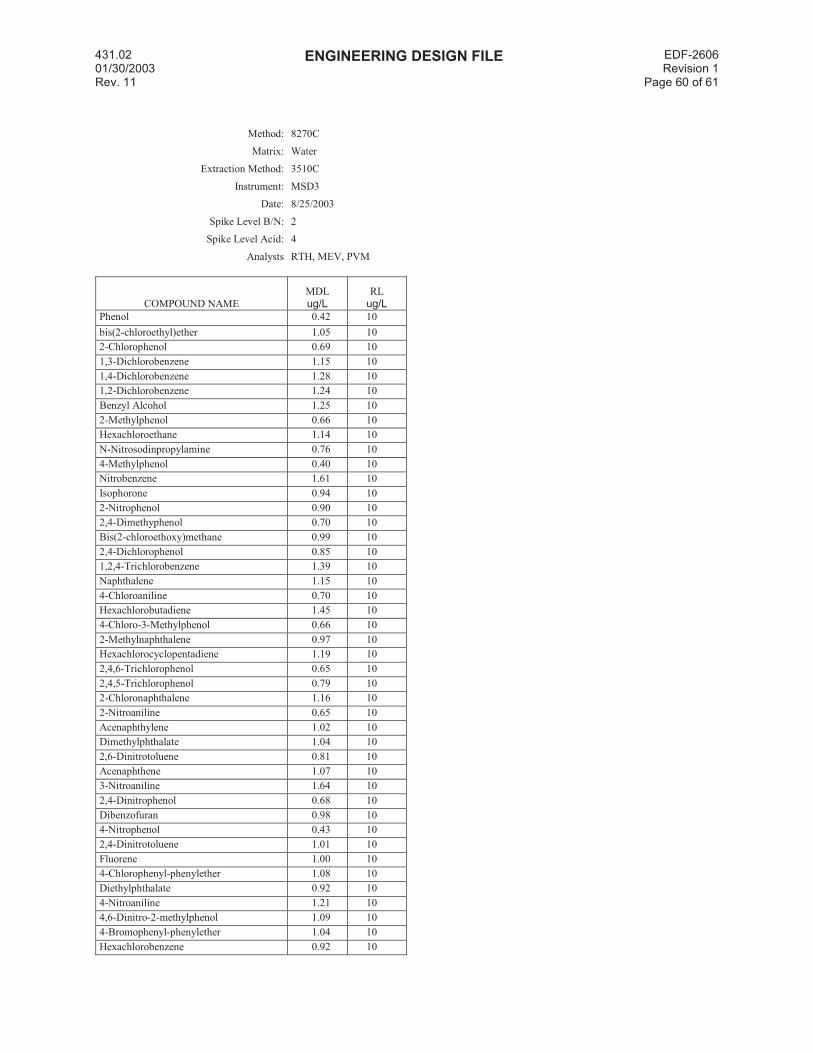
431.02 01/30/2003 Rev. 11
ENGINEERING DESIGN FILE EDF-2606Revision 1
Page 60 of 61
Method: 8270C
Matrix: Water
Extraction Method: 3510C
Instrument: MSD3
Date: 8/25/2003
Spike Level B/N: 2
Spike Level Acid: 4
Analysts RTH, MEV, PVM
COMPOUND NAME
MDL
ug/LRL
ug/L
Phenol 0.42 10
bis(2-chloroethyl)ether 1.05 10
2-Chlorophenol 0.69 10
1,3-Dichlorobenzene 1.15 10
1,4-Dichlorobenzene 1.28 10
1,2-Dichlorobenzene 1.24 10
Benzyl Alcohol 1.25 10
2-Methylphenol 0.66 10
Hexachloroethane 1.14 10
N-Nitrosodinpropylamine 0.76 10
4-Methylphenol 0.40 10
Nitrobenzene 1.61 10
Isophorone 0.94 10
2-Nitrophenol 0.90 10
2,4-Dimethyphenol 0.70 10
Bis(2-chloroethoxy)methane 0.99 10
2,4-Dichlorophenol 0.85 10
1,2,4-Trichlorobenzene 1.39 10
Naphthalene 1.15 10
4-Chloroaniline 0.70 10
Hexachlorobutadiene 1.45 10
4-Chloro-3-Methylphenol 0.66 10
2-Methylnaphthalene 0.97 10
Hexachlorocyclopentadiene 1.19 10
2,4,6-Trichlorophenol 0.65 10
2,4,5-Trichlorophenol 0.79 10
2-Chloronaphthalene 1.16 10
2-Nitroaniline 0.65 10
Acenaphthylene 1.02 10
Dimethylphthalate 1.04 10
2,6-Dinitrotoluene 0.81 10
Acenaphthene 1.07 10
3-Nitroaniline 1.64 10
2,4-Dinitrophenol 0.68 10
Dibenzofuran 0.98 10
4-Nitrophenol 0.43 10
2,4-Dinitrotoluene 1.01 10
Fluorene 1.00 10
4-Chlorophenyl-phenylether 1.08 10
Diethylphthalate 0.92 10
4-Nitroaniline 1.21 10
4,6-Dinitro-2-methylphenol 1.09 10
4-Bromophenyl-phenylether 1.04 10
Hexachlorobenzene 0.92 10
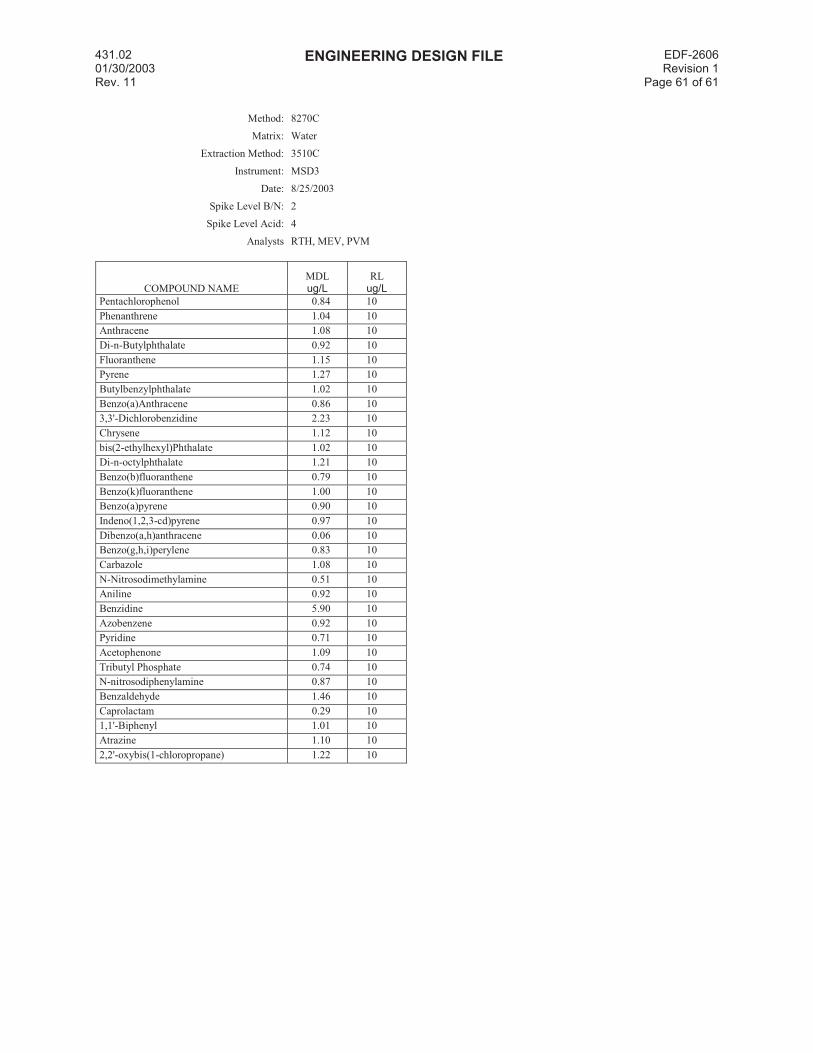
431.02 01/30/2003 Rev. 11
ENGINEERING DESIGN FILE EDF-2606Revision 1
Page 61 of 61
Method: 8270C
Matrix: Water
Extraction Method: 3510C
Instrument: MSD3
Date: 8/25/2003
Spike Level B/N: 2
Spike Level Acid: 4
Analysts RTH, MEV, PVM
COMPOUND NAME
MDL
ug/LRL
ug/L
Pentachlorophenol 0.84 10
Phenanthrene 1.04 10
Anthracene 1.08 10
Di-n-Butylphthalate 0.92 10
Fluoranthene 1.15 10
Pyrene 1.27 10
Butylbenzylphthalate 1.02 10
Benzo(a)Anthracene 0.86 10
3,3'-Dichlorobenzidine 2.23 10
Chrysene 1.12 10
bis(2-ethylhexyl)Phthalate 1.02 10
Di-n-octylphthalate 1.21 10
Benzo(b)fluoranthene 0.79 10
Benzo(k)fluoranthene 1.00 10
Benzo(a)pyrene 0.90 10
Indeno(1,2,3-cd)pyrene 0.97 10
Dibenzo(a,h)anthracene 0.06 10
Benzo(g,h,i)perylene 0.83 10
Carbazole 1.08 10
N-Nitrosodimethylamine 0.51 10
Aniline 0.92 10
Benzidine 5.90 10
Azobenzene 0.92 10
Pyridine 0.71 10
Acetophenone 1.09 10
Tributyl Phosphate 0.74 10
N-nitrosodiphenylamine 0.87 10
Benzaldehyde 1.46 10
Caprolactam 0.29 10
1,1'-Biphenyl 1.01 10
Atrazine 1.10 10
2,2'-oxybis(1-chloropropane) 1.22 10