Embed Size (px)
Citation preview
TABLE OF CONTENTS
PAGE
TOP STRATEGIES FOR ENERGY INTELLIGENCE
lnsresearch.com
CONNECT:
TOP STRATEGIES FOR ENERGY INTELLIGENCE
lnsresearch.com
TABLE OF CONTENTS
Executive Summary . . . . . . . . . . . . . . . . . . . . . . . . . . . . . . . . . . . . . . . . . . . . . . . . . . . . . . . . . . . . 3
Section 1: Mega-Trends Drive the Need for Energy Intelligence . . . . . . . . . . . . . . 5
Section 2: Individual Company Responses . . . . . . . . . . . . . . . . . . . . . . . . . . . . . . . . . . . . . 9
Section 3: Market Drivers for Energy Management . . . . . . . . . . . . . . . . . . . . . . . . . . . 14
Section 4: Challenges with Energy Management . . . . . . . . . . . . . . . . . . . . . . . . . . . . . 18
Section 5: Strategies for a Successful Energy Intelligence Solution . . . . . . . . . . 22
Section 6: Actionable Recommendations . . . . . . . . . . . . . . . . . . . . . . . . . . . . . . . . . . . . . 28
Executive Summary
4
TOP
STR
ATEG
IES
FOR
EN
ERGY
INTE
LLIG
ENCE
SECTION
TABLE OF CONTENTS
PAGE
135
246
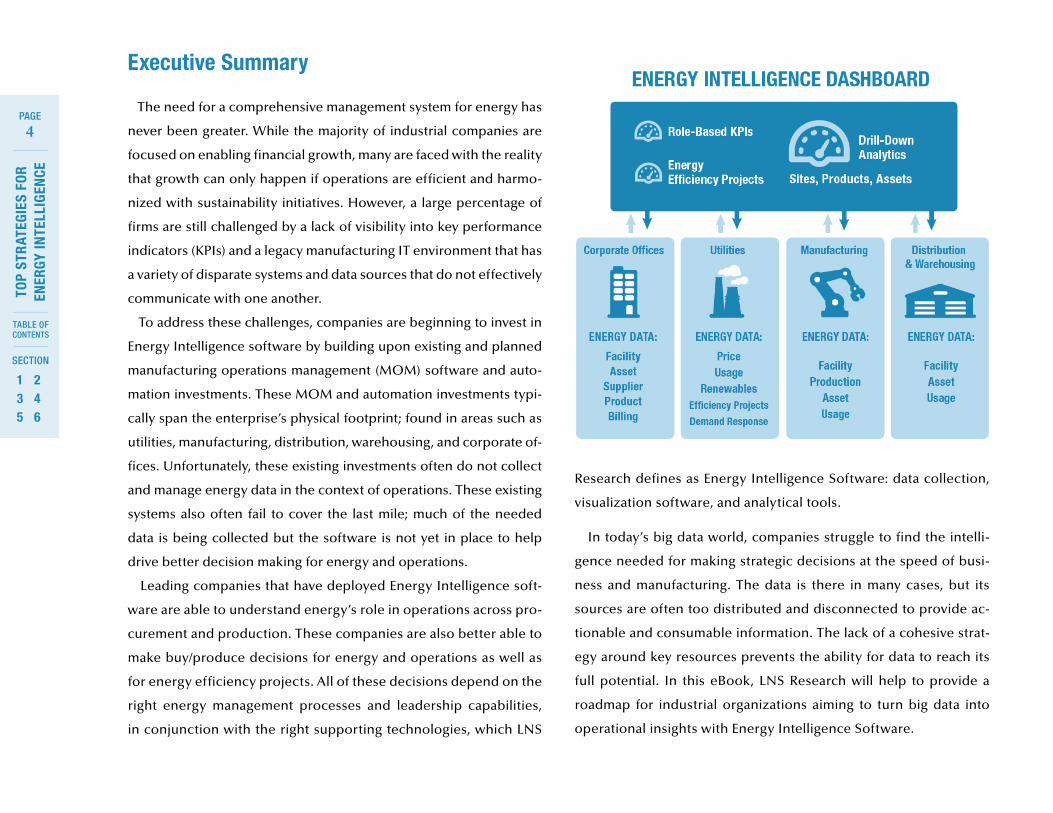
The need for a comprehensive management system for energy has
never been greater. While the majority of industrial companies are
focused on enabling financial growth, many are faced with the reality
that growth can only happen if operations are efficient and harmo-
nized with sustainability initiatives. However, a large percentage of
firms are still challenged by a lack of visibility into key performance
indicators (KPIs) and a legacy manufacturing IT environment that has
a variety of disparate systems and data sources that do not effectively
communicate with one another.
To address these challenges, companies are beginning to invest in
Energy Intelligence software by building upon existing and planned
manufacturing operations management (MOM) software and auto-
mation investments. These MOM and automation investments typi-
cally span the enterprise’s physical footprint; found in areas such as
utilities, manufacturing, distribution, warehousing, and corporate of-
fices. Unfortunately, these existing investments often do not collect
and manage energy data in the context of operations. These existing
systems also often fail to cover the last mile; much of the needed
data is being collected but the software is not yet in place to help
drive better decision making for energy and operations.
Leading companies that have deployed Energy Intelligence soft-
ware are able to understand energy’s role in operations across pro-
curement and production. These companies are also better able to
make buy/produce decisions for energy and operations as well as
for energy efficiency projects. All of these decisions depend on the
right energy management processes and leadership capabilities,
in conjunction with the right supporting technologies, which LNS
Research defines as Energy Intelligence Software: data collection,
visualization software, and analytical tools.
In today’s big data world, companies struggle to find the intelli-
gence needed for making strategic decisions at the speed of busi-
ness and manufacturing. The data is there in many cases, but its
sources are often too distributed and disconnected to provide ac-
tionable and consumable information. The lack of a cohesive strat-
egy around key resources prevents the ability for data to reach its
full potential. In this eBook, LNS Research will help to provide a
roadmap for industrial organizations aiming to turn big data into
operational insights with Energy Intelligence Software.
Executive Summary
SECTION 1
Mega-Trends Drive the Need for Energy Intelligence
6
TOP
STR
ATEG
IES
FOR
EN
ERGY
INTE
LLIG
ENCE
SECTION
TABLE OF CONTENTS
PAGE
135
246
World Industrial Sector Energy Consumption
As the world economy continues to grow and evolve, the en-
terprise visibility provided by Energy Intelligence Software will
become increasingly vital to operational success. According to
the U.S. Energy Information Administration’s (EIA) latest report,
The International Energy Outlook 2011, world-wide energy con-
sumption will increase over 50% by 2035. To be released in the
spring of 2013, the updated version of this report is expected to
reiterate the same projections. The chart shown visualizes several
of these projections for various resources. More information as
well as the upcoming report can be found on the EIA’s website.
50% Increase in world-wide
energy consumption by 2035
Liquids
Natural gas
Coal
Electricity
Renewables
Total
0 50 100 150 200 250 300
55.368.8
44.0 200869.5 2035
49.875.5
27.951.4
14.223.2
191.3288. 2
World Industrial Sector Energy
Consumption by fuel,
2008 and 2035 (quadrillion Btu)
7
TOP
STR
ATEG
IES
FOR
EN
ERGY
INTE
LLIG
ENCE
SECTION
TABLE OF CONTENTS
PAGE
135
246
ExxonMobil’s The Outlook for Energy: A view to 2040 puts the impact of population growth on the industrial sector
into perspective. It says:
“Energy demand in developing nations (Non-OECD) will rise 65% by 2040 compared to 2010, reflecting
growing prosperity and expanding economies. Overall, global energy demand will grow 35%, even with
significant efficiency gains, as the world’s population expands from about 7 billion people today to nearly
9 billion people by 2040, led by growth in Africa and India.”
The business case for improved energy management in the indus-
trial space has never been stronger. At the macroeconomic level,
the world continues to move toward cleaner and cheaper sources
of energy. Correspondingly, the overall consumption of energy in
the industrial space is continuing to grow at a rate that business
executives cannot ignore.
Much of the growth in energy consumption will be driven by
an increase in population and the coinciding GDP expansion. By
2040, many estimates of population growth have world population
approaching 10 billion people. The industrial sector is projected
to grow accordingly. As consequence, these mega-trends around
population and energy consumption growth are already being
Projected World Population Growth to 2100
10 billion peopleEstimate of world population growth by 2040
28.0
27.0
26.0
25.0
24.0
23.0
22.0
21.0
20.0
19.0
18.0
17.0
16.0
15.0
14.0
13.0
12.0
11.0
10.0
9.0
8.0
7.0
6.0
5.0
4.0
3.0
2.0
1.0
0.0
1950
1960
1970
1980
1990
2000
2010
2020
2030
2040
2050
2060
2070
2080
2090
2100
Constant fertility variant
High fertility variantMedium fertility variant
Instant replacement fertility variant
Low fertility variant
Projected World Population Growth to 2100Estimated and projected world population according to different variants, 2950-2100
accounted for by the world’s leading companies on both the pro-
duction and consumption sides of energy.
8
TOP
STR
ATEG
IES
FOR
EN
ERGY
INTE
LLIG
ENCE
SECTION
TABLE OF CONTENTS
PAGE
135
246
Energy Intensity and Potential for Improvement by Industry
50%-85%
50%-60%
30%-50%
10%-30%
25%-50%
7%-20%
15%-35%
5%-25%
1-10%
1-10%
ENERGY INTENSITY
Chemical and Petrol Chemical
Petroleum Refining
Non-Ferrous Metals
Iron and Steel
Cement
Glass
Pulp and Paper
Textile
Food and Beverage
Automotive
INDUSTRY
9%-25%
10%-25%
5%-35%
10%
20%
30%-35%
25%
10%
25%
10%-15%
IMPROVEMENT POTENTIALOECD Countries
14%-30%
40%-45%
5%-50%
30%
25%
40%
20%
20%
40%
25%-30%
IMPROVEMENT POTENTIALNon-OECD Countries
The expected growth in population, GDP, and energy consumption
will not impact all regions or industries in the same way. However,
as with any change that impacts the competitive environment, it will
provide business opportunities for many companies. According to
the Global Industrial Energy Efficiency Benchmarking Report pub-
lished by the United Nations Industrial Development Organization,
those industries that are most energy-intensive will have the greatest
opportunity for cost savings.
Energy-intensive industries that fit this category may include
almost all of the process industries, the food and beverages indus-
try, and the automotive industry. Additionally, because of existing
inefficiencies, non-OECD countries generally have more opportu-
nity for energy-related savings. However, in some cases, as we’ve
seen in the process industries, due to recent infrastructural invest-
ments there is actually more opportunity for future energy savings
in the developed world.
5%-30% Potential improvement in energy based cost savings
Energy Cost as Percentage of Total Product Cost
SECTION 2
Individual Company Responses
“10
TOP
STR
ATEG
IES
FOR
EN
ERGY
INTE
LLIG
ENCE
SECTION
TABLE OF CONTENTS
PAGE
135
246
Since 2008, our manufacturing eco-efficiency program has
used a number of cost-effective investments to reduce our ener-
gy, water and waste. Initiatives range from encouraging people
to adopt small actions that make a big difference cumulatively,
such as ensuring lights are turned off, to larger investments
such as biomass boilers. We have reduced our environmental
footprint while avoiding cumulative supply chain costs of over
€300 million:
• Water - €17 million • Energy - €99 million
• Waste disposal - €10 million • Materials - €186 million
Global population growth, along with the growing demand for
businesses to take more accountability with energy-related deci-
sions is prompting leading organizations to publicly and proactive-
ly target energy projects. As you will see in the following section,
some of the world’s largest companies have both boasted past
successes in energy performance and highlighted future goals. In
the coming years, it is likely that Energy Intelligence Software will
be a key component for measuring progress toward these goals.
Individual Company Responses
UnileverOver €300 million in Costs Avoided
Unilever: Over
€300 million
in costs avoided
“
11
TOP
STR
ATEG
IES
FOR
EN
ERGY
INTE
LLIG
ENCE
SECTION
TABLE OF CONTENTS
PAGE
135
246
Committed to 20% Reduction in Energy Consumption by 2015
General Mills
General Mills:
20% reduction in energy consumption by 2015
During 2012, we used 2.4 billion kWh of energy in our wholly
owned production facilities, 7.0% less than in 2011. During this
time, we used 514 kWh per metric ton of product, a decrease of
2.7% over 2011. These decreases were primarily due to a continu-
al focus on energy conservation and developing processes around
energy management. Main sources of energy included natural gas
(54% of the total) and electricity (45% of the total). We remain com-
mitted to meeting our goal of a 20% reduction by 2015, using 2005
as our baseline year.
“12
TOP
STR
ATEG
IES
FOR
EN
ERGY
INTE
LLIG
ENCE
SECTION
TABLE OF CONTENTS
PAGE
135
246
25% Reduction in Energy per Vehicle by 2016
Ford
We are committed to reduce our facility CO2 emissions by 30%
from 2010 to 2025 on a per-vehicle basis and average energy con-
sumed per vehicle by 25% from 2011 to 2016 globally.
Efforts to improve the energy efficiency of Ford’s
plant operations include:
• Aggressively curtailing energy use during
nonproduction periods
• Updating facility lighting systems by replacing inefficient
high-intensity discharge fixtures with up-to-date
fluorescent lights and control systems
• Installing automated control systems on plant powerhouses
and wastewater treatment equipment to increase
energy and process efficiency
Ford:
25% reductionin energy per vehicle by 2016
“13
TOP
STR
ATEG
IES
FOR
EN
ERGY
INTE
LLIG
ENCE
SECTION
TABLE OF CONTENTS
PAGE
135
246
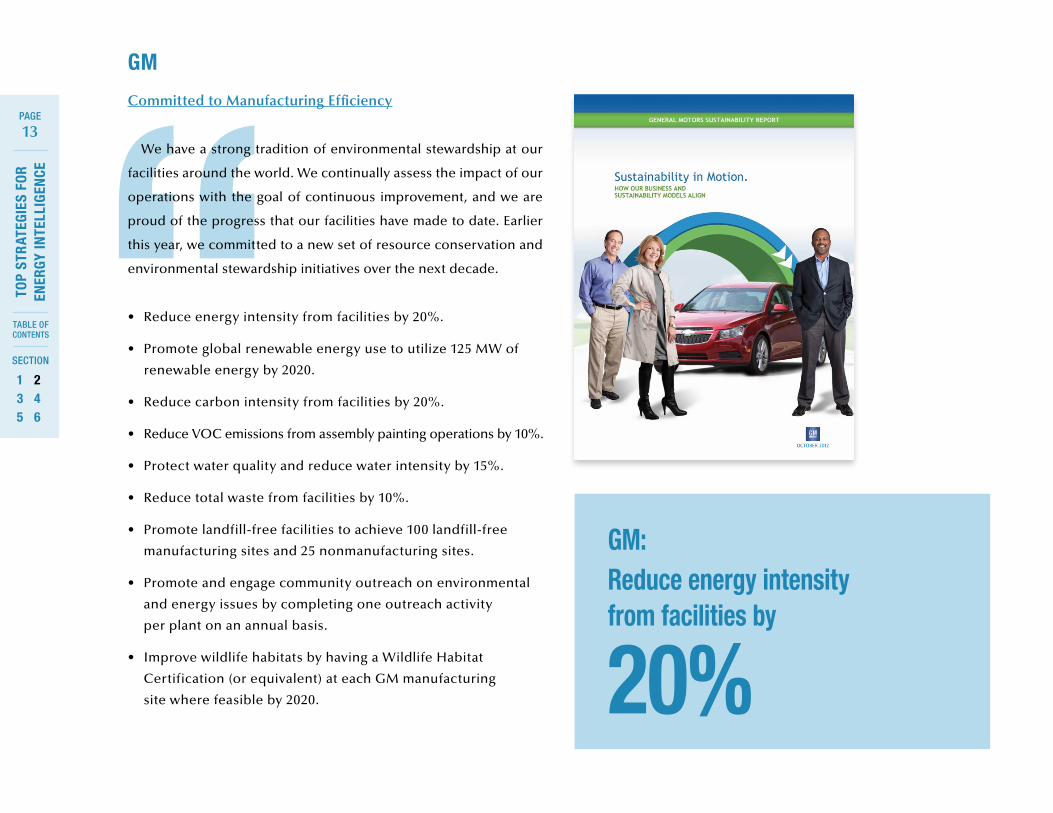
• Reduce energy intensity from facilities by 20%.
• Promote global renewable energy use to utilize 125 MW of
renewable energy by 2020.
• Reduce carbon intensity from facilities by 20%.
• Reduce VOC emissions from assembly painting operations by 10%.
• Protect water quality and reduce water intensity by 15%.
• Reduce total waste from facilities by 10%.
• Promote landfill-free facilities to achieve 100 landfill-free
manufacturing sites and 25 nonmanufacturing sites.
• Promote and engage community outreach on environmental
and energy issues by completing one outreach activity
per plant on an annual basis.
• Improve wildlife habitats by having a Wildlife Habitat
Certification (or equivalent) at each GM manufacturing
site where feasible by 2020.
GM
GM:Reduce energy intensity from facilities by
20%
Committed to Manufacturing Efficiency
We have a strong tradition of environmental stewardship at our
facilities around the world. We continually assess the impact of our
operations with the goal of continuous improvement, and we are
proud of the progress that our facilities have made to date. Earlier
this year, we committed to a new set of resource conservation and
environmental stewardship initiatives over the next decade.
SECTION 3
Market Drivers for Energy Management
15
TOP
STR
ATEG
IES
FOR
EN
ERGY
INTE
LLIG
ENCE
SECTION
TABLE OF CONTENTS
PAGE
135
246
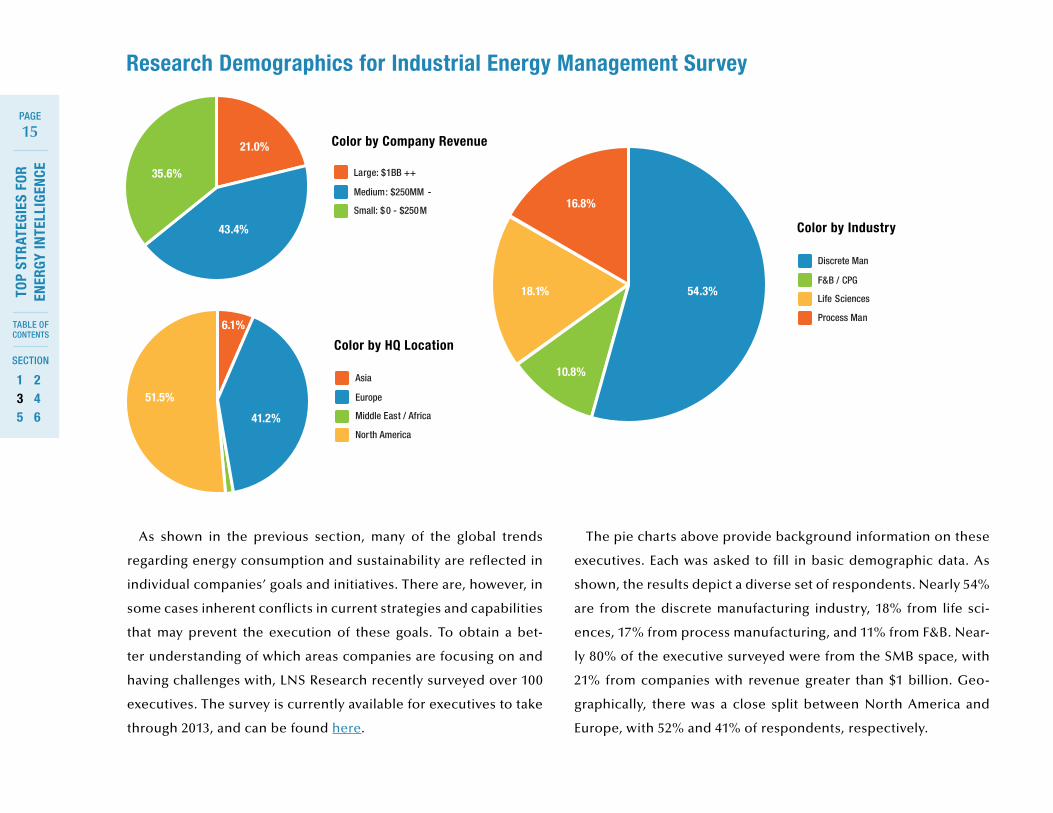
Research Demographics for Industrial Energy Management Survey
The pie charts above provide background information on these
executives. Each was asked to fill in basic demographic data. As
shown, the results depict a diverse set of respondents. Nearly 54%
are from the discrete manufacturing industry, 18% from life sci-
ences, 17% from process manufacturing, and 11% from F&B. Near-
ly 80% of the executive surveyed were from the SMB space, with
21% from companies with revenue greater than $1 billion. Geo-
graphically, there was a close split between North America and
Europe, with 52% and 41% of respondents, respectively.
35.6%
21.0%
43.4%
51.5%
41.2%
6.1%
Large: $1BB ++
Medium: $250MM -
Small: $0 - $250M
Asia
Europe
Middle East / Africa
North America
Discrete Man
F&B / CPG
Life Sciences
Process Man
54.3%18.1%
16.8%
10.8%
Color by HQ Location
Color by Industry
Color by Company Revenue
As shown in the previous section, many of the global trends
regarding energy consumption and sustainability are reflected in
individual companies’ goals and initiatives. There are, however, in
some cases inherent conflicts in current strategies and capabilities
that may prevent the execution of these goals. To obtain a bet-
ter understanding of which areas companies are focusing on and
having challenges with, LNS Research recently surveyed over 100
executives. The survey is currently available for executives to take
through 2013, and can be found here.
16
TOP
STR
ATEG
IES
FOR
EN
ERGY
INTE
LLIG
ENCE
SECTION
TABLE OF CONTENTS
PAGE
135
246
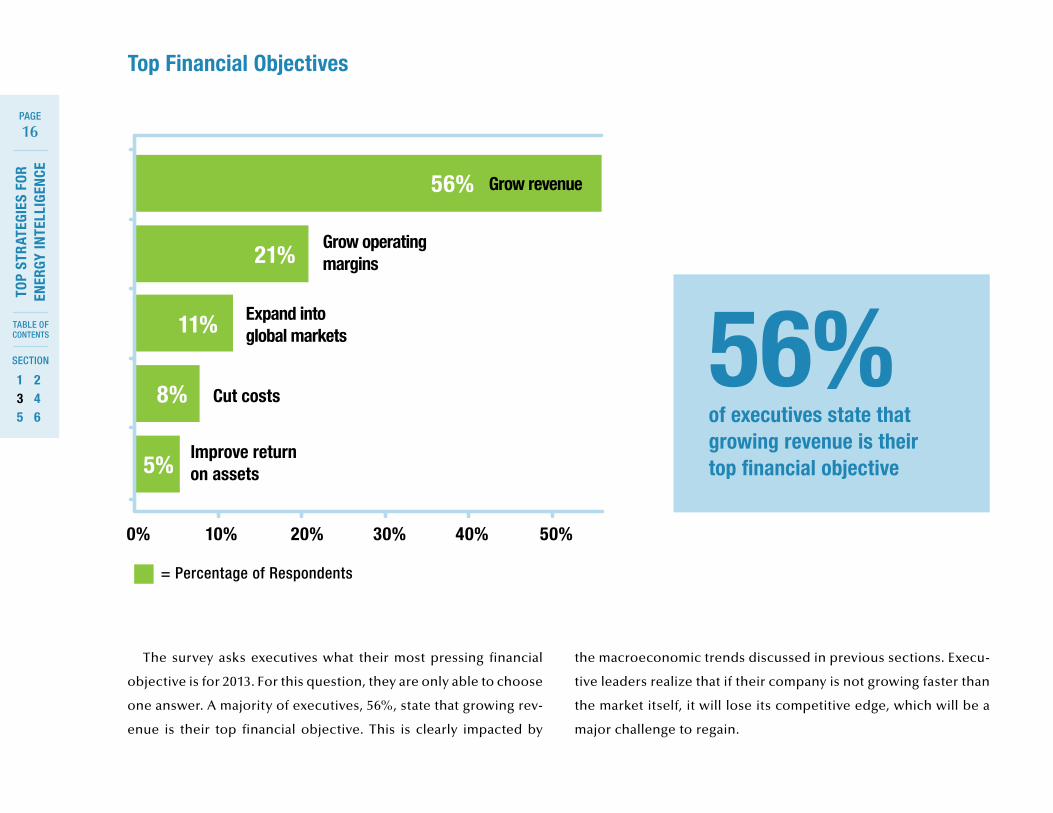
The survey asks executives what their most pressing financial
objective is for 2013. For this question, they are only able to choose
one answer. A majority of executives, 56%, state that growing rev-
enue is their top financial objective. This is clearly impacted by
Top Financial Objectives
= Percentage of Respondents
50%0% 10% 20% 30% 40%
Grow revenue
Grow operatingmargins
Expand into global markets
Improve return on assets
Cut costs
56%
21%
11%
8%
5%
the macroeconomic trends discussed in previous sections. Execu-
tive leaders realize that if their company is not growing faster than
the market itself, it will lose its competitive edge, which will be a
major challenge to regain.
56% of executives state that growing revenue is their top financial objective
17
TOP
STR
ATEG
IES
FOR
EN
ERGY
INTE
LLIG
ENCE
SECTION
TABLE OF CONTENTS
PAGE
135
246
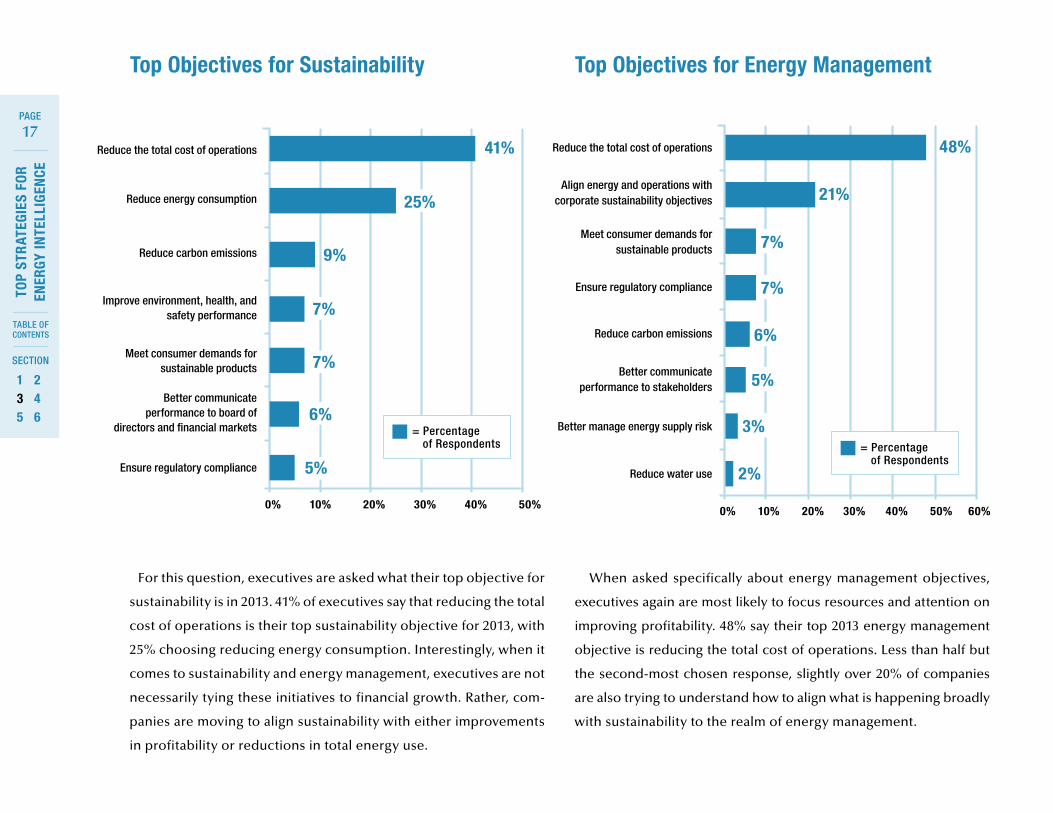
0% 10% 20% 30% 40% 50% 60%
48%
21%
7%
7%
6%
5%
3%
2%
Reduce the total cost of operations
Align energy and operations with corporate sustainability objectives
Meet consumer demands for sustainable products
Ensure regulatory compliance
Reduce carbon emissions
Better communicate performance to stakeholders
Better manage energy supply risk
Reduce water use
Top Objectives for Energy Management
= Percentage of Respondents
When asked specifically about energy management objectives,
executives again are most likely to focus resources and attention on
improving profitability. 48% say their top 2013 energy management
objective is reducing the total cost of operations. Less than half but
the second-most chosen response, slightly over 20% of companies
are also trying to understand how to align what is happening broadly
with sustainability to the realm of energy management.
For this question, executives are asked what their top objective for
sustainability is in 2013. 41% of executives say that reducing the total
cost of operations is their top sustainability objective for 2013, with
25% choosing reducing energy consumption. Interestingly, when it
comes to sustainability and energy management, executives are not
necessarily tying these initiatives to financial growth. Rather, com-
panies are moving to align sustainability with either improvements
in profitability or reductions in total energy use.
0% 10% 20% 30% 40% 50%
41%
25%
9%
7%
7%
6%
5%
Reduce the total cost of operations
Reduce energy consumption
Reduce carbon emissions
Improve environment, health, and safety performance
Meet consumer demands for sustainable products
Better communicate performance to board of
directors and financial markets
Ensure regulatory compliance
Top Objectives for Sustainability
= Percentage of Respondents
SECTION 4
Challenges with Energy Management
19
TOP
STR
ATEG
IES
FOR
EN
ERGY
INTE
LLIG
ENCE
SECTION
TABLE OF CONTENTS
PAGE
135
246
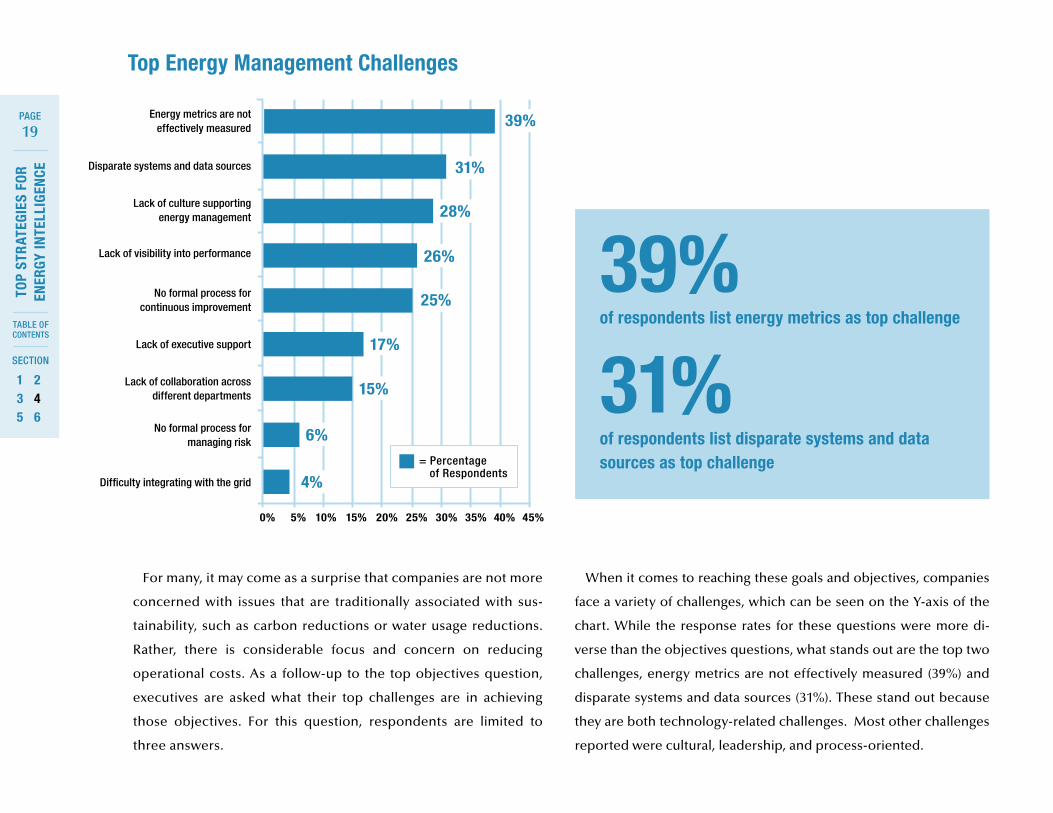
0% 5% 10% 15% 20% 25% 30% 35% 40% 45%
39%
25%
26%
28%
31%
17%
15%
4%
6%
Energy metrics are not effectively measured
Disparate systems and data sources
Lack of culture supporting energy management
Lack of visibility into performance
No formal process for continuous improvement
Lack of executive support
Lack of collaboration across different departments
No formal process for managing risk
Difficulty integrating with the grid
For many, it may come as a surprise that companies are not more
concerned with issues that are traditionally associated with sus-
tainability, such as carbon reductions or water usage reductions.
Rather, there is considerable focus and concern on reducing
operational costs. As a follow-up to the top objectives question,
executives are asked what their top challenges are in achieving
those objectives. For this question, respondents are limited to
three answers.
= Percentage of Respondents
Top Energy Management Challenges
When it comes to reaching these goals and objectives, companies
face a variety of challenges, which can be seen on the Y-axis of the
chart. While the response rates for these questions were more di-
verse than the objectives questions, what stands out are the top two
challenges, energy metrics are not effectively measured (39%) and
disparate systems and data sources (31%). These stand out because
they are both technology-related challenges. Most other challenges
reported were cultural, leadership, and process-oriented.
39% of respondents list energy metrics as top challenge
31% of respondents list disparate systems and data sources as top challenge
20
TOP
STR
ATEG
IES
FOR
EN
ERGY
INTE
LLIG
ENCE
SECTION
TABLE OF CONTENTS
PAGE
135
246
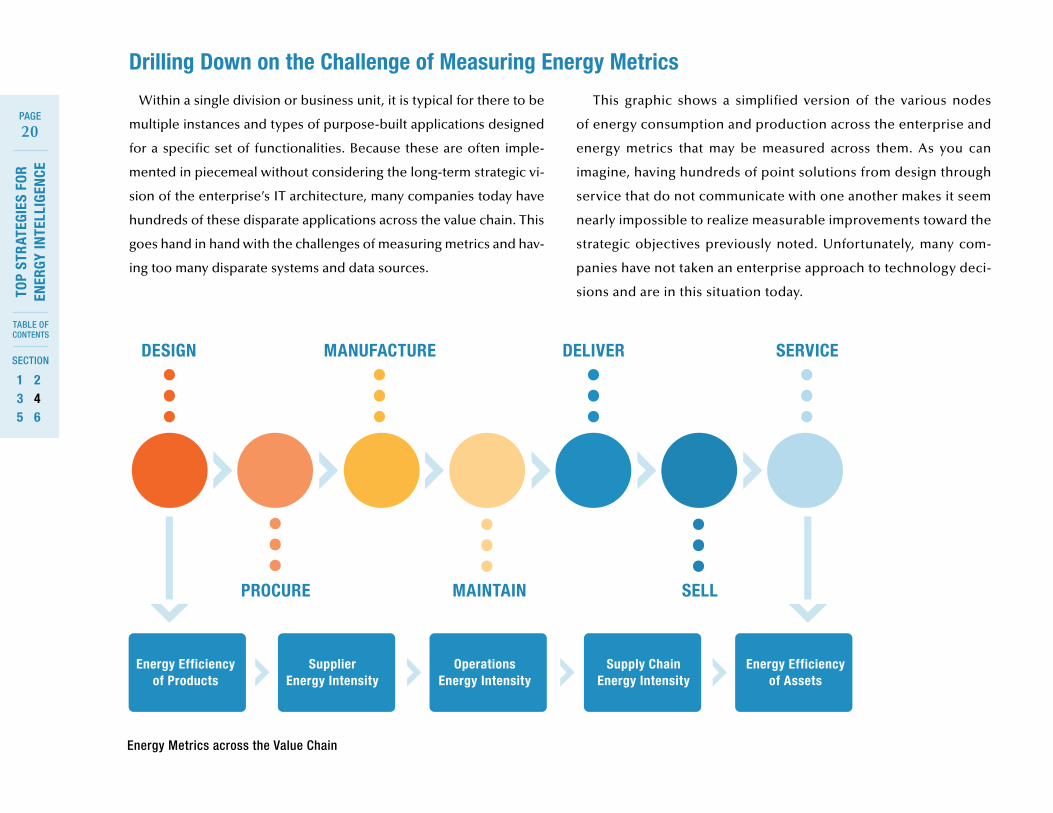
DESIGN
PROCURE MAINTAIN SELL
MANUFACTURE DELIVER SERVICE
Energy Efficiencyof Products
Supplier Energy Intensity
Operations Energy Intensity
Supply Chain Energy Intensity
Energy Efficiency of Assets
Within a single division or business unit, it is typical for there to be
multiple instances and types of purpose-built applications designed
for a specific set of functionalities. Because these are often imple-
mented in piecemeal without considering the long-term strategic vi-
sion of the enterprise’s IT architecture, many companies today have
hundreds of these disparate applications across the value chain. This
goes hand in hand with the challenges of measuring metrics and hav-
ing too many disparate systems and data sources.
This graphic shows a simplified version of the various nodes
of energy consumption and production across the enterprise and
energy metrics that may be measured across them. As you can
imagine, having hundreds of point solutions from design through
service that do not communicate with one another makes it seem
nearly impossible to realize measurable improvements toward the
strategic objectives previously noted. Unfortunately, many com-
panies have not taken an enterprise approach to technology deci-
sions and are in this situation today.
Energy Metrics across the Value Chain
Drilling Down on the Challenge of Measuring Energy Metrics
21
TOP
STR
ATEG
IES
FOR
EN
ERGY
INTE
LLIG
ENCE
SECTION
TABLE OF CONTENTS
PAGE
135
246
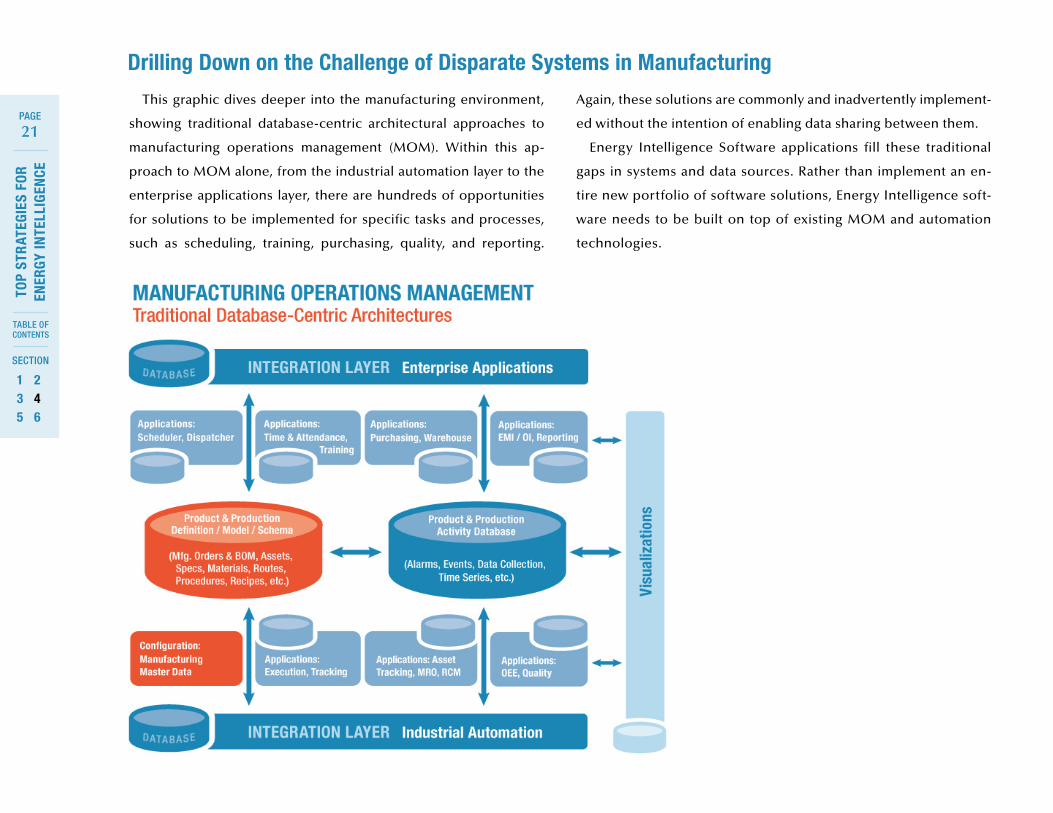
This graphic dives deeper into the manufacturing environment,
showing traditional database-centric architectural approaches to
manufacturing operations management (MOM). Within this ap-
proach to MOM alone, from the industrial automation layer to the
enterprise applications layer, there are hundreds of opportunities
for solutions to be implemented for specific tasks and processes,
such as scheduling, training, purchasing, quality, and reporting.
Again, these solutions are commonly and inadvertently implement-
ed without the intention of enabling data sharing between them.
Energy Intelligence Software applications fill these traditional
gaps in systems and data sources. Rather than implement an en-
tire new portfolio of software solutions, Energy Intelligence soft-
ware needs to be built on top of existing MOM and automation
technologies.
Drilling Down on the Challenge of Disparate Systems in Manufacturing
SECTION 5
Strategies for a Successful Energy Intelligence Solution
23
TOP
STR
ATEG
IES
FOR
EN
ERGY
INTE
LLIG
ENCE
SECTION
TABLE OF CONTENTS
PAGE
135
246
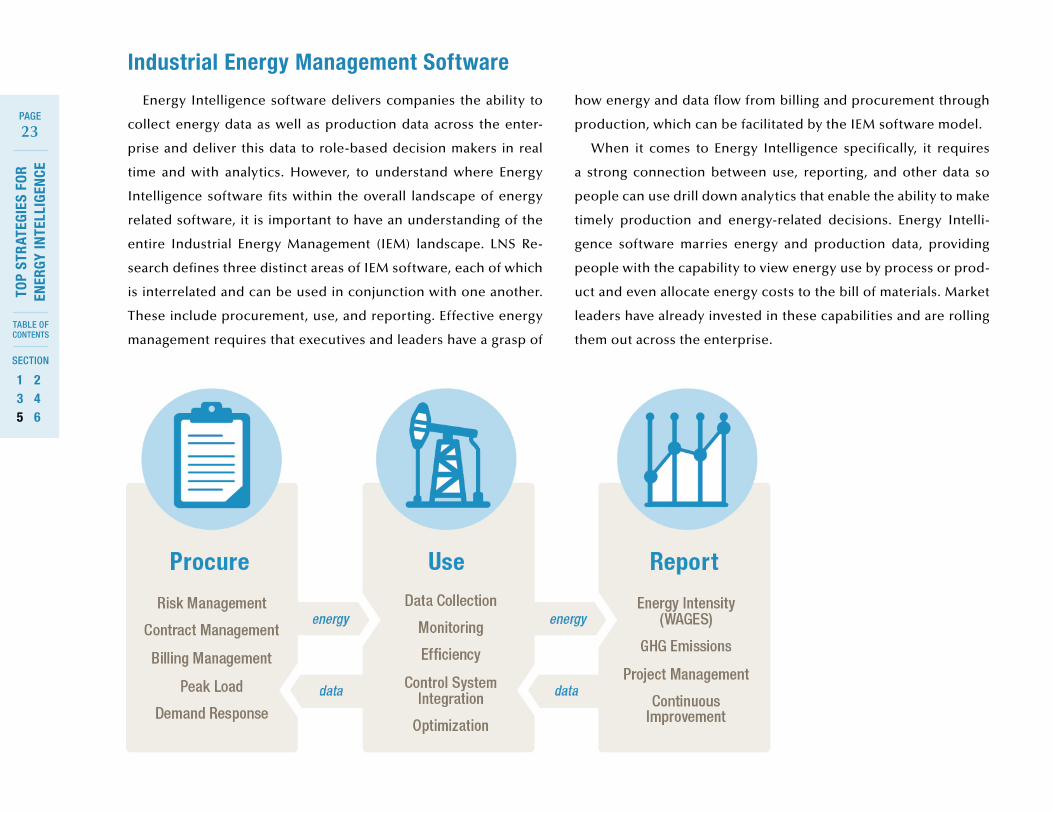
Industrial Energy Management Software
Energy Intelligence software delivers companies the ability to
collect energy data as well as production data across the enter-
prise and deliver this data to role-based decision makers in real
time and with analytics. However, to understand where Energy
Intelligence software fits within the overall landscape of energy
related software, it is important to have an understanding of the
entire Industrial Energy Management (IEM) landscape. LNS Re-
search defines three distinct areas of IEM software, each of which
is interrelated and can be used in conjunction with one another.
These include procurement, use, and reporting. Effective energy
management requires that executives and leaders have a grasp of
how energy and data flow from billing and procurement through
production, which can be facilitated by the IEM software model.
When it comes to Energy Intelligence specifically, it requires
a strong connection between use, reporting, and other data so
people can use drill down analytics that enable the ability to make
timely production and energy-related decisions. Energy Intelli-
gence software marries energy and production data, providing
people with the capability to view energy use by process or prod-
uct and even allocate energy costs to the bill of materials. Market
leaders have already invested in these capabilities and are rolling
them out across the enterprise.
24
TOP
STR
ATEG
IES
FOR
EN
ERGY
INTE
LLIG
ENCE
SECTION
TABLE OF CONTENTS
PAGE
135
246
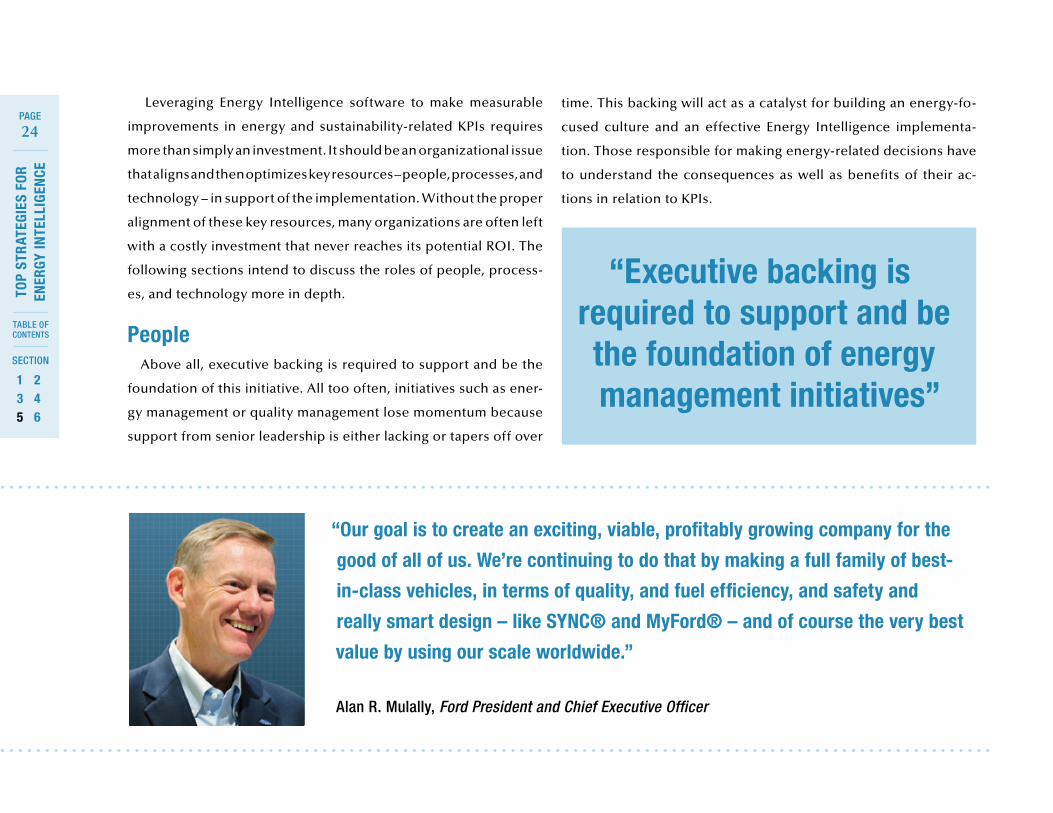
“Our goal is to create an exciting, viable, profitably growing company for the
good of all of us. We’re continuing to do that by making a full family of best-
in-class vehicles, in terms of quality, and fuel efficiency, and safety and
really smart design – like SYNC® and MyFord® – and of course the very best
value by using our scale worldwide.”
Alan R. Mulally, Ford President and Chief Executive Officer
Leveraging Energy Intelligence software to make measurable
improvements in energy and sustainability-related KPIs requires
more than simply an investment. It should be an organizational issue
that aligns and then optimizes key resources – people, processes, and
technology – in support of the implementation. Without the proper
alignment of these key resources, many organizations are often left
with a costly investment that never reaches its potential ROI. The
following sections intend to discuss the roles of people, process-
es, and technology more in depth.
People Above all, executive backing is required to support and be the
foundation of this initiative. All too often, initiatives such as ener-
gy management or quality management lose momentum because
support from senior leadership is either lacking or tapers off over
time. This backing will act as a catalyst for building an energy-fo-
cused culture and an effective Energy Intelligence implementa-
tion. Those responsible for making energy-related decisions have
to understand the consequences as well as benefits of their ac-
tions in relation to KPIs.
“Executive backing is required to support and be the foundation of energy management initiatives”
25
TOP
STR
ATEG
IES
FOR
EN
ERGY
INTE
LLIG
ENCE
SECTION
TABLE OF CONTENTS
PAGE
135
246
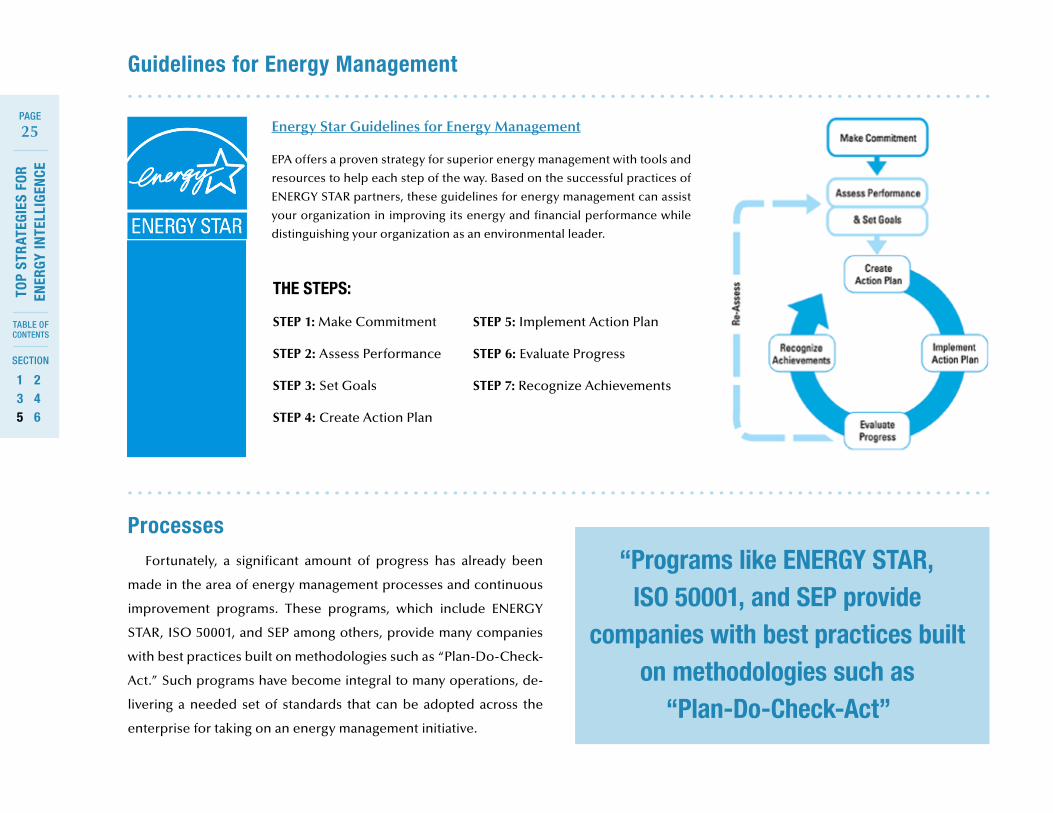
Guidelines for Energy Management
Energy Star Guidelines for Energy Management
EPA offers a proven strategy for superior energy management with tools and
resources to help each step of the way. Based on the successful practices of
ENERGY STAR partners, these guidelines for energy management can assist
your organization in improving its energy and financial performance while
distinguishing your organization as an environmental leader.
Processes Fortunately, a significant amount of progress has already been
made in the area of energy management processes and continuous
improvement programs. These programs, which include ENERGY
STAR, ISO 50001, and SEP among others, provide many companies
with best practices built on methodologies such as “Plan-Do-Check-
Act.” Such programs have become integral to many operations, de-
livering a needed set of standards that can be adopted across the
enterprise for taking on an energy management initiative.
THE STEPS:
STEP 1: Make Commitment
STEP 2: Assess Performance
STEP 3: Set Goals
STEP 4: Create Action Plan
STEP 5: Implement Action Plan
STEP 6: Evaluate Progress
STEP 7: Recognize Achievements
“Programs like ENERGY STAR, ISO 50001, and SEP provide
companies with best practices built on methodologies such as
“Plan-Do-Check-Act”
26
TOP
STR
ATEG
IES
FOR
EN
ERGY
INTE
LLIG
ENCE
SECTION
TABLE OF CONTENTS
PAGE
135
246
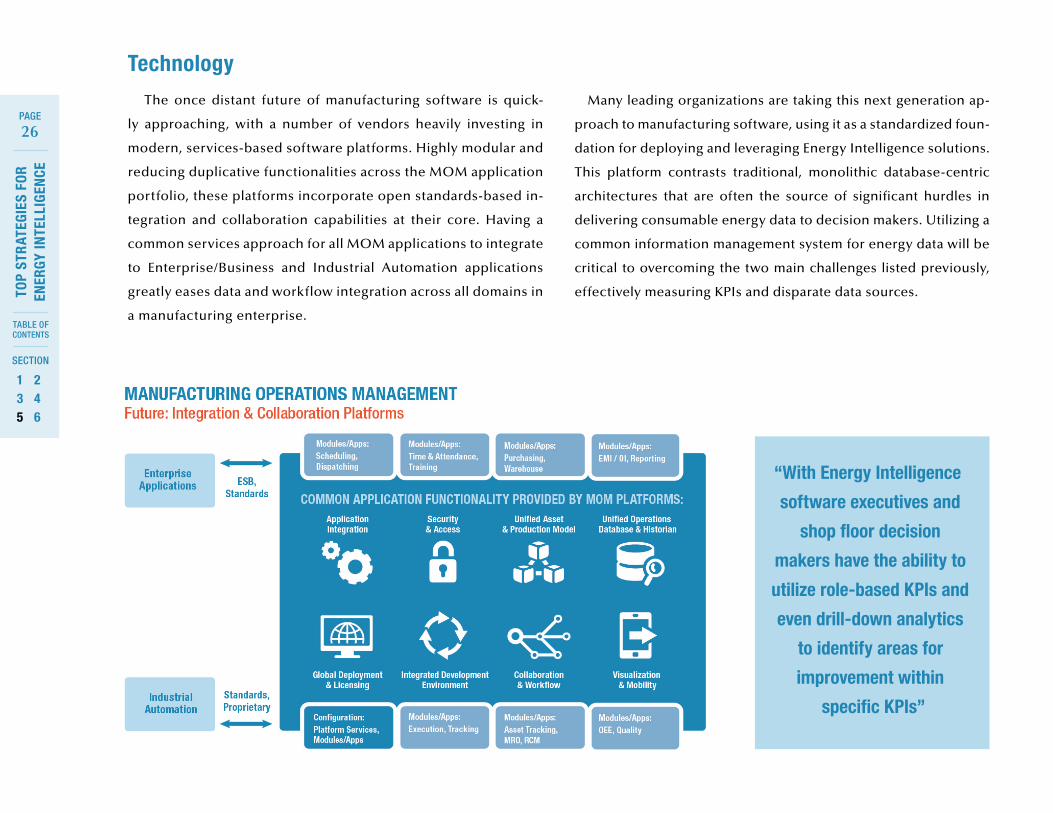
Technology The once distant future of manufacturing software is quick-
ly approaching, with a number of vendors heavily investing in
modern, services-based software platforms. Highly modular and
reducing duplicative functionalities across the MOM application
portfolio, these platforms incorporate open standards-based in-
tegration and collaboration capabilities at their core. Having a
common services approach for all MOM applications to integrate
to Enterprise/Business and Industrial Automation applications
greatly eases data and workflow integration across all domains in
a manufacturing enterprise.
Many leading organizations are taking this next generation ap-
proach to manufacturing software, using it as a standardized foun-
dation for deploying and leveraging Energy Intelligence solutions.
This platform contrasts traditional, monolithic database-centric
architectures that are often the source of significant hurdles in
delivering consumable energy data to decision makers. Utilizing a
common information management system for energy data will be
critical to overcoming the two main challenges listed previously,
effectively measuring KPIs and disparate data sources.
“With Energy Intelligence
software executives and
shop floor decision
makers have the ability to
utilize role-based KPIs and
even drill-down analytics
to identify areas for
improvement within
specific KPIs”
27
TOP
STR
ATEG
IES
FOR
EN
ERGY
INTE
LLIG
ENCE
SECTION
TABLE OF CONTENTS
PAGE
135
246
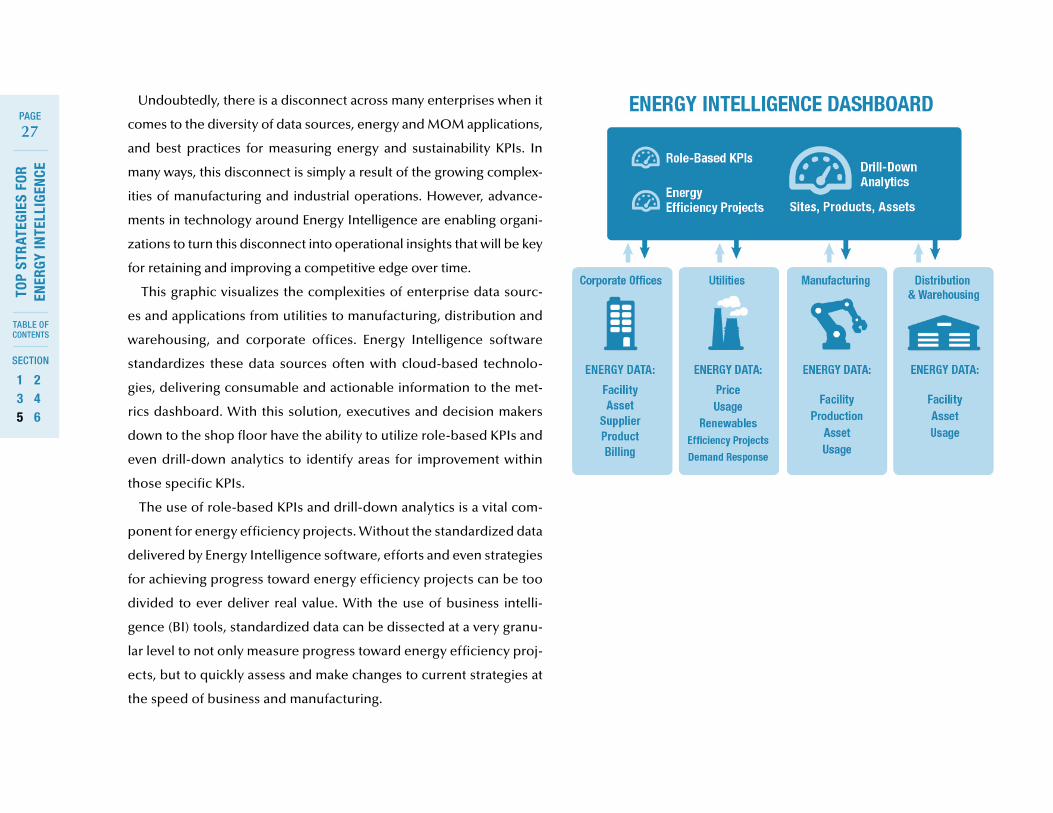
Undoubtedly, there is a disconnect across many enterprises when it
comes to the diversity of data sources, energy and MOM applications,
and best practices for measuring energy and sustainability KPIs. In
many ways, this disconnect is simply a result of the growing complex-
ities of manufacturing and industrial operations. However, advance-
ments in technology around Energy Intelligence are enabling organi-
zations to turn this disconnect into operational insights that will be key
for retaining and improving a competitive edge over time.
This graphic visualizes the complexities of enterprise data sourc-
es and applications from utilities to manufacturing, distribution and
warehousing, and corporate offices. Energy Intelligence software
standardizes these data sources often with cloud-based technolo-
gies, delivering consumable and actionable information to the met-
rics dashboard. With this solution, executives and decision makers
down to the shop floor have the ability to utilize role-based KPIs and
even drill-down analytics to identify areas for improvement within
those specific KPIs.
The use of role-based KPIs and drill-down analytics is a vital com-
ponent for energy efficiency projects. Without the standardized data
delivered by Energy Intelligence software, efforts and even strategies
for achieving progress toward energy efficiency projects can be too
divided to ever deliver real value. With the use of business intelli-
gence (BI) tools, standardized data can be dissected at a very granu-
lar level to not only measure progress toward energy efficiency proj-
ects, but to quickly assess and make changes to current strategies at
the speed of business and manufacturing.
SECTION 6
Actionable Recommendations
29
TOP
STR
ATEG
IES
FOR
EN
ERGY
INTE
LLIG
ENCE
SECTION
TABLE OF CONTENTS
PAGE
135
246
While more environmentally-conscious decisions will be expected
by stakeholders over time, the operational and financial benefits
of Energy Intelligence software warrant enough evidence to take
action now.
Tips for aligning people with energy initiatives:
• Instill a culture of energy management that starts with senior leadership
• Appoint site-level energy leaders responsible for performance
• Create an internal marketing program to support the initiative
• Put energy metrics on meeting agendas for all levels of management
• Develop cross-functional teams for improvement and education
• Offer incentives for performance improvements in energy metrics
Additional Technology Recommendations
• Energy Intelligence applications need to build on existing IT and automation investments
• Leverage existing next generation investments and roadmaps in MOM if available
• Ensure both energy and production data is collected with sufficient granularity to provide the analytical capabilities for measuring energy intensity of specific products and assets
• Focus on KPI visibility and the connection between energy consumption and production performance to drive a quick ROI
Authors:
Matthew LittlefieldPresident and Principal Analyst
Mike Roberts
Research Associate
Presented by: Distribution made possible by our sponsor:
lnsresearch.com
Connect:
© LNS Research, 2013. All Rights Reserved.