Embed Size (px)
Citation preview

National Water Mission 29 October 2017 for Internal Circulation only
Page | 218
4.2.3.3 Pulp & Paper
1.0 Subject Matter
(Present a brief historical background on the growth of industry – a bird’s eye view picture and analysis of the Industry using the information/ tables) provided in the annexure.
GIS based map depicting location of all the Pulp & Paper industries - District level Type of Pulp & Paper industries in the State along-with total production (Refer Annexure: Table-1) Time trend of the number (growth) of Pulp & Paper industries in the state and water demand and supply position. (Refer Annexure: Table-2)
2.0 Details of Water Availability, Supply, Demand, Withdrawal & Consumption for the Pulp & Paper industries
Water Supply & Demand for Pulp & Paper industries in the State
Time trend of total water demand and actual current water supplied for different categories of Pulp & Paper industries along with growth of industries in the state. Provide trend analysis (10-15 years) with breakup. (Refer Annexure: Table – 2, 3a, 3b)
Total Freshwater Withdrawal and Actual Water Consumption by Pulp & Paper industries in the State
Comparative trend of Total Freshwater Withdrawal Vs Actual Water Consumption by different categories of Pulp & Paper industries in the State:
State Water Budgeting: Refer Annexure- Table 3(e)
SECTOR Previous Year
/ Average
Annual
Demand
(MCM)
Previous Year/ Average Annual Supply & Consumptive Use (MCM)
Demand for the present Water Year (MCM) Supply Consumptive Use
All Pulp & Paper industries
GRAND TOTAL
Xxx xxx Xxx xxx
3.0 Issues and Challenges
Illustrative issues and challenges may include
Waste water disposal and associated surface and ground water contamination
Water demand and supply issues in the Pulp & Paper sector in the state, provide details
Capital investment related issues w.r.to wastewater treatment/recycle/reuse, water conservation interventions etc.
Issues related to water pricing in Pulp & Paper sector
Technology availability, affordability and efficiency related issues
Issues & challenges relevant to the water supply & consumption
Issues related to monitoring and reporting of data
Scattered nature and small scale of operations of industries
(Supporting data & analysis for above points may also be furnished)
4.0 Problem Tree / Root cause Analysis: Cause, Effect and Interventions 5.0 Governance / Management:
Statute / Law / Policy/ Regulations if any

National Water Mission 29 October 2017 for Internal Circulation only
Page | 219
State level laws, policy and governance for the Pulp & Paper sector in the state on water access, consumption and wastewater discharge.
Any specific fresh and waste water regulation/ guidelines in state, provide details.
Has the state notified any regulations including for zero liquid discharge for the Pulp & Paper sector in state? Provide details.
Institutions governing / managing / monitoring the resources and Institutional structure.
Institutions governing / managing / monitoring the industrial water consumption and supply.
Governing body for Pulp &
Paper sector
Water allocation & Monitoring authority Waste water discharge monitoring
Ministry of Industry, Government of
India
E.g. CGWA/ Water resource department/
Urban or Rural body
e.g. State pollution Control Board
Areas of Peoples/Private Participation if any
Water Projects set up by Pulp & Paper industries for the benefit of neighborhood/ local community/ Environment.
Pulp & Paper
Any OE10 or critical block
within the watershed
Water Conservation / Waste Water Treatment
initiatives if any
Partnership Sustainability of initiative Community
Participation
PPP
Others
Pulp & Paper Any OE or critical block within the watershed
Water Reuse/ Recycle initiatives under PPP
PPP Yes/No
Sustainability of initiative
Schemes, Economics & Financing-
Existing schemes and programs along with financial allocations, expenditure etc.
Water Tariff and procurement cost (Refer Annexure: Table 6(a) & 6(b))
Expenditure on Water management (Refer Annexure: Table 6(c) & 6(d))
6.0 Measurement, Monitoring and Data Constraints/ Management
Water & Wastewater Measurement:
Shall specify measurement methods and technologies at Raw water source, industrial process and Waste Water (generation, recycle/reuse & discharge) and Water Quality as per CPCB / SPCB
Monitoring at State Government: Institution/ Agency/ Official responsible for Sustainable Water Management comprehensively for this Industry Sector.
Data Management: Should specify - Frequency of measurement, Frequency of Reporting to centralized agency, Water Quality Parameters monitored, how data is being used to improve Water Use Efficiency and ensure water quality parameters within the prescribed norms etc.
Constraints with respect to the measurement & monitoring
7.0 Performance Indicators: a. Benchmarks on water use (Refer Annexure: Table-13) b. Status of various Performance Indicators– for comparison across Districts/ Plants/ Units/ Products etc.
Category Indicator Bench Mark/ Unit (as applicable)
Unit 1 Unit 2 Unit 3
Measurement Water Quantity
Measurement at Raw water source
Manual Yes/No
Real Time/ Automatic
Yes/No
10Overexploited block of groundwater

National Water Mission 29 October 2017 for Internal Circulation only
Page | 220
Use of ICT (SCADA)
Yes/No
Measurement at Major water usage areas
Manual Yes/No
Real Time/ Automatic
Yes/No
Use of ICT (SCADA)
Yes/No
Waste Water (generation, recycle/reuse & discharge)
Manual Yes/No
Real Time/ Automatic
Yes/No
Use of ICT (SCADA)
Yes/No
Undertaken internal Water Audit in the last Year?
Yes/No
Undertaken Third party Water Audit in the last Year?
Yes/No
Submitting monthly water balance to state pollution control board (SPCB)?
Yes/No
Performance Indicators
Category Indicator Bench Mark/ Unit (as applicable)
Unit 1 Unit 2 Unit 3
Management Plans Having Water Management Plans?
Yes/No
Whether Water Managements are operational
Yes/No
Water Conservation Have taken up RWH/ GW Recharge?
Yes/No
% of total Water requirement being met from Treated Waste Water
% reduction in water consumption compared to the previous year.
Introduction water efficient technologies in process to reduce water consumption.
Yes/No
Water Use Efficiency (Annexure: Table 7)
Specific Water Consumption (SWC); (m3/kg or tonne of paper produced) (refer Annexure: Table 7(a),(b) & (c))
Have specific water consumption within the norms/bench marks/standards
Yes/No
Water Productivity (Annexure: Table 8)
Water Productivity (INR/m3) Quantity of water necessary to produce these goods (refer Annexure: Table 8(a)&(b))
Water Intensity (Annexure: Table 9)
Water Intensity; (m3/1000 Rs or m3/US$) Volume of water used per unit of gross value added (GVA) (refer Annexure-9(a)&(b))
Water Foot print (Annexure: Table 10)
Total volume of freshwater used directly and/or

National Water Mission 29 October 2017 for Internal Circulation only
Page | 221
Category Indicator Bench Mark/ Unit (as applicable)
Unit 1 Unit 2 Unit 3
indirectly for the industrial operation/product (refer Annexure: Table 10(a))
Waste Water (Annexure: Table 11)
Total Waste Water Generated
% of Waste Water Treated
% of Treated waste water recycled
Implemented/ achieved zero liquid discharge (ZLD)
Waste Water Quality (Annexure: Table 12)
Installation of online water quality monitoring systems.
Yes/No
Compliance with the wastewater quality discharged norms.
Yes/No
Discharging wastewater into open area/ earthen nallah /open drain/ municipal sewer?
Notified for violating effluent discharge norms for discharge in natural resources (surface/ground).
Yes/No
Economics Whether economic incentives are in place by state to encourage water efficiency & conservation?
Yes/No
Whether economic disincentive mechanisms like penalties etc. are in place by state to discourage water wastage & inefficient use?
Yes/No
Whether water use charges & tariff are revised regularly and are reflective of rational pricing mechanisms?
Yes/No

National Water Mission 29 October 2017 for Internal Circulation only
Page | 222
Performance Indicators
Category Indicator Bench Mark/ Unit (as applicable)
District 1 District 2 District 3
Water Quantity Measurement
% of Pulp & Paper industries with water flow meters
% of Pulp & paper industries undertaken internal water audits in the last year
% of Pulp & Paper industries undertaken external water audit in the last year
% of Pulp & Paper industries submitting water balance to SPCB (state pollution control board)
8.0 Reforms undertaken/ being undertaken/ proposed if any 9.0 Road map of activities / tasks proposed for
Better governance Better source / supply management Better demand management /improved Water Use Efficiency Water Quality Water Economics and Financing Water incentives to industries Sustainable Water budgeting with timelines and agencies responsible for each task/activity.
ANNEXURE
1 Total number, types & production of Pulp & Paper industries in the State
Pulp & Paper industries in the State
Type (based on raw material) No. of industries Average Production
(kg or tonnes/day)
Wood based Pulp & Paper mills
- Bleached grade
- Unbleached grade
Total (A)
Agro based Pulp & Paper mills
- Bleached grade
- Unbleached grade
Total (B)
RCF & Market pulp based Paper mills
- Bleached grade
- Unbleached grade
Total (C)
RCF & Market pulp based Specialty Paper mills
Total (A+B+C)

National Water Mission 29 October 2017 for Internal Circulation only
Page | 223
2 Growth Trend of Pulp & Paper industries over a period and Water Demand and Supply position
Pulp & Paper (P&P) – Type based on raw
material
Years
1990 1995 2000 2005 2010 2017
No. of Industries
Wood based Pulp & Paper mills
Agro based Pulp & Paper mills
RCF & Market pulp based (Bleached &
Unbleached) Paper mills
RCF & Market pulp based Specialty Paper
mills
Total
Water Demand and Supply
Total Water Demand (MCM)
Total Water Supply
(MCM)
GW
SW
Total
Demand-Supply Gap
3 Water Budgeting
3(a) Demand, Supply (Withdrawals) & Consumptive Use:
Pulp & Paper: (MCM) Present Water Year: 1st June to 31st May next year
INDUSTRY (within the Basin/ Sub-basin A)
Previous
Year/ Average
Annual
Demand
Demand
for
Present
Water
Year
Previous Year/ Average Annual Supply Previous Year/
Average
Annual Waste
Water
Generated
Previous Year/
Average Annual
Consumptive
Use
Remarks
Rain Water
Surface Water
Ground Water*
TOTAL SUPPLY
Unit 1
Unit 2
GRAND TOTAL
*GW Draft can be calculated from the number of GW abstraction structures & corresponding draft for each Industrial Use/ Process.
3(b) Source Wise: Previous Year/ Average Annual Water Supply
Pulp & Paper: (MCM)
Source Sub Source Unit 1 Unit 2 Unit 3 Unit 4 TOTAL
Rain Water
Directly Harvested Rain Water
Total
Surface Water
Springs, Nallahs
Major Projects
Medium Projects
Minor Projects
Ponds, Tanks
Wetlands

National Water Mission 29 October 2017 for Internal Circulation only
Page | 224
Sea Water /Desalinated Water
Inter Basin Transfer
Total
Ground Water* (Dynamic/ Static)
Dug wells (Total No. x Draft)
Dug cum Bore well (Total No. x Draft)
Bore/Tube wells (Total No. x Draft)
Others etc Total
Treated Waste Water
GRAND TOTAL
*GW Draft can be calculated from the number of GW abstraction structures & corresponding draft for each Industrial Use/ Process.
3(c) Previous Year/ Average Annual Demand, Supply (Source wise) and Consumption for Basin/ Sub-basin A:
Source of Water Demand of all Units in Basin/ Sub-basin A
Supply/ Withdrawal for all Units
Consumptive Use of all Units
Gap/Remarks
Rain Water (Directly
Harvested)
Springs, Nallahs
Major Projects
Medium Projects
Minor Projects
Ponds, Tanks
Wetlands
Desalinated Water/
Sea water
Inter-Basin Transfer
Ground Water
(Dynamic)
Treated Waste Water
TOTAL (MCM)
3(d) Previous Year/ Average Annual Demand, Supply (Source wise) and Consumption for Whole State:
Source of Water Demand of all Units in the State
Supply/ Withdrawal for all Units
Consumptive Use of all Units
Gap/Remarks
Rain Water (Directly Harvested)
Springs, Nallahs
Major Projects
Medium Projects
Minor Projects
Ponds, Tanks
Wetlands
Desalinated Water/ Sea water

National Water Mission 29 October 2017 for Internal Circulation only
Page | 225
Inter-Basin Transfer
Ground Water (Dynamic)
Treated Waste Water
TOTAL (MCM)
3(e) Summary State Water Budget for Pulp & Paper
SECTOR Previous Year / Average
Annual Demand (MCM)
Previous Year/ Average Annual Supply & Consumptive Use (MCM)
Demand for the present Water Year
(MCM) Supply Consumptive Use
All Pulp & Paper units xxx xxx xxx xxx
4 Proportion of Water withdrawal and consumption by Pulp & Paper industries against total industries in the State
Pulp & Paper (P&P) – Raw
material type
Total Water
Withdrawal by all
Pulp & Paper
industries (%)
(Refer 4(a) below)
Total water
withdrawal by all the
Industries in state
Total Water
Consumption by all
Pulp & Paper
industries (%)
(Refer 4(b) below)
Total water
Consumption by all
the Industries in state
Wood based Pulp & Paper mills
Agro based Pulp & Paper mills
RCF & Market pulp based
(Bleached & Unbleached) Paper
mills
RCF & Market pulp based
Specialty Paper mills
Total
4(a) Total Water Withdrawal/Abstraction by Pulp & Paper industries in the State as percentage of Total water withdrawal by all the industries in the State
(Total water withdrawal by all the P&P units in the State) x 100
Total water withdrawal by Pulp & Paper Sector (%) = ---------------------------------------------------------------------------- (Total water withdrawal by all the industries in the state)
4(b) Total Actual Water Consumption by Pulp & Paper industries in the state as percentage of Total water consumption by all the industries in the State
Total water consumption by P&P Sector (%) = (Total actual water consumption by all P&P units in State) x100 ---------------------------------------------------------------------------------- (Total water consumption by all the industries in the state)
4(c) Total Freshwater Withdrawal and Total Actual Water Consumption by all Pulp & Paper industries in the State
CY
-11
CY
-10
CY
-9
CY
-8
CY
-7
CY
-6
CY
-5
CY
-4
CY
-3
CY
-2
CY
-1
CY
/
2017
Total Fresh Water Withdrawal
by all Pulp & Paper industries
(MCM)
Total Actual Water
Consumption by all Pulp &
Paper industries (MCM)

National Water Mission 29 October 2017 for Internal Circulation only
Page | 226
5 Total Water Withdrawal (Abstraction) and Actual Water Consumption as percentage of total renewable freshwater
resources
CY-5 CY-4 CY-3 CY-2 CY-1 CY/
2017
Total Fresh Water Withdrawal by all
Pulp & Paper industries (%)
Refer Annexure: Table 5(a)
Total Actual Water Consumption by all
Pulp & Paper industries (%)
Refer Annexure: Table 5(b)
5(a) Total Water Withdrawal/Abstraction by Pulp & Paper industries in the State as percentage of Total available freshwater resources of the State
(Total water withdrawal by all the P&P units in the State) x 100
Total water withdrawal by Pulp & Paper Sector (%) = ---------------------------------------------------------------------------- (Total available freshwater resources of the state)
5(b) Total Actual Water Consumption by Pulp & Paper industries in the state as percentage of Total available freshwater resources of the State
(Total actual water consumption by all P&P units in State) x 100 Total water consumption by Pulp & Paper Sector (%) = ----------------------------------------------------------------------------- (Total available freshwater resources of the state) 6 Water Economics & Financing: 6(a) Water Tariff (Rs./m3)
Source CY-5 CY-4 CY-3 CY-2 CY-1 CY/ 2017
GW
Urban body
Treated Waste Water for reuse
Others
6(b) Procurement Cost of Water (in Rs)
Year wise cost of procurement of Water
CY-5 CY-4 CY-3 CY-2 CY-1
6(c) Expenditure on Water including Treatment and Management-Time trend at State level
CY-5 CY-4 CY-3 CY-2 CY-1 CY/ 2017
Total Capex by Pulp & Paper industries on water treatment and management (Lakhs)
Total O&M Expenditure by Pulp & Paper industries on water treatment and management (Lakhs)
Total
O&M Expense (%)
6(d) Expenditure by each industry for the Current Year- CY
Pulp & Paper Capital Expenditure
(Lakhs) O&M Expenditure
(Lakhs) Total
O&M Expense (%)
UNIT 1
UNIT 2
National Water Mission 29 October 2017 for Internal Circulation only
Page | 227
UNIT 3
UNIT 4
UNIT 5
UNIT 6
Total
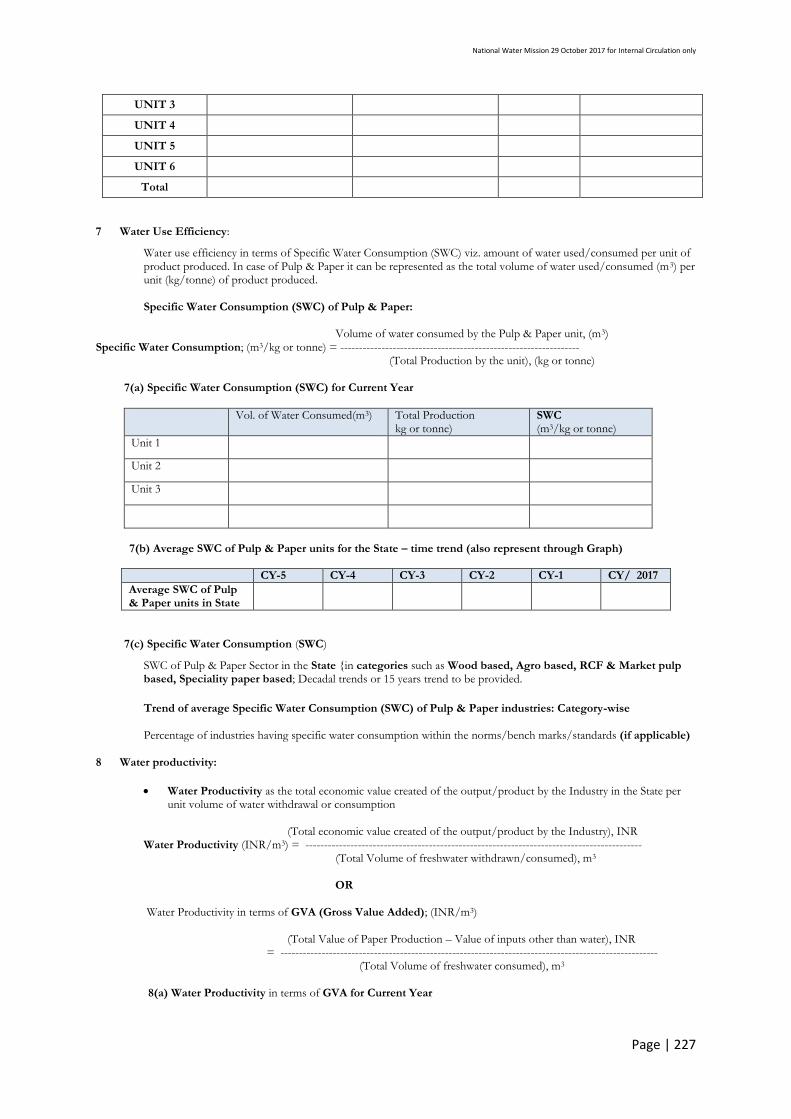
7 Water Use Efficiency:
Water use efficiency in terms of Specific Water Consumption (SWC) viz. amount of water used/consumed per unit of product produced. In case of Pulp & Paper it can be represented as the total volume of water used/consumed (m3) per unit (kg/tonne) of product produced. Specific Water Consumption (SWC) of Pulp & Paper:
Volume of water consumed by the Pulp & Paper unit, (m3) Specific Water Consumption; (m3/kg or tonne) = ----------------------------------------------------------------
(Total Production by the unit), (kg or tonne)
7(a) Specific Water Consumption (SWC) for Current Year
Vol. of Water Consumed(m3)
Total Production kg or tonne)
SWC (m3/kg or tonne)
Unit 1
Unit 2
Unit 3
7(b) Average SWC of Pulp & Paper units for the State – time trend (also represent through Graph)
7(c) Specific Water Consumption (SWC)
SWC of Pulp & Paper Sector in the State {in categories such as Wood based, Agro based, RCF & Market pulp based, Speciality paper based; Decadal trends or 15 years trend to be provided.
Trend of average Specific Water Consumption (SWC) of Pulp & Paper industries: Category-wise
Percentage of industries having specific water consumption within the norms/bench marks/standards (if applicable)
8 Water productivity:
Water Productivity as the total economic value created of the output/product by the Industry in the State per unit volume of water withdrawal or consumption
(Total economic value created of the output/product by the Industry), INR
Water Productivity (INR/m3) = ------------------------------------------------------------------------------------------ (Total Volume of freshwater withdrawn/consumed), m3
OR
Water Productivity in terms of GVA (Gross Value Added); (INR/m3)
(Total Value of Paper Production – Value of inputs other than water), INR
= ----------------------------------------------------------------------------------------------------- (Total Volume of freshwater consumed), m3
8(a) Water Productivity in terms of GVA for Current Year
CY-5 CY-4 CY-3 CY-2 CY-1 CY/ 2017
Average SWC of Pulp & Paper units in State

National Water Mission 29 October 2017 for Internal Circulation only
Page | 228
Value of Paper Production Value of inputs other than water
Total Volume of freshwater consumed
(Gross Value Added); (INR/m3)
Unit 1
Unit 2
Unit 3
Total
8(b) Average Water Productivity in terms of GVA for the State – time trend (also represent through Graph)
9 Water Intensity:
Volume of water consumed by the Industry, (m3)
Water Intensity; (m3/1000 Rs or m3/US$) = ----------------------------------------------------------------------------- (Unit value added by Paper production), (1000 Rs or US$)
9(a) Water Intensity for Current Year
Volume of water consumed
Unit value added by Paper production
Water Intensity; (m3/1000 Rs or m3/Rs)
Unit 1
Unit 2
Unit 3
Total
9(b) Average Water Intensity in terms for the State – time trend (also represent through Graph)
10 Water Footprint:
Water Footprint for Pulp & Paper industries
Water Footprint (WF) of pulp & paper production = Sum of WF of Operations of the plant and WF of Supply Chain
10(a) Water Foot print for Current Year
WF Supply Chain WF Operations Total
Unit 1
Unit 2
Unit 3
Total
11 Waste Water
Bench Mark/ Units (as applicable)
Unit 1 Unit 2 Unit 3
Total Waste Water Generated
% Waste Water Treated
CY-5 CY-4 CY-3 CY-2 CY-1 CY/ 2017
Average Water Productivity (GVA); (INR/m3)
CY-5 CY-4 CY-3 CY-2 CY-1 CY/ 2017
Average Water Intensity (m3/1000 Rs or m3/Rs)

National Water Mission 29 October 2017 for Internal Circulation only
Page | 229
% Waste Water Recycled
% Treated waste water used in Industrial activity
% Treated waste water used in Green belt
% Treated waste water used in others
% Total quantum of wastewater discharged.
Implementation/ achieved zero liquid discharge (ZLD).
11(a) Use of Treated Waste Water
Source of Waste Water
Source of Treated Waste Water for reuse
Qty. of Treated WW consumed
Total Water Consumption
% use of Treated WW out of total Water Consumption
UNIT 1
UNIT 2
UNIT 3
12 Water Quality
Bench
Mark/regulatory
norms (as applicable)
UNIT 1 UNIT 2
Water Quality Installation of online water
quality monitoring systems.
Compliance with the wastewater
regulatory quality discharge
norms.
Discharging wastewater into
open area/ earthen nallah /open
drain/ municipal sewer?
Notified for violating effluent
discharge norms for discharge in
natural resources
(surface/ground).
Water Quality Time trend- Graphs: Compliance to Waste water discharge Quality norms (E.g. BOD / PH /COD / TSS etc.)
13 Bench Marks/ Norms/ Standards and deviation from the norms/bench marks/standards currently for each industrial sector in state. The benchmarks to be given category wise 13(a) Benchmark for Water Consumption, Waste Water Generation etc.
Parameters Unit Indian Bench Mark International Bench Mark
4.2.3.3.1.1 Wood based Pulp & Paper mills
1 Specific Water Consumption m3/kg or tonne
2 Waste Water generation m3/kg or tonne
3 Waste Water discharged m3/kg or tonne
4.2.3.3.1.2 Agro based Pulp & Paper mills
1 Specific Water Consumption m3/kg or tonne
2 Waste Water generation m3/kg or tonne
3 Waste Water discharged m3/kg or tonne
4.2.3.3.1.3 RCF and Market Pulp based (Bleached & Unbleached) mills
1 Specific Water Consumption m3/kg or tonne
2 Waste Water generation m3/kg or tonne
3 Waste Water discharged m3/kg or tonne
4.2.3.3.1.4 RCF and Market Pulp based Specialty Paper mills
1 Specific Water Consumption m3/kg or tonne
2 Waste Water generation m3/kg or tonne
3 Waste Water discharged m3/kg or tonne

National Water Mission 29 October 2017 for Internal Circulation only
Page | 230
13(b) Existing benchmarks/norms in certain sectors for reference Pulp & Paper sector
Parameters Unit Value Indian Bench Mark International Bench Mark
1 Specific Water Consumption m3/tonne Wood based mills: 63
Waste paper based mills: 9 - 1911
Wood based mills: 30 – 70
Waste paper based mills: 8 - 105
2 Waste Water generation m3/tonne
3 Waste Water discharged m3/tonne
Wood based mills: 505&12
11http://cpcb.nic.in/newitems/45.pdf 12http://cpcb.nic.in/GeneralStandards.pdf