Embed Size (px)
Citation preview

Page 2 of 55
Page 3 of 55
Table of Contents
Introduction .................................................................................................................................. 4 Definition of Development ......................................................................................................... 5 A Brief Overview of Venezuelan Polity.................................................................................... 6 Venezuela & Oil ........................................................................................................................... 8 Recent Trends ............................................................................................................................. 10
Economic Overview ............................................................................................................................ 10 Education .............................................................................................................................................. 13 Literacy Rates ................................................................................................................................................................ 13 Primary School Enrollment ..................................................................................................................................... 16 Secondary School Enrollment................................................................................................................................. 17 Progression and Completion of Education........................................................................................................ 20 Resource Devotion to Education ........................................................................................................................... 20
Healthcare............................................................................................................................................. 22 Life Expectancy ............................................................................................................................................................. 23 Infant Mortality Rates ................................................................................................................................................ 24 Access to Safe Drinking Water................................................................................................................................ 25 Access to Improved Sanitation............................................................................................................................... 26
Venezuela’s Recent Performance: Theoretical Perspectives................................................ 27 Dependency Theory ............................................................................................................................ 28 Modernization Theory ........................................................................................................................ 28 Planning School.................................................................................................................................... 29 Radical School ...................................................................................................................................... 30
Future Absent Policy Change .................................................................................................. 30 Development Potential.............................................................................................................. 32
One Gap ................................................................................................................................................ 32 The Two Gap ........................................................................................................................................ 38 Currency........................................................................................................................................................................... 38 Composition of Exports and Imports .................................................................................................................. 40 Trade Balance ................................................................................................................................................................ 41 Debt .................................................................................................................................................................................... 43
Three Gap.............................................................................................................................................. 45 Secondary Education........................................................................................................................... 47
Constraints .................................................................................................................................. 49 Policy Proposals ......................................................................................................................... 54
Investment in Secondary Education ................................................................................................. 54 Control of Corruption ......................................................................................................................... 54 Investment In Oil ................................................................................................................................. 55

Page 4 of 55
Introduction
Countries today are faced with the all-encompassing challenge of development.
Differences among histories, cultures, and political environments cause countries to
choose and follow various paths to attain a higher level of development. This paper will
examine and analyze Venezuela’s experience with development thus far, as well as
make recommendations for the future. Our goal is to identify key issues hindering
development in Venezuela and to arrive at solutions. Ultimately, we will be presenting
our findings to the government of Venezuela and we hope that they value and accept
our proposals.
We begin this paper by defining development and identifying where we place
Venezuela according to this definition. Following, a brief overview of the political
environment of Venezuela and an analysis of the oil sector is required in order to better
comprehend why Venezuela is where it is today and what the future holds for the
nation. We will continue by tracing the recent trends of development, mainly in the
economy, education, and healthcare arenas. We will also consider a few different
theories of development and judge how well they apply to Venezuela. At this point, we
will hypothesize what the future of Venezuela will be if no changes in policy are
undertaken.
We will then examine financial aspects of the economy, specifically the one, two,
and three gaps, which play a vital role in assessing development potential. We will
identify the key areas in which certain improvements would yield the greatest impact
on the overall performance of Venezuela. We also will identify possible constraints that
could prevent the adoption or undermine the success of a given policy. With all of this

Page 5 of 55
considered, we will conclude with a rough policy proposal that we determine will have
the greatest positive effect on Venezuela.
Definition of Development
Assessing the level of development of a nation requires both a definition of
development as well as related metrics. In a word, development is opportunity.
Opportunity, however, is not a universal concept for every nation; the core meaning of
opportunity exists on a spectrum. To any given country we can assign one of three
broad levels of development. It should be noted that this is not a rigid structure;
nations gradually progress through the different metrics for opportunity. It is not
necessary to completely fulfill the requirements of one level before progressing to the
next; it is a fluid process. Each of these levels has different requisites for enhancing
opportunity. The first level, that of the least developed country, is to ensure the basic
needs of the population are met. It is the ability to move from a subsistence lifestyle to
one that is progressive and sustainable: an individual can look beyond the provision of
the basic necessities of life towards a more expansive future. The second level, that of
the moderately developed country, focuses on improving the social and political
landscape as well as establishing infrastructure. It is social mobility, the ability to
participate in an effective government free from rampant corruption, and the presence
of reliable infrastructure. The third level, that of the developed country, involves
ensuring the previous requisites of opportunity are available to everyone. It is not
enough that a simple majority has its basic needs met and has social and political
freedoms. This level requires efforts to bring development to every last citizen. These
development processes must not be temporary or fleeting, but rather dynamic, self-
Page 6 of 55
sustaining, and continuous. Development facilitates the chance to live a eudaimon life.
Opportunity, however, is an abstract concept, and thus difficult to quantify. Of
the four proposed indicators for encapsulating development (economic growth,
economic growth coupled with social change, human development, and liberation)
human development best reflects our definition. As such, the best way to assess the
first level of development is with education and healthcare data. A population that is
both educated and healthy is fundamental for development. Venezuela has progressed
beyond the first level, and currently resides within the second. Indicators for the
second level include various dimensions of governance such as government
effectiveness, rule of law, and voice and accountability.
A Brief Overview of Venezuelan Polity
Much of Venezuela’s 19th century history was marked by periods of political
instability, dictatorial rule, and revolutionary turbulence. The first half of the 20th
century was heralded by authoritarianism, including dictatorships from 1908-1935 and
1950-1958. Since the overthrow of General Marcos Perez Jimenez in 1958, and the
withdrawal of the military from direct involvement in national politics, Venezuela has
enjoyed an unbroken tradition of civilian democratic rule.
The Constitution of 1999 designates two main branches of the federal
government: the executive and legislative branches. The president of Venezuela, who
acts as both chief of state and head of government, is elected by popular vote for a six-
year term, and is eligible for unlimited reelection. The president also appoints the vice
president, determines the size and composition of the cabinet, and makes appointments
to the cabinet in consultation with the National Assembly. The National Assembly is
Page 7 of 55
unicameral, consisting solely of the Chamber of Deputies. Deputies are elected by
popular vote for five-year terms and are eligible for unlimited reelection.
The Constitution of 1999 designates three additional branches of the federal
government: the judicial, citizens, and electoral branches. The judicial branch of the
government is composed of the Supreme Tribunal of Justice, in which the National
Assembly elects thirty-two magistrates for a single twelve-year term. The judicial
branch also consists of lower courts, including district courts, municipal courts, and
courts of first instance. The citizens branch of the government consists of three
components: the attorney general, the “defender of the people” or ombudsman, and the
comptroller general. The holders of these offices are selected by the National Assembly
to serve seven-year terms. The electoral branch of the government, known as the
National Electoral Council, is responsible for organizing elections at all levels. Its five
members are selected by the National Assembly to serve five-year terms.
The current president of Venezuela, President Hugo Chavez Frias, was elected in
1998 under a campaign for broad reform, constitutional amendment, and a crackdown
on corruption. This campaign was revitalized in 2007 under the moniker of “21st
Century Socialism,” and seeks to alleviate social problems while simultaneously
attacking both capitalist globalization and existing democratic institutions. Over the
course of his tenure, President Chavez has largely focused the attention of his
administration on the implementation of social programs designed to benefit
Venezuelan society as a whole. Indeed, much of this spending has been directed toward
poverty alleviation.
Page 8 of 55
Venezuela & Oil
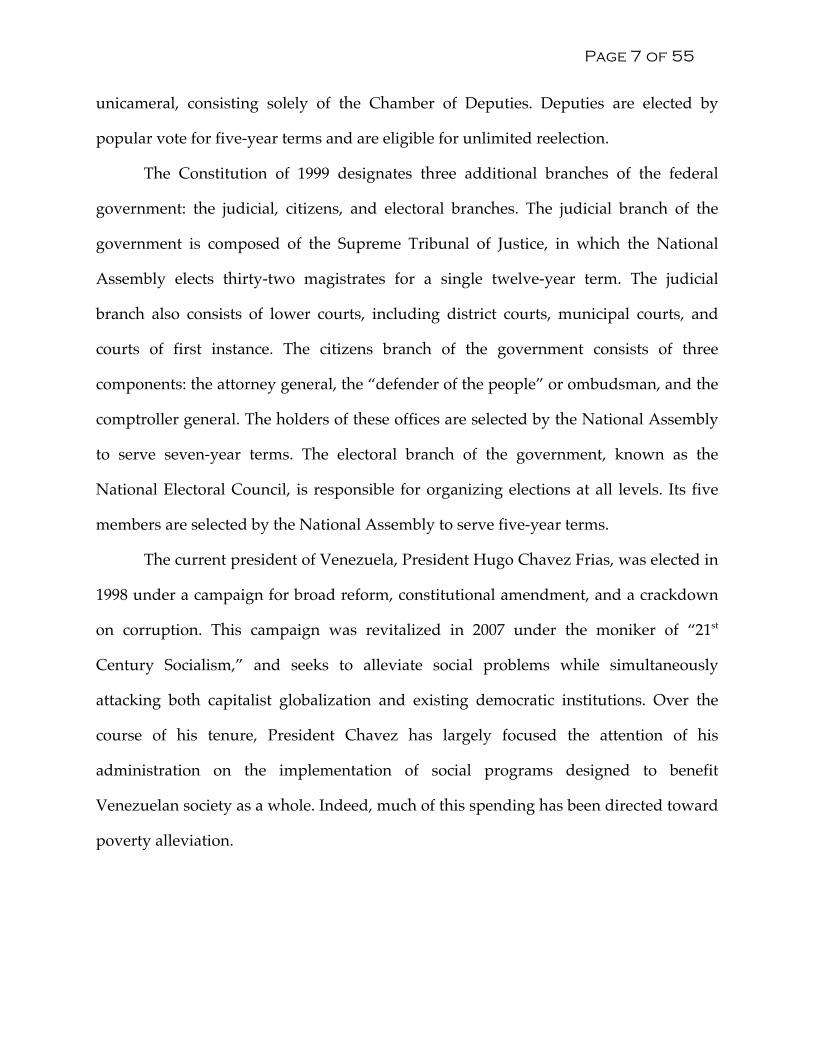
Any discussion of Venezuela requires a thorough analysis of the nation’s oil
sector. Oil is the key driver of the Venezuelan economy and society; oil profits
Figure 1: Venezuela’s GDP versus Oil Price constitute 80% of
Venezuela’s export
revenue and half of
government
revenue1. As Figure
1 illustrates, there is
a strong correlation
between
Venezuela’s GDP
and oil prices. An
oil-based economy
is something that
Venezuela can sustain far into the future. Throughout Venezuela’s oil producing
history (starting in 1917) the nation has produced a cumulative total of 60 billion barrels
of oil2. As of 2008, Venezuela has over 172 billion barrels of proven reserves. In 2007,
Venezuela only had 100 billion barrels of proven reserves, which leads one to believe
more oil may be found in the future. Conservatively estimating that Venezuela will not
generate any additional proven reserves, and assuming the doubling of production that
took place between 1988 and 2008 is representative of future trends3, Venezuela will
have oil until 2062 (52 years). If one assumes the current production rate of 300,000 1 Council on Foreign Relations “Venezuela’s Oil-Based Economy” http://www.cfr.org/publication/12089/ 2 All oil statistics come from OPEC’s 2008 Annual Statistical Bulletin 3 This equates to increasing production by about 3.5% per year.
$0.00 $10.00 $20.00 $30.00 $40.00 $50.00 $60.00 $70.00 $80.00 $90.00 $100.00
0
50
100
150
200
250
300
350
1998 2000 2002 2004 2006 2008 2010 Oil Price, USD
GDP (Billions, Current USD)
Venezuela's GDP versus Oil Price
GDP (Current USD)
Oil Price
Page 9 of 55
barrels per day will continue, their oil reserves will last for the next 155 years. Thus,
Venezuela does not need to worry about a loss of oil revenue due to lack of supply in
the short term. Other aspects of the oil sector, however, are of concern in the short term.
Chavez’s tenure as president has fundamentally changed the oil industry in
Venezuela. In 2006, President Chavez further nationalized the industry (the
Venezuelan government already controls 100% of PDVSA, the nation’s petroleum
company) with a focus on oil fields, and the government’s stake in the sector increased
from 40% to 60%4. President Chavez has also steered oil money away from the oil
industry in attempts to both diversify the economy and promote social welfare, an act
that has far-reaching consequences. According to Bernardo Alvarez Herrera,
Venezuela’s ambassador to the United States, Venezuela’s non-oil sectors are actually
growing faster than Venezuela’s oil sector, due in part to transferred funds from the oil
sector5. President Chavez also has plans to diversify the national oil firm, PDVSA. In
2007 President Chavez created subsidiaries dedicated to agriculture, shipbuilding, and
construction, among others, within the company. This diversification could be key to
Venezuela’s future, as its current intertwinement with oil prices does not provide stable
economic conditions. According to the Center for Economic and Policy Research,
President Chavez’s spending on social welfare has, among other metrics, decreased
poverty by 50%, increased access to education and healthcare services, and pushed
unemployment below 10%6. The commitment to economic diversification and the social
benefits that have arisen from oil revenue are positives for Venezuela. However,
diverting such significant sums of money away from the oil sector will have negative 4 Council on Foreign Relations “Venezuela’s Oil-Based Economy” http://www.cfr.org/publication/12089/. 5 Foreign Affairs. “A Benign Revolution”. http://www.foreignaffairs.com/articles/61747/bernardo-alvarez-herrera/a-benign-revolution 6 Center for Economic and Policy Research “The Venezuelan Economy in the Chavez Years”. http://www.cepr.net/documents/publications/venezuela_update_2008_02.pdf
Page 10 of 55
ramifications in the future. While Venezuela’s total reserves are vast, tapping those
reserves requires consistent investment in infrastructure, investment that has been
lacking under President Chavez.7 Experts maintain that PDVSA will need to invest, at
minimum, $3 billion annually to maintain its current levels of production. The
investment will need to be higher to access the less conventional reserves that make up
a large portion of Venezuela’s proven reserves, especially in the Orinoco Belt region.8
Managed correctly, Venezuela’s oil reserves could provide the resources required for
development. However, a lack of attention to infrastructure and upkeep could drive
Venezuela backwards as oil revenues, used to temporarily provide social welfare and
diversification, shrink.
Recent Trends
Economic Overview
While our definition of development does not fully embrace economic indicators
as key aspects of development, they can still act as a foundation and reference point for
other important metrics. The most basic of economic metrics are GDP, GDP per capita,
and the change in these numbers over time. As Figure 2 shows, Venezuela’s GDP (Real,
2005 US dollars) has grown at a typical rate for the region, but lags behind the
comparable nations. Figure 19 illustrates GDP as relative growth compared to GDP in
1999. Thus, a point approaching 2 on the graph indicates a doubling of GDP from 1999,
and a point approaching 1.5 indicates a 50% increase in GDP from 1999.
7 Council on Foreign Relations “Venezuela’s Oil-Based Economy” http://www.cfr.org/publication/12089/ 8 Ibid. 9 “ERS/USDA Data – International Macroeconomic Data Set” USDA Economic Research Service. http://www.ers.usda.gov/Data/Macroeconomics/
Page 11 of 55
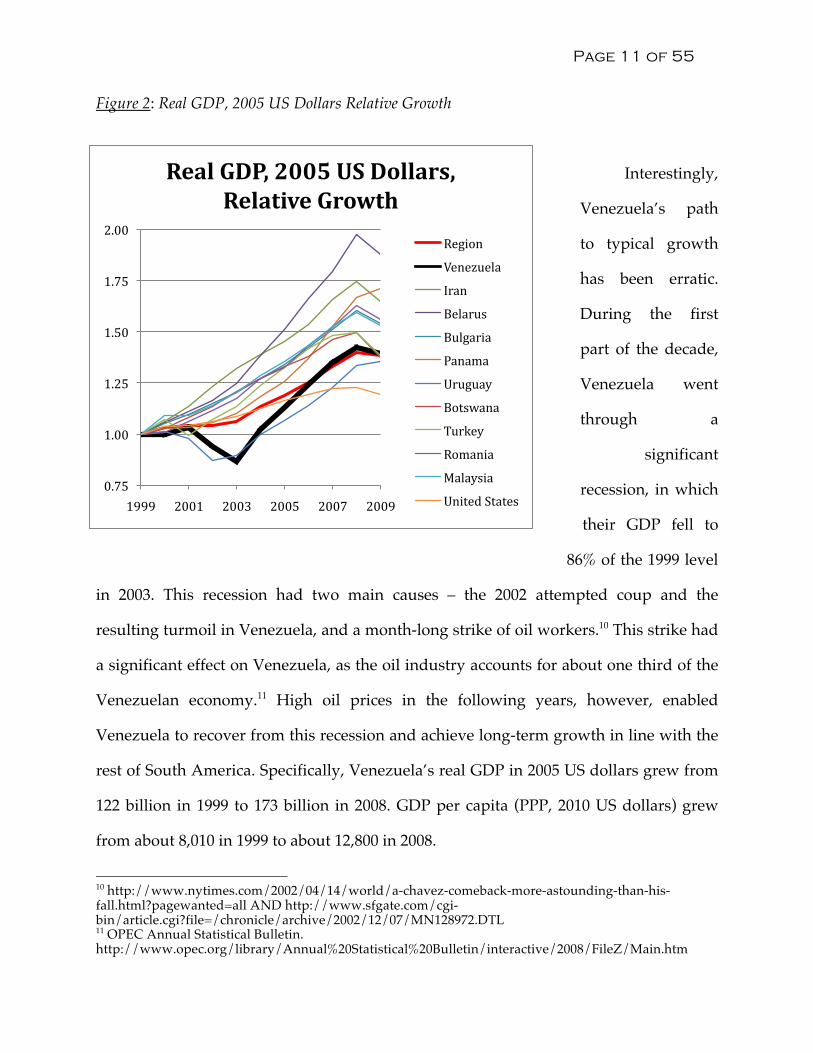
Figure 2: Real GDP, 2005 US Dollars Relative Growth
Interestingly,
Venezuela’s path
to typical growth
has been erratic.
During the first
part of the decade,
Venezuela went
through a
significant
recession, in which
their GDP fell to
86% of the 1999 level
in 2003. This recession had two main causes – the 2002 attempted coup and the
resulting turmoil in Venezuela, and a month-long strike of oil workers.10 This strike had
a significant effect on Venezuela, as the oil industry accounts for about one third of the
Venezuelan economy.11 High oil prices in the following years, however, enabled
Venezuela to recover from this recession and achieve long-term growth in line with the
rest of South America. Specifically, Venezuela’s real GDP in 2005 US dollars grew from
122 billion in 1999 to 173 billion in 2008. GDP per capita (PPP, 2010 US dollars) grew
from about 8,010 in 1999 to about 12,800 in 2008.
10 http://www.nytimes.com/2002/04/14/world/a-chavez-comeback-more-astounding-than-his-fall.html?pagewanted=all AND http://www.sfgate.com/cgi-bin/article.cgi?file=/chronicle/archive/2002/12/07/MN128972.DTL 11 OPEC Annual Statistical Bulletin. http://www.opec.org/library/Annual%20Statistical%20Bulletin/interactive/2008/FileZ/Main.htm
0.75
1.00
1.25
1.50
1.75
2.00
1999 2001 2003 2005 2007 2009
Real GDP, 2005 US Dollars, Relative Growth
Region
Venezuela
Iran
Belarus
Bulgaria
Panama
Uruguay
Botswana
Turkey
Romania
Malaysia
United States

Page 12 of 55
Figure 3: Income Distribution by Quintile
This increase in
economic wealth was
accompanied by a
slight increase in
equality within
Venezuela. While
inequality remains an
issue in Venezuela,
inequality has
declined by two
measures, the GINI
coefficient and wealth
distribution by quintile (Figure 312). The GINI coefficient is a numeral representation of
income distribution equality. As the GINI coefficient approaches 100, incomes become
more unequally distributed within a nation. Venezuela’s GINI of 48 in 2003 and 2005
are relatively high values (this places Venezuela in the bottom fourth of nations13), but a
drop to 43 in 2006 shows progress.
Also, as Figure 3 shows, income distribution among the quintiles has become
slightly more equal. Between 2003 and 2006, the income of the wealthiest 20% dropped
by 3% (from 52% to 49%), and the income of the poorest 20% increased by 2% (from 3%
to 5%). The slight decline in income inequality in Venezuela can be explained by a shift
12 World Bank’s World Development Indicators Database 13 CIA World Factbook: https://www.cia.gov/library/publications/the-world-factbook/rankorder/2172 rank.html
52 52 49
9 9 10
14 14 15
22 22 22
3 4 5
0% 10% 20% 30% 40% 50% 60% 70% 80% 90% 100%
2003 2005 2006
Percent of Total Income
Year
Income Distribution by Quintile
Lowest 20%
Fourth 20%
Third 20%
Second 20%
Highest 20%
Page 13 of 55
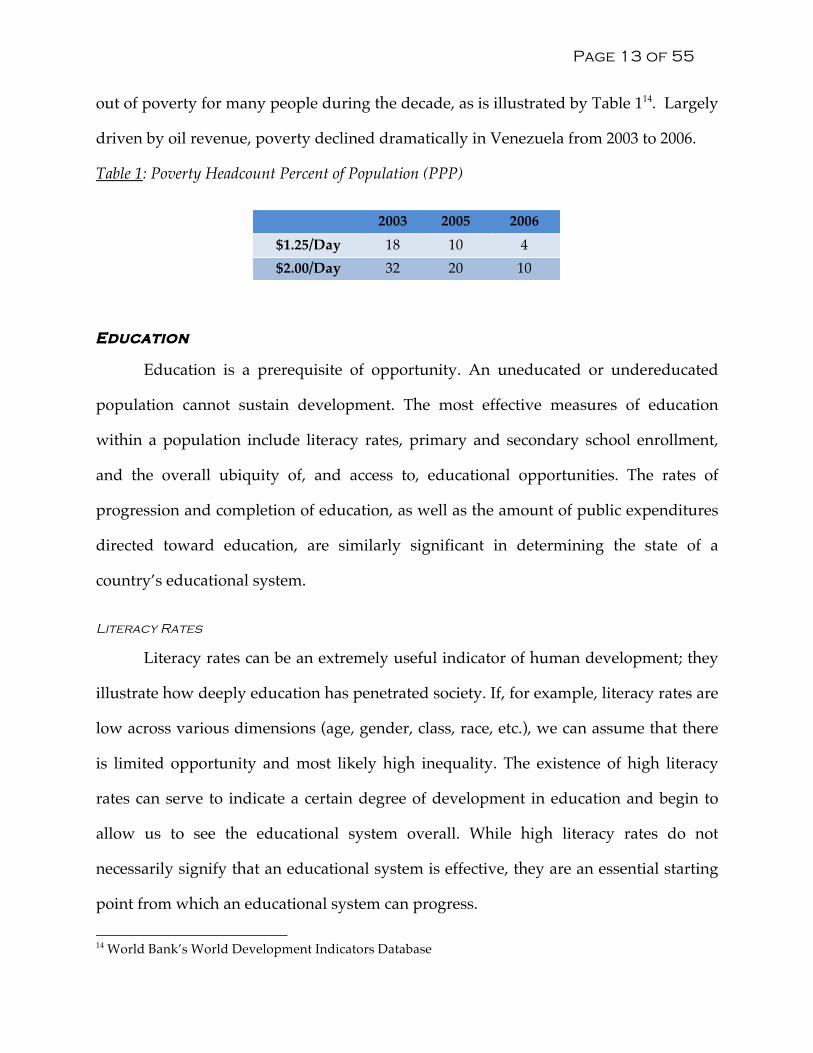
out of poverty for many people during the decade, as is illustrated by Table 114. Largely
driven by oil revenue, poverty declined dramatically in Venezuela from 2003 to 2006.
Table 1: Poverty Headcount Percent of Population (PPP)
Education
Education is a prerequisite of opportunity. An uneducated or undereducated
population cannot sustain development. The most effective measures of education
within a population include literacy rates, primary and secondary school enrollment,
and the overall ubiquity of, and access to, educational opportunities. The rates of
progression and completion of education, as well as the amount of public expenditures
directed toward education, are similarly significant in determining the state of a
country’s educational system.
Literacy Rates
Literacy rates can be an extremely useful indicator of human development; they
illustrate how deeply education has penetrated society. If, for example, literacy rates are
low across various dimensions (age, gender, class, race, etc.), we can assume that there
is limited opportunity and most likely high inequality. The existence of high literacy
rates can serve to indicate a certain degree of development in education and begin to
allow us to see the educational system overall. While high literacy rates do not
necessarily signify that an educational system is effective, they are an essential starting
point from which an educational system can progress.
14 World Bank’s World Development Indicators Database
2003 2005 2006 $1.25/Day 18 10 4 $2.00/Day 32 20 10

Page 14 of 55
Education at its most basic level has improved in Venezuela. As Figure 415
illustrates, literacy rates in Venezuela have increased across both the age group and
gender dimensions over the period 1990 to 2007. The most impressive increase of 5.9%
occurred in the adult age group among females; the least impressive increase of 2.4%
occurred in the youth age group among females. The overall average rate of
improvement in literacy across both the age group and gender dimensions over this
period is 4.15%: that percentage translates into an increase of roughly 0.23% per year.
Education at its most basic level has been relatively successful in Venezuela in
comparison to similar countries, as illustrated in Figure 5.16 Venezuela’s literacy rates
are slightly higher than both the regional and comparable country averages.
15 “Statistics, U. I. (2009)”. UNESCO Institute for Statistics: UIS Statistics in Brief: Education in Venezuela.. tinyurl.com/ye5tpb4 16 “Statistics, U. I. (2009)”. UNESCO Institute for Statistics: UIS Statistics in Brief: Education in Venezuela.. tinyurl.com/ye5tpb4

Page 15 of 55
Figure 4: Percentage of Literate Adults and Youth in Venezuela in 1990 and 2007
Figure 5: Percentage of Literate Adults and Youth in Venezuela, the region, and comparable
nations in 2007
80 82 84 86 88 90 92 94 96 98 100
Adult (15+) Youth (15-‐24)
Percentage (%)
Age Group
Percentage of Literate Adults and Youth in Venezuela, the region, and comparable nations in 2007
Venezuela
Total Regional Average
Belarus
Botswana
Bulgaria
Romania
Turkey
Malaysia
Panama
Uruguay
84 86 88 90 92 94 96 98 100
Total Male Female Total Male Female
Adult (15+) Youth (15-‐27)
Percentage (%)
Age Group and Gender
Percentage of Literate Adults and Youth in Venezuela in 1990 and 2007
1990
2007
Page 16 of 55
Primary School Enrollment
Primary school enrollment rates are an extremely important indicator of
development in that they represent a population’s access to the most basic foundations
of comprehension and understanding.
Over the period 1999 to 2007, Venezuela experienced an initial surge in NER17,
followed by a period of relative stagnation. As shown in Table 218, primary school
enrollment rates underwent significant change in Venezuela over the period 1999 to
2002, with each group (total, male, and female) experiencing a 7% increase in primary
school enrollment. However, primary school enrollment rates underwent little to no
change over the period 2002 to 2007, with the male group experiencing no change at all,
and both the total and female groups experiencing a 1% decrease.
Venezuela’s performance in terms of primary school enrollment is relatively on
par with that of similar countries. Figure 619 shows that primary school enrollment rates
in Venezuela are high at 92%, though this rate is two percentage points less than the
regional average of 94%. In terms of comparable nations, Venezuela, with a total
primary school enrollment rate of 92%, is again two percentage points less than the
average of 94%.
17 GER is the number of students enrolled in a given level of education, regardless of age, expressed as a percentage of the population in the theoretical age group for that level of education. Because this number involves the total number of students in a given grade, a higher number may, in fact, reflect poorly on the education system, as it implies students are not successfully advancing when they should be. If a country, for example, has 100 students eligible for grade 6 based on age, but has 120 students enrolled in grade 6, their GER would be 120. This means that roughly 20 students should be enrolled in a higher grade. NER is the number of students in the theoretical age group who are enrolled expressed as a percentage of the same population. GER numbers can be misleading, so we will focus on NER. 18 “Statistics, U. I. (2009)”. UNESCO Institute for Statistics: UIS Statistics in Brief: Education in Venezuela. 2/7/10. tinyurl.com/ye5tpb4
19 “Statistics, U. I. (2009)”. UNESCO Institute for Statistics: UIS Statistics in Brief: Education in Venezuela. 2/7/10. tinyurl.com/ye5tpb4

Page 17 of 55
Table 2: Primary School Enrollment Rates in Venezuela in 1999, 2002, and 2007
Primary School Enrollment Rates 1999 2002 2007
GER (%) Total 100 106 106 Male 101 108 107 Female 99 105 105
NER (%) Total 86 93 92 Male 85 92 92 Female 86 93 92
Figure 6: Primary School Enrollment Rates in Venezuela, the region, and comparable nations in
2007
Secondary School Enrollment
Secondary school enrollment rates are another extremely important indicator of
development in that they demonstrate a population’s access to an education that is
focused on future opportunities, such as employment.
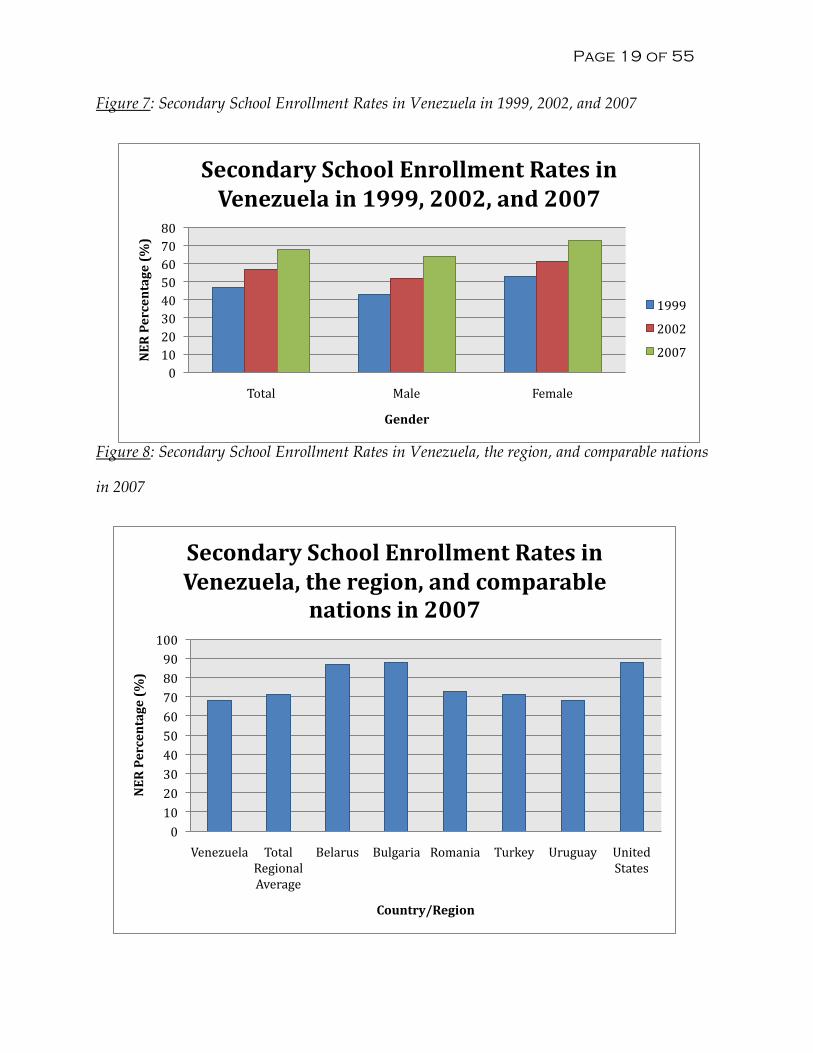
As shown by Figure 720 below, secondary school enrollment rates in Venezuela
have shown steady improvement over the period 1999 to 2007. In almost every instance, 20 “Statistics, U. I. (2009)”. UNESCO Institute for Statistics: UIS Statistics in Brief: Education in Venezuela. 2/7/10. tinyurl.com/ye5tpb4
86 88 90 92 94 96 98 100
Venezuela Total Regional Average
Belarus Bulgaria Panama Romania Turkey Uruguay United States N
ER Percentage (%)
Country/Region
Primary School Enrollment Rates in Venezuela, the region, and comparable
nations in 2007
Page 18 of 55
Venezuela experienced an increase of ten or more percentage points. For example, from
1999 to 2002, total secondary school enrollment increased from 47% to 57%, and from
2002 to 2007, increased from 57% to 68%. However, it is extremely important to note
that, while these increases have occurred and are to be commended, total secondary
school enrollment remains fairly low at 68% as compared to total primary school
enrollment at 92%.
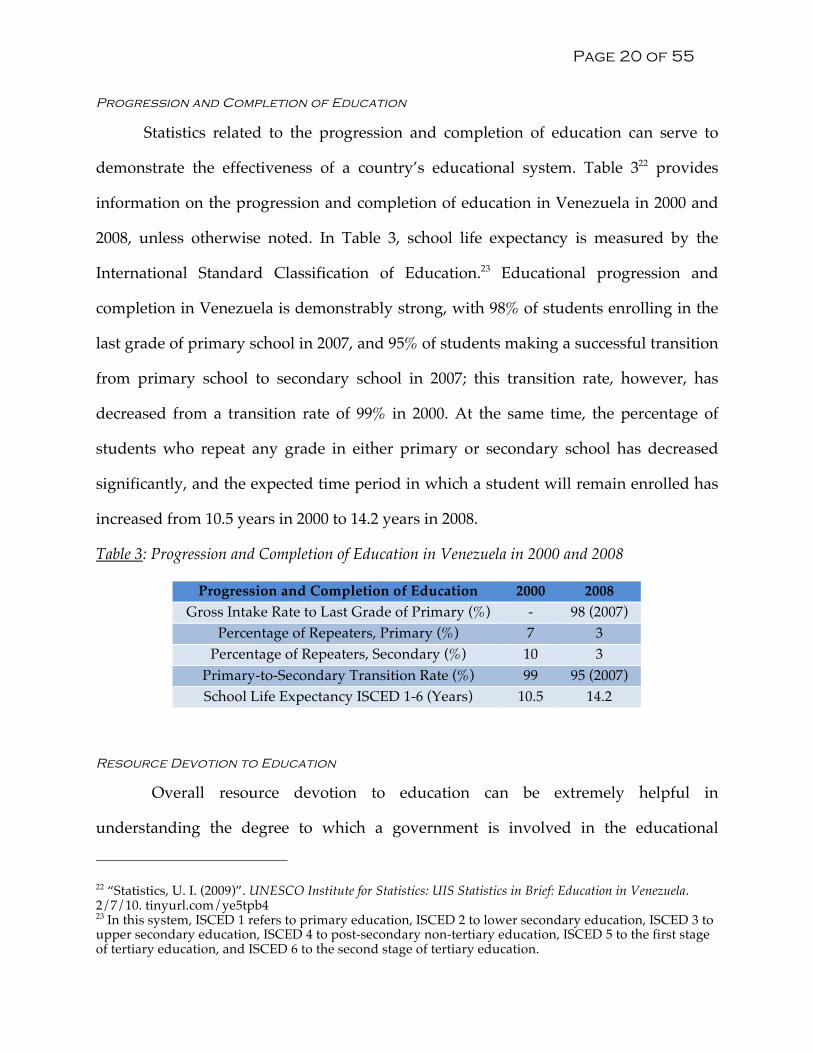
Figure 821 illustrates that the secondary school enrollment rate is slightly less than
the regional average of 71%. At this stage, it is unclear whether lower than regional
average enrollment rates are a consequence of financial cost, opportunity cost, social
stigma, or lack of supply of education.
21 “Statistics, U. I. (2009)”. UNESCO Institute for Statistics: UIS Statistics in Brief: Education in Venezuela. 2/7/10. tinyurl.com/ye5tpb4
Page 19 of 55
Figure 7: Secondary School Enrollment Rates in Venezuela in 1999, 2002, and 2007
Figure 8: Secondary School Enrollment Rates in Venezuela, the region, and comparable nations
in 2007
0 10 20 30 40 50 60 70 80
Total Male Female
NER Percentage (%)
Gender
Secondary School Enrollment Rates in Venezuela in 1999, 2002, and 2007
1999
2002
2007
0 10 20 30 40 50 60 70 80 90 100
Venezuela Total Regional Average
Belarus Bulgaria Romania Turkey Uruguay United States
NER Percentage (%)
Country/Region
Secondary School Enrollment Rates in Venezuela, the region, and comparable
nations in 2007
Page 20 of 55
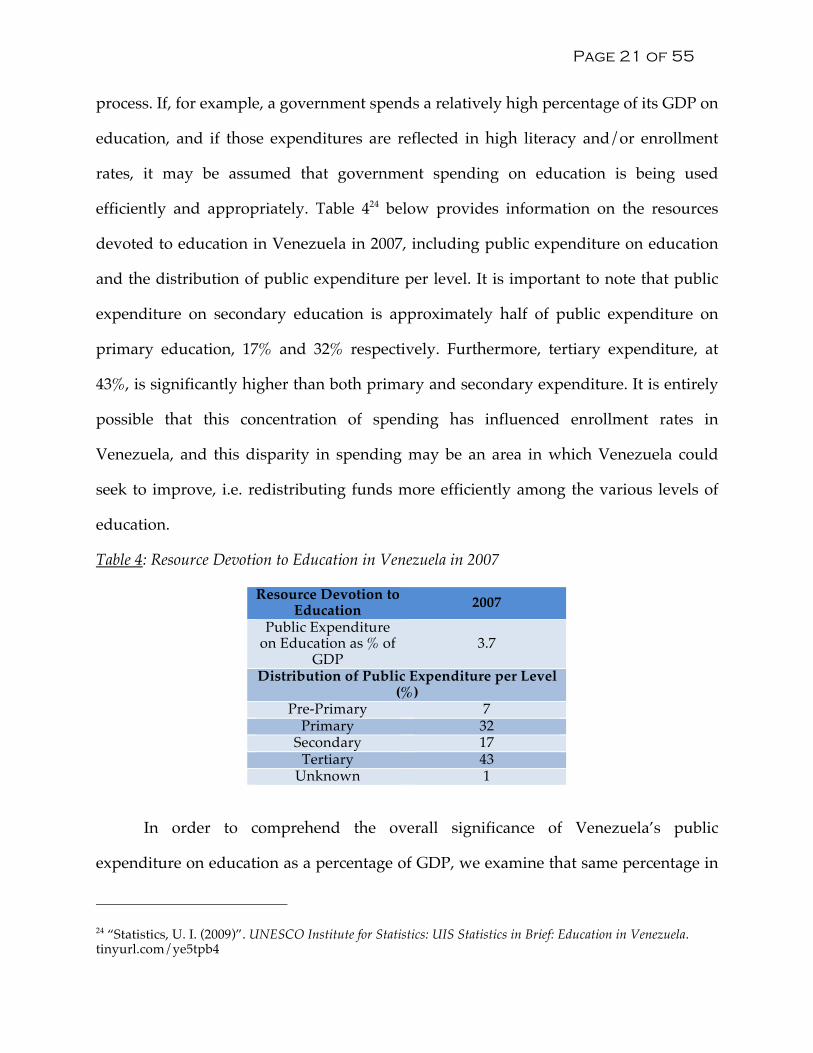
Progression and Completion of Education
Statistics related to the progression and completion of education can serve to
demonstrate the effectiveness of a country’s educational system. Table 322 provides
information on the progression and completion of education in Venezuela in 2000 and
2008, unless otherwise noted. In Table 3, school life expectancy is measured by the
International Standard Classification of Education.23 Educational progression and
completion in Venezuela is demonstrably strong, with 98% of students enrolling in the
last grade of primary school in 2007, and 95% of students making a successful transition
from primary school to secondary school in 2007; this transition rate, however, has
decreased from a transition rate of 99% in 2000. At the same time, the percentage of
students who repeat any grade in either primary or secondary school has decreased
significantly, and the expected time period in which a student will remain enrolled has
increased from 10.5 years in 2000 to 14.2 years in 2008.
Table 3: Progression and Completion of Education in Venezuela in 2000 and 2008
Progression and Completion of Education 2000 2008 Gross Intake Rate to Last Grade of Primary (%) - 98 (2007)
Percentage of Repeaters, Primary (%) 7 3 Percentage of Repeaters, Secondary (%) 10 3
Primary-to-Secondary Transition Rate (%) 99 95 (2007) School Life Expectancy ISCED 1-6 (Years) 10.5 14.2
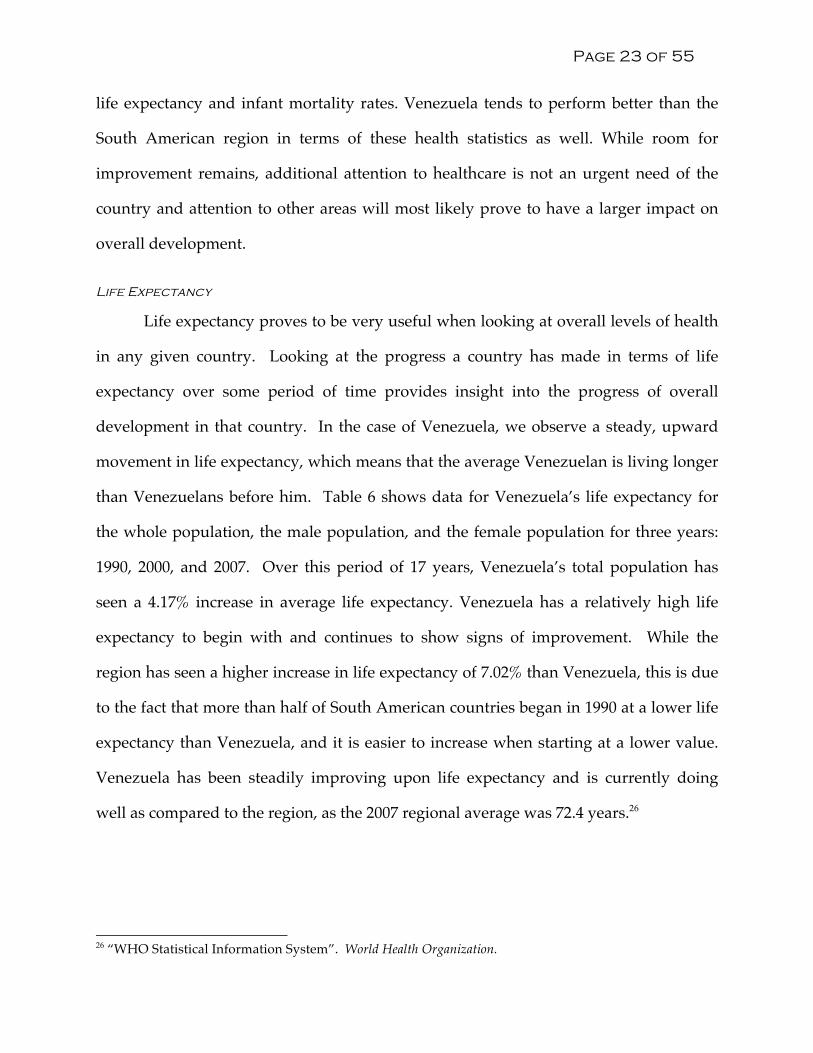
Resource Devotion to Education
Overall resource devotion to education can be extremely helpful in
understanding the degree to which a government is involved in the educational
22 “Statistics, U. I. (2009)”. UNESCO Institute for Statistics: UIS Statistics in Brief: Education in Venezuela. 2/7/10. tinyurl.com/ye5tpb4 23 In this system, ISCED 1 refers to primary education, ISCED 2 to lower secondary education, ISCED 3 to upper secondary education, ISCED 4 to post-secondary non-tertiary education, ISCED 5 to the first stage of tertiary education, and ISCED 6 to the second stage of tertiary education.
Page 21 of 55
process. If, for example, a government spends a relatively high percentage of its GDP on
education, and if those expenditures are reflected in high literacy and/or enrollment
rates, it may be assumed that government spending on education is being used
efficiently and appropriately. Table 424 below provides information on the resources
devoted to education in Venezuela in 2007, including public expenditure on education
and the distribution of public expenditure per level. It is important to note that public
expenditure on secondary education is approximately half of public expenditure on
primary education, 17% and 32% respectively. Furthermore, tertiary expenditure, at
43%, is significantly higher than both primary and secondary expenditure. It is entirely
possible that this concentration of spending has influenced enrollment rates in
Venezuela, and this disparity in spending may be an area in which Venezuela could
seek to improve, i.e. redistributing funds more efficiently among the various levels of
education.
Table 4: Resource Devotion to Education in Venezuela in 2007
Resource Devotion to Education 2007
Public Expenditure on Education as % of
GDP 3.7
Distribution of Public Expenditure per Level (%)
Pre-Primary 7 Primary 32
Secondary 17 Tertiary 43
Unknown 1
In order to comprehend the overall significance of Venezuela’s public
expenditure on education as a percentage of GDP, we examine that same percentage in
24 “Statistics, U. I. (2009)”. UNESCO Institute for Statistics: UIS Statistics in Brief: Education in Venezuela. tinyurl.com/ye5tpb4

Page 22 of 55
various countries throughout the Latin American and Caribbean region. As shown in
Table 525 below, Venezuela devotes only 3.7% of its GDP to public expenditure on
education, while Cuba devotes 13.3%, though Cuba is itself an exception to the general
tendencies of the region. On average, and excluding Cuba due to its status as an outlier,
countries in Latin America and the Caribbean devote 4.3% of GDP to public
expenditure on education, slightly higher than Venezuela’s 3.7%.
Table 5: Public Expenditure on Education as % of GDP in the Region in 2007
Country Public Expenditure
on Education as % of GDP in 2007
Cuba 13.3 St. Vincent and the
Grenadines 7.0 Barbados 6.9 Guyana 6.1 Jamaica 5.5 Belize 5.1 Aruba 4.8
Costa Rica 4.7 Colombia 4.1 Dominica 4.1 Venezuela 3.7
Chile 3.4 British Virgin Islands 3.1
El Salvador 3.0 Guatemala 3.0
Peru 2.5 Dominican Republic 2.2
Healthcare
The health levels of a population are instrumental in identifying development of
a country. The progress a country makes in improving its health statistics begins to
illustrate the commitment level of the state in investing in human development.
Generally, Venezuela has been successfully improving its basic health statistics such as 25 http://stats.uis.unesco.org/unesco/TableViewer/document.aspx?ReportId=125&IF_Language=eng&BR_ Fact=EEGDP&BR_Region=40520
Page 23 of 55
life expectancy and infant mortality rates. Venezuela tends to perform better than the
South American region in terms of these health statistics as well. While room for
improvement remains, additional attention to healthcare is not an urgent need of the
country and attention to other areas will most likely prove to have a larger impact on
overall development.
Life Expectancy
Life expectancy proves to be very useful when looking at overall levels of health
in any given country. Looking at the progress a country has made in terms of life
expectancy over some period of time provides insight into the progress of overall
development in that country. In the case of Venezuela, we observe a steady, upward
movement in life expectancy, which means that the average Venezuelan is living longer
than Venezuelans before him. Table 6 shows data for Venezuela’s life expectancy for
the whole population, the male population, and the female population for three years:
1990, 2000, and 2007. Over this period of 17 years, Venezuela’s total population has
seen a 4.17% increase in average life expectancy. Venezuela has a relatively high life
expectancy to begin with and continues to show signs of improvement. While the
region has seen a higher increase in life expectancy of 7.02% than Venezuela, this is due
to the fact that more than half of South American countries began in 1990 at a lower life
expectancy than Venezuela, and it is easier to increase when starting at a lower value.
Venezuela has been steadily improving upon life expectancy and is currently doing
well as compared to the region, as the 2007 regional average was 72.4 years.26
26 “WHO Statistical Information System”. World Health Organization.
Page 24 of 55
Table 6: Life Expectancy27
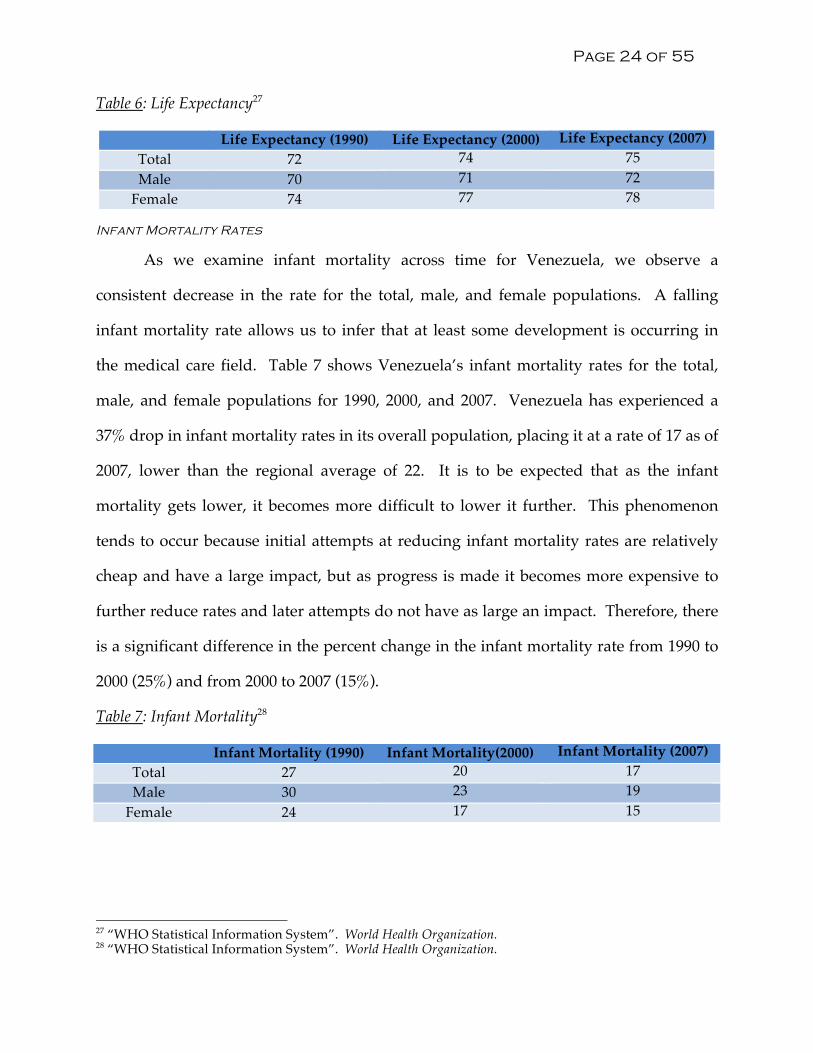
Infant Mortality Rates
As we examine infant mortality across time for Venezuela, we observe a
consistent decrease in the rate for the total, male, and female populations. A falling
infant mortality rate allows us to infer that at least some development is occurring in
the medical care field. Table 7 shows Venezuela’s infant mortality rates for the total,
male, and female populations for 1990, 2000, and 2007. Venezuela has experienced a
37% drop in infant mortality rates in its overall population, placing it at a rate of 17 as of
2007, lower than the regional average of 22. It is to be expected that as the infant
mortality gets lower, it becomes more difficult to lower it further. This phenomenon
tends to occur because initial attempts at reducing infant mortality rates are relatively
cheap and have a large impact, but as progress is made it becomes more expensive to
further reduce rates and later attempts do not have as large an impact. Therefore, there
is a significant difference in the percent change in the infant mortality rate from 1990 to
2000 (25%) and from 2000 to 2007 (15%).
Table 7: Infant Mortality28
27 “WHO Statistical Information System”. World Health Organization. 28 “WHO Statistical Information System”. World Health Organization.
Life Expectancy (1990) Life Expectancy (2000) Life Expectancy (2007) Total 72 74 75 Male 70 71 72
Female 74 77 78
Infant Mortality (1990) Infant Mortality(2000) Infant Mortality (2007) Total 27 20 17 Male 30 23 19
Female 24 17 15
Page 25 of 55
Access to Safe Drinking Water
Access to safe drinking water is a crucial aspect of public health. Having no
access to safe drinking water can cause diseases and can even be fatal. Since
development requires meeting the basic needs of the population, access to safe water is
an essential objective to reach on the path of development. Providing citizens with safe
drinking water consequently brings about increased opportunities to pursue other
productive activities. Tracking the progress a country has made regarding access to
safe drinking water can be misleading, mainly because in 2000, the World Health
Organization altered the definition to include access to improved drinking water, such
as water through household connection or a protected spring, as opposed to an
unprotected well or vendor-provided water.29 Therefore, data collected in and after 2000
reflect this new definition. In Venezuela’s case, the impact of the new definition shows
up in 2000 for the rural population but only in 2002 for the total and urban population.
In 2000, we see a drop of the percentage of the rural population with access to safe
drinking water by nearly 30%. Table 8 shows the percentage of the total, rural, and
urban populations that had access to safe drinking water in Venezuela in 1994, 2000,
and 2002 as well as the regional average. We observe that the new and stricter definition
had a strong impact on Venezuela’s data; while the urban population has seen an
overall improvement from 1994, the rural population, as of 2002, still had not reached
the 1994 level of access.
29“The World’s Water 2008-2009”. Pacific Institute: Information on the World’s Fresh Water Resources.
Page 26 of 55
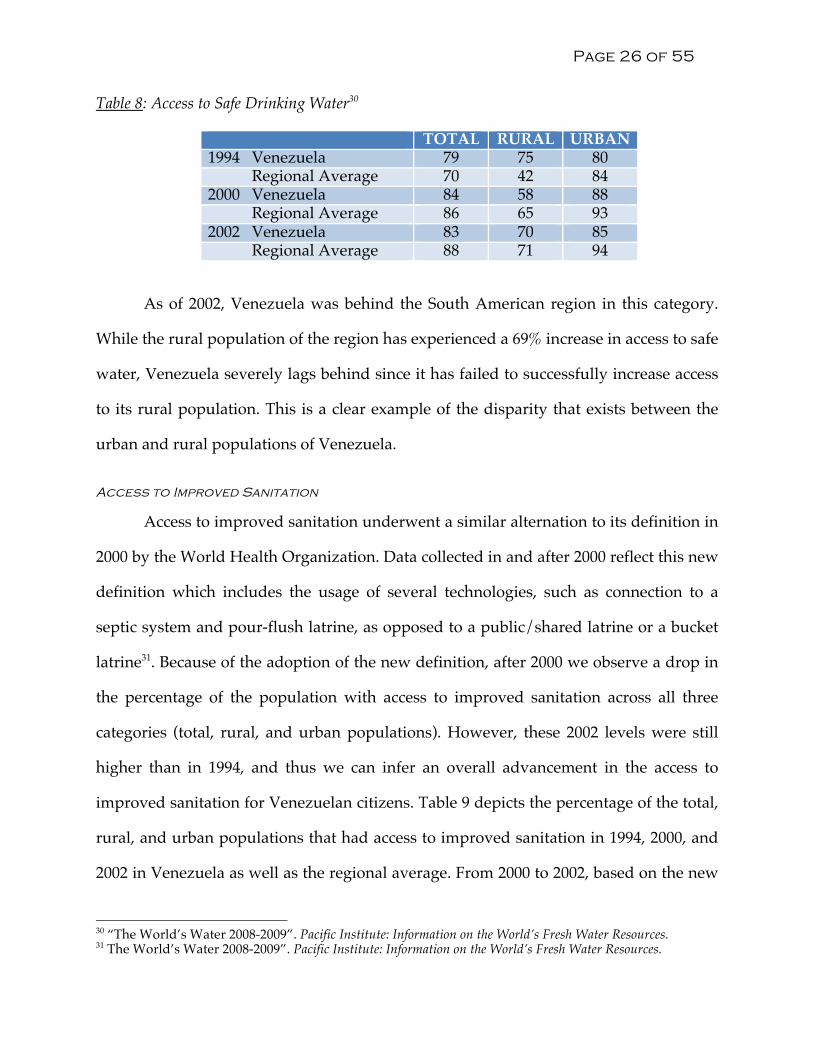
Table 8: Access to Safe Drinking Water30
TOTAL RURAL URBAN 1994 Venezuela 79 75 80 Regional Average 70 42 84 2000 Venezuela 84 58 88 Regional Average 86 65 93 2002 Venezuela 83 70 85 Regional Average 88 71 94
As of 2002, Venezuela was behind the South American region in this category.
While the rural population of the region has experienced a 69% increase in access to safe
water, Venezuela severely lags behind since it has failed to successfully increase access
to its rural population. This is a clear example of the disparity that exists between the
urban and rural populations of Venezuela.
Access to Improved Sanitation
Access to improved sanitation underwent a similar alternation to its definition in
2000 by the World Health Organization. Data collected in and after 2000 reflect this new
definition which includes the usage of several technologies, such as connection to a
septic system and pour-flush latrine, as opposed to a public/shared latrine or a bucket
latrine31. Because of the adoption of the new definition, after 2000 we observe a drop in
the percentage of the population with access to improved sanitation across all three
categories (total, rural, and urban populations). However, these 2002 levels were still
higher than in 1994, and thus we can infer an overall advancement in the access to
improved sanitation for Venezuelan citizens. Table 9 depicts the percentage of the total,
rural, and urban populations that had access to improved sanitation in 1994, 2000, and
2002 in Venezuela as well as the regional average. From 2000 to 2002, based on the new
30 “The World’s Water 2008-2009”. Pacific Institute: Information on the World’s Fresh Water Resources. 31 The World’s Water 2008-2009”. Pacific Institute: Information on the World’s Fresh Water Resources.

Page 27 of 55
definition, the rural population with access to improved sanitation dropped 44% while
the urban population dropped 21%. Nevertheless, even with the new definition, there
has been an overall 17% increase in the total population with access to improved
sanitation from 1994 to 2002. While this is progress, Venezuela still has much room for
improvement as still 52% of the rural and 29% of the urban population have no access
to improved sanitation.
Table 9: Access to Improved Sanitation32
TOTAL RURAL URBAN 1994 Venezuela 58 30 64 Regional Average 52 21 69 2000 Venezuela 74 69 86 Regional Average 82 60 90 2002 Venezuela 68 48 71 Regional Average 76 54 85
As compared to the region, Venezuela has fallen behind in development in this
area. While it started in 1994 at a higher level of access for the total population, this
access has since grown at a slower rate in Venezuela than for the region. Similar to
access to safe drinking water, this exemplifies the inequality between the rural and
urban populations within the country. Although improvements have been made, there
is still much of the population without access to improved sanitation.
Venezuela’s Recent Performance: Theoretical
Perspectives
In conducting an analysis of Venezuela’s recent performance in terms of
theoretical perspectives, it is important to recognize that the fruits of this analysis will
have significant implications for how we intend to address the obstacles that Venezuela
faces. In this section, Venezuela’s situation of development will be explored in the 32 “The World’s Water 2008-2009”. Pacific Institute: Information on the World’s Fresh Water Resources.
Page 28 of 55
context of both dependency theory and modernization theory, as well as both the
planning school and the radical school.
Dependency Theory
Dependency theory is largely reflective of the early writings of Andre Gunder
Frank. Frank asserts that the political, economic, and sociocultural institutions of the
underdeveloped world are the products of the historical evolution of the capitalist
system. In this way, the current position of a less developed country is a direct result of
the nature of its connection to the global system, i.e. the nature of its colonial
exploitation.
Venezuela was a relatively neglected colony throughout the 16th and 17th
centuries, as the Spaniards largely focused their attention on the extraction of silver and
gold from other regions in South America. In 1821, after a series of unsuccessful
uprisings, the country gained its independence from Spain under the leadership of
Simon Bolivar. Venezuela, along with what are now Colombia, Ecuador, and Panama,
was part of the Republic of Gran Colombia until 1830, at which point Venezuela
separated and became a sovereign country.
Thus, we have concluded that Venezuela’s current situation of development does
not reflect its history as a colony of Spain. Indeed, Venezuela was largely ignored by its
colonial masters, and hence did not suffer the same degree of exploitation that has
served to hinder growth and development in other former Spanish colonies.
Modernization Theory
Modernization theory views development as a universal, linear process, one that
is a direct result of “industrialization” or “modernization.” In this way, following the
advice and example of more industrialized or modern countries, namely the “West,”
Page 29 of 55
will enable less developed countries, the “Rest,” to achieve similar levels of growth and
development.
In viewing development as a universal, linear process, modernization theory
necessarily limits the scope of analysis. It detects only one path to development, and
while Venezuela has certainly adopted some elements of industrialization or
modernization, it has at the same time largely eschewed other elements of this
approach. Thus, we have concluded that modernization theory does not provide a
complete explanation of Venezuela’s situation of development.
Planning School
The planning school is known by many different names, including the dirigiste
school and the political economy school. Regardless of the difference in nomenclature,
followers of this approach maintain that the state is the only actor capable of steering a
country toward growth and development. According to the planning school, market
failure is inevitable, and therefore, the state must be active in not only the alleviation
but also the prevention of problems caused by the market mechanism. Some common
duties of such a state include the maintenance of law and order, the building of
infrastructure, and the prevention of monopolies.
Venezuela is a prime example of a country in which the state is by far the most
important, as well as the most powerful, actor. Much of Venezuela’s recent history has
been marked by high levels of state intervention in order to regulate the market and
spur growth and development. Indeed, the current administration of President Hugo
Chavez exemplifies such a state; under a program of “21st Century Socialism,” the
national government has attained historic levels of power and influence.

Page 30 of 55
Radical School
The radical school is largely reflective of the writings of Paul Baran. Baran asserts
that only a complete redefinition and reorganization of the polity, economy, society,
and institutions of a less developed country will create the conditions necessary for
progressive and sustainable development. In theory, the radical school believes that
intervention by the state is utterly implausible due to the political and social structure of
the government in power: it is designed to guard and abet the status quo, not to
promote progress. In practice, however, the radical school concedes that it is possible
for the state to be molded into an actor that reflects the interests of society as a whole.
It is difficult to assess Venezuela in terms of the radical school, since the
assertions that it makes suggest an abrupt transition, one that would most likely take
the form of a revolution, in order to achieve development. It is possible, however, to
conclude that from the perspective of President Chavez, the national government is
promoting progress in the interests of society as a whole, rather than maintaining the
status quo in the interests of a select few. Indeed, many of the social programs
implemented by his administration have been lauded as policies which take into
account the interests of the people. This view is demonstrative of the objectives of
President Chavez’ program of “21st Century Socialism.”
Future Absent Policy Change
Based on our definition of development, Venezuela rests in between the first and
second tier. This means that the nation has overcome some significant, if basic,
obstacles to development. President Chavez’s “21st Century Socialism” has resulted in
tangible benefits to many Venezuelans. However, problems within the country, such as
Page 31 of 55
weak governance indicators and poor infrastructure, could hamper future
development.
Oil is the driver of the Venezuelan economy, and will remain so for the
foreseeable future. As mentioned earlier, it is estimated that Venezuela will have oil for
at least the next 50 years. Currently, a significant portion of oil revenues are being
siphoned away from the oil sector and redirected towards social programs and other
government expenditures. Barring any policy change, Venezuela’s petroleum industry
will gradually lose its ability to produce a profit. Oil requires continuous reinvestment
in infrastructure, as one must keep exploring and tapping new oil fields as well as
maintaining the upkeep of current equipment. Also, it becomes increasingly difficult to
find and extract oil as reserves dwindle. Current policies place an unsustainable
burden on the oil industry. Hence, the economy’s ability to grow and thrive into the
future is in jeopardy.
Venezuela’s educational system is currently functioning in a relatively efficient
manner. Many of the social spending programs initiated by President Chavez have been
focused on the provision of education, and especially on the provision of primary
education. This is evidenced by fairly high literacy and primary enrollment rates across
various age and gender dimensions. However, it is significant that this same degree
focus has not been directed towards secondary education, and as a result, this level of
the Venezuelan educational system is performing in a sub-standard fashion. If change
does not occur in terms of the policies related to education, it is likely that a majority of
Venezuelans will continue to enjoy the relatively limited benefits of a primary
education. While it can be argued that widespread literacy is a crucial building block of
development, higher levels of education are necessary for development to be sustained.
Page 32 of 55
Similarly, Venezuela has been performing solidly concerning the health of its
population. Key measures such as life expectancy and infant mortality rates continue to
improve. While Venezuela already performs better than the region according to these
metrics, it is likely that with the current levels of investment in healthcare it will
continue to slowly improve the overall health level of its population and stay ahead of
the region. On the other hand, access to safe water and improved sanitation is of
concern as it highlights the disparity between the rural and urban population and as
Venezuela lags behind the rest of South America. Although some improvement in these
areas is occurring, it is happening at a very slow rate, and thus the future still looks dim
for a large portion of the population, especially in the rural areas. Nevertheless, overall
development will not be severely hindered if no policy changes are adopted concerning
healthcare.
One of the most critical problems Venezuela faces, without policy change, is in
the area of governance. President Chavez’s tenure has been accompanied by an overall
deterioration of important governance indicators. Frequently, President Chavez and his
government abuse their power by silencing and arresting opposition leaders. Given
President Chavez’s popularity with the average Venezuelan due to his social programs,
and his ability to be reelected an unlimited number of times, means these governance
problems are likely to continue well into the future.
Development Potential
One Gap
The one gap is the difference between a nation’s available savings and its desired
investment level. This gap reveals the amount of investment stemming from abroad
Page 33 of 55
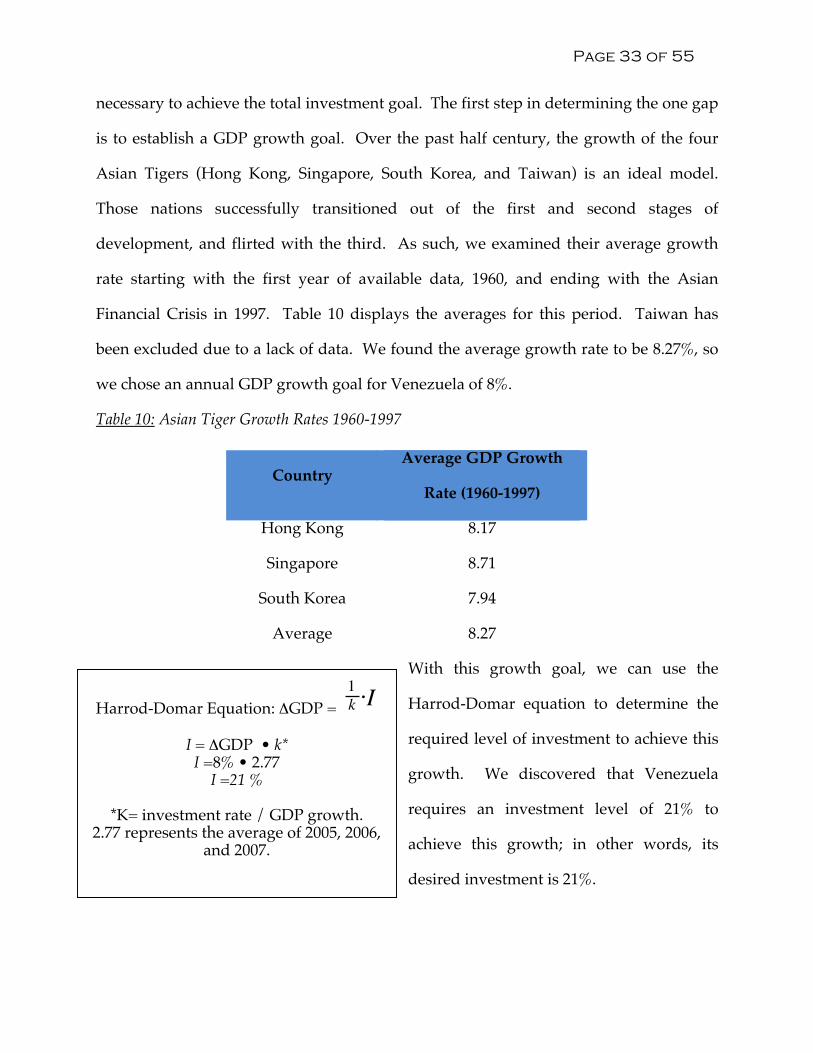
necessary to achieve the total investment goal. The first step in determining the one gap
is to establish a GDP growth goal. Over the past half century, the growth of the four
Asian Tigers (Hong Kong, Singapore, South Korea, and Taiwan) is an ideal model.
Those nations successfully transitioned out of the first and second stages of
development, and flirted with the third. As such, we examined their average growth
rate starting with the first year of available data, 1960, and ending with the Asian
Financial Crisis in 1997. Table 10 displays the averages for this period. Taiwan has
been excluded due to a lack of data. We found the average growth rate to be 8.27%, so
we chose an annual GDP growth goal for Venezuela of 8%.
Table 10: Asian Tiger Growth Rates 1960-1997
With this growth goal, we can use the
Harrod-Domar equation to determine the
required level of investment to achieve this
growth. We discovered that Venezuela
requires an investment level of 21% to
achieve this growth; in other words, its
desired investment is 21%.
Country Average GDP Growth
Rate (1960-1997)
Hong Kong 8.17
Singapore 8.71
South Korea 7.94
Average 8.27
Harrod-Domar Equation: ΔGDP =
I = ΔGDP • k* I =8% • 2.77
I =21 %
*K= investment rate / GDP growth. 2.77 represents the average of 2005, 2006,
and 2007.
Page 34 of 55
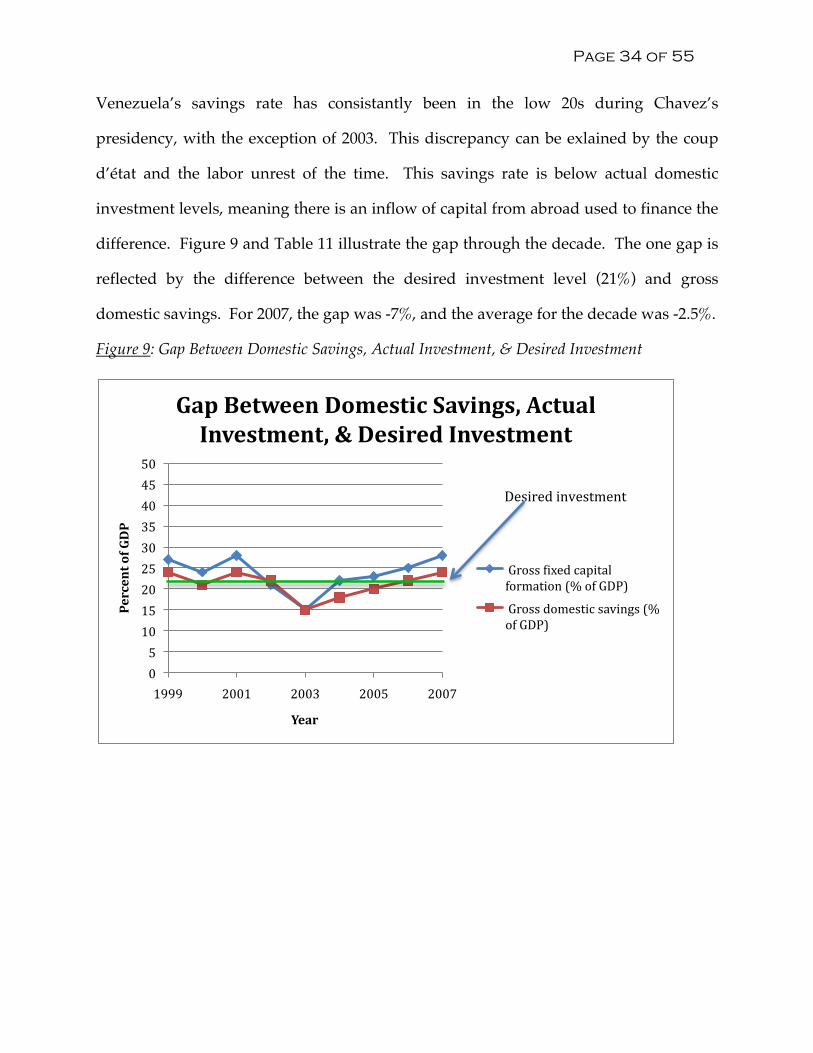
Venezuela’s savings rate has consistantly been in the low 20s during Chavez’s
presidency, with the exception of 2003. This discrepancy can be exlained by the coup
d’état and the labor unrest of the time. This savings rate is below actual domestic
investment levels, meaning there is an inflow of capital from abroad used to finance the
difference. Figure 9 and Table 11 illustrate the gap through the decade. The one gap is
reflected by the difference between the desired investment level (21%) and gross
domestic savings. For 2007, the gap was -7%, and the average for the decade was -2.5%.
Figure 9: Gap Between Domestic Savings, Actual Investment, & Desired Investment
0 5 10 15 20 25 30 35 40 45 50
1999 2001 2003 2005 2007
Percent of GDP
Year
Gap Between Domestic Savings, Actual Investment, & Desired Investment
Gross _ixed capital formation (% of GDP)
Gross domestic savings (% of GDP)
Desired investment
Page 35 of 55
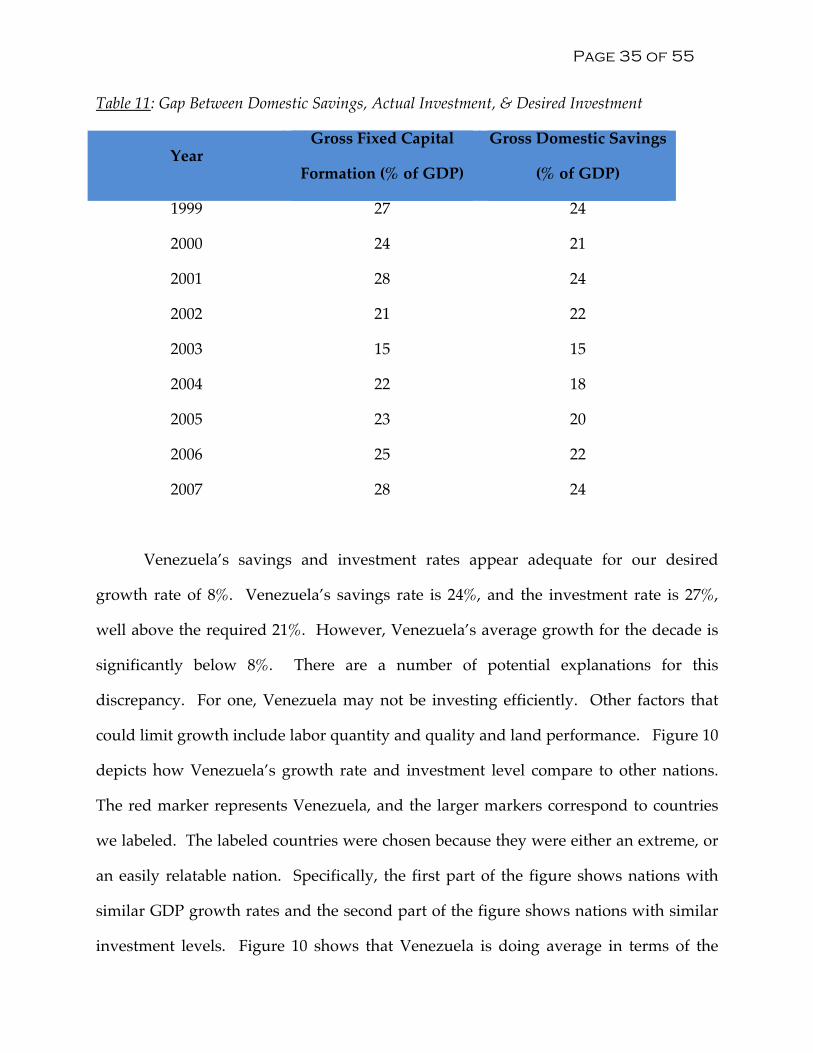
Table 11: Gap Between Domestic Savings, Actual Investment, & Desired Investment
Year Gross Fixed Capital
Formation (% of GDP)
Gross Domestic Savings
(% of GDP)
1999 27 24
2000 24 21
2001 28 24
2002 21 22
2003 15 15
2004 22 18
2005 23 20
2006 25 22
2007 28 24
Venezuela’s savings and investment rates appear adequate for our desired
growth rate of 8%. Venezuela’s savings rate is 24%, and the investment rate is 27%,
well above the required 21%. However, Venezuela’s average growth for the decade is
significantly below 8%. There are a number of potential explanations for this
discrepancy. For one, Venezuela may not be investing efficiently. Other factors that
could limit growth include labor quantity and quality and land performance. Figure 10
depicts how Venezuela’s growth rate and investment level compare to other nations.
The red marker represents Venezuela, and the larger markers correspond to countries
we labeled. The labeled countries were chosen because they were either an extreme, or
an easily relatable nation. Specifically, the first part of the figure shows nations with
similar GDP growth rates and the second part of the figure shows nations with similar
investment levels. Figure 10 shows that Venezuela is doing average in terms of the

Page 36 of 55
quality of its investments, but there is always room for improvement. There are some
outlier nation, such as Macao and Uganda, which have achieved high growth with low
investment rates, implying extremely efficient investment. Venezuela could increase
the efficiency and quality of its investment, especially in the petroleum sector.
Venezuela’s average growth rate over the past five years is over 10%. During that
same period, oil prices have increased significantly. Improved investment in oil
infrastructure could allow Venezuela to maintain this strong growth.33
33 All statistics are from WDI.

Page 37 of 55
Figure 10: GDP Growth Rate and Fixed Capital Formation Rate
3
3.1
3.2
3.3
3.4
3.5
3.6
3.7
3.8
3.9
10.0 12.0 14.0 16.0 18.0 20.0 22.0 24.0 26.0 28.0 30.0
GDP Growth Rate
Fixed Capital Formation (% of GDP)
GDP Growth & Fixed Capital Formation Rate 1999-2008 Average: GDP Growth Focus
Australia
Saudi Arabia
Macedonia, FYR
0.000
2.000
4.000
6.000
8.000
10.000
12.000
14.000
20.400 20.600 20.800 21.000 21.200 21.400 21.600 21.800 22.000 22.200
GDP Growth Rate
Fixed Capital Formation (% of GDP)
GDP Growth & Fixed Capital Formation Rate 1999-2008 Average: Fixed Capital Focus
Venezuela
Macao
Ukraine
Switzerland Italy
Uganda
Guinea
Venezuela
Page 38 of 55
The Two Gap
The two gap is the difference between desired imports and available foreign
exchange. It is an essential measure to consider for development analysis, as nations
require hard currency in order to import goods necessary for development. In
analyzing the two gap, it is important to examine various data and statistics, all of
which affect the currency prospects of a country in different ways. These data include:
the composition and price elasticity of exports and imports; trends in the terms of trade;
liabilities that must be serviced, especially debt; available transfers; and foreign
investment opportunities.
Currency
Venezuela’s currency has been the bolivar fuerte since January 2008. The bolivar
fuerte replaced the bolivar, which had been in use since 1879. The new bolivar fuerte is
1000 times stronger than the old bolivar. In addition, in January 2010 the Venezuelan
government introduced a devalued dual exchange rate. Categories of imported goods
now include “essentials” and “non-essentials”. Essential goods include food, health-
related supplies, and education-related supplies. Non-essentials range from oil to
manufactured goods. Each category has its own exchange rate; the essentials exchange
rate is pegged at 2.6 bolivars fuerte to 1 USD while the non-essentials exchange rate is
pegged at 4.3 bolivars fuerte to 1 USD. The goal of this policy is to promote long-term
growth and development of the domestic economy by limiting imports.
Figure 11 shows the general movements of the bolivar from 1999 to 2007. Over
this time period, we observe a steady devaluation of the currency. At the beginning of
the time period, the bolivar had been on a crawling peg regime, which allows gradual
movements in the currency value. Between 2002 and 2003, we observe a lot of volatility
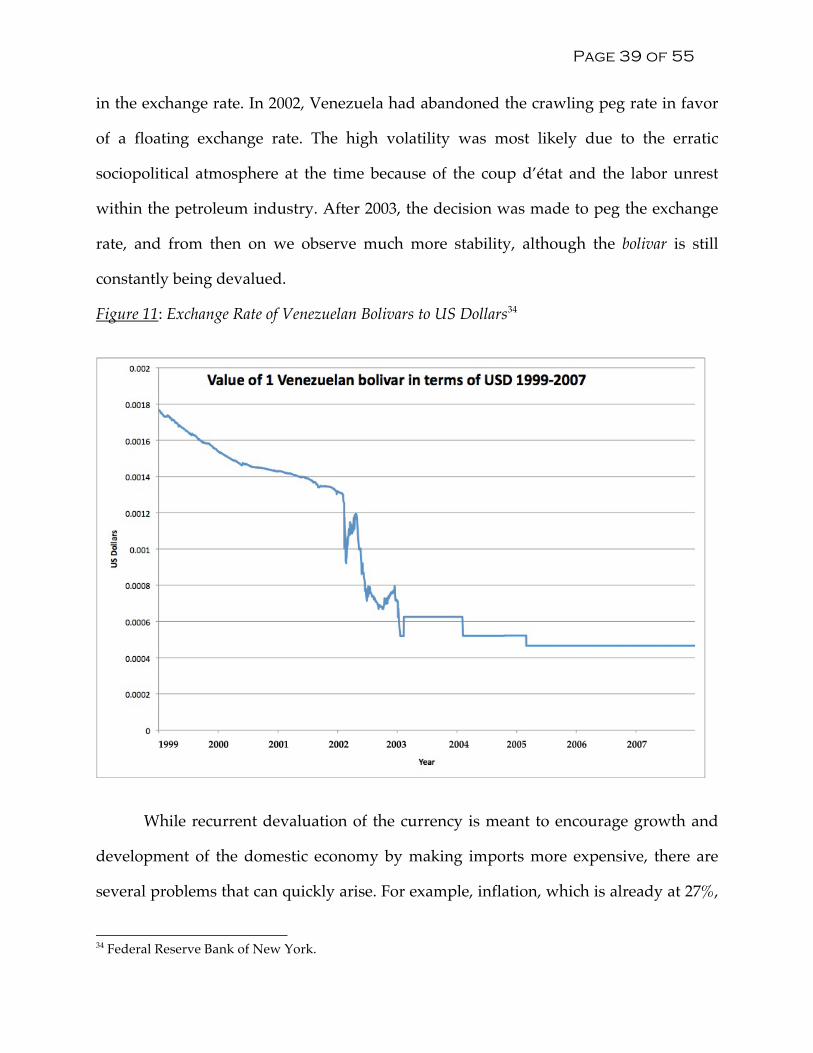
Page 39 of 55
in the exchange rate. In 2002, Venezuela had abandoned the crawling peg rate in favor
of a floating exchange rate. The high volatility was most likely due to the erratic
sociopolitical atmosphere at the time because of the coup d’état and the labor unrest
within the petroleum industry. After 2003, the decision was made to peg the exchange
rate, and from then on we observe much more stability, although the bolivar is still
constantly being devalued.
Figure 11: Exchange Rate of Venezuelan Bolivars to US Dollars34
While recurrent devaluation of the currency is meant to encourage growth and
development of the domestic economy by making imports more expensive, there are
several problems that can quickly arise. For example, inflation, which is already at 27%,
34 Federal Reserve Bank of New York.

Page 40 of 55
could worsen by as much as 5 percentage points, according to Venezuelan Finance
Minister Ali Rodriguez.35 Furthermore, there is no guarantee that a currency
devaluation will yield a more vibrant domestic economy, especially because the
essentials exchange rate is valued at 2.6 bolivars fuerte to 1 USD, making it relatively
cheap for Venezuelans to continue to import essential goods rather than producing
them domestically. While the reasoning behind this dual exchange rate is to promote
the domestic production of non-essential goods, it does nothing to help domestic
producers of essential goods. A lack of domestic production of essentials may prove to
be a risky move in the long run.
Composition of Exports and Imports
The nature of a country’s exports and imports can be extremely useful in
understanding its two gap. In the case of Venezuela, it is important to note, as shown in
Table 12, that oil exports account for a tremendous percentage of Venezuela’s exports,
and consequently, that non-oil imports account for an equally high percentage of its
imports. These percentages are reflected in Figure 12, and they show that the
composition of both exports and imports has remained fairly stable for the period 1997
to 2009. This indicates that President Chavez has continued to focus his attention on the
strength of the petroleum sector. However, it is also important to note that Venezuela’s
dependence on oil places it in a position of subordinance to the oil market, a market
which has experienced periods of extreme volatility in the past. Therefore, a possible
course of action for the future may be to seek to reduce Venezuela’s dependence on oil
exports and non-oil imports by building the relative strength of other sectors of the
economy.
35 “Chavez Devalues Venezuela’s Currency.” The Wall Street Journal. January 9, 2010.
Page 41 of 55
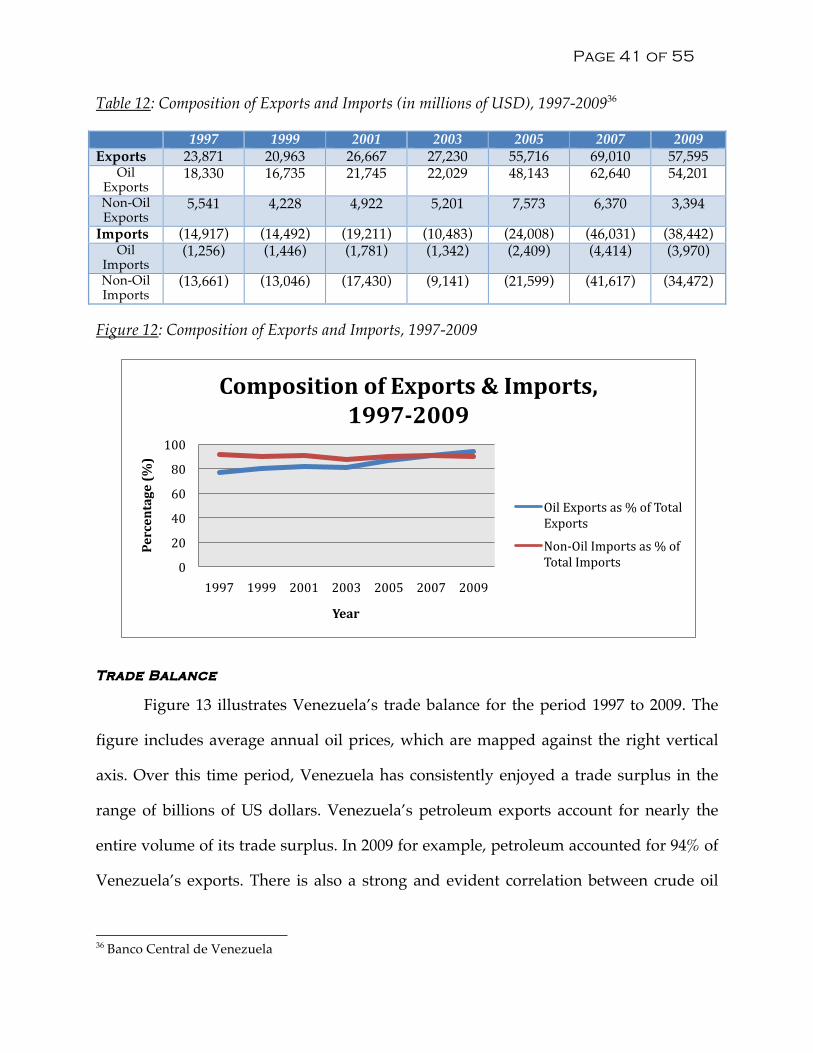
Table 12: Composition of Exports and Imports (in millions of USD), 1997-200936
1997 1999 2001 2003 2005 2007 2009 Exports 23,871 20,963 26,667 27,230 55,716 69,010 57,595
Oil Exports
18,330 16,735 21,745 22,029 48,143 62,640 54,201
Non-Oil Exports
5,541 4,228 4,922 5,201 7,573 6,370 3,394
Imports (14,917) (14,492) (19,211) (10,483) (24,008) (46,031) (38,442) Oil
Imports (1,256) (1,446) (1,781) (1,342) (2,409) (4,414) (3,970)
Non-Oil Imports
(13,661) (13,046) (17,430) (9,141) (21,599) (41,617) (34,472)
Figure 12: Composition of Exports and Imports, 1997-2009
Trade Balance
Figure 13 illustrates Venezuela’s trade balance for the period 1997 to 2009. The
figure includes average annual oil prices, which are mapped against the right vertical
axis. Over this time period, Venezuela has consistently enjoyed a trade surplus in the
range of billions of US dollars. Venezuela’s petroleum exports account for nearly the
entire volume of its trade surplus. In 2009 for example, petroleum accounted for 94% of
Venezuela’s exports. There is also a strong and evident correlation between crude oil
36 Banco Central de Venezuela
0
20
40
60
80
100
1997 1999 2001 2003 2005 2007 2009
Percentage (%)
Year
Composition of Exports & Imports, 1997-2009
Oil Exports as % of Total Exports
Non-‐Oil Imports as % of Total Imports
Page 42 of 55
prices, export levels, and the trade balance. Venezuela’s reliance on oil is risky and
unsustainable in the long term. Without oil, Venezuela would most likely generate
massive trade deficits, especially given its dependence on imports. Furthermore, a
heavy reliance on oil puts Venezuela at the mercy of both the dollar as well as the
international economy. As is evident in the massive swings in export totals in 2007,
2008, and 2009, Venezuela can neither control nor predict the profits that oil exports will
generate. This makes economic policy and planning difficult in the short term. In the
long term, Venezuela’s current economic paradigm with regard to trade is not feasible.
Oil is a nonrenewable resource, and while Venezuela’s reserves are vast (between 50
and 150 years remaining, depending on method of projection), they are also finite. It
will be difficult for Venezuela to maintain a trade surplus into the future as the
inevitable transition away from oil and towards other sources of energy begins to occur.

Page 43 of 55
Figure 13: Exports, Imports, Oil Prices, and the Trade Balance, 1997-200937
Debt
The debt level of a given country can be extremely helpful in understanding its
two gap. Figure 14 provides the present values of debt as a percentage of GNI for
various Latin American countries. 38 It is important to note that Venezuela’s present
value of debt as a percentage of GNI is 48.2%; this percentage reflects the approximate
median of the data shown in Figure 14. This level of debt indicates that Venezuela is
37 Banco Central de Venezuela 38 The present value of debt is the sum of short-term external debt plus the discounted sum of total debt service payments due on public, publicly guaranteed, and private nonguaranteed long-term external debt over the life of existing loans. The GNI denominator is a three-year average.
$0.00
$10.00
$20.00
$30.00
$40.00
$50.00
$60.00
$70.00
$80.00
$90.00
$100.00
0
10,000
20,000
30,000
40,000
50,000
60,000
70,000
80,000
90,000
100,000
1996 1997 1998 1999 2000 2001 2002 2003 2004 2005 2006 2007 2008 2009 2010
USD
Millions of USD
Year
Exports, Imports, Oil Prices, and the Trade Balance 1997-2009
Exports Imports Trade Balance Oil Prices

Page 44 of 55
performing relatively well in comparison to other Latin American countries, and while
this debt is not an urgent issue, it must be addressed in the future.
Figure 14: Present Value of Debt as % of GNI, 200539
In addition to examining the present level of debt as a percentage of GNI, it is
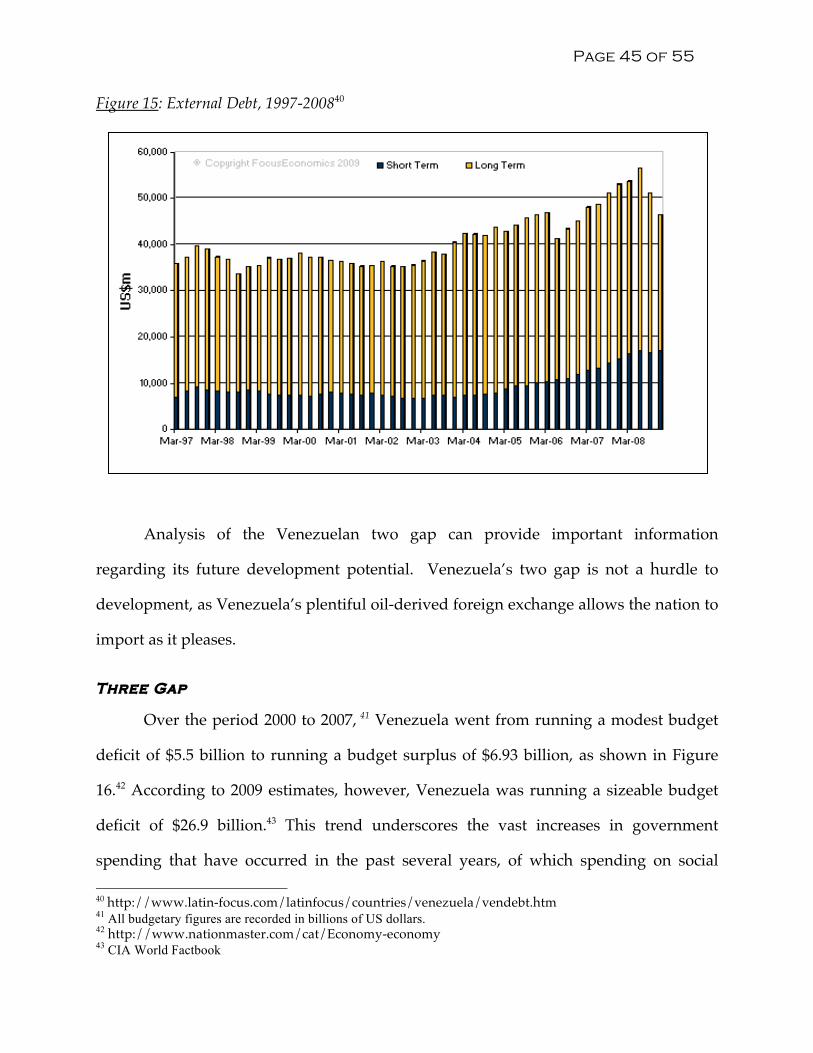
valuable to analyze the growth of that debt. Figure 15 shows Venezuela’s external debt,
both short term and long term, for the period 1997 to 2008. Total external debt has
generally increased from 2002 onward, a trend that reflects the massive levels of public
spending on social programs initiated by the Chavez administration under the banner
of “21st Century Socialism.”
39 http://www.nationmaster.com/graph/eco_pre_val_of_deb_of_gni-economy-present-value-debt-gni&date=2005
0
20
40
60
80
100
120
140
Uruguay
Belize
Panama
Guyana
Argentina
Ecuador
Paraguay
Chile
Peru
Venezuela
El Salvador
Nicaragua
Colombia
Bolivia
Honduras
Costa Rica
Brazil
Mexico
Guatem
ala
Percentage (%)
Country
Present Value of Debt as % of GNI
Present Value of Debt as % of GNI
Page 45 of 55
Figure 15: External Debt, 1997-200840
Analysis of the Venezuelan two gap can provide important information
regarding its future development potential. Venezuela’s two gap is not a hurdle to
development, as Venezuela’s plentiful oil-derived foreign exchange allows the nation to
import as it pleases.
Three Gap
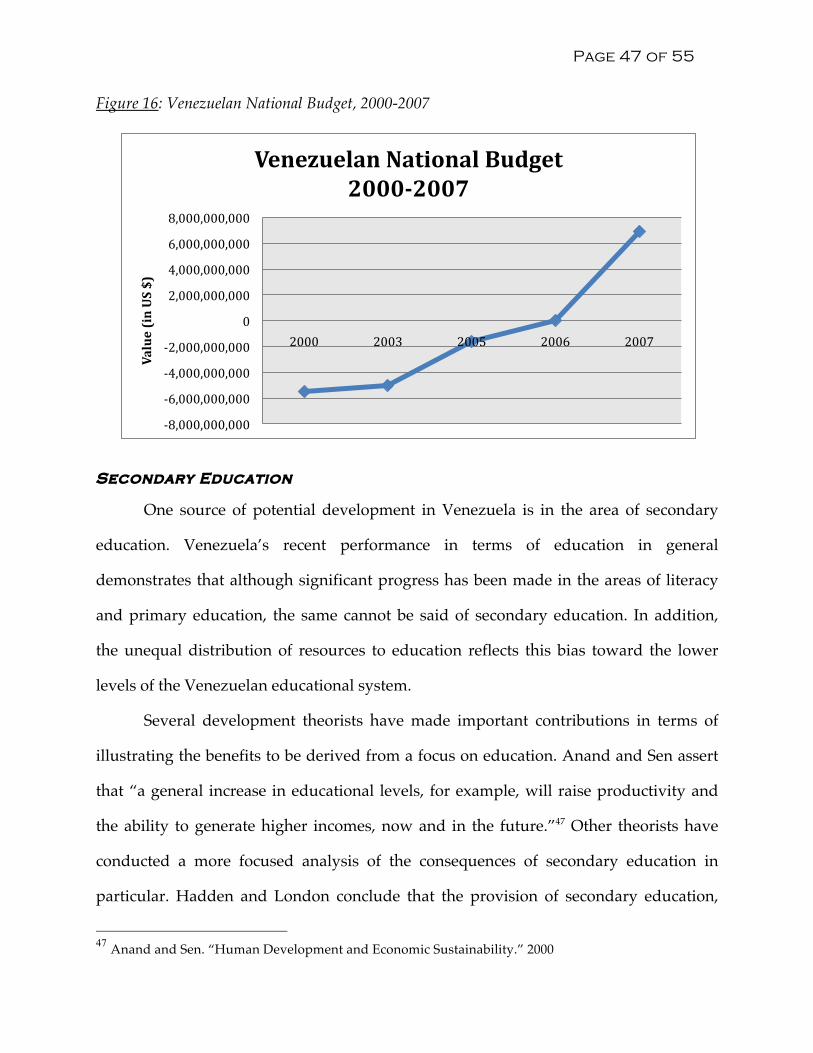
Over the period 2000 to 2007, 41 Venezuela went from running a modest budget
deficit of $5.5 billion to running a budget surplus of $6.93 billion, as shown in Figure
16.42 According to 2009 estimates, however, Venezuela was running a sizeable budget
deficit of $26.9 billion.43 This trend underscores the vast increases in government
spending that have occurred in the past several years, of which spending on social 40 http://www.latin-focus.com/latinfocus/countries/venezuela/vendebt.htm 41 All budgetary figures are recorded in billions of US dollars. 42 http://www.nationmaster.com/cat/Economy-economy 43 CIA World Factbook
Page 46 of 55
programs is an element of particular focus for the Chavez administration. Indeed,
45.73% of the proposed national budget for 2010 will be “directed towards social
spending aimed at poverty reduction and improving the quality of life for
Venezuelans” according to Alí Rodríguez Araque, the Venezuelan Minister for Finances
and the Economy.44 In addition to social spending, the national budget will also focus
on five strategic objectives in order to spur growth: increase food production and move
towards food sovereignty; address the housing shortage; develop and improve
infrastructure; boost energy production and distribution; realign the domestic financial
sector to promote productive sectors.45 Thus, it is clear that Venezuela’s budget
expenditures are directed toward both social programs as well as future growth. In
terms of budget revenues, Minister Rodríguez stated that tax revenues would finance
53% of the budget, oil revenues 24.7%, and the incursion of foreign debt the
remainder.46
Public debt is both manageable and sustainable in Venezuela. Trends in the
national budget demonstrate the relatively small need for Venezuela to borrow.
According to the CIA World Factbook, Venezuela’s debt was only 13.8% of GDP in
2008, and 19.4% of GDP in 2009. While this rise in debt from 2008 to 2009 is slightly
unsettling, the numbers still fall well within the range regarded to be acceptable.
Thus, we can conclude that Venezuela is willing to allocate its resources in such a
way as to achieve objectives of both growth and development. We further postulate that
the national government will be relatively receptive to the policy proposals we have
formulated. Two such proposals are discussed in the sections that follow.
44 http://venezuelanalysis.com/news/4881 45 http://venezuelanalysis.com/news/4881 46 http://venezuelanalysis.com/news/4881
Page 47 of 55
Figure 16: Venezuelan National Budget, 2000-2007
Secondary Education
One source of potential development in Venezuela is in the area of secondary
education. Venezuela’s recent performance in terms of education in general
demonstrates that although significant progress has been made in the areas of literacy
and primary education, the same cannot be said of secondary education. In addition,
the unequal distribution of resources to education reflects this bias toward the lower
levels of the Venezuelan educational system.
Several development theorists have made important contributions in terms of
illustrating the benefits to be derived from a focus on education. Anand and Sen assert
that “a general increase in educational levels, for example, will raise productivity and
the ability to generate higher incomes, now and in the future.”47 Other theorists have
conducted a more focused analysis of the consequences of secondary education in
particular. Hadden and London conclude that the provision of secondary education,
47 Anand and Sen. “Human Development and Economic Sustainability.” 2000
-‐8,000,000,000
-‐6,000,000,000
-‐4,000,000,000
-‐2,000,000,000
0
2,000,000,000
4,000,000,000
6,000,000,000
8,000,000,000
2000 2003 2005 2006 2007
Value (in US $)
Venezuelan National Budget 2000-2007
Page 48 of 55
and more especially the provision of secondary education for girls, can have
substantially positive effects in less developed countries.48 Indeed, their research shows
that secondary school enrollment and attendance have a noticeable effect on the overall
reduction of fertility as well as both infant and childhood mortality. Furthermore, these
effects are greater than those of primary school enrollment and attendance. Thus, while
a strong foundation in primary education is essential for stimulating initial
development, strength in secondary education is crucial for continuing that
development.
In the section that addresses recent trends in Venezuela in terms of education, we
took note of various trends in primary and secondary school enrollment rates, as well as
of public expenditure patterns with regards to the various levels of the educational
system. Thus, a brief reiteration of our findings will suffice to illustrate the significance
of focusing future resources on secondary education. While secondary school
enrollment rates increased from 47% to 68% over the period 1999 to 2007, these rates
remain below those of primary school enrollment. Furthermore, public expenditure on
secondary education is approximately half of public expenditure on primary education,
17% and 32% respectively. The percentage of the labor force with a secondary education
is also approximately half of the percentage of the labor force with a primary education,
30% and 61.9% respectively. In comparison to other Latin American countries, we
concluded that Venezuela’s performance could be deemed appropriate. This, however,
does not signify that the status quo is adequate and should remain unchanged.
In order to transform secondary education from an obstacle hindering
development to a source of development, we believe that a reconfiguration of the way
in which public expenditure is directed toward the various levels of the educational 48 Hadden and London. “Educating Girls in the Third World.” 1996
Page 49 of 55
system is necessary. More specifically, we regard it as essential that the Venezuelan
national government shifts its focus from primary education to secondary education.
Hence, we regard the Venezuelan state as a future partner in this approach to
development.
Constraints
Multiple actors and forces exist in Venezuela which could act as constraints on
the adoption or success of a development policy. These must be given adequate
consideration in order to arrive at a policy which is likely to be accepted and successful
given the political and economic climate of Venezuela. Even if a policy is accepted, it
could still face challenges during the execution phase in terms of financing and the
manner in which it is implemented.
An initial first obstacle to be aware of when attempting to make
recommendations to Venezuela on development is the government of Venezuela itself.
The adoption of a given policy could face severe disapproval based on President
Chavez’s ideological reasons alone. As an opponent of the Western standards of
requisites of economic development, such as capitalism and free trade, President
Chavez has chosen to approach the topic of development in an entirely different way.
President Chavez’s 2007 political campaign attacking globalization and existing
democratic institutions demonstrates his alternative perspective on the forces that spur
growth and development. Instead, he campaigned with a “21st Century Socialism”
platform, making it a major goal of the state to alleviate social problems. A key policy of
President Chavez’s is nationalization of key industries. In 2007 and 2008, Venezuela
took nationalization even further by taking the cement industry and the steel industry
Page 50 of 55
into state hands, as well as nationalizing the last remaining oil sites which were under
foreign control.49 By nationalizing key firms President Chavez displays his confidence in
the state over the private sector in being more efficient and bringing about economic
growth and development.
This sort of approach to development tremendously limits the scope of possible
development policies. Any slightly Western recommendations would be immediately
rejected and thus it is futile to even consider them as an option, even if we personally
deem them the best choice. The government of Venezuela will thus be the major
limiting factor in the adoption of certain development policies.
Even if our policy recommendations are accepted and adopted, however, there
are still potential downfalls while they are being implemented. Although currently
financing such policy changes is feasible as indicated by the budget surplus, we cannot
ignore the fact that the budget surplus is largely due to the unprecedented soaring
world oil prices. Venezuela’s oil accounts for 90% of revenues from all exports, over
50% of the government budget, and roughly 30% of the GDP. An economy so heavily
reliant on a natural resource can be dangerous. While during times of high oil prices the
domestic economy is positively affected with a huge increase in revenues, worse times
for oil prices have a strong negative implication on revenues. Any disruption in the
world oil market would tremendously impact Venezuela’s ability to follow through
with specific policies. There are a number of factors that could potentially influence
revenues earned from oil exports. These include a drop in the world price of oil, a
natural disaster that would reduce oil production, problems with aging petroleum
infrastructure, and other geopolitical issues. Notably, the United States is one of
Venezuela’s most important trading partners and tense relations between the two 49 “Venezuela’s new nationalization drive.” Reuters. 9 April 2008.
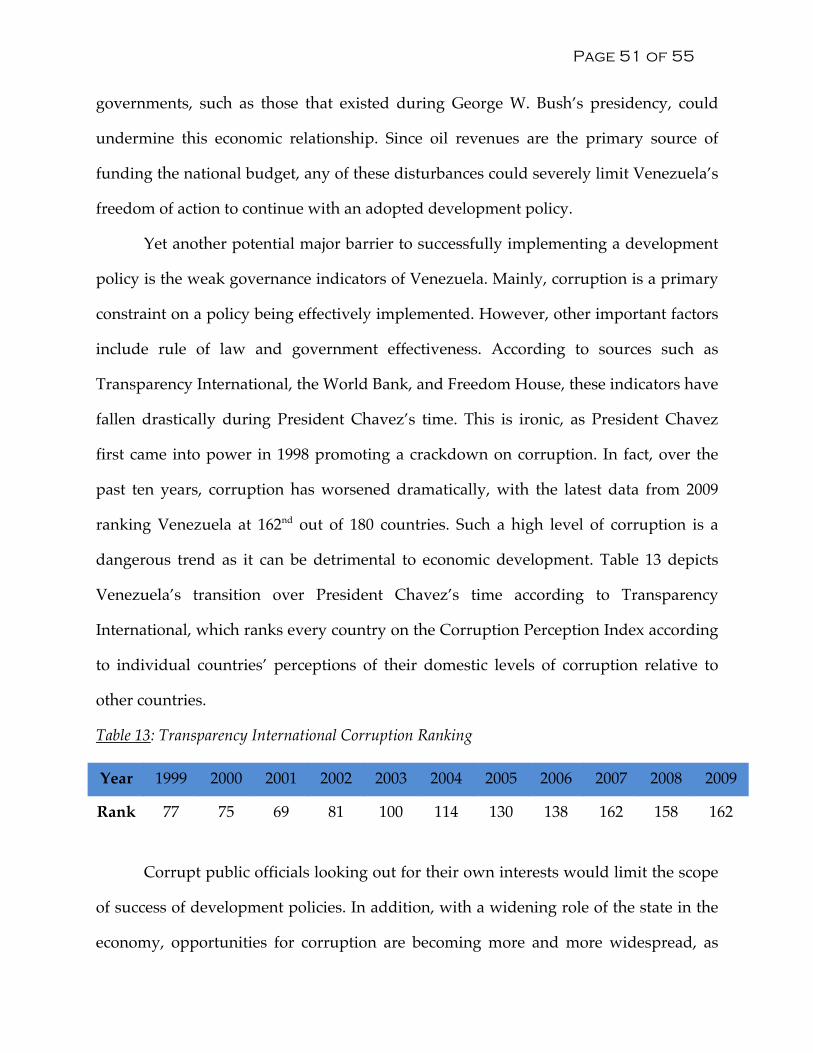
Page 51 of 55
governments, such as those that existed during George W. Bush’s presidency, could
undermine this economic relationship. Since oil revenues are the primary source of
funding the national budget, any of these disturbances could severely limit Venezuela’s
freedom of action to continue with an adopted development policy.
Yet another potential major barrier to successfully implementing a development
policy is the weak governance indicators of Venezuela. Mainly, corruption is a primary
constraint on a policy being effectively implemented. However, other important factors
include rule of law and government effectiveness. According to sources such as
Transparency International, the World Bank, and Freedom House, these indicators have
fallen drastically during President Chavez’s time. This is ironic, as President Chavez
first came into power in 1998 promoting a crackdown on corruption. In fact, over the
past ten years, corruption has worsened dramatically, with the latest data from 2009
ranking Venezuela at 162nd out of 180 countries. Such a high level of corruption is a
dangerous trend as it can be detrimental to economic development. Table 13 depicts
Venezuela’s transition over President Chavez’s time according to Transparency
International, which ranks every country on the Corruption Perception Index according
to individual countries’ perceptions of their domestic levels of corruption relative to
other countries.
Table 13: Transparency International Corruption Ranking
Year 1999 2000 2001 2002 2003 2004 2005 2006 2007 2008 2009
Rank 77 75 69 81 100 114 130 138 162 158 162
Corrupt public officials looking out for their own interests would limit the scope
of success of development policies. In addition, with a widening role of the state in the
economy, opportunities for corruption are becoming more and more widespread, as
Page 52 of 55
more individuals are being placed in positions of public power which they could easily
abuse for private gains. The selective enforcement of good government laws and
regulations that President Chavez’s government practices is extremely biased as it only
hurts any opposing groups and neglects to punish others.50
It is clear that corruption exists and has become significantly worse in Venezuela
over the last decade. There are several reasons as to how corruption can have a negative
impact on growth and development. For example, public officials receiving private
gains have little incentives to work towards development for the rest of the population.
In addition, corruption can bring about the diversion of funds from an efficient use to a
less efficient use. Corruption may mean that the most qualified lose while those that
have the ability to partake in the corrupt activities benefit. Ultimately, corruption can
imply a loss of confidence in the government by the public. The effects of corruption on
the economy can be extremely unfavorable, and it is crucial to consider any potential
policy recommendation in the context of corruption and see what kind of implications
that will have.
In addition to corruption, rule of law is an important governance indicator which
can play a constraining role to certain development policies. The rule of law is based on
individuals’ perception of the government’s creation and fair enforcement of law.
Venezuela has experienced a drastic drop in the rule of law category over the past few
years. Table 14 displays Venezuela’s falling rule of law percentile ranking relative to
other countries.
50 Freedom House.
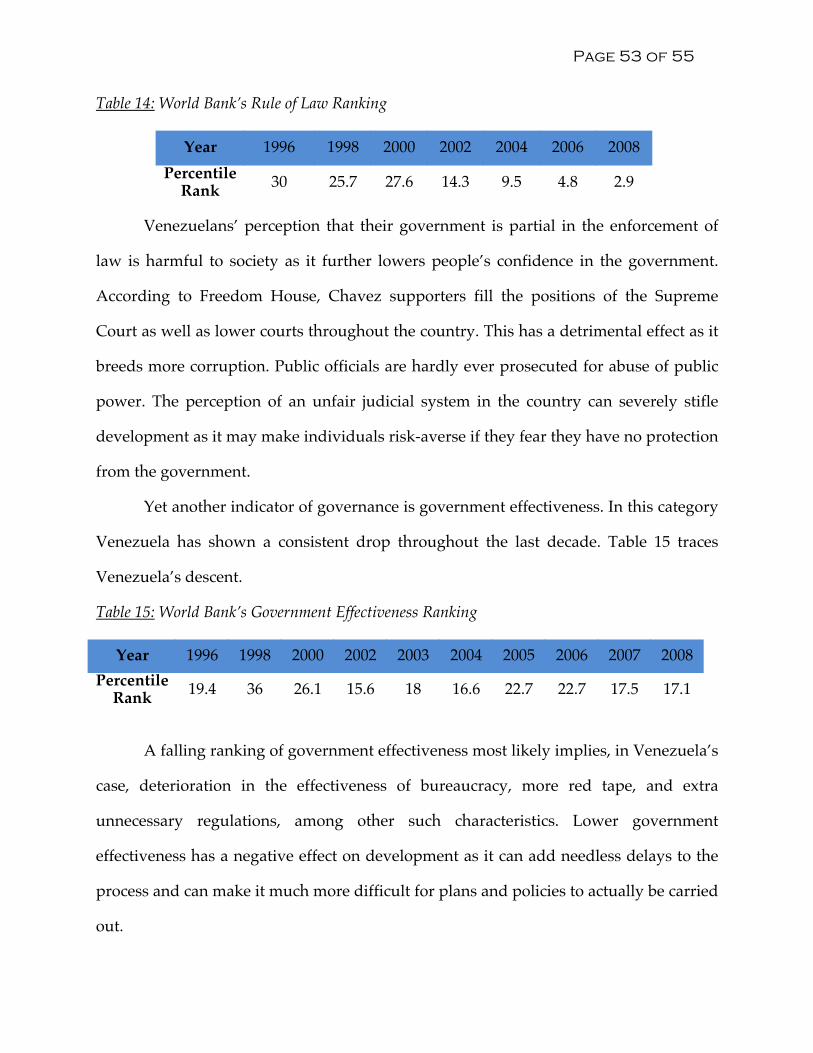
Page 53 of 55
Table 14: World Bank’s Rule of Law Ranking
Year 1996 1998 2000 2002 2004 2006 2008 Percentile
Rank 30 25.7 27.6 14.3 9.5 4.8 2.9 Venezuelans’ perception that their government is partial in the enforcement of
law is harmful to society as it further lowers people’s confidence in the government.
According to Freedom House, Chavez supporters fill the positions of the Supreme
Court as well as lower courts throughout the country. This has a detrimental effect as it
breeds more corruption. Public officials are hardly ever prosecuted for abuse of public
power. The perception of an unfair judicial system in the country can severely stifle
development as it may make individuals risk-averse if they fear they have no protection
from the government.
Yet another indicator of governance is government effectiveness. In this category
Venezuela has shown a consistent drop throughout the last decade. Table 15 traces
Venezuela’s descent.
Table 15: World Bank’s Government Effectiveness Ranking
Year 1996 1998 2000 2002 2003 2004 2005 2006 2007 2008 Percentile
Rank 19.4 36 26.1 15.6 18 16.6 22.7 22.7 17.5 17.1
A falling ranking of government effectiveness most likely implies, in Venezuela’s
case, deterioration in the effectiveness of bureaucracy, more red tape, and extra
unnecessary regulations, among other such characteristics. Lower government
effectiveness has a negative effect on development as it can add needless delays to the
process and can make it much more difficult for plans and policies to actually be carried
out.
Page 54 of 55
There are many constraints facing us in developing a realistic policy proposal for
Venezuela, mainly the ideology of President Chavez, oil dependence, and the rampant
corruption levels in the country among other poor performing governance indicators.
These are obstacles we have considered and are trying to overcome in order to produce
recommendations we think will be adopted as well as implemented successfully.
Policy Proposals
Investment in Secondary Education
The first policy change we propose is increased investment in secondary
education. Recent trends in secondary school enrollment rates demonstrate the relative
necessity of emphasizing this level of the educational system. We suggest that, in light
of the fact that the national government already devotes a great deal of its resources to
social programs, a renewed focus on secondary education in particular will reflect
President Chavez’s vision of “21st Century Socialism.” In addition, we strongly believe
that seeking to overcome this obstacle to development will yield positive results, the
most notable being a widespread increase in the country’s supply of human capital.
Such an increase will in turn enhance Venezuela’s ability to achieve other
developmental objectives.
Control of Corruption
The next policy change we propose would aim to decrease the rampant
corruption which acts as an obstruction to development. Since corruption diverts the
efficient use of funds for other less efficient uses, Venezuela’s deteriorating position in
terms of corruption over the past decade has most likely slowed down Venezuela’s
development and had corruption been nonexistent, we would expect to see Venezuela
Page 55 of 55
more developed than it actually is today. Strong anti-corruption policies would need to
be enacted as well as enforced in a fair manner in order to have a chance at successfully
combating corruption. A less corrupt government would be more likely to look out for
the interests of the general population rather than its own interests. Reducing
corruption would thus enable development to further thrive.
Investment In Oil
A last possible policy proposal revolves around the oil sector. Current policy
diverts significant sums of oil revenue to non-oil projects. While this provides short-
term benefits to the nation, it leaves the oil sector in danger of falling into obsolescence.
Thus, we propose a renewed focus on oil infrastructure, especially in the Orinoco Belt
region. The oil in this region is more difficult to extract, and will require a significant
investment. Venezuela must make this investment, as large portions of its proven
reserves exist there.