Embed Size (px)
Citation preview

1
01/12/15
Risk factors for Cardiovascular Disease in Type 1 Diabetes
The Diabetes Control and Complications Trial (DCCT)-Epidemiology of Diabetes Interventions and
Complications (EDIC) Research Group*
*A complete list of participants in the DCCT-EDIC Research Group is presented in the
Supplementary Material published online for the article in N Engl J Med 2015;372:1722-33.
Running title: Risk Factors for CVD in T1D
Writing Group: David M. Nathan1, Ionut Bebu
2, Barbara H. Braffett
2, Trevor J. Orchard
3,
Catherine C. Cowie4, Maria Lopes-Virella
5, Mark Schutta
6, John M. Lachin
2
1. Massachusetts General Hospital, Harvard Medical School, Boston, MA
2. The Biostatistics Center, George Washington University, Rockville, MD
3. Graduate School of Public Health, University of Pittsburgh, Pittsburgh, PA
4. National Institute of Diabetes and Digestive and Kidney Diseases, Bethesda, MD
5. Medical University of South Carolina, Charleston, SC
6. Hospital of the University of Pennsylvania, Philadelphia, PA
Corresponding Author:
John M. Lachin, Sc.D.
The Biostatistics Center
The George Washington University
6110 Executive Blvd. Rockville, MD 20852
Telephone: (301) 881-9260
Fax: (301) 881-0179
Email: [email protected]
Clinical Trials Registration Numbers: NCT00360893, NCT00360815
Type: Original Article for Diabetes.
Abstract: 195 words (max 200)
Text: 3976 words (max 4000)
Tables & Figures: 5 (4 & 1) (max 8)
Supplements for Web-only Publication: Yes
References: 44 (max 50)
Page 1 of 47 Diabetes
Diabetes Publish Ahead of Print, published online February 19, 2016

2
ABSTRACT
Risk factors for CVD are well-established in type 2 but not type 1 diabetes (T1DM). We
assessed risk factors in the long-term (mean 27 years) follow-up of the Diabetes Control and
Complications Trial (DCCT) T1DM cohort. Cox proportional hazards multivariate models assessed
the association of traditional and novel risk factors, including HbA1c, with major atherosclerotic
cardiovascular events (MACE: fatal or non-fatal myocardial infarction or stroke) and any-CVD
(MACE plus confirmed angina, silent MI, revascularization or congestive heart failure). Age and
mean HbA1c were strongly associated with any-CVD and with MACE. For each percentage point
increase in mean HbA1c, the risk for any-CVD and for MACE increased by 31% and 42%,
respectively. CVD and MACE were associated with seven other conventional factors such as blood
pressure, lipids and lack of ACE-inhibitor use, but not with gender. The areas under the receiver
operating characteristics curves for the association of age and HbA1c taken together with any-CVD
and for MACE were 0.70 and 0.77, respectively, and for the final models, including all significant
risk factors, were 0.75 and 0.82. Although many conventional CVD risk factors apply in T1DM,
hyperglycemia is an important risk factor second only to age.
Page 2 of 47Diabetes

3
Type 1 diabetes (TIDM) confers a high risk for cardiovascular disease (CVD) compared with
the age-matched non-diabetic population (1-3) that historically has also accounted for the majority of
premature mortality in type 1 diabetes and is associated with the development of nephropathy (4-6).
The Diabetes Control and Complications Trial (DCCT) previously demonstrated that a mean
6.5 years of intensive diabetes therapy with a mean HbA1c of ~7% substantially reduced
microvascular complications, including nephropathy, compared with conventional therapy with
HbA1c of ~9% (7). After an additional 11 years of observational follow-up in the Epidemiology of
Diabetes Interventions and Complications (EDIC) study, the risk of major atherosclerotic
cardiovascular events (MACE: fatal or non-fatal myocardial infarction or stroke) was reduced by
58%, and aggregate CVD (MACE plus confirmed angina, silent MI, revascularization or congestive
heart failure) by 42%, in the original intensive versus conventional therapy group (8).
In 2013 EDIC reached a pre-specified landmark of 100 former DCCT conventionally treated
subjects with an adjudicated CVD event that provides adequate power to describe risk factor effects
reliably in multivariate Cox proportional hazard regression models. We now present analyses of
established and putative risk factors for CVD, including glycemic control, after a mean of 27 years
of follow-up of the DCCT/EDIC cohort.
RESEARCH DESIGN AND METHODS
The detailed DCCT/EDIC methods have been described (9, 10). In brief, the DCCT (1983-
1993) was a controlled clinical trial of 1441 patients with T1DM randomized to either conventional
diabetes therapy or intensive therapy to assess whether reducing hyperglycemia would decrease the
risk of complications of TIDM. Conventional therapy utilized one or two daily injections of insulin
aimed at preventing symptoms of hypo- or hyper-glycemia but with no glucose targets. Intensive
therapy used multiple (>3) daily injections or insulin pump therapy, guided by self-monitoring of
Page 3 of 47 Diabetes

4
blood glucose, aimed at achieving glycemic control as close to the non-diabetic range as safely
possible.
Subjects
At DCCT baseline, the 13-39 year old study cohort included a primary prevention cohort
with 1-5 years diabetes duration, no retinopathy based on 7-field stereoscopic fundus photography
and <40 mg/24h of albuminuria. The secondary intervention cohort had 1-15 years duration,
minimal to moderate non-proliferative retinopathy and <200 mg/24h of albuminuria (9). Exclusion
criteria included neuropathy requiring therapy, hypertension (>140/90 mmHg or medication use) and
hyperlipidemia (a fasting serum cholesterol level ≥3 SD above age- and sex-specific means, or
medication use).
Risk Factors
Risk factors were assessed by standardized methods during DCCT/EDIC (9, 10). HbA1c
was measured by high performance liquid chromatography quarterly during DCCT and annually
during EDIC (11). Fasting lipoprotein levels and albuminuria were measured annually during
DCCT and on alternate years during EDIC. Serum creatinine was measured annually throughout.
The DCCT/EDIC central biochemistry laboratory performed all laboratory measurements with
standardized methods and long-term controls to guard against assay drift.
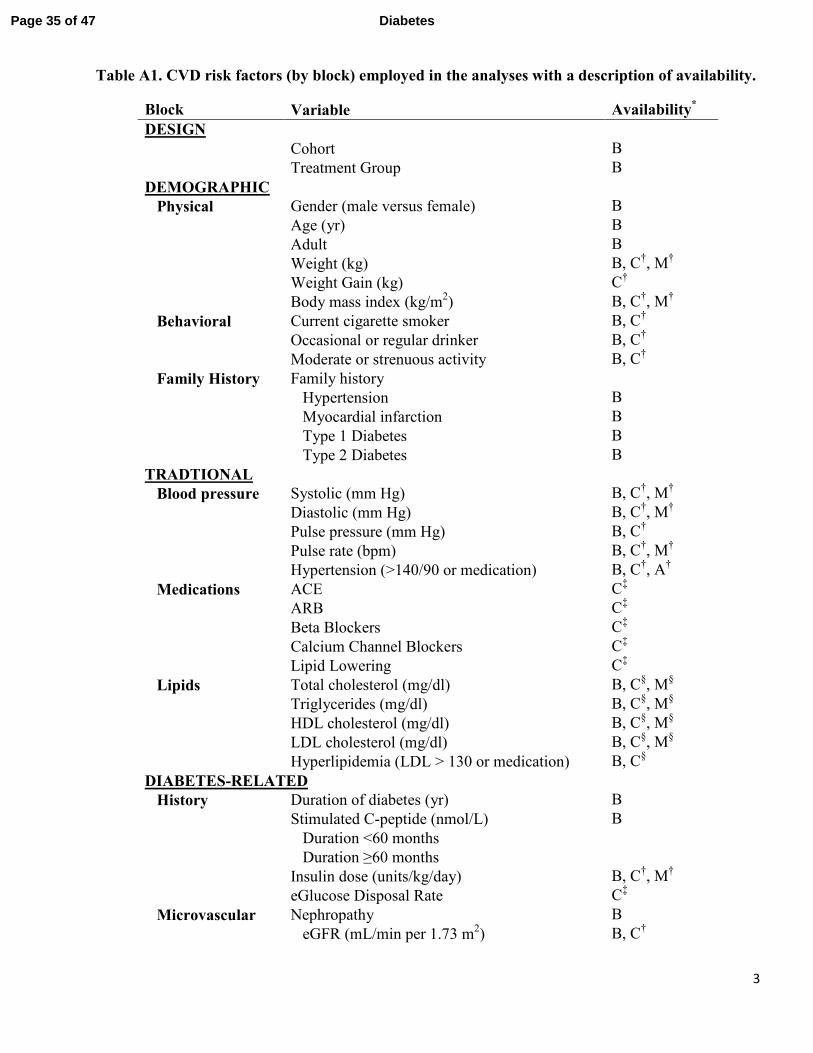
Candidate risk factors were grouped into the following 11 blocks (described in detail in
Supplementary Table 1): design (treatment group and cohort), physical (gender, age, weight, body
mass index), behavioral (smoking, alcohol intake, exercise), family history (of hypertension,
myocardial infarction (MI), and type 1 and type 2 diabetes), blood pressure/pulse (systolic and
diastolic blood pressure, pulse pressure, pulse rate), medication use (angiotensin converting enzyme
inhibitors, angiotensin receptor blockade, beta-adrenergic blockers, lipid-lowering agents, calcium
Page 4 of 47Diabetes

5
channel blockers), lipid levels (total cholesterol, triglycerides, LDL and HDL cholesterol levels),
diabetes specific (duration of diabetes, baseline stimulated C-peptide, daily insulin dose, estimated
glucose disposal rate (12)), microvascular complications (estimated GFR, albumin excretion rate,
presence of microalbuminuria, presence of macroalbuminuria), hypoglycemia events (episodes
requiring assistance, coma or seizure), and glycemia (HbA1c at eligibility and mean HbA1c during
DCCT/EDIC).
Some covariates were fixed (e.g. baseline) while others were time-dependent covariates
representing either the current (most recent) measurement, or the updated mean of all follow-up
values since randomization, or both. For covariates measured at different frequencies during DCCT
and EDIC (e.g. HbA1c), the updated time-weighted mean was computed weighting each value by
the interval between measurements.
Cardiovascular Outcomes
EDIC embargoed CVD risk factor analyses until 100 conventional group subjects had
experienced a CVD event. This led to data lock as of 12/31/13 for these analyses. CVD events were
ascertained based on the patient-reported updated annual CVD histories supported by medical
records, and annual centrally-graded electrocardiograms. Events were adjudicated and classified by a
committee masked to DCCT treatment assignment and HbA1c levels. (13)
The primary CVD outcome (“any-CVD”) was time to the first occurrence of cardiovascular
death, non-fatal myocardial infarction (MI), non-fatal stroke, subclinical myocardial infarction on
ECG, angina confirmed by ischemic changes with exercise tolerance testing or by clinically
significant obstruction on coronary angiography, revascularization (with angioplasty or coronary
artery bypass) or congestive heart failure (paroxysmal nocturnal dyspnea, orthopnea or marked
limitation of physical activity caused by heart disease). The secondary CVD outcome, major
Page 5 of 47 Diabetes

6
atherosclerotic cardiovascular events (MACE), a subset of any-CVD, included only the time to
cardiovascular death, non-fatal MI or non-fatal stroke, whichever occurred first.
Statistical Analysis
Quartiles describe quantitative variables, and percentages describe discrete variables.
A Cox proportional hazards model with 100 conventional group CVD cases, or
approximately 150 cases in the combined cohort, provided 97% power to detect a 30% risk reduction
per SD change in a factor adjusted for 10 other covariates with an R2=0.35 with that factor, and
using a test at the 0.01 level (two-sided). (14).
The analysis was based on the time to the first component event for each outcome (any-CVD
or MACE). The Kaplan-Meier method estimated the probability of remaining CVD- or MACE-free
over time (i.e. the “survival” function). Semi-parametric Cox proportional hazards models assessed
the influence of fixed and time-dependent covariates on risk of CVD/MACE. (15) Smoothing splines
assessed the shape of the empirical log hazard functions of any-CVD and MACE over the range of
age and weighted-mean HbA1c. (16).
Given the large number of risk factors, variables were entered into the Cox proportional
hazards model one block at a time in the order displayed in Supplement Table A1, starting with
design factors, then demographic-physical, etc. Details of the variable selection/deletion process are
described in the Supplementary Material. Briefly, after adding each block, a variable is deleted if not
nominally significant, and yields a poor Akaike Information Criterion (17), and has a penalized
likelihood estimate of zero. (18) After the last block is entered, the final model is fit using the
selected covariates. Two additional sensitivity analyses started with the complete set of variables
followed by subset selection based either on the Akaike Information Criterion or the penalized
Page 6 of 47Diabetes

7
likelihood. Interaction terms investigated gender differences in the effect of covariates on risk of
CVD.
There is no standard measure of the proportion of variation explained by a factor in the Cox
PH model. However, in other models the measure of R2 is directly proportional to the test statistic
value or inversely proportional to the p-value. Accordingly, the Z-test value is used to measure the
relative strength of the predictive association with CVD risk.
The area under the receiver operating characteristics curve (AUC=sensitivity versus 1 –
specificity) describes the predictive accuracy of a model, with AUC=0.5 meaning chance
predictions, and AUC=1 providing 100% accurate predictions. To allow for time-dependent
covariates, a separate model was fit for each year of follow-up and the simple average of the separate
AUC estimates was obtained. The AUC value can be interpreted as the probability that a subject
who experienced an event has a higher risk score than a subject who is event-free.
RESULTS
As of 12/31/13, 85.8% of the original cohort (93.2% of the 1327 surviving participants) was
under active follow-up, with a median follow-up of 27 years. All total, 184 subjects had a CVD
event (any-CVD cases) and 88 had MACE, with 82 CVD and 39 MACE intensive group cases and
102 CVD and 49 MACE conventional group cases. Approximately 85% of the cohort remained free
of any-CVD after 27 years of follow-up, and over 90% were free of MACE (Figure 1).
Baseline Characteristics
Table 1 shows the baseline characteristics of the DCCT cohort as a whole, and among those
who did versus did not have any-CVD event, and the corresponding hazard ratio without adjustment
for other factors. Supplementary Table A2 shows the baseline characteristics for subjects with and
without a MACE event. At baseline, 53% of the participants were men, the median age was 27
Page 7 of 47 Diabetes

8
years, duration of diabetes was 49 months, HbA1c was 8.8% (73 mmol/mol) and 19% were smokers.
Nominally significant baseline factors associated with a higher risk of any-CVD included the
secondary versus primary cohort, older age, greater weight and body mass index (BMI) in women
but not men, smoking, longer duration of diabetes, family history of MI and of type 2 diabetes,
higher blood pressure and pulse, and higher total cholesterol, triglyceride, LDL-cholesterol (LDLc)
and HbA1c levels. These risk factors were also associated with MACE, albeit with lower degrees of
significance, presumably owing to fewer events (See Supplemental Table A.2). Of note, the rate of
any-CVD and MACE were not statistically different between men and women, (p=0.98 and 0.23,
respectively, Table 1 and Supplemental Table A2).
Time-Dependent Characteristics
Table 2 presents the hazard ratios for any-CVD and MACE based on the current value or the
updated mean value of each time-dependent covariate, without adjustment for other factors; and
Supplemental Tables A3 present the values of each covariate among those still at risk of any-CVD at
10, 20 and 25 years. During the study, weight and BMI increased among men and women, smoking
decreased, alcohol consumption increased and exercise declined, and there were age-related
increases in blood pressure and lipids and use of respective medications, and increases in the
prevalence of microvascular complications (Table A3). All of these, except for weight, alcohol
consumption and exercise, were significantly associated with the risk of any-CVD, much more so
than the baseline value. Similar associations were observed for MACE (Supplement Table A4).
Individual Covariate Effects
Age and time-weighted mean HbA1c levels were the most significant univariate risk factors
for any-CVD, with respective Z-test values of 8.1 and 6.6 (p <1.0E-10) each adjusted for the other,
and also for MACE. Figures A.1 and A.2 of the Supplemental Appendix show that the spline-
Page 8 of 47Diabetes
9
smoothed model-free estimates of the log (hazard) function for any-CVD and for MACE were both
strongly linear functions of age and time-weighted mean HbA1c.
Table 3 presents the covariates that remained significantly associated with any-CVD and
MACE after adjustment for age and time-weighted mean HbA1c. A higher risk of any-CVD was
predicted by family history of MI, higher blood pressure and pulse variables, use of calcium channel
blockers (but not the other “cardioprotective” medications), higher cholesterol, triglycerides and
LDLc, and lower HDLc (which became significant after adjustment), diabetes-related history
variables (including higher mean insulin dose), higher albumin excretion rate and history of micro-
and macroalbuminuria, but not eGFR. While use of ACE inhibitors was not significant alone or
when adjusted for age and time-weighted HbA1c, it became significant when also adjusted for blood
pressure levels.
Similarly, a higher risk of MACE was predicted by the same set of factors with the
exceptions that higher insulin dose and microalbuminuria were not significant, but
macroalbuminuria (AER≥300 mg/24 h) was significant.
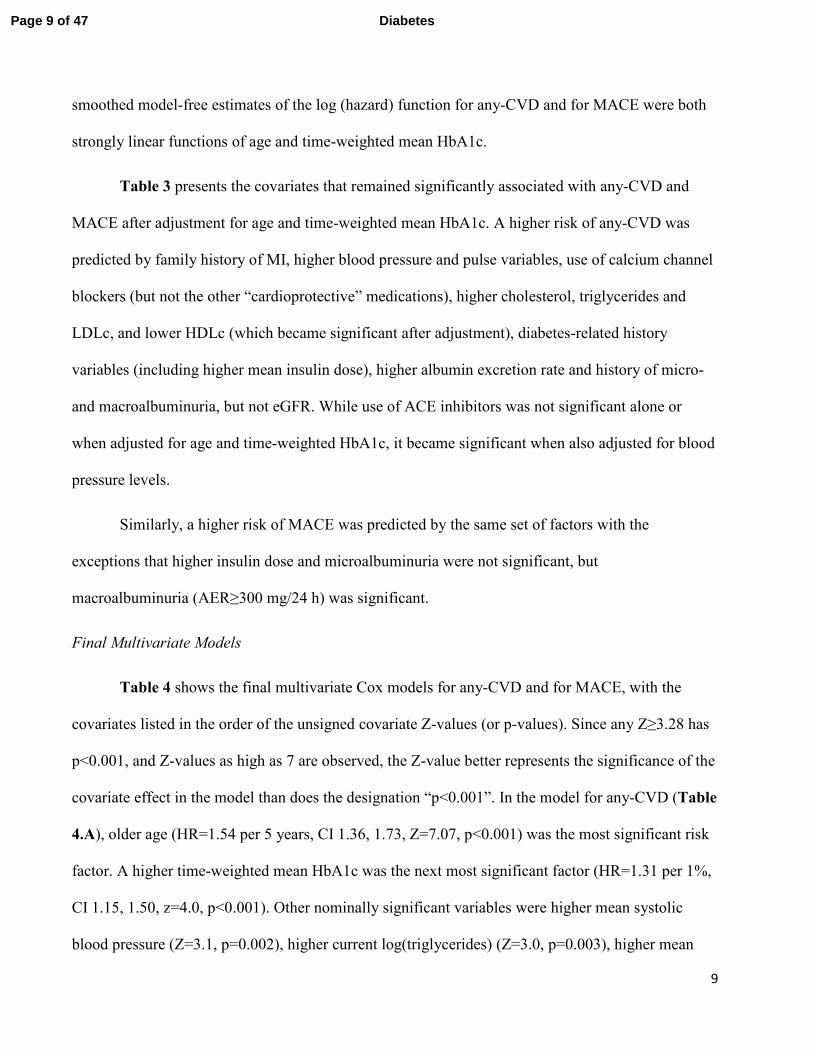
Final Multivariate Models
Table 4 shows the final multivariate Cox models for any-CVD and for MACE, with the
covariates listed in the order of the unsigned covariate Z-values (or p-values). Since any Z≥3.28 has
p<0.001, and Z-values as high as 7 are observed, the Z-value better represents the significance of the
covariate effect in the model than does the designation “p<0.001”. In the model for any-CVD (Table
4.A), older age (HR=1.54 per 5 years, CI 1.36, 1.73, Z=7.07, p<0.001) was the most significant risk
factor. A higher time-weighted mean HbA1c was the next most significant factor (HR=1.31 per 1%,
CI 1.15, 1.50, z=4.0, p<0.001). Other nominally significant variables were higher mean systolic
blood pressure (Z=3.1, p=0.002), higher current log(triglycerides) (Z=3.0, p=0.003), higher mean
Page 9 of 47 Diabetes

10
pulse rate (Z=2.8, p=0.005), longer duration of diabetes (Z=2.5, p=0.02), absent use of ACE
inhibitor (Z=-2.3, p=0.03, ACEi use being protective), family history of MI (Z=2.15, p=0.04) and
higher updated mean LDLc (Z=2.07, p=0.04). Thus, age is by far the most significant factor
followed by HbA1c that is more significant than any other factor in the model, even after adjusting
for age and the other factors.
The final time-dependent Cox model was fit separately in men and women (Supplemental
Tables A5 and A6). Non-significant interaction terms between gender and each of the variables in
the multivariable model indicated that the coefficients for men and women were not significantly
different.
The multivariable Cox model for MACE (Table 4.B) was very similar to that for any-CVD
even though there were fewer cases of MACE. Again, age was by far the most significant factor
followed by time-weighted mean HbA1c and then other factors. The only differences between the
sets of variables in the MACE versus any-CVD models were that smoking replaced family history of
MI, while the current LDLc value replaced the updated mean LDLc. For each factor that appears in
both models in the same manner, the coefficient was somewhat higher in the MACE versus the any-
CVD model but the confidence limits were wider owing to the fewer MACE events.
These models for any-CVD and MACE were obtained from a joint forward addition and
backwards elimination of successive blocks of covariates (see methods). Two sensitivity analyses
were also conducted using different model selection methods (see methods). Both analyses selected
the same sets of covariates for any-CVD and MACE as presented in Table 4.
The AUC measure of predictive ability for each outcome (any-CVD and MACE) was
assessed for a Cox model with age as the only covariate, another with age and time-weighted mean
Page 10 of 47Diabetes
11
HbA1c, and the other using the full model. The respective AUC values were 0.67, 0.70, and 0.75 for
any-CVD and 0.71, 0.77, and 0.82 for MACE.
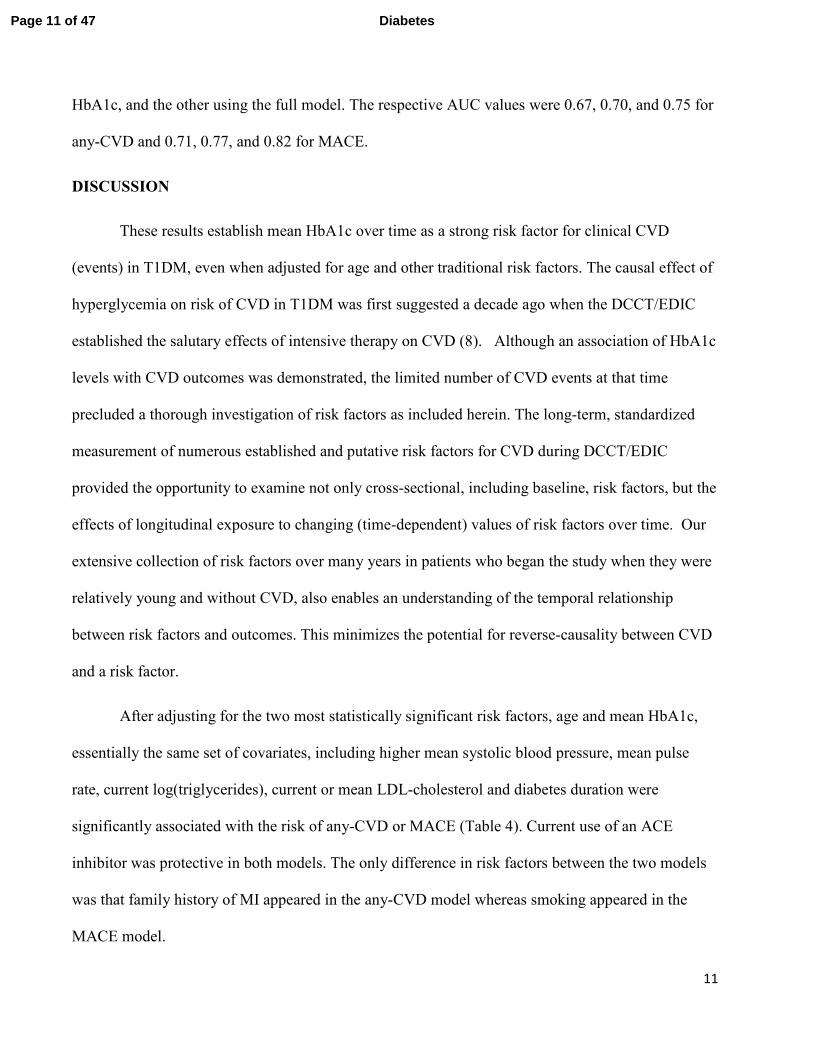
DISCUSSION
These results establish mean HbA1c over time as a strong risk factor for clinical CVD
(events) in T1DM, even when adjusted for age and other traditional risk factors. The causal effect of
hyperglycemia on risk of CVD in T1DM was first suggested a decade ago when the DCCT/EDIC
established the salutary effects of intensive therapy on CVD (8). Although an association of HbA1c
levels with CVD outcomes was demonstrated, the limited number of CVD events at that time
precluded a thorough investigation of risk factors as included herein. The long-term, standardized
measurement of numerous established and putative risk factors for CVD during DCCT/EDIC
provided the opportunity to examine not only cross-sectional, including baseline, risk factors, but the
effects of longitudinal exposure to changing (time-dependent) values of risk factors over time. Our
extensive collection of risk factors over many years in patients who began the study when they were
relatively young and without CVD, also enables an understanding of the temporal relationship
between risk factors and outcomes. This minimizes the potential for reverse-causality between CVD
and a risk factor.
After adjusting for the two most statistically significant risk factors, age and mean HbA1c,
essentially the same set of covariates, including higher mean systolic blood pressure, mean pulse
rate, current log(triglycerides), current or mean LDL-cholesterol and diabetes duration were
significantly associated with the risk of any-CVD or MACE (Table 4). Current use of an ACE
inhibitor was protective in both models. The only difference in risk factors between the two models
was that family history of MI appeared in the any-CVD model whereas smoking appeared in the
MACE model.
Page 11 of 47 Diabetes
12
There are a number of possible explanations for our ability to demonstrate a strong
relationship between glycemia and CVD, when older observational cohort studies in T1DM were
unable to do so (1, 5). The more frequent and consistent measurement of glycemia over time with
standardized methods in DCCT/EDIC provided an accurate assessment of long-term glycemia. In
addition, the younger age and exclusion of high cardiovascular risk participants from entry into the
DCCT, and relatively infrequent history of smoking in our cohort, may have limited the influence of
traditional risk factors and allowed the effects of glycemia to be manifest. Finally, the relatively
lower average HbA1c levels achieved may have also contributed as recent data from the Swedish
Registry showed a stronger association with CVD events over a lower HbA1c range (19).
As for the other risk factors identified, systolic blood pressure or hypertension has
consistently been reported as a major risk factor for CVD. The importance of the blood pressure
finding is magnified by a recent temporal analysis that showed that hypertension remains the major
unaddressed risk factor for major diabetes complications (20).
The strong association of triglycerides with CVD is consistent with prior studies which show
that triglyceride concentration is a particularly strong CVD predictor in diabetes (21). Further, this
association was observed at very low mean values of triglycerides, even in those with subsequent
CVD, supporting a recent call for resetting “normal” values in T1DM (22). These findings suggest
that a trial to examine the effects of triglyceride lowering in T1DM should be performed and that the
current lack of ADA guidelines for treatment of triglycerides (23) should be reconsidered.
Likewise, the strong reduction in risk with ACE inhibition observed herein, when adjusted
for blood pressure, suggests that a trial of the effects of ACE inhibition in a comparable T1DM
population may be warranted. The strong effect of increased pulse rate is also noteworthy. This may
reflect autonomic neuropathy that has been shown to predict coronary heart disease (24).
Page 12 of 47Diabetes

13
The factors that do not emerge as predictors are also of interest. The similar rates of CVD in
men and women with T1DM have been seen in other studies (1, 5, 25, 26) and with even higher rates in
women than men with type 2 diabetes (27, 28). This finding contrasts with the higher risk of CVD
among men than women in the general population (29). As we have observed in DCCT/EDIC, loss of
the female protection in diabetes may be related to less aggressive care in women than in men resulting
in lower achievement of recommended risk factor levels (30, 31). Diabetes has also been hypothesized
to have a relatively larger deleterious effect on risk factor levels in women than men, including lipids
and blood pressure, markers of coagulation, and fibrinolysis (32, 33). One recent study in T1DM also
demonstrated that HDL-cholesterol lost its protective effect above 50mg/dl in women but not in men
(34).
Another risk factor established for CVD in type 2 diabetes (35) that did not emerge in our study
was obesity or BMI. BMI has not been a strong risk factor for CVD (1, 5) or mortality in other studies
in T1DM (36, 37). Weight gain was greater in the intensively treated participants during the DCCT (38)
and its potential adverse effect on CVD risk might have been mitigated by the other benefits of
intensive therapy, including lower mean HbA1c. The absence of a deleterious effect of increased BMI
is confirmed by a previous report that showed that weight gain in the presence of improved glycemic
control was not disadvantageous (39).
A major factor that did not emerge as a risk factor for CVD in the final model was renal
disease, measured as albuminuria (either AER 30-300 mg/24 h or ≥300 mg/24 h), which has been
thought for many years to be a major contributor to CVD (40). More recent studies have also
supported a relatively greater role for albuminuria than for reduced GFR in CVD (41). Several
factors may explain our inability to demonstrate an association between albuminuria and CVD. First,
since HbA1c levels are strongly associated with the development of albuminuria in our study (42),
adjusting for HbA1c may have reduced the putative adverse effects of albuminuria. Second, the
Page 13 of 47 Diabetes
14
putative adverse effects of albuminuria may be confounded by the common use of ACE-inhibitors,
which reduce the risk of CVD in the setting of albuminuria. Finally, the null association in the final
model may be a function of inadequate power (with a limited number of cases of macroalbuminuria,
for example), or over-adjustment since blood pressure may be in the causal pathway between AER
and CVD.
Measurement error may have also contributed to failure to observe a significant association
with some factors, e.g. behavioral risk factors or those based on self-report (such as smoking,
exercise and alcohol use). Measurement errors would bias the estimates of associations towards the
null, thus reducing power to detect associations. Conversely, a risk factor measured with high
precision, such as HbA1c, will provide much greater power to detect a given association. Further,
when a precisely measured covariate and one measured with error represent the same causal pathway
to the outcome, that measured precisely will show a more significant effect. Accordingly, a study
similar to ours but with highly precise measures of other exposures, such as exercise, might provide
substantially different results than those presented herein. However, the results herein would be
expected to apply to other populations with a similar precision of measurement of such factors, as is
typically the case in observational follow-up.
The obvious strengths of these analyses include the careful and standardized assessments of
established and putative risk factors and cardiovascular outcomes prospectively over decades. In
addition, follow-up has been complete with 93% of the surviving cohort continuing to be followed
over an average of more than 27 years. Limitations include the exclusion of patients with
hypertension and dyslipidemia and some patients with albuminuria at baseline. However, owing to a
baseline mean age of 27 years and diabetes duration of only 6 years, it is unlikely that any more than
Page 14 of 47Diabetes
15
a small number of patients at higher risk may have been excluded because of these established and
putative CVD risk factors.
Regarding the modeling, data-dependent model selection has been shown to be susceptible to
various types of biases including bias in the set of covariates selected for inclusion, the coefficient
estimates and the levels of significance. However, we are confident that the resulting models are
reliable. The covariates selected for any-CVD and for MACE were highly internally consistent, each
model including the same five most significant covariates – age, HbA1c, systolic BP, triglycerides
and pulse rate, all at p < 0.01. Further, while the initial model building was based on a stepwise
process adding one block at a time, exactly the same final models were obtained in two sensitivity
analyses-- one using a penalized likelihood approach and the other was based on selection of an
optimal subset of covariates using the Akaike Information Criterion.
While these models could be employed as the basis for a “risk” or prediction score, we
hesitate to do so owing to the relatively small numbers of subjects with an outcome event (184 any-
CVD, 88 MACE) compared, for example, to the 1174 CVD cases used to develop, validate and
calibrate the Framingham Risk Score (43). However, it is encouraging that the AUC, a measure of
predictive ability, for the any-CVD model was 0.75 and that for MACE was 0.82.
It is clear that HbA1c is a robust and important risk factor in the DCCT/EDIC cohort over the
substantial but still limited period of study. However, the cohort is still young (mean age of 55 as of
2013), the proportion of survivors (1327 or 92%) is still quite high (44), and the cumulative
incidence of any-CVD is still only about 17% (Figure 1). Thus, the impact of hyperglycemia or other
risk factors may indeed be substantially different in future decades in which the overall incidence of
CVD will increase.
Page 15 of 47 Diabetes

16
In conclusion, in the DCCT/EDIC T1DM cohort, increasing age is the most significant risk
factor for clinical CVD, as in the general population, followed by the updated weighted-mean
HbA1c. Other traditional risk factors also appear to be important as risk factors for CVD and for
MACE, particularly blood pressure and triglycerides. Thus, in T1DM, control of glycemia as well as
other CVD risk factors should be aggressively pursued in order to reduce major cardiovascular
events.
Page 16 of 47Diabetes

17
ACKNOWLEDGMENTS
A complete list of participants in the DCCT/EDIC Research Group is presented in the
Supplementary Material published online for the article in N Engl J Med 2015;372:1722-33.
Authors Contributions: DMN and JML wrote the initial draft of the manuscript. IB and BHB
conducted statistical analyses under the direction of JML. IB, BHB, TJO, CC, MLV, and MS
contributed revisions to the paper. All authors approve the final content.
Conflict of Interest Statement: None
Guarantor Statement: John M. Lachin is the guarantor of this work and, as such, had full access to
all the data in the study and takes responsibility for the integrity of the data and the accuracy of the
data analysis.
Funding/Support: The DCCT/EDIC has been supported by cooperative agreement grants (1982-
1993, 2012-2017), and contracts (1982-2012) with the Division of Diabetes Endocrinology and
Metabolic Diseases of the National Institute of Diabetes and Digestive and Kidney Disease (current
grant numbers U01 DK094176 and U01 DK094157), and through support by the National Eye
Institute, the National Institute of Neurologic Disorders and Stroke, the General Clinical Research
Centers Program (1993-2007), and Clinical Translational Science Center Program (2006-present),
Bethesda, Maryland, USA.
Industry Contributions: Industry contributors have had no role in the DCCT/EDIC study but have
provided free or discounted supplies or equipment to support participants’ adherence to the study:
Abbott Diabetes Care (Alameda, CA), Animas (Westchester, PA), Bayer Diabetes Care (North
America Headquarters, Tarrytown, NY), Becton Dickinson (Franklin Lakes, NJ), Eli Lilly
(Indianapolis, IN), Extend Nutrition (St. Louis, MO), Insulet Corporation (Bedford, MA) , Lifescan
(Milpitas, CA), Medtronic Diabetes (Minneapolis, MN), Nipro Home Diagnostics (Ft. Lauderdale,
Page 17 of 47 Diabetes

18
FL), Nova Diabetes Care (Billerica, MA), Omron (Shelton, CT), Perrigo Diabetes Care (Allegan,
MI), Roche Diabetes Care (Indianapolis, IN) , and Sanofi-Aventis (Bridgewater, NJ).
Page 18 of 47Diabetes

19
REFERENCES
1. Orchard TJ, Costacou T, Kretowski A, Nesto RW. Type 1 diabetes and coronary artery disease.
Diabetes Care. 2006 Nov;29(11):2528-38.
2. Livingstone SJ, Looker HC, Hothersall EJ, Wild SH, Lindsay RS, Chalmers J, et al. Risk of
cardiovascular disease and total mortality in adults with type 1 diabetes: Scottish registry linkage
study. PLoS Med. 2012;9(10):e1001321.
3. Soedamah-Muthu SS, Fuller JH, Mulnier HE, Raleigh VS, Lawrenson RA, Colhoun HM. High
risk of cardiovascular disease in patients with type 1 diabetes in the U.K.: a cohort study using the
general practice research database. Diabetes Care. 2006 Apr;29(4):798-804.
4. Jensen T, Borch-Johnsen K, Kofoed-Enevoldsen A, Deckert T. Coronary heart disease in young
type 1 (insulin-dependent) diabetic patients with and without diabetic nephropathy: incidence and
risk factors. Diabetologia. 1987 Mar;30(3):144-8.
5. Orchard TJ, Olson JC, Erbey JR, Williams K, Forrest KY, Smithline Kinder L, et al. Insulin
resistance-related factors, but not glycemia, predict coronary artery disease in type 1 diabetes: 10-
year follow-up data from the Pittsburgh Epidemiology of Diabetes Complications Study. Diabetes
Care. 2003 May;26(5):1374-9.
6. Pambianco G, Costacou T, Ellis D, Becker DJ, Klein R, Orchard TJ. The 30-year natural history
of type 1 diabetes complications: the Pittsburgh Epidemiology of Diabetes Complications Study
experience. Diabetes. 2006 May;55(5):1463-9.
7. The DCCT Research Group. The effect of intensive treatment of diabetes on the development and
progression of long-term complications in insulin-dependent diabetes mellitus. N Engl J Med. 1993
Sep 30;329(14):977-86.
8. Nathan DM, Cleary PA, Backlund JY, Genuth SM, Lachin JM, Orchard TJ, et al. Intensive
diabetes treatment and cardiovascular disease in patients with type 1 diabetes. N Engl J Med. 2005
Dec 22;353(25):2643-53.
9. The DCCT Research Group. The Diabetes Control and Complications Trial (DCCT). Design and
methodologic considerations for the feasibility phase. Diabetes. 1986 May;35(5):530-45.
10. The DCCT/EDIC Research Group. Epidemiology of Diabetes Interventions and Complications
(EDIC). Design, implementation, and preliminary results of a long-term follow-up of the Diabetes
Control and Complications Trial cohort. Diabetes Care. 1999 Jan;22(1):99-111.
11. Feasibility of centralized measurements of glycated hemoglobin in the Diabetes Control and
Complications Trial: a multicenter study. The DCCT Research Group. Clin Chem. 1987
Dec;33(12):2267-71.
12. Williams KV, Erbey JR, Becker D, Arslanian S, Orchard TJ. Can clinical factors estimate insulin
resistance in type 1 diabetes? Diabetes. 2000 Apr;49(4):626-32.
Page 19 of 47 Diabetes

20
13. Lachin JM, Orchard TJ, Nathan DM, DCCT/EDIC Research Group. Update on cardiovascular
outcomes at 30 years of the Diabetes Control and Complications Trial/Epidemiology of Diabetes
Interventions and Complications study. Diabetes Care. 2014;37(1):39-43.
14. Hsieh FY, Lavori PW. Sample-size calculations for the Cox proportional hazards regression
model with nonbinary covariates. Control Clin Trials. 2000 Dec;21(6):552-60.
15. Lachin JM. Biostatistical Methods : The assessment of relative risks. 2nd ed. Hoboken, N.J.:
Wiley; 2011.
16. Therneau TM, Grambsch PM. Modeling survival data: extending the Cox model. New York ;
Berlin: Springer; 2000.
17. Claeskens G, Hjort NL. Model selection and model averaging. Cambridge ; New York:
Cambridge University Press; 2008.
18. Tibshirani R. The lasso method for variable selection in the Cox model. Stat Med. 1997 Feb
28;16(4):385-95.
19. Lind M, Bounias I, Olsson M, Gudbjornsdottir S, Svensson AM, Rosengren A. Glycaemic
control and incidence of heart failure in 20,985 patients with type 1 diabetes: an observational study.
Lancet. 2011 Jul 9;378(9786):140-6.
20. Miller RG, Secrest AM, Ellis D, Becker DJ, Orchard TJ. Changing impact of modifiable risk
factors on the incidence of major outcomes of type 1 diabetes: the Pittsburgh Epidemiology of
Diabetes Complications Study. Diabetes Care. 2013 Dec;36(12):3999-4006.
21. Jaiswal M, Schinske A, Pop-Busui R. Lipids and lipid management in diabetes. Best Pract Res
Clin Endocrinol Metab. 2014 Jun;28(3):325-38.
22. Tolonen N, Forsblom C, Makinen VP, Harjutsalo V, Gordin D, Feodoroff M, et al. Different
lipid variables predict incident coronary artery disease in patients with type 1 diabetes with or
without diabetic nephropathy: the FinnDiane study. Diabetes Care. 2014 Aug;37(8):2374-82.
23. American Diabetes Association. Standards of Medical Care in Diabetes-2015. Diabetes Care.
2015;38(1 Supp).
24. May O, Arildsen H, Damsgaard EM, Mickley H. Cardiovascular autonomic neuropathy in
insulin-dependent diabetes mellitus: prevalence and estimated risk of coronary heart disease in the
general population. J Intern Med. 2000 Dec;248(6):483-91.
25. Livingstone SJ, Looker HC, Hothersall EJ, Wild SH, Lindsay RS, Chalmers J, Cleland S, Leese
GP, McKnight J, Morris AD, Pearson DW, Peden NR, Petrie JR, Philip S, Sattar N, Sullivan F,
Colhoun HM. Risk of cardiovascular disease and total mortality in adults with type 1 diabetes:
Scottish registry linkage study. PLoS Med. 2012;9(10):e1001321.
26. Laing SP, Swerdlow AJ, Slater SD, Burden AC, Morris A, Waugh NR, Gatling W, Bingley PJ,
Page 20 of 47Diabetes

21
Patterson CC. Mortality from heart disease in a cohort of 23,000 patients with insulin-treated
diabetes. Diabetologia. 2003;46:760-5.
27. Peters SA, Huxley RR, Woodward M. Diabetes as a risk factor for stroke in women compared
with men: a systematic review and meta-analysis of 64 cohorts, including 775,385 individuals and
12,539 strokes. Lancet. 2014 Jun 7;383(9933):1973-80.
28. Peters SA, Huxley RR, Woodward M. Diabetes as risk factor for incident coronary heart disease
in women compared with men: a systematic review and meta-analysis of 64 cohorts including
858,507 individuals and 28,203 coronary events. Diabetologia. 2014 Aug;57(8):1542-51.
29. Mozaffarian D, Benjamin EJ, Go AS, Arnett DK, Blaha MJ, Cushman M, et al. Heart disease
and stroke statistics--2015 update: a report from the American Heart Association. Circulation. 2015
Jan 27;131(4):e29-322.
30. Ferrara A, Mangione CM, Kim C, Marrero DG, Curb D, Stevens M, et al. Sex disparities in
control and treatment of modifiable cardiovascular disease risk factors among patients with diabetes:
Translating Research Into Action for Diabetes (TRIAD) Study. Diabetes Care. 2008 Jan;31(1):69-
74.
31. Larkin ME, Backlund JY, Cleary P, Bayless M, Schaefer B, Canady J, et al. Disparity in
management of diabetes and coronary heart disease risk factors by sex in DCCT/EDIC. Diabet Med.
2010 Apr;27(4):451-8.
32. Williams K, Tchernof A, Hunt KJ, Wagenknecht LE, Haffner SM, Sniderman AD. Diabetes,
abdominal adiposity, and atherogenic dyslipoproteinemia in women compared with men. Diabetes.
2008 Dec;57(12):3289-96.
33. Peters SA, Huxley RR, Sattar N, Woodward M. Sex Differences in the Excess Risk of
Cardiovascular Diseases Associated with Type 2 Diabetes: Potential Explanations and Clinical
Implications. Curr Cardiovasc Risk Rep. 2015;9(7):36.
34. Costacou T, Evans RW, Orchard TJ. High-density lipoprotein cholesterol in diabetes: is higher
always better? J Clin Lipidol. 2011 Sep-Oct;5(5):387-94.
35. Meigs JB, Wilson PW, Fox CS, Vasan RS, Nathan DM, Sullivan LM, et al. Body mass index,
metabolic syndrome, and risk of type 2 diabetes or cardiovascular disease. J Clin Endocrinol Metab.
2006 Aug;91(8):2906-12.
36. Conway B, Miller RG, Costacou T, Fried L, Kelsey S, Evans RW, et al. Adiposity and mortality
in type 1 diabetes. Int J Obes (Lond). 2009 Jul;33(7):796-805.
37. Soedamah-Muthu SS, Chaturvedi N, Witte DR, Stevens LK, Porta M, Fuller JH; EURODIAB
Prospective Complications Study Group. Relationship between risk factors and mortality in type 1
diabetic patients in Europe: the EURODIAB Prospective Complications Study (PCS). Diabetes
Care. 2008; 31:1360-6.
Page 21 of 47 Diabetes

22
38. The DCCT Research Group. Adverse events and their association with treatment regimens in the
Diabetes Control and Complications Trial. Diabetes Care. 1995 Nov;18(11):1415-27.
39. Williams KV, Erbey JR, Becker D, Orchard TJ. Improved glycemic control reduces the impact
of weight gain on cardiovascular risk factors in type 1 diabetes. The Epidemiology of Diabetes
Complications Study. Diabetes Care. 1999 Jul;22(7):1084-91.
40. Pedersen MM, Christensen CK, Mogensen CE. Long-term (18 year) prognosis for normo- and
microalbuminuric type 1 (insulin-dependent) diabetic patients. Diabetologia. 1992;35(1 Supp):A60.
41. Matsushita K, Coresh J, Sang Y, Chalmers J, Fox C, Guallar E, et al. Estimated glomerular
filtration rate and albuminuria for prediction of cardiovascular outcomes: a collaborative meta-
analysis of individual participant data. Lancet Diabetes Endocrinol. 2015 Jul;3(7):514-25.
42. DCCT/EDIC research group. Effect of intensive diabetes treatment on albuminuria in type 1
diabetes: long-term follow-up of the Diabetes Control and Complications Trial and Epidemiology of
Diabetes Interventions and Complications study. Lancet Diabetes Endocrinol. 2014 Oct;2(10):793-
800.
43. D'Agostino RB S, Vasan RS, Pencina MJ, Wolf PA, Cobain M, Massaro JM, et al. General
cardiovascular risk profile for use in primary care: the Framingham Heart Study. Circulation. 2008
Feb 12;117(6):743-53.
44. DCCT/EDIC research group. Intensive Diabetes Treatment and Cardiovascular Outcomes in
Type 1 Diabetes: The DCCT/EDIC Study 30 year Follow-up. Submitted for publication.
Page 22 of 47Diabetes

23
Table 1. Median and inter-quartile range or prevalence (%) for fixed baseline characteristics of DCCT/EDIC participants
according to the presence or absence of any-CVD over the course of the DCCT/EDIC study, and the corresponding hazard ratio
for any-CVD per unit change in the baseline covariate. An identical table for MACE is presented in the Supplemental Appendix.
Any-CVD
Overall No Yes HR 95% CI p-value
N 1441 1257 184
DESIGN
Treatment group (% conventional) 51 50 55 1.29 (0.964, 1.725) 0.0864
Cohort (% secondary) 50 48 62 1.592 (1.18, 2.147) 0.0023
DEMOGRAPHIC
Physical
Gender (% men) 53 53 52 1.004 (0.752, 1.341) 0.9786
Age (yr) 27 (22,32) 27 (21,32) 31 (27,35) 1.091 (1.066, 1.116) <0.0001
Adult vs. adolescent (< 18 years) 86 85 95 3.378 (1.727, 6.611) 0.0004
Weight Men (kg) 74 (67,82) 74 (67,82) 76 (70,84) 1.011 (0.993, 1.029) 0.2422
Weight Women (kg) 62 (56,69) 61 (55,68) 65 (57,70) 1.034 (1.011, 1.057) 0.0032
BMI Men (kg/m2) 24 (22,25) 23 (22,25) 24 (22,26) 1.065 (0.993, 1.142) 0.0764
BMI Women (kg/m2) 23 (21,25) 23 (21,25) 24 (22,26) 1.096 (1.022, 1.175) 0.0098
Behavioral
Smoking (%) 19 17 27 1.834 (1.325, 2.538) 0.0003
Alcohol (% occasional or regular) 22 22 20 0.888 (0.617, 1.279) 0.5246
Exercise (% moderate or strenuous) 70 70 71 1.067 (0.775, 1.468) 0.6901
Family History
Family history of HT (%) 56 56 59 1.123 (0.838, 1.506) 0.4377
Family history of MI (%) 49 47 60 1.615 (1.202, 2.169) 0.0015
Family history of T1D (%) 14 14 17 1.294 (0.884, 1.894) 0.1856
Family history of T2D (%) 9 9 13 1.592 (1.037, 2.446) 0.0336
Page 23 of 47 Diabetes

24
TRADITIONAL
Blood Pressure
Systolic (mm Hg) 114 (106,122) 114 (106,120) 116 (110,124) 1.016 (1.004, 1.029) 0.0117
Diastolic (mm Hg) 72 (68,80) 72 (68,80) 74 (68,80) 1.021 (1.004, 1.038) 0.0131
Pulse pressure (mm Hg) 40 (34,48) 40 (34,48) 42 (34,48) 1.006 (0.991, 1.02) 0.4554
Pulse rate (bpm) 76 (68,84) 76 (68,82) 78 (72,88) 1.019 (1.006, 1.031) 0.0029
Lipids
Total cholesterol (mg/dl) 174 (153,197) 172 (152,195) 185 (162,211) 1.012 (1.008, 1.016) <0.0001
Triglycerides (mg/dl) 73 (55,94) 72 (55,93) 80 (59,97) 1.614 (1.184, 2.199) 0.0024
HDLc (mg/dl) 49 (42,57) 50 (42,58) 47 (41,55) 0.992 (0.98, 1.004) 0.2001
LDLc (mg/dl) 107 (91,127) 105 (89,125) 119 (98,144) 1.014 (1.01, 1.019) <0.0001
DIABETES-RELATED
History
Duration of Diabetes (months) 49 (26,108) 47 (26,104) 69 (29,130) 1.004 (1.001, 1.007) 0.0032
C-peptide (nmol/L)*
Diabetes duration <5 years 0.13 (0.04,0.25) 0.12 (0.04,0.24)2) 0.13 (0.03,0.29) 1.5571 (0.325, 7.458) 0.5796
Duration ≥5 years 0.03 (0.03,0.04) 0.03 (0.03,0.04) 0.03 (0.03,0.03) 0.079 (0, 33.708) 0.4115
Microvascular
Log AER (mg/24 hr) 24 (20,29) 23 (20,28) 24 (20,30) 1.17 (0.978, 1.401) 0.0861
Glycemia
HbA1c [% (mmol/mol)] 8.8 (7.8,10.1)
73 (62,87)
8.8 (7.8,10.1)
73 (62,87)
9.0 (8.1,10.3)
75 (65,89) 1.093 (1.003,1.19) 0.0426 BMI=body mass index; HT=hypertension; MI=myocardial infarction; T1D=type 1 diabetes; T2D=type 2 diabetes; HDLc=high-density lipoprotein
cholesterol; LDLc=low-density lipoprotein cholesterol; AER=albumin excretion rate
Data are median (first quartile, third quartile) or %.
*C-peptide is presented separately within diabetes duration strata because the eligibility range differed among those ≤ 5 years duration (0 – 0.5 nmol/L)
and those > 5 years (0 – 0.2 nmol/L).
Page 24 of 47Diabetes

25
Table 2. Hazard ratio for any-CVD and for MACE per unit change in each time-dependent covariate with no other adjustments,
and an indication of the type of covariate used in the analysis.
Any-CVD MACE
Type* HR 95% CI p-value HR 95% CI p-value
DEMOGRAPHIC
Physical
Age (yr) C 1.091 (1.066, 1.116) <0.0001 1.112 (1.074, 1.151) <0.0001
Weight Men (kg) C 1 (0.987, 1.014) 0.954 0.984 (0.964, 1.004) 0.1092
Weight Women (kg) C 1.009 (0.995, 1.022) 0.1956 1.008 (0.988, 1.028) 0.4519
Mean BMI (kg/m2) M 1.04 (1, 1.081) 0.0486 1.009 (0.952, 1.069) 0.758
BMI Men (kg/m2) C 1.01 (0.967, 1.055) 0.6557 0.966 (0.903, 1.034) 0.3216
BMI Women (kg/m2) C 1.024 (0.985, 1.064) 0.2303 1.019 (0.962, 1.08) 0.5147
Behavioral
Smoking (yes vs. no) C 1.529 (1.076, 2.173) 0.0179 2.247 (1.411, 3.579) 0.0007
Alcohol (% occasional or regular vs. non-drinker) C 0.86 (0.727, 1.018) 0.0797 0.783 (0.608, 1.007) 0.0568
Exercise (% moderate or strenuous vs. sedentary) C 0.914 (0.707, 1.181) 0.4898 0.979 (0.676, 1.416) 0.909
TRADITIONAL
Blood Pressure C
Systolic (mm Hg) C 1.027 (1.018, 1.037) <0.0001 1.034 (1.022, 1.046) <0.0001
Mean Systolic (mm Hg) M 1.061 (1.043, 1.078) <0.0001 1.071 (1.046, 1.096) <0.0001
Diastolic (mm Hg) C 1.009 (0.993, 1.025) 0.2721 1.01 (0.987, 1.034) 0.3842
Mean Diastolic (mm Hg) M 1.055 (1.028, 1.083) 0.0001 1.044 (1.005, 1.085) 0.027
Pulse pressure (mm Hg) C 1.036 (1.025, 1.047) <0.0001 1.045 (1.03, 1.059) <0.0001
Hypertension (yes vs. no) C 2.01 (1.448, 2.79) <0.0001 2.198 (1.348, 3.586) 0.0016
Any Hypertension (yes vs. no) A 2.308 (1.583, 3.365) <0.0001 2.291 (1.303, 4.027) 0.004
Pulse rate (bpm) C 1.021 (1.008, 1.034) 0.0012 1.029 (1.011, 1.048) 0.0016
Page 25 of 47 Diabetes

26
Mean Pulse rate (bpm) M 1.057 (1.036, 1.078) <0.0001 1.074 (1.044, 1.106) <0.0001
Medications
ACE (yes vs. no) C 1.092 (0.782, 1.523) 0.6062 0.945 (0.583, 1.533) 0.8191
ARB (yes vs. no) C 1.421 (0.878, 2.3) 0.1523 1.024 (0.486, 2.158) 0.9495
Beta Blockers (yes vs. no) C 1.827 (1.002, 3.333) 0.0493 2.796 (1.441, 5.424) 0.0024
Calcium Channel Blockers (yes vs. no) C 2.84 (1.801, 4.478) <0.0001 2.385 (1.216, 4.68) 0.0115
Lipid Lowering (yes vs. no) C 1.401 (0.991, 1.98) 0.056 1.141 (0.696, 1.872) 0.6006
Lipids
Total cholesterol (mg/dl) C 1.01 (1.007, 1.014) <0.0001 1.011 (1.007, 1.016) <0.0001
Mean Total cholesterol (mg/dl) M 1.018 (1.013, 1.023) <0.0001 1.018 (1.011, 1.025) <0.0001
Triglycerides (mg/dl) C 2.133 (1.674, 2.719) <0.0001 2.522 (1.807, 3.518) <0.0001
Mean Triglycerides (mg/dl) M 2.458 (1.786, 3.382) <0.0001 2.923 (1.87, 4.568) <0.0001
HDLc (mg/dl) C 0.995 (0.986, 1.005) 0.3191 0.984 (0.97, 0.999) 0.0323
Mean HDLc (mg/dl) M 0.989 (0.977, 1.001) 0.0847 0.983 (0.965, 1.002) 0.0754
LDLc (mg/dl) C 1.011 (1.006, 1.015) <0.0001 1.014 (1.008, 1.019) <0.0001
Mean LDLc (mg/dl) M 1.019 (1.014, 1.025) <0.0001 1.02 (1.012, 1.029) <0.0001
Hyperlipidemia (yes vs. no) C 1.767 (1.3, 2.401) 0.0003 1.647 (1.055, 2.571) 0.0282
DIABETES-RELATED
History
Insulin Dose (units/kg/day) C 1.595 (1.095, 2.325) 0.0151 1.363 (0.694, 2.678) 0.3691
Mean Insulin Dose (units/kg/day) M 1.674 (0.797, 3.516) 0.174 1.296 (0.433, 3.874) 0.6431
Estimated Glucose Disposal Rate C 0.819 (0.761, 0.882) <0.0001 0.763 (0.683, 0.853) <0.0001
Microvascular
Estimated GFR (mL/min per 1.73 m2) C 0.985 (0.978, 0.991) <0.0001 0.978 (0.971, 0.986) <0.0001
eGFR <60 (yes vs. no) C 2.479 (1.332, 4.613) 0.0042 4.356 (2.21, 8.586) <0.0001
Any eGFR <60 (yes vs. no) A 2.529 (1.472, 4.346) 0.0008 3.949 (2.099, 7.429) <0.0001
Log AER (mg/24 hr) C 1.229 (1.133, 1.334) <0.0001 1.283 (1.151, 1.431) <0.0001
Page 26 of 47Diabetes

27
Sustained AER ≥30 mg/dl (yes vs. no) C 1.8 (1.278, 2.535) 0.0008 1.916 (1.18, 3.109) 0.0085
AER ≥40 mg/dl (yes vs. no) C 1.891 (1.346, 2.656) 0.0002 2.171 (1.355, 3.478) 0.0013
AER ≥300 mg/dl (yes vs. no) C 2.312 (1.434, 3.728) 0.0006 3.028 (1.64, 5.593) 0.0004
Any AER ≥40 mg/dl (yes vs. no) A 1.768 (1.316, 2.374) 0.0002 1.729 (1.127, 2.654) 0.0122
Any AER ≥300 mg/dl (yes vs. no) A 1.958 (1.287, 2.978) 0.0017 3.072 (1.834, 5.148) <0.0001
Hypoglycemia
Coma/Seizure (yes vs. no) C 0.972 (0.812, 1.163) 0.7542 1.021 (0.835, 1.248) 0.8379
Requiring Assistance (yes vs. no) C 1.002 (0.93, 1.079) 0.9626 1.005 (0.905, 1.114) 0.9319
Glycemia
HbA1c (%) C 1.241 (1.129, 1.364) <0.0001 1.297 (1.139, 1.478) 0.0001
Mean HbA1c (%) M 1.382 (1.231, 1.551) <0.0001 1.539 (1.309, 1.808) <0.0001 BMI=body mass index; ACE=angiotensin converting enzyme inhibitors; ARB=angiotensin receptor blockers; HDLc=high-density lipoprotein
cholesterol; LDLc=low-density lipoprotein cholesterol; GFR=glomerular filtration rate; AER=albumin excretion rate
*C=Current (or most recent) value, M=Updated mean value, A=Cumulative Incidence (such as Any Use). Categories C, M, and A correspond to time-
dependent covariates assessed or measured at or most recently prior to each event time or right censoring time, i.e. at the most recent visit up to the
particular time-point.
Page 27 of 47 Diabetes

28
Table 3. Hazard ratios for any-CVD and for MACE per unit change in each baseline or time-dependent covariate that was
nominally significant at p≤0.01 in separate Cox Models, minimally adjusted for age and updated mean HbA1c.
Type* Any-CVD MACE
Hazard Ratio
(95% CI)
p-value Hazard Ratio
(95% CI)
p-value
DESIGN
Secondary cohort (yes vs. no)
B 1.57 (1.17, 2.13) 0.003
DEMOGRAPHIC
Behavioral
Smoking status (yes vs. no) C 1.89 (1.18, 3.04) 0.009
Family History
History of MI (yes vs. no) B 1.53 (1.14, 2.06) 0.005
TRADITIONAL
Blood Pressure
Systolic (mm Hg) C 1.02 (1.01, 1.03) <0.001 1.02 (1.01, 1.03) <0.001
Mean systolic (mm Hg) M 1.04 (1.02, 1.06) <0.001 1.04 (1.02, 1.07) <0.0014
Mean diastolic (mm Hg) M 1.04 (1.01, 1.07) 0.004
Pulse pressure C 1.02 (1.01, 1.03) <0.001 1.03 (1.01, 1.04) 0.001
Mean Pulse rate (bpm) M 1.05 (1.03, 1.07) <0.001 1.07 (1.03, 1.10) <0.001
Medications
Calcium channel blockers (yes vs. no) C 2.02 (1.28, 3.20) 0.003
Lipids
Total cholesterol (mg/dl) C 1.008 (1.004, 1.012) <0.001 1.009 (1.004, 1.0139) <0.001
Triglycerides (log) C 1.98 (1.53, 2.56) <0.001 2.37 (1.65, 3.40) <0.001
LDL cholesterol (mg/dl) C 1.008 (1.004, 1.013) <0.001 1.011 (1.005, 1.017) <0.001
HDL cholesterol (mg/dl) C 0.98 (0.966, 0.995) 0.007
Page 28 of 47Diabetes

29
MI=myocardial infarction; LDL=low-density lipoprotein; HDLc=high-density lipoprotein cholesterol; AER=albumin excretion rate
*B=Baseline Value, C=Current (or most recent) value, M=Updated mean value, A=Cumulative Incidence (such as Any Use). Categories C, M, and A
correspond to time-dependent covariates assessed or measured at or most recently prior to each event time or right censoring time, i.e. at the most
recent visit up to the particular time-point.
Mean total cholesterol (mg/dl) M 1.012 (1.006, 1.017) <0.001 1.010 (1.002, 1.018) 0.013
Mean triglycerides (log) M 2.23 (1.60, 3.12) <0.001 2.56 (1.60, 4.11) <0.001
Mean LDL cholesterol (mg/dl) M 1.013 (1.007, 1.020) <0.001 1.013 (1.004, 1.022) 0.007
Mean HDL cholesterol (mg/dl) M 0.984 (0.971, 0.996) 0.010 0.976 (0.958, 0.994) 0.010
DIABETES-RELATED
History
Duration (months) B 1.005 (1.002, 1.008) <0.001 1.006 (1.002, 1.01) 0.006
Mean insulin dose (units/kg/day) M 3.72 (1.70, 8.14) 0.001
Microvascular
AER (log) (mg/24 hr) C 1.17 (1.06, 1.28) 0.001 1.21 (1.06, 1.37) 0.004
Any AER ≥40 (yes vs. no) A 1.66 (1.21, 2.26) 0.002
Any AER ≥300 (yes vs. no) A 2.41 (1.39, 4.18) 0.002
Page 29 of 47 Diabetes

30
Table 4. The final multivariable Cox models for any-CVD and for MACE as a function of fixed
(baseline) and time-dependent covariates, the latter either the current value or mean from
baseline as stated. Covariates listed in the order of significance as indicated by the unsigned Z-
value.
Any-CVD Model
Covariate Hazard Ratio (95% CI)* Z-test value p-value
Baseline Age (per 5 yrs) 1.5366 (1.3641, 1.731) 7.0711 <0.001
Mean HbA1c (per 1%) 1.3115 (1.1488, 1.4972) 4.0133 <0.001
Mean systolic BP (per 10 mm Hg) 1.3186 (1.1096, 1.567) 3.1419 0.002
Current Triglycerides (log) 1.5536 (1.1688, 2.065) 3.0346 0.003
Mean Pulse rate (per 10 bpm) 1.3855 (1.1051, 1.737) 2.8267 0.005
Baseline Duration of Diabetes (per 5yrs) 1.247 (1.0514, 1.4789) 2.5364 0.02
Current use of ACE Inhibitor (yes vs. no) 0.6732 (0.4777, 0.9486) -2.2611 0.03
Baseline family history of MI (yes vs. no) 1.3866 (1.0294, 1.8678) 2.1507 0.04
Mean LDLc (per 10 mg/dl) 1.0721 (1.0037, 1.1451) 2.0697 0.04
MACE Model
Covariate Hazard Ratio (95% CI) Z-test value p-value
Baseline Age (per 5 yrs) 1.7748 (1.4872, 2.1179) 6.3613 <0.001
Mean HbA1c (per 1%) 1.4186 (1.1785, 1.7077) 3.6965 <0.001
Mean Pulse rate (per 10 bpm) 1.5975 (1.1576, 2.2046) 2.8509 0.005
Current Triglycerides (log) 1.7844 (1.1909, 2.6737) 2.8071 0.005
Mean systolic BP (per 10 mm Hg) 1.3863 (1.0929, 1.7583) 2.6931 0.007
Current smoking (yes vs. no) 1.8686 (1.1647, 2.9978) 2.5924 0.01
Baseline Duration of Diabetes (per 5 yrs) 1.3334 (1.0399, 1.7098) 2.2685 0.03
Current use of ACE Inhibitor (yes vs. no) 0.5819 (0.3553, 0.9529) -2.1515 0.04
Current LDLc (per 10 mg/dl) 1.0692 (1.0035, 1.1392) 2.0685 0.04
BP=blood pressure; ACE=angiotensin converting enzyme inhibitors; MI=myocardial infarction; LDL=low-
density lipoprotein; bpm=beats per minute
*The hazard ratio (HR) in the Cox proportional hazards model can be converted from HR per x-units (e.g. per 5
years of age above) to HR per y-units (e.g. per 1 year), using the equation: HR(y/x)
. For example, the hazard
ratio for MACE per 1 year of Age is (1.7748)1/5
=1.1216. The same equation applies to the confidence limits.
The Z-test and p-values are unchanged by a change of scale of the HRs.
Page 30 of 47Diabetes

31
FIGURE LEGENDS
Figure 1. Kaplan-Meier survival (event-free) curves (solid lines), and 95% confidence intervals
(dashed lines) for MACE (top) and CVD (bottom), with number of subjects at risk for each at 10, 20
and 30 years of follow-up. The number at risk beyond 23 years declines as a function of staggered entry
into the study over 1983-89.
Page 31 of 47 Diabetes

0 5 10 15 20 25 30
0.70
0.75
0.80
0.85
0.90
0.95
1.00
Years since Entry
Eve
nt−
Fre
e (S
urvi
val)
Pro
babi
lity
Any−CVD
MACE
Number at risk
1441 1391 1292 1058 40
1441 1380 1235 988 37
Page 32 of 47Diabetes

1
Online Appendix
Risk Factors for Cardiovascular Disease in Type 1 Diabetes
The Diabetes Control and Complications Trial (DCCT)-Epidemiology of Diabetes Interventions and
Complications (EDIC) Research Group*
This Appendix presents supplemental materials cited in the text of the main manuscript.
Model Selection
The final models for Any-CVD and MACE presented in Table 4 of the main manuscript were
obtained in a forward fashion by sequentially considering the blocks of variables described in
Supplementary Table A1 herein. The models were also confirmed in two sensitivity analyses that
started with all variables from all blocks.
Three statistical methods were employed for variable selection/deletion. One approach simply
fit a Cox PH model and deleted factors that were not statistically significant. Another approach
conducted a search for the best subset model based on the minimum (best) Akaike Information
Criterion (AIC) (17). A third identified covariate deletions by fitting a model with a penalized
likelihood “lasso” (least absolute shrinkage and selection operator) method (18). The lasso shrinks the
regression coefficients toward zero, and sets those deemed unimportant to zero (penalized). A model
can then be fit with the remaining selected variables.
For the final models, the forward variable selection approach started with the variables in the
Design block in Table A1, namely cohort and treatment group, and the three approaches were applied.
First, a Cox model that included both variables was fit, and a variable was selected for inclusion if its p-
value was below a certain cut-off value (0.10 was used herein). Second, a penalized likelihood model
was fit using both variables, and those with non-zero coefficients were retained. Third, a search
identified the sub-model with the lowest AIC value, and the variables included in that model were
retained. A risk factor was retained if it met at least one of the three criteria. From the Design block,
both cohort and treatment group were selected (e.g., they both had p-values less than 0.10).
At the next step, the variables in the next block, in this case the Demographic-Physical block
(such as gender, age, weight and BMI), were added to the previously selected variables (i.e., cohort and
treatment group). The three variable selection criteria were applied to this set of variables, all of them,
not just those added; and again, variables that met at least one criterion were selected, and the others
were dropped. This could include deletion of variables entered in preceding blocks.
The procedure continued in a similar fashion by adding each block to the already selected risk
factors, and variables selected by at least one criterion were kept in the model, while the others were
dropped. After the final block (Glycemia) was considered, the remaining set of variables that were
Page 33 of 47 Diabetes

2
considered of interest were employed in a Cox model, and variables that did not reach statistical
significance at level 0.05 were then dropped to yield the final model.
Two sensitivity analyses were conducted to confirm the final model, and they both started with
all variables in all blocks. The first approach was to fit a penalized Cox model to identify variables to
be deleted (those with a zero coefficient), followed by a Cox model using only the variables that were
retained (had non-zero coefficients). The second method identified the sub-model with the lowest AIC,
and then fit a Cox model using only the variables selected by the AIC criterion. Both approaches led to
the same set of significant variables as obtained using the forward selection procedure shown in Table
4.
Page 34 of 47Diabetes
3
Table A1. CVD risk factors (by block) employed in the analyses with a description of availability.
Block Variable Availability*
DESIGN
Cohort B
Treatment Group B
DEMOGRAPHIC
Physical Gender (male versus female) B
Age (yr) B
Adult B
Weight (kg) B, C†, M
†
Weight Gain (kg) C†
Body mass index (kg/m2) B, C
†, M
†
Behavioral Current cigarette smoker B, C†
Occasional or regular drinker B, C†
Moderate or strenuous activity B, C†
Family History Family history
Hypertension B
Myocardial infarction B
Type 1 Diabetes B
Type 2 Diabetes B
TRADTIONAL
Blood pressure Systolic (mm Hg) B, C†, M
†
Diastolic (mm Hg) B, C†, M
†
Pulse pressure (mm Hg) B, C†
Pulse rate (bpm) B, C†, M
†
Hypertension (>140/90 or medication) B, C†, A
†
Medications ACE C‡
ARB C‡
Beta Blockers C‡
Calcium Channel Blockers C‡
Lipid Lowering C‡
Lipids Total cholesterol (mg/dl) B, C§, M
§
Triglycerides (mg/dl) B, C§, M
§
HDL cholesterol (mg/dl) B, C§, M
§
LDL cholesterol (mg/dl) B, C§, M
§
Hyperlipidemia (LDL > 130 or medication) B, C§
DIABETES-RELATED
History Duration of diabetes (yr) B
Stimulated C-peptide (nmol/L) B
Duration <60 months
Duration ≥60 months
Insulin dose (units/kg/day) B, C†, M
†
eGlucose Disposal Rate C‡
Microvascular Nephropathy B
eGFR (mL/min per 1.73 m2) B, C
†
Page 35 of 47 Diabetes

4
eGFR<60 C†, A
†
AER (mg/24 hr)
AER ≥40, AER≥300, Sustained
AER≥30mg/24 hr
B, C§,
A§
Hypoglycemia Coma and/or seizure B, C†
Requiring assistance B, C†
Glycemia HbA1c (%) B, C†, M
†
*A=Cumulative Incidence (such as Any Use), B=Baseline Value, C=Current Value, M=Updated Mean
Value. Categories C, M and A enter the analyses as time dependent covariates. †Collected annually during DCCT and EDIC
‡Collected annually in EDIC, not collected in DCCT
§Collected annually in DCCT, every two years in EDIC
Page 36 of 47Diabetes

5
Table A.2. Median and inter-quartile range or prevalence (%) for fixed baseline characteristics of DCCT/EDIC participants
according to the presence or absence of MACE over the course of the DCCT/EDIC study, and the corresponding hazard ratio of
any CVD per unit change in the baseline covariate.
MACE
Overall No Yes HR 95% CI p-value
DESIGN
Treatment group (% conventional) 51 50 56 1.302 (0.855, 1.984) 0.2184
Cohort (% secondary) 50 49 64 1.603 (1.036, 2.479) 0.0341
DEMOGRAPHIC
Physical
Gender (% men) 53 52 58 1.293 (0.847, 1.975) 0.234
Age (yr) 27 (22,32) 27 (22,32) 32 (28,36) 1.112 (1.074, 1.151) 0
Adult vs. adolescent (< 18 years) 86 86 97 5.044 (1.591, 15.992) 0.006
Weight Men (kg) 74 (67,82) 74 (67,82) 76 (69,82) 1.001 (0.976, 1.026) 0.9579
Weight Women (kg) 62 (56,69) 61 (56,68) 64 (58,70) 1.04 (1.005, 1.076) 0.0244
BMI Men (kg/m2) 24 (22,25) 24 (22,25) 24 (22,25) 1.034 (0.938, 1.14) 0.4975
BMI Women (kg/m2) 23 (21,25) 23 (21,25) 24 (22,26) 1.108 (0.996, 1.232) 0.0586
Behavioral
Smoking (%) 19 17 38 2.927 (1.901, 4.508) 0
Alcohol (% occasional or regular) 22 22 16 0.692 (0.391, 1.226) 0.2073
Exercise (% moderate or strenuous) 70 70 75 1.259 (0.777, 2.041) 0.3495
Family History
Family history of HT (%) 56 56 53 0.9 (0.592, 1.368) 0.6218
Family history of MI (%) 49 48 55 1.251 (0.822, 1.903) 0.2964
Family history of T1D (%) 14 14 18 1.376 (0.801, 2.365) 0.2481
Family history of T2D (%) 9 9 9 1.025 (0.495, 2.12) 0.9473
TRADITIONAL
Blood Pressure
Systolic (mm Hg) 114 (106,122) 114 (106,122) 113 (108,126) 1.013 (0.995, 1.031) 0.1618
Diastolic (mm Hg) 72 (68,80) 72 (68,80) 76 (68,80) 1.021 (0.997, 1.046) 0.0854
Page 37 of 47 Diabetes

6
Pulse pressure (mm Hg) 40 (34,48) 40 (35,48) 40 (34,48) 1.001 (0.98, 1.023) 0.9303
Pulse rate (bpm) 76 (68,84) 76 (68,82) 80 (74,88) 1.025 (1.008, 1.043) 0.0042
Lipids
Total cholesterol (mg/dl) 174 (153,197) 173 (152,196) 184 (160,207) 1.011 (1.005, 1.017) 3.00E-04
Triglycerides (mg/dl) 73 (55,94) 72 (55,93) 84 (59,105) 1.981 (1.291, 3.04) 0.0017
HDLc (mg/dl) 49 (42,57) 50 (42,57) 45 (41,58) 0.988 (0.97, 1.006) 0.1864
LDLc (mg/dl) 107 (91,127) 106 (90,126) 119 (98,137) 1.013 (1.006, 1.02) 2.00E-04
DIABETES-RELATED
History
Duration of Diabetes (months) 49 (26,108) 48 (26,106) 70 (30,134) 1.005 (1.001, 1.009) 0.0238
C-peptide (nmol/L)*
Diabetes duration <5 years 0.13 (0.04,0.25) 0.13 (0.04,0.25) 0.12 (0.03,0.24) 0.441 (0.039, 5.025) 0.5097
Duration ≥5 years 0.03 (0.03,0.04) 0.03 (0.03,0.04) 0.03 (0.03,0.03) <0.001 (0, 7.958) 0.1094
Microvascular
Log AER (mg/24 hr) 2.4 (2,2.9) 2.4 (2,2.9) 2.6 (1.8,2.9) 1.087 (0.837, 1.411) 0.5328
Glycemia
HbA1c [% (mmol/mol)] 8.8 (7.8,10.1)
73 (62,87)
8.8 (7.8,10.1)
73 (62,87)
9.3 (8.1,10.7)
78 (65,93) 1.168 (1.037, 1.316) 0.0106 ACE=angiotensin converting enzyme inhibitors; ARB=angiotensin receptor blockers; BMI=body mass index; HT=hypertension; MI=myocardial
infarction; T1D=type 1 diabetes; T2D=type 2 diabetes; HDLc=high-density lipoprotein cholesterol; LDLc=low-density lipoprotein cholesterol;
AER=albumin excretion rate
Data are median (first quartile, third quartile) or %.
*C-peptide is presented separately within diabetes duration strata because the eligibility range differed among those ≤ 5 years duration (0 – 0.5 nmol/L)
and those > 5 years (0 – 0.2 nmol/L).
Page 38 of 47Diabetes

7
Table A.3. Median and inter-quartile range or prevalence (%) for time-dependent characteristics of DCCT/EDIC participants at
DCCT baseline and at 10, 20 and 25 years of follow-up for those at risk of any cardiovascular disease over the course of the
DCCT/EDIC study. The covariate type is also indicated, M = the updated mean value over follow-up, C = the current or most
recent covariate value.
Type Baseline Year 10 Year 20 Year 25
N 1441 1380 1235 988
DEMOGRAPHIC
Physical
Age (yr) C 27 (22,32) 36 (31,42) 46 (41,51) 51 (45,56)
Weight Men (kg) C 74 (67,82) 83 (76,92) 90 (80,100) 90 (80,101)
Weight Women (kg) C 62 (56,69) 69 (62,78) 73 (65,84) 73 (65,84)
Mean BMI(kg/m2) M 23 (21,25) 25 (23,27) 26 (24,28) 26 (24,29)
BMI Men (kg/m2) C 24 (22,25) 26 (24,29) 28 (25,31) 28 (25,31)
BMI Women (kg/m2) C 23 (21,25) 25 (23,28) 27 (24,31) 27 (24,31)
Behavior
Smoking (%) C 19 19 14 13
Alcohol (% occasional or regular) C 22 41 46 45
Exercise (% moderate or strenuous) C 70 55 55 56
TRADITIONAL
Blood Pressure C
Systolic (mm Hg) C 114 (106,122) 118 (110,126) 120 (111,129) 120 (110,130)
Mean Systolic (mm Hg) M 114 (106,122) 115 (110,121) 118 (112,124) 118 (112,124)
Diastolic (mm Hg) C 72 (68,80) 76 (70,82) 74 (68,80) 71 (65,78)
Mean Diastolic (mm Hg) M 72 (68,80) 74 (71,78) 75 (71,78) 74 (71,77)
Pulse C
Pulse pressure (mm Hg) C 40 (34,48) 42 (36,50) 46 (39,53) 48 (41,56)
Page 39 of 47 Diabetes

8
Pulse rate (bpm) C 76 (68,84) 72 (68,80) 72 (64,80) 70 (63,78)
Mean Pulse rate (bpm) M 76 (68,84) 74 (69,78) 73 (69,77) 73 (69,77)
Hypertension (%) A 3 19 56 64
Hypertension Cumulative (%) C 0 23 70 79
Medications
ACE (%) C 0 7 39 43
ARB (%) C 0 0 12 16
Beta Blockers (%) C 0 1 4 9
Calcium Channel Blockers (%) C 0 1 5 8
Lipid Lowering (%) C 0 3 43 59
Lipids
Total cholesterol (mg/dl) C 174 (153,197) 184 (161,207) 177 (155,200) 172 (149,195)
Mean Total cholesterol (mg/dl) M 174 (153,197) 181 (163,202) 183 (165,199) 181 (165,196)
Triglycerides (mg/dl) C 70 (55,94) 73 (54,104) 71 (51,104) 65 (50,91)
Mean Triglycerides (mg/dl) M 70 (52,93) 73 (59,97) 74 (59,99) 74 (59,97)
HDLc (mg/dl) C 49 (42,57) 52 (44,62) 53 (45,65) 59 (49,72)
Mean HDLc (mg/dl) M 49 (42,57) 50 (44,59) 53 (45,61) 53 (46,63)
LDLc (mg/dl) C 107 (91,127) 113 (93,135) 103 (86,123) 94 (77,111)
Mean LDLc (mg/dl) M 107 (91,127) 112 (96,131) 112 (97,127) 108 (95,121)
Hyperlipidemia (%) C 23 30 55 65
DIABETES-RELATED
History
Insulin Dose (units/kg/day) C 0.64 (05,0.8) 0.63 (0.51,0.76) 0.54 (0.36,0.69) 0.51 (0.33,0.69)
Mean Insulin Dose (units/kg/day) M 0.64 (0.5,0.8) 0.65 (0.55,0.79) 0.61 (0.5,0.72) 0.59 (0.49,0.71)
Estimated Glucose Disposal Rate C NA (NA,NA) 9 (7,10) 7 (5,9) 6 (5,8)
Microvascular
Estimated GFR (mL/min per 1.73 m2) C 125 (118,134) 113 (105,120) 101 (90,110) 96 (86,105)
Page 40 of 47Diabetes

9
eGFR<60 (%) C 0 0 3 5
Any eGFR<60 (%) A 0 0 4 7
Log AER (mg/24 hr) C 2.4 (2,3.9) 2.3 (1.8,3) 2.4 (2,3.1) 2.4 (2,3.1)
Sustained AER ≥30 (%) C 5 13 16 15
AER≥40 (%) C 5 13 16 16
AER≥300 (%) C 0 3 6 6
Any AER≥40 (%) A 5 28 38 44
Any AER≥300 (%) A 0 4 9 10
Hypoglycemia
Coma/Seizure (%) C 0 9 19 14
Requiring Assistance (%) C 0 34 46 43
Glycemia
HbA1c [% (mmol/mol)] C
8.8 (7.8,10.1)
73 (62,87)
8.1 (7.3,9.1)
65 (56,76)
7.7 (7.0,8.6)
61 (53,70)
7.8 (7.1,8.5)
62 (54,69)
Mean HbA1c [% (mmol/mol)] M
8.8 (7.8,10.1)
73 (62,87)
8.0 (7.2,9.0)
64 (54,75)
7.9 (7.3,8.6)
63 (56,70)
7.9 (7.3,8.5)
63 (56,69) BMI=body mass index; ACE=angiotensin converting enzyme inhibitors; ARB=angiotensin receptor blockers; HDLc=high-density lipoprotein
cholesterol; LDLc=low-density lipoprotein cholesterol; GFR=glomerular filtration rate; AER=albumin excretion rate
*C=Current (or most recent) value, M=Updated mean value, A=Cumulative Incidence (such as Any Use). Categories C, M, and A correspond to
time-dependent covariates assessed or measured at or most recently prior to each event time or right censoring time, i.e. at the most recent visit up
to the particular time-point.
Data are median (first quartile, third quartile) or %. For each time-dependent covariate, average value (and quartiles) are computed
from all values over the entire period of follow-up to the event time (any CVD “yes”) or censoring (any CVD “no”). Only subjects at
risk at the particular time-point were included; for example, at year 10 there were 1380 active participants without a prior CVD event.
The number at risk beyond year 24 declines owing to staggered entry of participants into the DCCT during 1983-1989, only 37 being at
risk of any CVD in year 30.
Page 41 of 47 Diabetes

10
Table A.4. Median and inter-quartile range or prevalence (%) for time-dependent characteristics of DCCT/EDIC participants at
DCCT baseline and at 10, 20 and 25 years of follow-up for those at risk of MACE over the course of the DCCT/EDIC study, and
the corresponding hazard ratio of any CVD per unit change in the covariate.
Baseline Year 10 Year 20 Year 25 HR 95% CI p-value
N 1441 1391 1292 1058
DEMOGRAPHIC
Physical
Age (yr) 27 (22,32) 36 (31,42) 46 (41,51) 51 (46,56) 1.112 (1.074, 1.151) 0
Weight Men (kg) 74 (67,82) 83 (76,92) 90 (80,100) 90 (80,101) 0.984 (0.964, 1.004) 0.1092
Weight Women (kg) 62 (56,69) 69 (62,78) 73 (65,84) 74 (65,84) 1.008 (0.988, 1.028) 0.4519
Mean BMI (kg/m2) 23 (21,25) 25 (23,27) 26 (24,29) 26 (24,29) 1.009 (0.952, 1.069) 0.758
BMI Men (kg/m2) 24 (22,25) 26 (24,29) 28 (25,31) 28 (25,31) 0.966 (0.903, 1.034) 0.3216
BMI Women (kg/m2) 23 (21,25) 25 (23,28) 27 (24,31) 27 (24,31) 1.019 (0.962, 1.08) 0.5147
Behavior
Smoking (%) 19 19 14 12 2.247 (1.411, 3.579) 7.00E-04
Alcohol (% occasional or regular) 22 40 45 45 0.783 (0.608, 1.007) 0.0568
Exercise (% moderate or strenuous) 70 55 55 55 0.979 (0.676, 1.416) 0.909
TRADITIONAL
Blood Pressure
Systolic (mm Hg) 114 (106,122) 118 (110,126) 120 (112,129) 120 (110,130) 1.034 (1.022, 1.046) 0
Mean Systolic (mm Hg) 114 (106,122) 115 (110,121) 118 (112,124) 118 (112,124) 1.071 (1.046, 1.096) 0
Diastolic (mm Hg) 72 (68,80) 76 (70,82) 74 (68,80) 71 (65,78) 1.01 (0.987, 1.034) 0.3842
Mean Diastolic (mm Hg) 72 (68,80) 74 (71,78) 75 (71,78) 74 (71,77) 1.044 (1.005, 1.085) 0.027
Pulse pressure (mm Hg) 40 (34,48) 42 (36,50) 46 (39,54) 48 (41,57) 1.045 (1.03, 1.059) 0
Hypertension (%) 3 19 58 65 2.198 (1.348, 3.586) 0.0016
Any Hypertension (%) 0 23 71 79 2.291 (1.303, 4.027) 0.004
Pulse rate (bpm) 76 (68,84) 74 (68,80) 72 (64,80) 70 (62,78) 1.029 (1.011, 1.048) 0.0016
Mean Pulse rate (bpm) 76 (68,84) 74 (69,78) 73 (69,77) 73 (69,77) 1.074 (1.044, 1.106) 0
Medications
ACE (%) 0 7 40 44 0.945 (0.583, 1.533) 0.8191
Page 42 of 47Diabetes

11
ARB (%) 0 0 12 16 1.024 (0.486, 2.158) 0.9495
Beta Blockers (%) 0 1 4 11 2.796 (1.441, 5.424) 0.0024
Calcium Channel Blockers (%) 0 1 5 8 2.385 (1.216, 4.68) 0.0115
Lipid Lowering (%) 0 3 44 60 1.141 (0.696, 1.872) 0.6006
Lipids
Total cholesterol (mg/dl) 174 (153,197) 184 (161,207) 177 (155,200) 171 (149,195) 1.011 (1.007, 1.016) 0
Mean Total cholesterol (mg/dl) 174 (153,197) 181 (163,202) 184 (165,200) 181 (165,197) 1.018 (1.011, 1.025) 0
Triglycerides (mg/dl) 70 (55,94) 73 (54,104) 71 (51,104) 66 (50,92) 2.522 (1.807, 3.518) 0
Mean Triglycerides (mg/dl) 70 (52,93) 74 (59,97) 74 (59,99) 74 (59,98) 2.923 (1.87, 4.568) 0
HDLc (mg/dl) 49 (42,57) 52 (44,62) 53 (45,65) 58 (48,72) 0.984 (0.97, 0.999) 0.0323
Mean HDLc (mg/dl) 49 (42,57) 50 (44,59) 53 (45,61) 53 (46,63) 0.983 (0.965, 1.002) 0.0754
LDLc (mg/dl) 107 (91,127) 113 (93,135) 103 (86,122) 93 (75,111) 1.014 (1.008, 1.019) 0
Mean LDLc (mg/dl) 107 (91,127) 112 (96,131) 112 (97,127) 109 (96,122) 1.02 (1.012, 1.029) 0
Hyperlipidemia (%) 23 30 56 67 1.647 (1.055, 2.571) 0.0282
DIABETES-RELATED
History
Insulin Dose (units/kg/day) 0.64 (0.5,0.8) 0.63 (0.51,0.75) 0.53 (0.36,0.69) 0.51 (0.33,0.69) 1.363 (0.694, 2.678) 0.3691
Mean Insulin Dose (units/kg/day) 0.64 (0.5,0.8) 0.65 (0.55,0.79) 0.61 (0.5,0.73) 0.59 (0.49,0.71) 1.296 (0.433, 3.874) 0.6431
Estimated Glucose Disposal Rate NA (NA,NA) 9 (7,10) 7 (5,9) 6 (5,8) 0.763 (0.683, 0.853) 0
Microvascular
Estimated GFR (mL/min per 1.73 m2) 125 (118,134) 113 (105,120) 101 (90,109) 96 (85,104) 0.978 (0.971, 0.986) 0
eGFR<60 (%) 0 0 3 5 4.356 (2.21, 8.586) 0
Any eGFR<60 (%) 0 1 4 7 3.949 (2.099, 7.429) 0
Log AER (mg/24 hr) 2.4 (2.0,2.9) 2.3 (1.9,3.0) 2.4 (2.0,3.1) 2.4 (2.0,3.2) 1.283 (1.151, 1.431) 0
Sustained AER ≥30 mg/dl (%) 5 14 16 16 1.916 (1.18, 3.109) 0.0085
AER ≥40 mg/dl (%) 5 13 16 17 2.171 (1.355, 3.478) 0.0013
AER ≥300 mg/dl (%) 0 3 6 6 3.028 (1.64, 5.593) 4.00E-04
Any AER ≥40 mg/dl (%) 5 28 39 45 1.729 (1.127, 2.654) 0.0122
Any AER ≥300 mg/dl (%) 0 4 10 10 3.072 (1.834, 5.148) 0
Hypoglycemia
Coma/Seizure (%) 0 9 18 13 1.021 (0.835, 1.248) 0.8379
Page 43 of 47 Diabetes

12
Requiring Assistance (%) 0 34 45 42 1.005 (0.905, 1.114) 0.9319
Glycemia
HbA1c [% (mmol/mol)]
8.8 (7.8,10.1)
73 (62,87)
8.1 (7.3,9.1)
65 (56,76)
7.7 (7.0,8.6)
61 (53,70)
7.8 (7.1,8.6)
62 (54,70) 1.297 (1.139, 1.478) 1.00E-04
Mean HbA1c [% (mmol/mol)]
8.8 (7.8,10.1)
73 (62,87)
8.0 (7.2,9.0)
64 (54,75)
7.9 (7.3,8.6)
63 (56,70)
7.9 (7.3,8.6)
63 (56,70) 1.539 (1.309, 1.808) 0
BMI=body mass index; ACE=angiotensin converting enzyme inhibitors; ARB=angiotensin receptor blockers; HDLc=high-density lipoprotein
cholesterol; LDLc=low-density lipoprotein cholesterol; GFR=glomerular filtration rate; AER=albumin excretion rate
*C=Current (or most recent) value, M=Updated mean value, A=Cumulative Incidence (such as Any Use). Categories C, M, and A correspond to time-
dependent covariates assessed or measured at or most recently prior to each event time or right censoring time, i.e. at the most recent visit up to the
particular time-point.
Data are medians (first quartile, third quartile) or %. Only subjects at risk at the particular time-point were included; for example, at year 10 there were
1391 active participants without a prior MACE event. The number at risk beyond year 24 declines owing to staggered entry of participants into the
DCCT during 1983-1989, only 40 being at risk of MACE in year 30.
Page 44 of 47Diabetes
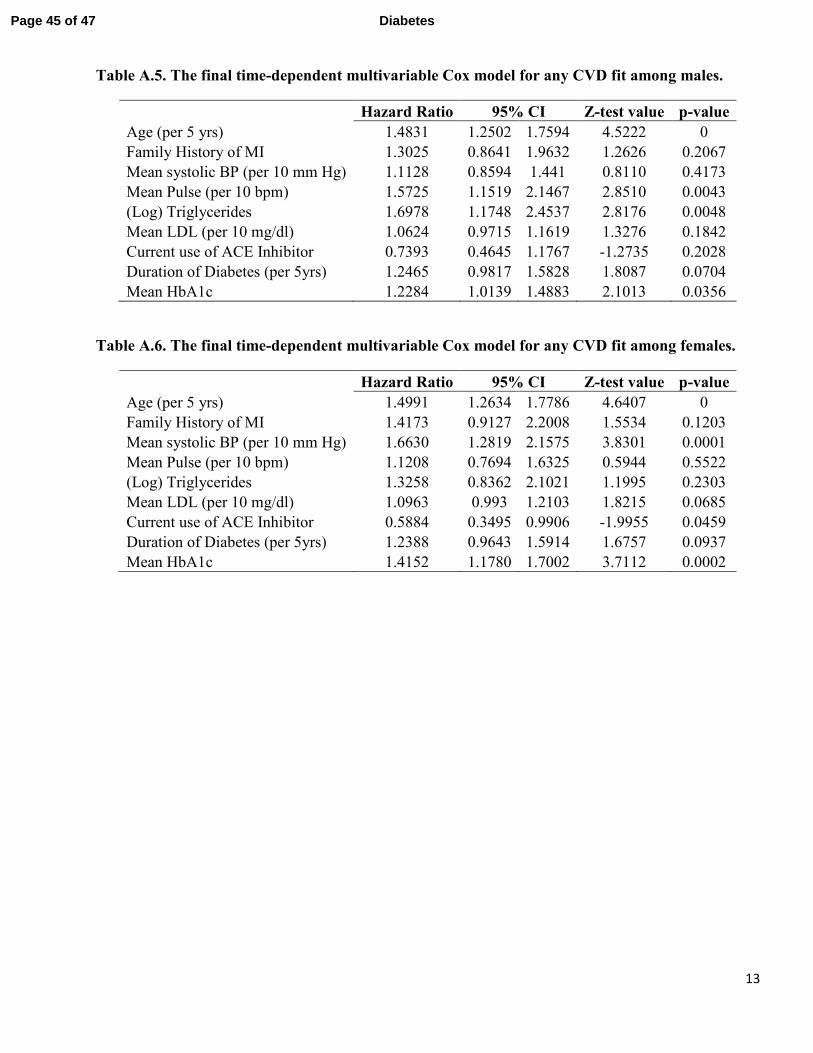
13
Table A.5. The final time-dependent multivariable Cox model for any CVD fit among males.
Hazard Ratio 95% CI Z-test value p-value
Age (per 5 yrs) 1.4831 1.2502 1.7594 4.5222 0
Family History of MI 1.3025 0.8641 1.9632 1.2626 0.2067
Mean systolic BP (per 10 mm Hg) 1.1128 0.8594 1.441 0.8110 0.4173
Mean Pulse (per 10 bpm) 1.5725 1.1519 2.1467 2.8510 0.0043
(Log) Triglycerides 1.6978 1.1748 2.4537 2.8176 0.0048
Mean LDL (per 10 mg/dl) 1.0624 0.9715 1.1619 1.3276 0.1842
Current use of ACE Inhibitor 0.7393 0.4645 1.1767 -1.2735 0.2028
Duration of Diabetes (per 5yrs) 1.2465 0.9817 1.5828 1.8087 0.0704
Mean HbA1c 1.2284 1.0139 1.4883 2.1013 0.0356
Table A.6. The final time-dependent multivariable Cox model for any CVD fit among females.
Hazard Ratio 95% CI Z-test value p-value
Age (per 5 yrs) 1.4991 1.2634 1.7786 4.6407 0
Family History of MI 1.4173 0.9127 2.2008 1.5534 0.1203
Mean systolic BP (per 10 mm Hg) 1.6630 1.2819 2.1575 3.8301 0.0001
Mean Pulse (per 10 bpm) 1.1208 0.7694 1.6325 0.5944 0.5522
(Log) Triglycerides 1.3258 0.8362 2.1021 1.1995 0.2303
Mean LDL (per 10 mg/dl) 1.0963 0.993 1.2103 1.8215 0.0685
Current use of ACE Inhibitor 0.5884 0.3495 0.9906 -1.9955 0.0459
Duration of Diabetes (per 5yrs) 1.2388 0.9643 1.5914 1.6757 0.0937
Mean HbA1c 1.4152 1.1780 1.7002 3.7112 0.0002
Page 45 of 47 Diabetes

14
Figure A.1. Risk gradients showing the linearity of the log hazard rate for any CVD (A) and for MACE
(B) as a function of the weighted mean HbA1c (a time-dependent covariate) and age at baseline.
A. Any CVD
6 7 8 9 10 11
-2-1
01
2
Weighted Mean HbA1c
Log Hazard
15 20 25 30 35 40
-2-1
01
2
Age
Log Hazard
Page 46 of 47Diabetes

15
B. MACE
6 7 8 9 10 11
-2-1
01
2
Weighted Mean HbA1c
Log Hazard
15 20 25 30 35 40
-2-1
01
2
Age
Log Hazard
Page 47 of 47 Diabetes