Embed Size (px)
Citation preview

Page 1 of 30

Page 2 of 30
Abstract
We are now approaching what scientists have named “The Sixth Extinction”. Ants are considered
incredibly important taxa to ecosystems. The red barbed ant (Formica rufibarbis) is arguably the
rarest animal in Britain and is likely to be the next ant species to disappear from British shores. In
the early 20th
Century nest sites within England were evident in large areas of heathland in South-
east England. Presently only three nest sites are known to exist all within Chobham Common, a
nature reserve managed by Surrey Wildlife Trust. Understanding peak activity periods of foraging
will help develop survey methods that more efficient, reliable and valid. Foraging activity was
observed from 08:00–20:00. Foraging activity, number of workers leaving nest in 15 minutes, and
prey returned to nest was recorded. Foraging activity closely followed soil temperature and to a
less extent the air temperature, with the highest frequency of ants observed leaving the nest
when the soil temperature was close to the peak for the day (14:00hrs). Plant material accounted
for 15.8% of all food returned to the nests. The most common prey was Hemiptera, accounting for
over 12%, closely followed by Hymenoptera and Coleoptera. Sugar bait stations offered a good
estimate of foraging activity, a foraging area of approximately 500m2 was found. Aggression
bioassays were used to determine colony identities of two adjacent nests, and suggest they are
closely related, supporting the belief they were produced by colony fission. Dipoena tristis
(Theridiidae) was a regular predator at the nests. Results from study are used to suggest
implications for survey methods.

Page 3 of 30
Introduction
Formica rufibarbis
Distribution and status
Causes for decline
Conservation management
Aims
4
4
5
5
5
6
Methods
Study site
Roadside
Rowan
Experimental procedure
Foraging activity
Prey return
Bait station study
Thermal comparison of nest and release sites
Nest aggression bioassays
Statistical menthods
7
7
8
9
9
9
10
10
11
11
12
Results
Foraging activity
Prey return
Bait station study
Thermal comparison of nest and release sites
Aggression bioassays
Observations
New nest entrances
Predation
13
13
14
15
18
19
19
20
20
Discussion
Temperature / Foraging activity relationship
Prey return
Bait station study
Colony identities
22
22
23
23
25
Conclusion and Implications 27
Acknowledgements 28
References 28

Page 4 of 30
Introduction
We are now approaching what scientists have named “The Sixth Extinction”. Animal and Plant
species are disappearing at an astonishing rate, only seen five times in all of Earth’s history (Leakey
& Lewin 1995). Although documentation of large vertebrate species features as a dominating
force in media and even scientific literature, most of these extinctions are predicted to be that of
insects (Dunn, 2005). Such a bias to studying vertebrate animals as they are more charismatic is a
form of taxonomic chauvinism, invertebrates they have received less research funding and interest
throughout history (Leather, 2009). It is however the invertebrate extinctions that may be most
damaging to ecosystems, as they are often the foundations of them (Dunn. 2005) Invertebrates
offer a diverse range of ecological system functions rendering them incredibly important to the
local ecosystem, local extinctions are therefore as important as global ones. The UK has seen huge
number of extinctions over the last century, many invertebrates have been lost most of which can
be attributed to human activity (Shirt, 1987) Butterflies have been given the most attention in the
invertebrate world and a massive decline in butterflies has been witnessed within the UK (Thomas
et al 2004). There is very little known of all the other invertebrates with regards to their status,
countless species could be in threat that we are unaware of. It is often only when a species
becomes incredibly rare that attention is drawn and it is often too late.
Ants are considered an incredibly important taxa to ecological functioning acting as herbivores,
predators, involved in soil aeration and important in plant seed dispersal mechanisms. They can be
regarded as ecosystem engineers (Folgarait, 1998). One ant species has already been lost from
Britain – the Black-backed meadow ant (Formica pratensis) (Shirt, 1987). Eight further species are
at risk of being lost and have been placed on the Biological Action Plan (BAP) to prevent this. The
Red-barbed ant (Formica rufibarbis) is arguably the rarest animal in Britain (Pontin, 2005) and is
likely to be the next ant species to disappear from British shores if a concerted effort is not made
for its conservation.
Formica rufibarbis
This species is a member of the Formicidae family of ants which has a further 8 representatives in
the UK. It is distinguishable from the close relatives Formica cunicularia and Formica sanguinea by
the presence of two barb like hairs on the prothorax which has led to the common name Red-
barbed ant. Full identification keys can be found in Skinner & Allen (1996). Little is known of its
breeding biology when compared to the intensely studied relative Formica rufa. Nests have been
shown to include one or more queens and contain up to a thousand workers (Czechowski et al.
2002). The nuptial flights within the UK occur in June-July and nests are usually dormant from
October through to April (Donisthorpe, 1927; Pontin, 2005). It is a thermophilic species preferring
bare ground in full sun. Nests are often located underneath stones which increase the
microclimate, achieving higher surface temperatures than that of the surroundings (Pontin 2005).

Page 5 of 30
Workers forage singly for a diverse array of invertebrate prey (Donisthorpe, 1927: Jones, 2009)
and have been noted to harvest honey dew from aphids where it is available (Pontin, 2005).
Distribution and status.
Formica rufibarbis is classed as a common species within continental Europe ranging across the
Palearctic and is present in southern and central Europe as far north as 62 degrees latitude and
spreads into Asia minor and Caucasus (UK BAP, 1998). There is however no data supporting a
global population trend of the species (Gammans, 2008). Within the UK it is a very rare species,
historically only living within the southern parts of the British Isles mainly in Surrey, along with a
population in the Isles of Scilly (Donisthorpe 1927, Pontin 2005). In the early 20th
Century F.
rufibarbis was evident in large areas of heathland of South-east England consisting of many nests
(Donisthorpe, 1927). Presently only three nests are known, all of which are within the nature
reserve Chobham Common managed by The Surrey Wildlife Trust.
Causes for decline.
Formica rufibarbis is a specialist of sandy heathland (Pontin,2005), an endangered habitat itself,
designated a BAP priority habitat in Britain. Sadly only 16% of Britain’s heathland from 1900s
remains (English Nature, 2002). Poor management of Britain’s remaining heathland adds to the
decline of this species. Grazing being removed from the remaining areas of heath led to increased
vegetation succession. The increased cover of heather, gorse and bracken removed the favourable
bare ground limiting the nest locations further (Pontin, 2005).
Conservation management
General heathland management is beneficial to the conservation of F. rufibarbis as well as a
variety of other warmth loving invertebrates such as Solitary bees (Buckland, 2007). Grazing is
beneficial to plant biodiversity and can increase percentage of bare soil however as populations
are incredibly low the potential risk due to trampling is a real threat to the species’ survival
(Buckland, 2007; Pontin, 2002). Therefore scrape creation is one of the main tools used in
Chobham Common where bare soil is created or banks are constructed to increase south facing
slopes (Pontin, 2002). In 2008 twenty Formica rufibarbis colonies were released at Chobham
Common. Queens were released with ‘nest chambers’ (small plastic box with entrance tube) with
a minimum of ten workers along and a small reserve of fish eggs for food to maximise survivorship
(Gammans, 2008). It is evident that a number of the sites failed and Lasius niger has colonised
some locations and potentially killed some queens (Gammans, 2008).
Ants generally forage within a limited thermal range (Garcia-Perez et al. 1994) understanding this
range is important information when predicting peak times of activity in order to achieve reliable
surveying of foraging presence. Temperature has been shown to be a very strong factor in
determining an ant’s competitive ability and each species has what can be regarded as having a
temperature niche (Hӧlldobler & Wilson, 1990). As this is very important for conservation of the
species it is important to understand the temperature envelope that is most beneficial for the

Page 6 of 30
species. Jones (2009) found a maximum activity level in soil temperatures of approximately 30°C
and activity falls at 50°C from the Isles of Scilly population. We expect this to be similar in the
English population however no studies have focused on this, or the thermal qualities of nest sites
themselves. In this study the aim is to understand the foraging ecology of the remaining nests of
Formica rufibarbis on Chobham Common. There is also no data with regards to the prey that is
taken by the English population. Jones (2009) found an adaptive prey selection in the Isles of Scilly
population showing a positive quality for the conservation of the species. Understanding the
foraging area of the remaining nests will develop an idea of areas to be searched when surveying
for the released nests. Foraging distance has been stated at 10m (Jones, 2009) to 20m (Hӧlldobler
& Wilson, 1990) from the nest entrance however this may be misleading information, which may
not be applicable to the English population. Understanding peak activity periods of foraging will
also lead to procedures that will lead to the most efficient survey methods, which is very
important for such a rare species.
Aims
• Develop a temperature envelope under which the Chobham common nests are
most active.
• Establish an estimate of the foraging distance and area of Formica rufibarbis.
• Note the main species of ants that interact with F. rufibarbis and determine if
competition is evident.
• Compare the temperature of the release sites with that of the known nest sites,
testing assumption that they are of similar value.
• Record prey taken by the nests noting any trends.
• Observe any predator species of the ants or interesting interspecies interactions.
From the results of this study suggestions to survey methods for Formica rufibarbis on Chobham
Common will be made. Further work that could be conducted will also be discussed.

Page 7 of 30
Methods
Studying such a rare species provides issues for the researcher, normal methods such as pitfall
trapping, marking of individual workers or excavating of nests is not possible as this would
significantly increase mortality rate (Billick, 1999). As there are only three English nests remaining
any work that would increase mortality was avoided.
Study Site
The study was conducted in Chobham Common, Surrey (+51° 22’50", -0° 36’56”) located in South-
east England from June-August 2011. The two known Formica rufibarbis nest sites in England are
within 300m of each other and for the purpose of this study are named ‘Roadside’, due to a road
to the West of the nests and ‘Rowan’, due to presents of a rowan tree to the East of the nest. The
location of each is shown in Map 2.
Map 1. Location of Study site within Chobham Common, Surrey.
Map 2. Location of the two nest sites, Rowan and Roadside, within Chobham Common.
Page 8 of 30
Roadside
(Grid reference SU 96440 65533)
This F. rufibarbis nest site is the newest discovery dating from 2008. It is a site of once overgrown
gorse (Ulex europeaus) that had been cut back and a bund created. Dominant grass species were
Molinia caerulea and Agrostis curtisii, Heather was also present however in much less frequency
(Erica cinerea, Calluna vulgaris and Erica tetralix). Gorse, Ulex minor, was present. Ulex europeaus
were up to a height of 1.4m. Birch saplings were scattered around the site with heights of
approximately 1m. The B383 (Chobham Road) ran north-south to the west of the site. The two
nest entrances were identified and named A and B in May 2011. Nest entrances A1, A2 were
discovered June 2011 both of which showed to have connections to A. B1 was discovered August
2011 with a connection to B.
Photo 1. South facing view of Roadside site. B383 is to the west.
Photo 2. North facing view of Roadside site showing the areas of thicker vegetation. Nest locations are shown.

Page 9 of 30
Rowan
(Grid reference SU 96701 65625)
This site is home for an established F. rufibarbis nest, its existence has been known for over 10
years (Pontin, 2002). The site has been subject to heathland management to increase areas of
bare soil by turfing which would prevent vegetation succession that would shade out the species
(Pontin, 2002). The nest site has been managed by the addition of stone slabs near the entrance to
restrict both vegetation growth in the area and allow a higher temperature of the site.
Photo 3. Nest entrance at Rowan site. The coin in the centre of picture is a British ten pence piece.
Grasses Molinia caerulea and Agrostis curtisii dominate the areas where scrape has not occurred
and vegetation covers 100% of ground at heights exceeding 30cm. Heather, mainly Erica cinerea
and gorse (Ulex minor and Ulex europeas) also occurs across the site. A small patch of Birch trees is
to the east of the site and one lone Rowan tree stands 8 m from the nest to the East.
Experimental procedure.
Foraging activity
Each nest entrance was observed from 08:00–20:00 for 3 days. Thermochrons (DS1921G-F) were
placed close to the nest entrances approximately 1cm beneath the surface. Direct temperature
readings were not possible as they would have disturbed the colony. A circular ring of string was
suspended at with a diameter of 15cm around the nest. Numbers of ants leaving the string circle
were recorded for 15 minutes at the start of each hour. Ants that did not leave the string were not
counted as they as they taken as being involved in nest maintenance rather than foraging. A
thermochron was also placed 20cm above the soil surface recording temperature when the study
occurred. All thermochrons recorded temperatures every 30 minutes. Air temperatures were not

Page 10 of 30
recorded by the thermochron due to a technical fault. All air temperatures were taken from the
nearby Woking weather station. (Met-Office, 2011)
Prey return.
All prey returned to the nest within 15minutes was recorded at the same time period as the
foraging activity study was conducted. Recording for prey and activity was separated by 15
minutes as it is impossible to simultaneously record both sets of information accurately. Prey was
identified to nearest possible taxonomic division. If prey could not be identified a digital photo was
taken allowing later scrutiny, if this still did not help the item was labelled as unknown.
Bait station study
A 40m x 40m grid of bait stations spaced 4m apart was placed around the nest locations. Each bait
station consisted of a 1cm3
piece of cotton wool soaked with 2ml of 20% sugar solution (w:v)
resting on a 2cm x 4cm piece of card. Preliminary data showed that ants show no aversion to
walking on the card, this aided ant identification. Recordings of number and species of ant present
were taken after 1, 1.5, 2, 2.5 hour duration after placing down the bait stations. It took
approximately 20 minutes to place down bait stations and the same time to record all ants
present. Recordings were only taken on fair weather days with air temperatures exceeding 15°C.
All data collection was taken between the hours of 12:00 and 15:00, as preliminary data showed
this was the peak period of activity for the nests.

Page 11 of 30
Thermal comparison of Nest and Release sites.
Thermochrons were positioned at release sites on Chobham common to develop an
understanding of the soil surface temperature of these locations. Release sites were marked with
slate and thermochrons placed in close proximity to these. Again the thermochrons were placed
adjacent to release sites and 1cm beneath the soil, recording temperatures half-hourly for 16
days. Location of release site is shown in Map 1. Thermochrons used in foraging activity study
were used to gather thermal data from the nests.
Photo 4. Example of release site slate. Red circle shows the position of the thermochron.
Nest aggression bioassays
The procedure was developed from that described in Carlin & Hӧlldobler (1986). Aggression
crosses were taken from all the known active nest entrances (A, A2, B, & C) and all possible crosses
performed. Foraging ants were taken as they left the entrance. One ant from each nest was placed
within a Petri dish lined with clean filter paper. Ants were given 30 seconds to calm from the initial
disturbance of being handled, after which time the behaviour was monitored for 2 minutes. The
behaviour was scored according to the most aggressive act observed. After the assay was
performed the ants were returned to the nest they were removed from. Each cross combination
was repeated 10 times.

Page 12 of 30
Table 1. Scoring responses of the aggression bioassay of ant pairings, taken from Carlin & Hӧlldobler (1986).
Score
0 Casual tolerance; huddle together; allogroom; food exchange.
1 Initial jerk back, the tolerance; initial or weak avoidance.
2 Intense antennation (“investigation”); rapid mutual antennation; jerk back at
each encounter; strong open-mandible threat.
3 Strong avoidance or flight; light mandible-mandible nipping (“nibbling”);
aggressive regurgitation (“spitting fight”); stand atop.
4 Repeated, rapid forward-and-back jerking with open mandibles;
stilt-legged posture; "advance-retreat" ; carry
5 Strong mandible-mandible nipping ("sparring"); seize
and drag; lunge (weak charge); nip antennae, body, limbs;
chase; gaster forward to spray acid
6 Charge and attack; briefly lock together; prolonged biting/ spraying fight
Statistical Methods.
All statistical analyses, unless noted otherwise, were conducted in “R”, version 2.11.0 (R
Development core team, 2011)
The comparison of prey frequencies returned back to the nests, A, B and C were compared using
the likelihood of independence test (G-test). It was performed using the “R” package “Deducer”
(Fellows, 2011). Thermal comparison of release and nest sites were analysed using repeated
measures ANOVA where sites were taken as replicates and time of day as psuedoreplicates.
Analysis was only conducted for temperatures from 08:00-20:00hrs as this data could be related
to foraging activity. The Rayleigh test for uniformity, assessing the significance of the mean
resultant direction of F. rufibarbis individuals at bait stations in relation to the nest. The test was
performed in “R” using the package CircStats (Agostinelli, 2009). The C-score “checkerboardness”
was used to determine whether there was a co-occurrence of species found at the individual bait
stations or conversely if there was a significant checkerboard layout suggesting competition (Stone
& Roberts, 1990). The simulation model EcoSim (Gotelli & Entsminger, 2001) was used to calculate
the score. Observed data of species presence at each bait station was compared to null model
Monte Carlo simulations of random species combinations constrained by totals from the matrix
data. Five-thousand iterations were simulated and p values calculated from the location of the
observed C-score on the normal distribution of simulated C-scores. See Stone & Roberts (1990) for
a thorough explanation of the mathematical reasoning. Aggression bioassays were analysed using
the non-parametric Mann-Whitney U Test comparing inter-intra scores of sites, (Rowan:Roadside)
colonies (A:B) and nests (A2:A).

Page 13 of 30
Results
Foraging Activity
Foraging activity, number of workers leaving nest in 15 minutes, closely followed the soil
temperature and to a less extent the air temperature, with the highest frequency of ants observed
leaving the nest when the soil temperature was close to the peak for the day (Figs 1-3)
Numbers of ants leaving the nest increased with increasing temperature towards midday and then
fell with the cooling in the afternoon. Temperature ranges were 9.5 - 57.5 ºC and 8.9 - 28.9 ºC for
soil and air respectively, both of which showed a significant positive effect on ants leaving the
nest. (Fig 4 & 5).
Figures 1-3. Frequency of ants leaving the entrance
of three study nests A,B and C within a 15 minute
period against time of day. Corresponding air
temperature and soil temperature is shown. Each
graph shows results for one of the three day
repeats. All temperatures are in degrees Celsius.

Page 14 of 30
Figure 4 & 5. Activity as frequency of ants leaving in 15 minute period plotted against soil and air
temperature. All temperatures are degrees Celsius. The data has been fitting with a quasipoisson GLM.
Soil-temperature: y=exp(0.06x +0.68),T=3.71, d.f.=116, P<0.001, Air temperature : y=exp(0.09x + 0.73),
T=10.83, d.f.=116,P<0.05.
Prey return
Table 2. Frequency of prey returned to nest entrance divided in taxonomic division from a total of 9 hours
observation for each nest. Percentages are given in brackets.
Nest
Taxa All A B C
Plant 37 (15.8) 9 (15.5) 9 (20.0) 19 (14.5)
Hemiptera 30 (12.8) 6 (10.3) 8 (17.8) 16 (12.2)
Hymenoptera 28 (12.0) 9 (15.5) 2 (4.4) 17 (13.0)
Coleoptera 28 (12.0) 9 (15.5) 5 (11.1) 14 (10.7)
Aracnida 21 (9.0) 2 (3.4) 1 (2.2) 18 (13.7)
Diptera 18 (7.7) 7 (12.1) 3 (6.7) 8 (6.1)
Isopoda 9 (3.8) 0 (0.0) 5 (11.1) 4 (3.1)
Orthoptera 9 (3.8) 2 (3.4) 4 (8.9) 3 (2.3)
Lepidoptera 8 (3.4) 3 (5.2) 0 (0.0) 5 (3.8)
Myriapoda 7 (3.0) 2 (3.4) 1 (2.2) 4 (3.1)
Annelid 7 (3.0) 0 (0.0) 1 (2.2) 6 (4.6)
Dermaptera 4 (1.7) 0 (0.0) 0 (0.0) 4 (3.1)
Mollusc 3 (1.3) 2 (3.4) 0 (0.0) 1 (0.8)
Unidentified 25 (10.7) 7 (12.1) 6 (13.3) 12 (9.2)
Total 234 58 45 131

Page 15 of 30
The most common prey type for the three nests was Hemiptera, accounting for over 12% of all
prey observed being brought back to the nests, closely followed by Hymenoptera and Coleoptera.
Arachnids was next most common however this result was mostly influenced by nest C where
arachnids accounted for 13.7% of the returned food items but this was less than 4% for nests A
and B. Plant material accounted for 15.8% of all food bought back to nest and this percentage was
typical for all three nests. Diptera accounted for only 6.7% and 6.1% for nests B and C respectively
however this value was nearly twice as high at 12.1% for nest A. The proportions of prey return
from the different taxonomic divisions was not found to be significantly different between the
three nests (G-test, G=29.17, d.f.=26, P=0.3).
Bait Station study
Roadside
The grid was limited in its extension to the West due to the road (B493). The majority of Formica
rufibarbis were found in a southerly direction from the nest site, towards the road. Although over
5 species of ant were found at the site, it was rare for more than 2 species to be present at a bait
station. Formica fusca was found at 32 of the 61 bait stations, proving to be a common ant species
at the site, monopolising 11 of these. Co-occurrence of ant species at bait stations was not
different to that that would be expected to chance (C-Score = 0.717, p = 0.10, N.S.). Formica
rufibarbis was present at a total of 25 bait stations indicating a foraging area of 400m2.
Figure 6 Frequency of Formica rufibarbis at Roadside bait stations in relation to the distance from the nest.
Formica rufibarbis workers were found up to 17.9m from the nest, the majority being 4-5m from
nest. The mean distance was 9.5m. Figure 8 shows a histogram to represent the distance from
nest data for the Roadside

Page 16 of 30
Figures 7 & 8. Above Left: Schematic of Roadside bait stations showing presence of ant species Above right:
Circular plot showing distribution of direction of Formica rufibarbis measured from Roadside nest site. The
mean vector of distribution is shown by with thin line arrow. (Rayleigh test, n=163, rho=0.571 p<0.01)
Rowan.
Formica rufibarbis was not found at bait stations clustered in any particular direction relative to
the nest. Lasius niger was the most common species of ant found at bait stations, showing
presence at nearly half (39/81). Many of which were shared with F. rufibarbis. Lasius niger also
showed a high competitive nature monopolising 9 of the stations. A total of 32 bait stations
showed F. rufibarbis presence accounting for a foraging area of 512m2. The furthest a worker was
found from the nest was 17.9m, with the mean distance being 9.6m.
Figure 9 Frequency of Formica rufibarbis found a bait stations in relation to the distance from the Rowan
nest.

Page 17 of 30
Above: Figure 10. Schematic Road site bait stations
showing presence of ant species.
Left: Figure 11. Circular plot showing distribution of
direction of Formica rufibarbis measured from Rowan nest
sites. The mean vector of distribution is shown by with thin
line arrow. (Rayleigh test, n=142, rho=1.405, P=0.21, N.S.)
The co-occurrence of species at bait station was found to be lower than that expected by chance,
supporting the extent of competition of species at this site. (C-score=1.322, p<0.001).
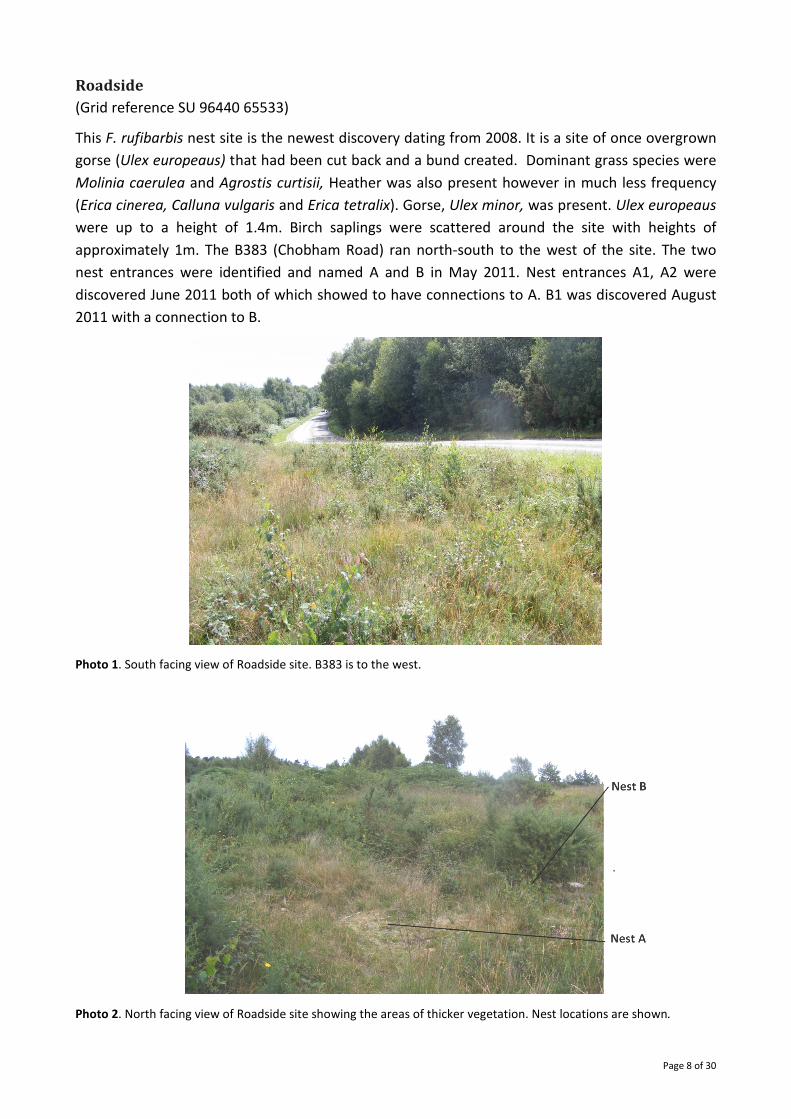
The mean number of F. rufibarbis counted at the bait stations increased with time (Fig. 12)
however no significant difference was found (Kruskal Wallis, K=5.70, df = 3, p-value = 0.128). The
mean number of bait stations with a F. rufibarbis present varied very little over time (Kruskal
Wallis, K=1.14, df = 3, p-value = 0.767).
Page 18 of 30
Figure 12. A- Frequency of Formica rufibarbis found at bait stations for different durations after
placement. B- Frequency of bait stations with Formica rufibarbis present for difference durations
after placement.
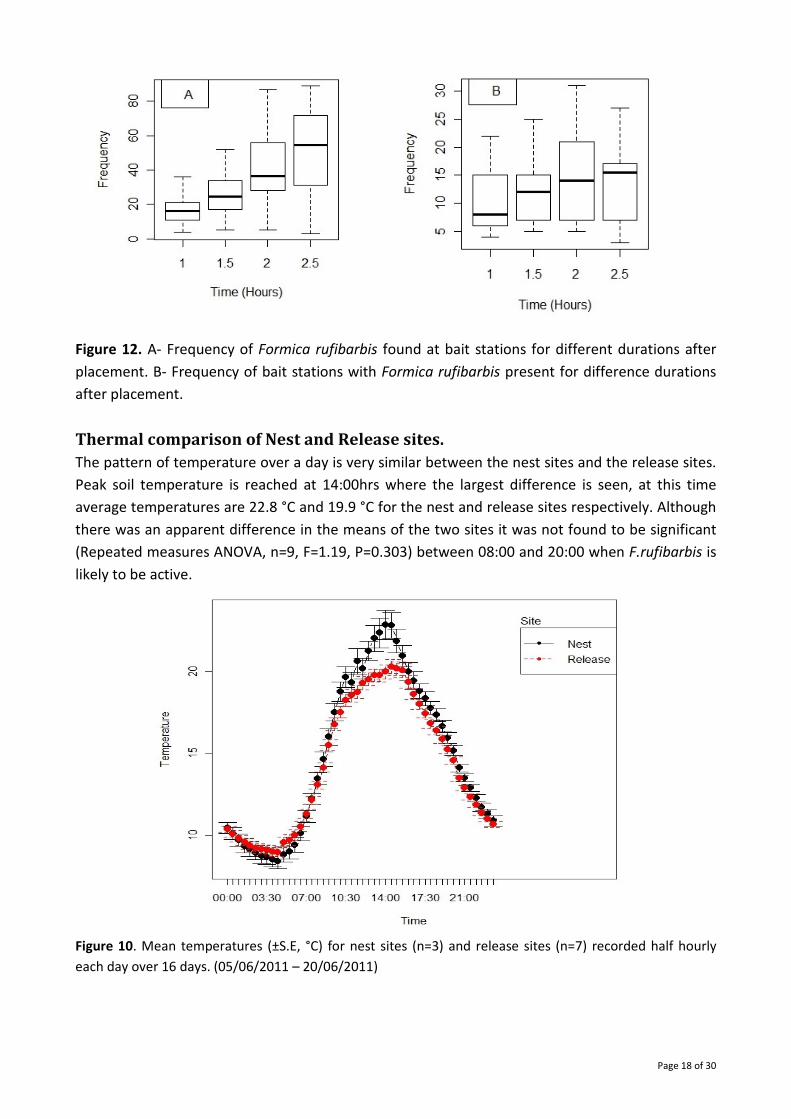
Thermal comparison of Nest and Release sites.
The pattern of temperature over a day is very similar between the nest sites and the release sites.
Peak soil temperature is reached at 14:00hrs where the largest difference is seen, at this time
average temperatures are 22.8 °C and 19.9 °C for the nest and release sites respectively. Although
there was an apparent difference in the means of the two sites it was not found to be significant
(Repeated measures ANOVA, n=9, F=1.19, P=0.303) between 08:00 and 20:00 when F.rufibarbis is
likely to be active.
Figure 10. Mean temperatures (±S.E, °C) for nest sites (n=3) and release sites (n=7) recorded half hourly
each day over 16 days. (05/06/2011 – 20/06/2011)

Page 19 of 30
Aggression bioassays.
Aggression bioassays between the two sites Roadside and Rowan created the highest aggressive
response averaging a 4 on the scale, significantly higher than the control (intra-site bioassays).
Inter colony crosses between nests A and B score a much lower score when mixed averaging just
2, this score was consistently higher than the control. The lowest average score was observed
between the inter nest crosses between A1 and A. This was not seen to be significantly different
from that of the control.
Figure 11. Boxplots showing the results of aggression bioassay tests and corresponding controls.
A – mixes between nest sites, Road:Rowen (n=30, control n=70 Mann-Whitney U Test: M=57.16, d.f.=1),
B – mixes between colonies, Colony A: Colony B (n=20, control n=40, Mann-Whitney U Test: M=656, d.f.=1),
C – mixes within Colonies, A:A2 (n=10, control n=20, Mann-Whitney U Test: M=124, d.f.=1).
Observations
Workers were observed milking and tending to an aphid colony on a young gorse plant near to
nest A throughout study period. Two queens were witnessed climbing the grass around nest C at
14.00hrs on July 14th
2011 at 13.00hrs. this suggests a nuptial flight had occurred close to this
date. Activity of nests A and B was checked the same day but no queens were witnessed.

Page 20 of 30
New nest entrances.
A1 - While conducting the study of foraging activity on Nest A the carrying of pupae into the
entrance was witnessed. This first led to the discovery of a new nest entrance used by the colony
on 22nd
June 2011. The workers were followed back to their origin where a new nest entrance was
confirmed 2.7m North of nest A’s location in dense short cut grass. It was along a trail likely to
have been created by a rodent. By 14th
July 2011 it appeared the nest was abandoned, no activity
was witnessed after this date. The entrance degraded over time and was barely visible by 21st
August 2011.
A2 - Ant activity was observed 1.3m to the East of nest A and a new entrance was identified. The
connection to nest A was confirmed when pupae originating from A were carried to this new nest.
B1 - When observing nest B ants leaving were witnessed carrying pupae. Following the workers led
to the discovery of a new nest entrance 3m to the North at the base of a gorse stump in bare
ground of soil and woodchip. This entrance was discovered 21st
August 2011.
Predation.
When conducting the foraging study it became apparent that the obligate ant mugging spider,
Dipoena tristis (Theridiidae), was often present at the entrances. Out of the 9 days monitoring nest
activity the spider was present for 8 of these times. Three individuals were observed present at
nest C on one occasion. They were very successful at catching ants around the entrances; with one
spider taking 4 individuals in one day. A time of 3 hours was recorded from capture to complete
consumption of one worker. The crab spider Xysticus cristatusw was also noted feeding on F. rufibarbis.
Above: Photo 5. Dipoena tristis feeding on a
worker, found at nest C.
Right: Photo 5. Xysticus cristatus feeding on
worker, found at nest A.

Page 21 of 30
Agelena labyrinthica is very common at both the Rowan and Roadside sites, webs were often
within a meter of the entrances. F .rufibarbis was never witnessed falling victim to this species.
Workers walked onto the web sheet on two occasions and fought off the attack from this species.
It should be noted however that this was an observation was not of an adult A. abyrinthica. Webs
of A. labyrinthica were checked for remains of Formica rufibarbis but predation by this species was
not confirmed.

Page 22 of 30
Discussion
Temperature/ Foraging activity relationship
This study shows how the activity of the nests, number of ants leaving per unit time, increases
with increasing temperature. This relationship can only be used to describe the temperatures that
were experienced in this study, a range of 9.5 - 57.5°C and 8.9 - 28.9°C for soil and air respectively.
We cannot extrapolate from this data that this relationship will continue into higher temperatures.
The GLM shows how the activity begins to rise after approximately 15°C. Ants have been shown to
have a thermal niche where they show activity, yet above and below this niche activity will cease
and potentially the individuals will die (Hӧlldobler & Wilson, 1990). Jones (2009) and Nielson
(1981) found that soil temperatures above 35°C actually led to a reduction in activity. The data
from this study showed activity continuing to rise at soil temperatures up to 50°C showing a much
higher temperature tolerance. It could be that the English population of F. rufibarbis is actually
adapted to living in a warmer environment than that of the Isles of Scilly or Denmark (Nielson,
1981). The mean high temperatures given in June for Isles and Scilly and Woking are 17 and 20
respectively (Met-Office, 2011). This higher temperature experienced by the English F. rufibarbis
colonies may have led to a better adaptation to warmer soil temperatures. A small increase in air
temperature is likely to suggest a larger soil temperature increase due to the nonlinear
relationship (Green et al. 1984). Further studies would need to be conducted to test this theory.
Perhaps monitoring colonies produced by queens originating from the Isles of Scilly to see if they
have a lower temperature tolerance. Equally the difference may be a result of discrepancies of soil
temperature recording. Although methods of recording temperature were identical between the
studies it is plausible that soil erosion brought upon by rain caused the thermochrons to come
closer to the surface. Soil depth is crucial for determining temperature (Oliver et al. 1987). If the
depth of the thermochrons was less in this study a higher temperature would be recorded. To
combat this discrepancy in soil temperature recorded a more accurate method to measure actual
surface temperature such as an infrared thermometer could be used.
Although the GLM shows the activity continuing to rise, the data suggests that the peak activity
temperature was nearly reached in the observations taken for soil temperatures above 50°C.
Looking at the plots of frequency of ants leaving and temperature you can see that there are 4
points near 50°C that are of considerably lower than that of the calculated GLM. Ants are known
to have a minimum and maximum activity temperature (Hӧlldobler & Wilson, 1990). To ascertain

Page 23 of 30
what the peak temperature is it is recommended that more readings of foraging activity should be
taken incorporating more temperatures exceeding 50°C. It would be beneficial to take data from a
warmer month, August for example. This however could not be used to compare activity from
another month as number of ants within a colony may alter within a season (Hӧlldobler & Wilson,
1990). The activity level would have to be standardised to account for changes in number of
foragers in a colony over the season.
It could be argued that as temperature and time of day follow a specific pattern and it is merely an
artefact that activity follows temperature. A diurnal rhythm based on time which peaks around
midday might just be followed. This argument however is not likely to be a valid one. Time of
sunrise changes by nearly 2 hours over the spring and summer season showing that time is not a
reliable measure to determining activity. Hunt (1974) showed how activity rhythms of ants are
controlled more by temperature and environmental factors rather than diurnal time rhythms. A
unimodal activity rhythm can be turned into a bimodal one by shading a nest around midday
(Hunt, 1974) the reduction in temperature this caused significantly reduced foraging activity
supporting a temperature related activity pattern in ants.
Prey return.
Prey return studies retrieved disappointing results in terms of number of observations. Only a
total of 58 prey items were witnessed being returned to nest A in a total of 9 hours observation.
This result could be due to the fact that there were other active nest entrances for this colony (A1
and A2). Workers could potentially be returning food items to these entrances, causing a
reduction in number of observed food entering nest entrance A. Nest B also provided
disappointing numbers of prey returned, it is possible that an entrance was concealed underneath
the gorse. The second nest entrance of colony B was not found until August but it may be possible
that it was present throughout the whole season. The bait station study does support the
presence of F. rufibarbis to the north of the nest B, where the new entrance B1 was found. (Fig. 5),
so we cannot rule out its presence at the time the bait station study was conducted.
Bait station study
Previous work on the Isles of Scilly population has noted that Formica fusca does not occur in the
same localities as F. rufibarbis (Brian, 1964). These two species do occur together in Chobham
Common. The C-score for the Rowan site showed a level of competition for bait stations between

Page 24 of 30
the ant species. It is highly likely that these are competitive species limiting each other’s local
distribution. This would limit F. rufibarbis to foraging in the higher temperature soil types created
by bare soil, where it has the advantage over F .fusca and others. Formica fusca has been shown
not to prefer bare soil (Brian, 1964; Buckland, 2007), this was seen in the grid station study where
most of the F. fusca was found to the North and east of the Roadside nests where covers of Gorse
and Molinia spp. formed a high percentage of ground cover.
The maximum distance from the nest a worker was found was 17.9m for both sites which is similar
to the distance noted in Hӧlldobler & Wilson, (1990) however much larger than the distance noted
from Jones (2009), but this study only use anecdotal evidence to come to this conclusion.
Although there seems to be a higher frequency of ants foraging at 4-5m distance from the nest
this is likely to be a misleading result. Ants leaving the nest entrance to forage are likely to come in
contact with the bait stations at 4m and start feeding rather than foraging at further distances.
The numbers observed are evenly distributed suggesting that they forage uniformly with respect
to distance from the nest. This study could be improved by placing a ring of sugar bait stations
immediately outside of the nest. This would prevent new foragers leaving the nest influencing the
frequencies at the 4m bait station. This would get a realistic snap-shot of where the foraging
workers are in relation to the nest entrance. The area covered by F. rufibarbis was 5122m in the
Rowan site and 400m2 for the Roadside site. The grid station however was likely not to have
sampled all the foraging area of the Roadside site as the road acted as a barrier to the ants. It is
likely that the ants carried on further South-west along the path. Assuming that the Roadside will
have equal foraging area to the Rowan site foraging could continue for a further 16m. It would be
interesting to focus a study on the prey retrieval in Formica rufibarbis. The grid bait station study
could not distinguish between members of nest A or B in the roadside site. An investigation that
sadly could not be completed in this study due to time constraints could be easily conducted to
see whether nest A and B had overlapping foraging areas. Following a method described in Bouley
et al. (2007) a detailed foraging territory map can be constructed. Dividing the study area into
distinct grids and observing each grid for F. rufibarbis activity, workers can be offered a distinct
packet of food (usually tuna). The worker could then be followed back to the entrance, giving
foraging territories and area for specific colonies. This could also provide information on whether
one nest entrance was preferred for returning prey to in a colony. This data could retrieve very
important information for this species of great conservation importance. If strong territories are
observed it suggests that two colonies forage antagonistically, this would suggest perhaps they be
Page 25 of 30
relocated for a mutual benefit, or that any further reintroductions of F. rufibarbis be spaced
further apart to prevent competitive in foraging between conspecifics.
The total number of bait stations with the species presence did not increase over time. This
information suggests that sugar bait stations will provide a reliable measure of F. rufibarbis
foraging activity of a location within an hour of being placed out, little more information is likely to
be gained from an increasing sampling time to 2. 5 hours. Sugar bait stations were used to
measure the foraging activity in this study as studies showed it provides a good bait to capture a
range of ant species (Way et al. 1997). Given further time a study focusing on preferred bait
station would have been conducted to ascertain the best possible bait to survey Formica
rufibarbis. Tuna is regularly used for such predatory species as F. rufibarbis however this might not
actually be beneficial to surveying this species. Formica rufibarbis has good eyesight and likely
forages using sight when compared to other ant species (Donisthorpe, 1927). Using odoriferous
Tuna may favour ant species that use olfactory cues preferentially which would not be beneficial.
It may be that different coloured bait stations could have important in creating a better bait
station for F. rufibarbis. A simple study could be conducted to ascertain the best colour increasing
accuracy of survey technique of F. rufibarbis such information would be incredibly important
considering the post-release colonies have yet to be found.
Colony identities
From this study it seems that the Roadside site consists of two distinct colonies. The new
entrances A1, A2 and B1 are proven to be of the same colonies of A and B respectively, due to the
exchange of pupae and workers between them. However the lack of interaction observed
between nests A and B does not qualify them as distinct colonies. Gammans (2008) suggests the
two nests are satellite nests however no work has really focused on confirming this. The
aggression bioassays have shown that members of the two nests A and B have a significantly
different aggressive behavioural response to each other. Such behavioural responses support a
self/non-self distinction that workers from different colonies are making (Carlin, 1989). Although
the mean response is not of an especially aggressive manner they are significantly different to that
of control B-B, A-A and A2-A2 crosses. An interesting finding is the significant difference of inter
and intra aggression of the sites. Inter site bioassays (A, A2 and B crosses with C) produced high
levels of aggression, the only bioassays that produced scores above 3. Nest colony identification in

Page 26 of 30
ants has been shown to be based from genetic and environmental factors creating differing
hydrocarbons coated on the workers (Jackson & Morgan, 1993). Although it has been shown that
diet (Liang & Silverman, 2000) and nesting material (Bos et al., 2011) is important in the ability for
colonies to identify self from non-self, this has been shown not to be the case for F. rufibarbis. Van
Zwedon (2011) shows through cross fostering studies that it is heritable factors that influences the
hydrocarbons that are involved in nest mate recognition in F. rufibarbis which impacts on
aggressive bioassays. This being known the results of this study suggests the close relatedness of
nests A and B and not that of C. The distinguishing of inter and intra site colony aggression is
suggestive that colony formation has been due to fission (Dahbi et al. 1996) which supports what
is suggested by Gammans (2008). These results are far from conclusive as there is far more
research to be conducted on nest mate recognition in ants. It would be interesting to test
aggression bioassays on the Isles of Scilly’s population to determine factors of nest aggression, to
decipher what determines aggressive response and whether it consistently corresponds to
relatedness or merely nest proximately. This could be related to DNA studies which are currently
ongoing (Gammans, 2008). Caution should be taken with the interpretation of these studies.
Experimenter bias is a problem regular featured in scientific research (Sheldrake, 1998), this study
was conducted by a single experimenter and results may have been influenced by an expectation
of result. To remove this possible criticism I suggest a repeat using a double blind experimental set
up using a naive person grading ant aggression bioassays.

Page 27 of 30
Conclusion and Implications
Sugar bait stations offered a good estimate of foraging activity for Formica rufibarbis, strong
attraction to the bait stations was witnessed. Foraging distance was shown not to exceed 17.9m
with the mean distance approximately 10m. I would therefore suggest that bait stations for survey
work of F.rufibarbis should be placed in grid like formation with distances not exceeding 18m.
Preferably it should be 10m to increase chance of falling in the foraging range of the workers. If
the distance exceeded 18m survey work could easily miss the forging range of a nest. The
Roadside nest showed increased foraging activity alongside the road, this suggests survey work
should be focused near to roads. Time showed little effect on number of bait stations with
F.rufibarbis present between 1hour and 2.5 hours. It seems that survey work involving bait
stations would produce reliable data on the presence/absence within an hour after the bait
stations had been set out, little benefit to increasing duration of surveying was indicated.
Competition between ant species is evident at the sites. Lasius niger has high competitive effect,
monopolising bait stations frequently. Formica fusca is rarely found in conjunction with Formica
rufibarbis they likely exclude each other locally.
A significant relationship was found for the foraging activity of the nests for air and soil
temperatures. It suggests that air temperatures increasing up to 29°C have a beneficial impact;
survey work should be taken at these warmer temperatures to increase chance of finding a
forager. For Chobham common the highest soil temperature on average is at 14.00hrs which
suggests the peak activity for the nests. Temperatures above those experienced within this study
may not follow the same pattern of increased activity. A reduction in activity is predicted for soil
temperatures exceeding 50°C and air temperature above 29°C.
Nests A and B are likely to have been formed through fission as the low aggression bioassays
suggests a high level of relatedness when compared to nest C. The different aggressive response
between nests A and B suggest they are independent colonies but the score is low enough to
suggest they have overlapping territories. More work needs to be completed to ascertain if this
assumption is correct.

Page 28 of 30
As heritable factors have been shown to be involved in nest identification unrelated queens are
likely to lead to highly aggressive colonies, suggesting queens from different blood lines should not
be released close to each other.
Acknowledgements
I would like to thank Jon Knight for supervising me throughout the whole project. I would
especially like to thank Scott Dodd for sharing his expertise and help with insect identification.
References
Agostinelli, C. (2009). CircStats: Circular Statistics, from "Topics in circular Statistics" (2001). R package version
0.2-4. http://CRAN.R-project.org/package=CircStats
Billick, I. (1999) The use of mark-recapture to measure worker number in the rock nesting ant species,
Formica neorufibarbis Emery. Insectes soc. 46, 256-260.
Boulay, R.L., Cerda, X., Simon, T., Roldan, M., Hefetz, A. (2007) Intraspecific competition in the ant
Camponotus cruentatus: should we expect the ‘dear enemy’ effect? Animal Behaviour. 74, 985-993.
Bos, N., Grinsted L. & Holman, L. (2011) Wax On, Wax Off: Nest Soil Facilitates Indirect Transfer of Recognition
Cues between Ant Nestmates. PLoS ONE 6(4):e19435. doi:10.1371/journal.pone.0019435
Brian, M.V. (1964) Ant distribution in a Souther English heath. Journal of Animal Ecology 33, 451-461.
Buckland, N. (2007) The effect of heathland management practices on ant foraging habitat. MSc Thesis. The
University of Reading.
Carlin, N.F. (1989) Discrimination between and within colonies of social insects: Two null hypotheses.
Netherlands journal of Zoology 39, 86-100.
Carlin, N.F. & Holldobler, B. (1986) The kin reconigition system of carpenter ants (Camponotus spp.) 1.
Hierarchial cues in small colonies. Behav. Ecol. Sociobiol. 19, 123-134.
Czechowski, W., Radchenko, A. & Czechowska, W. (2002) The ants (Hymenoptera, Formicidae) of Poland.
Warsaw, Museum & Institute of Zoology.
Dahbi, A., Cerda, X., Hefetz, A.& Lenoir, A. (1996). Social closure, aggressive behavior,and cuticular
hydrocarbon profiles in the polydomous ant Catagluphis iberica (Hymenoptera, Formicidae). J. Chem. Ecol.
22, 2173–2186
Donisthorpe, H.J.K. (1927) British ants: Their life-history and classification. George Routledge. London.
Dunn, R.R. (2005) Modern insect extinctions, the neglected majority. Conservation Biology 19, 1030-1036
Page 29 of 30
English Nature (2002) Lowland heathland: a cultural and endangered landscape. English Nature, Belmont
Press.
Fellows, I. (2011). Deducer: Deducer. R package version 0.4-4. http://CRAN.R-project.org/package=Deducer
Folgarait, P.J. (1998) Ant biodiversity and its relationship to ecosystem functioning: a review. Biodiversity
Conserv. 7, 1221–124
Gammans, N. (2008) Conserving the red barbed ant (Formica rufibarbis) in the United Kingdom, project report
2008. Surrey Wildlife Trust.
García-Pérez, J.A., Rebeles-Manríquez A. & Peña-Sánchez, R. (1994) Seasonal changes in trails and the
influences of temperature in foraging activity in a nest of the ant Pogonomyrmex barbatus. SW Entomol 19,
181-187.
Gotelli, N.J. & Entsminger, G.L. (2001) EcoSim: Null models software for ecology. Version 7.0. Acquired
Intelligence Inc. & Kesey-Bear. http://homepages.together.net/~gentsmin/ecosim.htm.
Green, F.H.W., Harding, R.J. & Oliver, H.R., (1984) The relationship of soil temperature to vegetation height. J.
Climatol. 4, 229-240.
Hӧlldobler, B. and Wilson, E.O. (1990) The Ants. Cambridge, USA: Belknap Press of Harvard University Press.
Hunt, J.H. (1974) Temporal activity patterns in two competing ant species (Hymenoptera: Formicidae). Psyche.
81, 237-242.
Jackson, B. D., & Morgan, E. D. 1993. Insect chemical communication: pheromones and exocrine glands of
ants. Chemoecology 4, 125–144
Jones, S. (2009) Foraging behaviour and nesting ecology in the red barbed ant Formica rufibarbis
(Hymenoptera: Formicidae). MSc Thesis. Imperial College London.
Liang, D. & Silverman, J. (2000) “You are what you eat”: Diet modifies cuticular hydrocarbons and nestmate
recognition in the Argentine ant, Linepithema humile. Naturwissenschaften 87, 412–416.
Leather, S. (2009) Taxonomic chauvinism threatens the future of entomology. Biologist. 56, 10-13.
Leakey, R. & Lewin R. (1995) The Sixth Extinction. Biodiversity and its Survival. London: Weidenfeld &
Nicolson.
Met-Office (2011) UK Weather. [online]. Available from “ http://www.metoffice.gov.uk/weather/uk/”
[Accessed 29th
August 2011]
Nielsen, M.G. (1981) Dirunal foraging activity of two ant species, Myrmica schencki Emery and Formica
rufibarbis F., in a sandy heath area. Nat. Jutlandica. 19, 49-52.
Oliver, S.A., Oliver, H.R. & Wallace, J.S. (1987) Soil heat flux and temperature variation with vegetation, soil
type and climate. Agricultural and Forest Meteorology. 39, 257-269
Pontin, J. (2002) Annual Report to English Nature on Formica rufibarbis. Surrey, UK.
Pontin, J. (2005) Ants of Surrey. Surrey Wildlife Trust. Surrey, UK
R Development Core Team (2011) R: A language and environment for statistical computing. R Foundation for
Statistical Computing.Vienna , Austria. ISBN 3-9000051-07-0. http://www.R-project.org
Sheldrake, R. (1998) Experimenter effects in scientific research: how widely are they neglected? J Sci
Exploration 12, 73-78
Shirt, D.B. (editor) 1987. British Red Data Books: 2 Insects. Nature Conservancy Council, Peterborough.
Page 30 of 30
Skinner, G.J. & Allen, G.W. (1996) Ants. Naturalists’ handbooks 24. Slough, The Richmond publishing Co.
Ldt.
Stone, L. & Roberts, A. 1990. The checkerboard score and species distributions. Oecologia 85, 74-79
Thomas, J.A., Telfer, M.G., Roy, D.B., Preston, C.D., Greenwood, J.J.D., Asher, J., Fox, R., Clarke, R.T. & Lawton,
J.H. (2004) Comparative losses of British butterflies, birds, and plants and the global extinction crisis.
Science 303, 1879-1881
UK BAP (1999) UK Biodiversity Group Tranche 2 Action Plans - Volume IV: Invertebrates. p245
van Zweden, J.S., Brask, J.B., Christensen, J.H., Boomsma, J.J., Linksvayer, T.A. & D'Ettorre, P. (2010), Blending
of heritable recognition cues among ant nestmates creates distinct colony gestalt odours but prevents
within-colony nepotism', Journal of Evolutionary Biology. 23. 1498-1508.
Way, M.J., Cammell, M.E., Paiva, M.R. & Collingwood, C.A. (1997) Distribution and dynamics of the Argentine
ant Linepithema (Iridomyrmex) humile (Mayr) in relation to vegetation, soil conditions, topography and
native competitor ants in Portugal. Insectes soc. 44, 415-433.