Embed Size (px)
Citation preview
Page 1 of 157
Page 2 of 157
AKVA group in brief
AKVA group is the leading technology and service partner to the aquaculture industry worldwide. The Group has 1 447 employees, offices in 10 countries and a total turnover of NOK 3.2 billion in 2020.
We are a public listed company operating in one of the world’s fastest growing industries and supply everything from single components to complete installations, both for cage farming and land based aquaculture. AKVA group is recognized as a pioneer and technology leader through more than 40 years.
Page 3 of 157
Contents AKVA GROUP IN BRIEF __________________________________________________ 2
CONTENTS ___________________________________________________________ 3
HIGHLIGHTS 2020 _____________________________________________________ 4
FINANCIAL KEY FIGURES ________________________________________________ 5
CEO’S REPORT ________________________________________________________ 8
GROUP MANAGEMENT _________________________________________________ 10
BOARD OF DIRECTORS’ REPORT _________________________________________ 14
BOARD OF DIRECTORS _________________________________________________ 21
AKVA GROUP CONSOLIDATED FINANCIAL STATEMENTS AND NOTES _____________ 25
AKVA GROUP ASA FINANCIAL STATEMENTS AND NOTES _______________________ 85
AUDITOR’S REPORT __________________________________________________ 116
RESPONSIBILITY STATEMENT __________________________________________ 121
ALTERNATIVE PERFORMANCE MEASURES - NON IFRS FINANCIAL MEASURES ______ 122
ARTICLES OF ASSOCIATION OF AKVA GROUP ASA __________________________ 123
CORPORATE SOCIAL RESPONSIBILITY ____________________________________ 125
CORPORATE GOVERNANCE IN AKVA GROUP ASA ____________________________ 142
Page 4 of 157
Highlights 2020 - Order intake of 3,370 MNOK in 2020, compared to MNOK 3,409 in 2019
- Revenue in 2020 of MNOK 3,177 – a 3% increase compared to revenue in 2019
- Net profit in 2020 of MNOK 91 – an increase from MNOK 17 in net profit in 2019
- Dividend of 1.00 NOK per share paid in March 2020
- Order backlog end of 2020 of MNOK 1,881
- Acquisition of the remaining shares (34%) in Sperre AS
- Signed 100 MNOK contract for delivery of TubenetTM
- Awarded 500 MNOK grow-out facility contract with Nordic Aqua Ninbo, China
Page 5 of 157
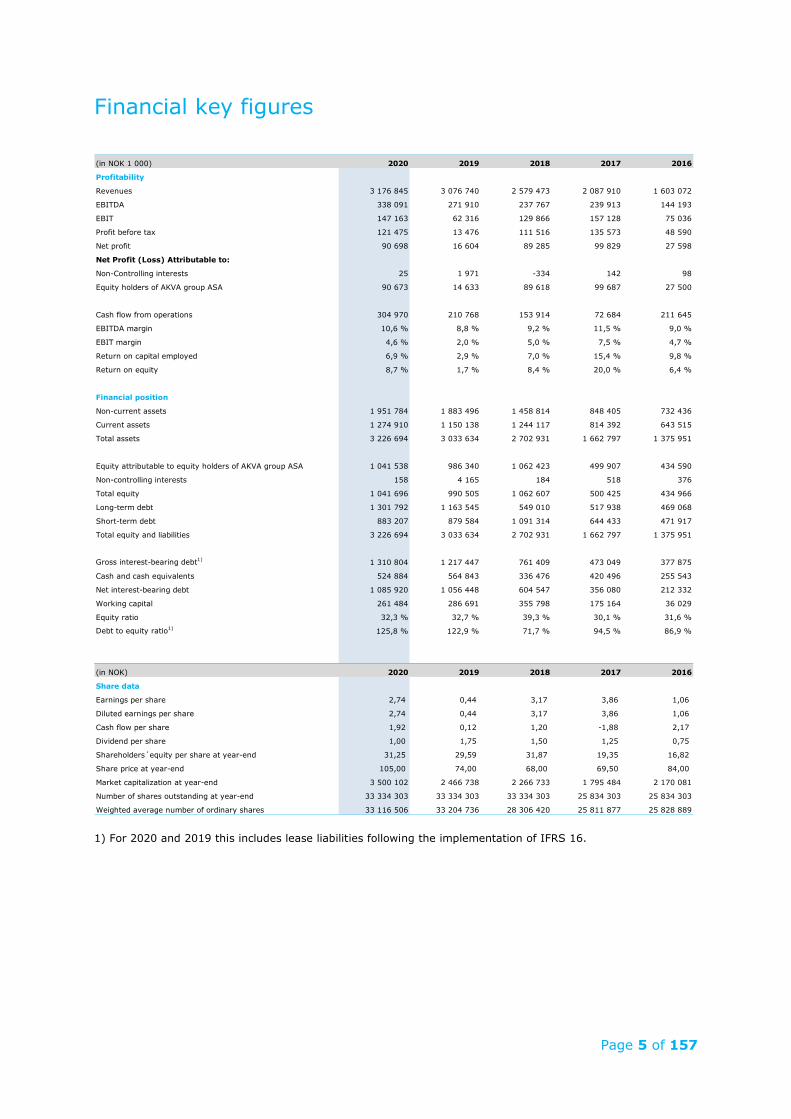
Financial key figures
1) For 2020 and 2019 this includes lease liabilities following the implementation of IFRS 16.
(in NOK 1 000) 2020 2019 2018 2017 2016
Profitability
Revenues 3 176 845 3 076 740 2 579 473 2 087 910 1 603 072
EBITDA 338 091 271 910 237 767 239 913 144 193
EBIT 147 163 62 316 129 866 157 128 75 036
Profit before tax 121 475 13 476 111 516 135 573 48 590
Net profit 90 698 16 604 89 285 99 829 27 598
Net Profit (Loss) Attributable to:
Non-Controlling interests 25 1 971 -334 142 98
Equity holders of AKVA group ASA 90 673 14 633 89 618 99 687 27 500
Cash flow from operations 304 970 210 768 153 914 72 684 211 645
EBITDA margin 10,6 % 8,8 % 9,2 % 11,5 % 9,0 %
EBIT margin 4,6 % 2,0 % 5,0 % 7,5 % 4,7 %
Return on capital employed 6,9 % 2,9 % 7,0 % 15,4 % 9,8 %
Return on equity 8,7 % 1,7 % 8,4 % 20,0 % 6,4 %
Financial position
Non-current assets 1 951 784 1 883 496 1 458 814 848 405 732 436
Current assets 1 274 910 1 150 138 1 244 117 814 392 643 515
Total assets 3 226 694 3 033 634 2 702 931 1 662 797 1 375 951
Equity attributable to equity holders of AKVA group ASA 1 041 538 986 340 1 062 423 499 907 434 590
Non-controlling interests 158 4 165 184 518 376
Total equity 1 041 696 990 505 1 062 607 500 425 434 966
Long-term debt 1 301 792 1 163 545 549 010 517 938 469 068
Short-term debt 883 207 879 584 1 091 314 644 433 471 917
Total equity and liabilities 3 226 694 3 033 634 2 702 931 1 662 797 1 375 951
Gross interest-bearing debt1) 1 310 804 1 217 447 761 409 473 049 377 875
Cash and cash equivalents 524 884 564 843 336 476 420 496 255 543
Net interest-bearing debt 1 085 920 1 056 448 604 547 356 080 212 332
Working capital 261 484 286 691 355 798 175 164 36 029
Equity ratio 32,3 % 32,7 % 39,3 % 30,1 % 31,6 %
Debt to equity ratio1) 125,8 % 122,9 % 71,7 % 94,5 % 86,9 %
(in NOK) 2020 2019 2018 2017 2016
Share data
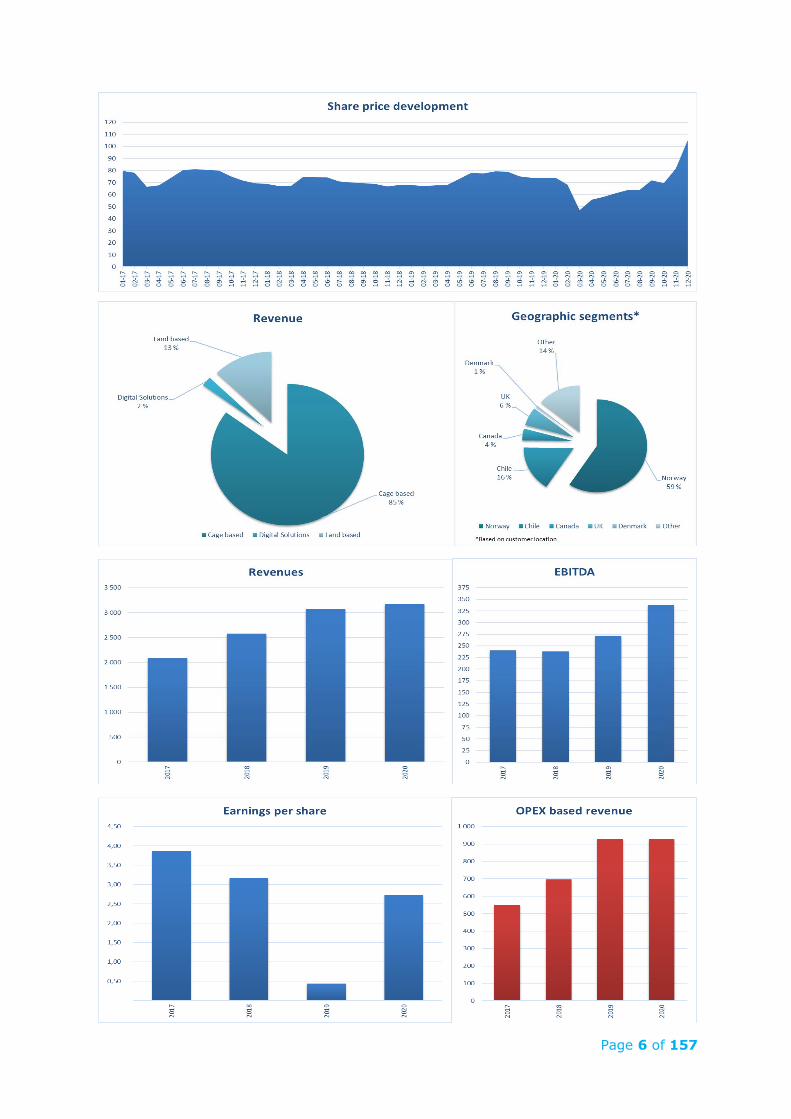
Earnings per share 2,74 0,44 3,17 3,86 1,06
Diluted earnings per share 2,74 0,44 3,17 3,86 1,06
Cash flow per share 1,92 0,12 1,20 -1,88 2,17
Dividend per share 1,00 1,75 1,50 1,25 0,75
Shareholders´equity per share at year-end 31,25 29,59 31,87 19,35 16,82
Share price at year-end 105,00 74,00 68,00 69,50 84,00
Market capitalization at year-end 3 500 102 2 466 738 2 266 733 1 795 484 2 170 081
Number of shares outstanding at year-end 33 334 303 33 334 303 33 334 303 25 834 303 25 834 303
Weighted average number of ordinary shares 33 116 506 33 204 736 28 306 420 25 811 877 25 828 889
Page 6 of 157
Page 7 of 157
CEO’s report
Group Management
Board of Directors’ report
Board of Directors
Page 8 of 157
CEO’s report Dear stakeholders and shareholders
AKVA group started 2020 with optimism, a strong order backlog and a solid pipeline of prospects.
Unfortunately, COVID-19 became a global pandemic and impacted the economics worldwide. We took immediate action with focus on securing health and safety of our employees, maintain and optimize the Group’s liquidity, maintain the security of supply, and ensure work for all our employees through a steady order intake. We believe we to a large extent have managed the situation well due to the great commitment and hard work all AKVA employees have contributed with throughout a challenging 2020. This has also been important for what became a respectable financial performance:
• Revenues increase with 3% to 3,177 MNOK • EBIT up from 62 MNOK in 2019 to 147 MNOK in 2020 • Net profit of 91 MNOK, up from 17 MNOK in 2019 • ROACE from 3.3% end of 2019 to 8.0% end of 2020
Market AKVA group is the global market leader of technology, products, and services to the fish farming industry, whereof 90% of our deliveries are to the salmon industry. Salmon prices have over the past years been relatively high due to high demand and constraints on supply. The global COVID-19 pandemic that hit the market in the first quarter of the year led to full stop in the HORECA market diverging volumes into the retail market. Lower demand for salmon put pressure on prices and low salmon prices in a middle to long-term perspective can impact the activity and profitability of AKVA group. We are dependent of our customers’ financial capacity and willingness to invest in new technology and sustainable solutions. However, there are indications of change in consumer preferences resulting in the retail market stabilizing on a higher level, and expectations that the HORECA market will recover post COVID-19. The above expectations together with market intelligence implies a demand growth of 1-2 million ton by 2030. AKVA group believes that the demand will be driven by increased focus on environment and health, and distribution of salmon to new markets. The increased demand will be covered through both conventional and unconventional supply sources. Increase in conventional production will require investments in new technology to increase capacity and utilization in existing facilities. However, a significant part of the increased demand needs to be covered from unconventional production and AKVA group believes that full grow out facilities on land will play an important role in the future. Our focus is to make sure that AKVA group remains an attractive global supplier so that the salmon industry can meet the expected demand growth worldwide. We made significant progress in 2020, which amongst other included two strategically important contracts, the 100 MNOK contract awarded for delivery of Tubenet’sTM and the 500 MNOK contract awarded for delivery of a full grow-out RAS facility in China.
Page 9 of 157
Innovation and digitalization To continue to be in the forefront by offering state of the art solutions and services to our customers we acknowledge a significant ramp-up in innovation capabilities is required. We have set out a target of 50% increase in spending within this area to support our growth ambitions. By establishing one Centre of Excellence and focusing on top collaboration in the Group we are confident that we will succeed to further strengthen our position as the global market leader of technology to the salmon industry. Combining a strong innovation agenda with digital opportunities is key to enable our organic growth ambitions. To achieve this, we will also do a step change in development and improvement of our digital solutions; AKVAconnect, AKVA Observe and Fishtalk. The acquisition of 33.67% of the shares in Observes Technologies in February 2021 was an important strategic milestone to improve our digital agenda. Our ongoing and future innovation program will also play an important part in improving sustainability within the industry through improving fish health, reducing CO2 emissions, waste management, and recycling fabricates and water. We have started an internal process to make our environmental, social and governance focus more visible and measurable, and prioritize actions by their importance. Operational excellence We have strengthened our management team in 2020 and focus to strengthen our performance culture through our operational excellence program “The AKVA way”. In 2020 we conducted a project manager training program, and we plan to execute new development programs in 2021 ensuring that our employees have the competence and the capabilities to further develop the Group. We also strive to simplify work methods and ensure top collaboration across the Group improving efficiency and customer satisfaction. We will proceed with implementation of a group ERP system supporting standardization of our business processes, improve supply chain management and project execution, and increase visibility for better decision making. Finally, we have strengthened our project- and controlling capabilities for better monitoring of performance and relevant KPI’s. The future AKVA group is in a very attractive position for future profitable growth. Our strategy outlines a strong organic topline growth and minimum 25% increase in EBIT year-on-year the coming years. My role is to make sure we make the right priorities and execute our innovation and digital agenda to the best for AKVA, our customers, shareholders, and stakeholders. Despite falling victim to a cyber extortion attack hampering our organization at the start of 2021 the long-term fundamentals remain unchanged and we are confident that we will reach our targets. An important part of everything we do is ensuring our values – Customer focus, Aquaculture knowledge, Reliability, Enthusiasm – stays guidance and compass for developing our business.
__________________ Klepp, Norway 14 April 2021 Knut Nesse Chief Executive Officer
Page 10 of 157
Group Management
Knut Nesse Chief Executive Officer Knut Nesse assumed the position as CEO in November 2019. He holds an MBA from the Norwegian school of economics and business administration (NHH) and is on the Board of several companies. Previous roles include extensive CEO experience from international leading companies. 6 years as CEO of Skretting Group (part of Nutreco) (2006 – 2012) and 6 years as CEO of Nutreco (2012 – 2018). Nutreco is a global animal nutrition and fish feed company. Mr. Nesse was first elected to the Board of Directors at the general meeting 9 May 2019. Mr. Nesse later stepped down from the Board to assume the position as CEO. He is a Norwegian citizen and resides in Bryne, Norway.
Ronny Meinkøhn Chief Financial Officer Ronny Meinkøhn assumed the position as CFO in August 2020. He came from Apply where he held the position as CFO for the past 6 years. He started his career as an auditor in EY in 2003. Mr. Meinkøhn holds an MSc in Finance from the Norwegian School of Economics (NHH). He is a Norwegian citizen and resides in Klepp, Norway.
Page 11 of 157
Andrew Campbell Chief Operating Officer Cage Based International
Andrew Campbell assumed the position as COO Cage Based International in December 2019. He joined AKVA group in 2000 assuming the role of General Manager in Chile in 2006, then in 2009 became COO Americas and Australasia. Prior to working with AKVA he worked as a Production Manager in the salmon industry in New Zealand for the New Zealand Salmon Company Ltd from 1989 to 2000. Mr. Campbell holds a Bachelor of Science degree from New Zealand’s Victoria University. He is a New Zealand citizen and resides in Stavanger, Norway.
Erlend Sødal Chief Operating Officer Cage Based Nordic Erlend Sødal joined AKVA group in May 2020. He came from Skretting/Nutreco where he held various senior management positions. He was Managing Director of Skretting Norway for 8 years and Managing Director of Cluster Norway, UK, and Australia for 3 years. During the Skretting time Mr. Sødal also acted as Skretting Global Operations Director for two periods and has also been a member of the board of directors of Norwegian Seafood federation for 4 years. Mr. Sødal holds a MSC in Industrial Economics and an MBA of Technology from NTNU/MIT. He is a Norwegian citizen and resides in Stavanger, Norway.
Page 12 of 157
Johan Fredrik Gjesdal Chief Operating Officer Land Based Johan Fredrik Gjesdal assumed the position as COO Land Based in October 2020. He joined AKVA group in 2017 as Vice President Strategy and Business Development. His professional experience includes management and consulting roles within strategy, M&A and operational improvement in Aker Solutions, KPMG, and Accenture. Mr. Gjesdal holds a Master of Science in Industrial Economics and Technology Management from the Norwegian University of Science and Technology (NTNU). He is a Norwegian citizen and resides in Oslo, Norway.
Espen Fredrik Staubo Chief Innovation Officer Espen Fredrik Staubo assumed the position as CIO in March 2019. Prior to joining AKVA group, he was the CTO of Elopak, an international supplier of paper-based packaging solutions for liquid food. He has extensive management experience from a number of international businesses and industries. Between 1997 and 2005 he worked for Stolt Sea Farm, including four years as President for the company’s European division. He has also been the CEO of the US based aquaculture company Low Salinity, where he was hired to build up the company’s land based seafood production. Mr. Staubo holds a Dr. of Science degree in Nuclear Physics from the University of Bergen. He is a Norwegian citizen and resides in Oslo, Norway.
Page 13 of 157
Per Andreas Hjetland Chief Commercial Officer Per Andreas Hjetland assumed the position as CCO in January 2020. He joined AKVA group ASA in 2008 where he was COO from September 2010 until August 2018 and thereafter served as Senior Vice President, International Business Development from August 2018 until January 2020. Prior to joining AKVA group, he held several senior positions with international companies. His professional background covers industrial technologies, and he also brings with him extensive experience in business operations, sales & marketing. Per Andreas’ academic background was gained at the Technical School of Stavanger. He is a Norwegian citizen and resides in Stavanger, Norway.
Page 14 of 157
Board of Directors’ Report AKVA group had a record high revenue of MNOK 3,177 in 2020 and a strong order intake of BNOK 3.4. The order backlog increased by BNOK 0.2 and ended at BNOK 1.9. A good basis for future growth is established, and several improvement initiatives have been implemented to secure successful and efficient project deliveries going forward. 2020 AKVA group acquired 70% of the shares in Newfoundland Aqua Service Inc (“NAS”) at the end of February 2020, and from that time consolidated the company into the Group. At the end of May 2020, AKVA group acquired 100% of the shares in Austevoll Rørteknikk AS (“Austevoll”) and consolidated the company into the Group. Austevoll was later merged with AKVA group Land Based Norway AS, with accounting effect from 31 May 2020. More information about the acquisitions is found in note 19 to the consolidated accounts. Total revenue for the Group in 2020 was MNOK 3,177, an increase of 3.3% from 2019. Earnings before interest, tax, depreciation, and amortization (EBITDA) was MNOK 338, compared to MNOK 272 for 2019. Net profit was MNOK 91 – an increase from MNOK 17 in 2019. The Land Based and Digital Solutions segments had an increase in order backlog in 2020 compared to 2019 of MNOK 314, whilst Cage Based had a decrease of MNOK 121. The Cage Based Segment had an increase in revenues in 2020 of MNOK 173. The Land Based Segment and the Digital Solutions segment had a decline in revenues of respectively MNOK 15 and MNOK 57. Adjusted for the sale of Wise the revenues in Digital Solutions increased by MNOK 7. The total order backlog ended at BNOK 1.9, whereof the Land Based segment is included with BNOK 1.0. AKVA group – the business segments AKVA group is a leading supplier of technology and services to the global aquaculture industry. Our activities include design, purchase, manufacturing, assembly, sale and installation of technology products as well as rental, service and consulting services. The Group’s main customer base is the global salmon-farming industry. The Group divides its operations into three business segments: Cage Based Technology (CBT), Digital Solutions (DS) and Land Based Technology (LBT). Main products in the CBT segment are feed barges, fish farming cages, centralized feed systems, sensors, cameras, biomass estimation systems, light systems, net cleaning systems and remotely operating vehicles (ROV’s). The PolarcirkelTM polyethylene (PE) cages are produced at our facility in Mo i Rana, Norway, and is one of the world’s leading fish cage brands. The PolarcirkelTM brand also includes PolarcirkelTM PE-boats designed for extreme conditions for the fish-farming industry, diving and the oil and gas service industry. Our manufacturing plant at Mo i Rana is also a well-known supplier of PE pipes up to 1200 mm diameter for installation in Land Based recirculation systems and for sale into the water/wastewater segment. Steel cages sold under the WavemasterTM brand are market leaders in Chile and Canada. WavemasterTM’s production facility for steel cages is in Puerto Montt, Chile. Feed barges are also marketed and sold as WavemasterTM. barges. The feed barges have a strong international position in the salmon market and are supplied with AKVASmartTM centralized feed systems as well as other technologies from AKVA group. The manufacturing of feed barges designed by AKVA group, are done in amongst others the Baltic’s, Poland, and Vietnam by external partners. Sperre AS, a subsidiary located at Notodden, Norway, holds extensive experience in developing and producing a range of advanced ROV solutions, with applications for both aquaculture as well as oil service and marine industries. Egersund Net, a company acquired in 2018, offer nets and moorings and has an extensive service network for net services. Out of filaments Egersund Net produce its own netting in Norway, which is used in the manufacturing of a variety of
Page 15 of 157
standard and special fish net designs, all optimized, focusing on quality and user-friendliness. The Digital segment provides market-leading digital solutions for fish farming as well as for the seafood and other industries. The LBT segment designs and deliver recirculation systems for land based fish farming operations. The systems ensure optimal water quality conditions for both fresh- and seawater operations. AKVA group designs the systems in both Norway and Denmark as well as having a manufacturing facility for breeding tanks at Sømna (Norway). The delivery capabilities include design, engineering, tanks, piping, feeding systems, software, cameras, sensors etc. AKVA group has a broad portfolio of systems and a strong position in the land-based aquaculture industry. AKVA group’s registered company address is in Egersund, Norway. The company has offices and service stations along the Norwegian coast as well as company and offices in Chile, United Kingdom, Lithuania, Canada, Turkey, Denmark, Australia, Spain, and Greece. In addition, the Group has representation in a few other countries. Market situation and operations through 2020 (2019 figures in brackets). The order intake decreased by 1.1%, from MNOK 3,409 in 2019 to MNOK 3,370 in 2020. NAS and Austevoll, which were acquired in 2020, are included with MNOK 31 in 2020. The decrease in order intake was 2.1% on a like for like basis excluding NAS and Austevoll. Revenues increased by 3.3%, from MNOK 3,077 in 2019 to MNOK 3,177 in 2020. The divested company Wise had a revenue of MNOK 64 in 2019. NAS and Austevoll, which were acquired in 2020, are included with MNOK 35 in 2020. On a like for like basis, excluding Wise, NAS and Austevoll, the increase in revenue was 4.3%. The order backlog increased from BNOK 1.7 in 2019 to BNOK 1.9 in 2020. The Land Based Segment experienced the highest increase in the order backlog, which increased from MNOK 669 in 2019 to MNOK 975 in 2020. The Americas region had another busy year in 2020. Revenue increased by 18%, after the region delivered the first ever order for four feed barges. The order backlog in the region is 202 MNOK. The Nordic region had a 0.5% growth in order intake and a 0.7% growth in revenues in 2020. The marine service operations including net services in sea developed well, so did the ROV business. This region also grew its order backlog, from MNOK 533 in 2019 to MNOK 543 in 2020. Order intake increased in Europe and Middle East (EME) in 2020, especially the export business (mainly to Russia) and Scotland experienced growth, but also Turkey had a positive development in new orders. The total order intake for the region increased from MNOK 316 in 2019 to MNOK 320 in 2020. The revenue in the region which was built on last year’s strong order intake increased from MNOK 291 in 2019 to MNOK 359 in 2020. We are still set with a strong order book of MNOK 161 at end of 2020, down from MNOK 200 in 2019. The Digital Solutions Segment grew in order backlog, whilst it decreased in order intake and revenues mainly due to the divestment of Wise. More importantly, the segment invested in new product modules and business development creating a robust platform for future growth.
Page 16 of 157
The Land Based Segment had a growth in order intake from MNOK 638 in 2019 to MNOK 708 MNOK in 2020, a growth of 11%. Mainly due to phasing of deliveries and several projects coming to an end, the Land Based Segment revenues declined from MNOK 417 in 2019 to MNOK 402 in 2020. The order backlog was MNOK 975 at the end of the year. Revenues from rental, services and maintenance including software sales ended at MNOK 927 in 2020. This is 29% of total revenue and makes up a solid part of the business mix of the AKVA group. Profit and loss AKVA group Total revenue for AKVA group in 2020 was MNOK 3,177 (3,077) - an increase of 3.3% compared to 2019. EBITDA for 2020 was MNOK 338 (272). Depreciation and amortization in 2020 were MNOK 191 (210). EBIT for 2020 was MNOK 147 (62). Net financial expenses were MNOK 26 (49) and Profit before tax was MNOK 121 (13). The calculated tax for 2020 is MNOK 31 (-3). Net profit for the year was MNOK 91 (17). CBT had operating revenues in 2020 of MNOK 2,706 (2,533), an increase of 6.8% compared to 2019. EBITDA was MNOK 330 (291), an increase of 13.5% compared to 2019. The increase in revenue was driven by the Nordic and Americas regions. Digital Solutions had operating revenues in 2020 of MNOK 69 (126) with an EBITDA of MNOK 18 (25). The decline in revenue and EBITDA mostly stems from the divestment of Wise (64 in 2019) in 2019. LBT had operating revenues in 2020 of MNOK 402 (417), a decrease of 3.6% compared to 2019. EBITDA was MNOK -10 (-44). The decline in revenue is partly due to several projects coming to an end, as new projects have been won and the order backlog is very strong. Earnings per share were NOK 2.74 in 2020 versus NOK 0.44 in 2019. The average total number of outstanding shares has been 33,116,506 in 2020 and 33,204,736 in 2019. Profit and loss AKVA group ASA Operating revenues for AKVA group ASA in 2020 was MNOK 1,135 (941). EBITDA for 2020 was MNOK 4 (31). Depreciation and amortization in 2020 were MNOK 26 (35). EBIT for 2020 was MNOK -22 (-4). Net financial income was MNOK 227 (36) and profit before tax was MNOK 206 (32). The calculated tax for 2020 was MNOK 8 (-5). Net profit for the year was MNOK 198 (37). Statement of Financial Position and cash flow AKVA group Total assets at the end of 2020 were MNOK 3,227 (3,034). Total liabilities amounted to MNOK 2,185 (2,043) and equity totalled MNOK 1,042 (991) giving an equity ratio of 32% (33%). Working capital in the consolidated balance sheet, defined as non-interest-bearing current assets less non-interest-bearing short-term debt, was MNOK 261 at the end of 2020, compared to MNOK 287 at the end of 2019. Working capital in percentage of 12 months rolling revenue was 8.2% at the end of 2020 compared to 9.3% at the end of 2019. Equity was positively affected during 2020 by this year’s result of MNOK 91 (17). Translation differences and cash flow hedges had positive impact on equity of MNOK 18 (-6), out of which MNOK 4 (1) was related to currency effects on goodwill and other intangible assets. Equity was negatively affected during 2020 by the dividend payment of MNOK 35, the buyback of own shares of MNOK 15 and from adjustments of contingent considerations with MNOK 8.
Page 17 of 157
At the end of 2020 gross interest-bearing debt amounted to MNOK 1,311 (1,217). The Company complied with all financial covenants during 2020. Cash and unused credit facilities amounted to MNOK 525 (565). The operating activities gave a net cash contribution of MNOK 305 (211). Statement of Financial Position AKVA group ASA Total assets at the end of 2020 were MNOK 2,531 (2,060). Total liabilities amounted to MNOK 1,497 (1,176) and equity totalled MNOK 1,034 (884) giving an equity ratio of 41% (43%). Risk factors AKVA group categorize risk factors into four categories:
1. Market/operational risk 2. Strategic risk 3. Reporting risk 4. Financial risk
Market/operational risk The aquaculture industry is associated with biological and market risk and has historically been subject to cyclicality. AKVA group aims to reduce the risks related to these factors through diversification of its products and technologies to various geographical regions and by increasing revenues from recurring service and after sales. AKVA group is exposed to fluctuations in prices of certain raw materials used for some of the main products. Reduction of this risk is sought through continuous general awareness and specific attention during major contract negotiation periods, as well as by securing the pricing of raw materials immediately after signing contracts when applicable. Strategic risk One of AKVA group's focus areas is providing technology to land based fish farming, which is a type of farming that has not been developed on a large scale yet. The investment in this segment therefore entails strategic risk and uncertainty in the form of the fact that this segment currently comprises complex projects with higher uncertainty related to margins than traditional cage based projects. To reduce this risk, AKVA group has built up its own land based organization, which specializes exclusively in this technology. The organization within land based includes engineers, economists, salespeople, lawyers and more, all with the sole focus on being able to deliver this type of projects in a profitable way. Reporting risk AKVA group are subject to the rules of the Oslo Stock Exchange and other Norwegian and European Union financial market regulations. As such, there is a risk that the performed risk assessment process and internal controls related to financial reporting does not carry the expected results, which could imply that there is a risk of material misstatements in AKVA group’s financial figures. AKVA group has implemented internal controls to address this risk, which is considered effective as of 31 December 2020. However, there can be no assurance that, going forward, the implemented internal controls will effectively prevent material misstatements in our financial statements. Hence, AKVA group will continue to focus on the design and implementation of internal controls to have sufficient assurance that the reporting risk is kept to a minimum.
Page 18 of 157
Financial risk For AKVA group the financial risks are mainly related to currency risks, interest rate risks, credit risks and liquidity risks. A reduction in currency risks is sought through matching revenues and costs in the same currency, in combination with forward contracts. The Group is also exposed to fluctuations in foreign exchange rates when calculating the equity of foreign subsidiaries into NOK. Interest bearing debt is based on floating interest rate and net interest costs will consequently increase and decrease according to fluctuations in the interest rate level. AKVA group targets to always maintain sufficient level of free cash to be able to meet its obligations and planned investment levels. Historically the Group has had low losses from customer receivables. For larger projects, the Group generally receives partial pre-payment and payments according to the progress of the projects. The credit risk is thereby reduced. AKVA group continuously monitors its liquidity, and estimates expected liquidity developments based on budgets and forecasts from the units. Any negative development in key liquidity ratios for the units are followed up and analysed. Liquidity improvement measures are implemented for each unit, to ensure that the liquidity risk is kept at a minimum. Product development In 2020 the Group invested MNOK 84 (93) in product research and development, of which MNOK 39 (44) was capitalized and MNOK 45 (49) expensed. The investments were used to further improve existing products and to develop new products. Organisation and work environment AKVA group had 1 447 (1 437) employees at the end of 2020. The Group aims at having a gender balance across the different levels of the organisation. The aquaculture industry has historically been a male-dominated industry and the Group realize that it will take time before an equal gender balance is reached. The total gender balance improved somewhat in 2020 compared to 2019 and women accounted for 34% (33%) of the employees. Group Management where all men in 2020, as well as in 2019. Of the seven members of AKVA group ASA’s Board of Directors, four are women. The Norwegian Discrimination Act’s objective is to promote gender equality, ensure equal opportunities and rights, and to prevent discrimination due to ethnicity, national origin, descent, skin colour, language, religion, and faith. The Group is working actively to encourage the act’s purpose within our business. Included in the activities are recruiting, salary and working conditions, promotion, development opportunities and protection against harassment. The Group target to be a workplace with no discrimination due to reduced functional ability and is working actively to design and implement physical working conditions to fit all employees. For employees or new applicants with reduced functional ability, individual arrangements of workplace and responsibility are made. The Group aims to strengthen the competence of its employees to maintain a position as a leading supplier of technology and service to the global aquaculture industry. Through recruitment, the company seeks to employ people with high competence within all areas of its business. Total sick leave in the Group during 2020 amounted to 5.3% (5.5%). The Group has registered two (seven) incidents causing sick leave exceeding the day the incident occurred during 2020.
Page 19 of 157
The board considers the working environment in the company to be satisfactory. Environmental responsibility AKVA group works systematically to avoid having an undesirable impact on its surroundings. This includes the day-to-day actions of its employees, involvement in research and development, as well as collaboration with government and regulatory authorities, interest groups, other aquaculture companies and suppliers of goods and services. Good environmental, social and governance principles are key to AKVA group’s global activities. The Group has started an internal process to make this focus more visible and measurable. Environment and sustainability are central to the innovation agenda in the Group. Product examples include:
- TubenetTM: Reduced lice infections and less use of medication leads to a healthier and cleaner salmon
- Water feeding: Compared to airborne feeding require water feeding less energy and reduce the CO2 emission
- Net and copper recycling and waste management at our net cleaning stations - Land-based RAS technology based on the zero-water exchange concept
More detailed information is presented in the Group’s Corporate Social Responsibility report in this report. Future outlook and going concern The COVID-19 restrictions are still impacting the industry and the company. There are however signs of improvement as the vaccination programs gradually takes effect worldwide. On 10 January 2021, AKVA group was subject to a cyber-attack impacting several key systems. Most of AKVA group’s internally hosted services were shut down and data, including backups, were encrypted. All main IT systems were recovered during Q1 2021 and no data were lost. However, the company will recognize significant non-recurring costs related to the cyber-attack in Q1. The long-term fundamentals for the industry remain unchanged and the demand for salmon is expected to increase the coming years. Increased production will require new and improved technology both within conventional and unconventional farming. The strategy for the company outlines a strong organic growth and increased profitability. This is supported by a strong focus on innovation and digital solutions, and operational excellence. With a record high order backlog AKVA group is well positioned to strengthen its position as global market leader of technology to the aquaculture industry. The Board confirms that the financial statements have been prepared on the assumption of going concern, in accordance with section 3-3a of the Norwegian Accounting Act, and that such an assumption is justified. This confirmation is based on the Group’s reported results, financial situation, and established budgets.
Page 20 of 157
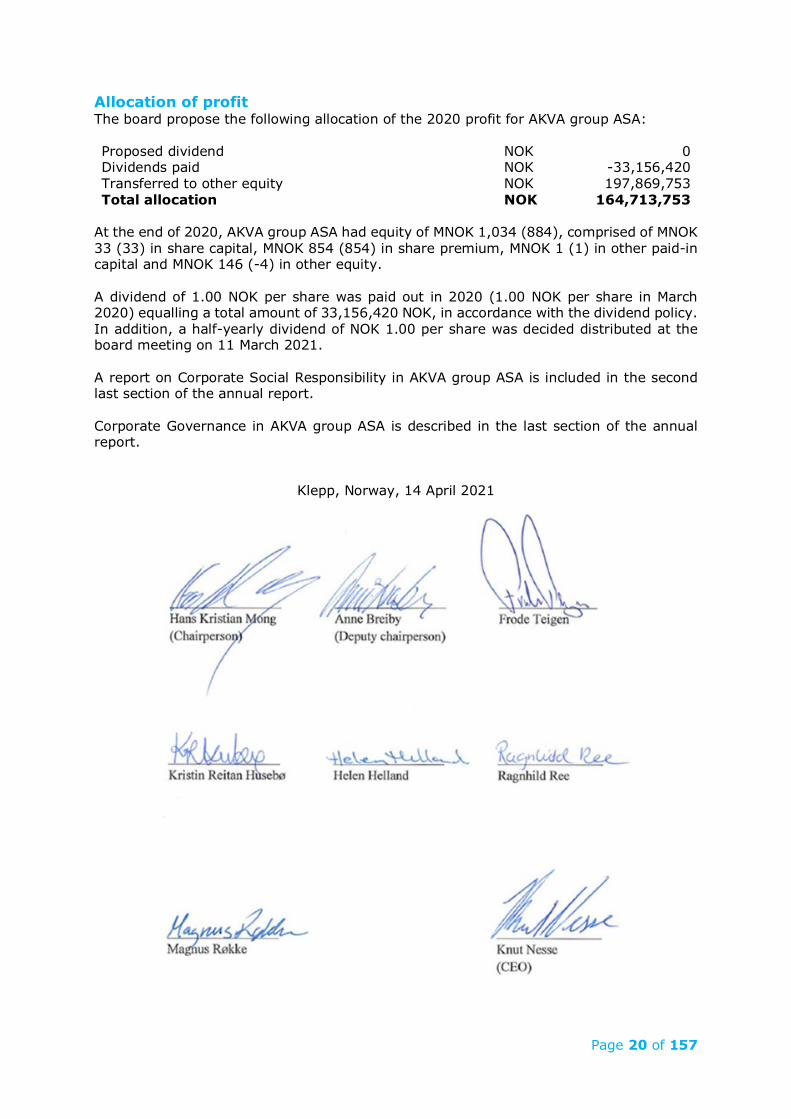
Allocation of profit The board propose the following allocation of the 2020 profit for AKVA group ASA: Proposed dividend NOK 0 Dividends paid NOK -33,156,420 Transferred to other equity NOK 197,869,753 Total allocation NOK 164,713,753
At the end of 2020, AKVA group ASA had equity of MNOK 1,034 (884), comprised of MNOK 33 (33) in share capital, MNOK 854 (854) in share premium, MNOK 1 (1) in other paid-in capital and MNOK 146 (-4) in other equity. A dividend of 1.00 NOK per share was paid out in 2020 (1.00 NOK per share in March 2020) equalling a total amount of 33,156,420 NOK, in accordance with the dividend policy. In addition, a half-yearly dividend of NOK 1.00 per share was decided distributed at the board meeting on 11 March 2021. A report on Corporate Social Responsibility in AKVA group ASA is included in the second last section of the annual report. Corporate Governance in AKVA group ASA is described in the last section of the annual report.
Klepp, Norway, 14 April 2021

Page 21 of 157
Board of Directors
Hans Kristian Mong Chairman Hans Kristian Mong lives in Egersund, Norway. He is Chairman of the board in Egersund Group AS. In addition, he holds Chairman positions in several companies, including Egersund Trål AS and Ok Marine AS. Mr. Mong was elected to the Board of Directors at the general meeting 9 May 2012.
Anne Breiby Deputy Chairperson Anne Breiby lives in Ålesund, Norway. She holds a Cand. scient degree in Fishery biology from Tromsø University. She held positions in the Norwegian Fishfarmer’s Association and the Regional Fishery Administration before serving as a Political advisor for the Minister of Fishery, Political advisor for fishery and industry matters in Parliament and Deputy Minister in the Ministry of Industry and Energy. She has broad experience from serving as a Board member for several companies and institutions. Amongst these are Domstein ASA, Ulstein group ASA, Folketrygdfondet, Sparebanken Møre, Innovation Norway, Norwegian Research Council, Rem ASA, Kongsberg Satellite Service AS, Scandinavian Business Seating AS and Fiskeribladet Fiskaren AS. Mrs. Breiby was elected to the Board of Directors at the general meeting 25 September 2006.
Page 22 of 157
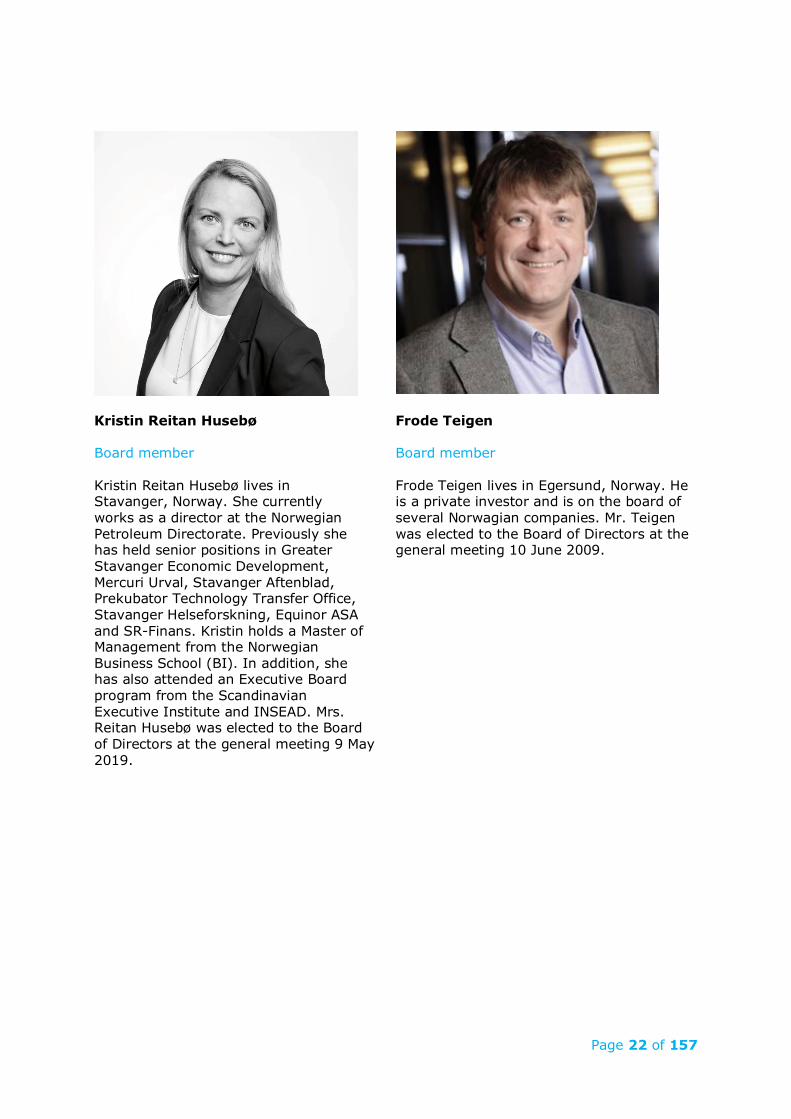
Kristin Reitan Husebø Board member Kristin Reitan Husebø lives in Stavanger, Norway. She currently works as a director at the Norwegian Petroleum Directorate. Previously she has held senior positions in Greater Stavanger Economic Development, Mercuri Urval, Stavanger Aftenblad, Prekubator Technology Transfer Office, Stavanger Helseforskning, Equinor ASA and SR-Finans. Kristin holds a Master of Management from the Norwegian Business School (BI). In addition, she has also attended an Executive Board program from the Scandinavian Executive Institute and INSEAD. Mrs. Reitan Husebø was elected to the Board of Directors at the general meeting 9 May 2019.
Frode Teigen Board member Frode Teigen lives in Egersund, Norway. He is a private investor and is on the board of several Norwagian companies. Mr. Teigen was elected to the Board of Directors at the general meeting 10 June 2009.

Page 23 of 157
Ragnhild Ree Employee elected board member Ragnhild Ree lives in Bryne, Norway, and joined AKVA group in 2006 as administration and reception employee. From 2012 sha has been payroll manager for AKVA group ASA, Helgeland Plast AS and AKVA group Software AS.
Helen Helland Employee elected board member Helen Helland lives in Bjerkreim, Norway, and joined Egersund Net AS in 1995. During these years she has held various managerial positions and for the last two years she has worked as project manager. She also works as technical support for the sales team.
Page 24 of 157
Magnus Røkke Employee elected board member Magnus Røkke lives in Brønnøysund, Norway. He has been employed as project manager in AKVA group Land Based Norway AS since 2016 and newly started as Head of Project. He is following up a team of 5 project managers, 3 project engineers, 4 technical drawers, 1 technical designer and 1 project assistant whom planning and executing Land Based projects around the world.
Page 25 of 157
AKVA group Consolidated Financial Statements and notes
Page 26 of 157
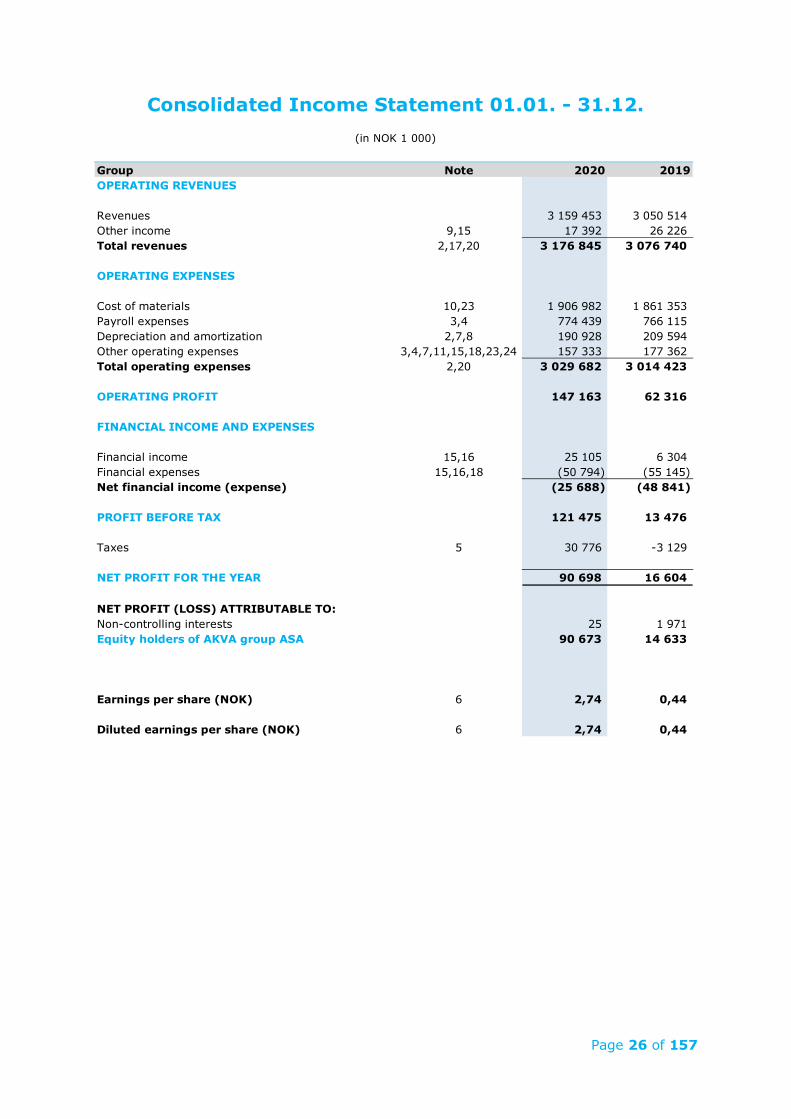
Consolidated Income Statement 01.01. - 31.12. (in NOK 1 000)
Group Note 2020 2019OPERATING REVENUES
Revenues 3 159 453 3 050 514 Other income 9,15 17 392 26 226 Total revenues 2,17,20 3 176 845 3 076 740
OPERATING EXPENSES
Cost of materials 10,23 1 906 982 1 861 353 Payroll expenses 3,4 774 439 766 115 Depreciation and amortization 2,7,8 190 928 209 594 Other operating expenses 3,4,7,11,15,18,23,24 157 333 177 362 Total operating expenses 2,20 3 029 682 3 014 423
OPERATING PROFIT 147 163 62 316
FINANCIAL INCOME AND EXPENSES
Financial income 15,16 25 105 6 304 Financial expenses 15,16,18 (50 794) (55 145) Net financial income (expense) (25 688) (48 841)
PROFIT BEFORE TAX 121 475 13 476
Taxes 5 30 776 -3 129
NET PROFIT FOR THE YEAR 90 698 16 604
NET PROFIT (LOSS) ATTRIBUTABLE TO:Non-controlling interests 25 1 971 Equity holders of AKVA group ASA 90 673 14 633
Earnings per share (NOK) 6 2,74 0,44
Diluted earnings per share (NOK) 6 2,74 0,44
Page 27 of 157
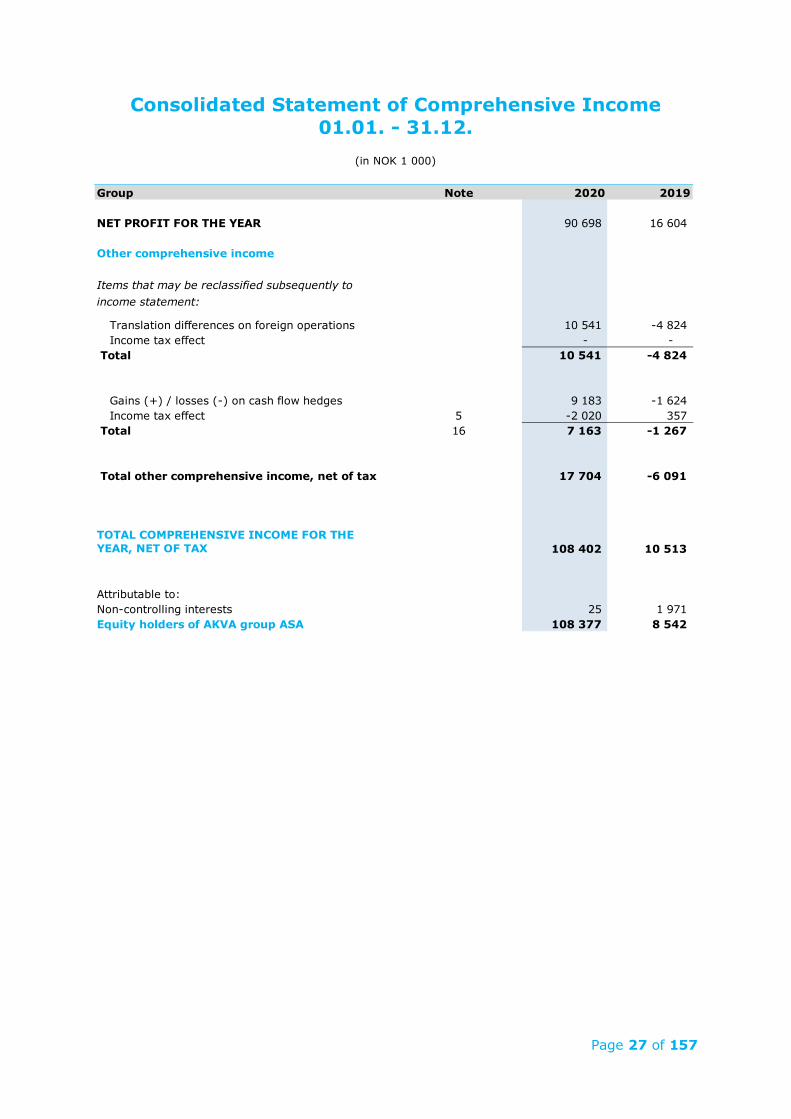
Consolidated Statement of Comprehensive Income 01.01. - 31.12.
(in NOK 1 000)
Group Note 2020 2019
NET PROFIT FOR THE YEAR 90 698 16 604
Other comprehensive income
Items that may be reclassified subsequently to income statement:
Translation differences on foreign operations 10 541 -4 824 Income tax effect - -
Total 10 541 -4 824
Gains (+) / losses (-) on cash flow hedges 9 183 -1 624 Income tax effect 5 -2 020 357
Total 16 7 163 -1 267
Total other comprehensive income, net of tax 17 704 -6 091
TOTAL COMPREHENSIVE INCOME FOR THE YEAR, NET OF TAX 108 402 10 513
Attributable to:Non-controlling interests 25 1 971 Equity holders of AKVA group ASA 108 377 8 542
Page 28 of 157
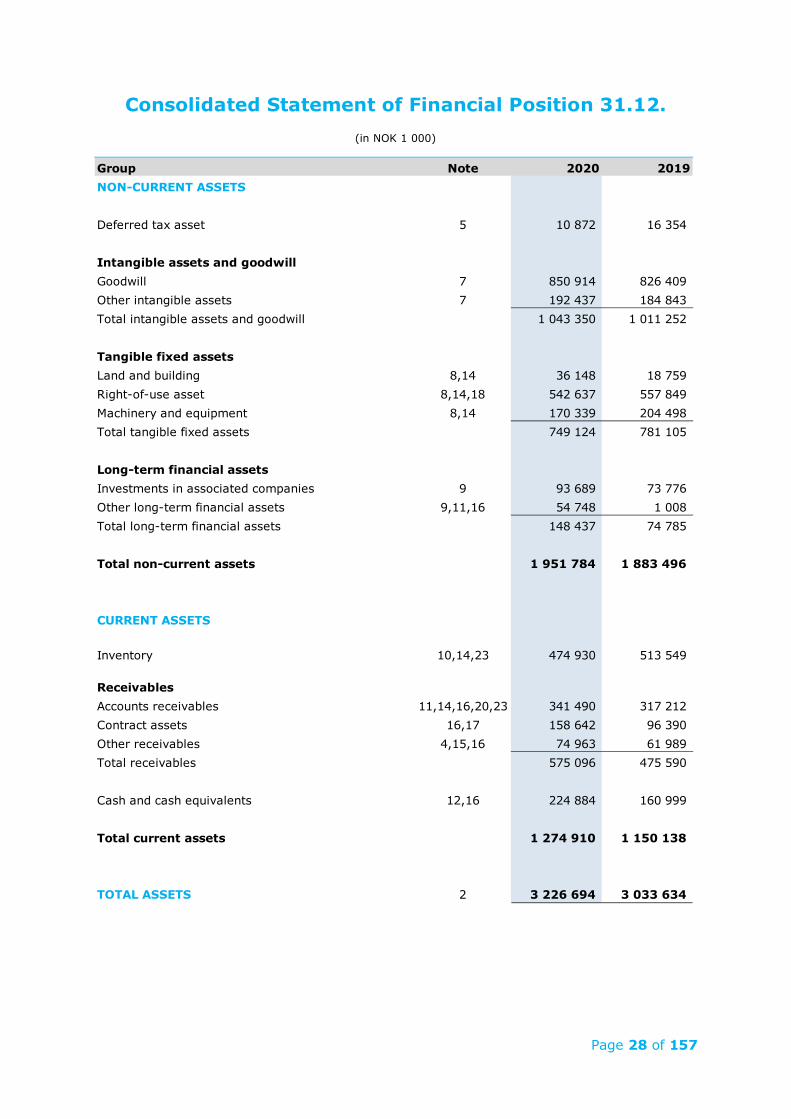
Consolidated Statement of Financial Position 31.12. (in NOK 1 000)
Group Note 2020 2019NON-CURRENT ASSETS
Deferred tax asset 5 10 872 16 354
Intangible assets and goodwillGoodwill 7 850 914 826 409 Other intangible assets 7 192 437 184 843 Total intangible assets and goodwill 1 043 350 1 011 252
Tangible fixed assetsLand and building 8,14 36 148 18 759 Right-of-use asset 8,14,18 542 637 557 849 Machinery and equipment 8,14 170 339 204 498 Total tangible fixed assets 749 124 781 105
Long-term financial assetsInvestments in associated companies 9 93 689 73 776 Other long-term financial assets 9,11,16 54 748 1 008 Total long-term financial assets 148 437 74 785
Total non-current assets 1 951 784 1 883 496
CURRENT ASSETS
Inventory 10,14,23 474 930 513 549
Receivables Accounts receivables 11,14,16,20,23 341 490 317 212 Contract assets 16,17 158 642 96 390 Other receivables 4,15,16 74 963 61 989 Total receivables 575 096 475 590
Cash and cash equivalents 12,16 224 884 160 999
Total current assets 1 274 910 1 150 138
TOTAL ASSETS 2 3 226 694 3 033 634
Page 29 of 157
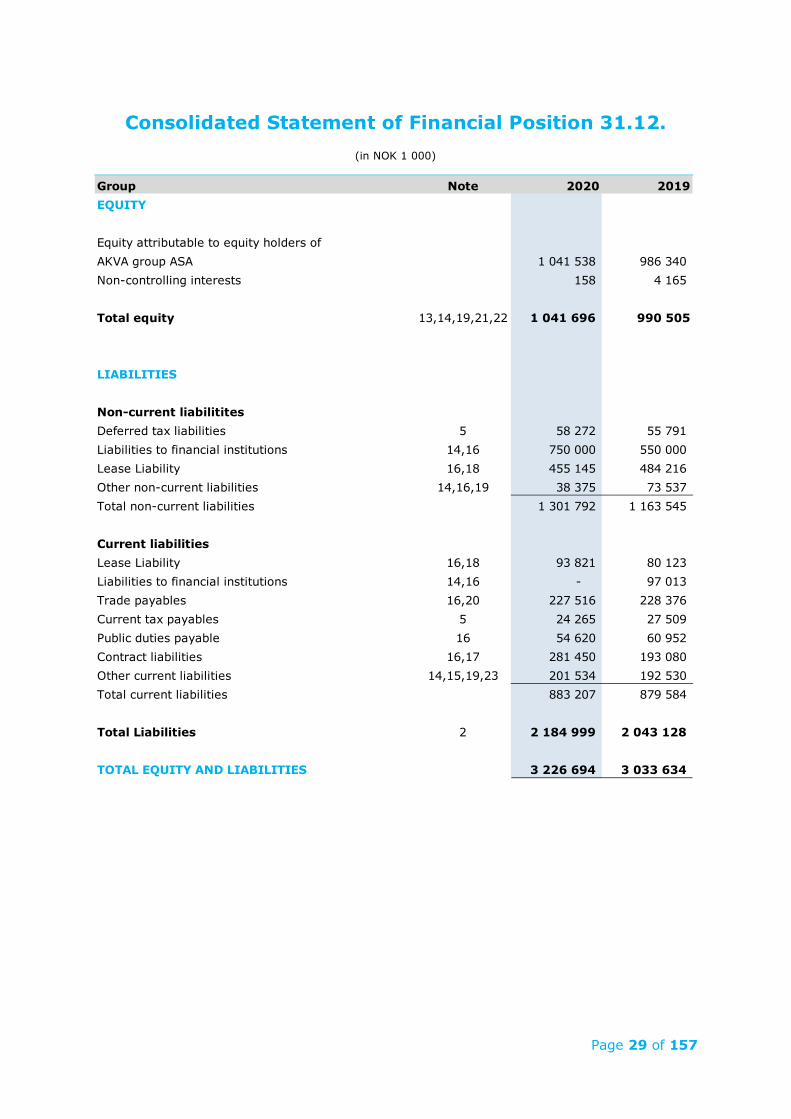
Consolidated Statement of Financial Position 31.12.
(in NOK 1 000)
Group Note 2020 2019EQUITY
Equity attributable to equity holders of AKVA group ASA 1 041 538 986 340 Non-controlling interests 158 4 165
Total equity 13,14,19,21,22 1 041 696 990 505
LIABILITIES
Non-current liabilititesDeferred tax liabilities 5 58 272 55 791 Liabilities to financial institutions 14,16 750 000 550 000 Lease Liability 16,18 455 145 484 216 Other non-current liabilities 14,16,19 38 375 73 537 Total non-current liabilities 1 301 792 1 163 545
Current liabilitiesLease Liability 16,18 93 821 80 123 Liabilities to financial institutions 14,16 - 97 013 Trade payables 16,20 227 516 228 376 Current tax payables 5 24 265 27 509 Public duties payable 16 54 620 60 952 Contract liabilities 16,17 281 450 193 080 Other current liabilities 14,15,19,23 201 534 192 530 Total current liabilities 883 207 879 584
Total Liabilities 2 2 184 999 2 043 128
TOTAL EQUITY AND LIABILITIES 3 226 694 3 033 634
Page 30 of 157
Klepp, Norway, 14 April 2021
Page 31 of 157
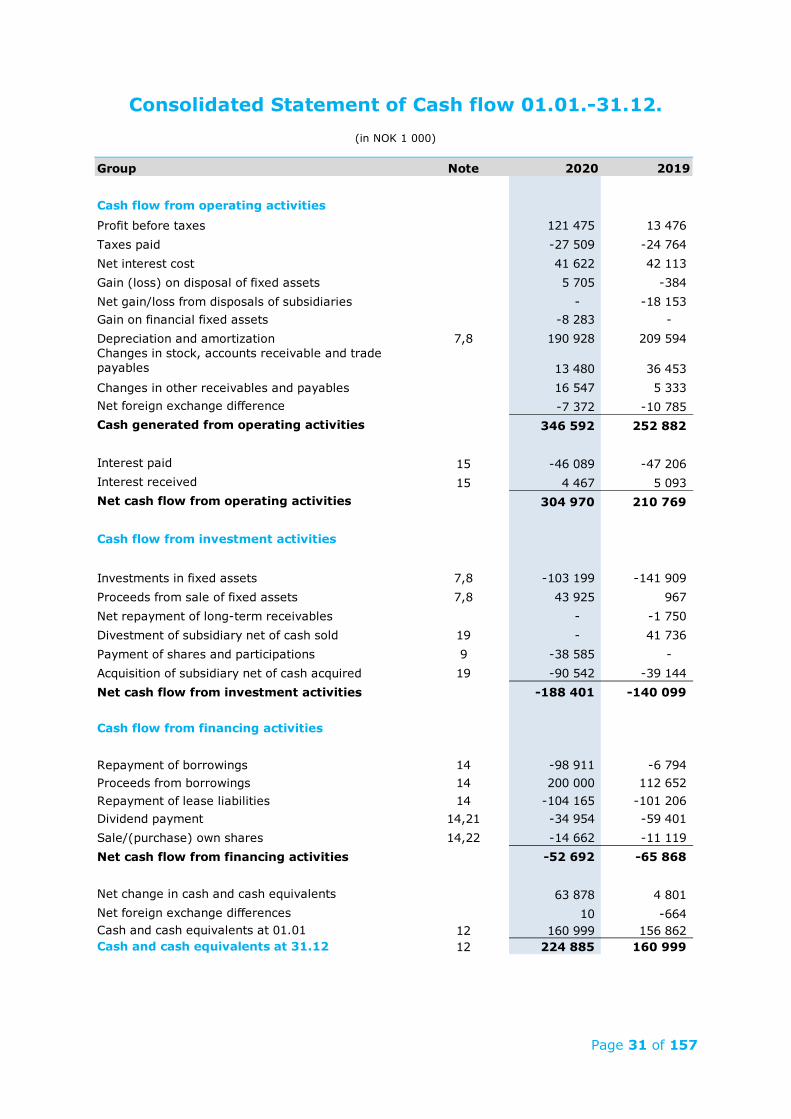
Consolidated Statement of Cash flow 01.01.-31.12. (in NOK 1 000)
Group Note 2020 2019
Cash flow from operating activitiesProfit before taxes 121 475 13 476 Taxes paid -27 509 -24 764 Net interest cost 41 622 42 113 Gain (loss) on disposal of fixed assets 5 705 -384 Net gain/loss from disposals of subsidiaries - -18 153 Gain on financial fixed assets -8 283 - Depreciation and amortization 7,8 190 928 209 594 Changes in stock, accounts receivable and trade payables 13 480 36 453 Changes in other receivables and payables 16 547 5 333 Net foreign exchange difference -7 372 -10 785 Cash generated from operating activities 346 592 252 882
Interest paid 15 -46 089 -47 206 Interest received 15 4 467 5 093 Net cash flow from operating activities 304 970 210 769
Cash flow from investment activities
Investments in fixed assets 7,8 -103 199 -141 909 Proceeds from sale of fixed assets 7,8 43 925 967 Net repayment of long-term receivables - -1 750 Divestment of subsidiary net of cash sold 19 - 41 736 Payment of shares and participations 9 -38 585 - Acquisition of subsidiary net of cash acquired 19 -90 542 -39 144 Net cash flow from investment activities -188 401 -140 099
Cash flow from financing activities
Repayment of borrowings 14 -98 911 -6 794 Proceeds from borrowings 14 200 000 112 652 Repayment of lease liabilities 14 -104 165 -101 206 Dividend payment 14,21 -34 954 -59 401 Sale/(purchase) own shares 14,22 -14 662 -11 119 Net cash flow from financing activities -52 692 -65 868
Net change in cash and cash equivalents 63 878 4 801 Net foreign exchange differences 10 -664 Cash and cash equivalents at 01.01 12 160 999 156 862 Cash and cash equivalents at 31.12 12 224 885 160 999
Page 32 of 157
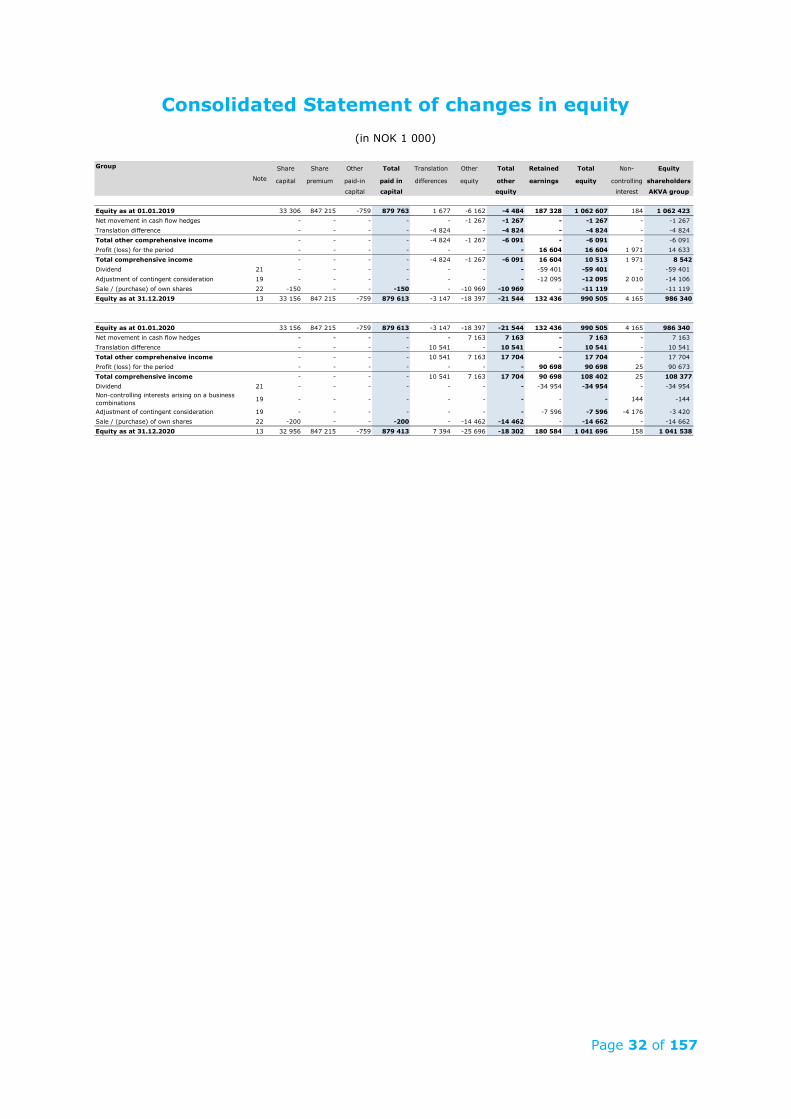
Consolidated Statement of changes in equity (in NOK 1 000)
Group Share Share Other Total Translation Other Total Retained Total Non- EquityNote capital premium paid-in paid in differences equity other earnings equity controlling shareholders
capital capital equity interest AKVA group
Equity as at 01.01.2019 33 306 847 215 -759 879 763 1 677 -6 162 -4 484 187 328 1 062 607 184 1 062 423 Net movement in cash flow hedges - - - - - -1 267 -1 267 - -1 267 - -1 267 Translation difference - - - - -4 824 - -4 824 - -4 824 - -4 824 Total other comprehensive income - - - - -4 824 -1 267 -6 091 - -6 091 - -6 091 Profit (loss) for the period - - - - - - - 16 604 16 604 1 971 14 633 Total comprehensive income - - - - -4 824 -1 267 -6 091 16 604 10 513 1 971 8 542 Dividend 21 - - - - - - - -59 401 -59 401 - -59 401 Adjustment of contingent consideration 19 - - - - - - - -12 095 -12 095 2 010 -14 106 Sale / (purchase) of own shares 22 -150 - - -150 - -10 969 -10 969 - -11 119 - -11 119 Equity as at 31.12.2019 13 33 156 847 215 -759 879 613 -3 147 -18 397 -21 544 132 436 990 505 4 165 986 340
Equity as at 01.01.2020 33 156 847 215 -759 879 613 -3 147 -18 397 -21 544 132 436 990 505 4 165 986 340 Net movement in cash flow hedges - - - - - 7 163 7 163 - 7 163 - 7 163 Translation difference - - - - 10 541 - 10 541 - 10 541 - 10 541 Total other comprehensive income - - - - 10 541 7 163 17 704 - 17 704 - 17 704 Profit (loss) for the period - - - - - - - 90 698 90 698 25 90 673 Total comprehensive income - - - - 10 541 7 163 17 704 90 698 108 402 25 108 377 Dividend 21 - - - - - - - -34 954 -34 954 - -34 954 Non-controlling interests arising on a business combinations 19 - - - - - - - - - 144 -144
Adjustment of contingent consideration 19 - - - - - - - -7 596 -7 596 -4 176 -3 420 Sale / (purchase) of own shares 22 -200 - - -200 - -14 462 -14 462 - -14 662 - -14 662 Equity as at 31.12.2020 13 32 956 847 215 -759 879 413 7 394 -25 696 -18 302 180 584 1 041 696 158 1 041 538
Page 33 of 157
Notes to the Consolidated Financial Statements – AKVA group
Contents 01 Summary of significant accounting policies 02 Segment information 03 Wages, remunerations, and pensions 04 Government grants and subsidies 05 Taxes 06 Earnings per share 07 Intangible assets 08 Tangible fixed assets 09 Subsidiaries and other long-term investments 10 Inventory 11 Receivables 12 Cash and cash equivalents 13 Shareholders 14 Loans and borrowings 15 Specification of items that are grouped in the financial statement 16 Financial instruments and risk management 17 Long-term construction contracts 18 Leasing 19 Business combinations 20 Related parties 21 Dividend 22 Sale and buyback of own shares 23 Provisions 24 Subsequent events
Page 34 of 157
Note 1 Reporting entity AKVA group ASA is a public limited liability company registered in Norway. The company is subject to the provisions of the Norwegian Act relating to Public Limited Liability Companies. The company's registered office is at Svanavågveien 30, N-4374 Eigersund, Norway. The Group is primarily involved in delivery of technology and services to the fish farming industry. These consolidated Financial Statements have been approved for issuance by the board of directors on 14 April and is subject for approval by the Annual General Meeting on 6 May 2021. Basis of accounting The consolidated financial statements of the AKVA group have been prepared in accordance with the international accounting standards published by the International Accounting Standards Board and the International Financial Reporting Standards (IFRS) as adopted by the European Union (EU) as per 31 December 2020. The consolidated financial statements have been prepared on a historical cost basis, except for derivatives and contingent considerations measured at fair value, and financial liabilities recognized due to anticipated acquisitions at the present value of the expected redemption amount. All amounts have been rounded to the nearest thousand unless otherwise stated. As a result of rounding adjustments, the figures in one or more rows or columns included in the financial statements and notes may not add up to the total of that row or column. COVID-19 The outbreak of the COVID-19 pandemic, and the measures adopted by the governments in the countries where the Group operates to mitigate its spread, have impacted the Group. The main influence on the Group related to COVID-19 is that the global mobility restrictions have led to an increase in project costs and consequently lower project margins than the Group would have achieved in a normal year. This has negatively impacted the Group’s financial performance during the year. However, the Group do not find itself materially affected by COVID-19, set aside from the restrictions mentioned above. There is still uncertainty over how the future development of the outbreak will impact the Group’s business and customer demand for its products. The impact is monitored continuously by the Group, and Management have identified the following focus areas to mitigate the effects:
- maintain and optimize the Group’s liquidity; - maintain the security of supply; and - ensure work for all our employees through a steady order intake
Based on these factors, management has assessed that there is no going concern risk related to COVID-19 at the time of publication of the financial statements. Fair value measurement “Fair value” is the price that would be received to sell an asset or paid to transfer a liability in an orderly transaction between market participants at the measurement date. Several of the Group’s accounting policies and disclosures require the measurement of fair values, for both financial and non-financial assets and liabilities. When one is available, the Group measures the fair value of an instrument using the quoted price in an active market for that instrument. If there is no quoted price in an active market, then the Group uses valuation techniques that maximise the use of relevant observable
Page 35 of 157
inputs and minimise the use of unobservable inputs. The chosen valuation technique incorporates all the factors that market participants would consider in pricing a transaction. Fair values are categorized into different levels in a fair value hierarchy based on the inputs used in the valuation techniques as follows:
• Level 1: quoted prices (unadjusted) in active markets for identical assets or liabilities
• Level 2: inputs other than quoted prices included in Level 1 that are observable for the asset or liability, either directly or indirectly
• Level 3: inputs for the asset or liability that are not based on observable market data
Further information about the assumptions made in measuring fair values is included in the following notes:
• Note 3 – Wages, remunerations, and pensions • Note 9 – Subsidiaries and other long-term investments • Note 16 – Financial instruments and risk management • Note 19 – Business combinations
Functional and presentation currency The Group presents its financial statements in NOK. This is also the parent company's functional currency. For consolidation purposes, the statements of financial position of subsidiaries with a different functional currency are translated at the rate applicable at the end of the reporting period, and the income statements have been translated at monthly average rates. Translation differences are recognized in other comprehensive income. When foreign subsidiaries are sold, the accumulated translation differences relating to the subsidiary are recognized as agio gain or loss in the statement of profit or loss. Changes in significant accounting policies The Group has initially adopted Definition of a Business (Amendments to IFRS 3) and Interest Rate Benchmark Reform (Amendments to IFRS 9, IAS 39 and IFRS 7) from 1 January 2020. None of these adoptions have a material effect on the Group’s financial statements. Use of judgements and estimates when preparing the annual financial statements In preparing these consolidated financial statements, management has made judgements and estimates that affect the application of the Group’s accounting policies and the reported amounts of assets, liabilities, income, and expense. Actual results may differ from these estimates. Estimates and underlying assumptions are reviewed on an ongoing basis. Revisions to accounting estimates are recognized in the period in which the estimate is revised and in any future periods affected. Judgements Information about judgements made in applying accounting policies that have the most significant effects on the amounts recognized in the financial statements is included in the following notes:
• Note 17 – revenue recognition: whether revenue is recognized over time or at a point in time
• Note 9 – equity-accounted investees: whether the Group has significant influence over an investee based on relevant facts and circumstances
Page 36 of 157
Estimates and assumption uncertainties Information about estimates and assumption uncertainties on 31 December 2020 that have the most significant effect on the amounts recognized in the financial statement, is given in the following notes:
• Note 5 – recognition of deferred tax assets: availability of future taxable profit against which deductible temporary differences and tax losses carried forward can be utilised
• Note 7 – impairment test of non-financial assets: key assumptions underlying recoverable amounts, including the recoverability of development costs
• Note 11 – measurement of expected credit losses allowance for trade receivables and contract assets: key assumptions in determining the average loss rate
• Note 19 – business combinations: fair value of the consideration transferred (including contingent consideration) and fair value of the assets acquired, and liabilities assumed, measured on a provisional basis
Significant accounting policies The Group has consistently applied the following accounting policies to all periods presented in these consolidated financial statements, unless otherwise disclosed. Subsidiaries The consolidated financial statements incorporate AKVA group ASA and companies that AKVA group ASA (directly or indirectly) control (the Group). Control is achieved when the Group is exposed or has right to variable returns from its involvement with a company in which it has invested and has the ability to use its power to affect its returns from this company. The financial statements of subsidiaries are included in the consolidated financial statements from the date on which control commences until the date on which control ceases. Non-controlling Interests (NCI) NCI in subsidiaries is measured initially at their proportionate share of the acquiree’s identifiable net assets at the date of acquisition and presented within equity separately from the equity attributable to the owners of the parent. Changes in the Group’s interest in a subsidiary that do not result in a loss of control are accounted for as equity transactions. Loss of control When the Group loses control over a subsidiary, it derecognizes the assets and liabilities of the subsidiary and any related NCI and other components of equity. Any resulting gain or loss is recognized in profit or loss. Any interest retained in the former subsidiary is measured at fair value when control is lost. Interests in equity-accounted investees The Group’s interests in equity-accounted investees comprise interests in associates. Investments in associates are those entities that the Group exercises a significant influence, but not control or joint control, over the financial and operating policies (normally investments of between 20% and 50% of the companies’ equity). These investments are accounted for using the equity method. They are initially recognized at cost, which includes transaction costs. After initial recognition, the consolidated financial statements include the Group’s share of the profit or loss and OCI of equity-accounted investees, until the date on which significant influence or joint control ceases. When the Group’s share of the loss exceeds the investment in associates, the investment, and any long-term interests that in substance is a part of the net investment is carried at zero value. If the Group’s share of the loss exceeds the investment, this will be recognized to the extent that the Group has obligations to cover this loss.
Page 37 of 157
Eliminations in consolidated accounts Inter-company transactions and balances, including internal profits and unrealized gains and losses are eliminated in full. Unrealized gains that have arisen due to transactions with associates are eliminated against the Group’s share in the associate. Unrealized losses are correspondingly eliminated, but only to the extent that there are no indications of a decline in the value of the asset that has been sold internally. Business Combinations The Group accounts for business combinations using the acquisition method when the acquired set of activities and assets meets the definition of a business and control is transferred to the Group. In determining whether a particular set of activities and assets is a business, the Group assesses whether the set of assets and activities acquired includes, at a minimum, an input and substantive process and whether the acquired set has the ability to produce outputs. The Group has an option to apply a “concentration test” that permits a simplified assessment of whether an acquired set of activities and assets is not a business. The optional concentration test is met if substantially all of the fair value of the gross assets acquired is concentrated in a single identifiable asset or group of similar identifiable assets. The acquirer’s identifiable assets, liabilities and contingent liabilities that meet the conditions for recognition are recognized at their fair values at the acquisition date. Goodwill arising on acquisition is recognized as an asset measured at the excess of the sum of the consideration transferred, the fair value of any previously held equity interests and the amount of any non-controlling interests in the acquire over the net amounts of the identifiable assets acquired and the liabilities assumed. If, after reassessment, the Group’s interest in the net fair value of the acquirer’s identifiable assets, liabilities and contingent liabilities exceeds the total consideration of the business combination, the excess is recognized in the income statement immediately. Any contingent consideration to be transferred by the acquirer will be recognized at fair value at the acquisition date. Subsequent changes to the fair value of the contingent consideration which is deemed to be an asset or liability will be recognized in the income statement as financial income or expense. If the contingent consideration is classified as equity, it should not be re-measured until it is finally settled within equity. The Group has in some business combinations entered into put and call options for the remaining non-controlling interests (NCI). The group accounts for such agreements using "the anticipated-acquisition method". Under this method, the interest subject to the option is deemed to have been acquired at the date of acquisition. Accordingly, the financial liability arising from the option is included in the consideration transferred. Under the anticipated-acquisition method, the interests of the non-controlling shareholders that hold the options are derecognized when the financial liability is recognized. This is because the recognition of the financial liability implies that the interests subject to the options are deemed to have been acquired already. Therefore, the underlying interests are presented as already owned by the Group, both in the statement of financial position and in the statement of profit or loss and other comprehensive income. The financial liability is recognized at the present value of the expected redemption amount. Changes in the carrying amount of the liability will be recognized within equity. If the option expires unexercised, then the liability is derecognized and NCI is recognized, consistent with a decrease in ownership interests in a subsidiary while retaining control. Purchase Price Allocation arising from a business combination is finalized within twelve months of completed acquisition.
Page 38 of 157
If the business combination is achieved in stages, the fair value of the Group’s previously held equity interest in the acquiree is re-measured to fair value at the acquisition date through the income statement. Segments For management purposes, the Group is organized into three business areas according to their range of products/services. The Chief Operating Decision Maker is the Group's Chief Executive Officer who delegates responsibility to the Chief Operating Officers (COO’s) in the business area they are responsible. These business areas comprise the basis for primary segment reporting. Financial information relating to segments and geographical divisions is presented in note 2. In the segment reporting, the internal gain on sales between the various segments is eliminated. Foreign currency Foreign currency transactions Transactions in foreign currencies are initially recognized in the functional currency at the exchange rate at the date of the transaction. Monetary assets and liabilities denominated in foreign currencies are translated to the functional currency using the exchange rate at the reporting date. All exchange differences are recognized in the income statement except for exchange differences on foreign currency borrowings that provide a hedge against a net investment in a foreign entity, or monetary items that are regarded as part of the net investments. These exchange differences are recognized as a separate component of other comprehensive income until the disposal of the net investment or settlement of the monetary item, at which time they are recognized in the income statement. Tax charges and credits attributable to exchange differences on those borrowings or monetary items as part of the net investments are also recognized in other comprehensive income. Non-monetary items that are measured at historical cost in foreign currency are translated using the exchange rates at the dates of the initial transactions. Foreign operations The assets and liabilities of foreign subsidiaries, including goodwill and fair value adjustments included in the consolidation are translated into NOK at the exchange rates at the balance sheet date. The income and expenses of foreign operations are translated into NOK using the monthly average exchange rate. Foreign currency differences are recognized in other comprehensive income and accumulated in the translation reserve. The Group uses the mid-rate on the balance sheet date listed by Norges Bank, the Central Bank of Norway, when translating foreign currencies into NOK. Norges Bank does not quote the exchange rate between NOK and CLP. This exchange rate is calculated based on the quoted rates of NOK per USD and CLP per USD by Norges Bank and the Central Bank of Chile, respectively. Revenue recognition Revenues are recognized either at the point of transfer of control of goods and services or recognized over time on an activity basis. Contracts are reviewed to identify each performance obligation relating to a distinct good or service and the associated consideration. The Group allocates revenue to multiple element arrangements based on the identified performance obligations within the contracts in line with the policies below. A performance obligation is identified if the customer can benefit from the good or service on its own or together with other readily available resources, and it can be separately identified within the contract. This review is performed by reference to the specific contract terms.
Page 39 of 157
Construction contracts This revenue stream accounts for the majority of Group sales. Contracts related to construction of barges, cages and boats withing the cage based segment, together with contracts for construction of equipment within the land based segment, operates almost exclusively on this basis. Where multiple performance obligations are identified, revenue is recognised as each performance obligation is met. This requires an assessment of total revenue to identify the allocation across the performance obligations, based on the standalone selling price for each obligation. AKVA group recognizes revenue over time if one of the following criteria is met:
• The customer simultaneously receives and consumes all of the benefits provided by entity as the entity performs;
• The entity’s performance creates or enhances an asset the customer controls as the asset is created; or
• The entity’s performance does not create an asset with an alternative use to the entity and the entity has an enforceable right to payment for performance completed to date.
There are two methods used by AKVA group to measure progress of a project recognized over time, either the input or the output method. Input method The input method measures performance based on efforts or inputs towards satisfying the performance obligation relative to the total expected inputs. Such inputs are for example resources consumed, cost incurred, time elapsed, labour hour expended, and machine hours used. The input method is done by the basis of AKVA group’s efforts/inputs to the satisfaction of a performance obligation relative to the total expected inputs to the satisfaction of that performance obligation. The input method is used for all construction contracts that is not accounted for by the output method, refer the next section. Output method The output method measures performance based on the value created relative to the total value of the contract/delivery. The control of the good is gradually transferred to the customer, and for construction contracts AKVA group uses milestones for guiding purposes. The output method is applied for three specific standard customer contracts within the cage based segment; barges, plastic cages and Polarcirkel boats. To measure the output, AKVA uses methods such as surveys of performance completed to date, appraisals of results achieved, and milestones reached. The usage of milestones reached are not used to determine if goods or services is transferred at a discrete point in time, but more as a guideline ("rule of thumb") for evaluation the stage of completion of a project. As long as the progress can be reliably measured, AKVA believes that the abovementioned output methods are considered to be the best way of reflecting satisfaction of performance obligations. As a result of contracts that meet the requirements for revenue recognition over time, AKVA group will have associated contract assets and contract liabilities on the balance sheet. The contract assets primarily relate to the Group’s rights to consideration for work completed but not billed at the reporting date. The contract liabilities primarily relate to the advance consideration received from customers for work performed after the reporting date.
Page 40 of 157
Service, spare parts and software Invoices for goods are raised and revenue is recognised when control of the goods is transferred to the customer. Dependent upon contractual terms this may be at the point of despatch, acceptance by the customer or certification by the customer. The revenue recognised is the transaction price as it is the observable selling price. For service contracts the benefit is considered to be consumed simultaneously by the customer as it is received from AKVA. Therefore, the service contracts are recognized over a straight line for the period the service is performed. Cash discounts, volume rebates and other customer incentive programmes are allocated to performance obligations and recorded as a reduction in revenue at the point of sale based on the estimated future outcome. Variable considerations, such as penalties or prices that depend on uncertain future outcomes, are estimated upfront and considered in the calculation of transaction price by using either the expected value approach or the most likely amount. Before it may be concluded that any amount of variable consideration can be included in the transaction price, AKVA group considers whether the amount of variable consideration is constrained. This means that variable consideration estimated can only be included in the transaction price to the extent that it is highly probable that a significant reversal in the amount of revenue recognized will not occur when the uncertainty associated with the variable consideration is subsequently resolved. Employee benefits Defined contribution plan All Group companies have pension schemes based on contributions from the company to the employees. The companies’ payments are recognized in the income statements for the year to which the contribution applies. The companies have no further commitments towards pensions when the agreed contributions are paid. Severance pays In some countries, the companies are obliged by law to provide severance pay for redundancies due to reductions in the workforce. The costs relating to severance pay are set aside once the management have decided on a plan that will lead to reductions in the workforce and the work of restructuring has started or the reduction in the workforce has been communicated to the employees. Share options The fair value of the share options is measured at the grant date and the cost is recognized in the income statement, together with a corresponding increase in other paid-in capital, over the period in which the performance and/or service conditions are fulfilled. The fair value is calculated using a Black & Scholes model. Finance income and finance costs The Group’s finance income and finance costs include:
• Interest income • Interest expense • The foreign currency gain or loss on financial assets and financial liabilities • Hedge ineffectiveness recognized in profit or loss
Interest income or expense is recognized using the effective interest method. Income tax Income tax comprises current and deferred tax. It is recognized in profit or loss except to the extent that it relates to items recognized directly in equity or in other comprehensive income.
Page 41 of 157
Current tax Current tax comprises the expected tax payable or receivable on the taxable income or loss for the year and any adjustments to the tax payable or receivable in respect of previous years. The amount of current tax payable or receivable is the best estimate of the tax amount expected to be paid or received that reflects uncertainty related to income tax, if any. It is measured using tax rates enacted or substantively enacted at the reporting date. Current tax also includes any tax arising on dividends. Deferred tax Deferred tax is recognized in respect of temporary differences between the carrying amounts of assets and liabilities for financial reporting purposes and the amounts used for taxation purposes. Deferred tax is calculated on all taxable temporary differences, except for:
• Temporary differences relating to investments in subsidiaries, associates, or joint ventures when the Group decides when the temporary differences are to be reversed and this is not expected to take place in the foreseeable future
• Taxable temporary differences arising on the initial recognition of goodwill. Deferred tax assets are recognized in the balance sheet when it is probable that the company will have a sufficient profit for tax purposes to utilize the tax asset. At each balance sheet date, the Group carries out a review of its unrecognized deferred tax assets and the value it has recognized. The companies recognize formerly unrecognized deferred tax assets to the extent that it has become probable that the company can utilize the deferred tax asset. Similarly, the company will reduce its deferred tax assets to the extent that it can no longer utilize these. Deferred tax is measured at the tax rates that are expected to be applied to temporary differences when they reverse, using tax rates enacted or substantively enacted at the reporting date, and reflects uncertainty related to income taxes, if any. Deferred tax assets (tax liabilities) are recognized at their nominal value and classified as non-current asset (long-term liabilities) in the balance sheet. Intangible assets and goodwill Intangible assets are recognized in the balance sheet if it is probable that there are future economic benefits that can be attributed to the asset which is owned by the company, and the asset’s cost price can be reliably estimated. Intangible assets are recognized at cost price. Research & development costs Expenses relating to research are recognized in the income statement when they are incurred. Expenses relating to development are recognized in the income statement when they are incurred unless the following criterions are met in full:
• The product or process is clearly defined, and the cost elements can be identified and measured reliably
• The technical solution for the product has been demonstrated • The product or process will be sold or used in the company’s operations • The asset will generate future economic benefits • Sufficient technical, financial, and other resources for completing the project are
present. When all the above criterions are met, the associated development costs will be recognized in the balance sheet. Costs that have been charged as expenses in previous accounting periods are not recognized in the balance sheet.
Page 42 of 157
Amortization of the asset begins when development is complete, and the asset is available for use. During the period of development, the asset is tested for impairment annually. Other intangible assets Other intangible assets, including customer relationship, product rights, patents, and trademarks, that are acquired by the Group are measured at cost less accumulated amortization and any accumulated impairment losses. Goodwill Additional value on the purchase of a business that cannot be allocated to assets or liabilities on the acquisition date is classified in the balance sheet as goodwill. In the case of investments in associates, goodwill is included in the cost price of the investment. Amortization Intangible assets with a finite useful life are amortized and any need for impairment losses to be recognized is considered. Amortization is calculated using the straight-line method over the asset’s estimated useful life and is recognized in profit and loss. Intangible assets with indefinite useful lives and goodwill are not amortized, but impairment losses are recognized if the recoverable amount is less than the carrying amount. The estimated useful lives for current and comparative periods are as follows:
Development costs: 3-5 years Patents (included in other intangible assets): 20 years Trademarks (included in other intangible assets): 5 years Product rights (included in other intangible assets): 5-10 years Internal systems (included in other intangible assets): 5-10 years
Amortization methods, useful lives and residual values are reviewed at each reporting date and adjusted if appropriate. Tangible fixed assets Tangible fixed assets are carried at cost less accumulated depreciation and any accumulated impairment losses. When assets are sold or disposed of, the gross carrying amount and accumulated depreciation are derecognized, and any gain or loss on the sale or disposal is recognized in the income statement. The gross carrying amount of tangible fixed assets is the purchase price, including duties/taxes and direct acquisition costs relating to making the asset ready for use. Subsequent costs, such as repair and maintenance costs, are normally recognized in profit or loss as incurred. When future economic benefits are increased because of repair/maintenance work can be proven, such costs will be recognized in the balance sheet as additions to tangible fixed assets. If replacing an asset, the replacement will be recognized in the balance sheet and the replaced asset will be de-recognized. Depreciation Depreciation is calculated using the straight-line method over the asset’s estimated useful lives and is generally recognized in profit and loss. Leased assets are depreciated over the shorter of the lease term and their useful lives unless it is reasonably certain that the Group will obtain ownership by the end of the lease term. Land is not depreciated. The estimated useful lives for current and comparative periods are as follows:
Buildings: > 20 years Right-of-use assets: 3-15 years Machinery and equipment: 3-5 years
Page 43 of 157
Depreciation methods, useful lives and residual values are reviewed at each reporting date and adjusted appropriately. Leases The information on leases provided below relates to the Group as a lessee. The Group’s transactions as a lessor are immaterial, with recognition on a straight-line basis over the lease term. At the inception of a contract, the Group assesses whether the contract is, or contains, a lease. A contract is, or contains, a lease if the contract conveys the right to control the use of an identified asset for a period of time in exchange for consideration. Recognition of leases and exemptions At the lease commencement date, the Group recognizes a lease liability and corresponding right-of-use asset for all lease agreements in which it is the lessee, except for the following exemptions applied:
• Short-term leases (defined as 12 months or less) • Low value assets
For these leases, the Group recognizes the lease payments as other operating expenses in the statement of profit or loss when they incur. Lease liabilities The lease liability is recognized at the commencement date of the lease. The Group initially measures the lease liability at the present value of the lease payments that are not paid at the commencement date, discounted using the interest rate implicit in the lease or, if that rate cannot be readily determined, the Group’s incremental borrowing rate. Generally, the Group uses its incremental borrowing rate as the discount rate. The lease term represents the non-cancellable period of the lease, together with periods covered by an option either to extend or to terminate the lease when the Group is reasonably certain to exercise this option. The lease payments included in the measurement comprise of:
• Fixed lease payments (including in-substance fixed payments), less any lease incentives receivable
• Variable lease payments that depend on an index or a rate, initially measured using the index or rate as at the commencement date
• Payments of penalties for terminating the lease, if the lease term reflects the Group exercising an option to terminate the lease.
The lease liability is subsequently measured by increasing the carrying amount to reflect interest on the lease liability, reducing the carrying amount to reflect the lease payments made and remeasuring the carrying amount to reflect any reassessment or lease modifications, or to reflect adjustments in lease payments due to an adjustment in an index or rate. The Group does not include variable lease payments in the lease liability. Instead, the Group recognizes these variable lease expenses in profit or loss.
Page 44 of 157
Right-of-use assets The Group measures the right-of use asset at cost, less any accumulated depreciation and impairment losses, adjusted for any remeasurement of lease liabilities. The cost of the right-of-use asset comprise:
• The amount of the initial measurement of the lease liability recognized • Any lease payments made at or before the commencement date, less any
incentives received • Any initial direct costs incurred by the Group.
Right-of-use assets are depreciated on a straight-line basis over the shorter of the lease term and the estimated useful lives of the assets. The Group applies IAS 36 Impairment of Assets to determine whether the right-of-use asset should be impaired and to account for any impairment loss identified. Financial instruments On initial recognition, financial instruments are classified in one of the following categories: amortized cost, fair value through profit and loss or fair value through other comprehensive income. Financial instruments with fixed or determinable cash flows and a fixed maturity are measured at amortized cost. Financial instruments that are held with the intention of making a gain on short-term fluctuations in prices are classified as financial assets at fair value through profit or loss. Financial assets with fixed or determinable cash flows that are not quoted in an active market are classified as loans and receivables, except for instruments that the Group has designated as being at fair value with changes in value through profit or loss or available for sale. Financial instruments that are held to maturity are included in the non-current asset/liabilities unless the maturity date is less than 12 months after the balance sheet date. Financial instruments at fair value through profit or loss are classified as current assets/liabilities, and financial instruments that are available for sale are presented as current assets if the management has decided to sell the instrument within 12 months of the balance sheet date. All purchases and sales of financial instruments are recognized on the transaction date. The transaction costs are included in the cost price, but not for financial instruments that are measured at fair value. Changes in the fair value of financial instruments classified as financial instruments at fair value through profit or loss are recognized in the income statement and included in the net financial income (expenses). Fair value of financial instruments The best evidence of the fair value of a financial instrument on initial recognition is normally the transaction price – i.e., the fair value of the consideration given or received. Hedging As part of the international activity the Group's assets and liabilities as well as expected cash inflows and cash outflows are exposed to changes in the currency rates. Such risk is sought reduced by using currency forward contracts. The currency risk is managed by the parent company in cooperation with the subsidiaries.
Page 45 of 157
Before a hedging transaction is carried out, the Group’s finance department assesses whether a derivative is to be used to a) hedge the fair value of an asset or liability, b) hedge a future cash flow from an investment, debt payment or future identified transaction or c) hedge a net investment in a foreign operation. The Group’s criteria for classifying a derivative as a hedging instrument are as follows: (1) the hedge is expected to be effective in that it counteracts changes in the fair value of or cash flows from an identified asset - a hedging efficiency within the range of 80-125% is expected, (2) the effectiveness of the hedge can be reliably measured, (3) there is adequate documentation when the hedge is entered into that the hedge is effective, (4) for cash-flow hedges, the forthcoming transaction must be probable, and (5) the hedge is evaluated regularly and has proven to be effective. Fair value hedges Derivatives designated as hedging instruments are measured at their fair value and changes in the fair value are recognized in the income statement as they arise. Correspondingly, a change in the fair value of the hedged object which is due to the risk that the object is hedged against is recognized in the income statement. The hedge accounting is discontinued if: i) the hedging instrument expires or is terminated, exercised, or sold, or ii) the hedge does not meet the abovementioned hedge requirements, or iii) the Group chooses to discontinue hedge accounting for other reasons If the hedge assessment is terminated, the changes which have been made in the carrying amount of the hedged object are amortized over the remaining economic life using the effective interest rate method if the hedging instrument is a financial instrument that has been recognized according to the effective interest rate method. Cash-flow hedges The hedge is done on 1:1 relationship between the hedged item and the hedging instrument. Changes in the fair value of a hedging instrument that meet the criteria for cash flow hedge accounting are recognized as gains or losses in other comprehensive income. The ineffective part of the hedging instrument is recognized directly in the income statement. In these hedge relationships, the main source for ineffectiveness is changes in timing of the hedged transaction. If the hedge of a cash flow results in an asset or liability being recognized, all former gains and losses recognized directly in other comprehensive income are transferred from other comprehensive income and included in the initial measurement of the asset or liability. For other cash-flow hedges, gains and losses recognized directly in other comprehensive income are reclassified to the income statement in the same period as the cash flow which comprises the hedged object is recognized in the income statement. If the hedge no longer meets the criteria for hedge accounting, the hedge accounting is discontinued. The cumulative gain or loss on the hedging instrument recognized directly in other comprehensive income remains separately recognized in other comprehensive income until the forecast transaction occurs. If the hedged transaction is no longer expected to occur, any previously accumulated gain or loss on the hedging instrument that has been recognized directly in other comprehensive income will be recognized in profit or loss. See note 16 for further information.
Page 46 of 157
Loans and borrowings Loans/borrowings are recognized at fair value, net of transaction costs. The loans/borrowings are thereafter recognized at amortized costs using the effective interest rate method, with the difference between the net amount paid out/received and the redemption value being recognized in the income statement over the term of the loan/borrowing. Loan interest income/borrowing costs are recognized in the income statement when they arise. Borrowing costs are capitalized to the extent that they are directly related to the purchase, construction, or production of a qualifying asset. Borrowing costs are capitalized when the interest costs are incurred during the non-current asset's construction period. The borrowing costs are capitalized until the date when the non-current asset is ready for use. If the cost price exceeds the non-current asset's fair value, an impairment loss is recognized. Intragroup loans defined as part of the net investment in a subsidiary is denominated in the functional currency of the foreign operation. An exchange difference arising on a net investment is recognized in other comprehensive income and accumulated in a separate component of equity until the disposal of the foreign operation. Inventories Inventories, including work in progress, are measured at the lower of cost and net realizable value. The cost of inventories is based on the first-in, first-out (FIFO) principle. Finished goods and work in progress include variable costs and fixed costs that can be allocated to goods based on normal capacity. The net realizable value is the estimated selling price in the ordinary course of business, less the estimated cost of completion and estimated costs necessary to make the sale. Obsolete inventories have been fully recognized as costs of goods sold. Trade receivables Trade receivables are carried at amortized cost, less provision for expected credit losses. Cash and cash equivalents Cash and cash equivalents in the statement of financial position includes cash in hand and at bank. Cash equivalents are short-term liquid investments that can be converted into cash within three months and to a known amount, and which contain insignificant risk elements. The cash and cash equivalent amount in the cash flow statement do not include overdraft facilities. Impairment of assets Financial instruments Financial assets which are valued at amortized cost are written down with lifetime expected credit losses. Lifetime expected credit losses are a probability-weighted estimate of credit losses. The amount of the impairment loss is recognized in the income statement. Any reversal of previous impairment losses is recognized when the expected loss change. However, an increase in the carrying amount is only recognized to the extent that it does not exceed what the amortized cost would have been if the impairment loss had not been recognized. Non-financial assets At each reporting date, the Group reviews the carrying amounts of its non-financial assets (other than inventories, contract assets and deferred tax assets) to determine whether
Page 47 of 157
there is any indication of impairment. If any such indication exists, then the asset’s recoverable amount is estimated. Goodwill, intangible assets with indefinite lives and intangible assets not yet available for use are tested annually for impairment. For impairment testing, assets are grouped together into the smallest group of assets that generates cash inflows from continuing use that are largely independent of the cash inflows of other assets (cash-generating units, CGU’s). Goodwill arising from a business combination is allocated to CGU’s that are expected to benefit from the synergies of the combination. The recoverable amount of an asset or CGU is the higher of the fair value less costs of disposal and its value in use. Value in use is based on the estimated future cash flows, discounted to their present value using a discount rate that reflects current market assessments of the time value of money and the risks specific to the asset or CGU. If an asset’s carrying amount is higher than the asset’s recoverable amount, an impairment loss will be recognized in the income statement. They are allocated first to reduce the carrying amount of any goodwill allocated to the CGU, and then to reduce the carrying amounts of the other assets in the CGU on a pro rata basis. Except for goodwill, impairment losses recognized in the income statements for previous periods are reversed when there is information that the need for the impairment loss no longer exists or is not as great as it was. The reversal is recognized in the same line item as the impairment. However, no reversal takes place if the reversal leads to the carrying amount exceeding what the carrying amount would have been if normal depreciation periods had been used. Equity Share capital Ordinary shares are classified as equity. Costs directly attributable to the issue of new shares or options, net of tax, are shown in equity as a deduction, net of tax, from the proceeds. Other equity Translation differences Translation differences arise in connection with currency differences when foreign entities are consolidated. Currency differences relating to monetary items (liabilities or receivables), which are part of a company’s net investment in foreign entities are treated as translation differences. When a foreign operation is sold, the accumulated translation differences linked to the entity are reversed and recognized in the income statement in the same period as the gain or loss on the sale is recognized. Hedge reserve The hedge reserve includes the total net change in the fair value of the cash-flow hedge until the hedged cash flow arises or is no longer expected to arise. Dividends Dividends payable to the company’s shareholders are recognized as a liability in the Group’s financial statements when the dividends are approved by the General Meeting. Provisions Provisions are recognized when, and only when, the company has a valid liability (legal or constructive) as a result of events that have taken place and it can be proven probable (more probable than not) that a financial settlement will take place as a result of this
Page 48 of 157
liability, and that the size of the amount can be measured reliably. Provisions are reviewed on each balance sheet date and their level reflects the best estimate of the liability. Provided provisions to cover the liability will be equal to fair value if the effect of time is insignificant. When the effect of time is significant, the provisions will be the present value of future payments to cover the liability. Any increase in the provisions due to time is presented as interest costs. Warranties A provision for warranties is recognized when the underlying products or services are sold, based on historical warranty data. Obsolete inventory A provision for obsolete inventory is recognized when the net realizable value is deemed to be below the carrying value. Bad debt A provision for bad debt is recognized for expected credit losses. Contingent liabilities and assets Except for in the event of a business combination, neither contingent liabilities nor contingent assets are recognized. A contingent liability is a possible obligation that arises from past events and whose existence will be confirmed only by the occurrence or non-occurrence of one or more uncertain future events not wholly within the control of the entity; or a present obligation that arises from past events but is not recognized because it is not probable that an outflow of resources embodying economic benefits will be required to settle the obligation or the amount of the obligation cannot be measured with sufficient reliability. Contingent liabilities are disclosed except for contingent liabilities where the probability of the liability having to be settled is remote. Contingent liabilities acquired upon the purchase of a business are recognized at fair value even if the liability is not probable. The assessment of probability and fair value is subject to constant review. Changes in the fair value are recognized in the income statement. Contingent assets are possible asset that arises from past events and whose existence will be confirmed only by the occurrence or non-occurrence of one or more uncertain future events not wholly within the control of the entity. Information about such contingent assets is provided if inflow of economic benefits is probable. Government grants Government grants are recognized when there is reasonable assurance that they will be received, and the Group will comply with conditions associated with the grant. Grants related to assets are presented in the balance sheet by deducting the grant when arriving at the carrying amount of the asset and recognized in the income statement over the useful life of the depreciable asset as a reduced depreciation expense. Grants that compensate the Group for expenses incurred are recognized in profit and loss on a systematic basis over the periods in which the expenses are recognized. Events after the balance sheet date Events after the balance sheet date that do not affect the company’s position at the balance sheet date, but which will affect the company’s position in the future are disclosed if significant.
Page 49 of 157
Standards issued but not yet effective A number of new standards are effective for annual periods beginning after 1 January 2020 and earlier application is permitted; however, the Group has not early adopted the new or amended standards in preparing these consolidated financial statements. The impact of not early adopting these standards has been assessed to be immaterial for the Group.
Page 50 of 157
Note 2 Segment information (in NOK 1 000) Business segments For more detailed description and information about products and services included in the business areas, please go to www.akvagroup.com. Cage Based Technology (CBT) Main products include PolarcirkelTM, WavemasterTM and AkvasmartTM hardware brands such as: Plastic cages, steel cages, feed barges, feed systems, sensor- and camera systems, underwater lights and net cleaning systems. Various degrees of cage farming projects are also delivered in main export markets. These also include nets and mooring systems from other recognized sub-suppliers. Through Helgeland Plast AS in Norway, AKVA group supplies polyethylene work boats and pipes to aquaculture and other industries. Land Based Technology (LBT) Recirculation technology forms the main part of our Land Based Aquaculture Technology, which is developing into a major trend in global aquaculture. This technology allows the re-use (recirculation) of close to 100% of the water by cleaning the water and restoring important water quality parameters, using advanced water treatment technology. Main components used include mechanical filters, UV treatment, bio filters, degasser units, oxygenation, cooling/heating systems and lifting pumps. The main reason for reporting this separately is due to the very different nature of this business compared to the other more traditional part of AKVA group’s business and products. Recirculation projects tend to be multiple times larger (in average project value) compared to other delivery projects (other AKVA group products). The sales process is substantially more complex and time consuming as it often requires extensive pre-project engineering, site evaluations and harder to get financing. The longer duration of this type of projects also means that it takes longer for the order backlog to generate corresponding revenue in the income statement. Main subsidiaries in the Group for Land Based Technology are AKVA group Denmark A/S (Denmark), AKVA group Land Based Norway AS (Norway) and AKVA group Land Based A/S (Denmark). Digital Solutions (DS) Main products include all FishtalkTM software brands such as: Production control, planning, traceability and ERP software for both the aquaculture and the fishing industry. Main markets include Norway, Iceland, Canada, Chile and UK. AKVA group is the market leader in software both to the aquaculture and fishing industries in these markets. The main offices for the software activities are in Norway (Trondheim). Intra segment transactions are immaterial, hence no reconciling items are presented in the tables below.
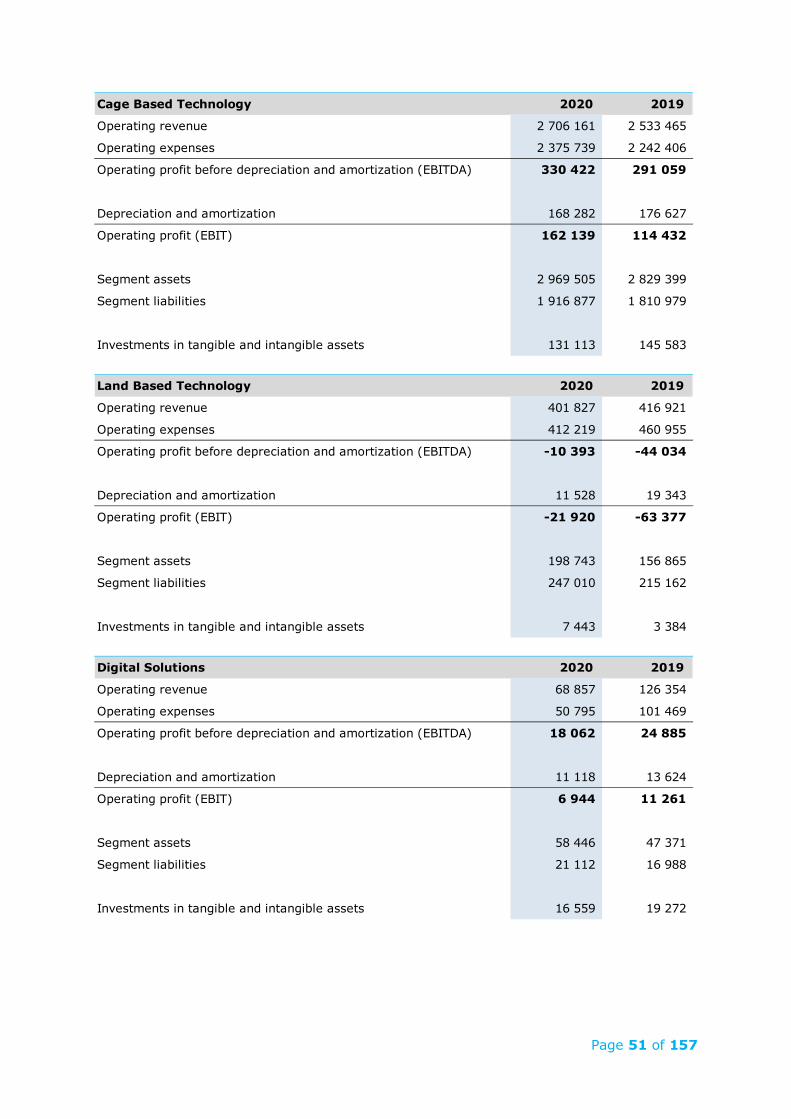
Page 51 of 157
Cage Based Technology 2020 2019
Operating revenue 2 706 161 2 533 465
Operating expenses 2 375 739 2 242 406
Operating profit before depreciation and amortization (EBITDA) 330 422 291 059
Depreciation and amortization 168 282 176 627
Operating profit (EBIT) 162 139 114 432
Segment assets 2 969 505 2 829 399
Segment liabilities 1 916 877 1 810 979
Investments in tangible and intangible assets 131 113 145 583
Land Based Technology 2020 2019
Operating revenue 401 827 416 921
Operating expenses 412 219 460 955
Operating profit before depreciation and amortization (EBITDA) -10 393 -44 034
Depreciation and amortization 11 528 19 343
Operating profit (EBIT) -21 920 -63 377
Segment assets 198 743 156 865
Segment liabilities 247 010 215 162
Investments in tangible and intangible assets 7 443 3 384
Digital Solutions 2020 2019
Operating revenue 68 857 126 354
Operating expenses 50 795 101 469
Operating profit before depreciation and amortization (EBITDA) 18 062 24 885
Depreciation and amortization 11 118 13 624
Operating profit (EBIT) 6 944 11 261
Segment assets 58 446 47 371
Segment liabilities 21 112 16 988
Investments in tangible and intangible assets 16 559 19 272
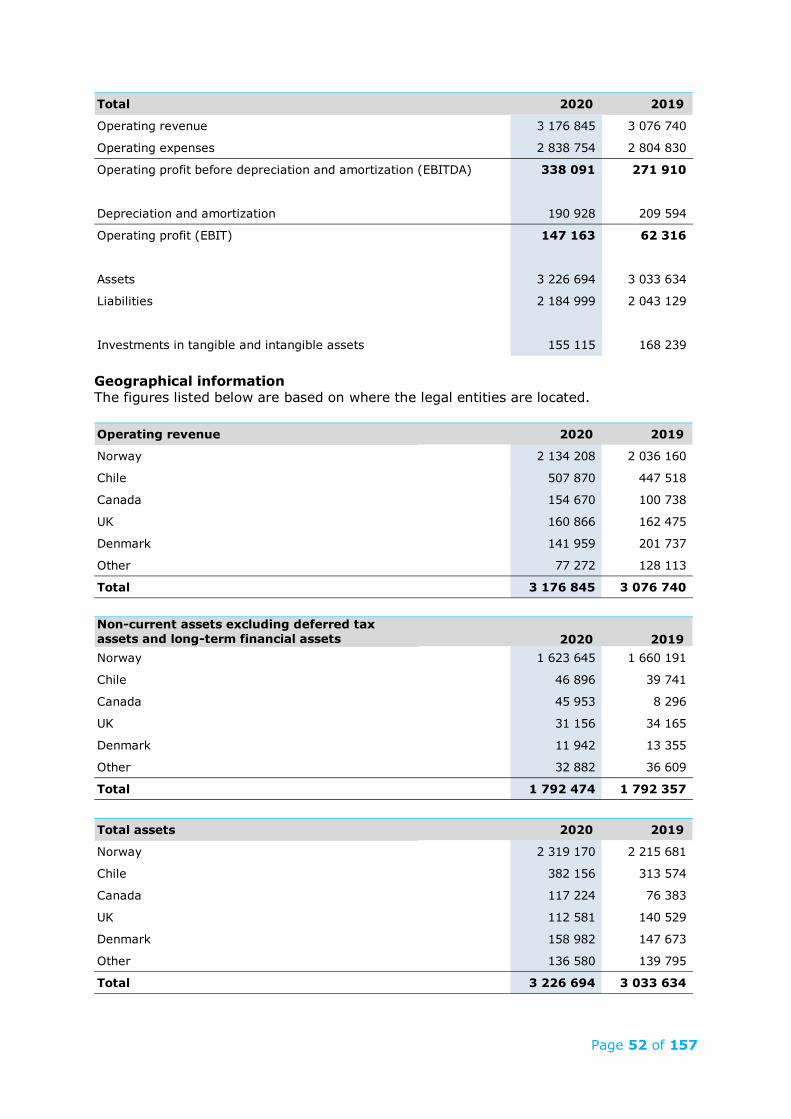
Page 52 of 157
Geographical information The figures listed below are based on where the legal entities are located.
Total 2020 2019
Operating revenue 3 176 845 3 076 740
Operating expenses 2 838 754 2 804 830
Operating profit before depreciation and amortization (EBITDA) 338 091 271 910
Depreciation and amortization 190 928 209 594
Operating profit (EBIT) 147 163 62 316
Assets 3 226 694 3 033 634
Liabilities 2 184 999 2 043 129
Investments in tangible and intangible assets 155 115 168 239
Operating revenue 2020 2019
Norway 2 134 208 2 036 160
Chile 507 870 447 518
Canada 154 670 100 738
UK 160 866 162 475
Denmark 141 959 201 737
Other 77 272 128 113
Total 3 176 845 3 076 740
Non-current assets excluding deferred tax assets and long-term financial assets 2020 2019Norway 1 623 645 1 660 191
Chile 46 896 39 741
Canada 45 953 8 296
UK 31 156 34 165
Denmark 11 942 13 355
Other 32 882 36 609
Total 1 792 474 1 792 357
Total assets 2020 2019
Norway 2 319 170 2 215 681
Chile 382 156 313 574
Canada 117 224 76 383
UK 112 581 140 529
Denmark 158 982 147 673
Other 136 580 139 795
Total 3 226 694 3 033 634
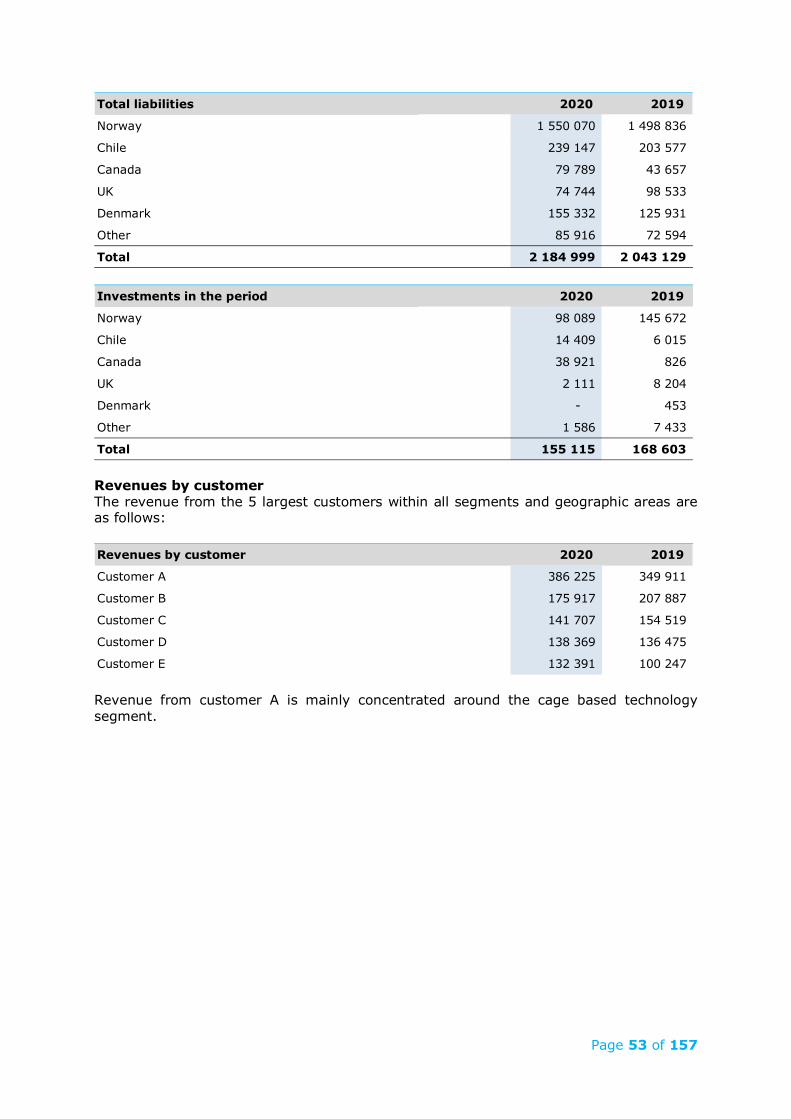
Page 53 of 157
Revenues by customer The revenue from the 5 largest customers within all segments and geographic areas are as follows:
Revenue from customer A is mainly concentrated around the cage based technology segment.
Total liabilities 2020 2019
Norway 1 550 070 1 498 836
Chile 239 147 203 577
Canada 79 789 43 657
UK 74 744 98 533
Denmark 155 332 125 931
Other 85 916 72 594
Total 2 184 999 2 043 129
Investments in the period 2020 2019
Norway 98 089 145 672
Chile 14 409 6 015
Canada 38 921 826
UK 2 111 8 204
Denmark - 453
Other 1 586 7 433
Total 155 115 168 603
Revenues by customer 2020 2019
Customer A 386 225 349 911
Customer B 175 917 207 887
Customer C 141 707 154 519
Customer D 138 369 136 475
Customer E 132 391 100 247
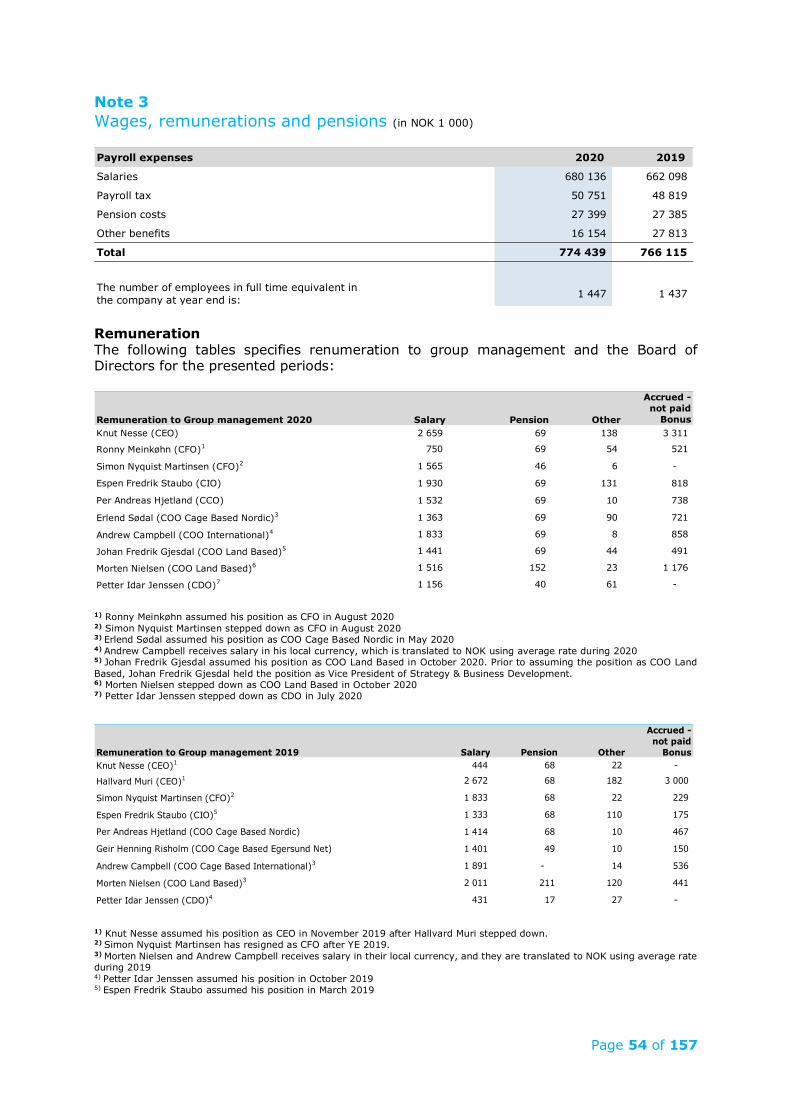
Page 54 of 157
Note 3 Wages, remunerations and pensions (in NOK 1 000)
Remuneration The following tables specifies renumeration to group management and the Board of Directors for the presented periods:
1) Ronny Meinkøhn assumed his position as CFO in August 2020 2) Simon Nyquist Martinsen stepped down as CFO in August 2020 3) Erlend Sødal assumed his position as COO Cage Based Nordic in May 2020 4) Andrew Campbell receives salary in his local currency, which is translated to NOK using average rate during 2020 5) Johan Fredrik Gjesdal assumed his position as COO Land Based in October 2020. Prior to assuming the position as COO Land Based, Johan Fredrik Gjesdal held the position as Vice President of Strategy & Business Development. 6) Morten Nielsen stepped down as COO Land Based in October 2020 7) Petter Idar Jenssen stepped down as CDO in July 2020
1) Knut Nesse assumed his position as CEO in November 2019 after Hallvard Muri stepped down. 2) Simon Nyquist Martinsen has resigned as CFO after YE 2019. 3) Morten Nielsen and Andrew Campbell receives salary in their local currency, and they are translated to NOK using average rate during 2019 4) Petter Idar Jenssen assumed his position in October 2019 5) Espen Fredrik Staubo assumed his position in March 2019
Payroll expenses 2020 2019
Salaries 680 136 662 098
Payroll tax 50 751 48 819
Pension costs 27 399 27 385
Other benefits 16 154 27 813
Total 774 439 766 115
The number of employees in full time equivalent in the company at year end is: 1 447 1 437
Remuneration to Group management 2020 Salary Pension Other
Accrued - not paid
BonusKnut Nesse (CEO) 2 659 69 138 3 311
Ronny Meinkøhn (CFO)1 750 69 54 521
Simon Nyquist Martinsen (CFO)2 1 565 46 6 -
Espen Fredrik Staubo (CIO) 1 930 69 131 818
Per Andreas Hjetland (CCO) 1 532 69 10 738
Erlend Sødal (COO Cage Based Nordic)3 1 363 69 90 721
Andrew Campbell (COO International)4 1 833 69 8 858
Johan Fredrik Gjesdal (COO Land Based)5 1 441 69 44 491
Morten Nielsen (COO Land Based)6 1 516 152 23 1 176
Petter Idar Jenssen (CDO)7 1 156 40 61 -
Remuneration to Group management 2019 Salary Pension Other
Accrued - not paid
BonusKnut Nesse (CEO)1 444 68 22 -
Hallvard Muri (CEO)1 2 672 68 182 3 000
Simon Nyquist Martinsen (CFO)2 1 833 68 22 229
Espen Fredrik Staubo (CIO)5 1 333 68 110 175
Per Andreas Hjetland (COO Cage Based Nordic) 1 414 68 10 467
Geir Henning Risholm (COO Cage Based Egersund Net) 1 401 49 10 150
Andrew Campbell (COO Cage Based International)3 1 891 - 14 536
Morten Nielsen (COO Land Based)3 2 011 211 120 441
Petter Idar Jenssen (CDO)4 431 17 27 -
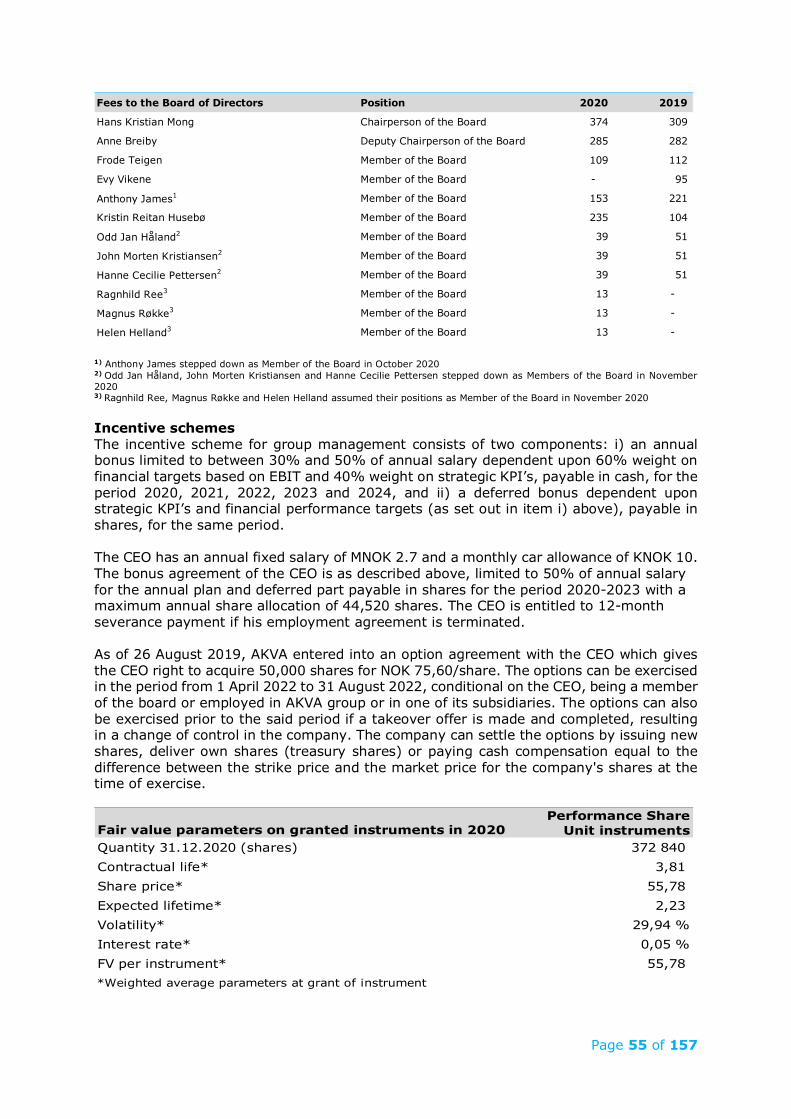
Page 55 of 157
1) Anthony James stepped down as Member of the Board in October 2020 2) Odd Jan Håland, John Morten Kristiansen and Hanne Cecilie Pettersen stepped down as Members of the Board in November 2020 3) Ragnhild Ree, Magnus Røkke and Helen Helland assumed their positions as Member of the Board in November 2020 Incentive schemes The incentive scheme for group management consists of two components: i) an annual bonus limited to between 30% and 50% of annual salary dependent upon 60% weight on financial targets based on EBIT and 40% weight on strategic KPI’s, payable in cash, for the period 2020, 2021, 2022, 2023 and 2024, and ii) a deferred bonus dependent upon strategic KPI’s and financial performance targets (as set out in item i) above), payable in shares, for the same period. The CEO has an annual fixed salary of MNOK 2.7 and a monthly car allowance of KNOK 10. The bonus agreement of the CEO is as described above, limited to 50% of annual salary for the annual plan and deferred part payable in shares for the period 2020-2023 with a maximum annual share allocation of 44,520 shares. The CEO is entitled to 12-month severance payment if his employment agreement is terminated. As of 26 August 2019, AKVA entered into an option agreement with the CEO which gives the CEO right to acquire 50,000 shares for NOK 75,60/share. The options can be exercised in the period from 1 April 2022 to 31 August 2022, conditional on the CEO, being a member of the board or employed in AKVA group or in one of its subsidiaries. The options can also be exercised prior to the said period if a takeover offer is made and completed, resulting in a change of control in the company. The company can settle the options by issuing new shares, deliver own shares (treasury shares) or paying cash compensation equal to the difference between the strike price and the market price for the company's shares at the time of exercise.
Fees to the Board of Directors Position 2020 2019
Hans Kristian Mong Chairperson of the Board 374 309
Anne Breiby Deputy Chairperson of the Board 285 282
Frode Teigen Member of the Board 109 112
Evy Vikene Member of the Board - 95
Anthony James1 Member of the Board 153 221
Kristin Reitan Husebø Member of the Board 235 104
Odd Jan Håland2 Member of the Board 39 51
John Morten Kristiansen2 Member of the Board 39 51
Hanne Cecilie Pettersen2 Member of the Board 39 51
Ragnhild Ree3 Member of the Board 13 -
Magnus Røkke3 Member of the Board 13 -
Helen Helland3 Member of the Board 13 -
Fair value parameters on granted instruments in 2020Performance Share
Unit instrumentsQuantity 31.12.2020 (shares) 372 840 Contractual life* 3,81 Share price* 55,78 Expected lifetime* 2,23 Volatility* 29,94 %Interest rate* 0,05 %FV per instrument* 55,78 *Weighted average parameters at grant of instrument
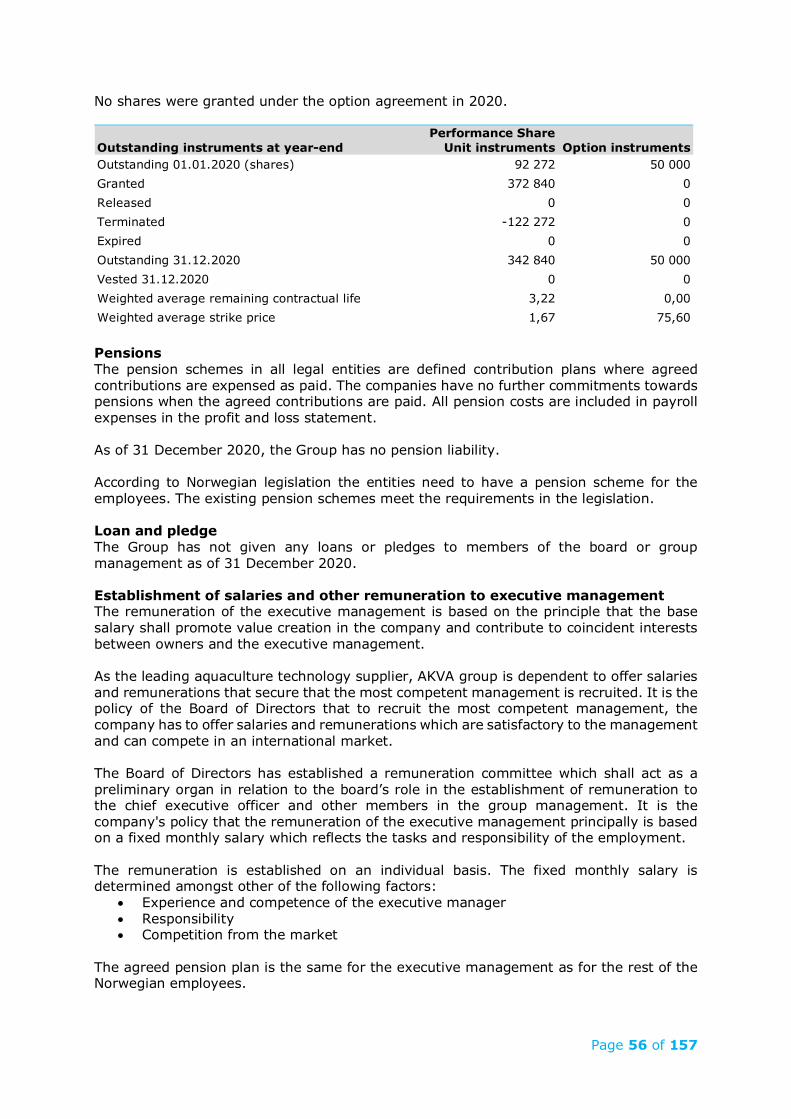
Page 56 of 157
No shares were granted under the option agreement in 2020.
Pensions The pension schemes in all legal entities are defined contribution plans where agreed contributions are expensed as paid. The companies have no further commitments towards pensions when the agreed contributions are paid. All pension costs are included in payroll expenses in the profit and loss statement. As of 31 December 2020, the Group has no pension liability. According to Norwegian legislation the entities need to have a pension scheme for the employees. The existing pension schemes meet the requirements in the legislation. Loan and pledge The Group has not given any loans or pledges to members of the board or group management as of 31 December 2020. Establishment of salaries and other remuneration to executive management The remuneration of the executive management is based on the principle that the base salary shall promote value creation in the company and contribute to coincident interests between owners and the executive management. As the leading aquaculture technology supplier, AKVA group is dependent to offer salaries and remunerations that secure that the most competent management is recruited. It is the policy of the Board of Directors that to recruit the most competent management, the company has to offer salaries and remunerations which are satisfactory to the management and can compete in an international market. The Board of Directors has established a remuneration committee which shall act as a preliminary organ in relation to the board’s role in the establishment of remuneration to the chief executive officer and other members in the group management. It is the company's policy that the remuneration of the executive management principally is based on a fixed monthly salary which reflects the tasks and responsibility of the employment. The remuneration is established on an individual basis. The fixed monthly salary is determined amongst other of the following factors:
• Experience and competence of the executive manager • Responsibility • Competition from the market
The agreed pension plan is the same for the executive management as for the rest of the Norwegian employees.
Outstanding instruments at year-endPerformance Share
Unit instruments Option instrumentsOutstanding 01.01.2020 (shares) 92 272 50 000Granted 372 840 0Released 0 0Terminated -122 272 0Expired 0 0Outstanding 31.12.2020 342 840 50 000Vested 31.12.2020 0 0Weighted average remaining contractual life 3,22 0,00Weighted average strike price 1,67 75,60
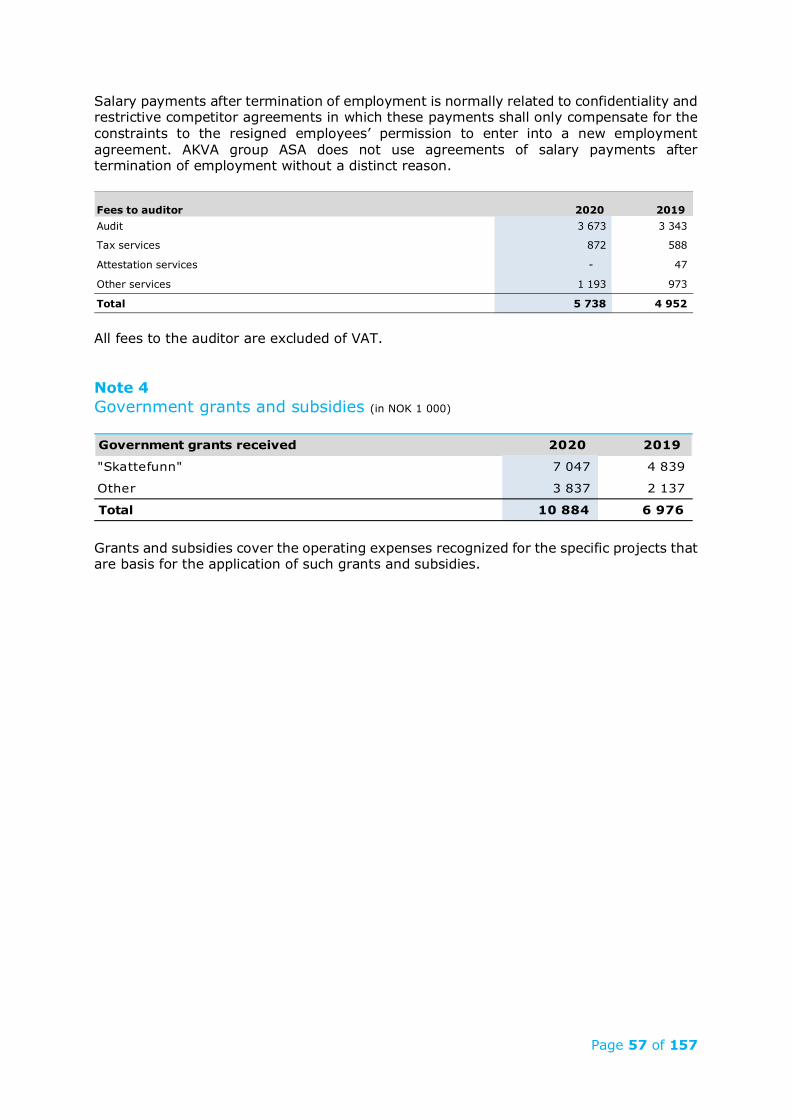
Page 57 of 157
Salary payments after termination of employment is normally related to confidentiality and restrictive competitor agreements in which these payments shall only compensate for the constraints to the resigned employees’ permission to enter into a new employment agreement. AKVA group ASA does not use agreements of salary payments after termination of employment without a distinct reason.
All fees to the auditor are excluded of VAT. Note 4 Government grants and subsidies (in NOK 1 000)
Grants and subsidies cover the operating expenses recognized for the specific projects that are basis for the application of such grants and subsidies.
Fees to auditor 2020 2019Audit 3 673 3 343
Tax services 872 588
Attestation services - 47
Other services 1 193 973
Total 5 738 4 952
Government grants received 2020 2019
"Skattefunn" 7 047 4 839
Other 3 837 2 137
Total 10 884 6 976
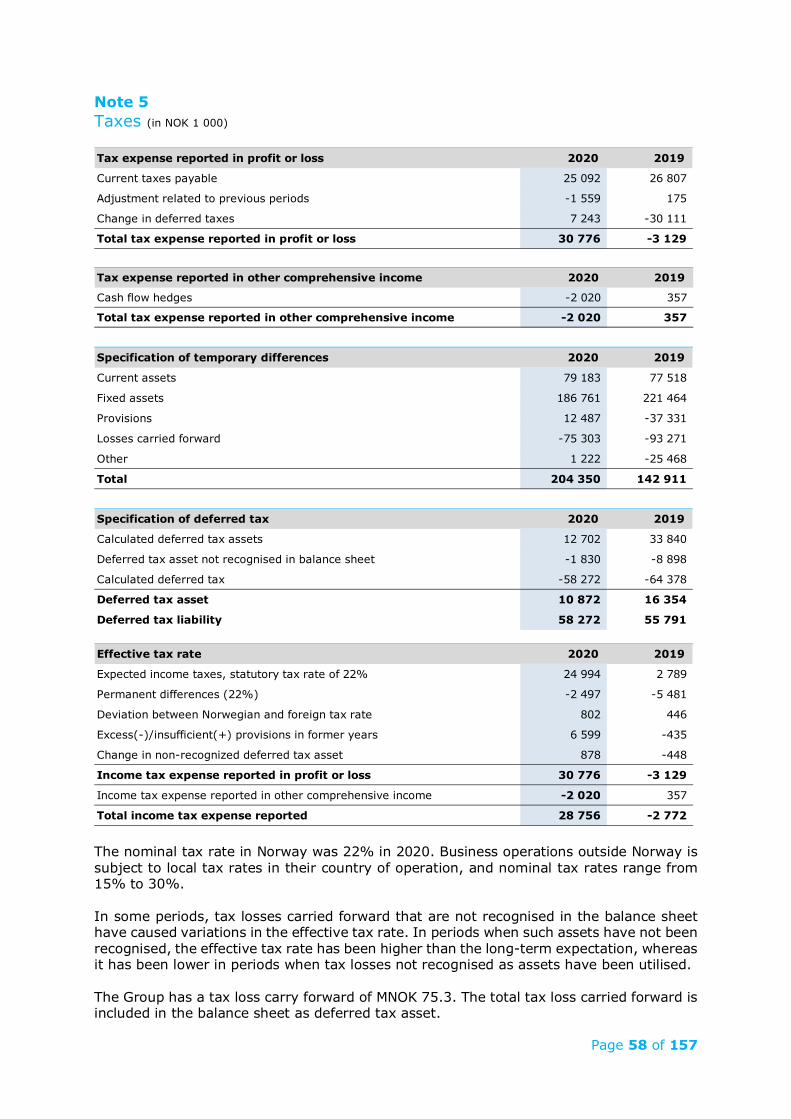
Page 58 of 157
Note 5 Taxes (in NOK 1 000)
The nominal tax rate in Norway was 22% in 2020. Business operations outside Norway is subject to local tax rates in their country of operation, and nominal tax rates range from 15% to 30%. In some periods, tax losses carried forward that are not recognised in the balance sheet have caused variations in the effective tax rate. In periods when such assets have not been recognised, the effective tax rate has been higher than the long-term expectation, whereas it has been lower in periods when tax losses not recognised as assets have been utilised. The Group has a tax loss carry forward of MNOK 75.3. The total tax loss carried forward is included in the balance sheet as deferred tax asset.
Tax expense reported in profit or loss 2020 2019
Current taxes payable 25 092 26 807
Adjustment related to previous periods -1 559 175
Change in deferred taxes 7 243 -30 111
Total tax expense reported in profit or loss 30 776 -3 129
Tax expense reported in other comprehensive income 2020 2019
Cash flow hedges -2 020 357
Total tax expense reported in other comprehensive income -2 020 357
Specification of temporary differences 2020 2019
Current assets 79 183 77 518
Fixed assets 186 761 221 464
Provisions 12 487 -37 331
Losses carried forward -75 303 -93 271
Other 1 222 -25 468
Total 204 350 142 911
Specification of deferred tax 2020 2019
Calculated deferred tax assets 12 702 33 840
Deferred tax asset not recognised in balance sheet -1 830 -8 898
Calculated deferred tax -58 272 -64 378
Deferred tax asset 10 872 16 354
Deferred tax liability 58 272 55 791
Effective tax rate 2020 2019
Expected income taxes, statutory tax rate of 22% 24 994 2 789
Permanent differences (22%) -2 497 -5 481
Deviation between Norwegian and foreign tax rate 802 446
Excess(-)/insufficient(+) provisions in former years 6 599 -435
Change in non-recognized deferred tax asset 878 -448
Income tax expense reported in profit or loss 30 776 -3 129
Income tax expense reported in other comprehensive income -2 020 357
Total income tax expense reported 28 756 -2 772
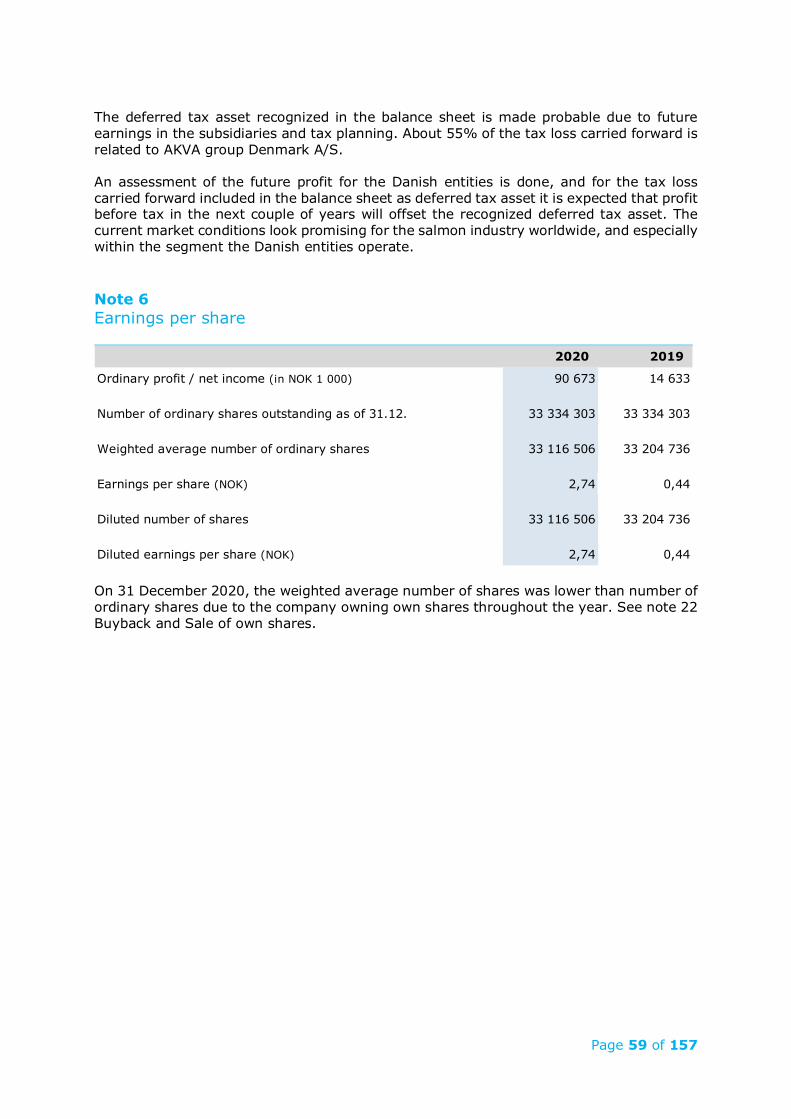
Page 59 of 157
The deferred tax asset recognized in the balance sheet is made probable due to future earnings in the subsidiaries and tax planning. About 55% of the tax loss carried forward is related to AKVA group Denmark A/S. An assessment of the future profit for the Danish entities is done, and for the tax loss carried forward included in the balance sheet as deferred tax asset it is expected that profit before tax in the next couple of years will offset the recognized deferred tax asset. The current market conditions look promising for the salmon industry worldwide, and especially within the segment the Danish entities operate. Note 6 Earnings per share
On 31 December 2020, the weighted average number of shares was lower than number of ordinary shares due to the company owning own shares throughout the year. See note 22 Buyback and Sale of own shares.
2020 2019
Ordinary profit / net income (in NOK 1 000) 90 673 14 633
Number of ordinary shares outstanding as of 31.12. 33 334 303 33 334 303
Weighted average number of ordinary shares 33 116 506 33 204 736
Earnings per share (NOK) 2,74 0,44
Diluted number of shares 33 116 506 33 204 736
Diluted earnings per share (NOK) 2,74 0,44
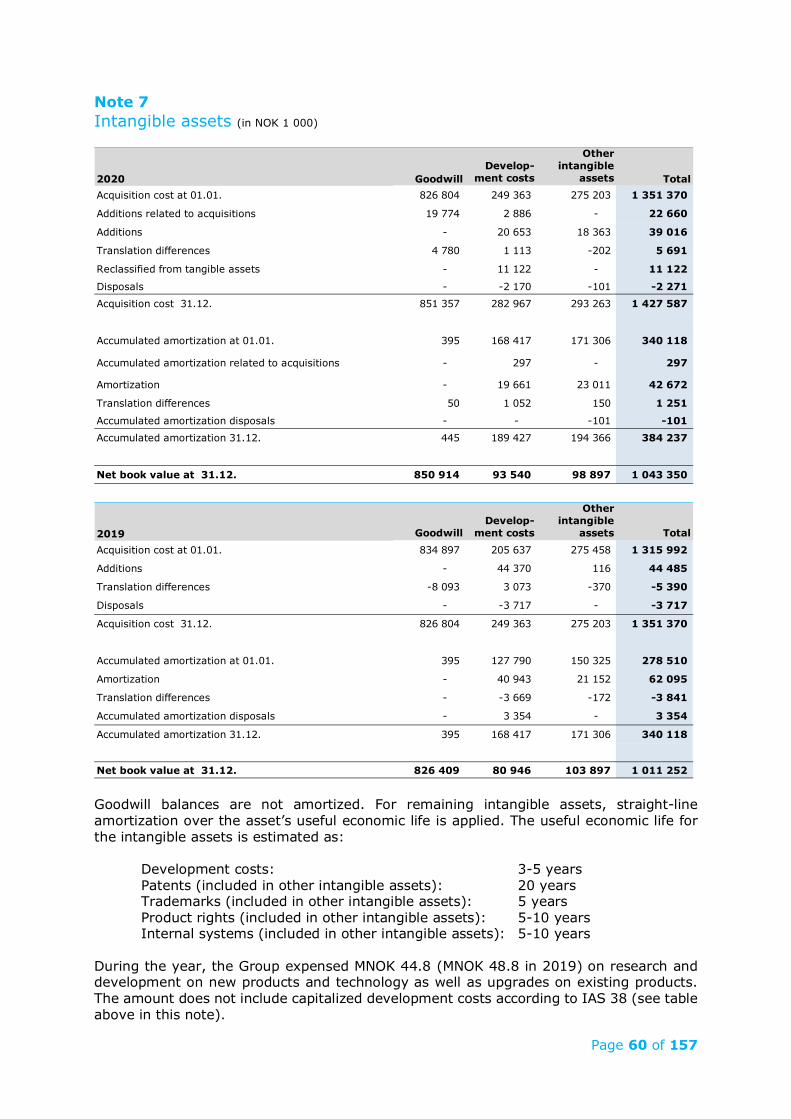
Page 60 of 157
Note 7 Intangible assets (in NOK 1 000)
Goodwill balances are not amortized. For remaining intangible assets, straight-line amortization over the asset’s useful economic life is applied. The useful economic life for the intangible assets is estimated as:
Development costs: 3-5 years Patents (included in other intangible assets): 20 years Trademarks (included in other intangible assets): 5 years Product rights (included in other intangible assets): 5-10 years Internal systems (included in other intangible assets): 5-10 years
During the year, the Group expensed MNOK 44.8 (MNOK 48.8 in 2019) on research and development on new products and technology as well as upgrades on existing products. The amount does not include capitalized development costs according to IAS 38 (see table above in this note).
2020 GoodwillDevelop-
ment costs
Other intangible
assets TotalAcquisition cost at 01.01. 826 804 249 363 275 203 1 351 370
Additions related to acquisitions 19 774 2 886 - 22 660
Additions - 20 653 18 363 39 016
Translation differences 4 780 1 113 -202 5 691
Reclassified from tangible assets - 11 122 - 11 122
Disposals - -2 170 -101 -2 271 Acquisition cost 31.12. 851 357 282 967 293 263 1 427 587
Accumulated amortization at 01.01. 395 168 417 171 306 340 118
Accumulated amortization related to acquisitions - 297 - 297
Amortization - 19 661 23 011 42 672
Translation differences 50 1 052 150 1 251
Accumulated amortization disposals - - -101 -101 Accumulated amortization 31.12. 445 189 427 194 366 384 237
Net book value at 31.12. 850 914 93 540 98 897 1 043 350
2019 GoodwillDevelop-
ment costs
Other intangible
assets TotalAcquisition cost at 01.01. 834 897 205 637 275 458 1 315 992
Additions - 44 370 116 44 485
Translation differences -8 093 3 073 -370 -5 390
Disposals - -3 717 - -3 717
Acquisition cost 31.12. 826 804 249 363 275 203 1 351 370
Accumulated amortization at 01.01. 395 127 790 150 325 278 510
Amortization - 40 943 21 152 62 095
Translation differences - -3 669 -172 -3 841
Accumulated amortization disposals - 3 354 - 3 354
Accumulated amortization 31.12. 395 168 417 171 306 340 118
Net book value at 31.12. 826 409 80 946 103 897 1 011 252
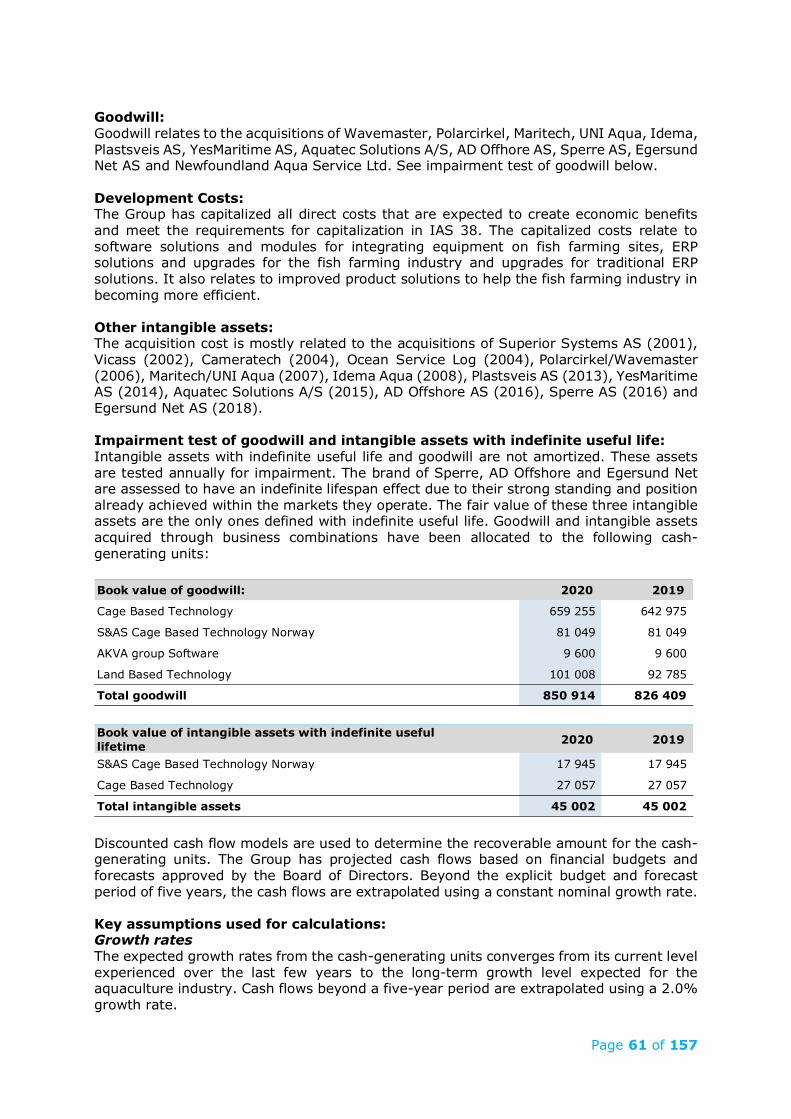
Page 61 of 157
Goodwill: Goodwill relates to the acquisitions of Wavemaster, Polarcirkel, Maritech, UNI Aqua, Idema, Plastsveis AS, YesMaritime AS, Aquatec Solutions A/S, AD Offhore AS, Sperre AS, Egersund Net AS and Newfoundland Aqua Service Ltd. See impairment test of goodwill below. Development Costs: The Group has capitalized all direct costs that are expected to create economic benefits and meet the requirements for capitalization in IAS 38. The capitalized costs relate to software solutions and modules for integrating equipment on fish farming sites, ERP solutions and upgrades for the fish farming industry and upgrades for traditional ERP solutions. It also relates to improved product solutions to help the fish farming industry in becoming more efficient. Other intangible assets: The acquisition cost is mostly related to the acquisitions of Superior Systems AS (2001), Vicass (2002), Cameratech (2004), Ocean Service Log (2004), Polarcirkel/Wavemaster (2006), Maritech/UNI Aqua (2007), Idema Aqua (2008), Plastsveis AS (2013), YesMaritime AS (2014), Aquatec Solutions A/S (2015), AD Offshore AS (2016), Sperre AS (2016) and Egersund Net AS (2018). Impairment test of goodwill and intangible assets with indefinite useful life: Intangible assets with indefinite useful life and goodwill are not amortized. These assets are tested annually for impairment. The brand of Sperre, AD Offshore and Egersund Net are assessed to have an indefinite lifespan effect due to their strong standing and position already achieved within the markets they operate. The fair value of these three intangible assets are the only ones defined with indefinite useful life. Goodwill and intangible assets acquired through business combinations have been allocated to the following cash-generating units:
Discounted cash flow models are used to determine the recoverable amount for the cash-generating units. The Group has projected cash flows based on financial budgets and forecasts approved by the Board of Directors. Beyond the explicit budget and forecast period of five years, the cash flows are extrapolated using a constant nominal growth rate. Key assumptions used for calculations: Growth rates The expected growth rates from the cash-generating units converges from its current level experienced over the last few years to the long-term growth level expected for the aquaculture industry. Cash flows beyond a five-year period are extrapolated using a 2.0% growth rate.
Book value of goodwill: 2020 2019
Cage Based Technology 659 255 642 975
S&AS Cage Based Technology Norway 81 049 81 049
AKVA group Software 9 600 9 600
Land Based Technology 101 008 92 785
Total goodwill 850 914 826 409
Book value of intangible assets with indefinite useful lifetime 2020 2019
S&AS Cage Based Technology Norway 17 945 17 945
Cage Based Technology 27 057 27 057
Total intangible assets 45 002 45 002
Page 62 of 157
Revenue Revenue is based on budget for the coming year and strategy figures for the period 2022-2023, assessed through a thorough process for all cash-generating units. Thereafter the outlook and expectations within each cash-generating unit is considered and revenue is estimated with a reasonable, but conservative growth rate. Gross margin The gross margins, revenues subtracted for cost of goods sold, are only with immaterial changes based on achieved gross margins during the last three years and is aligned with achievements the last year. It is assumed the gross margin will be stable in the years to come. It is expected that any change in the raw material prices during a reasonable time period will be reflected in product market prices and thus not have any material effect on achieved gross margins. Market share The calculations assume that market share will not change significantly from the date of the calculation. Discount rates Discount rates are based on Weighted Average Cost of Capital (WACC) derived from the Capital Asset Pricing Model (CAPM) methodology. The cost of a company's equity and debt, weighted to reflect its capital structure of 72|28 respectively, derive its weighted average cost of capital. The discount rates take into account the debt premium, market risk premium and gearing, corporate tax rate and asset beta. In the recoverable amount assessment, the Group has applied estimated cash flows after tax and a corresponding discount rate after tax of 6.99% for all cash-generating units. A variation of +/- 1% does not materially affect the conclusion of the impairment tests. Sensitivity to changes in assumptions IAS 36.134(f) With regards to the assessment of value-in-use of the different cash-generating units, management believes that no reasonably possible change in any of the above key assumptions would cause the carrying value of the unit to exceed its recoverable amount.
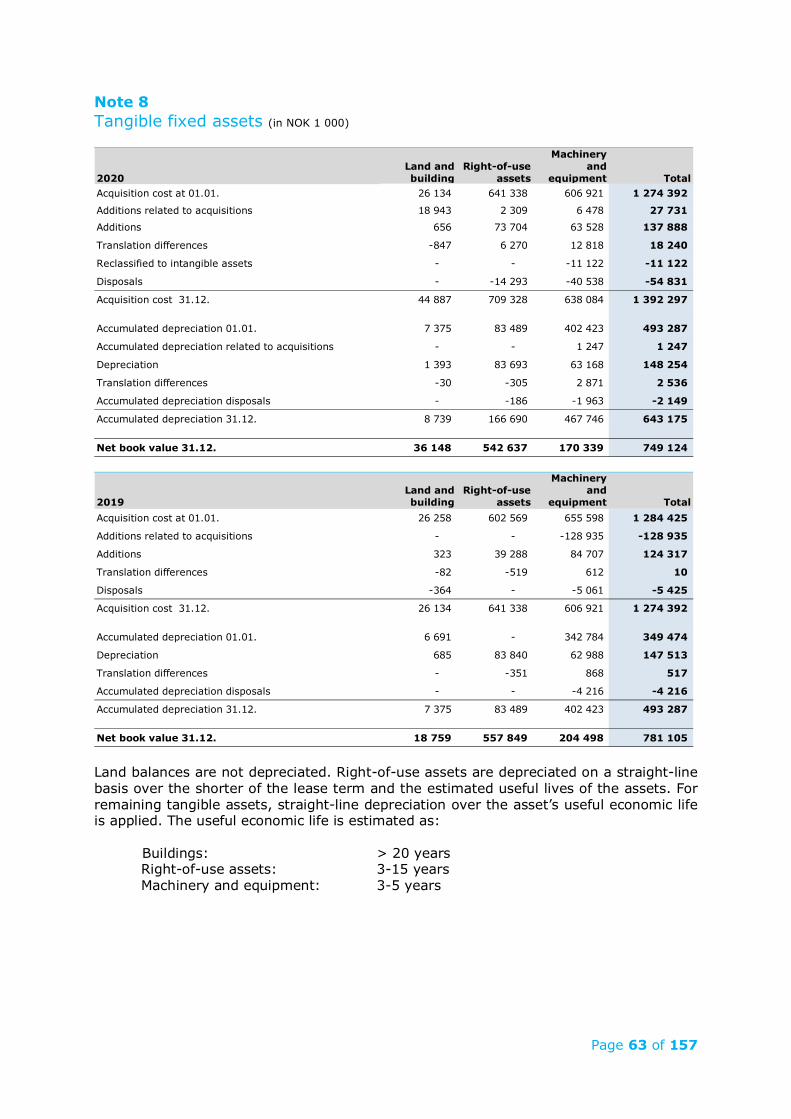
Page 63 of 157
Note 8 Tangible fixed assets (in NOK 1 000)
Land balances are not depreciated. Right-of-use assets are depreciated on a straight-line basis over the shorter of the lease term and the estimated useful lives of the assets. For remaining tangible assets, straight-line depreciation over the asset’s useful economic life is applied. The useful economic life is estimated as:
Buildings: > 20 years Right-of-use assets: 3-15 years Machinery and equipment: 3-5 years
2020Land and building
Right-of-use assets
Machinery and
equipment TotalAcquisition cost at 01.01. 26 134 641 338 606 921 1 274 392
Additions related to acquisitions 18 943 2 309 6 478 27 731 Additions 656 73 704 63 528 137 888
Translation differences -847 6 270 12 818 18 240
Reclassified to intangible assets - - -11 122 -11 122
Disposals - -14 293 -40 538 -54 831
Acquisition cost 31.12. 44 887 709 328 638 084 1 392 297
Accumulated depreciation 01.01. 7 375 83 489 402 423 493 287
Accumulated depreciation related to acquisitions - - 1 247 1 247
Depreciation 1 393 83 693 63 168 148 254
Translation differences -30 -305 2 871 2 536
Accumulated depreciation disposals - -186 -1 963 -2 149
Accumulated depreciation 31.12. 8 739 166 690 467 746 643 175
Net book value 31.12. 36 148 542 637 170 339 749 124
2019Land and building
Right-of-use assets
Machinery and
equipment TotalAcquisition cost at 01.01. 26 258 602 569 655 598 1 284 425
Additions related to acquisitions - - -128 935 -128 935
Additions 323 39 288 84 707 124 317
Translation differences -82 -519 612 10
Disposals -364 - -5 061 -5 425
Acquisition cost 31.12. 26 134 641 338 606 921 1 274 392
Accumulated depreciation 01.01. 6 691 - 342 784 349 474
Depreciation 685 83 840 62 988 147 513
Translation differences - -351 868 517
Accumulated depreciation disposals - - -4 216 -4 216
Accumulated depreciation 31.12. 7 375 83 489 402 423 493 287
Net book value 31.12. 18 759 557 849 204 498 781 105
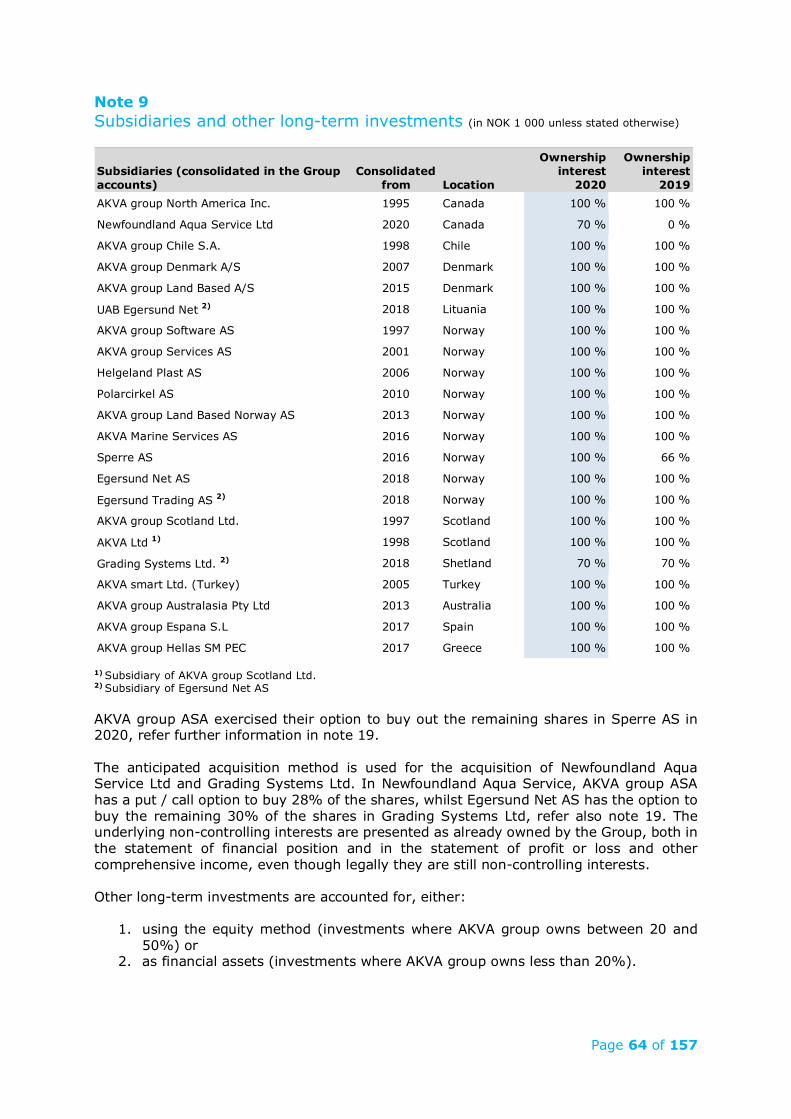
Page 64 of 157
Note 9 Subsidiaries and other long-term investments (in NOK 1 000 unless stated otherwise)
1) Subsidiary of AKVA group Scotland Ltd. 2) Subsidiary of Egersund Net AS AKVA group ASA exercised their option to buy out the remaining shares in Sperre AS in 2020, refer further information in note 19. The anticipated acquisition method is used for the acquisition of Newfoundland Aqua Service Ltd and Grading Systems Ltd. In Newfoundland Aqua Service, AKVA group ASA has a put / call option to buy 28% of the shares, whilst Egersund Net AS has the option to buy the remaining 30% of the shares in Grading Systems Ltd, refer also note 19. The underlying non-controlling interests are presented as already owned by the Group, both in the statement of financial position and in the statement of profit or loss and other comprehensive income, even though legally they are still non-controlling interests. Other long-term investments are accounted for, either:
1. using the equity method (investments where AKVA group owns between 20 and 50%) or
2. as financial assets (investments where AKVA group owns less than 20%).
Subsidiaries (consolidated in the Group accounts)
Consolidated from Location
Ownership interest
2020
Ownership interest
2019AKVA group North America Inc. 1995 Canada 100 % 100 %
Newfoundland Aqua Service Ltd 2020 Canada 70 % 0 %
AKVA group Chile S.A. 1998 Chile 100 % 100 %
AKVA group Denmark A/S 2007 Denmark 100 % 100 %
AKVA group Land Based A/S 2015 Denmark 100 % 100 %
UAB Egersund Net 2) 2018 Lituania 100 % 100 %
AKVA group Software AS 1997 Norway 100 % 100 %
AKVA group Services AS 2001 Norway 100 % 100 %
Helgeland Plast AS 2006 Norway 100 % 100 %
Polarcirkel AS 2010 Norway 100 % 100 %
AKVA group Land Based Norway AS 2013 Norway 100 % 100 %
AKVA Marine Services AS 2016 Norway 100 % 100 %
Sperre AS 2016 Norway 100 % 66 %
Egersund Net AS 2018 Norway 100 % 100 %
Egersund Trading AS 2) 2018 Norway 100 % 100 %
AKVA group Scotland Ltd. 1997 Scotland 100 % 100 %
AKVA Ltd 1) 1998 Scotland 100 % 100 %
Grading Systems Ltd. 2) 2018 Shetland 70 % 70 %
AKVA smart Ltd. (Turkey) 2005 Turkey 100 % 100 %
AKVA group Australasia Pty Ltd 2013 Australia 100 % 100 %
AKVA group Espana S.L 2017 Spain 100 % 100 %
AKVA group Hellas SM PEC 2017 Greece 100 % 100 %
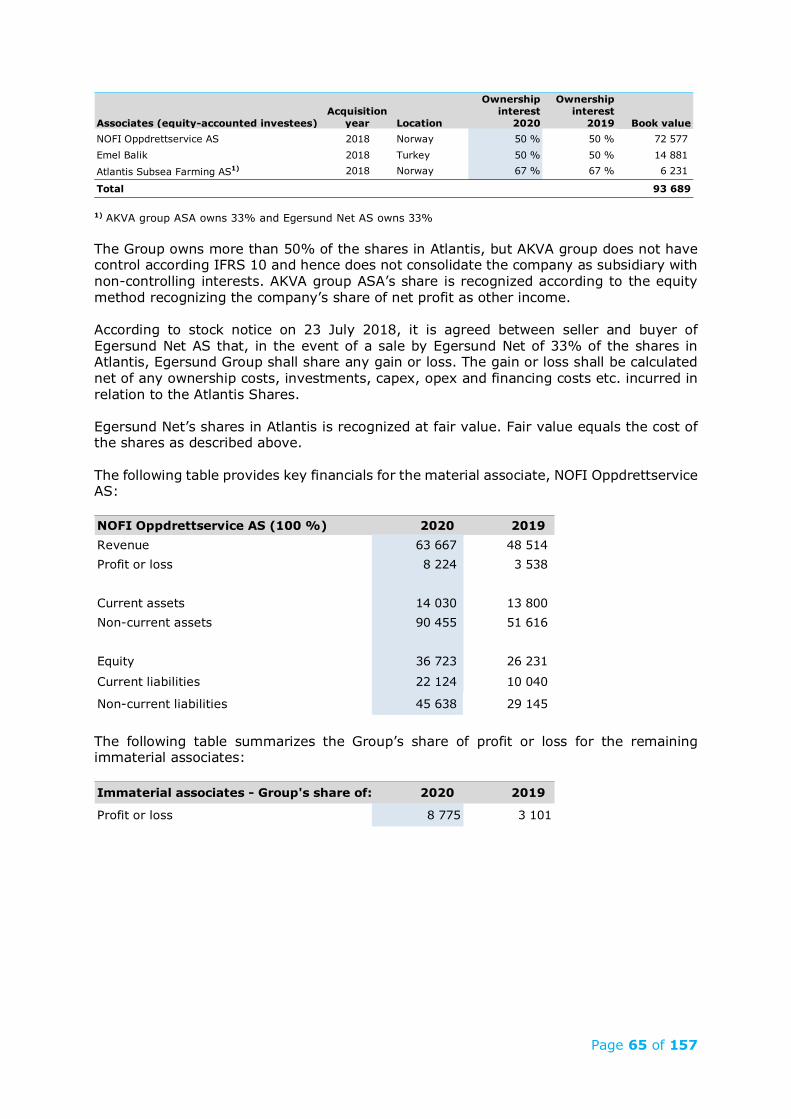
Page 65 of 157
1) AKVA group ASA owns 33% and Egersund Net AS owns 33% The Group owns more than 50% of the shares in Atlantis, but AKVA group does not have control according IFRS 10 and hence does not consolidate the company as subsidiary with non-controlling interests. AKVA group ASA’s share is recognized according to the equity method recognizing the company’s share of net profit as other income. According to stock notice on 23 July 2018, it is agreed between seller and buyer of Egersund Net AS that, in the event of a sale by Egersund Net of 33% of the shares in Atlantis, Egersund Group shall share any gain or loss. The gain or loss shall be calculated net of any ownership costs, investments, capex, opex and financing costs etc. incurred in relation to the Atlantis Shares. Egersund Net’s shares in Atlantis is recognized at fair value. Fair value equals the cost of the shares as described above. The following table provides key financials for the material associate, NOFI Oppdrettservice AS:
The following table summarizes the Group’s share of profit or loss for the remaining immaterial associates:
Associates (equity-accounted investees)Acquisition
year Location
Ownership interest
2020
Ownership interest
2019 Book valueNOFI Oppdrettservice AS 2018 Norway 50 % 50 % 72 577 Emel Balik 2018 Turkey 50 % 50 % 14 881
Atlantis Subsea Farming AS1) 2018 Norway 67 % 67 % 6 231
Total 93 689
NOFI Oppdrettservice AS (100 %) 2020 2019Revenue 63 667 48 514 Profit or loss 8 224 3 538
Current assets 14 030 13 800 Non-current assets 90 455 51 616
Equity 36 723 26 231
Current liabilities 22 124 10 040
Non-current liabilities 45 638 29 145
Immaterial associates - Group's share of: 2020 2019
Profit or loss 8 775 3 101
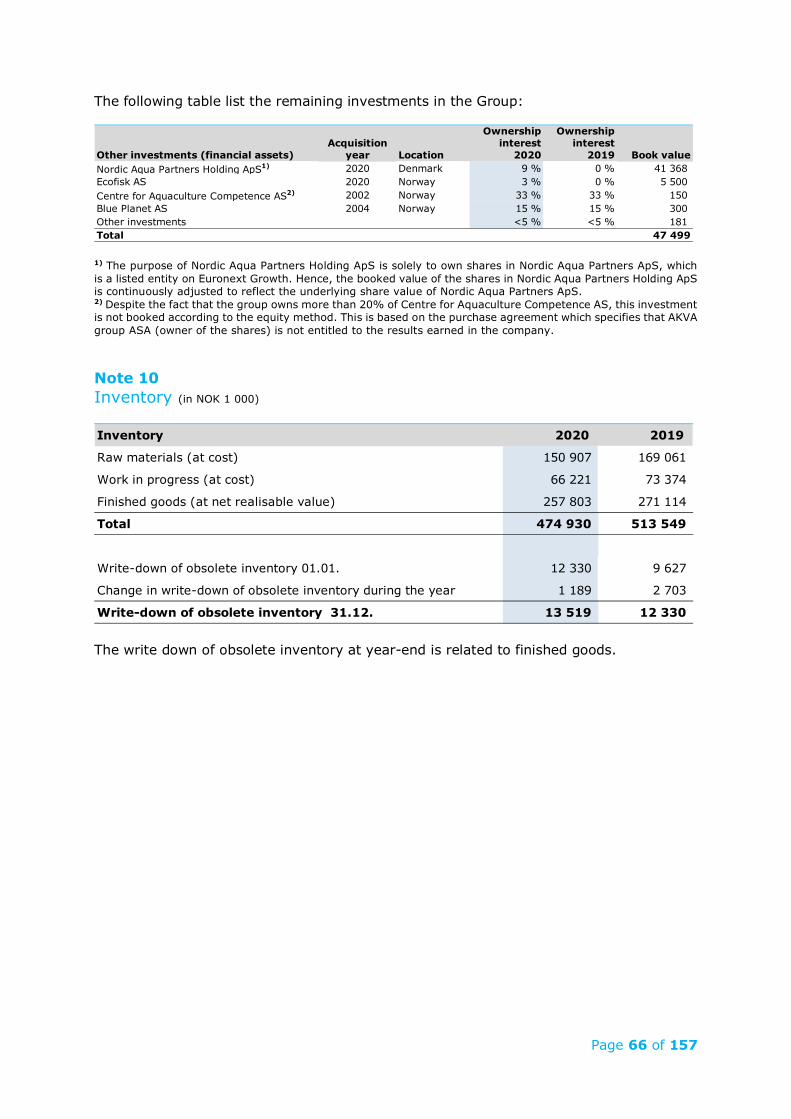
Page 66 of 157
The following table list the remaining investments in the Group:
1) The purpose of Nordic Aqua Partners Holding ApS is solely to own shares in Nordic Aqua Partners ApS, which is a listed entity on Euronext Growth. Hence, the booked value of the shares in Nordic Aqua Partners Holding ApS is continuously adjusted to reflect the underlying share value of Nordic Aqua Partners ApS. 2) Despite the fact that the group owns more than 20% of Centre for Aquaculture Competence AS, this investment is not booked according to the equity method. This is based on the purchase agreement which specifies that AKVA group ASA (owner of the shares) is not entitled to the results earned in the company. Note 10 Inventory (in NOK 1 000)
The write down of obsolete inventory at year-end is related to finished goods.
Other investments (financial assets)Acquisition
year Location
Ownership interest
2020
Ownership interest
2019 Book valueNordic Aqua Partners Holding ApS1) 2020 Denmark 9 % 0 % 41 368 Ecofisk AS 2020 Norway 3 % 0 % 5 500 Centre for Aquaculture Competence AS2) 2002 Norway 33 % 33 % 150 Blue Planet AS 2004 Norway 15 % 15 % 300 Other investments <5 % <5 % 181 Total 47 499
Inventory 2020 2019
Raw materials (at cost) 150 907 169 061
Work in progress (at cost) 66 221 73 374
Finished goods (at net realisable value) 257 803 271 114
Total 474 930 513 549
Write-down of obsolete inventory 01.01. 12 330 9 627
Change in write-down of obsolete inventory during the year 1 189 2 703
Write-down of obsolete inventory 31.12. 13 519 12 330
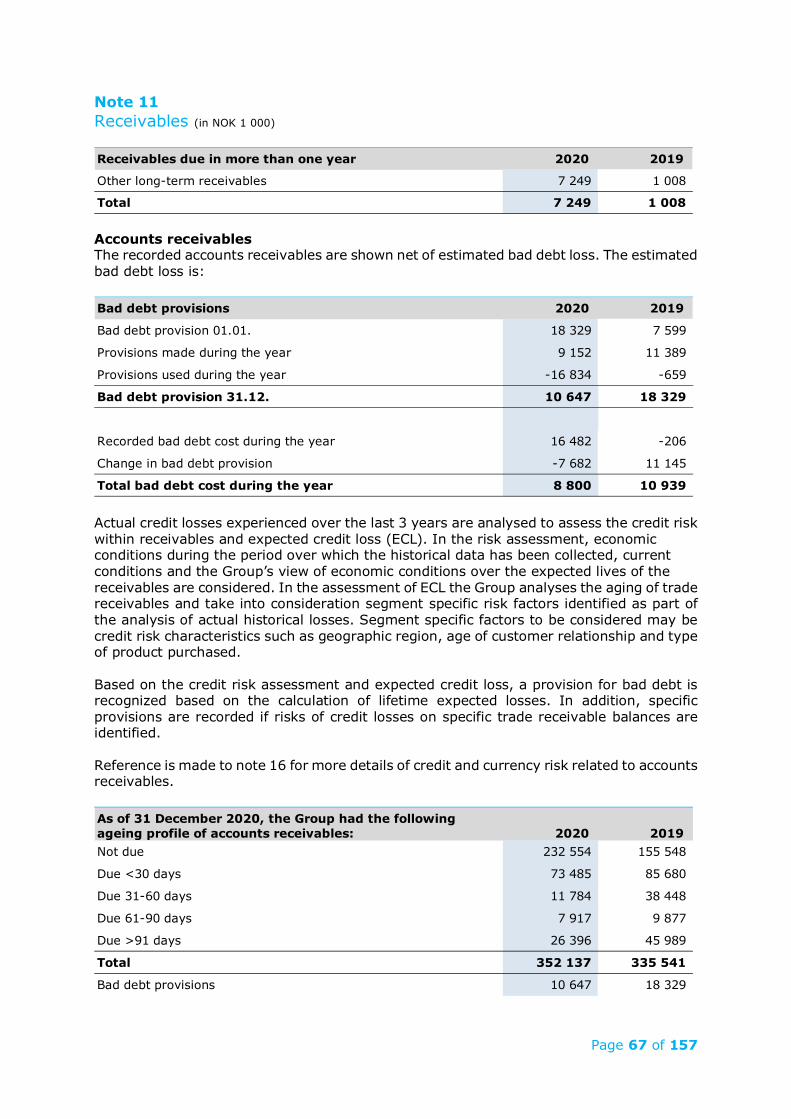
Page 67 of 157
Note 11 Receivables (in NOK 1 000)
Accounts receivables The recorded accounts receivables are shown net of estimated bad debt loss. The estimated bad debt loss is:
Actual credit losses experienced over the last 3 years are analysed to assess the credit risk within receivables and expected credit loss (ECL). In the risk assessment, economic conditions during the period over which the historical data has been collected, current conditions and the Group’s view of economic conditions over the expected lives of the receivables are considered. In the assessment of ECL the Group analyses the aging of trade receivables and take into consideration segment specific risk factors identified as part of the analysis of actual historical losses. Segment specific factors to be considered may be credit risk characteristics such as geographic region, age of customer relationship and type of product purchased. Based on the credit risk assessment and expected credit loss, a provision for bad debt is recognized based on the calculation of lifetime expected losses. In addition, specific provisions are recorded if risks of credit losses on specific trade receivable balances are identified. Reference is made to note 16 for more details of credit and currency risk related to accounts receivables.
Receivables due in more than one year 2020 2019
Other long-term receivables 7 249 1 008
Total 7 249 1 008
Bad debt provisions 2020 2019
Bad debt provision 01.01. 18 329 7 599
Provisions made during the year 9 152 11 389
Provisions used during the year -16 834 -659
Bad debt provision 31.12. 10 647 18 329
Recorded bad debt cost during the year 16 482 -206
Change in bad debt provision -7 682 11 145
Total bad debt cost during the year 8 800 10 939
2020 2019Not due 232 554 155 548
Due <30 days 73 485 85 680
Due 31-60 days 11 784 38 448
Due 61-90 days 7 917 9 877
Due >91 days 26 396 45 989
Total 352 137 335 541
Bad debt provisions 10 647 18 329
As of 31 December 2020, the Group had the following ageing profile of accounts receivables:
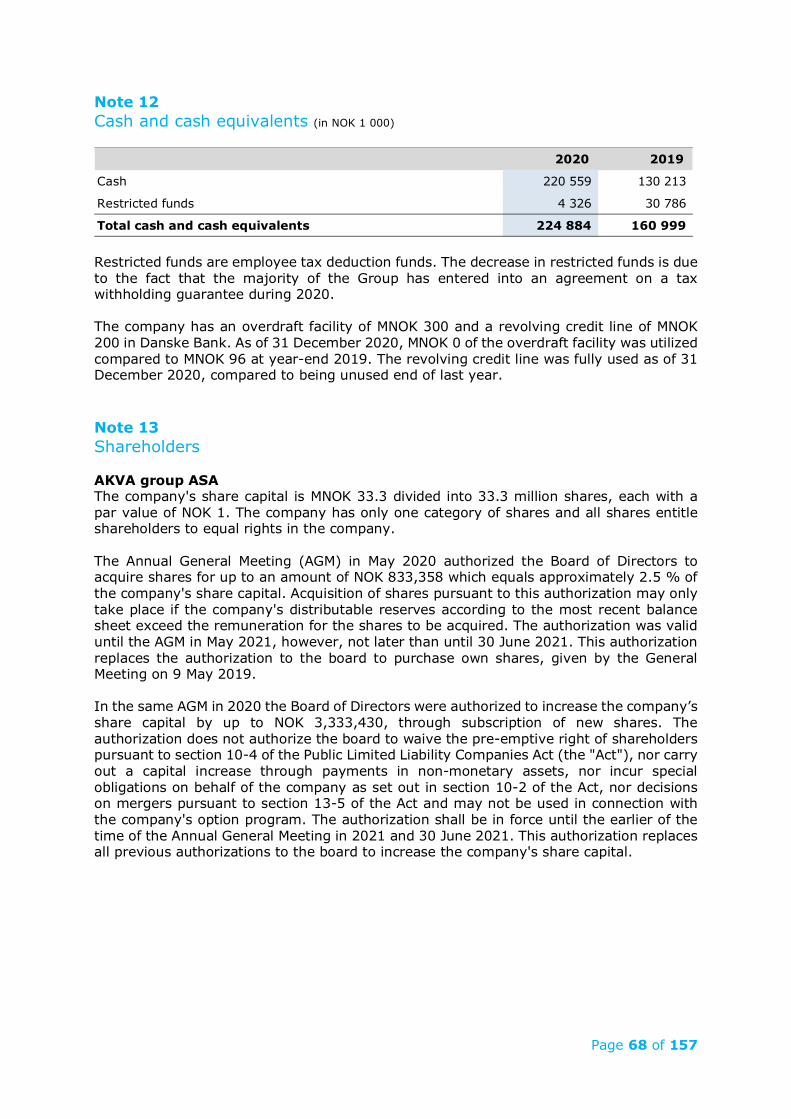
Page 68 of 157
Note 12 Cash and cash equivalents (in NOK 1 000)
Restricted funds are employee tax deduction funds. The decrease in restricted funds is due to the fact that the majority of the Group has entered into an agreement on a tax withholding guarantee during 2020. The company has an overdraft facility of MNOK 300 and a revolving credit line of MNOK 200 in Danske Bank. As of 31 December 2020, MNOK 0 of the overdraft facility was utilized compared to MNOK 96 at year-end 2019. The revolving credit line was fully used as of 31 December 2020, compared to being unused end of last year. Note 13 Shareholders AKVA group ASA The company's share capital is MNOK 33.3 divided into 33.3 million shares, each with a par value of NOK 1. The company has only one category of shares and all shares entitle shareholders to equal rights in the company. The Annual General Meeting (AGM) in May 2020 authorized the Board of Directors to acquire shares for up to an amount of NOK 833,358 which equals approximately 2.5 % of the company's share capital. Acquisition of shares pursuant to this authorization may only take place if the company's distributable reserves according to the most recent balance sheet exceed the remuneration for the shares to be acquired. The authorization was valid until the AGM in May 2021, however, not later than until 30 June 2021. This authorization replaces the authorization to the board to purchase own shares, given by the General Meeting on 9 May 2019. In the same AGM in 2020 the Board of Directors were authorized to increase the company’s share capital by up to NOK 3,333,430, through subscription of new shares. The authorization does not authorize the board to waive the pre-emptive right of shareholders pursuant to section 10-4 of the Public Limited Liability Companies Act (the "Act"), nor carry out a capital increase through payments in non-monetary assets, nor incur special obligations on behalf of the company as set out in section 10-2 of the Act, nor decisions on mergers pursuant to section 13-5 of the Act and may not be used in connection with the company's option program. The authorization shall be in force until the earlier of the time of the Annual General Meeting in 2021 and 30 June 2021. This authorization replaces all previous authorizations to the board to increase the company's share capital.
2020 2019
Cash 220 559 130 213
Restricted funds 4 326 30 786
Total cash and cash equivalents 224 884 160 999
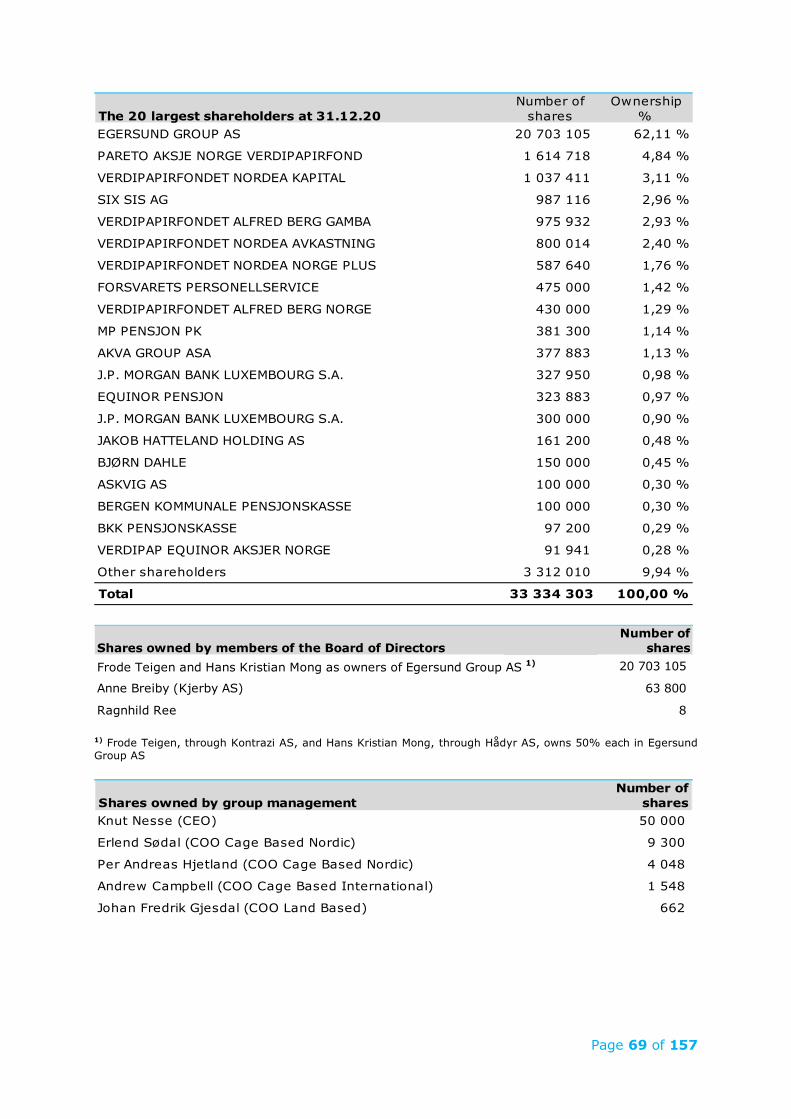
Page 69 of 157
1) Frode Teigen, through Kontrazi AS, and Hans Kristian Mong, through Hådyr AS, owns 50% each in Egersund Group AS
The 20 largest shareholders at 31.12.20Number of
shares Ownership
% EGERSUND GROUP AS 20 703 105 62,11 %
PARETO AKSJE NORGE VERDIPAPIRFOND 1 614 718 4,84 %
VERDIPAPIRFONDET NORDEA KAPITAL 1 037 411 3,11 %
SIX SIS AG 987 116 2,96 %
VERDIPAPIRFONDET ALFRED BERG GAMBA 975 932 2,93 %
VERDIPAPIRFONDET NORDEA AVKASTNING 800 014 2,40 %
VERDIPAPIRFONDET NORDEA NORGE PLUS 587 640 1,76 %
FORSVARETS PERSONELLSERVICE 475 000 1,42 %
VERDIPAPIRFONDET ALFRED BERG NORGE 430 000 1,29 %
MP PENSJON PK 381 300 1,14 %
AKVA GROUP ASA 377 883 1,13 %
J.P. MORGAN BANK LUXEMBOURG S.A. 327 950 0,98 %
EQUINOR PENSJON 323 883 0,97 %
J.P. MORGAN BANK LUXEMBOURG S.A. 300 000 0,90 %
JAKOB HATTELAND HOLDING AS 161 200 0,48 %
BJØRN DAHLE 150 000 0,45 %
ASKVIG AS 100 000 0,30 %
BERGEN KOMMUNALE PENSJONSKASSE 100 000 0,30 %
BKK PENSJONSKASSE 97 200 0,29 %
VERDIPAP EQUINOR AKSJER NORGE 91 941 0,28 %
Other shareholders 3 312 010 9,94 %
Total 33 334 303 100,00 %
Shares owned by members of the Board of Directors Number of
shares Frode Teigen and Hans Kristian Mong as owners of Egersund Group AS 1) 20 703 105
Anne Breiby (Kjerby AS) 63 800
Ragnhild Ree 8
Shares owned by group management Number of
shares Knut Nesse (CEO) 50 000
Erlend Sødal (COO Cage Based Nordic) 9 300
Per Andreas Hjetland (COO Cage Based Nordic) 4 048
Andrew Campbell (COO Cage Based International) 1 548
Johan Fredrik Gjesdal (COO Land Based) 662
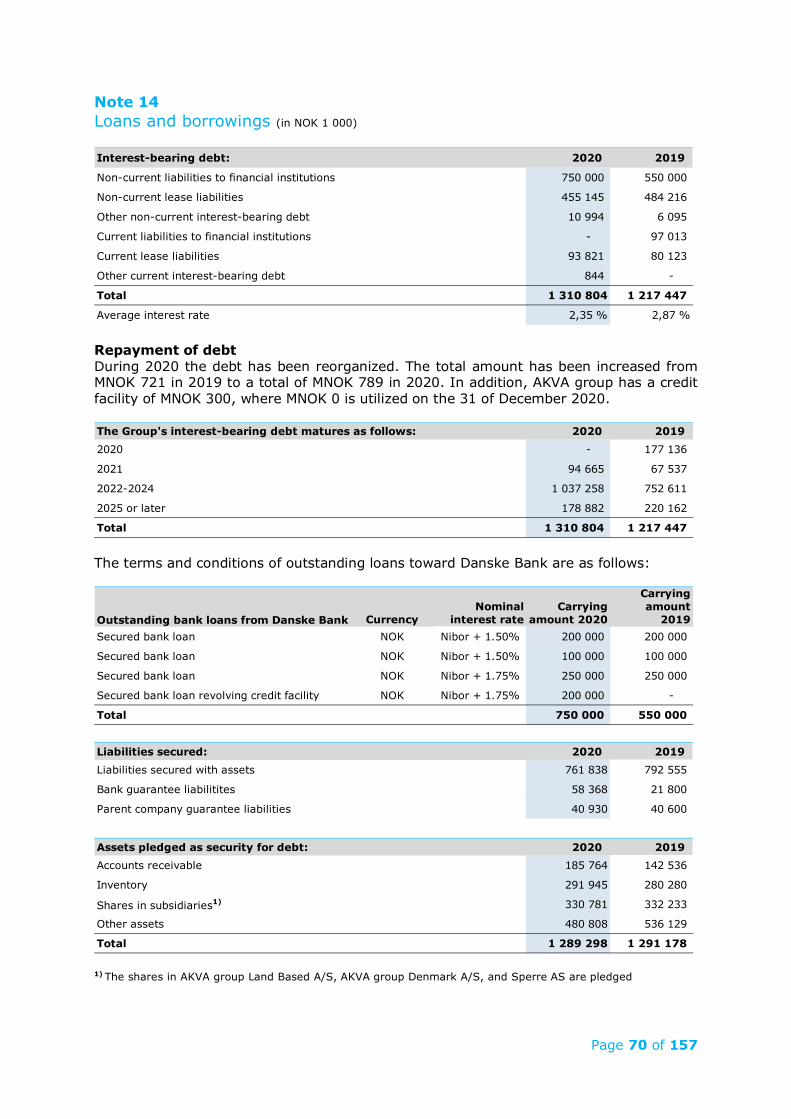
Page 70 of 157
Note 14 Loans and borrowings (in NOK 1 000)
Repayment of debt During 2020 the debt has been reorganized. The total amount has been increased from MNOK 721 in 2019 to a total of MNOK 789 in 2020. In addition, AKVA group has a credit facility of MNOK 300, where MNOK 0 is utilized on the 31 of December 2020.
The terms and conditions of outstanding loans toward Danske Bank are as follows:
1) The shares in AKVA group Land Based A/S, AKVA group Denmark A/S, and Sperre AS are pledged
Interest-bearing debt: 2020 2019
Non-current liabilities to financial institutions 750 000 550 000
Non-current lease liabilities 455 145 484 216
Other non-current interest-bearing debt 10 994 6 095
Current liabilities to financial institutions - 97 013
Current lease liabilities 93 821 80 123
Other current interest-bearing debt 844 -
Total 1 310 804 1 217 447
Average interest rate 2,35 % 2,87 %
2020 20192020 - 177 136
2021 94 665 67 537
2022-2024 1 037 258 752 611
2025 or later 178 882 220 162
Total 1 310 804 1 217 447
The Group's interest-bearing debt matures as follows:
Outstanding bank loans from Danske Bank CurrencyNominal
interest rateCarrying
amount 2020
Carrying amount
2019Secured bank loan NOK Nibor + 1.50% 200 000 200 000
Secured bank loan NOK Nibor + 1.50% 100 000 100 000
Secured bank loan NOK Nibor + 1.75% 250 000 250 000
Secured bank loan revolving credit facility NOK Nibor + 1.75% 200 000 -
Total 750 000 550 000
Liabilities secured: 2020 2019Liabilities secured with assets 761 838 792 555
Bank guarantee liabilitites 58 368 21 800
Parent company guarantee liabilities 40 930 40 600
Assets pledged as security for debt: 2020 2019Accounts receivable 185 764 142 536
Inventory 291 945 280 280
Shares in subsidiaries1) 330 781 332 233
Other assets 480 808 536 129
Total 1 289 298 1 291 178
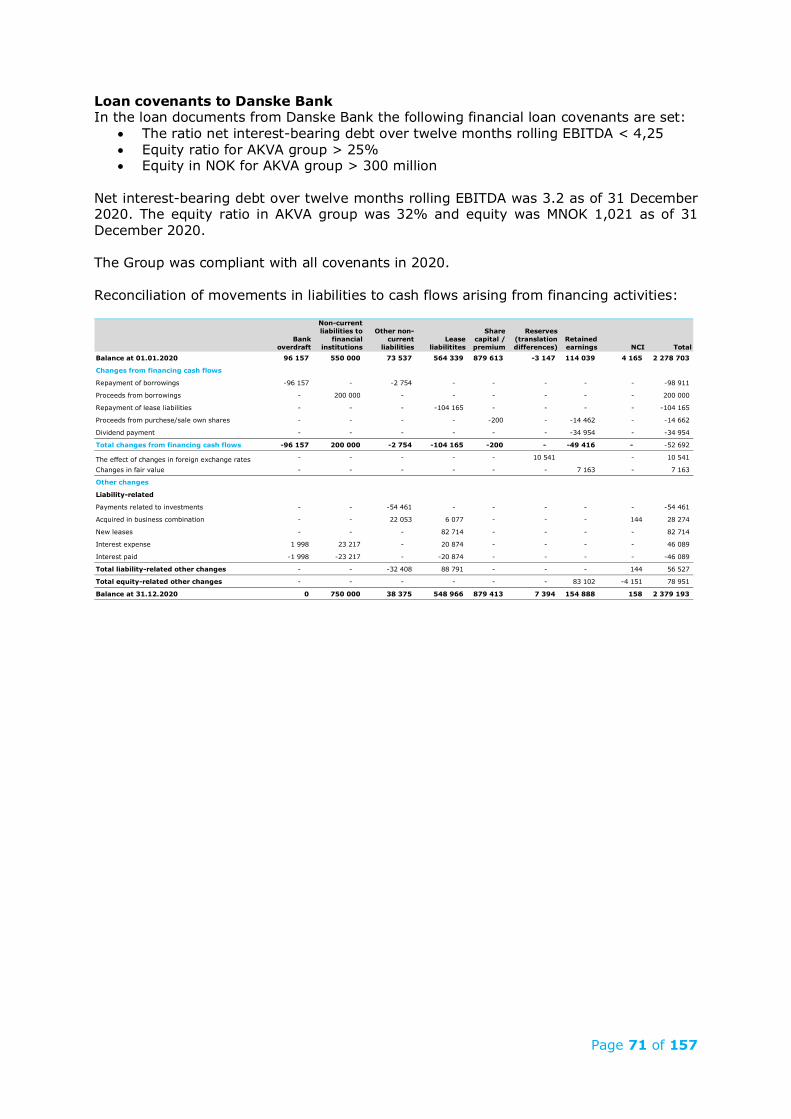
Page 71 of 157
Loan covenants to Danske Bank In the loan documents from Danske Bank the following financial loan covenants are set:
• The ratio net interest-bearing debt over twelve months rolling EBITDA < 4,25 • Equity ratio for AKVA group > 25% • Equity in NOK for AKVA group > 300 million
Net interest-bearing debt over twelve months rolling EBITDA was 3.2 as of 31 December 2020. The equity ratio in AKVA group was 32% and equity was MNOK 1,021 as of 31 December 2020. The Group was compliant with all covenants in 2020. Reconciliation of movements in liabilities to cash flows arising from financing activities:
Bank overdraft
Non-current liabilities to
financial institutions
Other non-current
liabilitiesLease
liabilitites
Share capital / premium
Reserves (translation differences)
Retained earnings NCI Total
Balance at 01.01.2020 96 157 550 000 73 537 564 339 879 613 -3 147 114 039 4 165 2 278 703
Changes from financing cash flows
Repayment of borrowings -96 157 - -2 754 - - - - - -98 911
Proceeds from borrowings - 200 000 - - - - - - 200 000
Repayment of lease liabilities - - - -104 165 - - - - -104 165
Proceeds from purchese/sale own shares - - - - -200 - -14 462 - -14 662
Dividend payment - - - - - - -34 954 - -34 954
Total changes from financing cash flows -96 157 200 000 -2 754 -104 165 -200 - -49 416 - -52 692
The effect of changes in foreign exchange rates - - - - - 10 541 - 10 541
Changes in fair value - - - - - - 7 163 - 7 163
Other changes
Liability-related
Payments related to investments - - -54 461 - - - - - -54 461
Acquired in business combination - - 22 053 6 077 - - - 144 28 274
New leases - - - 82 714 - - - - 82 714
Interest expense 1 998 23 217 - 20 874 - - - - 46 089
Interest paid -1 998 -23 217 - -20 874 - - - - -46 089
Total liability-related other changes - - -32 408 88 791 - - - 144 56 527
Total equity-related other changes - - - - - - 83 102 -4 151 78 951
Balance at 31.12.2020 0 750 000 38 375 548 966 879 413 7 394 154 888 158 2 379 193
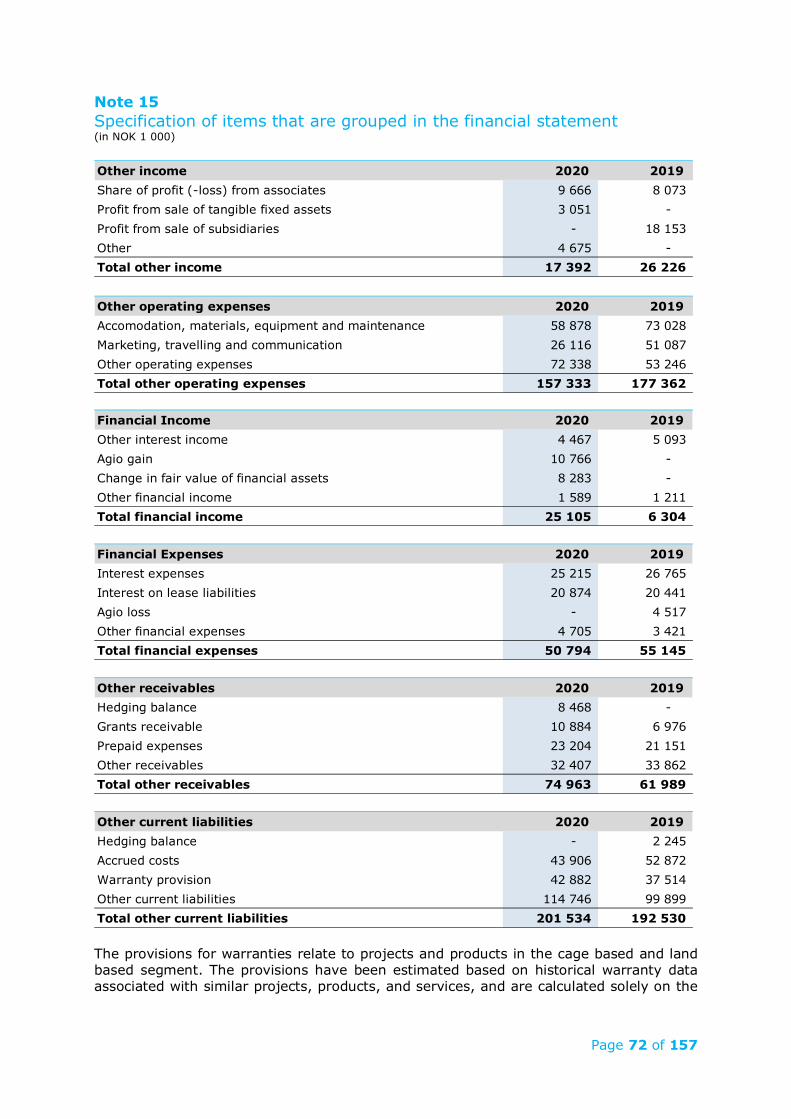
Page 72 of 157
Note 15 Specification of items that are grouped in the financial statement (in NOK 1 000)
The provisions for warranties relate to projects and products in the cage based and land based segment. The provisions have been estimated based on historical warranty data associated with similar projects, products, and services, and are calculated solely on the
Other income 2020 2019Share of profit (-loss) from associates 9 666 8 073 Profit from sale of tangible fixed assets 3 051 - Profit from sale of subsidiaries - 18 153 Other 4 675 - Total other income 17 392 26 226
Other operating expenses 2020 2019Accomodation, materials, equipment and maintenance 58 878 73 028 Marketing, travelling and communication 26 116 51 087 Other operating expenses 72 338 53 246 Total other operating expenses 157 333 177 362
Financial Income 2020 2019Other interest income 4 467 5 093 Agio gain 10 766 - Change in fair value of financial assets 8 283 - Other financial income 1 589 1 211 Total financial income 25 105 6 304
Financial Expenses 2020 2019Interest expenses 25 215 26 765 Interest on lease liabilities 20 874 20 441 Agio loss - 4 517 Other financial expenses 4 705 3 421 Total financial expenses 50 794 55 145
Other receivables 2020 2019Hedging balance 8 468 - Grants receivable 10 884 6 976 Prepaid expenses 23 204 21 151 Other receivables 32 407 33 862 Total other receivables 74 963 61 989
Other current liabilities 2020 2019Hedging balance - 2 245 Accrued costs 43 906 52 872 Warranty provision 42 882 37 514 Other current liabilities 114 746 99 899 Total other current liabilities 201 534 192 530
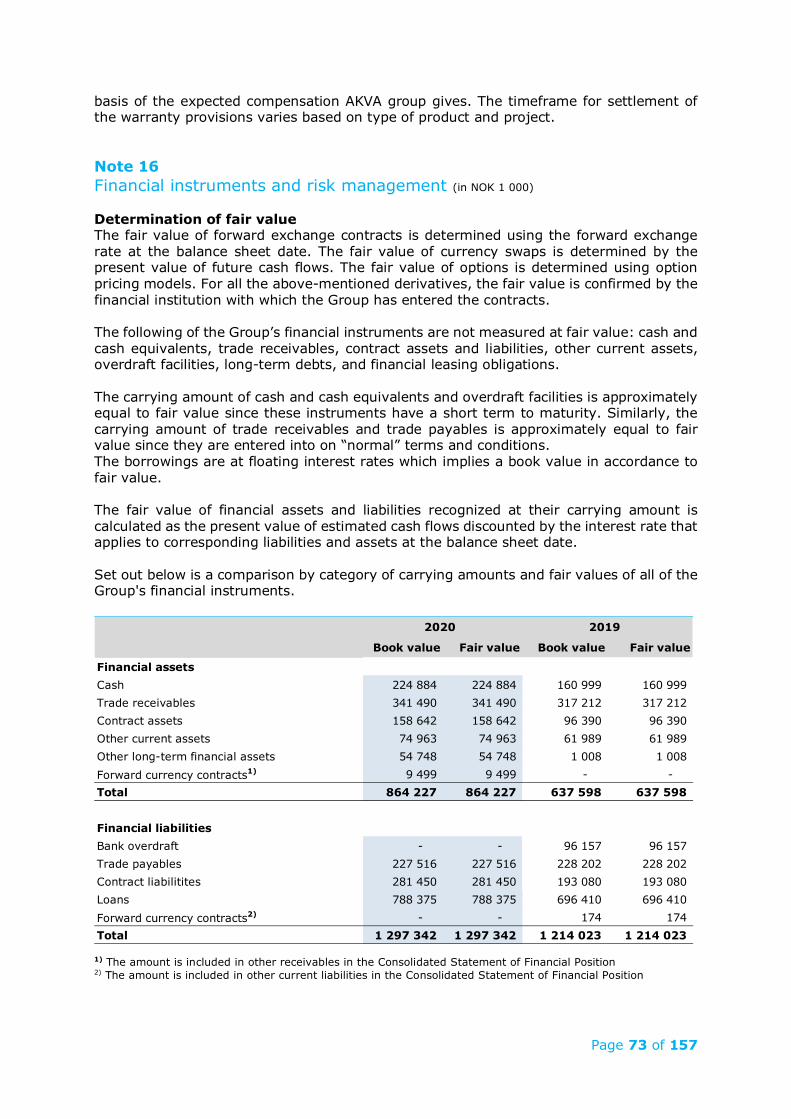
Page 73 of 157
basis of the expected compensation AKVA group gives. The timeframe for settlement of the warranty provisions varies based on type of product and project. Note 16 Financial instruments and risk management (in NOK 1 000) Determination of fair value The fair value of forward exchange contracts is determined using the forward exchange rate at the balance sheet date. The fair value of currency swaps is determined by the present value of future cash flows. The fair value of options is determined using option pricing models. For all the above-mentioned derivatives, the fair value is confirmed by the financial institution with which the Group has entered the contracts. The following of the Group’s financial instruments are not measured at fair value: cash and cash equivalents, trade receivables, contract assets and liabilities, other current assets, overdraft facilities, long-term debts, and financial leasing obligations. The carrying amount of cash and cash equivalents and overdraft facilities is approximately equal to fair value since these instruments have a short term to maturity. Similarly, the carrying amount of trade receivables and trade payables is approximately equal to fair value since they are entered into on “normal” terms and conditions. The borrowings are at floating interest rates which implies a book value in accordance to fair value. The fair value of financial assets and liabilities recognized at their carrying amount is calculated as the present value of estimated cash flows discounted by the interest rate that applies to corresponding liabilities and assets at the balance sheet date. Set out below is a comparison by category of carrying amounts and fair values of all of the Group's financial instruments.
1) The amount is included in other receivables in the Consolidated Statement of Financial Position 2) The amount is included in other current liabilities in the Consolidated Statement of Financial Position
Book value Fair value Book value Fair value
Financial assetsCash 224 884 224 884 160 999 160 999 Trade receivables 341 490 341 490 317 212 317 212 Contract assets 158 642 158 642 96 390 96 390 Other current assets 74 963 74 963 61 989 61 989 Other long-term financial assets 54 748 54 748 1 008 1 008 Forward currency contracts1) 9 499 9 499 - - Total 864 227 864 227 637 598 637 598
Financial liabilitiesBank overdraft - - 96 157 96 157 Trade payables 227 516 227 516 228 202 228 202 Contract liabilitites 281 450 281 450 193 080 193 080 Loans 788 375 788 375 696 410 696 410 Forward currency contracts2) - - 174 174 Total 1 297 342 1 297 342 1 214 023 1 214 023
2020 2019
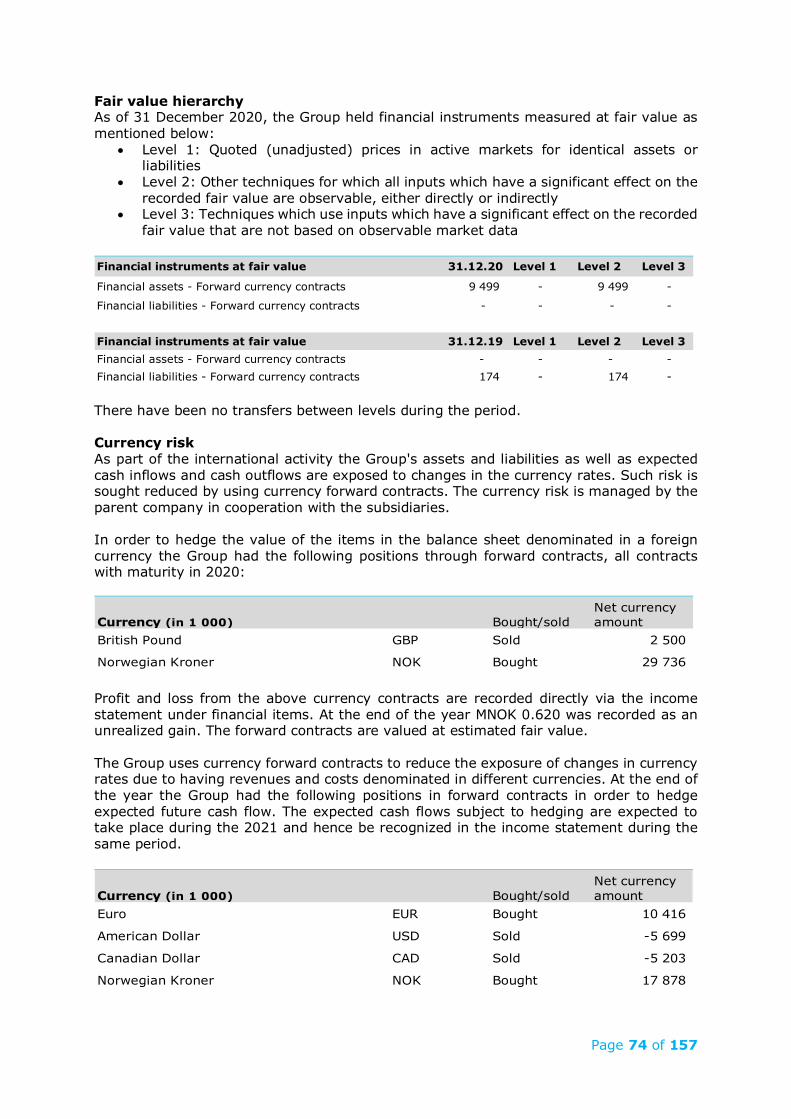
Page 74 of 157
Fair value hierarchy As of 31 December 2020, the Group held financial instruments measured at fair value as mentioned below:
• Level 1: Quoted (unadjusted) prices in active markets for identical assets or liabilities
• Level 2: Other techniques for which all inputs which have a significant effect on the recorded fair value are observable, either directly or indirectly
• Level 3: Techniques which use inputs which have a significant effect on the recorded fair value that are not based on observable market data
There have been no transfers between levels during the period. Currency risk As part of the international activity the Group's assets and liabilities as well as expected cash inflows and cash outflows are exposed to changes in the currency rates. Such risk is sought reduced by using currency forward contracts. The currency risk is managed by the parent company in cooperation with the subsidiaries. In order to hedge the value of the items in the balance sheet denominated in a foreign currency the Group had the following positions through forward contracts, all contracts with maturity in 2020:
Profit and loss from the above currency contracts are recorded directly via the income statement under financial items. At the end of the year MNOK 0.620 was recorded as an unrealized gain. The forward contracts are valued at estimated fair value. The Group uses currency forward contracts to reduce the exposure of changes in currency rates due to having revenues and costs denominated in different currencies. At the end of the year the Group had the following positions in forward contracts in order to hedge expected future cash flow. The expected cash flows subject to hedging are expected to take place during the 2021 and hence be recognized in the income statement during the same period.
Financial instruments at fair value 31.12.20 Level 1 Level 2 Level 3
Financial assets - Forward currency contracts 9 499 - 9 499 -
Financial liabilities - Forward currency contracts - - - -
Financial instruments at fair value 31.12.19 Level 1 Level 2 Level 3Financial assets - Forward currency contracts - - - - Financial liabilities - Forward currency contracts 174 - 174 -
Currency (in 1 000) Bought/soldNet currency amount
British Pound GBP Sold 2 500
Norwegian Kroner NOK Bought 29 736
Currency (in 1 000) Bought/soldNet currency amount
Euro EUR Bought 10 416
American Dollar USD Sold -5 699
Canadian Dollar CAD Sold -5 203
Norwegian Kroner NOK Bought 17 878
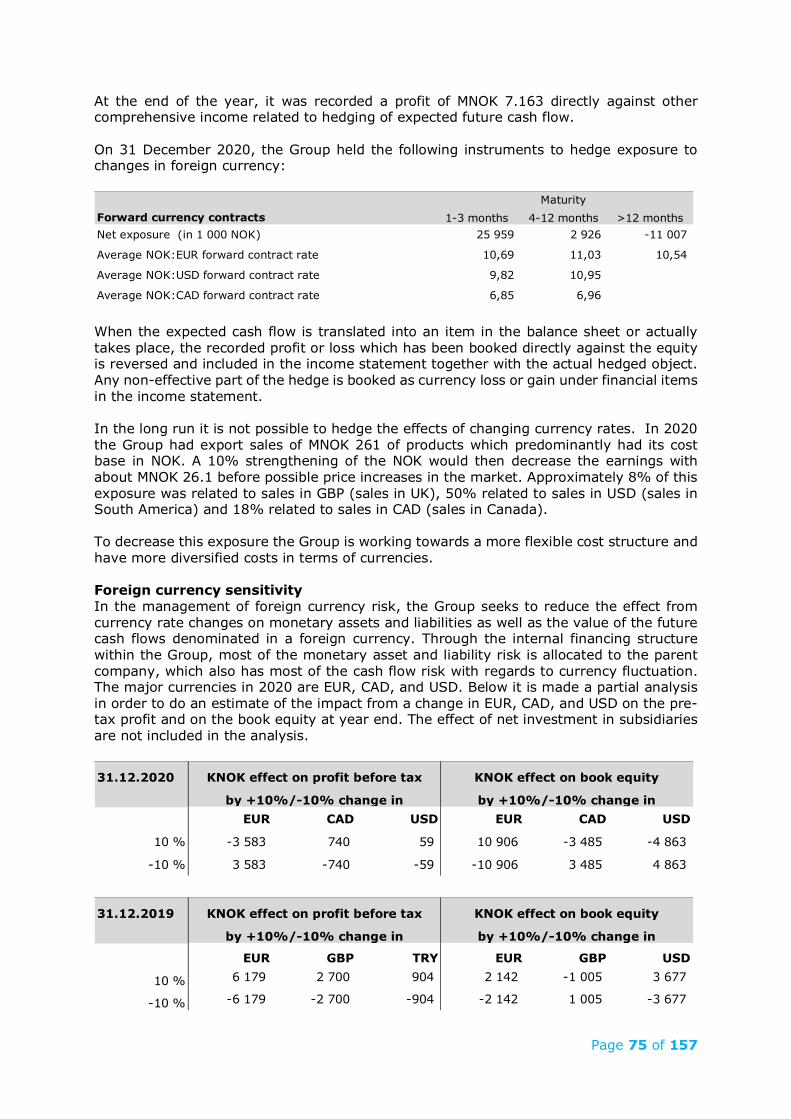
Page 75 of 157
At the end of the year, it was recorded a profit of MNOK 7.163 directly against other comprehensive income related to hedging of expected future cash flow. On 31 December 2020, the Group held the following instruments to hedge exposure to changes in foreign currency:
When the expected cash flow is translated into an item in the balance sheet or actually takes place, the recorded profit or loss which has been booked directly against the equity is reversed and included in the income statement together with the actual hedged object. Any non-effective part of the hedge is booked as currency loss or gain under financial items in the income statement. In the long run it is not possible to hedge the effects of changing currency rates. In 2020 the Group had export sales of MNOK 261 of products which predominantly had its cost base in NOK. A 10% strengthening of the NOK would then decrease the earnings with about MNOK 26.1 before possible price increases in the market. Approximately 8% of this exposure was related to sales in GBP (sales in UK), 50% related to sales in USD (sales in South America) and 18% related to sales in CAD (sales in Canada). To decrease this exposure the Group is working towards a more flexible cost structure and have more diversified costs in terms of currencies. Foreign currency sensitivity In the management of foreign currency risk, the Group seeks to reduce the effect from currency rate changes on monetary assets and liabilities as well as the value of the future cash flows denominated in a foreign currency. Through the internal financing structure within the Group, most of the monetary asset and liability risk is allocated to the parent company, which also has most of the cash flow risk with regards to currency fluctuation. The major currencies in 2020 are EUR, CAD, and USD. Below it is made a partial analysis in order to do an estimate of the impact from a change in EUR, CAD, and USD on the pre-tax profit and on the book equity at year end. The effect of net investment in subsidiaries are not included in the analysis.
1-3 months 4-12 months >12 monthsNet exposure (in 1 000 NOK) 25 959 2 926 -11 007
Average NOK:EUR forward contract rate 10,69 11,03 10,54
Average NOK:USD forward contract rate 9,82 10,95
Average NOK:CAD forward contract rate 6,85 6,96
Forward currency contractsMaturity
31.12.2020
EUR CAD USD EUR CAD USD
10 % -3 583 740 59 10 906 -3 485 -4 863
-10 % 3 583 -740 -59 -10 906 3 485 4 863
31.12.2019
EUR GBP TRY EUR GBP USD
10 % 6 179 2 700 904 2 142 -1 005 3 677
-10 % -6 179 -2 700 -904 -2 142 1 005 -3 677
KNOK effect on profit before tax
KNOK effect on profit before tax KNOK effect on book equity
KNOK effect on book equity
by +10%/-10% change in by +10%/-10% change in
by +10%/-10% change in by +10%/-10% change in
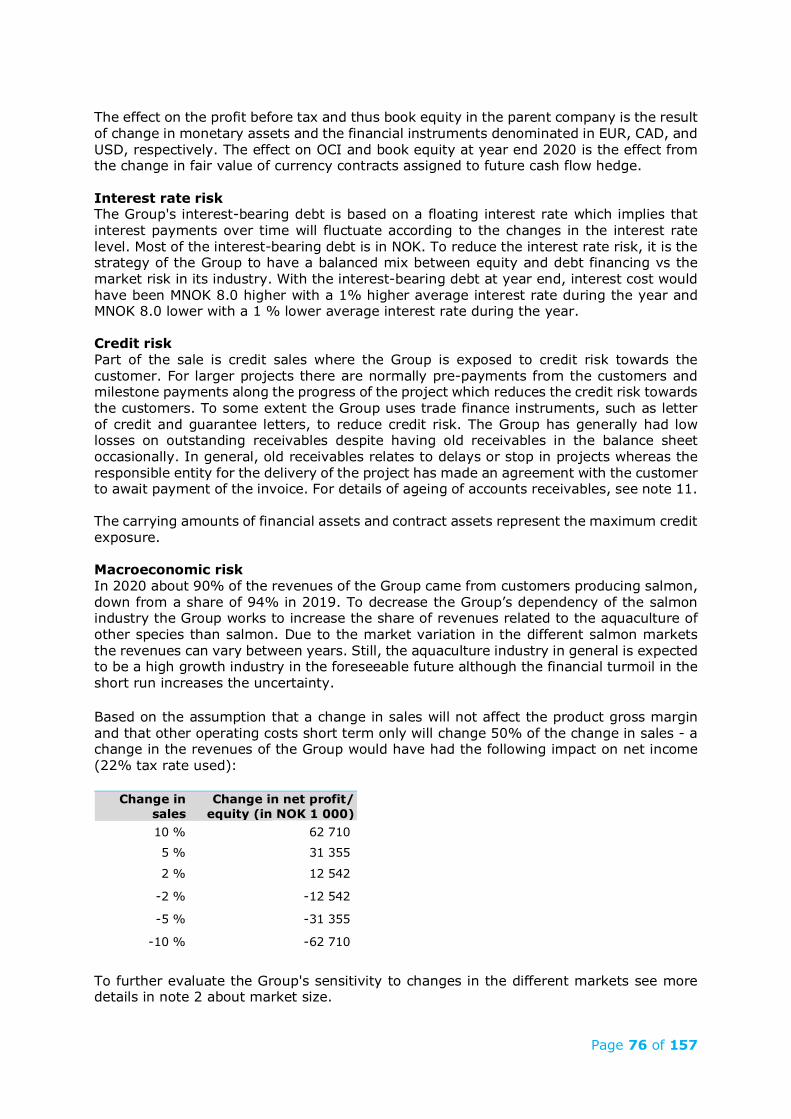
Page 76 of 157
The effect on the profit before tax and thus book equity in the parent company is the result of change in monetary assets and the financial instruments denominated in EUR, CAD, and USD, respectively. The effect on OCI and book equity at year end 2020 is the effect from the change in fair value of currency contracts assigned to future cash flow hedge. Interest rate risk The Group's interest-bearing debt is based on a floating interest rate which implies that interest payments over time will fluctuate according to the changes in the interest rate level. Most of the interest-bearing debt is in NOK. To reduce the interest rate risk, it is the strategy of the Group to have a balanced mix between equity and debt financing vs the market risk in its industry. With the interest-bearing debt at year end, interest cost would have been MNOK 8.0 higher with a 1% higher average interest rate during the year and MNOK 8.0 lower with a 1 % lower average interest rate during the year. Credit risk Part of the sale is credit sales where the Group is exposed to credit risk towards the customer. For larger projects there are normally pre-payments from the customers and milestone payments along the progress of the project which reduces the credit risk towards the customers. To some extent the Group uses trade finance instruments, such as letter of credit and guarantee letters, to reduce credit risk. The Group has generally had low losses on outstanding receivables despite having old receivables in the balance sheet occasionally. In general, old receivables relates to delays or stop in projects whereas the responsible entity for the delivery of the project has made an agreement with the customer to await payment of the invoice. For details of ageing of accounts receivables, see note 11. The carrying amounts of financial assets and contract assets represent the maximum credit exposure. Macroeconomic risk In 2020 about 90% of the revenues of the Group came from customers producing salmon, down from a share of 94% in 2019. To decrease the Group’s dependency of the salmon industry the Group works to increase the share of revenues related to the aquaculture of other species than salmon. Due to the market variation in the different salmon markets the revenues can vary between years. Still, the aquaculture industry in general is expected to be a high growth industry in the foreseeable future although the financial turmoil in the short run increases the uncertainty. Based on the assumption that a change in sales will not affect the product gross margin and that other operating costs short term only will change 50% of the change in sales - a change in the revenues of the Group would have had the following impact on net income (22% tax rate used):
To further evaluate the Group's sensitivity to changes in the different markets see more details in note 2 about market size.
Change in sales10 % 62 710
5 % 31 355
2 % 12 542
-2 % -12 542
-5 % -31 355
-10 % -62 710
Change in net profit/ equity (in NOK 1 000)
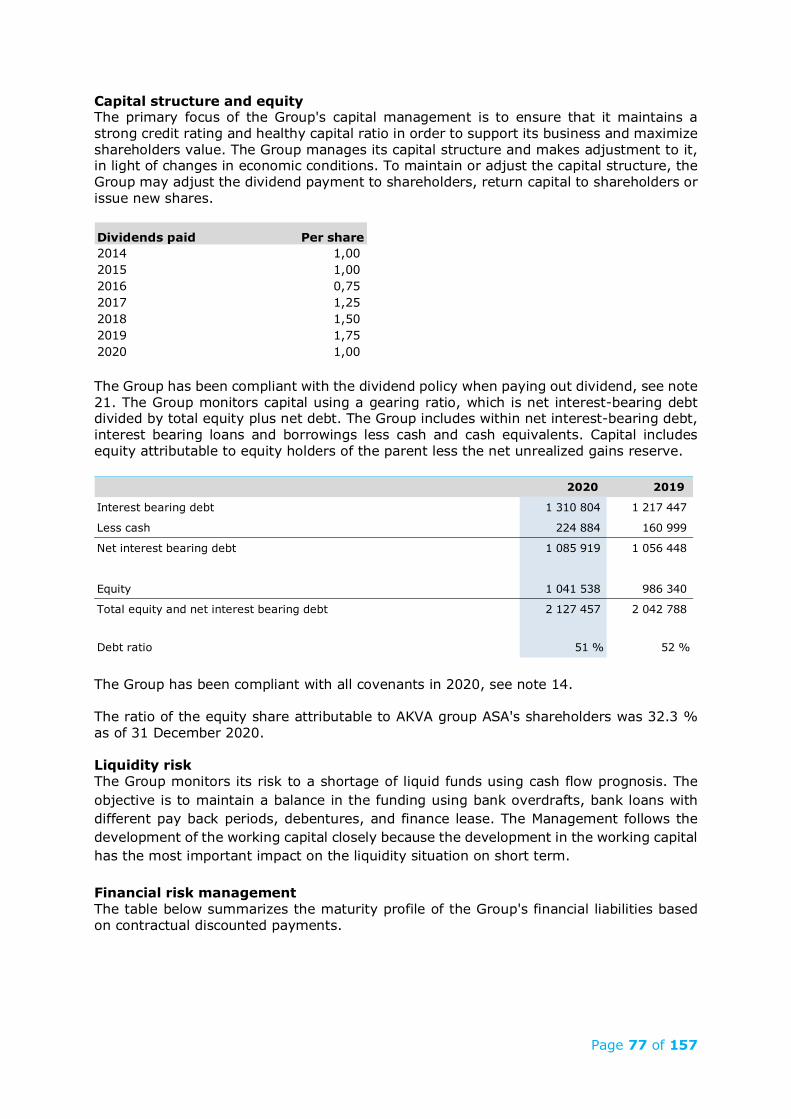
Page 77 of 157
Capital structure and equity The primary focus of the Group's capital management is to ensure that it maintains a strong credit rating and healthy capital ratio in order to support its business and maximize shareholders value. The Group manages its capital structure and makes adjustment to it, in light of changes in economic conditions. To maintain or adjust the capital structure, the Group may adjust the dividend payment to shareholders, return capital to shareholders or issue new shares.
The Group has been compliant with the dividend policy when paying out dividend, see note 21. The Group monitors capital using a gearing ratio, which is net interest-bearing debt divided by total equity plus net debt. The Group includes within net interest-bearing debt, interest bearing loans and borrowings less cash and cash equivalents. Capital includes equity attributable to equity holders of the parent less the net unrealized gains reserve.
The Group has been compliant with all covenants in 2020, see note 14. The ratio of the equity share attributable to AKVA group ASA's shareholders was 32.3 % as of 31 December 2020. Liquidity risk The Group monitors its risk to a shortage of liquid funds using cash flow prognosis. The objective is to maintain a balance in the funding using bank overdrafts, bank loans with different pay back periods, debentures, and finance lease. The Management follows the development of the working capital closely because the development in the working capital has the most important impact on the liquidity situation on short term. Financial risk management The table below summarizes the maturity profile of the Group's financial liabilities based on contractual discounted payments.
Dividends paid Per share2014 1,00 2015 1,00 2016 0,75 2017 1,25 2018 1,50 2019 1,75 2020 1,00
2020 2019
Interest bearing debt 1 310 804 1 217 447
Less cash 224 884 160 999
Net interest bearing debt 1 085 919 1 056 448
Equity 1 041 538 986 340
Total equity and net interest bearing debt 2 127 457 2 042 788
Debt ratio 51 % 52 %
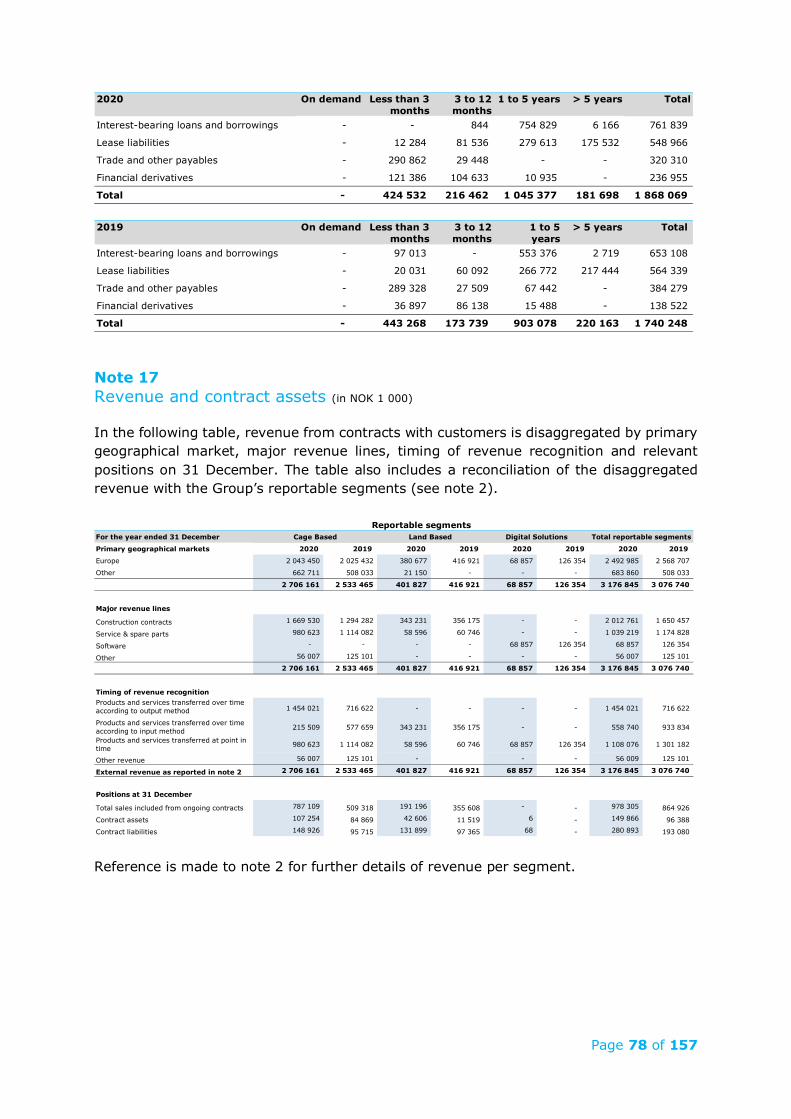
Page 78 of 157
Note 17 Revenue and contract assets (in NOK 1 000) In the following table, revenue from contracts with customers is disaggregated by primary geographical market, major revenue lines, timing of revenue recognition and relevant positions on 31 December. The table also includes a reconciliation of the disaggregated revenue with the Group’s reportable segments (see note 2).
Reference is made to note 2 for further details of revenue per segment.
2020 On demand Less than 3 months
3 to 12 months
1 to 5 years > 5 years Total
Interest-bearing loans and borrowings - - 844 754 829 6 166 761 839
Lease liabilities - 12 284 81 536 279 613 175 532 548 966
Trade and other payables - 290 862 29 448 - - 320 310
Financial derivatives - 121 386 104 633 10 935 - 236 955
Total - 424 532 216 462 1 045 377 181 698 1 868 069
2019 On demand Less than 3 months
3 to 12 months
1 to 5 years
> 5 years Total
Interest-bearing loans and borrowings - 97 013 - 553 376 2 719 653 108
Lease liabilities - 20 031 60 092 266 772 217 444 564 339
Trade and other payables - 289 328 27 509 67 442 - 384 279
Financial derivatives - 36 897 86 138 15 488 - 138 522
Total - 443 268 173 739 903 078 220 163 1 740 248
For the year ended 31 December
Primary geographical markets 2020 2019 2020 2019 2020 2019 2020 2019
Europe 2 043 450 2 025 432 380 677 416 921 68 857 126 354 2 492 985 2 568 707
Other 662 711 508 033 21 150 - - - 683 860 508 033
2 706 161 2 533 465 401 827 416 921 68 857 126 354 3 176 845 3 076 740
Major revenue lines
Construction contracts 1 669 530 1 294 282 343 231 356 175 - - 2 012 761 1 650 457
Service & spare parts 980 623 1 114 082 58 596 60 746 - - 1 039 219 1 174 828
Software - - - - 68 857 126 354 68 857 126 354
Other 56 007 125 101 - - - - 56 007 125 101
2 706 161 2 533 465 401 827 416 921 68 857 126 354 3 176 845 3 076 740
Timing of revenue recognitionProducts and services transferred over time according to output method 1 454 021 716 622 - - - - 1 454 021 716 622
Products and services transferred over time according to input method 215 509 577 659 343 231 356 175 - - 558 740 933 834
Products and services transferred at point in time 980 623 1 114 082 58 596 60 746 68 857 126 354 1 108 076 1 301 182
Other revenue 56 007 125 101 - - - 56 009 125 101
External revenue as reported in note 2 2 706 161 2 533 465 401 827 416 921 68 857 126 354 3 176 845 3 076 740
Positions at 31 December
Total sales included from ongoing contracts 787 109 509 318 191 196 355 608 - - 978 305 864 926
Contract assets 107 254 84 869 42 606 11 519 6 - 149 866 96 388
Contract liabilities 148 926 95 715 131 899 97 365 68 - 280 893 193 080
Total reportable segmentsReportable segments
Cage Based Land Based Digital Solutions
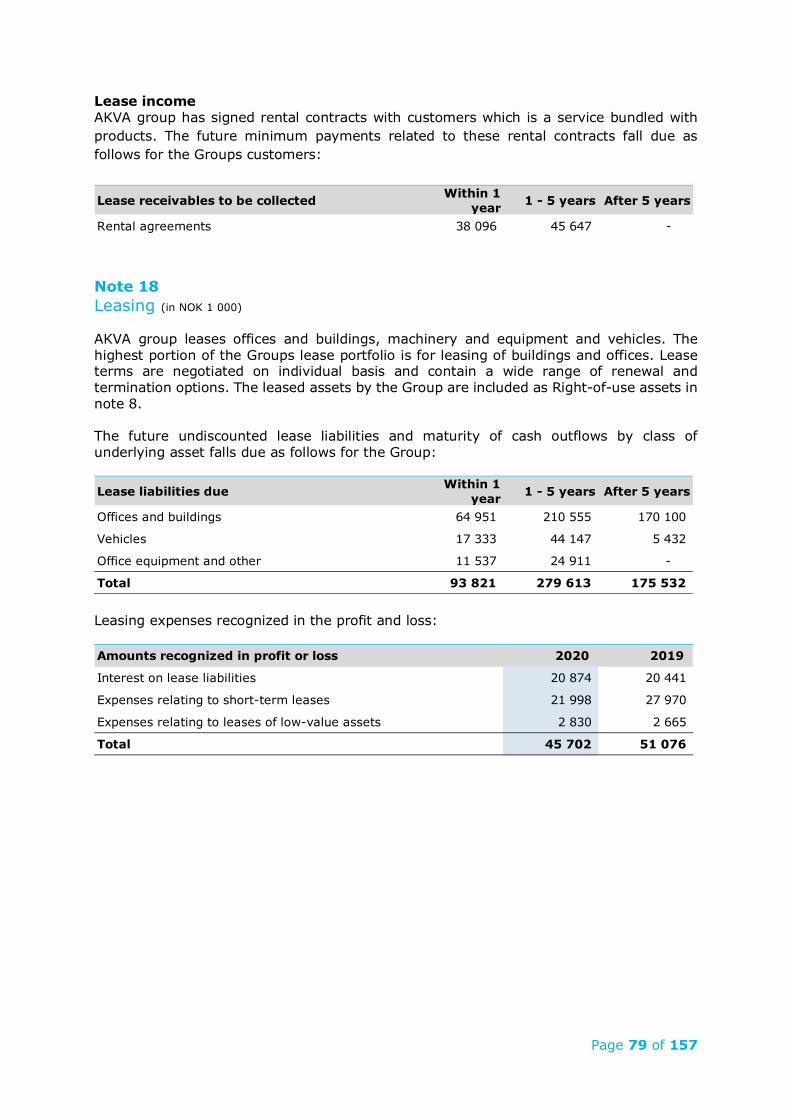
Page 79 of 157
Lease income AKVA group has signed rental contracts with customers which is a service bundled with products. The future minimum payments related to these rental contracts fall due as follows for the Groups customers:
Note 18 Leasing (in NOK 1 000) AKVA group leases offices and buildings, machinery and equipment and vehicles. The highest portion of the Groups lease portfolio is for leasing of buildings and offices. Lease terms are negotiated on individual basis and contain a wide range of renewal and termination options. The leased assets by the Group are included as Right-of-use assets in note 8. The future undiscounted lease liabilities and maturity of cash outflows by class of underlying asset falls due as follows for the Group:
Leasing expenses recognized in the profit and loss:
Lease receivables to be collected Within 1 year 1 - 5 years After 5 years
Rental agreements 38 096 45 647 -
Lease liabilities due Within 1 year 1 - 5 years After 5 years
Offices and buildings 64 951 210 555 170 100
Vehicles 17 333 44 147 5 432
Office equipment and other 11 537 24 911 -
Total 93 821 279 613 175 532
Amounts recognized in profit or loss 2020 2019
Interest on lease liabilities 20 874 20 441
Expenses relating to short-term leases 21 998 27 970
Expenses relating to leases of low-value assets 2 830 2 665
Total 45 702 51 076
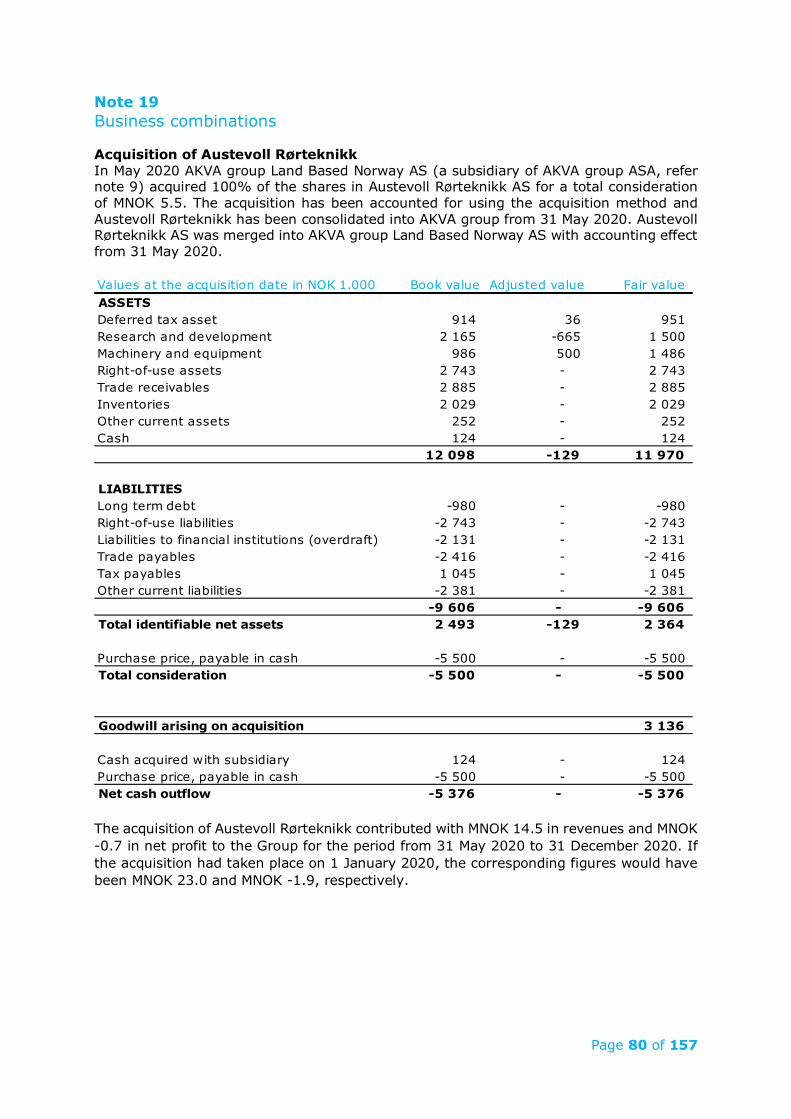
Page 80 of 157
Note 19 Business combinations Acquisition of Austevoll Rørteknikk In May 2020 AKVA group Land Based Norway AS (a subsidiary of AKVA group ASA, refer note 9) acquired 100% of the shares in Austevoll Rørteknikk AS for a total consideration of MNOK 5.5. The acquisition has been accounted for using the acquisition method and Austevoll Rørteknikk has been consolidated into AKVA group from 31 May 2020. Austevoll Rørteknikk AS was merged into AKVA group Land Based Norway AS with accounting effect from 31 May 2020.
The acquisition of Austevoll Rørteknikk contributed with MNOK 14.5 in revenues and MNOK -0.7 in net profit to the Group for the period from 31 May 2020 to 31 December 2020. If the acquisition had taken place on 1 January 2020, the corresponding figures would have been MNOK 23.0 and MNOK -1.9, respectively.
Values at the acquisition date in NOK 1.000 Book value Adjusted value Fair value ASSETSDeferred tax asset 914 36 951 Research and development 2 165 -665 1 500 Machinery and equipment 986 500 1 486 Right-of-use assets 2 743 - 2 743 Trade receivables 2 885 - 2 885 Inventories 2 029 - 2 029 Other current assets 252 - 252 Cash 124 - 124
12 098 -129 11 970
LIABILITIESLong term debt -980 - -980 Right-of-use liabilities -2 743 - -2 743 Liabilities to financial institutions (overdraft) -2 131 - -2 131 Trade payables -2 416 - -2 416 Tax payables 1 045 - 1 045 Other current liabilities -2 381 - -2 381
-9 606 - -9 606 Total identifiable net assets 2 493 -129 2 364
Purchase price, payable in cash -5 500 - -5 500 Total consideration -5 500 - -5 500
Goodwill arising on acquisition 3 136
Cash acquired with subsidiary 124 - 124 Purchase price, payable in cash -5 500 - -5 500 Net cash outflow -5 376 - -5 376
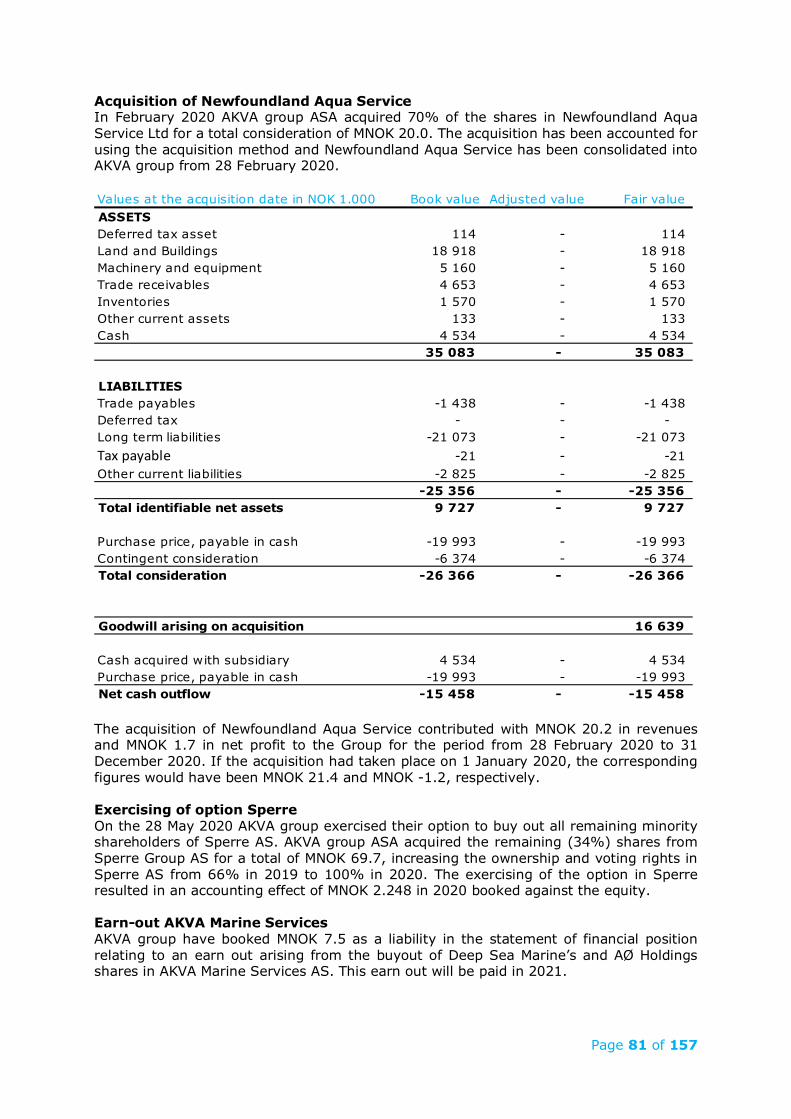
Page 81 of 157
Acquisition of Newfoundland Aqua Service In February 2020 AKVA group ASA acquired 70% of the shares in Newfoundland Aqua Service Ltd for a total consideration of MNOK 20.0. The acquisition has been accounted for using the acquisition method and Newfoundland Aqua Service has been consolidated into AKVA group from 28 February 2020.
The acquisition of Newfoundland Aqua Service contributed with MNOK 20.2 in revenues and MNOK 1.7 in net profit to the Group for the period from 28 February 2020 to 31 December 2020. If the acquisition had taken place on 1 January 2020, the corresponding figures would have been MNOK 21.4 and MNOK -1.2, respectively. Exercising of option Sperre On the 28 May 2020 AKVA group exercised their option to buy out all remaining minority shareholders of Sperre AS. AKVA group ASA acquired the remaining (34%) shares from Sperre Group AS for a total of MNOK 69.7, increasing the ownership and voting rights in Sperre AS from 66% in 2019 to 100% in 2020. The exercising of the option in Sperre resulted in an accounting effect of MNOK 2.248 in 2020 booked against the equity. Earn-out AKVA Marine Services AKVA group have booked MNOK 7.5 as a liability in the statement of financial position relating to an earn out arising from the buyout of Deep Sea Marine’s and AØ Holdings shares in AKVA Marine Services AS. This earn out will be paid in 2021.
Values at the acquisition date in NOK 1.000 Book value Adjusted value Fair value ASSETSDeferred tax asset 114 - 114 Land and Buildings 18 918 - 18 918 Machinery and equipment 5 160 - 5 160 Trade receivables 4 653 - 4 653 Inventories 1 570 - 1 570 Other current assets 133 - 133 Cash 4 534 - 4 534
35 083 - 35 083
LIABILITIESTrade payables -1 438 - -1 438 Deferred tax - - - Long term liabilities -21 073 - -21 073 Tax payable -21 - -21 Other current liabilities -2 825 - -2 825
-25 356 - -25 356 Total identifiable net assets 9 727 - 9 727
Purchase price, payable in cash -19 993 - -19 993 Contingent consideration -6 374 - -6 374 Total consideration -26 366 - -26 366
Goodwill arising on acquisition 16 639
Cash acquired with subsidiary 4 534 - 4 534 Purchase price, payable in cash -19 993 - -19 993 Net cash outflow -15 458 - -15 458
Page 82 of 157
Options Grading Systems The Minority Shareholders of Grading Systems Ltd has an option to sell to Egersund Net AS (subsidiary of AKVA group ASA, refer note 9) and Egersund Net AS has an option to purchase from the Minority Shareholders the remaining shares. The pricing is based on financial performance. The option is calculated at present value of the redemption amount. The liability is classified as other short-term liabilities in the statement of financial position. The estimated liability of MNOK 6.8 is accounted for based on a mutual option agreement between Egersund Net AS and Viking Atlantic AS to buy/sell the remaining 30% of the shares in Grading Systems Ltd. The pricing of the remaining 30% of the shares is linked to the performance of the company in 2018, 2019 and 2020. The option is exercisable in a limited period after the approval of the 2020 annual accounts of Grading Systems Ltd. Options Newfoundland Aqua Service The Minority Shareholders of Newfoundland Aqua Service Ltd has an option to sell to AKVA group ASA and AKVA group ASA has an option to purchase from the Minority Shareholders most of the remaining shares. The pricing is based on financial performance. The option is calculated at present value of the redemption amount. The liability is classified as other long-term liabilities in the statement of financial position. The estimated liability of MNOK 6.1 is accounted for based on a mutual option agreement between AKVA group ASA and to buy/sell 28% of the shares in Newfoundland Aqua Service Ltd. The pricing of the 28% of the shares is linked to the performance of the company in 2020, 2021 and 2022. The option is exercisable in a limited period after the approval of the 2022 annual accounts of Newfoundland Aqua Service Ltd. Note 20 Related parties (2019 figures in brackets) See consolidated accounts note 3 about remuneration to CEO and executive management and fees to the Board of Directors. Atlantis Subsea Farming AS (ASF) is a related party due to AKVA group ASA’s and Egersund Net’s ownership of 33% each of the shares in ASF. The Group has as part of their role in ASF recorded revenues from ASF of MNOK 3.3 (6.5) in 2020. The outstanding balance towards ASF on 31 December 2020 was a receivable of MNOK 0.9 (1.3). Centre of Aquaculture Competence AS (CAC) is a related party due to AKVA group ASA’s ownership of 33% of the shares in CAC. The Group has as part of their role in CAC recorded revenues from CAC of MNOK 1.5 (0.3) in 2020. The outstanding balance towards CAC on 31 December 2020 was a receivable of MNOK 1.7 (0.0). NOFI Oppdrettservice AS (NOFI) is a related party due to Egersund Net AS’s ownership of 50% of the shares in NOFI. The Group has as part of their role in NOFI recorded revenues from NOFI of MNOK 4.6 (1.9) in 2020. The outstanding balance towards NOFI on 31 December 2020 was a receivable of MNOK 1.2 (0.1) and a payable of MNOK 1.9 (0.0). Emel Balik is a related party due to Egersund Net AS’s ownership of 50% of the shares in the company. The Group has as part of their role in Emel Balik recorded revenues from the company of MNOK 29.4 (3.7) in 2020. The outstanding balance towards Emel Balik on 31 December 2020 was a receivable of MNOK 4.3 (0.0).
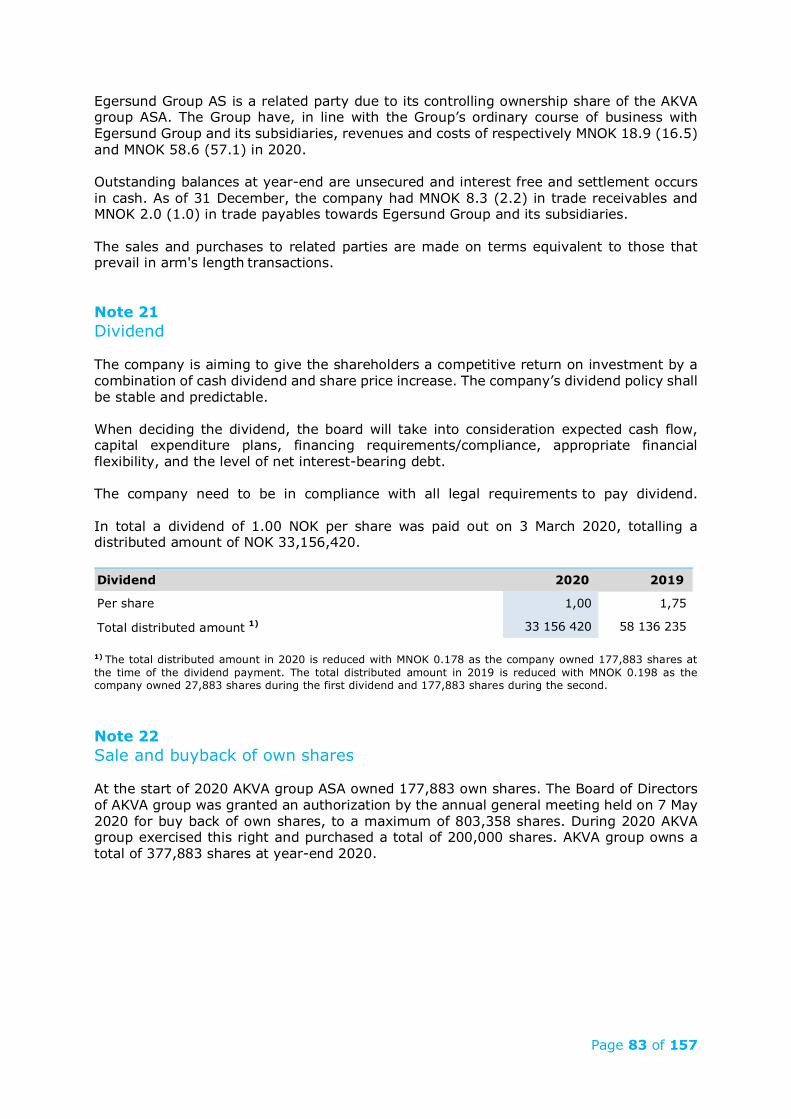
Page 83 of 157
Egersund Group AS is a related party due to its controlling ownership share of the AKVA group ASA. The Group have, in line with the Group’s ordinary course of business with Egersund Group and its subsidiaries, revenues and costs of respectively MNOK 18.9 (16.5) and MNOK 58.6 (57.1) in 2020. Outstanding balances at year-end are unsecured and interest free and settlement occurs in cash. As of 31 December, the company had MNOK 8.3 (2.2) in trade receivables and MNOK 2.0 (1.0) in trade payables towards Egersund Group and its subsidiaries. The sales and purchases to related parties are made on terms equivalent to those that prevail in arm's length transactions. Note 21 Dividend The company is aiming to give the shareholders a competitive return on investment by a combination of cash dividend and share price increase. The company’s dividend policy shall be stable and predictable. When deciding the dividend, the board will take into consideration expected cash flow, capital expenditure plans, financing requirements/compliance, appropriate financial flexibility, and the level of net interest-bearing debt. The company need to be in compliance with all legal requirements to pay dividend. In total a dividend of 1.00 NOK per share was paid out on 3 March 2020, totalling a distributed amount of NOK 33,156,420.
1) The total distributed amount in 2020 is reduced with MNOK 0.178 as the company owned 177,883 shares at the time of the dividend payment. The total distributed amount in 2019 is reduced with MNOK 0.198 as the company owned 27,883 shares during the first dividend and 177,883 shares during the second. Note 22 Sale and buyback of own shares At the start of 2020 AKVA group ASA owned 177,883 own shares. The Board of Directors of AKVA group was granted an authorization by the annual general meeting held on 7 May 2020 for buy back of own shares, to a maximum of 803,358 shares. During 2020 AKVA group exercised this right and purchased a total of 200,000 shares. AKVA group owns a total of 377,883 shares at year-end 2020.
Dividend 2020 2019
Per share 1,00 1,75
Total distributed amount 1) 33 156 420 58 136 235
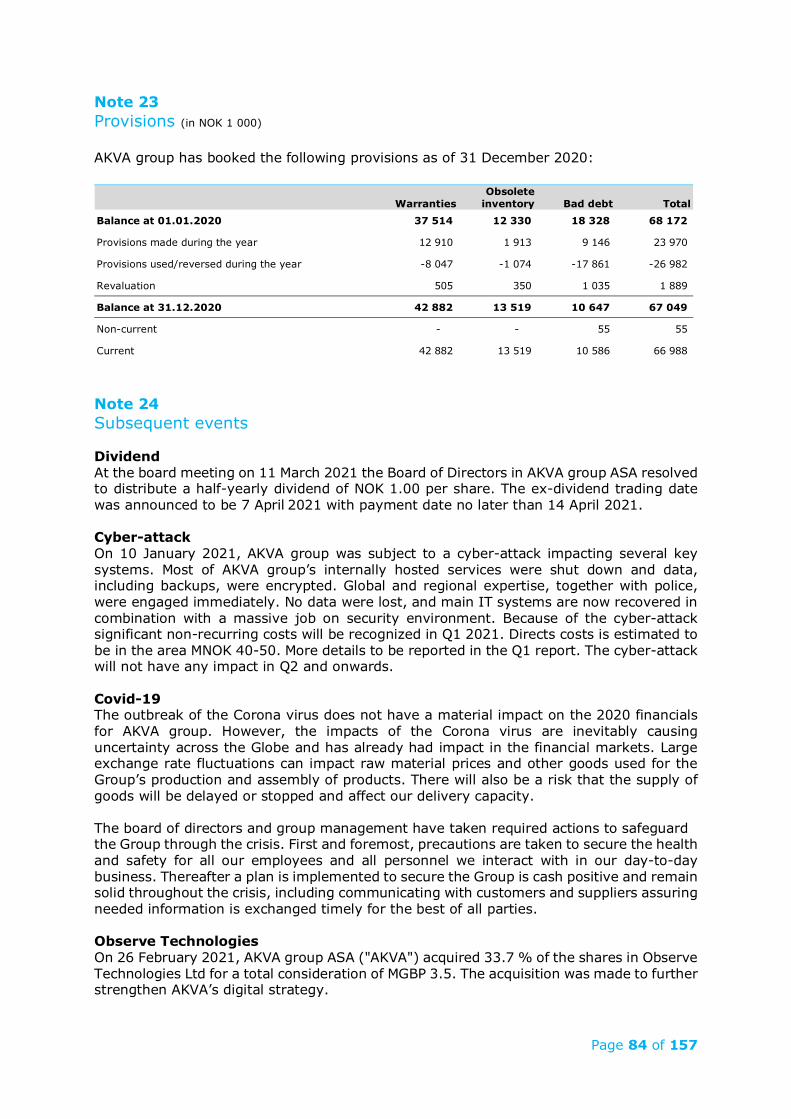
Page 84 of 157
Note 23 Provisions (in NOK 1 000) AKVA group has booked the following provisions as of 31 December 2020:
Note 24 Subsequent events Dividend At the board meeting on 11 March 2021 the Board of Directors in AKVA group ASA resolved to distribute a half-yearly dividend of NOK 1.00 per share. The ex-dividend trading date was announced to be 7 April 2021 with payment date no later than 14 April 2021. Cyber-attack On 10 January 2021, AKVA group was subject to a cyber-attack impacting several key systems. Most of AKVA group’s internally hosted services were shut down and data, including backups, were encrypted. Global and regional expertise, together with police, were engaged immediately. No data were lost, and main IT systems are now recovered in combination with a massive job on security environment. Because of the cyber-attack significant non-recurring costs will be recognized in Q1 2021. Directs costs is estimated to be in the area MNOK 40-50. More details to be reported in the Q1 report. The cyber-attack will not have any impact in Q2 and onwards. Covid-19 The outbreak of the Corona virus does not have a material impact on the 2020 financials for AKVA group. However, the impacts of the Corona virus are inevitably causing uncertainty across the Globe and has already had impact in the financial markets. Large exchange rate fluctuations can impact raw material prices and other goods used for the Group’s production and assembly of products. There will also be a risk that the supply of goods will be delayed or stopped and affect our delivery capacity. The board of directors and group management have taken required actions to safeguard the Group through the crisis. First and foremost, precautions are taken to secure the health and safety for all our employees and all personnel we interact with in our day-to-day business. Thereafter a plan is implemented to secure the Group is cash positive and remain solid throughout the crisis, including communicating with customers and suppliers assuring needed information is exchanged timely for the best of all parties. Observe Technologies On 26 February 2021, AKVA group ASA ("AKVA") acquired 33.7 % of the shares in Observe Technologies Ltd for a total consideration of MGBP 3.5. The acquisition was made to further strengthen AKVA’s digital strategy.
WarrantiesObsolete
inventory Bad debt TotalBalance at 01.01.2020 37 514 12 330 18 328 68 172
Provisions made during the year 12 910 1 913 9 146 23 970
Provisions used/reversed during the year -8 047 -1 074 -17 861 -26 982
Revaluation 505 350 1 035 1 889
Balance at 31.12.2020 42 882 13 519 10 647 67 049
Non-current - - 55 55
Current 42 882 13 519 10 586 66 988
Page 85 of 157
AKVA group ASA Financial Statements and notes
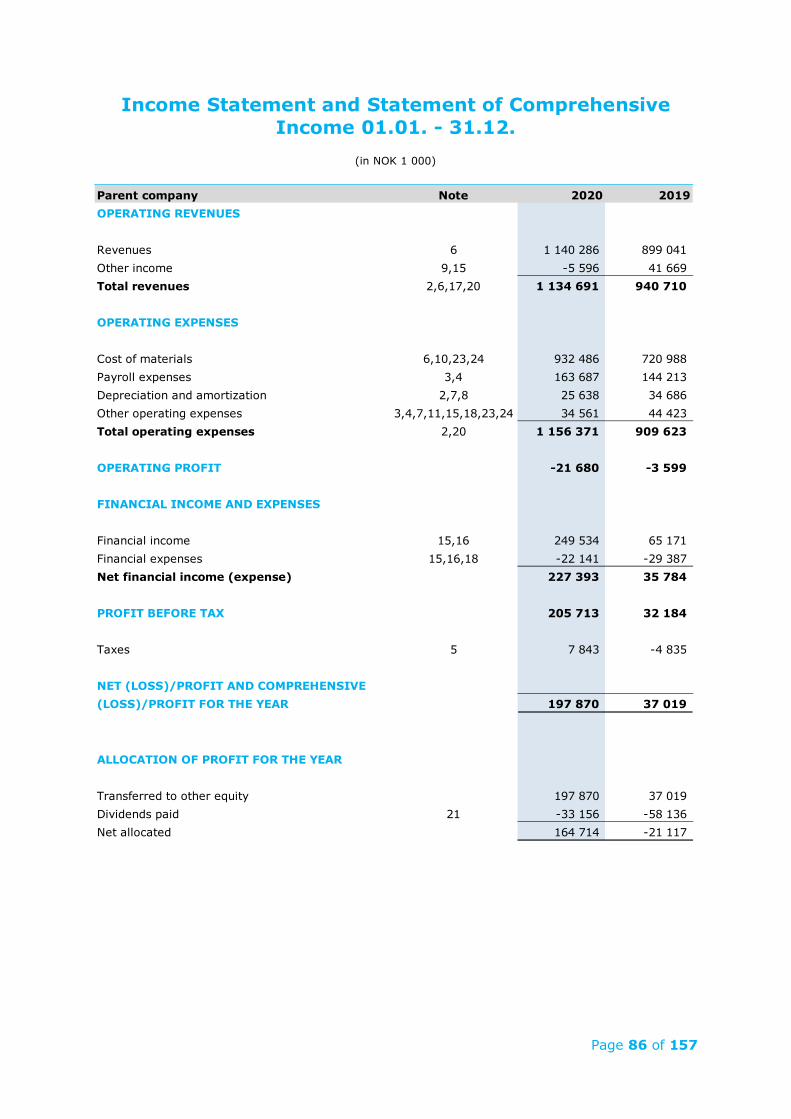
Page 86 of 157
Income Statement and Statement of Comprehensive Income 01.01. - 31.12.
(in NOK 1 000)
Parent company Note 2020 2019OPERATING REVENUES
Revenues 6 1 140 286 899 041 Other income 9,15 -5 596 41 669 Total revenues 2,6,17,20 1 134 691 940 710
OPERATING EXPENSES
Cost of materials 6,10,23,24 932 486 720 988 Payroll expenses 3,4 163 687 144 213 Depreciation and amortization 2,7,8 25 638 34 686 Other operating expenses 3,4,7,11,15,18,23,24 34 561 44 423 Total operating expenses 2,20 1 156 371 909 623
OPERATING PROFIT -21 680 -3 599
FINANCIAL INCOME AND EXPENSES
Financial income 15,16 249 534 65 171 Financial expenses 15,16,18 -22 141 -29 387 Net financial income (expense) 227 393 35 784
PROFIT BEFORE TAX 205 713 32 184
Taxes 5 7 843 -4 835
NET (LOSS)/PROFIT AND COMPREHENSIVE(LOSS)/PROFIT FOR THE YEAR 197 870 37 019
ALLOCATION OF PROFIT FOR THE YEAR
Transferred to other equity 197 870 37 019 Dividends paid 21 -33 156 -58 136 Net allocated 164 714 -21 117
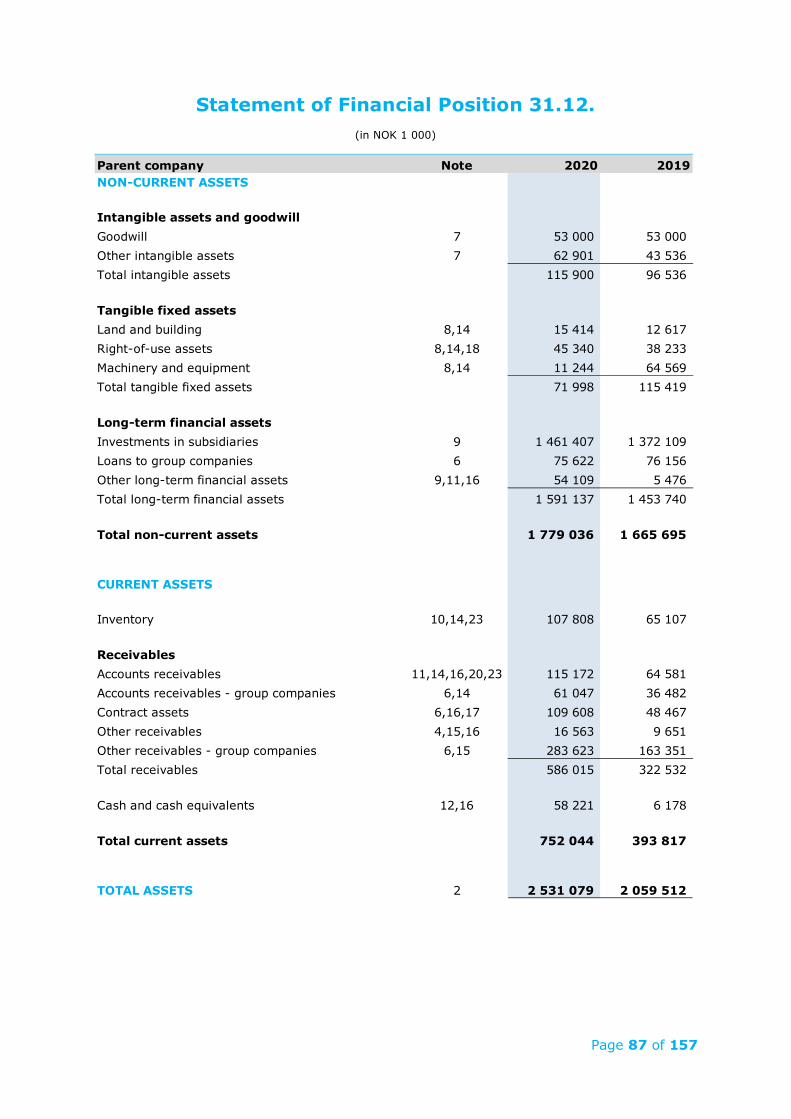
Page 87 of 157
Statement of Financial Position 31.12.
(in NOK 1 000)
Parent company Note 2020 2019NON-CURRENT ASSETS
Intangible assets and goodwillGoodwill 7 53 000 53 000 Other intangible assets 7 62 901 43 536 Total intangible assets 115 900 96 536
Tangible fixed assetsLand and building 8,14 15 414 12 617 Right-of-use assets 8,14,18 45 340 38 233 Machinery and equipment 8,14 11 244 64 569 Total tangible fixed assets 71 998 115 419
Long-term financial assetsInvestments in subsidiaries 9 1 461 407 1 372 109 Loans to group companies 6 75 622 76 156 Other long-term financial assets 9,11,16 54 109 5 476 Total long-term financial assets 1 591 137 1 453 740
Total non-current assets 1 779 036 1 665 695
CURRENT ASSETS
Inventory 10,14,23 107 808 65 107
Receivables Accounts receivables 11,14,16,20,23 115 172 64 581 Accounts receivables - group companies 6,14 61 047 36 482 Contract assets 6,16,17 109 608 48 467 Other receivables 4,15,16 16 563 9 651 Other receivables - group companies 6,15 283 623 163 351 Total receivables 586 015 322 532
Cash and cash equivalents 12,16 58 221 6 178 Total current assets 752 044 393 817
TOTAL ASSETS 2 2 531 079 2 059 512
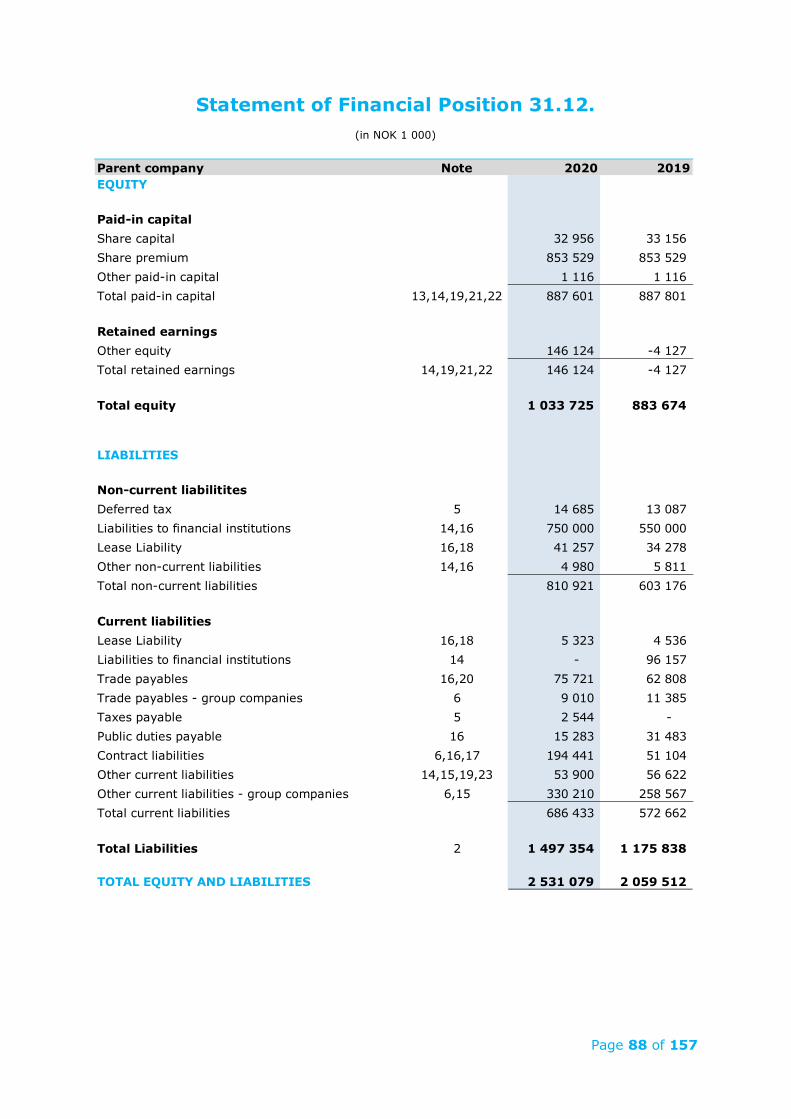
Page 88 of 157
Statement of Financial Position 31.12.
(in NOK 1 000)
Parent company Note 2020 2019EQUITY
Paid-in capitalShare capital 32 956 33 156 Share premium 853 529 853 529 Other paid-in capital 1 116 1 116 Total paid-in capital 13,14,19,21,22 887 601 887 801
Retained earningsOther equity 146 124 -4 127 Total retained earnings 14,19,21,22 146 124 -4 127 Total equity 1 033 725 883 674
LIABILITIES
Non-current liabilititesDeferred tax 5 14 685 13 087 Liabilities to financial institutions 14,16 750 000 550 000 Lease Liability 16,18 41 257 34 278 Other non-current liabilities 14,16 4 980 5 811 Total non-current liabilities 810 921 603 176
Current liabilitiesLease Liability 16,18 5 323 4 536 Liabilities to financial institutions 14 - 96 157 Trade payables 16,20 75 721 62 808 Trade payables - group companies 6 9 010 11 385 Taxes payable 5 2 544 - Public duties payable 16 15 283 31 483 Contract liabilities 6,16,17 194 441 51 104 Other current liabilities 14,15,19,23 53 900 56 622 Other current liabilities - group companies 6,15 330 210 258 567 Total current liabilities 686 433 572 662
Total Liabilities 2 1 497 354 1 175 838
TOTAL EQUITY AND LIABILITIES 2 531 079 2 059 512
Page 89 of 157
Klepp, Norway, 14 April 2021
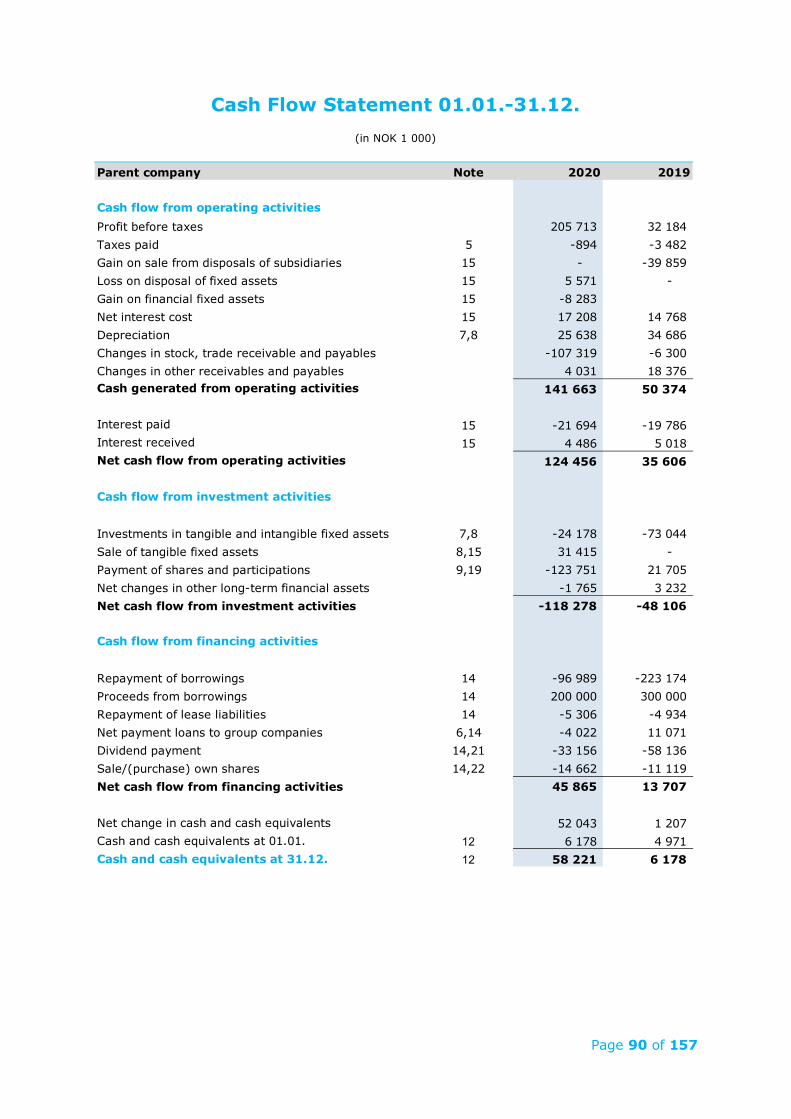
Page 90 of 157
Cash Flow Statement 01.01.-31.12. (in NOK 1 000)
Parent company Note 2020 2019
Cash flow from operating activitiesProfit before taxes 205 713 32 184 Taxes paid 5 -894 -3 482 Gain on sale from disposals of subsidiaries 15 - -39 859 Loss on disposal of fixed assets 15 5 571 - Gain on financial fixed assets 15 -8 283 Net interest cost 15 17 208 14 768 Depreciation 7,8 25 638 34 686 Changes in stock, trade receivable and payables -107 319 -6 300 Changes in other receivables and payables 4 031 18 376 Cash generated from operating activities 141 663 50 374
Interest paid 15 -21 694 -19 786 Interest received 15 4 486 5 018 Net cash flow from operating activities 124 456 35 606
Cash flow from investment activities
Investments in tangible and intangible fixed assets 7,8 -24 178 -73 044 Sale of tangible fixed assets 8,15 31 415 - Payment of shares and participations 9,19 -123 751 21 705 Net changes in other long-term financial assets -1 765 3 232 Net cash flow from investment activities -118 278 -48 106
Cash flow from financing activities
Repayment of borrowings 14 -96 989 -223 174 Proceeds from borrowings 14 200 000 300 000 Repayment of lease liabilities 14 -5 306 -4 934 Net payment loans to group companies 6,14 -4 022 11 071 Dividend payment 14,21 -33 156 -58 136 Sale/(purchase) own shares 14,22 -14 662 -11 119 Net cash flow from financing activities 45 865 13 707
Net change in cash and cash equivalents 52 043 1 207 Cash and cash equivalents at 01.01. 12 6 178 4 971 Cash and cash equivalents at 31.12. 12 58 221 6 178
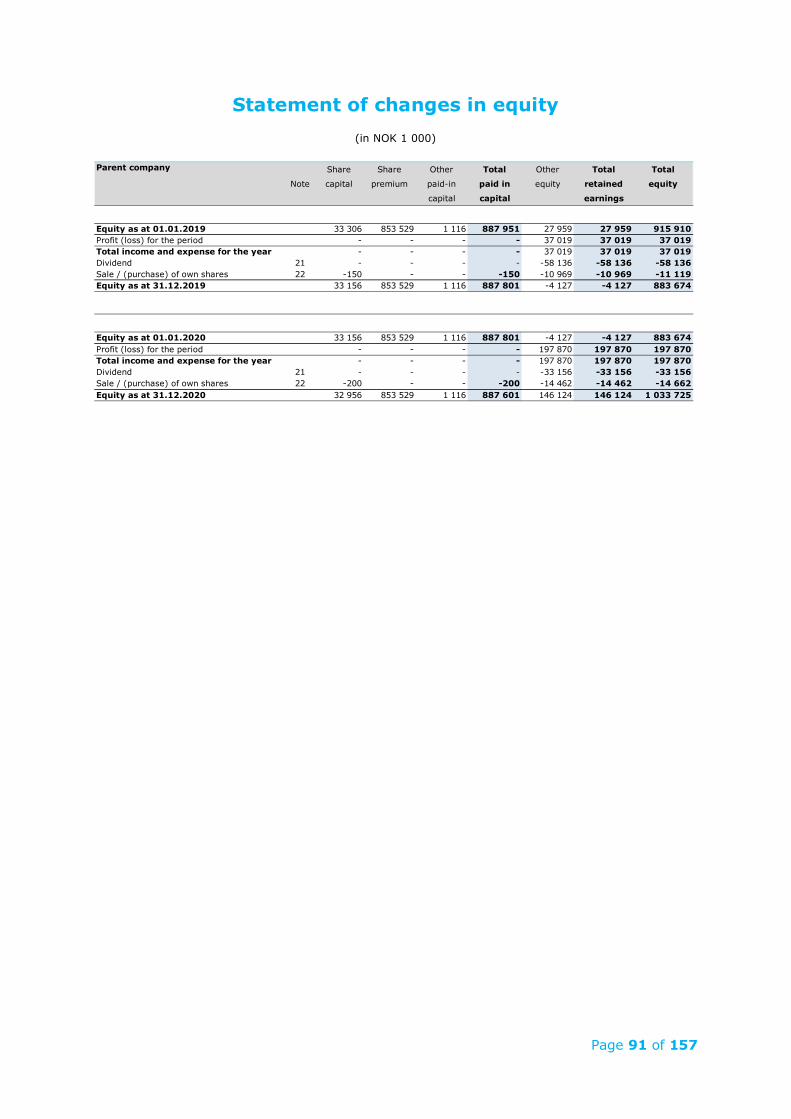
Page 91 of 157
Statement of changes in equity (in NOK 1 000)
Parent company Share Share Other Total Other Total Total
Note capital premium paid-in paid in equity retained equity
capital capital earnings
Equity as at 01.01.2019 33 306 853 529 1 116 887 951 27 959 27 959 915 910 Profit (loss) for the period - - - - 37 019 37 019 37 019 Total income and expense for the year - - - - 37 019 37 019 37 019 Dividend 21 - - - - -58 136 -58 136 -58 136 Sale / (purchase) of own shares 22 -150 - - -150 -10 969 -10 969 -11 119 Equity as at 31.12.2019 33 156 853 529 1 116 887 801 -4 127 -4 127 883 674
Equity as at 01.01.2020 33 156 853 529 1 116 887 801 -4 127 -4 127 883 674 Profit (loss) for the period - - - - 197 870 197 870 197 870 Total income and expense for the year - - - - 197 870 197 870 197 870 Dividend 21 - - - - -33 156 -33 156 -33 156 Sale / (purchase) of own shares 22 -200 - - -200 -14 462 -14 462 -14 662 Equity as at 31.12.2020 32 956 853 529 1 116 887 601 146 124 146 124 1 033 725
Page 92 of 157
Notes to the Financial Statements – AKVA group ASA
Contents 01 Summary of significant accounting policies 02 Segment information 03 Wages and remunerations 04 Government grants and subsidies 05 Taxes 06 Inter-company transactions and balances 07 Intangible assets 08 Tangible fixed assets 09 Subsidiaries and other long-term investments 10 Inventory 11 Receivables 12 Bank deposits 13 Shareholders 14 Loans and borrowings 15 Specification of items that are grouped in the financial statement 16 Financial instruments and risk management 17 Long-term construction contracts 18 Leasing 19 Business combinations 20 Related parties 21 Dividend 22 Sale and buyback of own shares 23 Provisions 24 Subsequent events
Page 93 of 157
Note 1 Summary of significant accounting policies AKVA group ASA is a public limited company registered in Norway. The Company's registered address is Svanavågveien 30, N-4374 Egersund, Norway. The financial statement for AKVA group ASA has been prepared in accordance with the Norwegian accounting Act’s §3-9 and the related regulation on simplified IFRS as approved by the Ministry of Finance on November 3rd, 2014. As a result, the principles for recognition and measurement applied when preparing the financial statements are according to International Financial Reporting Standards as adopted by EU (IFRS) and the disclosure notes have been prepared in accordance with the requirements of the Norwegian Accounting Act and accounting principles generally accepted in Norway (NGAAP). See note 1 in Group accounts for more details of the accounting policy. Subsidiaries are valued at cost in the company accounts. The investment is valued as cost of acquiring shares in the subsidiary, providing they are not impaired. Write down to recoverable amount will be carried out and recognized as a financial cost if an impairment is deemed necessary according to IFRS. Impairments are reversed when the indication no longer exist. Investments in associates are valued according to the equity method and recognized as other income. AKVA group ASA accounts for group contributions and dividends in the same fiscal year as the subsidiary receives/grants group contribution and dividends, in accordance with the exemption in the simplified IFRS accounting framework.
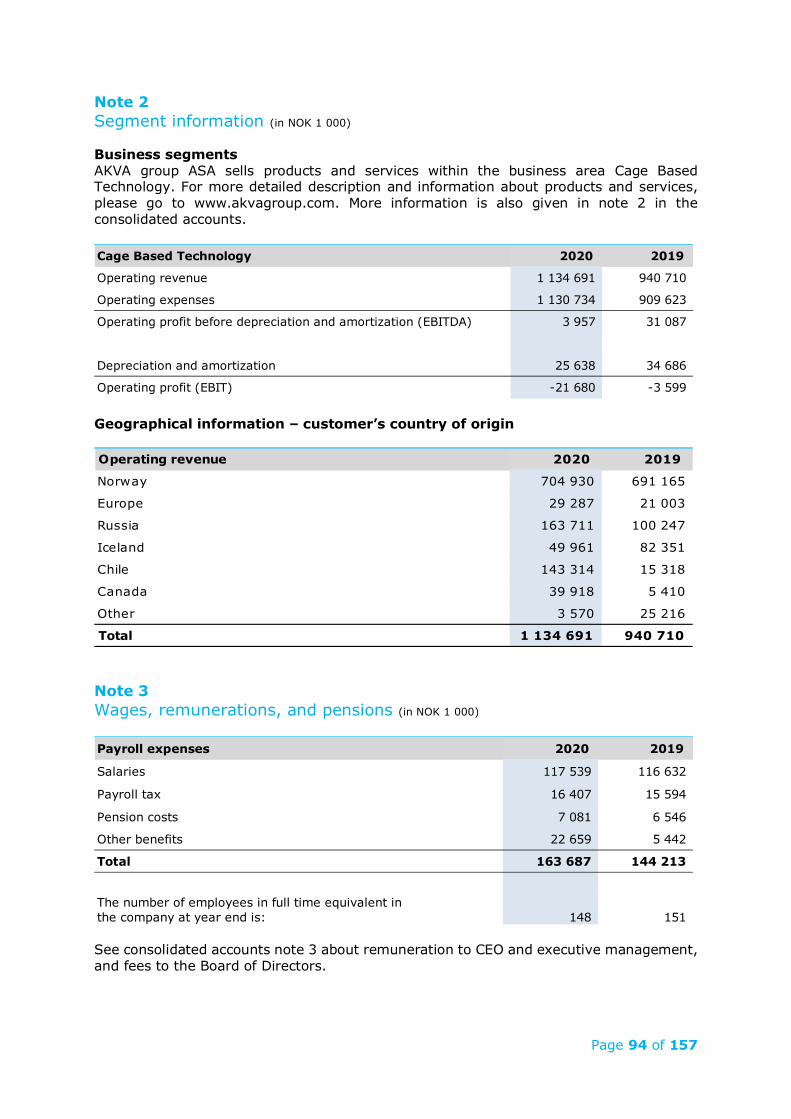
Page 94 of 157
Note 2 Segment information (in NOK 1 000) Business segments AKVA group ASA sells products and services within the business area Cage Based Technology. For more detailed description and information about products and services, please go to www.akvagroup.com. More information is also given in note 2 in the consolidated accounts.
Geographical information – customer’s country of origin
Note 3 Wages, remunerations, and pensions (in NOK 1 000)
See consolidated accounts note 3 about remuneration to CEO and executive management, and fees to the Board of Directors.
Cage Based Technology 2020 2019
Operating revenue 1 134 691 940 710
Operating expenses 1 130 734 909 623
Operating profit before depreciation and amortization (EBITDA) 3 957 31 087
Depreciation and amortization 25 638 34 686
Operating profit (EBIT) -21 680 -3 599
Operating revenue 2020 2019
Norway 704 930 691 165
Europe 29 287 21 003
Russia 163 711 100 247
Iceland 49 961 82 351
Chile 143 314 15 318
Canada 39 918 5 410
Other 3 570 25 216
Total 1 134 691 940 710
Payroll expenses 2020 2019
Salaries 117 539 116 632
Payroll tax 16 407 15 594
Pension costs 7 081 6 546
Other benefits 22 659 5 442
Total 163 687 144 213
The number of employees in full time equivalent in the company at year end is: 148 151
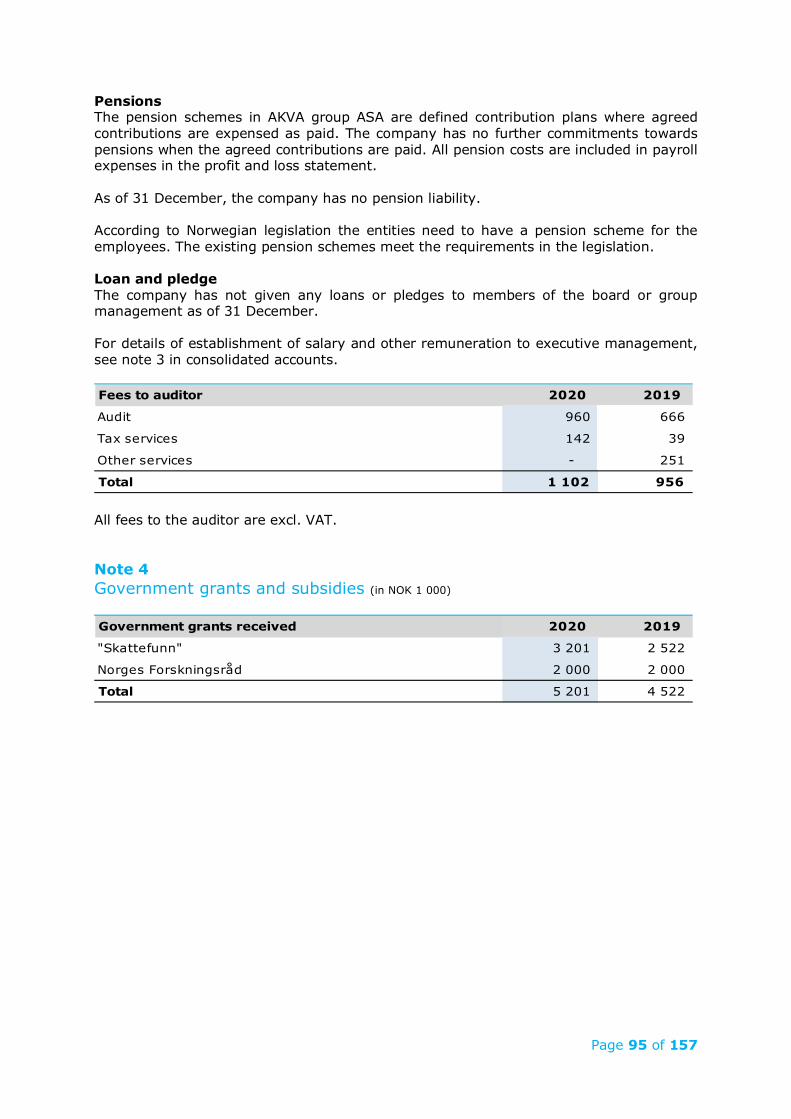
Page 95 of 157
Pensions The pension schemes in AKVA group ASA are defined contribution plans where agreed contributions are expensed as paid. The company has no further commitments towards pensions when the agreed contributions are paid. All pension costs are included in payroll expenses in the profit and loss statement. As of 31 December, the company has no pension liability. According to Norwegian legislation the entities need to have a pension scheme for the employees. The existing pension schemes meet the requirements in the legislation. Loan and pledge The company has not given any loans or pledges to members of the board or group management as of 31 December. For details of establishment of salary and other remuneration to executive management, see note 3 in consolidated accounts.
All fees to the auditor are excl. VAT. Note 4 Government grants and subsidies (in NOK 1 000)
Fees to auditor 2020 2019
Audit 960 666
Tax services 142 39
Other services - 251
Total 1 102 956
Government grants received 2020 2019
"Skattefunn" 3 201 2 522
Norges Forskningsråd 2 000 2 000
Total 5 201 4 522
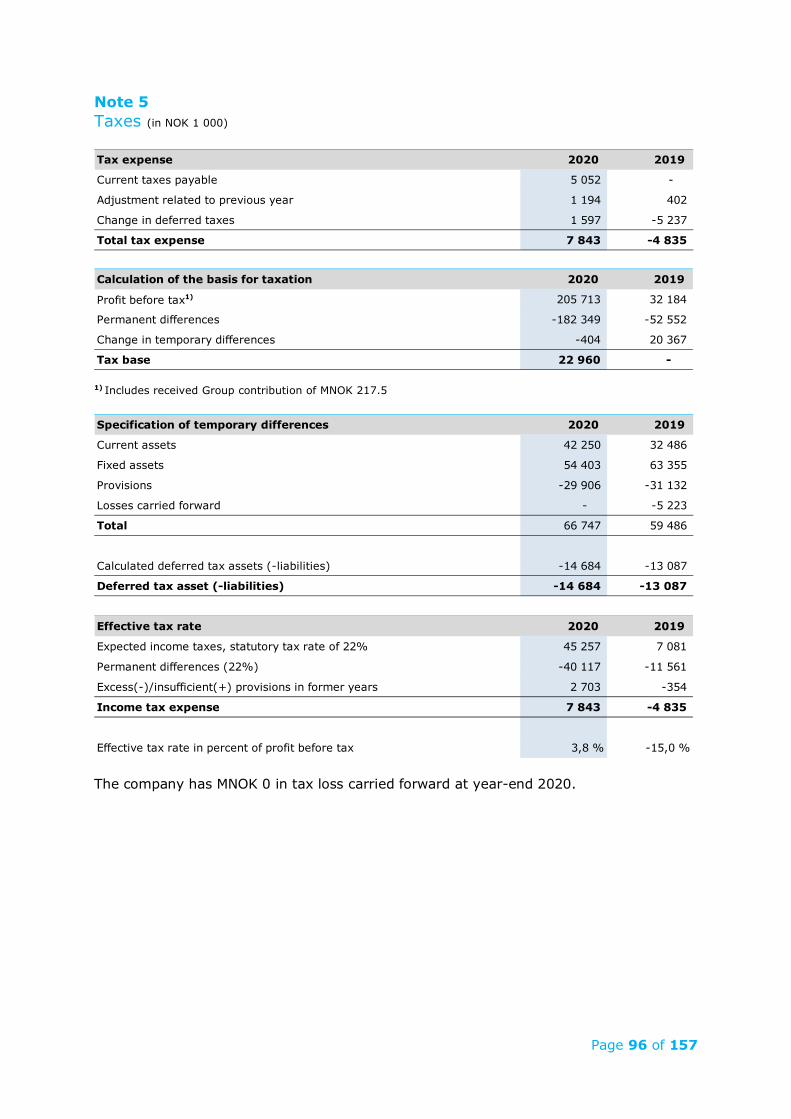
Page 96 of 157
Note 5 Taxes (in NOK 1 000)
1) Includes received Group contribution of MNOK 217.5
The company has MNOK 0 in tax loss carried forward at year-end 2020.
Tax expense 2020 2019
Current taxes payable 5 052 -
Adjustment related to previous year 1 194 402
Change in deferred taxes 1 597 -5 237
Total tax expense 7 843 -4 835
Calculation of the basis for taxation 2020 2019
Profit before tax1) 205 713 32 184
Permanent differences -182 349 -52 552
Change in temporary differences -404 20 367
Tax base 22 960 -
Specification of temporary differences 2020 2019
Current assets 42 250 32 486
Fixed assets 54 403 63 355
Provisions -29 906 -31 132
Losses carried forward - -5 223
Total 66 747 59 486
Calculated deferred tax assets (-liabilities) -14 684 -13 087
Deferred tax asset (-liabilities) -14 684 -13 087
Effective tax rate 2020 2019
Expected income taxes, statutory tax rate of 22% 45 257 7 081
Permanent differences (22%) -40 117 -11 561
Excess(-)/insufficient(+) provisions in former years 2 703 -354
Income tax expense 7 843 -4 835
Effective tax rate in percent of profit before tax 3,8 % -15,0 %
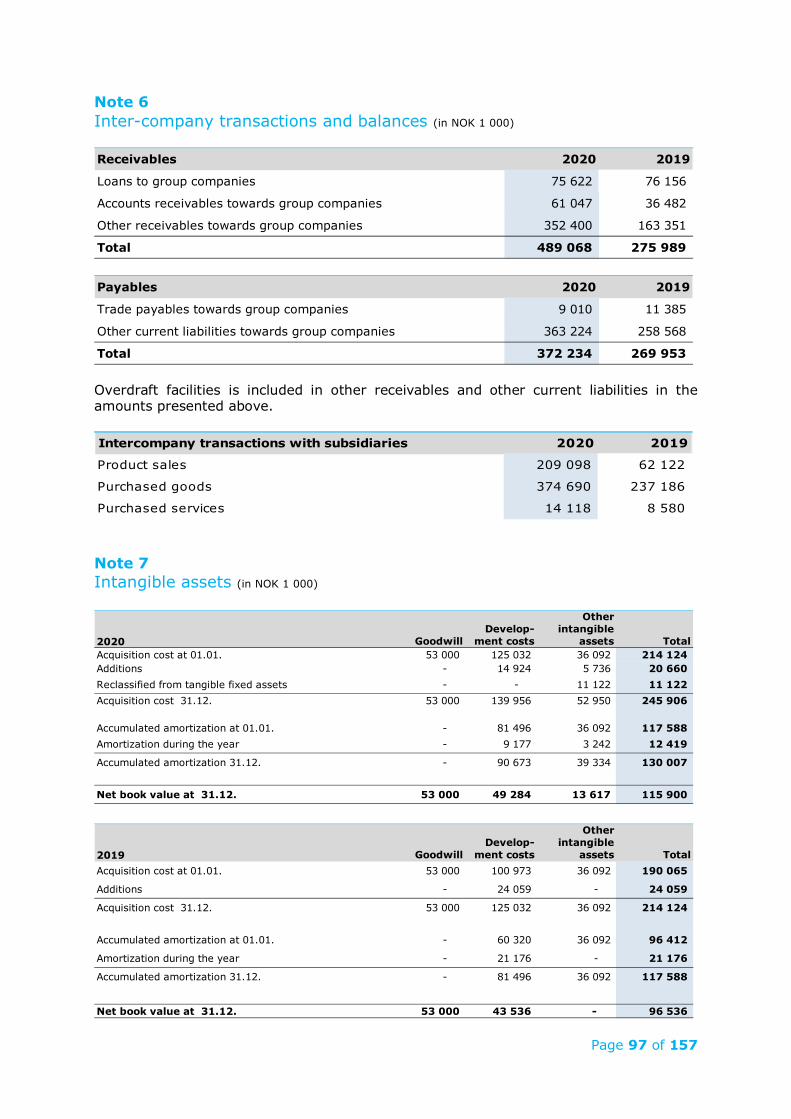
Page 97 of 157
Note 6 Inter-company transactions and balances (in NOK 1 000)
Overdraft facilities is included in other receivables and other current liabilities in the amounts presented above.
Note 7 Intangible assets (in NOK 1 000)
Receivables 2020 2019
Loans to group companies 75 622 76 156
Accounts receivables towards group companies 61 047 36 482
Other receivables towards group companies 352 400 163 351
Total 489 068 275 989
Payables 2020 2019
Trade payables towards group companies 9 010 11 385
Other current liabilities towards group companies 363 224 258 568
Total 372 234 269 953
Intercompany transactions with subsidiaries 2020 2019
Product sales 209 098 62 122
Purchased goods 374 690 237 186
Purchased services 14 118 8 580
2020 GoodwillDevelop-
ment costs
Other intangible
assets TotalAcquisition cost at 01.01. 53 000 125 032 36 092 214 124 Additions - 14 924 5 736 20 660 Reclassified from tangible fixed assets - - 11 122 11 122 Acquisition cost 31.12. 53 000 139 956 52 950 245 906
Accumulated amortization at 01.01. - 81 496 36 092 117 588 Amortization during the year - 9 177 3 242 12 419
Accumulated amortization 31.12. - 90 673 39 334 130 007
Net book value at 31.12. 53 000 49 284 13 617 115 900
2019 GoodwillDevelop-
ment costs
Other intangible
assets TotalAcquisition cost at 01.01. 53 000 100 973 36 092 190 065
Additions - 24 059 - 24 059
Acquisition cost 31.12. 53 000 125 032 36 092 214 124
Accumulated amortization at 01.01. - 60 320 36 092 96 412
Amortization during the year - 21 176 - 21 176
Accumulated amortization 31.12. - 81 496 36 092 117 588
Net book value at 31.12. 53 000 43 536 - 96 536
Page 98 of 157
Goodwill balances are not amortized. For remaining intangible assets, straight-line amortization over the asset’s useful economic life is applied. The useful economic life for the intangible assets is estimated as:
Development costs: 3-5 years Patents (included in other intangible assets): 20 years Trademarks (included in other intangible assets): 5 years Product rights (included in other intangible assets): 5-10 years Internal systems (included in other intangible assets): 5-10 years
During the year, the company expensed MNOK 23.8 (MNOK 19.1 in 2019) on research and development on new products and technology as well as upgrades on existing products. Goodwill: The goodwill balance is partly related to the merger with Maritech International AS and Idema Aqua AS and partly to the transfer of the aquaculture business from Helgeland Plast AS to AKVA group ASA, carried out in 2009. Development Costs: The company has capitalized all direct costs that are expected to create economic benefits and meet the requirements for capitalization in IAS 38. The capitalized costs relate to software solutions and modules for integrating equipment on fish farming sites, and improved product solutions to help the fish farming industry in becoming more efficient. Other intangible assets: Most of the net book value of other intangible assets relates to capitalized expenses related to the company’s new ERP-system.
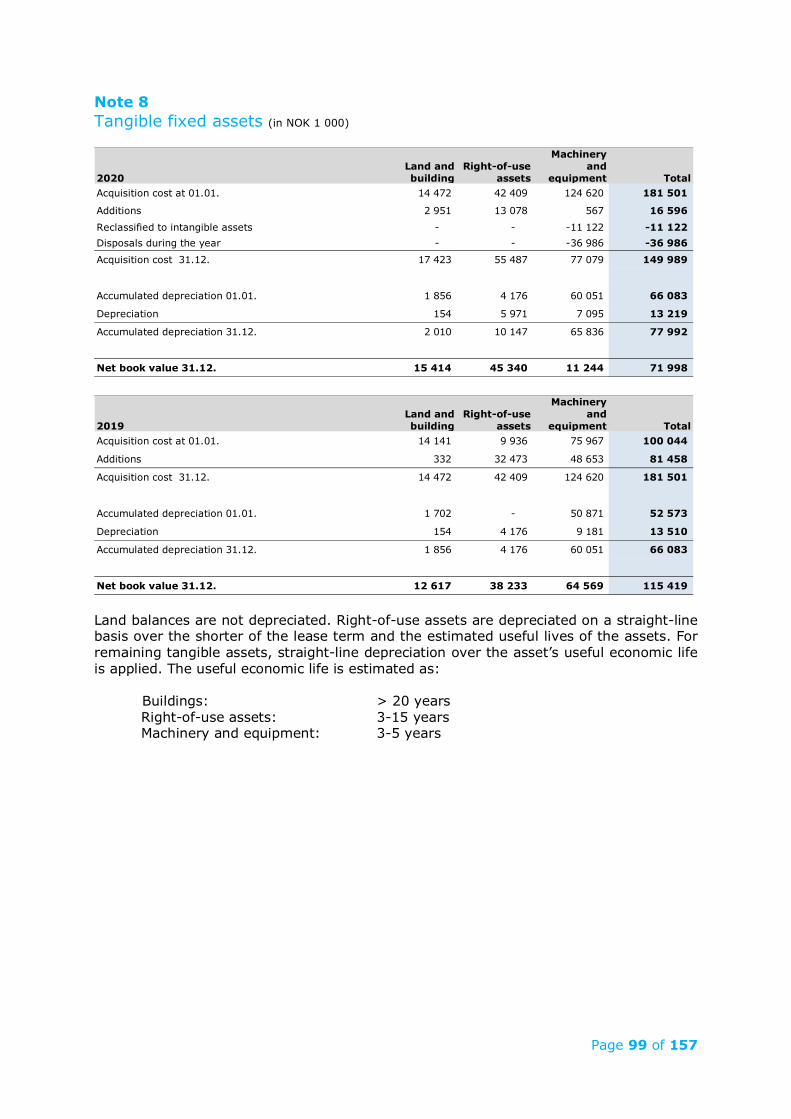
Page 99 of 157
Note 8 Tangible fixed assets (in NOK 1 000)
Land balances are not depreciated. Right-of-use assets are depreciated on a straight-line basis over the shorter of the lease term and the estimated useful lives of the assets. For remaining tangible assets, straight-line depreciation over the asset’s useful economic life is applied. The useful economic life is estimated as:
Buildings: > 20 years Right-of-use assets: 3-15 years Machinery and equipment: 3-5 years
2020Land and building
Right-of-use assets
Machinery and
equipment TotalAcquisition cost at 01.01. 14 472 42 409 124 620 181 501
Additions 2 951 13 078 567 16 596 Reclassified to intangible assets - - -11 122 -11 122 Disposals during the year - - -36 986 -36 986 Acquisition cost 31.12. 17 423 55 487 77 079 149 989
Accumulated depreciation 01.01. 1 856 4 176 60 051 66 083
Depreciation 154 5 971 7 095 13 219
Accumulated depreciation 31.12. 2 010 10 147 65 836 77 992
Net book value 31.12. 15 414 45 340 11 244 71 998
2019Land and building
Right-of-use assets
Machinery and
equipment TotalAcquisition cost at 01.01. 14 141 9 936 75 967 100 044
Additions 332 32 473 48 653 81 458
Acquisition cost 31.12. 14 472 42 409 124 620 181 501
Accumulated depreciation 01.01. 1 702 - 50 871 52 573
Depreciation 154 4 176 9 181 13 510
Accumulated depreciation 31.12. 1 856 4 176 60 051 66 083
Net book value 31.12. 12 617 38 233 64 569 115 419
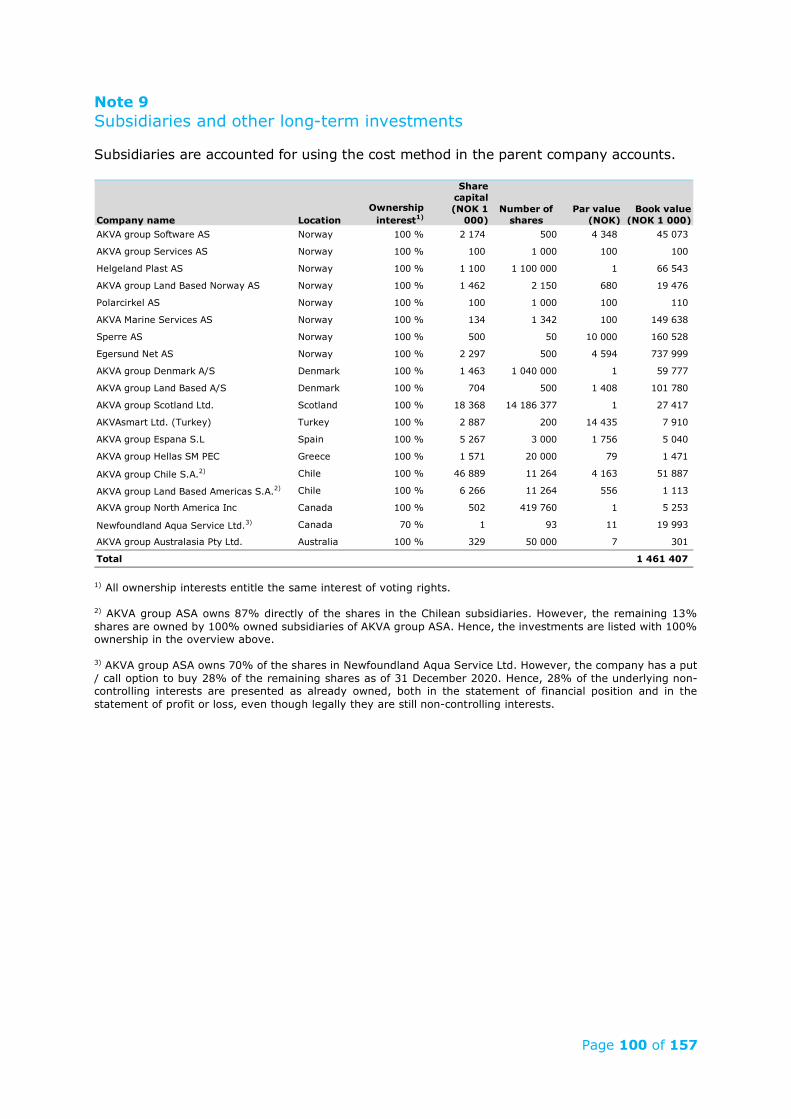
Page 100 of 157
Note 9 Subsidiaries and other long-term investments Subsidiaries are accounted for using the cost method in the parent company accounts.
1) All ownership interests entitle the same interest of voting rights. 2) AKVA group ASA owns 87% directly of the shares in the Chilean subsidiaries. However, the remaining 13% shares are owned by 100% owned subsidiaries of AKVA group ASA. Hence, the investments are listed with 100% ownership in the overview above. 3) AKVA group ASA owns 70% of the shares in Newfoundland Aqua Service Ltd. However, the company has a put / call option to buy 28% of the remaining shares as of 31 December 2020. Hence, 28% of the underlying non-controlling interests are presented as already owned, both in the statement of financial position and in the statement of profit or loss, even though legally they are still non-controlling interests.
Company name LocationOwnership
interest1)
Share capital (NOK 1
000)Number of
sharesPar value
(NOK)Book value
(NOK 1 000)AKVA group Software AS Norway 100 % 2 174 500 4 348 45 073
AKVA group Services AS Norway 100 % 100 1 000 100 100
Helgeland Plast AS Norway 100 % 1 100 1 100 000 1 66 543
AKVA group Land Based Norway AS Norway 100 % 1 462 2 150 680 19 476
Polarcirkel AS Norway 100 % 100 1 000 100 110
AKVA Marine Services AS Norway 100 % 134 1 342 100 149 638
Sperre AS Norway 100 % 500 50 10 000 160 528
Egersund Net AS Norway 100 % 2 297 500 4 594 737 999
AKVA group Denmark A/S Denmark 100 % 1 463 1 040 000 1 59 777
AKVA group Land Based A/S Denmark 100 % 704 500 1 408 101 780
AKVA group Scotland Ltd. Scotland 100 % 18 368 14 186 377 1 27 417
AKVAsmart Ltd. (Turkey) Turkey 100 % 2 887 200 14 435 7 910
AKVA group Espana S.L Spain 100 % 5 267 3 000 1 756 5 040
AKVA group Hellas SM PEC Greece 100 % 1 571 20 000 79 1 471
AKVA group Chile S.A.2) Chile 100 % 46 889 11 264 4 163 51 887
AKVA group Land Based Americas S.A.2) Chile 100 % 6 266 11 264 556 1 113
AKVA group North America Inc Canada 100 % 502 419 760 1 5 253
Newfoundland Aqua Service Ltd.3) Canada 70 % 1 93 11 19 993
AKVA group Australasia Pty Ltd. Australia 100 % 329 50 000 7 301
Total 1 461 407
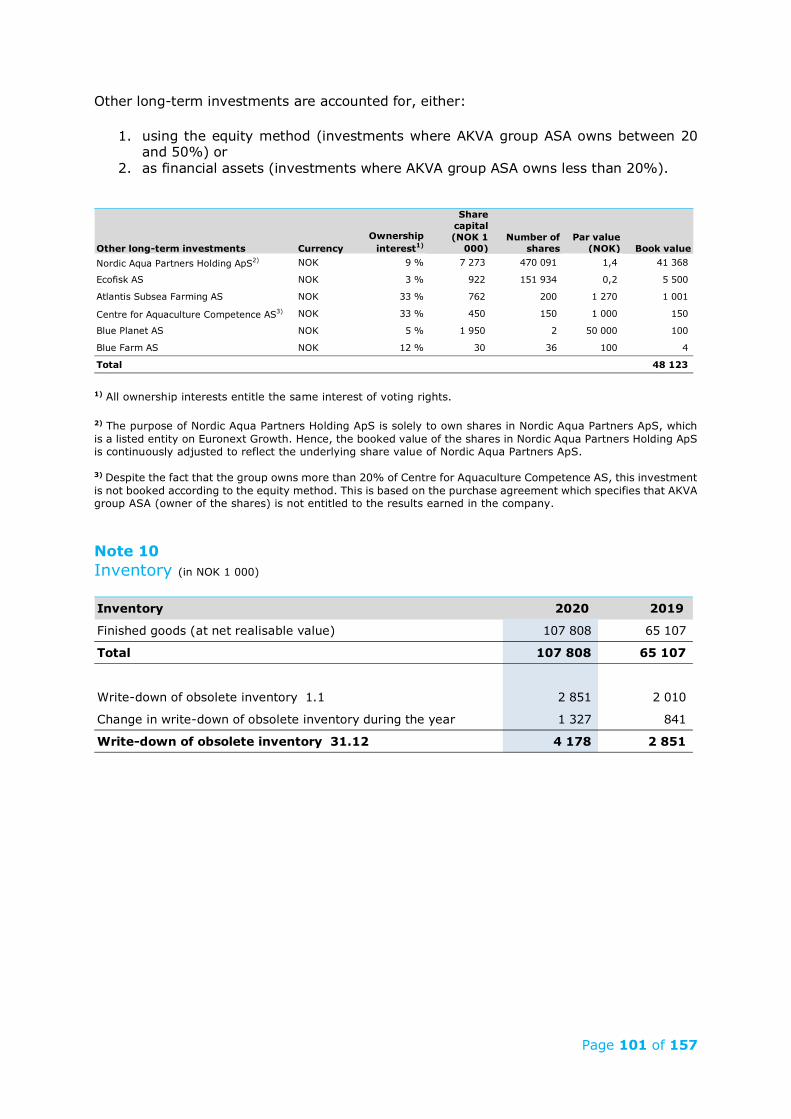
Page 101 of 157
Other long-term investments are accounted for, either:
1. using the equity method (investments where AKVA group ASA owns between 20 and 50%) or
2. as financial assets (investments where AKVA group ASA owns less than 20%).
1) All ownership interests entitle the same interest of voting rights. 2) The purpose of Nordic Aqua Partners Holding ApS is solely to own shares in Nordic Aqua Partners ApS, which is a listed entity on Euronext Growth. Hence, the booked value of the shares in Nordic Aqua Partners Holding ApS is continuously adjusted to reflect the underlying share value of Nordic Aqua Partners ApS. 3) Despite the fact that the group owns more than 20% of Centre for Aquaculture Competence AS, this investment is not booked according to the equity method. This is based on the purchase agreement which specifies that AKVA group ASA (owner of the shares) is not entitled to the results earned in the company. Note 10 Inventory (in NOK 1 000)
Other long-term investments CurrencyOwnership
interest1)
Share capital (NOK 1
000)Number of
sharesPar value
(NOK) Book valueNordic Aqua Partners Holding ApS2) NOK 9 % 7 273 470 091 1,4 41 368
Ecofisk AS NOK 3 % 922 151 934 0,2 5 500
Atlantis Subsea Farming AS NOK 33 % 762 200 1 270 1 001
Centre for Aquaculture Competence AS3) NOK 33 % 450 150 1 000 150
Blue Planet AS NOK 5 % 1 950 2 50 000 100
Blue Farm AS NOK 12 % 30 36 100 4
Total 48 123
Inventory 2020 2019
Finished goods (at net realisable value) 107 808 65 107
Total 107 808 65 107
Write-down of obsolete inventory 1.1 2 851 2 010
Change in write-down of obsolete inventory during the year 1 327 841
Write-down of obsolete inventory 31.12 4 178 2 851

Page 102 of 157
Note 11 Receivables (in NOK 1 000)
Accounts receivables The recorded accounts receivables are shown net of estimated bad debt loss. The estimated bad debt loss is:
Reference is made to note 16 for more details of credit and currency risks related to accounts receivables. Note 12 Bank deposits (in NOK 1 000)
The company has entered into a tax deduction guarantee agreement in 2020 and thus has no restricted funds as of 31 December 2020. The company has an overdraft facility of MNOK 300 and a revolving credit line of MNOK 200 in Danske Bank. As of 31 December 2020, MNOK 0 of the overdraft facility was utilized
Receivables due in more than one year 2020 2019
Other long-term receivables 5 986 98
Total 5 986 98
Bad debt provisions 2020 2019
Bad debt provision 01.01. 1 200 -
Change in bad debt provision -200 1 200
Bad debt provision 31.12. 1 000 1 200
Recorded bad debt cost during the year 799 -
Change in bad debt provision -200 1 200
Total bad debt cost during the year 599 1 200
2020 2019Not due 83 327 23 165
Due <30 days 24 816 28 878
Due 31-60 days 262 6 203
Due 61-90 days 5 759 15
Due >91 days 2 009 7 521
Total 116 172 65 781
Bad debt provisions 1 000 1 200
As of 31.12. the company had the following ageing profile of accounts receivables:
2020 2019
Cash 58 221 15
Restricted funds - 6 164
Total cash and cash equivalents 58 221 6 178
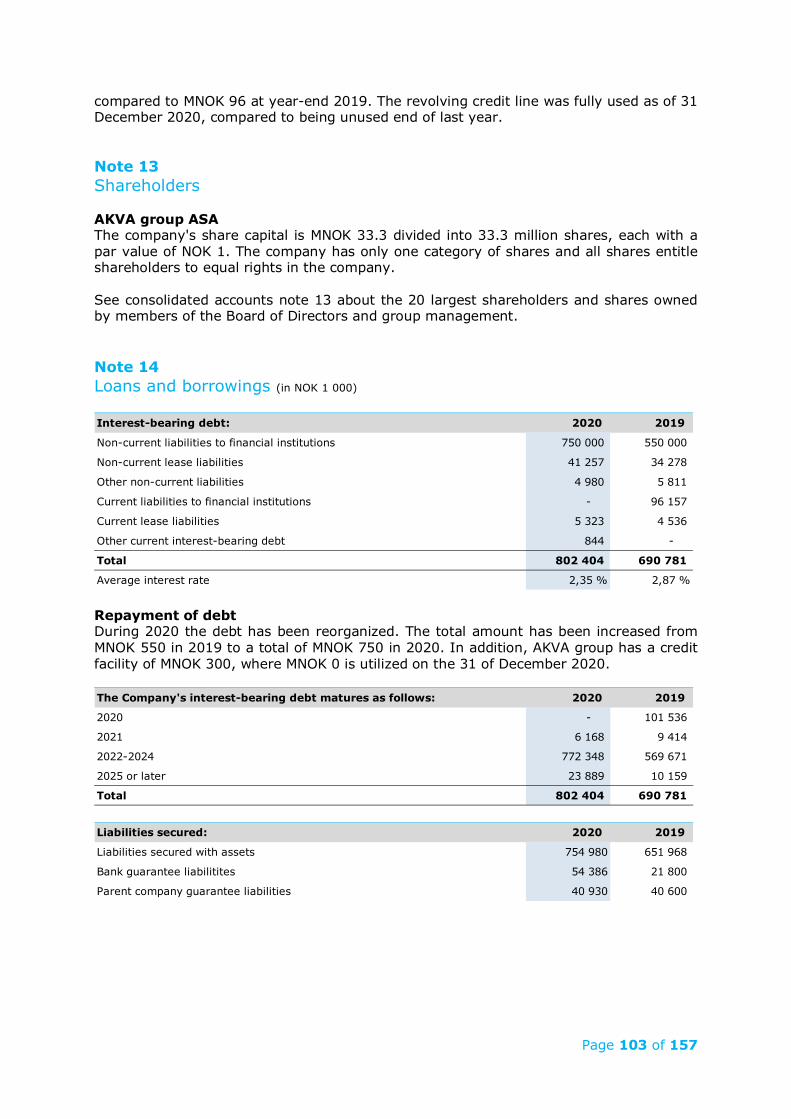
Page 103 of 157
compared to MNOK 96 at year-end 2019. The revolving credit line was fully used as of 31 December 2020, compared to being unused end of last year. Note 13 Shareholders AKVA group ASA The company's share capital is MNOK 33.3 divided into 33.3 million shares, each with a par value of NOK 1. The company has only one category of shares and all shares entitle shareholders to equal rights in the company. See consolidated accounts note 13 about the 20 largest shareholders and shares owned by members of the Board of Directors and group management. Note 14 Loans and borrowings (in NOK 1 000)
Repayment of debt During 2020 the debt has been reorganized. The total amount has been increased from MNOK 550 in 2019 to a total of MNOK 750 in 2020. In addition, AKVA group has a credit facility of MNOK 300, where MNOK 0 is utilized on the 31 of December 2020.
Interest-bearing debt: 2020 2019
Non-current liabilities to financial institutions 750 000 550 000
Non-current lease liabilities 41 257 34 278
Other non-current liabilities 4 980 5 811
Current liabilities to financial institutions - 96 157
Current lease liabilities 5 323 4 536
Other current interest-bearing debt 844 -
Total 802 404 690 781
Average interest rate 2,35 % 2,87 %
The Company's interest-bearing debt matures as follows: 2020 2019
2020 - 101 536
2021 6 168 9 414
2022-2024 772 348 569 671
2025 or later 23 889 10 159
Total 802 404 690 781
Liabilities secured: 2020 2019
Liabilities secured with assets 754 980 651 968
Bank guarantee liabilitites 54 386 21 800
Parent company guarantee liabilities 40 930 40 600
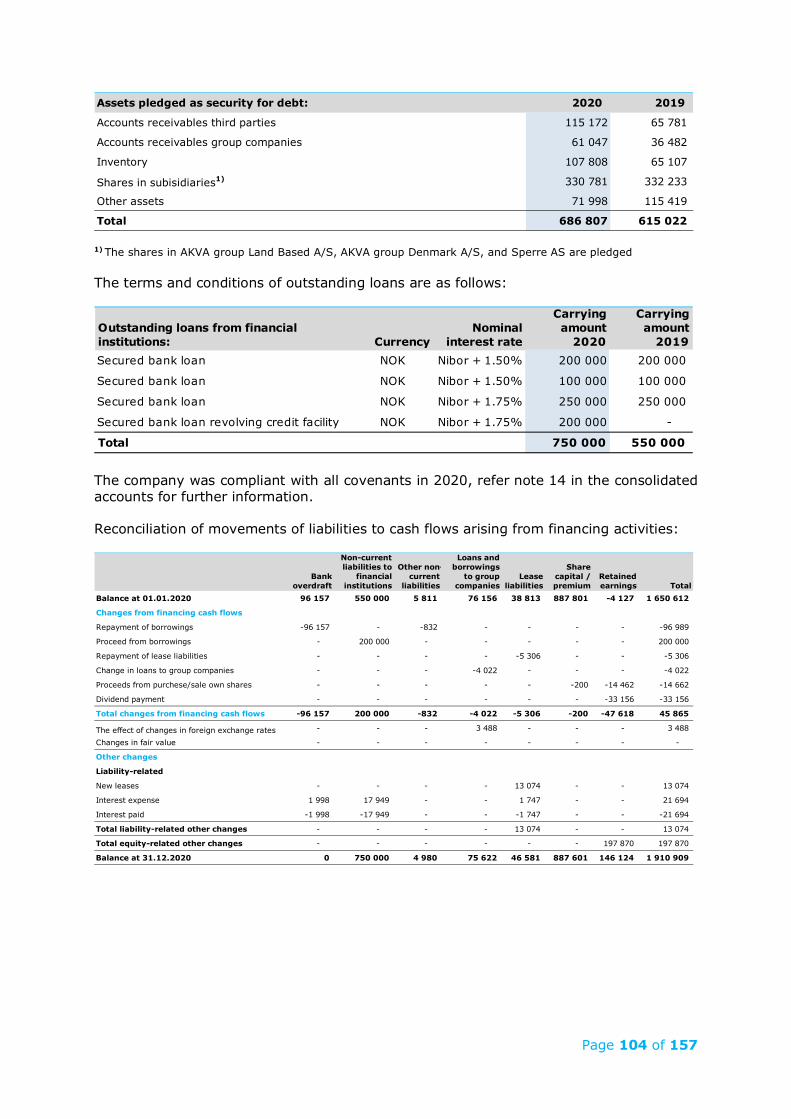
Page 104 of 157
1) The shares in AKVA group Land Based A/S, AKVA group Denmark A/S, and Sperre AS are pledged The terms and conditions of outstanding loans are as follows:
The company was compliant with all covenants in 2020, refer note 14 in the consolidated accounts for further information. Reconciliation of movements of liabilities to cash flows arising from financing activities:
Assets pledged as security for debt: 2020 2019
Accounts receivables third parties 115 172 65 781
Accounts receivables group companies 61 047 36 482
Inventory 107 808 65 107
Shares in subisidiaries1) 330 781 332 233
Other assets 71 998 115 419
Total 686 807 615 022
Outstanding loans from financial institutions: Currency
Nominal interest rate
Carrying amount
2020
Carrying amount
2019Secured bank loan NOK Nibor + 1.50% 200 000 200 000
Secured bank loan NOK Nibor + 1.50% 100 000 100 000
Secured bank loan NOK Nibor + 1.75% 250 000 250 000
Secured bank loan revolving credit facility NOK Nibor + 1.75% 200 000 -
Total 750 000 550 000
Bank overdraft
Non-current liabilities to
financial institutions
Other non-current
liabilities
Loans and borrowings
to group companies
Lease liabilities
Share capital / premium
Retained earnings Total
Balance at 01.01.2020 96 157 550 000 5 811 76 156 38 813 887 801 -4 127 1 650 612
Changes from financing cash flows
Repayment of borrowings -96 157 - -832 - - - - -96 989
Proceed from borrowings - 200 000 - - - - - 200 000
Repayment of lease liabilities - - - - -5 306 - - -5 306
Change in loans to group companies - - - -4 022 - - - -4 022
Proceeds from purchese/sale own shares - - - - - -200 -14 462 -14 662
Dividend payment - - - - - - -33 156 -33 156
Total changes from financing cash flows -96 157 200 000 -832 -4 022 -5 306 -200 -47 618 45 865
The effect of changes in foreign exchange rates - - - 3 488 - - - 3 488
Changes in fair value - - - - - - - -
Other changes
Liability-related
New leases - - - - 13 074 - - 13 074
Interest expense 1 998 17 949 - - 1 747 - - 21 694
Interest paid -1 998 -17 949 - - -1 747 - - -21 694
Total liability-related other changes - - - - 13 074 - - 13 074
Total equity-related other changes - - - - - - 197 870 197 870
Balance at 31.12.2020 0 750 000 4 980 75 622 46 581 887 601 146 124 1 910 909
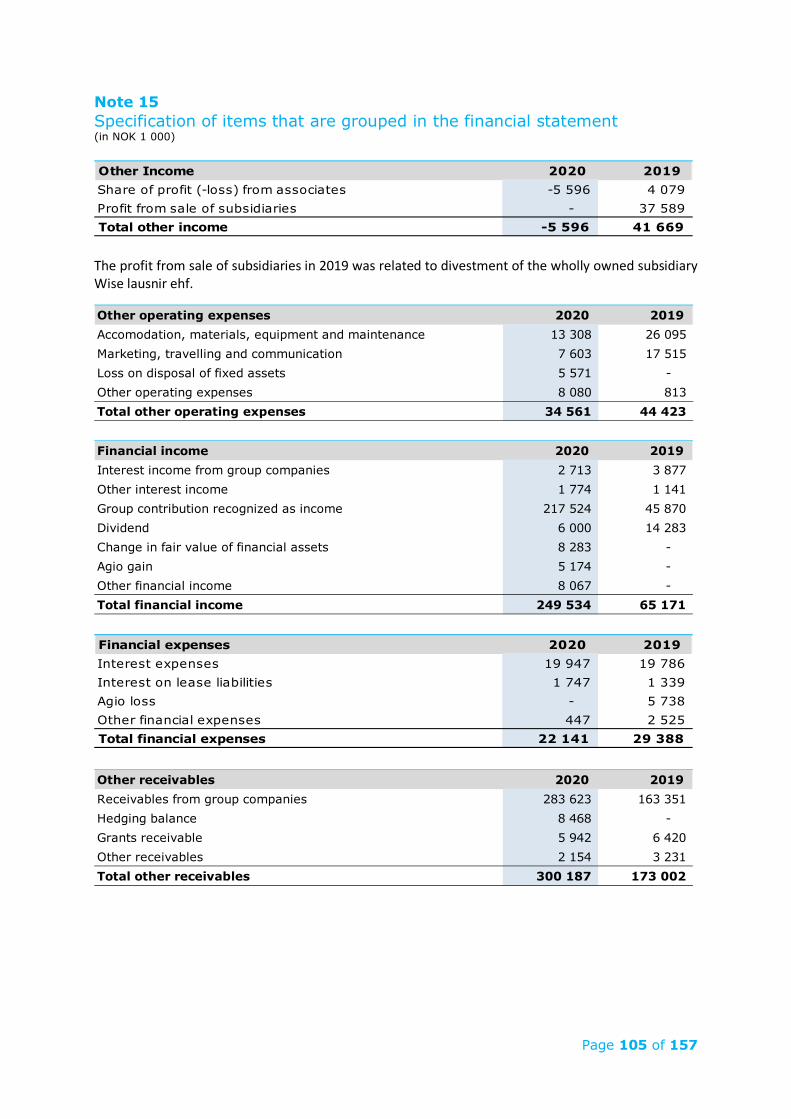
Page 105 of 157
Note 15 Specification of items that are grouped in the financial statement (in NOK 1 000)
The profit from sale of subsidiaries in 2019 was related to divestment of the wholly owned subsidiary Wise lausnir ehf.
Other Income 2020 2019Share of profit (-loss) from associates -5 596 4 079 Profit from sale of subsidiaries - 37 589 Total other income -5 596 41 669
Other operating expenses 2020 2019Accomodation, materials, equipment and maintenance 13 308 26 095 Marketing, travelling and communication 7 603 17 515 Loss on disposal of fixed assets 5 571 - Other operating expenses 8 080 813 Total other operating expenses 34 561 44 423
Financial income 2020 2019Interest income from group companies 2 713 3 877 Other interest income 1 774 1 141 Group contribution recognized as income 217 524 45 870 Dividend 6 000 14 283 Change in fair value of financial assets 8 283 - Agio gain 5 174 - Other financial income 8 067 - Total financial income 249 534 65 171
Financial expenses 2020 2019Interest expenses 19 947 19 786 Interest on lease liabilities 1 747 1 339 Agio loss - 5 738 Other financial expenses 447 2 525 Total financial expenses 22 141 29 388
Other receivables 2020 2019Receivables from group companies 283 623 163 351 Hedging balance 8 468 - Grants receivable 5 942 6 420 Other receivables 2 154 3 231 Total other receivables 300 187 173 002
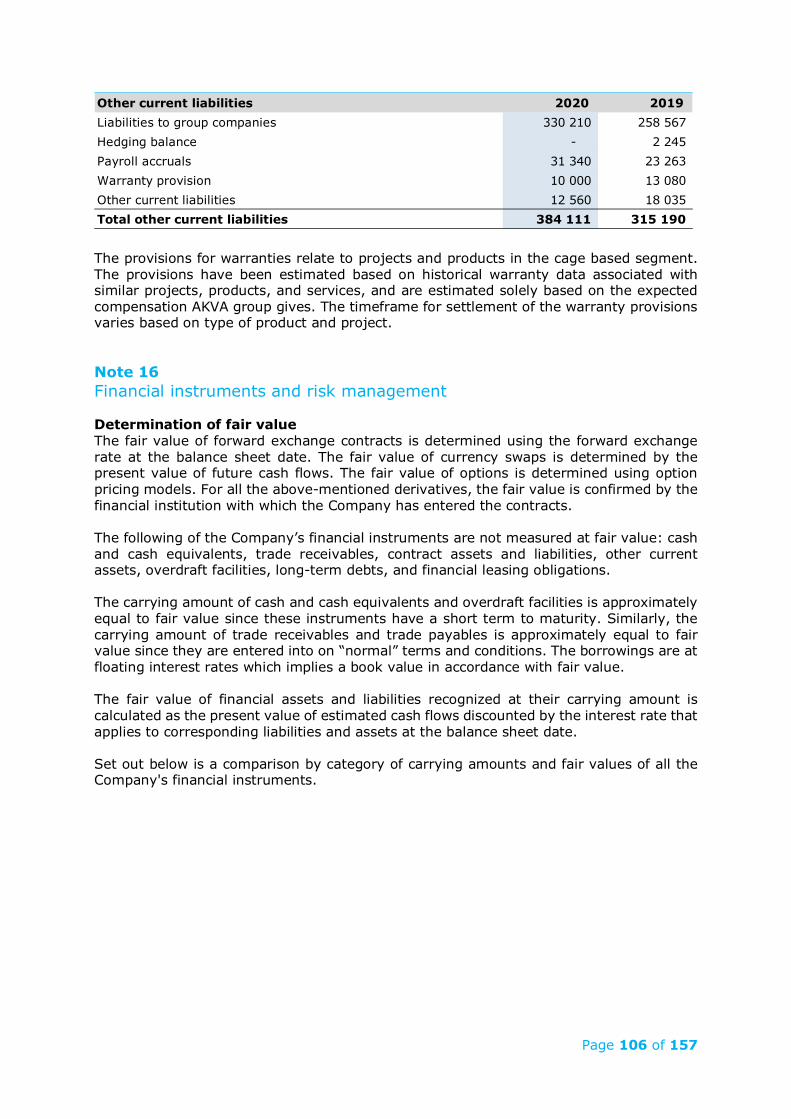
Page 106 of 157
The provisions for warranties relate to projects and products in the cage based segment. The provisions have been estimated based on historical warranty data associated with similar projects, products, and services, and are estimated solely based on the expected compensation AKVA group gives. The timeframe for settlement of the warranty provisions varies based on type of product and project. Note 16 Financial instruments and risk management Determination of fair value The fair value of forward exchange contracts is determined using the forward exchange rate at the balance sheet date. The fair value of currency swaps is determined by the present value of future cash flows. The fair value of options is determined using option pricing models. For all the above-mentioned derivatives, the fair value is confirmed by the financial institution with which the Company has entered the contracts. The following of the Company’s financial instruments are not measured at fair value: cash and cash equivalents, trade receivables, contract assets and liabilities, other current assets, overdraft facilities, long-term debts, and financial leasing obligations. The carrying amount of cash and cash equivalents and overdraft facilities is approximately equal to fair value since these instruments have a short term to maturity. Similarly, the carrying amount of trade receivables and trade payables is approximately equal to fair value since they are entered into on “normal” terms and conditions. The borrowings are at floating interest rates which implies a book value in accordance with fair value. The fair value of financial assets and liabilities recognized at their carrying amount is calculated as the present value of estimated cash flows discounted by the interest rate that applies to corresponding liabilities and assets at the balance sheet date. Set out below is a comparison by category of carrying amounts and fair values of all the Company's financial instruments.
Other current liabilities 2020 2019Liabilities to group companies 330 210 258 567 Hedging balance - 2 245 Payroll accruals 31 340 23 263 Warranty provision 10 000 13 080 Other current liabilities 12 560 18 035 Total other current liabilities 384 111 315 190
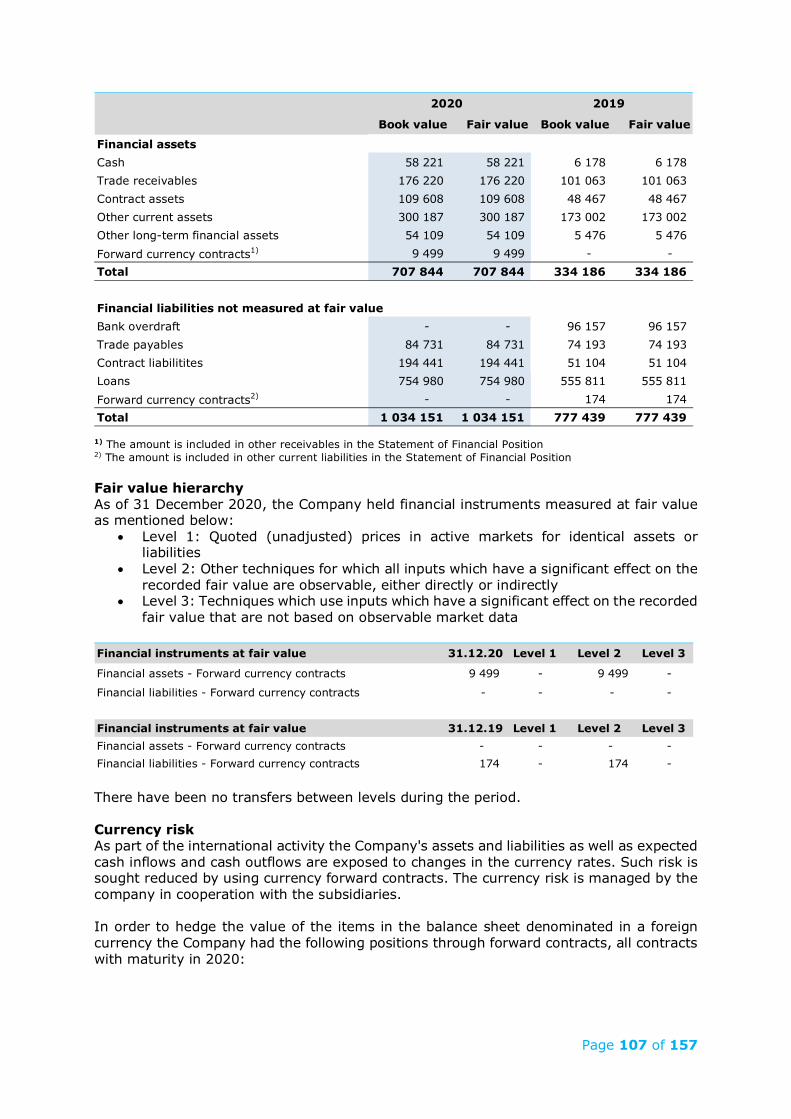
Page 107 of 157
1) The amount is included in other receivables in the Statement of Financial Position 2) The amount is included in other current liabilities in the Statement of Financial Position Fair value hierarchy As of 31 December 2020, the Company held financial instruments measured at fair value as mentioned below:
• Level 1: Quoted (unadjusted) prices in active markets for identical assets or liabilities
• Level 2: Other techniques for which all inputs which have a significant effect on the recorded fair value are observable, either directly or indirectly
• Level 3: Techniques which use inputs which have a significant effect on the recorded fair value that are not based on observable market data
There have been no transfers between levels during the period. Currency risk As part of the international activity the Company's assets and liabilities as well as expected cash inflows and cash outflows are exposed to changes in the currency rates. Such risk is sought reduced by using currency forward contracts. The currency risk is managed by the company in cooperation with the subsidiaries. In order to hedge the value of the items in the balance sheet denominated in a foreign currency the Company had the following positions through forward contracts, all contracts with maturity in 2020:
Book value Fair value Book value Fair value
Financial assetsCash 58 221 58 221 6 178 6 178 Trade receivables 176 220 176 220 101 063 101 063 Contract assets 109 608 109 608 48 467 48 467 Other current assets 300 187 300 187 173 002 173 002 Other long-term financial assets 54 109 54 109 5 476 5 476 Forward currency contracts1) 9 499 9 499 - - Total 707 844 707 844 334 186 334 186
Financial liabilities not measured at fair valueBank overdraft - - 96 157 96 157 Trade payables 84 731 84 731 74 193 74 193 Contract liabilitites 194 441 194 441 51 104 51 104 Loans 754 980 754 980 555 811 555 811 Forward currency contracts2) - - 174 174 Total 1 034 151 1 034 151 777 439 777 439
2020 2019
Financial instruments at fair value 31.12.20 Level 1 Level 2 Level 3
Financial assets - Forward currency contracts 9 499 - 9 499 -
Financial liabilities - Forward currency contracts - - - -
Financial instruments at fair value 31.12.19 Level 1 Level 2 Level 3Financial assets - Forward currency contracts - - - - Financial liabilities - Forward currency contracts 174 - 174 -
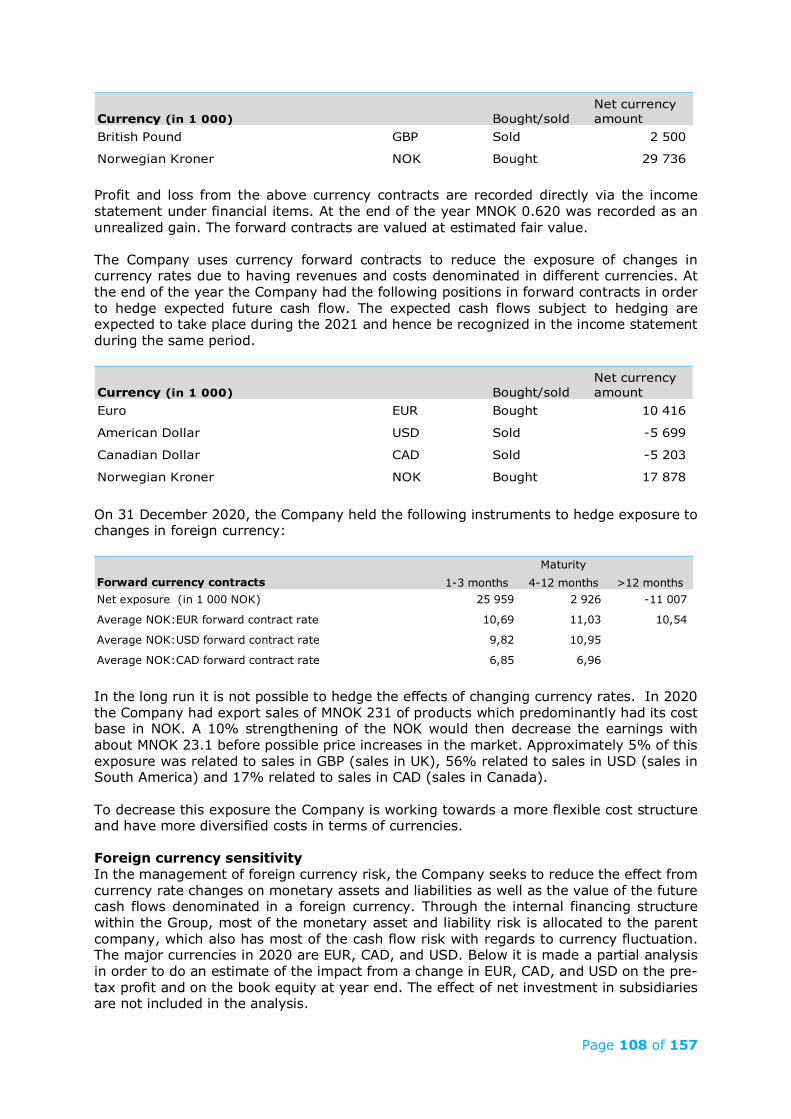
Page 108 of 157
Profit and loss from the above currency contracts are recorded directly via the income statement under financial items. At the end of the year MNOK 0.620 was recorded as an unrealized gain. The forward contracts are valued at estimated fair value. The Company uses currency forward contracts to reduce the exposure of changes in currency rates due to having revenues and costs denominated in different currencies. At the end of the year the Company had the following positions in forward contracts in order to hedge expected future cash flow. The expected cash flows subject to hedging are expected to take place during the 2021 and hence be recognized in the income statement during the same period.
On 31 December 2020, the Company held the following instruments to hedge exposure to changes in foreign currency:
In the long run it is not possible to hedge the effects of changing currency rates. In 2020 the Company had export sales of MNOK 231 of products which predominantly had its cost base in NOK. A 10% strengthening of the NOK would then decrease the earnings with about MNOK 23.1 before possible price increases in the market. Approximately 5% of this exposure was related to sales in GBP (sales in UK), 56% related to sales in USD (sales in South America) and 17% related to sales in CAD (sales in Canada). To decrease this exposure the Company is working towards a more flexible cost structure and have more diversified costs in terms of currencies. Foreign currency sensitivity In the management of foreign currency risk, the Company seeks to reduce the effect from currency rate changes on monetary assets and liabilities as well as the value of the future cash flows denominated in a foreign currency. Through the internal financing structure within the Group, most of the monetary asset and liability risk is allocated to the parent company, which also has most of the cash flow risk with regards to currency fluctuation. The major currencies in 2020 are EUR, CAD, and USD. Below it is made a partial analysis in order to do an estimate of the impact from a change in EUR, CAD, and USD on the pre-tax profit and on the book equity at year end. The effect of net investment in subsidiaries are not included in the analysis.
Currency (in 1 000) Bought/soldNet currency amount
British Pound GBP Sold 2 500
Norwegian Kroner NOK Bought 29 736
Currency (in 1 000) Bought/soldNet currency amount
Euro EUR Bought 10 416
American Dollar USD Sold -5 699
Canadian Dollar CAD Sold -5 203
Norwegian Kroner NOK Bought 17 878
1-3 months 4-12 months >12 monthsNet exposure (in 1 000 NOK) 25 959 2 926 -11 007
Average NOK:EUR forward contract rate 10,69 11,03 10,54
Average NOK:USD forward contract rate 9,82 10,95
Average NOK:CAD forward contract rate 6,85 6,96
Forward currency contractsMaturity
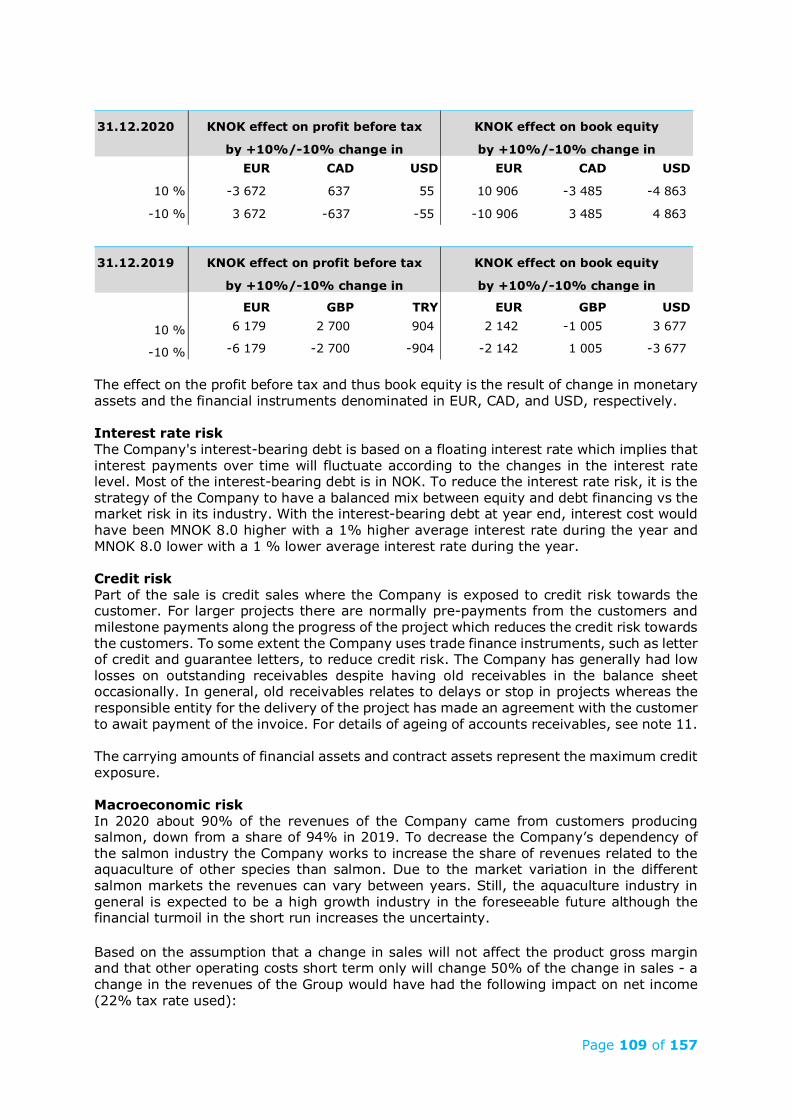
Page 109 of 157
The effect on the profit before tax and thus book equity is the result of change in monetary assets and the financial instruments denominated in EUR, CAD, and USD, respectively. Interest rate risk The Company's interest-bearing debt is based on a floating interest rate which implies that interest payments over time will fluctuate according to the changes in the interest rate level. Most of the interest-bearing debt is in NOK. To reduce the interest rate risk, it is the strategy of the Company to have a balanced mix between equity and debt financing vs the market risk in its industry. With the interest-bearing debt at year end, interest cost would have been MNOK 8.0 higher with a 1% higher average interest rate during the year and MNOK 8.0 lower with a 1 % lower average interest rate during the year. Credit risk Part of the sale is credit sales where the Company is exposed to credit risk towards the customer. For larger projects there are normally pre-payments from the customers and milestone payments along the progress of the project which reduces the credit risk towards the customers. To some extent the Company uses trade finance instruments, such as letter of credit and guarantee letters, to reduce credit risk. The Company has generally had low losses on outstanding receivables despite having old receivables in the balance sheet occasionally. In general, old receivables relates to delays or stop in projects whereas the responsible entity for the delivery of the project has made an agreement with the customer to await payment of the invoice. For details of ageing of accounts receivables, see note 11. The carrying amounts of financial assets and contract assets represent the maximum credit exposure. Macroeconomic risk In 2020 about 90% of the revenues of the Company came from customers producing salmon, down from a share of 94% in 2019. To decrease the Company’s dependency of the salmon industry the Company works to increase the share of revenues related to the aquaculture of other species than salmon. Due to the market variation in the different salmon markets the revenues can vary between years. Still, the aquaculture industry in general is expected to be a high growth industry in the foreseeable future although the financial turmoil in the short run increases the uncertainty. Based on the assumption that a change in sales will not affect the product gross margin and that other operating costs short term only will change 50% of the change in sales - a change in the revenues of the Group would have had the following impact on net income (22% tax rate used):
31.12.2020
EUR CAD USD EUR CAD USD
10 % -3 672 637 55 10 906 -3 485 -4 863
-10 % 3 672 -637 -55 -10 906 3 485 4 863
31.12.2019
EUR GBP TRY EUR GBP USD
10 % 6 179 2 700 904 2 142 -1 005 3 677
-10 % -6 179 -2 700 -904 -2 142 1 005 -3 677
KNOK effect on profit before tax
KNOK effect on profit before tax KNOK effect on book equity
KNOK effect on book equity
by +10%/-10% change in by +10%/-10% change in
by +10%/-10% change in by +10%/-10% change in
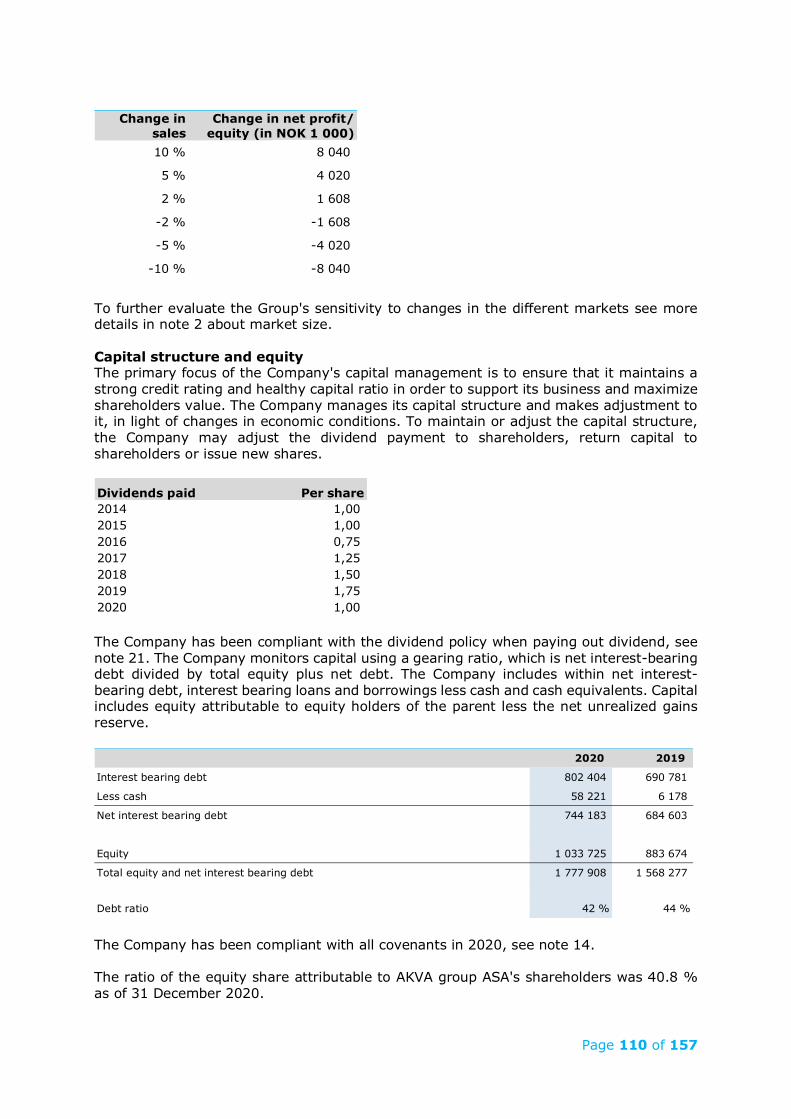
Page 110 of 157
To further evaluate the Group's sensitivity to changes in the different markets see more details in note 2 about market size. Capital structure and equity The primary focus of the Company's capital management is to ensure that it maintains a strong credit rating and healthy capital ratio in order to support its business and maximize shareholders value. The Company manages its capital structure and makes adjustment to it, in light of changes in economic conditions. To maintain or adjust the capital structure, the Company may adjust the dividend payment to shareholders, return capital to shareholders or issue new shares.
The Company has been compliant with the dividend policy when paying out dividend, see note 21. The Company monitors capital using a gearing ratio, which is net interest-bearing debt divided by total equity plus net debt. The Company includes within net interest-bearing debt, interest bearing loans and borrowings less cash and cash equivalents. Capital includes equity attributable to equity holders of the parent less the net unrealized gains reserve.
The Company has been compliant with all covenants in 2020, see note 14. The ratio of the equity share attributable to AKVA group ASA's shareholders was 40.8 % as of 31 December 2020.
Change in sales10 % 8 040
5 % 4 020
2 % 1 608
-2 % -1 608
-5 % -4 020
-10 % -8 040
Change in net profit/ equity (in NOK 1 000)
Dividends paid Per share2014 1,00 2015 1,00 2016 0,75 2017 1,25 2018 1,50 2019 1,75 2020 1,00
2020 2019
Interest bearing debt 802 404 690 781
Less cash 58 221 6 178
Net interest bearing debt 744 183 684 603
Equity 1 033 725 883 674
Total equity and net interest bearing debt 1 777 908 1 568 277
Debt ratio 42 % 44 %
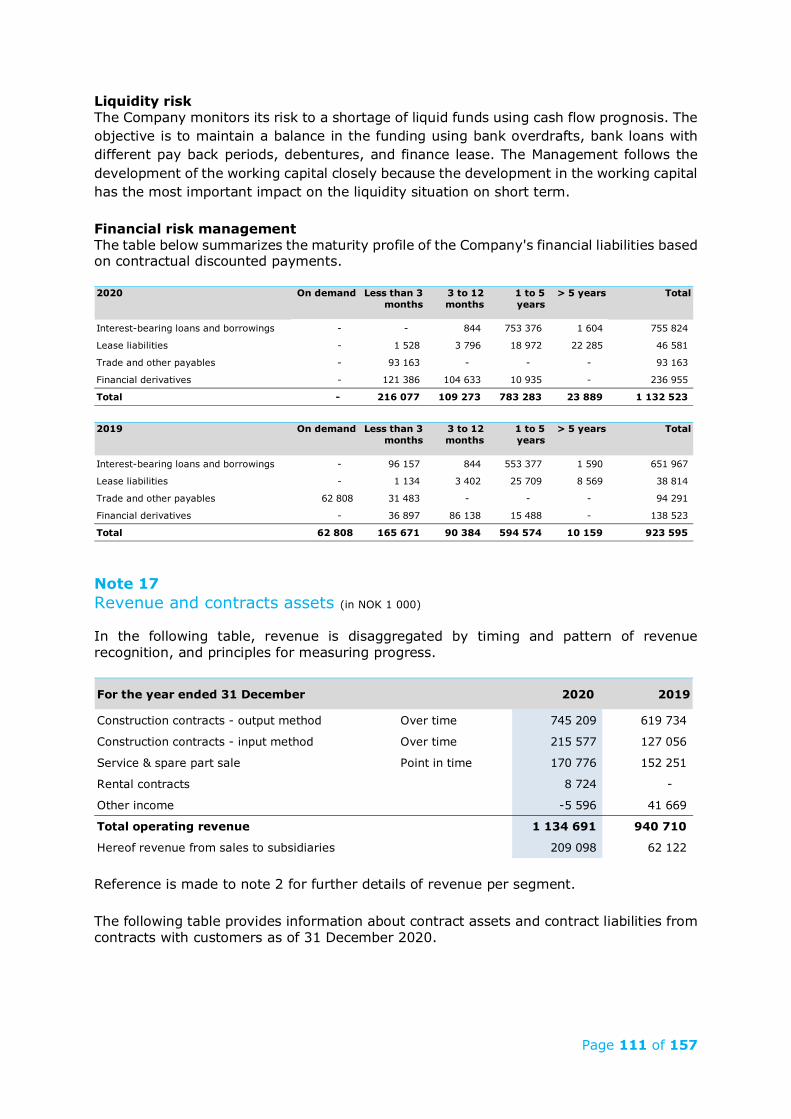
Page 111 of 157
Liquidity risk The Company monitors its risk to a shortage of liquid funds using cash flow prognosis. The objective is to maintain a balance in the funding using bank overdrafts, bank loans with different pay back periods, debentures, and finance lease. The Management follows the development of the working capital closely because the development in the working capital has the most important impact on the liquidity situation on short term. Financial risk management The table below summarizes the maturity profile of the Company's financial liabilities based on contractual discounted payments.
Note 17 Revenue and contracts assets (in NOK 1 000) In the following table, revenue is disaggregated by timing and pattern of revenue recognition, and principles for measuring progress.
Reference is made to note 2 for further details of revenue per segment. The following table provides information about contract assets and contract liabilities from contracts with customers as of 31 December 2020.
2020 On demand Less than 3 months
3 to 12 months
1 to 5 years
> 5 years Total
Interest-bearing loans and borrowings - - 844 753 376 1 604 755 824
Lease liabilities - 1 528 3 796 18 972 22 285 46 581
Trade and other payables - 93 163 - - - 93 163
Financial derivatives - 121 386 104 633 10 935 - 236 955
Total - 216 077 109 273 783 283 23 889 1 132 523
2019 On demand Less than 3 months
3 to 12 months
1 to 5 years
> 5 years Total
Interest-bearing loans and borrowings - 96 157 844 553 377 1 590 651 967
Lease liabilities - 1 134 3 402 25 709 8 569 38 814
Trade and other payables 62 808 31 483 - - - 94 291
Financial derivatives - 36 897 86 138 15 488 - 138 523
Total 62 808 165 671 90 384 594 574 10 159 923 595
For the year ended 31 December 2020 2019
Construction contracts - output method Over time 745 209 619 734
Construction contracts - input method Over time 215 577 127 056
Service & spare part sale Point in time 170 776 152 251
Rental contracts 8 724 -
Other income -5 596 41 669
Total operating revenue 1 134 691 940 710
Hereof revenue from sales to subsidiaries 209 098 62 122
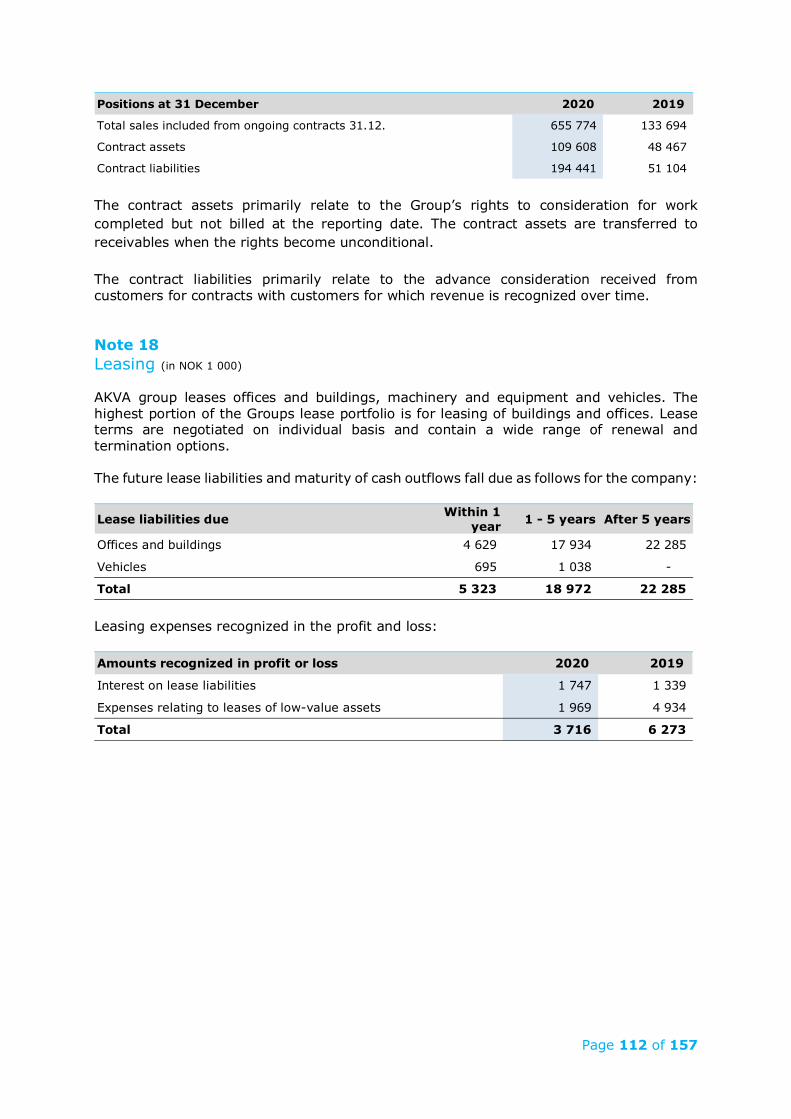
Page 112 of 157
The contract assets primarily relate to the Group’s rights to consideration for work completed but not billed at the reporting date. The contract assets are transferred to receivables when the rights become unconditional. The contract liabilities primarily relate to the advance consideration received from customers for contracts with customers for which revenue is recognized over time. Note 18 Leasing (in NOK 1 000) AKVA group leases offices and buildings, machinery and equipment and vehicles. The highest portion of the Groups lease portfolio is for leasing of buildings and offices. Lease terms are negotiated on individual basis and contain a wide range of renewal and termination options. The future lease liabilities and maturity of cash outflows fall due as follows for the company:
Leasing expenses recognized in the profit and loss:
Positions at 31 December 2020 2019
Total sales included from ongoing contracts 31.12. 655 774 133 694
Contract assets 109 608 48 467
Contract liabilities 194 441 51 104
Lease liabilities due Within 1 year 1 - 5 years After 5 years
Offices and buildings 4 629 17 934 22 285
Vehicles 695 1 038 -
Total 5 323 18 972 22 285
Amounts recognized in profit or loss 2020 2019
Interest on lease liabilities 1 747 1 339
Expenses relating to leases of low-value assets 1 969 4 934
Total 3 716 6 273
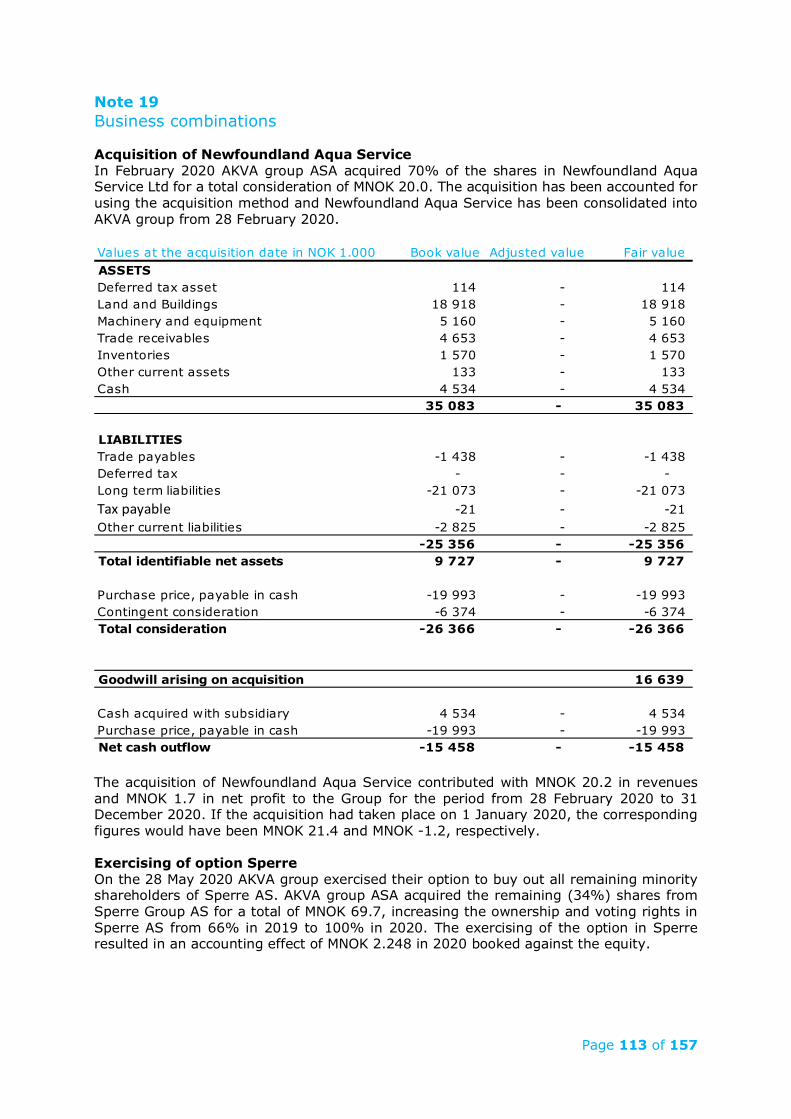
Page 113 of 157
Note 19 Business combinations Acquisition of Newfoundland Aqua Service In February 2020 AKVA group ASA acquired 70% of the shares in Newfoundland Aqua Service Ltd for a total consideration of MNOK 20.0. The acquisition has been accounted for using the acquisition method and Newfoundland Aqua Service has been consolidated into AKVA group from 28 February 2020.
The acquisition of Newfoundland Aqua Service contributed with MNOK 20.2 in revenues and MNOK 1.7 in net profit to the Group for the period from 28 February 2020 to 31 December 2020. If the acquisition had taken place on 1 January 2020, the corresponding figures would have been MNOK 21.4 and MNOK -1.2, respectively. Exercising of option Sperre On the 28 May 2020 AKVA group exercised their option to buy out all remaining minority shareholders of Sperre AS. AKVA group ASA acquired the remaining (34%) shares from Sperre Group AS for a total of MNOK 69.7, increasing the ownership and voting rights in Sperre AS from 66% in 2019 to 100% in 2020. The exercising of the option in Sperre resulted in an accounting effect of MNOK 2.248 in 2020 booked against the equity.
Values at the acquisition date in NOK 1.000 Book value Adjusted value Fair value ASSETSDeferred tax asset 114 - 114 Land and Buildings 18 918 - 18 918 Machinery and equipment 5 160 - 5 160 Trade receivables 4 653 - 4 653 Inventories 1 570 - 1 570 Other current assets 133 - 133 Cash 4 534 - 4 534
35 083 - 35 083
LIABILITIESTrade payables -1 438 - -1 438 Deferred tax - - - Long term liabilities -21 073 - -21 073 Tax payable -21 - -21 Other current liabilities -2 825 - -2 825
-25 356 - -25 356 Total identifiable net assets 9 727 - 9 727
Purchase price, payable in cash -19 993 - -19 993 Contingent consideration -6 374 - -6 374 Total consideration -26 366 - -26 366
Goodwill arising on acquisition 16 639
Cash acquired with subsidiary 4 534 - 4 534 Purchase price, payable in cash -19 993 - -19 993 Net cash outflow -15 458 - -15 458
Page 114 of 157
Earn-out AKVA Marine Services AKVA group have booked MNOK 7.5 as a liability in the statement of financial position relating to an earn out arising from the buyout of Deep Sea Marine’s and AØ Holdings shares in AKVA Marine Services AS. This earn out will be paid in 2021. Options Newfoundland Aqua Service The Minority Shareholders of Newfoundland Aqua Service Ltd has an option to sell to AKVA group ASA and AKVA group ASA has an option to purchase from the Minority Shareholders most of the remaining shares. The pricing is based on financial performance. The option is calculated at present value of the redemption amount. The liability is classified as other long-term liabilities in the statement of financial position. The estimated liability of MNOK 6.1 is accounted for based on a mutual option agreement between AKVA group ASA and to buy/sell 28% of the shares in Newfoundland Aqua Service Ltd. The pricing of the 28% of the shares is linked to the performance of the company in 2020, 2021 and 2022. The option is exercisable in a limited period after the approval of the 2022 annual accounts of Newfoundland Aqua Service Ltd. Note 20 Related parties (2019 figures in brackets) See note 6 for transaction and balances with subsidiaries. See consolidated accounts note 3 about remuneration to CEO and executive management and fees to the Board of Directors. Atlantis Subsea Farming AS (ASF) is a related party due to AKVA group ASA’s ownership of 33% of the shares in ASF. AKVA group ASA has as part of their role in ASF recorded revenues from ASF of MNOK 9.6 (6.5) in 2020. The outstanding balance towards ASF on 31 December 2020 was a receivable of MNOK 0.8 (1.3). Centre of Aquaculture Competence AS (CAC) is a related party due to AKVA group ASA’s ownership of 33% of the shares in CAC. AKVA group ASA has as part of their role in CAC recorded revenues from CAC of MNOK 1.5 (0.3) in 2020. The outstanding balance towards CAC on 31 December 2020 was a receivable of MNOK 1.7 (0.0). Egersund Group AS is a related party due to its controlling ownership share of the AKVA group ASA. AKVA group ASA has, in line with the company’s ordinary course of business with Egersund Group and its subsidiaries, had revenues and costs of respectively MNOK 0.3 (16.5) and MNOK 0.6 (57.1) in 2020. Outstanding balances at year-end are unsecured and interest free and settlement occurs in cash. As of 31 December, the company had MNOK 0.1 (2.2) in trade receivables and MNOK 0.4 (1.0) in trade payables towards Egersund Group and its subsidiaries. The sales and purchases to related parties are made on terms equivalent to those that prevail in arm's length transactions.
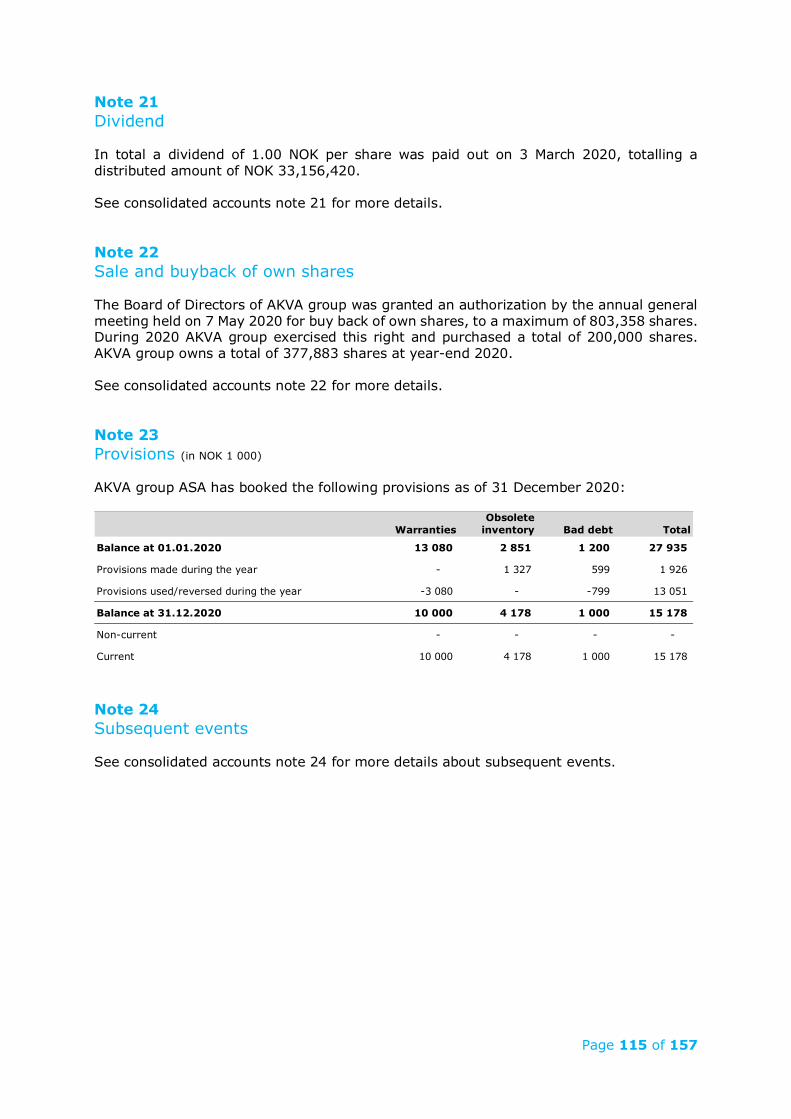
Page 115 of 157
Note 21 Dividend In total a dividend of 1.00 NOK per share was paid out on 3 March 2020, totalling a distributed amount of NOK 33,156,420. See consolidated accounts note 21 for more details. Note 22 Sale and buyback of own shares The Board of Directors of AKVA group was granted an authorization by the annual general meeting held on 7 May 2020 for buy back of own shares, to a maximum of 803,358 shares. During 2020 AKVA group exercised this right and purchased a total of 200,000 shares. AKVA group owns a total of 377,883 shares at year-end 2020. See consolidated accounts note 22 for more details. Note 23 Provisions (in NOK 1 000) AKVA group ASA has booked the following provisions as of 31 December 2020:
Note 24 Subsequent events See consolidated accounts note 24 for more details about subsequent events.
WarrantiesObsolete
inventory Bad debt Total
Balance at 01.01.2020 13 080 2 851 1 200 27 935
Provisions made during the year - 1 327 599 1 926
Provisions used/reversed during the year -3 080 - -799 13 051
Balance at 31.12.2020 10 000 4 178 1 000 15 178
Non-current - - - -
Current 10 000 4 178 1 000 15 178
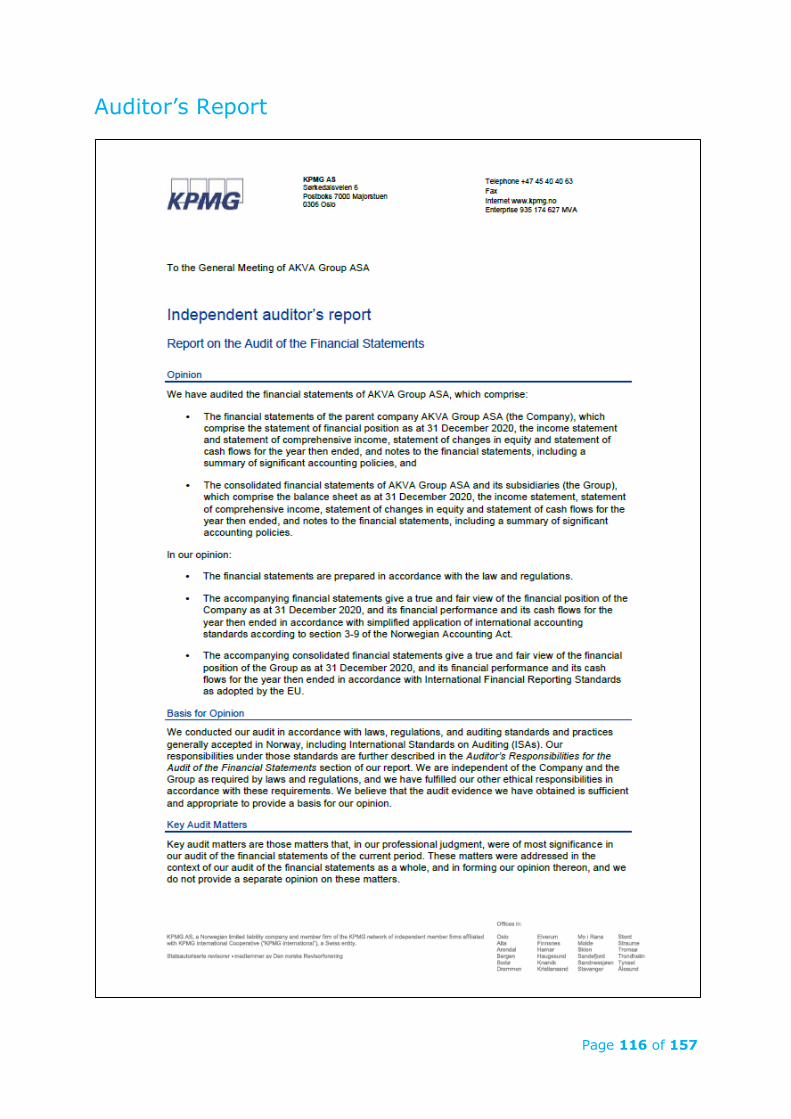
Page 116 of 157
Auditor’s Report
Page 117 of 157
Page 118 of 157
Page 119 of 157
Page 120 of 157
Page 121 of 157
Responsibility Statement
Today, the Board of Directors and the CEO reviewed and approved the Board of Director’s report and the consolidated and separate annual financial statements for AKVA group ASA for the year ended 31 December 2020, in accordance with the Securities Trading Act.
We confirm, to the best of our knowledge, that the financial statements for the period from 1 January to 31 December, 2020 has been prepared in accordance with applicable accounting standards and gives a true and fair view of the Group and the Company’s assets, liabilities, financial position and results of operations, and that the Report of the Board of directors provides a true and fair view of the development and performance of the business and the position of the Group and the Company together with a description of the key risks and uncertainty factors that the companies are facing.
Klepp, Norway, 14 April 2021
Page 122 of 157
Alternative Performance Measures - Non IFRS Financial Measures AKVA group discloses alternative performance measures as a supplement to the financial statements prepared in accordance with IFRS. Such performance measures are used to provide an enhanced insight into the operating performance, financing and future prospects of the company and are frequently used by analysts, investors and other interested parties. The definition of these measures are as follows: Available cash is a non-IFRS financial measure, calculated by summarizing all cash in the Group in addition to available cash from established credit facilities. Capital Employed is calculated as the sum of NIBD, at the balance sheet date plus equity, deferred tax, and other long-term liabilities. Capital Employed can also be found by the formula (total assets – cash) – (total current liabilities – liabilities to financial institutions). EBITDA – EBITDA is the earnings before interest, taxes, depreciation, and amortizations. It can be calculated by the EBIT added by the depreciations and amortizations. EBIT – EBIT is the earnings before interest and taxes. It can be calculated by the profit before tax added by the interest. NIBD - Net interest-bearing debt is a non-IFRS financial measure, equal to our long-term interest-bearing debt plus liabilities to financial institutions minus our cash at the balance sheet date. NIBD / EBITDA is a non-IFRS measure, calculated as period end NIBD divided by the prior 12 months EBITDA. Order backlog is a non-IFRS measure, calculated as signed orders and contracts at the balance sheet date. It does not include spot-sales, spare parts, and aftermarket sales. Order intake is a non-IFRS measure, calculated as order backlog at the end of period minus order backlog at start of period and revenue in the period. ROACE - Return on average Capital Employed is a non-IFRS financial measure, calculated by dividing the last 12 months EBIT by the average of the Capital Employed on the opening and closing dates of the period under consideration. ROCE – Return on Capital Employed is a non-IFRS financial measure, calculated by dividing the last 12 months EBIT by capital employed at the balance sheet date. Capital Employed is calculated as the sum of NIBD, at the balance sheet date plus equity, deferred tax, and other long-term liabilities. Capital Employed can also be found by the formula (total assets – cash) – (total current liabilities – liabilities to financial institutions). Working Capital is a non-IFRS financial measure calculated by current assets less cash minus current liabilities less liabilities to financial institutions.
Page 123 of 157
Articles of Association of AKVA group ASA
(Unofficial office translation. In case pf discrepancies the Norwegian version shall prevail)
Per 14 August 2018
§ 1
The company’s name is AKVA group ASA. The company is a public limited company.
§ 2
The company’s registered office is in Eigersund municipality.
§ 3
The purpose of the company is to develop, produce, project, sell and market own and purchased products, and everything connected to such activity, including participation in other companies with similar activities.
The activities of the company shall in particular be directed towards technology for farming of fish and animals.
§4
The company’s share capital shall be NOK 33,334,303 divided into 33,334,303 shares at NOK 1 each. The company’s shares shall be registered in the Norwegian Register of Securities (VPS). Any transfer of shares shall be notified to VPS within 1 – one – month.
§ 5
The Board of Directors shall be composed of 4 to 10 members, in accordance with a decision by the General Meeting. The Chairperson and one Board member jointly sign on behalf of the company.
§ 6
The ordinary General Meeting of the company shall consider the following:
1. The approval of the annual profit and loss statement and balance sheet.
2. Application of the profit, or settlement of the deficit according to the approved balance sheet, as well as the distribution of dividends.
3. The election of Board of Directors.
4. Other issues that under Norwegian law are to be dealt with by the shareholders General Meeting.
Page 124 of 157
§ 7
The company shall have a nomination committee consisting of at least 3 members elected by the general meeting. The nomination committee shall prepare the general meeting’s election of board members and propose candidates for nominations. The General Meeting may adopt instructions for the nomination committee.
§ 8
When documents concerning matters to be discussed at the general meeting are made available to the shareholders on the Company’s website, the requirement in the Public Companies Act that such documents shall be sent to the shareholders shall not apply. This also applies to documents which, according to law, shall be included or enclosed to the notice of the general meeting. A shareholder may nonetheless request hard copies of such documents to be sent to him.
Page 125 of 157
Corporate Social Responsibility
OUR COMMITMENT
This policy is made in accordance with the Norwegian Accounting Act, Section 3-3c. AKVA group is expected to assume responsibility for the impact on people, the environment, and the communities and societies in which AKVA group operate. This involves an analysis of AKVA group’s list of interests, a materiality assessment and a mapping of risks and opportunities.
The report:
• Refers to the Company’s guidelines related to following up its corporate social responsibility, including any principles, procedures, and standards to be adhered to
• Explains how the Company works to translate the principles, procedures, standards, and guidelines mentioned above into actions
• Describes the Company’s assessment of the results achieved as a consequence of working with corporate social responsibility and any expectations for future results
• Is made in accordance with the guidelines of the GRI G4 Core reporting standard and the Oslo Stock Exchange’s guidance on reporting on corporate social responsibility. AKVA group follow the Euronext guidance on ESG reporting of January 2020.
AKVA group’s commitment statement:
By developing technology focused on solving the biological challenges, we contribute to the continued development of a sustainable industry. Good operational performance and fish welfare are paramount in achieving good results and investing in our technology will help deliver both.
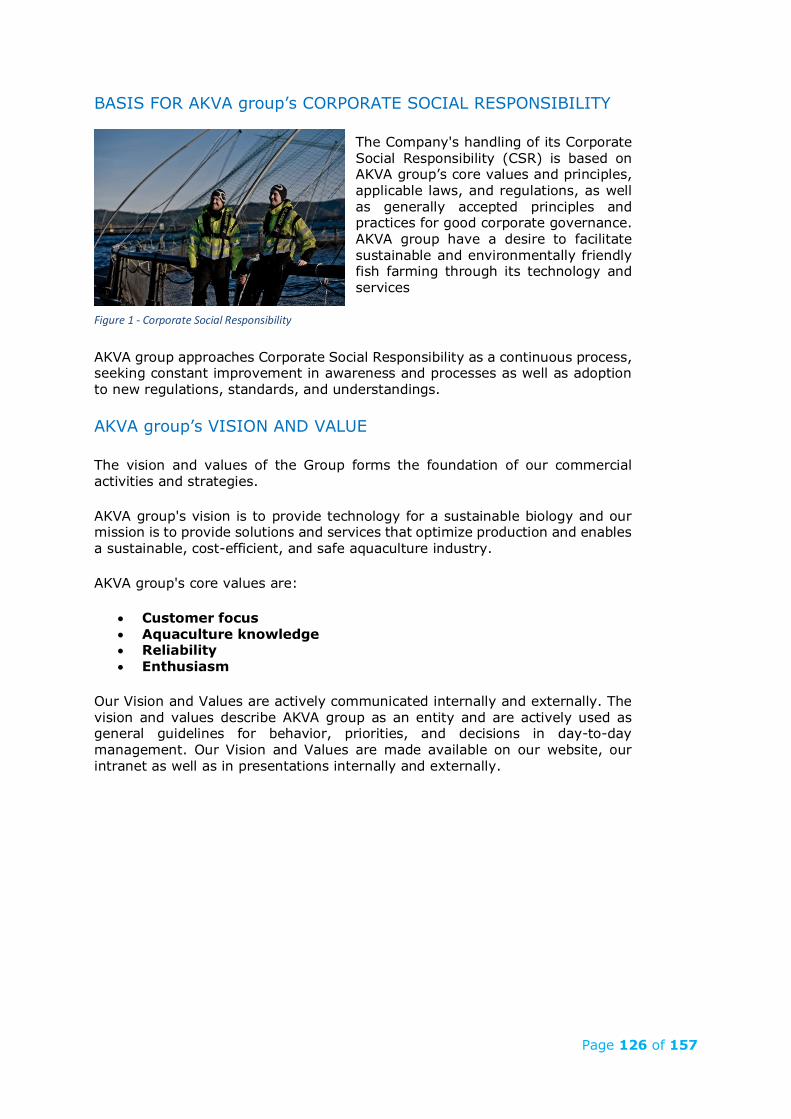
Page 126 of 157
BASIS FOR AKVA group’s CORPORATE SOCIAL RESPONSIBILITY
The Company's handling of its Corporate Social Responsibility (CSR) is based on AKVA group’s core values and principles, applicable laws, and regulations, as well as generally accepted principles and practices for good corporate governance. AKVA group have a desire to facilitate sustainable and environmentally friendly fish farming through its technology and services
AKVA group approaches Corporate Social Responsibility as a continuous process, seeking constant improvement in awareness and processes as well as adoption to new regulations, standards, and understandings.
AKVA group’s VISION AND VALUE
The vision and values of the Group forms the foundation of our commercial activities and strategies.
AKVA group's vision is to provide technology for a sustainable biology and our mission is to provide solutions and services that optimize production and enables a sustainable, cost-efficient, and safe aquaculture industry.
AKVA group's core values are:
• Customer focus • Aquaculture knowledge • Reliability • Enthusiasm
Our Vision and Values are actively communicated internally and externally. The vision and values describe AKVA group as an entity and are actively used as general guidelines for behavior, priorities, and decisions in day-to-day management. Our Vision and Values are made available on our website, our intranet as well as in presentations internally and externally.
Figure 1 - Corporate Social Responsibility
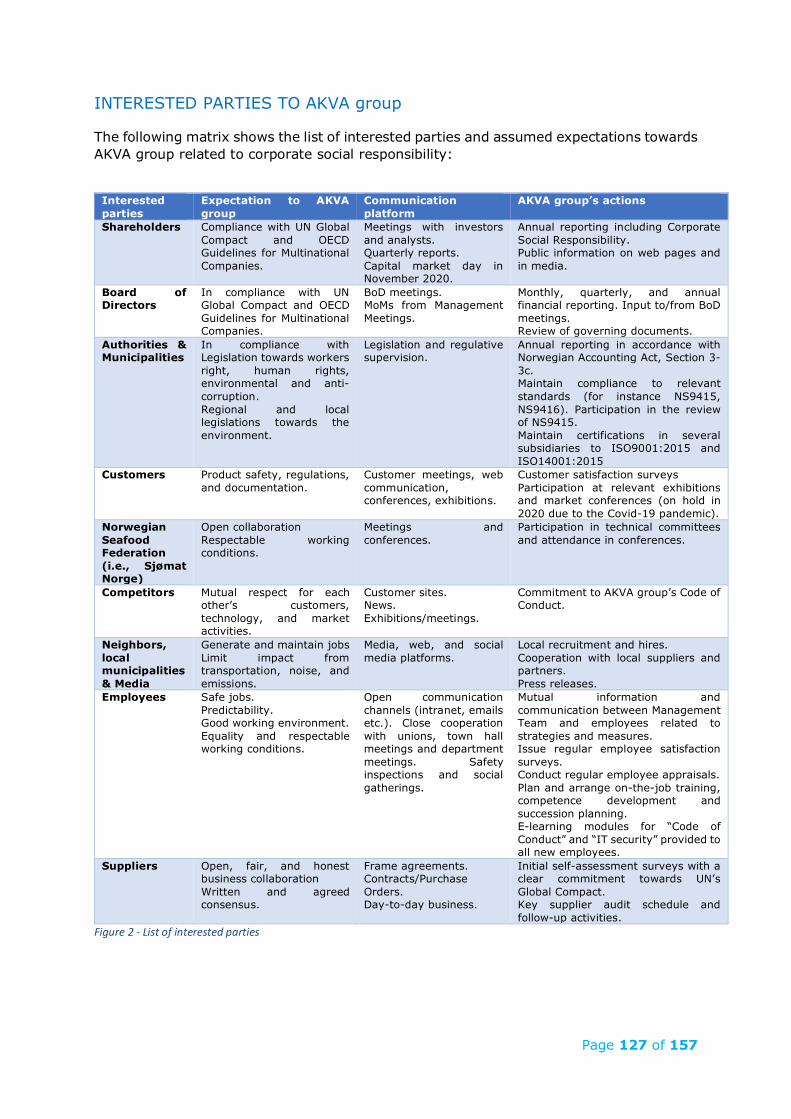
Page 127 of 157
INTERESTED PARTIES TO AKVA group
The following matrix shows the list of interested parties and assumed expectations towards AKVA group related to corporate social responsibility:
Interested parties
Expectation to AKVA group
Communication platform
AKVA group’s actions
Shareholders Compliance with UN Global Compact and OECD Guidelines for Multinational Companies.
Meetings with investors and analysts. Quarterly reports. Capital market day in November 2020.
Annual reporting including Corporate Social Responsibility. Public information on web pages and in media.
Board of Directors
In compliance with UN Global Compact and OECD Guidelines for Multinational Companies.
BoD meetings. MoMs from Management Meetings.
Monthly, quarterly, and annual financial reporting. Input to/from BoD meetings. Review of governing documents.
Authorities & Municipalities
In compliance with Legislation towards workers right, human rights, environmental and anti-corruption. Regional and local legislations towards the environment.
Legislation and regulative supervision.
Annual reporting in accordance with Norwegian Accounting Act, Section 3-3c. Maintain compliance to relevant standards (for instance NS9415, NS9416). Participation in the review of NS9415. Maintain certifications in several subsidiaries to ISO9001:2015 and ISO14001:2015
Customers Product safety, regulations, and documentation.
Customer meetings, web communication, conferences, exhibitions.
Customer satisfaction surveys Participation at relevant exhibitions and market conferences (on hold in 2020 due to the Covid-19 pandemic).
Norwegian Seafood Federation (i.e., Sjømat Norge)
Open collaboration Respectable working conditions.
Meetings and conferences.
Participation in technical committees and attendance in conferences.
Competitors Mutual respect for each other’s customers, technology, and market activities.
Customer sites. News. Exhibitions/meetings.
Commitment to AKVA group’s Code of Conduct.
Neighbors, local municipalities & Media
Generate and maintain jobs Limit impact from transportation, noise, and emissions.
Media, web, and social media platforms.
Local recruitment and hires. Cooperation with local suppliers and partners. Press releases.
Employees Safe jobs. Predictability. Good working environment. Equality and respectable working conditions.
Open communication channels (intranet, emails etc.). Close cooperation with unions, town hall meetings and department meetings. Safety inspections and social gatherings.
Mutual information and communication between Management Team and employees related to strategies and measures. Issue regular employee satisfaction surveys. Conduct regular employee appraisals. Plan and arrange on-the-job training, competence development and succession planning. E-learning modules for “Code of Conduct” and “IT security” provided to all new employees.
Suppliers Open, fair, and honest business collaboration Written and agreed consensus.
Frame agreements. Contracts/Purchase Orders. Day-to-day business.
Initial self-assessment surveys with a clear commitment towards UN’s Global Compact. Key supplier audit schedule and follow-up activities.
Figure 2 - List of interested parties
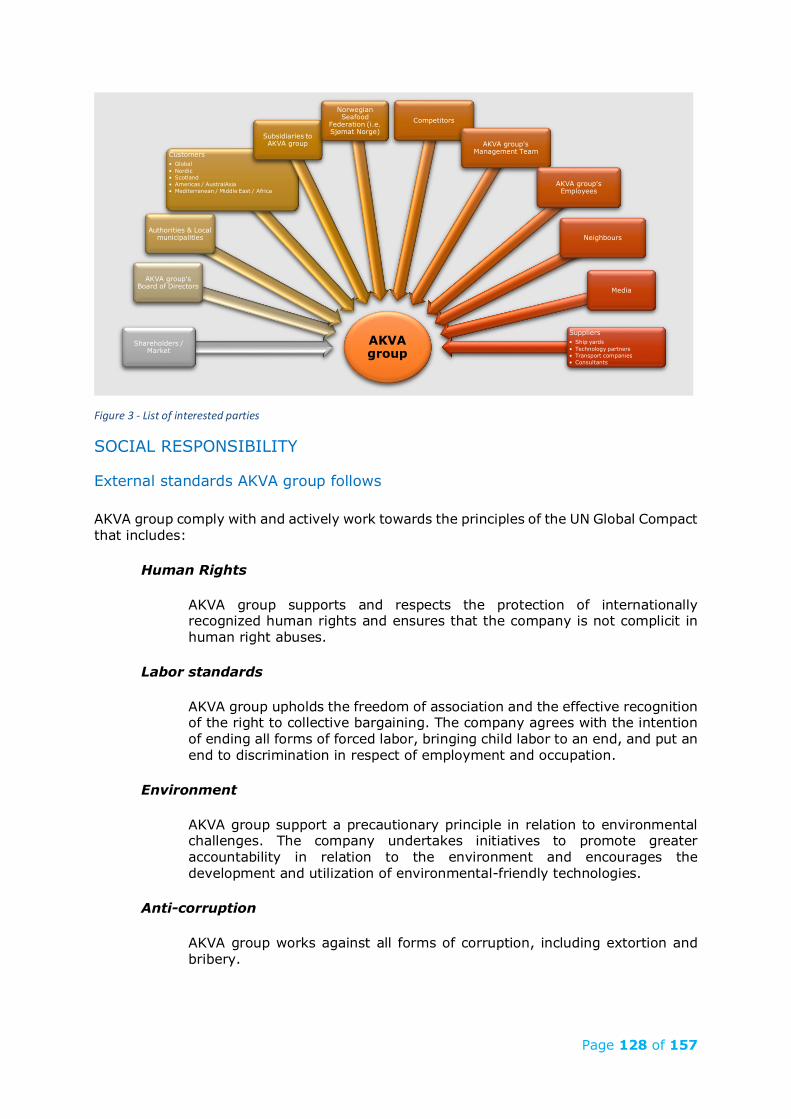
Page 128 of 157
Figure 3 - List of interested parties
SOCIAL RESPONSIBILITY
External standards AKVA group follows
AKVA group comply with and actively work towards the principles of the UN Global Compact that includes:
Human Rights
AKVA group supports and respects the protection of internationally recognized human rights and ensures that the company is not complicit in human right abuses.
Labor standards
AKVA group upholds the freedom of association and the effective recognition of the right to collective bargaining. The company agrees with the intention of ending all forms of forced labor, bringing child labor to an end, and put an end to discrimination in respect of employment and occupation.
Environment
AKVA group support a precautionary principle in relation to environmental challenges. The company undertakes initiatives to promote greater accountability in relation to the environment and encourages the development and utilization of environmental-friendly technologies.
Anti-corruption
AKVA group works against all forms of corruption, including extortion and bribery.
AKVA group
Shareholders / Market
AKVA group's Board of Directors
Authorities & Local municipalities
Customers• Global• Nordic• Scotland• Americas / AustralAsia• Mediterranean / Middle East / Africa
Subsidiaries to AKVA group
Norwegian Seafood
Federation (i.e. Sjømat Norge)
Competitors
AKVA group's Management Team
AKVA group's Employees
Neighbours
Media
Suppliers• Ship yards• Technology partners• Transport companies• Consultants
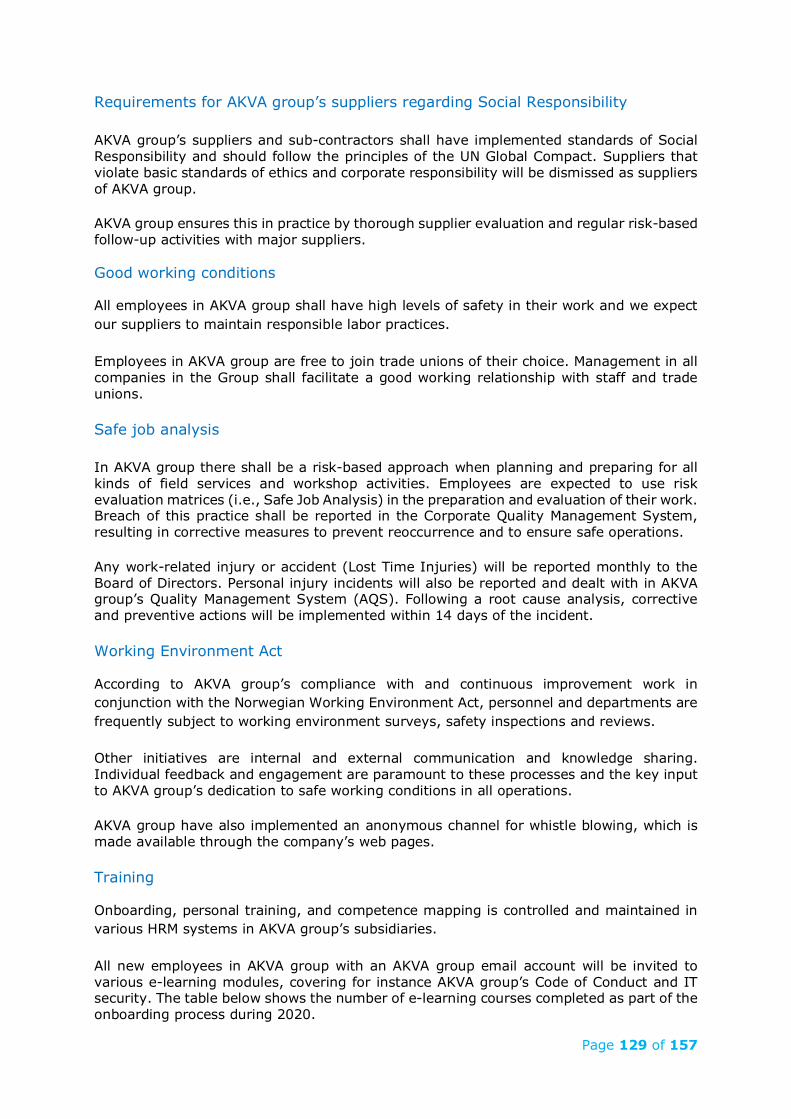
Page 129 of 157
Requirements for AKVA group’s suppliers regarding Social Responsibility
AKVA group’s suppliers and sub-contractors shall have implemented standards of Social Responsibility and should follow the principles of the UN Global Compact. Suppliers that violate basic standards of ethics and corporate responsibility will be dismissed as suppliers of AKVA group.
AKVA group ensures this in practice by thorough supplier evaluation and regular risk-based follow-up activities with major suppliers.
Good working conditions
All employees in AKVA group shall have high levels of safety in their work and we expect our suppliers to maintain responsible labor practices.
Employees in AKVA group are free to join trade unions of their choice. Management in all companies in the Group shall facilitate a good working relationship with staff and trade unions.
Safe job analysis
In AKVA group there shall be a risk-based approach when planning and preparing for all kinds of field services and workshop activities. Employees are expected to use risk evaluation matrices (i.e., Safe Job Analysis) in the preparation and evaluation of their work. Breach of this practice shall be reported in the Corporate Quality Management System, resulting in corrective measures to prevent reoccurrence and to ensure safe operations.
Any work-related injury or accident (Lost Time Injuries) will be reported monthly to the Board of Directors. Personal injury incidents will also be reported and dealt with in AKVA group’s Quality Management System (AQS). Following a root cause analysis, corrective and preventive actions will be implemented within 14 days of the incident.
Working Environment Act
According to AKVA group’s compliance with and continuous improvement work in conjunction with the Norwegian Working Environment Act, personnel and departments are frequently subject to working environment surveys, safety inspections and reviews.
Other initiatives are internal and external communication and knowledge sharing. Individual feedback and engagement are paramount to these processes and the key input to AKVA group’s dedication to safe working conditions in all operations.
AKVA group have also implemented an anonymous channel for whistle blowing, which is made available through the company’s web pages.
Training
Onboarding, personal training, and competence mapping is controlled and maintained in various HRM systems in AKVA group’s subsidiaries.
All new employees in AKVA group with an AKVA group email account will be invited to various e-learning modules, covering for instance AKVA group’s Code of Conduct and IT security. The table below shows the number of e-learning courses completed as part of the onboarding process during 2020.
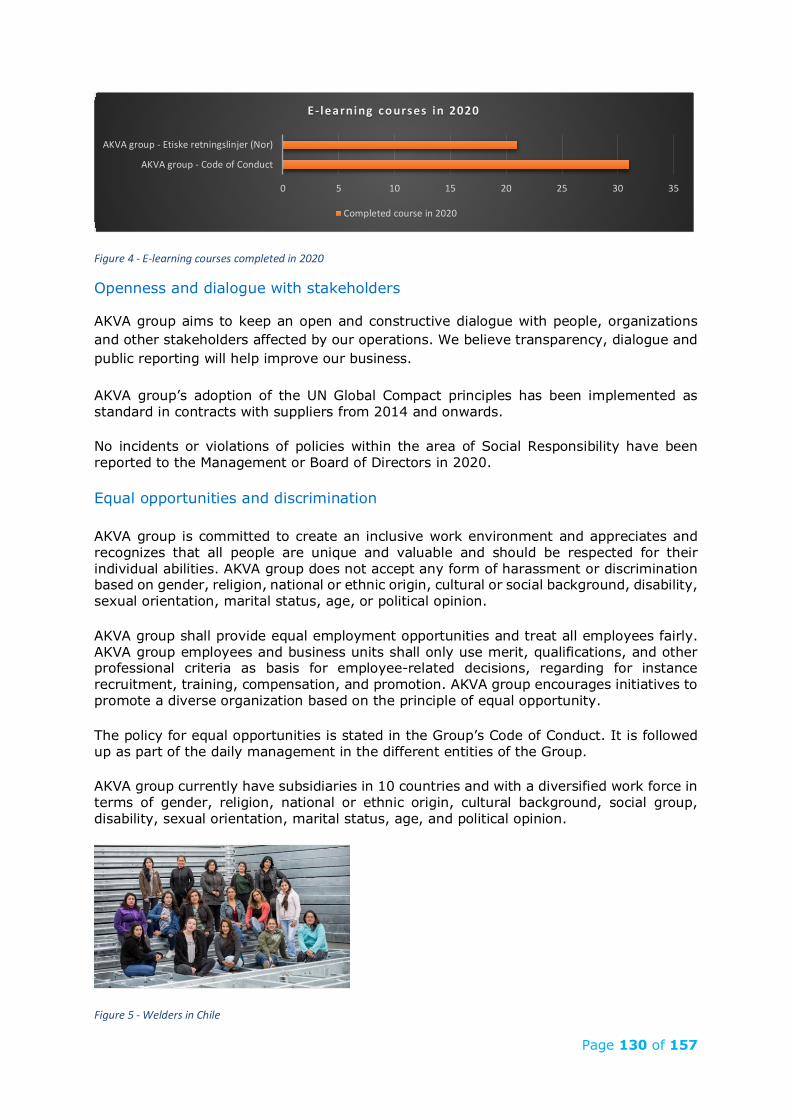
Page 130 of 157
Figure 4 - E-learning courses completed in 2020
Openness and dialogue with stakeholders
AKVA group aims to keep an open and constructive dialogue with people, organizations and other stakeholders affected by our operations. We believe transparency, dialogue and public reporting will help improve our business.
AKVA group’s adoption of the UN Global Compact principles has been implemented as standard in contracts with suppliers from 2014 and onwards.
No incidents or violations of policies within the area of Social Responsibility have been reported to the Management or Board of Directors in 2020.
Equal opportunities and discrimination
AKVA group is committed to create an inclusive work environment and appreciates and recognizes that all people are unique and valuable and should be respected for their individual abilities. AKVA group does not accept any form of harassment or discrimination based on gender, religion, national or ethnic origin, cultural or social background, disability, sexual orientation, marital status, age, or political opinion.
AKVA group shall provide equal employment opportunities and treat all employees fairly. AKVA group employees and business units shall only use merit, qualifications, and other professional criteria as basis for employee-related decisions, regarding for instance recruitment, training, compensation, and promotion. AKVA group encourages initiatives to promote a diverse organization based on the principle of equal opportunity.
The policy for equal opportunities is stated in the Group’s Code of Conduct. It is followed up as part of the daily management in the different entities of the Group.
AKVA group currently have subsidiaries in 10 countries and with a diversified work force in terms of gender, religion, national or ethnic origin, cultural background, social group, disability, sexual orientation, marital status, age, and political opinion.
Figure 5 - Welders in Chile
0 5 10 15 20 25 30 35
AKVA group - Code of Conduct
AKVA group - Etiske retningslinjer (Nor)
E-learning courses in 2020
Completed course in 2020
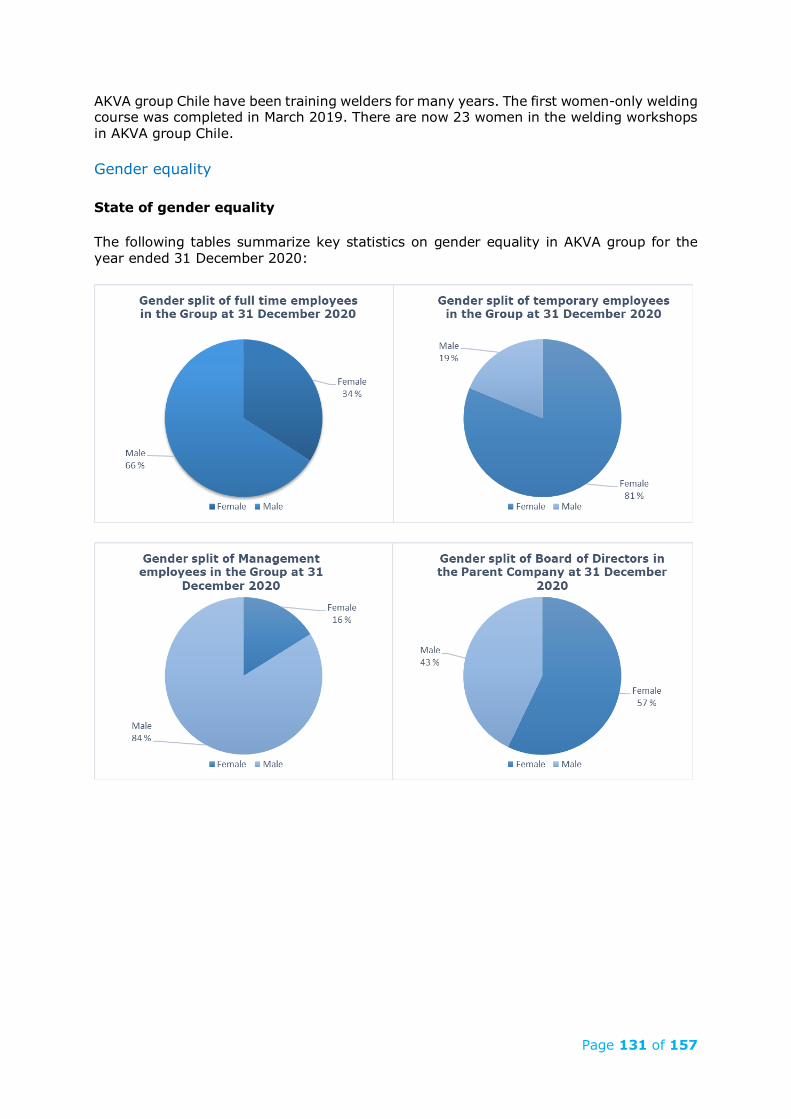
Page 131 of 157
AKVA group Chile have been training welders for many years. The first women-only welding course was completed in March 2019. There are now 23 women in the welding workshops in AKVA group Chile.
Gender equality
State of gender equality
The following tables summarize key statistics on gender equality in AKVA group for the year ended 31 December 2020:
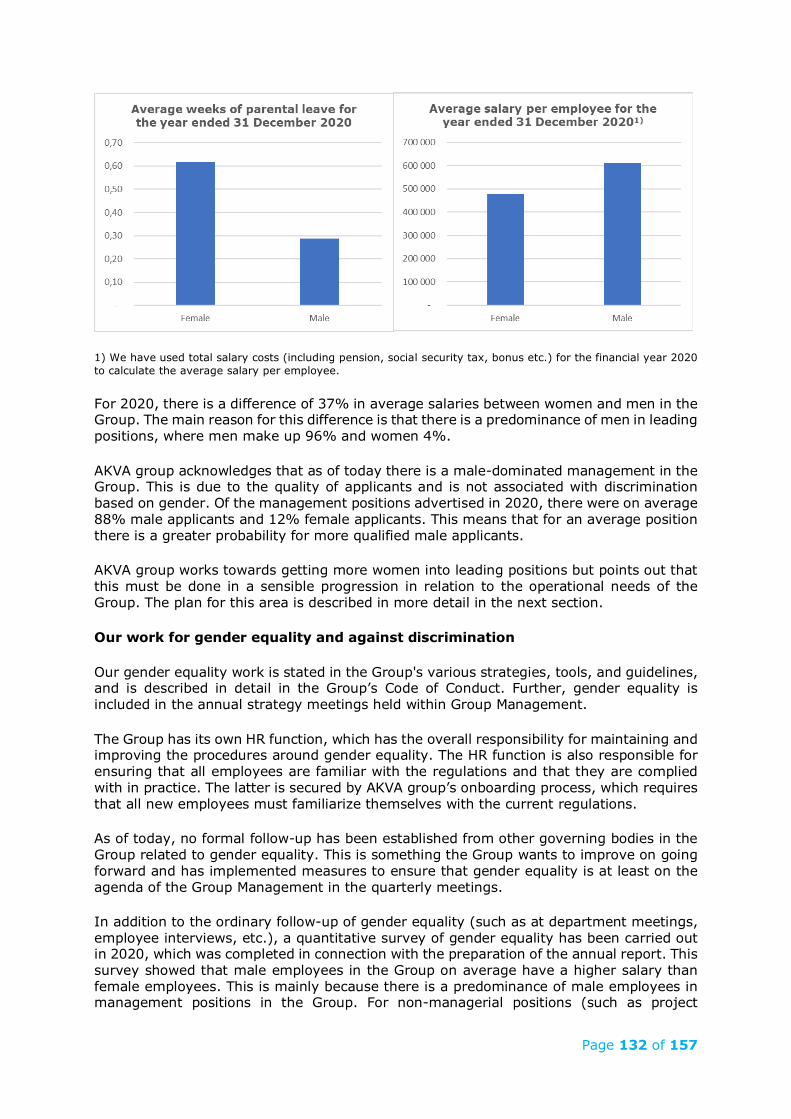
Page 132 of 157
1) We have used total salary costs (including pension, social security tax, bonus etc.) for the financial year 2020 to calculate the average salary per employee.
For 2020, there is a difference of 37% in average salaries between women and men in the Group. The main reason for this difference is that there is a predominance of men in leading positions, where men make up 96% and women 4%.
AKVA group acknowledges that as of today there is a male-dominated management in the Group. This is due to the quality of applicants and is not associated with discrimination based on gender. Of the management positions advertised in 2020, there were on average 88% male applicants and 12% female applicants. This means that for an average position there is a greater probability for more qualified male applicants.
AKVA group works towards getting more women into leading positions but points out that this must be done in a sensible progression in relation to the operational needs of the Group. The plan for this area is described in more detail in the next section.
Our work for gender equality and against discrimination
Our gender equality work is stated in the Group's various strategies, tools, and guidelines, and is described in detail in the Group’s Code of Conduct. Further, gender equality is included in the annual strategy meetings held within Group Management.
The Group has its own HR function, which has the overall responsibility for maintaining and improving the procedures around gender equality. The HR function is also responsible for ensuring that all employees are familiar with the regulations and that they are complied with in practice. The latter is secured by AKVA group’s onboarding process, which requires that all new employees must familiarize themselves with the current regulations.
As of today, no formal follow-up has been established from other governing bodies in the Group related to gender equality. This is something the Group wants to improve on going forward and has implemented measures to ensure that gender equality is at least on the agenda of the Group Management in the quarterly meetings.
In addition to the ordinary follow-up of gender equality (such as at department meetings, employee interviews, etc.), a quantitative survey of gender equality has been carried out in 2020, which was completed in connection with the preparation of the annual report. This survey showed that male employees in the Group on average have a higher salary than female employees. This is mainly because there is a predominance of male employees in management positions in the Group. For non-managerial positions (such as project
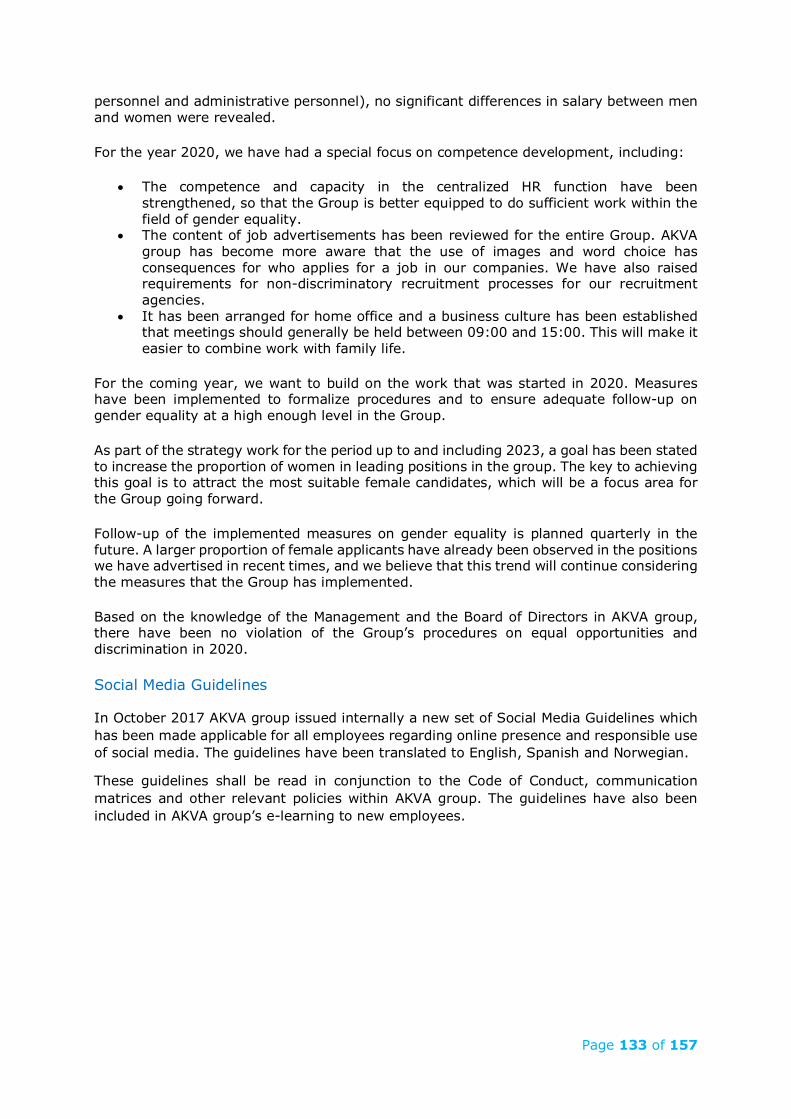
Page 133 of 157
personnel and administrative personnel), no significant differences in salary between men and women were revealed.
For the year 2020, we have had a special focus on competence development, including:
• The competence and capacity in the centralized HR function have been strengthened, so that the Group is better equipped to do sufficient work within the field of gender equality.
• The content of job advertisements has been reviewed for the entire Group. AKVA group has become more aware that the use of images and word choice has consequences for who applies for a job in our companies. We have also raised requirements for non-discriminatory recruitment processes for our recruitment agencies.
• It has been arranged for home office and a business culture has been established that meetings should generally be held between 09:00 and 15:00. This will make it easier to combine work with family life.
For the coming year, we want to build on the work that was started in 2020. Measures have been implemented to formalize procedures and to ensure adequate follow-up on gender equality at a high enough level in the Group.
As part of the strategy work for the period up to and including 2023, a goal has been stated to increase the proportion of women in leading positions in the group. The key to achieving this goal is to attract the most suitable female candidates, which will be a focus area for the Group going forward.
Follow-up of the implemented measures on gender equality is planned quarterly in the future. A larger proportion of female applicants have already been observed in the positions we have advertised in recent times, and we believe that this trend will continue considering the measures that the Group has implemented.
Based on the knowledge of the Management and the Board of Directors in AKVA group, there have been no violation of the Group’s procedures on equal opportunities and discrimination in 2020.
Social Media Guidelines
In October 2017 AKVA group issued internally a new set of Social Media Guidelines which has been made applicable for all employees regarding online presence and responsible use of social media. The guidelines have been translated to English, Spanish and Norwegian.
These guidelines shall be read in conjunction to the Code of Conduct, communication matrices and other relevant policies within AKVA group. The guidelines have also been included in AKVA group’s e-learning to new employees.
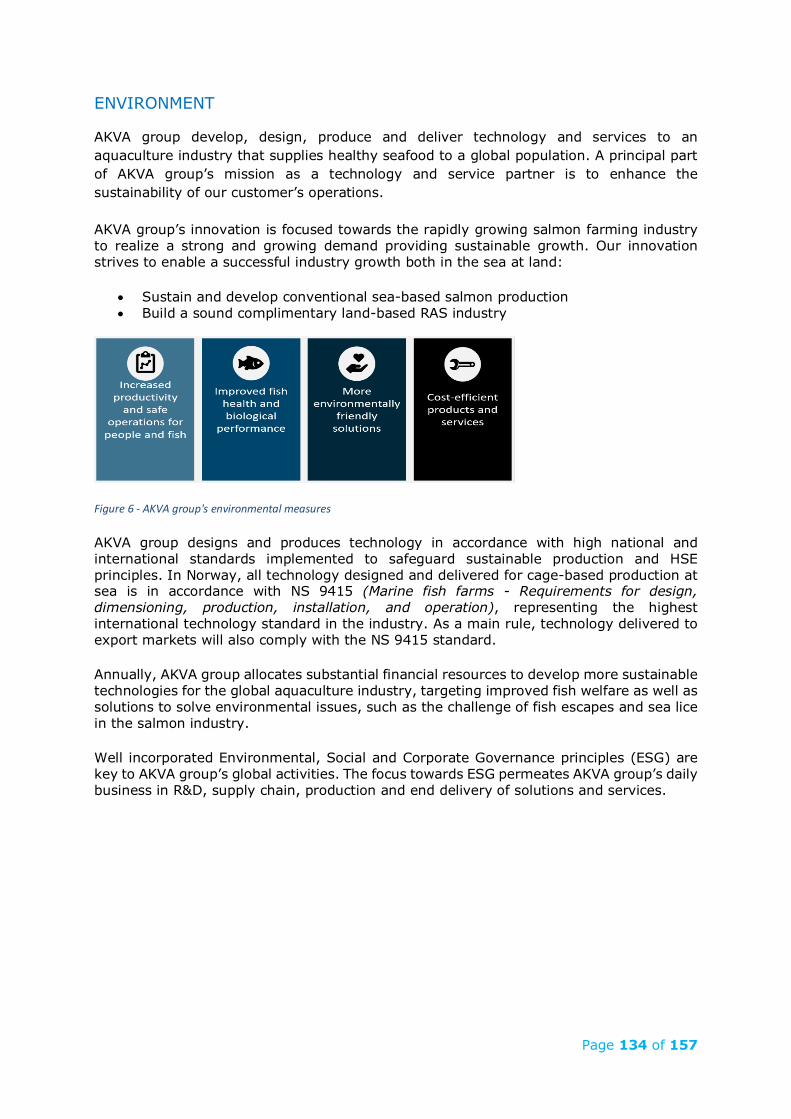
Page 134 of 157
ENVIRONMENT
AKVA group develop, design, produce and deliver technology and services to an aquaculture industry that supplies healthy seafood to a global population. A principal part of AKVA group’s mission as a technology and service partner is to enhance the sustainability of our customer’s operations.
AKVA group’s innovation is focused towards the rapidly growing salmon farming industry to realize a strong and growing demand providing sustainable growth. Our innovation strives to enable a successful industry growth both in the sea at land:
• Sustain and develop conventional sea-based salmon production • Build a sound complimentary land-based RAS industry
Figure 6 - AKVA group's environmental measures
AKVA group designs and produces technology in accordance with high national and international standards implemented to safeguard sustainable production and HSE principles. In Norway, all technology designed and delivered for cage-based production at sea is in accordance with NS 9415 (Marine fish farms - Requirements for design, dimensioning, production, installation, and operation), representing the highest international technology standard in the industry. As a main rule, technology delivered to export markets will also comply with the NS 9415 standard.
Annually, AKVA group allocates substantial financial resources to develop more sustainable technologies for the global aquaculture industry, targeting improved fish welfare as well as solutions to solve environmental issues, such as the challenge of fish escapes and sea lice in the salmon industry.
Well incorporated Environmental, Social and Corporate Governance principles (ESG) are key to AKVA group’s global activities. The focus towards ESG permeates AKVA group’s daily business in R&D, supply chain, production and end delivery of solutions and services.
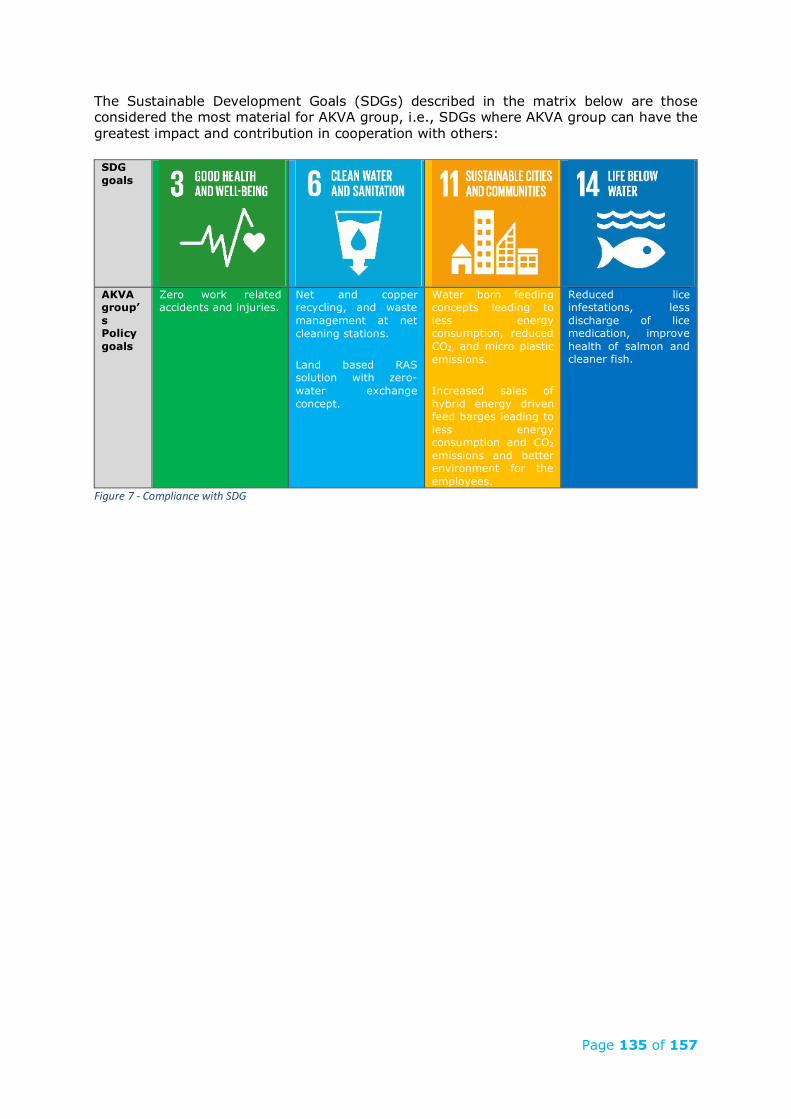
Page 135 of 157
The Sustainable Development Goals (SDGs) described in the matrix below are those considered the most material for AKVA group, i.e., SDGs where AKVA group can have the greatest impact and contribution in cooperation with others:
SDG goals
AKVA group’s Policy goals
Zero work related accidents and injuries.
Net and copper recycling, and waste management at net cleaning stations.
Land based RAS solution with zero-water exchange concept.
Water born feeding concepts leading to less energy consumption, reduced CO2, and micro plastic emissions.
Increased sales of hybrid energy driven feed barges leading to less energy consumption and CO2 emissions and better environment for the employees.
Reduced lice infestations, less discharge of lice medication, improve health of salmon and cleaner fish.
Figure 7 - Compliance with SDG
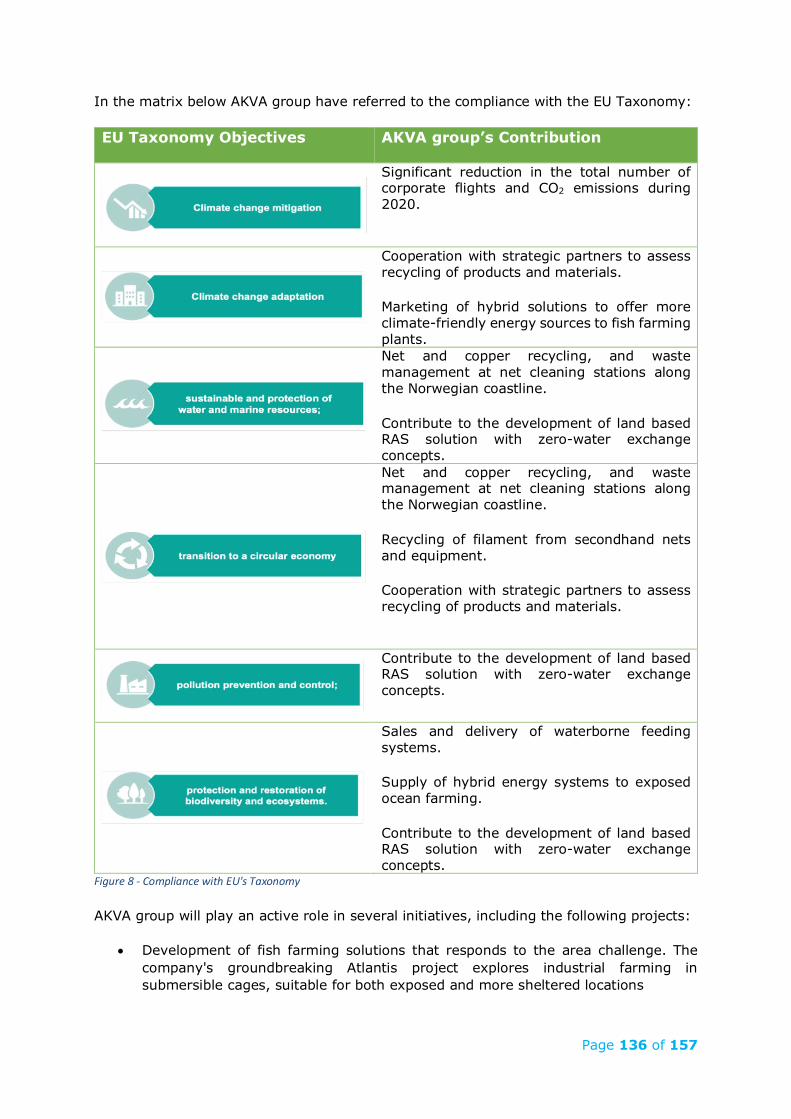
Page 136 of 157
In the matrix below AKVA group have referred to the compliance with the EU Taxonomy:
EU Taxonomy Objectives AKVA group’s Contribution
Significant reduction in the total number of corporate flights and CO2 emissions during 2020.
Cooperation with strategic partners to assess recycling of products and materials.
Marketing of hybrid solutions to offer more climate-friendly energy sources to fish farming plants.
Net and copper recycling, and waste management at net cleaning stations along the Norwegian coastline.
Contribute to the development of land based RAS solution with zero-water exchange concepts.
Net and copper recycling, and waste management at net cleaning stations along the Norwegian coastline.
Recycling of filament from secondhand nets and equipment.
Cooperation with strategic partners to assess recycling of products and materials.
Contribute to the development of land based RAS solution with zero-water exchange concepts.
Sales and delivery of waterborne feeding systems.
Supply of hybrid energy systems to exposed ocean farming.
Contribute to the development of land based RAS solution with zero-water exchange concepts.
Figure 8 - Compliance with EU's Taxonomy
AKVA group will play an active role in several initiatives, including the following projects:
• Development of fish farming solutions that responds to the area challenge. The company's groundbreaking Atlantis project explores industrial farming in submersible cages, suitable for both exposed and more sheltered locations
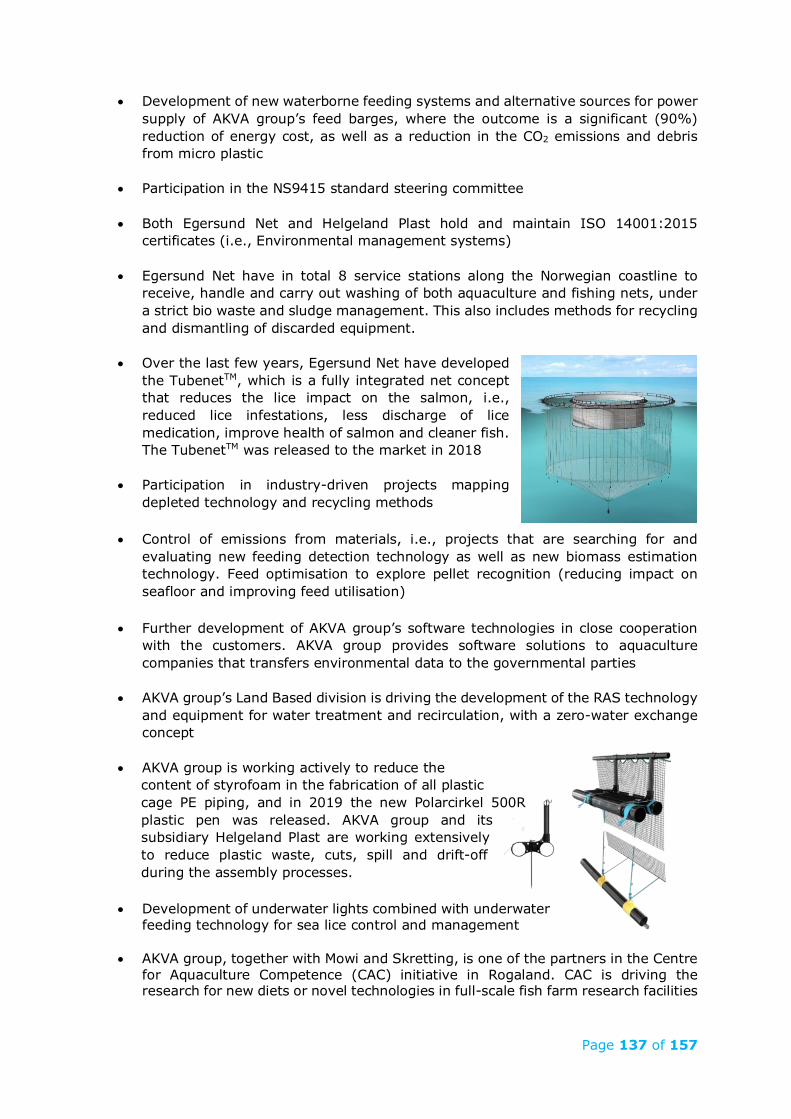
Page 137 of 157
• Development of new waterborne feeding systems and alternative sources for power supply of AKVA group’s feed barges, where the outcome is a significant (90%) reduction of energy cost, as well as a reduction in the CO2 emissions and debris from micro plastic
• Participation in the NS9415 standard steering committee
• Both Egersund Net and Helgeland Plast hold and maintain ISO 14001:2015 certificates (i.e., Environmental management systems)
• Egersund Net have in total 8 service stations along the Norwegian coastline to receive, handle and carry out washing of both aquaculture and fishing nets, under a strict bio waste and sludge management. This also includes methods for recycling and dismantling of discarded equipment.
• Over the last few years, Egersund Net have developed the TubenetTM, which is a fully integrated net concept that reduces the lice impact on the salmon, i.e., reduced lice infestations, less discharge of lice medication, improve health of salmon and cleaner fish. The TubenetTM was released to the market in 2018
• Participation in industry-driven projects mapping depleted technology and recycling methods
• Control of emissions from materials, i.e., projects that are searching for and evaluating new feeding detection technology as well as new biomass estimation technology. Feed optimisation to explore pellet recognition (reducing impact on seafloor and improving feed utilisation)
• Further development of AKVA group’s software technologies in close cooperation with the customers. AKVA group provides software solutions to aquaculture companies that transfers environmental data to the governmental parties
• AKVA group’s Land Based division is driving the development of the RAS technology and equipment for water treatment and recirculation, with a zero-water exchange concept
• AKVA group is working actively to reduce the content of styrofoam in the fabrication of all plastic cage PE piping, and in 2019 the new Polarcirkel 500R plastic pen was released. AKVA group and its subsidiary Helgeland Plast are working extensively to reduce plastic waste, cuts, spill and drift-off during the assembly processes.
• Development of underwater lights combined with underwater feeding technology for sea lice control and management
• AKVA group, together with Mowi and Skretting, is one of the partners in the Centre for Aquaculture Competence (CAC) initiative in Rogaland. CAC is driving the research for new diets or novel technologies in full-scale fish farm research facilities
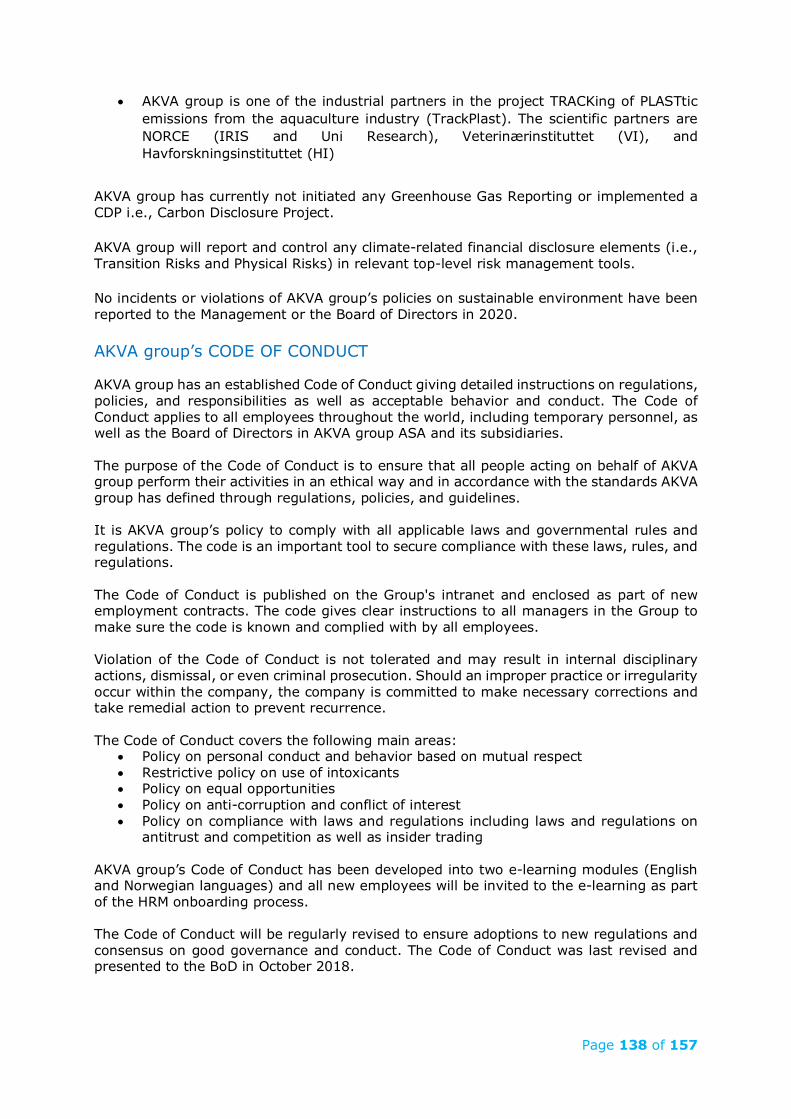
Page 138 of 157
• AKVA group is one of the industrial partners in the project TRACKing of PLASTtic emissions from the aquaculture industry (TrackPlast). The scientific partners are NORCE (IRIS and Uni Research), Veterinærinstituttet (VI), and Havforskningsinstituttet (HI)
AKVA group has currently not initiated any Greenhouse Gas Reporting or implemented a CDP i.e., Carbon Disclosure Project.
AKVA group will report and control any climate-related financial disclosure elements (i.e., Transition Risks and Physical Risks) in relevant top-level risk management tools.
No incidents or violations of AKVA group’s policies on sustainable environment have been reported to the Management or the Board of Directors in 2020.
AKVA group’s CODE OF CONDUCT
AKVA group has an established Code of Conduct giving detailed instructions on regulations, policies, and responsibilities as well as acceptable behavior and conduct. The Code of Conduct applies to all employees throughout the world, including temporary personnel, as well as the Board of Directors in AKVA group ASA and its subsidiaries. The purpose of the Code of Conduct is to ensure that all people acting on behalf of AKVA group perform their activities in an ethical way and in accordance with the standards AKVA group has defined through regulations, policies, and guidelines. It is AKVA group’s policy to comply with all applicable laws and governmental rules and regulations. The code is an important tool to secure compliance with these laws, rules, and regulations. The Code of Conduct is published on the Group's intranet and enclosed as part of new employment contracts. The code gives clear instructions to all managers in the Group to make sure the code is known and complied with by all employees. Violation of the Code of Conduct is not tolerated and may result in internal disciplinary actions, dismissal, or even criminal prosecution. Should an improper practice or irregularity occur within the company, the company is committed to make necessary corrections and take remedial action to prevent recurrence. The Code of Conduct covers the following main areas:
• Policy on personal conduct and behavior based on mutual respect • Restrictive policy on use of intoxicants • Policy on equal opportunities • Policy on anti-corruption and conflict of interest • Policy on compliance with laws and regulations including laws and regulations on
antitrust and competition as well as insider trading AKVA group’s Code of Conduct has been developed into two e-learning modules (English and Norwegian languages) and all new employees will be invited to the e-learning as part of the HRM onboarding process. The Code of Conduct will be regularly revised to ensure adoptions to new regulations and consensus on good governance and conduct. The Code of Conduct was last revised and presented to the BoD in October 2018.
Page 139 of 157
POLICIES AND ACTIONS TO PREVENT CORRUPTION
The policies and actions to prevent corruption are all documented, communicated, maintained, and controlled in AKVA group’s Quality Management Systems. Any deviation or non-conformity shall be reported herein.
AKVA group has a zero-tolerance policy on corruption.
8.1 Bribery
Employees in AKVA group shall not offer or accept any bribes. Bribery occurs when a person gives or offers a gift or favor for himself to achieve an unfair advantage. AKVA group do not allow so-called "facilitation payments", i.e., entitled payments made to secure or expedite something.
8.2 Gifts, favors and entertainment
Employees in AKVA group should exercise caution in giving and receiving gifts, services, and other benefits. Gifts, services, and benefits shall not go beyond what is considered normal and reasonable in the country of operation. The size and circumstances of gifts, services and benefits that are given or received shall always be of such character that an employee can speak openly about it.
The policy underlines that gifts etc. under no circumstances shall be offered or received in relation to:
• a negotiation, an application, an offer, or other situations where it is expected to give something in return, or
• money, loans, and private services, or • frequent gifts or • gifts to public officials or politicians, or • gifts with specific conditions or • a gift with a value exceeding $ 100 (without the prior written consent of the
employee’s manager)
In addition to these guidelines, employees are required to follow local regulations, including tax laws.
8.3 Actions and status
The policy and guidelines to prevent corruption and fraud is stated in AKVA group’s Code of Conduct.
Special management attention is given to safeguard the strict anti-corruption policy, enforcing strong awareness among employees on all levels. Actions are systematically implemented, including:
- Sales and projects staff working towards and/or operating in markets with historical records of corruption, are followed up with special information and training courses aimed at enhancing understanding and awareness
- All new suppliers, distributors and cooperating partners in export markets are subject to an Integrity Due Diligence (IDD) process. AKVA group’s IDD process includes either an integrity due diligence review or a «Red Flag Screening» of the potential supplier/sub-contractor

Page 140 of 157
- Anti-corruption clauses are implemented in all significant contracts with suppliers and customers from 2014 and onwards
- Anti-corruption clauses are included in new agent and distributor agreements - Anti-corruption clauses are included in significant contracts in emerging markets
As of today, no incidents of corruption involving AKVA group have been reported to the Management or the Board of Directors in AKVA group.
8.4 Conflicts of Interest
Employees in AKVA group shall not attempt to gain advantages for themselves or relatives that are unlawful, or in any way may be in violation of AKVA group's interests or reputation.
8.5 Duties, positions, and ownership of external business
Employees in AKVA group shall not be involved in matters or enter into agreements that may either conflict with or damage AKVA group's interests or provide the employee with benefits. This includes conditions that puts a person's independence in question, for instance if an employee or his/her family / close connections have financial interests tied to AKVA group's operations.
Employees in AKVA group shall avoid relationships or agreements that may affect his or her actions or judgement and make others question their independence.
Employees in AKVA group shall avoid ownership interests or directorships in other companies if this is likely to undermine the loyalty to AKVA group. Board positions and/or equity investment in companies that compete or are doing business with AKVA group shall always be subject to prior approval from the employee's supervisor/manager.
8.6 Political activity
AKVA group does not provide any form of financial or other support to political parties. AKVA group may however support or promote political views in matters affecting its business interests.
8.7 Prohibition on the purchase of sexual services
Purchase of sexual services on a business trip, or in connection with the execution of an assignment or work for AKVA group, is unacceptable and shall not occur.
Purchase of sexual services is prohibited by law in Norway. This prohibition also applies abroad for Norwegian citizens and persons with permanent residence in Norway.
8.8 Actions and status
The policy and guidelines on integrity and conflict of interests are stated in AKVA group’s Code of Conduct.
Violation is not tolerated and may, in accordance with relevant legislation, lead to internal disciplinary actions, dismissal or even criminal prosecution. Should an improper practice or deviation occur within the Company, the Company is committed to make necessary corrections and take remedial action to prevent reoccurrence.
Page 141 of 157
No violations of the policy and guidelines for Integrity and Conflict of Interest have been reported to the Management or Board of Directors during 2020.
COMPLIANCE WITH STANDARDS, LAWS AND REGULATIONS
Compliance with standards, national laws and regulations are the basis for AKVA group's operations in all countries.
Employees and directors in AKVA group shall:
• Comply with all applicable laws and regulations when acting on behalf of the company, including the obligation to report and pay taxes;
• Under no circumstances cause or contribute to violations of the general and specific competition regulations, such as price-fixing, illegal market sharing or other conduct in violation of applicable competition laws;
• Comply with applicable legislation and internal instructions on insider trading and insider information. This includes acting on or providing advice on the sale of securities in AKVA group based on non-public information made available through the employee's work in AKVA group.
The policy and guidelines of compliance with laws and regulations are stated in AKVA group’s Code of Conduct and in AKVA group’s Quality Management Systems.
AKVA group have developed and issued guidelines for insiders in accordance with the recommendations set by Oslo Stock Exchange. These guidelines are documented, communicated, maintained, and controlled in AKVA group’s Quality Management Systems.
No incidents of non-compliance with the policies of Compliance have been reported to the Management or the Board of Directors in 2020.
Page 142 of 157
Corporate Governance in AKVA group ASA AKVA group ASA’s objective is to create the greatest possible value for its shareholders over time. Strong corporate governance will contribute to reducing risk and ensure sustainable value creation. Pursuant to section 3-3(b) of the Norwegian Accounting Act and the Norwegian Code of Practice for Corporate Governance, last revised by the Norwegian Corporate Governance Board (the "NCGB") on 17 October 2018 (the "Code"; which recommendations are highlighted in blue text below), the board of directors (the "Board") of AKVA group ASA ("AKVA group" or the "Company", and together with its subsidiaries the "Group") reviews and updates the Company’s principles for corporate governance on an annual basis. This report is included in the Company’s annual report. 1. Implementation and reporting on corporate governance The board of directors must ensure that the company implements sound corporate governance. The board of directors must provide a report on the company’s corporate governance in the directors' report or in a document that is referred to in the directors' report. The report on the company’s corporate governance must cover every section of the Code of Practice. If the company does not fully comply with the Code of Practice, the company must provide an explanation of the reason for the deviation and what solution it has selected. The board of AKVA group has defined guidelines to ensure that the Company has good corporate governance to, inter alia, support achievement of the Company's core objectives on behalf of its shareholders and to create a strong, sustainable company. The Board believes that good corporate governance involves openness and a trustful cooperation between all parties involved in and with the Group: The shareholders, the Board and the management, employees, customers, suppliers, public authorities, and the society in general. By pursuing the principles of corporate governance, approved by the Board, the Board and management shall contribute to achieving the following objectives:
• Openness and honesty. Communication with the interest groups of AKVA group shall be based on openness and honesty on issues relevant for the evaluation of the development and position of the Company.
• Independence. The relationship between the Board, the management and the shareholders shall be based on independence. Independence shall ensure that decisions are made on an unbiased and neutral basis.
• Equal treatment. AKVA group has equal treatment and equal rights for all shareholders as one of its primary objectives.
• Control and management. Good control and corporate governance mechanisms shall contribute to predictability and reduce the level of risks for shareholders and other interest groups.
The development of, and improvements in, AKVA group's corporate governance principles are considered by the Board as ongoing and important processes. The individual recommendations in the Code are discussed below. The Code and its recommendations are available on the NCGB website, https://nues.no/. To a large extent AKVA group’s principle correspond to the Code. Possible deviations from the Code are
Page 143 of 157
discussed under the relevant sections below, and any deviation is accounted for and any alternative practice adopted by the Company explained. Deviation from the Recommendation: None 2. Business The company’s articles of association should clearly describe the business that the company shall operate. The board of directors should define clear objectives, strategies, and risk profiles for the company's business activities such that the company creates value for shareholders. The company should have guidelines for how it integrates considerations related to its stakeholders into its value creation. The board of directors should evaluate these objectives, strategies, and risk profiles at least yearly. The operations of AKVA group shall be in compliance with the business objective as set forth in paragraph 3 of the Company’s articles of association (the "Articles of Association") which reads as follows:
“The purpose of the company is to develop, produce, project, sell and market own and purchased products, and everything connected to such activity, including participation in other companies with similar activities. The activities of the company shall in particular be directed towards technology for farming of fish and animals.”
The full Articles of Association are included in the annual report and available at https://ir.akvagroup.com. The Company’s strategic goals and objectives are described thoroughly in the report. The Board has defined clear objectives, strategies, and risk profiles for the Company's business activities to ensure that the Company creates value for shareholders. These objectives, strategies and risk profiles are evaluated by the Board yearly. The Company has established guidelines and a Code of Conduct addressing corporate social responsibility, including matters that relate to human rights, employee rights and social matters, the external environment, the prevention of corruption, the working environment, equal treatment, discrimination, and environmental impact, as well as setting out defined values upon which the Company should base its activities. These are reviewed on a yearly basis and are included in the annual report pursuant to the Norwegian Accounting Act. Deviation from the Recommendation: None 3. Equity and dividends The board of directors should ensure that the company has a capital structure that is appropriate to the company's objective, strategy, and risk profile. The board of directors should establish and disclose a clear and predictable dividend policy. The background to any proposal for the board of directors to be given a mandate to approve the distribution of dividends should be explained. Mandates granted to the board of directors to increase the company’s share capital or to purchase own shares should be intended for a defined purpose. Such mandates should be limited in time to no later than the date of the next annual general meeting. At year end 2020 AKVA group had a consolidated equity of MNOK 1,042 which accounts for 32% of the total consolidated assets of the Company. The view of the Board is that the
Page 144 of 157
above stated equity capital level is appropriate in consideration of the Company’s objectives, strategy, and risk profile. Dividend policy: The Company’s main objective is to maximise the value of the investment made by its shareholders through both increased share prices and dividend payments. The Company aims to give the shareholders a competitive return on investment by a combination of cash dividend and share price increase. The Company’s dividend policy shall be stable and predictable. When deciding the dividend, the Board will take into consideration expected cash flow, capital expenditure plans, financing requirements/compliance, appropriate financial flexibility, and the level of net interest-bearing debt. The Company needs to be in compliance with all legal requirements to pay dividend. The Company will target to pay dividend twice a year. The dividend policy has been established by the Board and is disclosed on the Company’s website. AKVA group paid out a dividend of NOK 1.00 per share in 2020, in total NOK 33,156,420. In order to enable the Company to maintain the dividend policy, the Board will propose that the Annual General Meeting to be held in May 2021 authorizes the Board pursuant to the Norwegian Public Limited Liability Companies Act (the "Public Companies Act" or the "Act") § 8-2(2) to approve the distribution of dividends based on the Company’s annual accounts for 2020. The proposed authority may be used to approve the distribution of dividends up to an aggregate amount of NOK 100,000,000. The authorization shall, if adopted by the Annual General Meeting, be in force from the date of the general meeting until the earlier of the time of the Annual General Meeting in 2022 and 30 June 2022. The general meeting held on 7 May 2020 resolved to grant the Board an authorization to increase the Company’s share capital by up to NOK 3,333,430 through subscription of new shares. The authorization is in force until the earlier of the date of the Annual General Meeting in 2021 and 30 June 2021 and replaced all previous Board authorizations to increase the Company’s share capital. The authorization does not authorize the Board to (i) waive the pre-emptive right of shareholders pursuant to section 10-4 of the Act; (ii) carry out a capital increase by contribution in kind, (iii) incur any special obligations on behalf of the Company, cf. section 10-2 of the Act, (iv) decide on mergers pursuant to section 13-5 of the Act, or (v) use the authorization in connection with the Company’s option program. The Board will proposed that the Annual General Meeting to be held in May 2021 repeats the authorization granted to the Board in 2020 with a limitation corresponding to 10% of authorized share capital, but so that the Board is not authorized to waive the pre-emptive right of shareholders pursuant to section 10-4 of the Act, nor carry out a capital increase by contribution in kind, nor incur special obligations on behalf of the Company, cf. section 10-2 of the Act, and nor decide on mergers pursuant to section 13-5 of the Act, and so that the authorization may not be used in connection with the Company’s option program. The new authorization shall, if adopted by the Annual General Meeting, expire at the earliest on the date of the Annual General Meeting in 2022 and 30 June 2022. It is further proposed that the new authorization shall replace all previous authorizations to the Board to increase the Company’s share capital. The general meeting in 2020 also resolved to grant the Board authorization to acquire own shares which have been fully paid in accordance with the rules of §§ 9-2 – 9-4 of the Act. The shares to be acquired under this authorization shall not be acquired at a higher value than market terms on a regulated market where the shares are traded, and the minimum
Page 145 of 157
and maximum price that may be paid for each share is NOK 1 and NOK 150, respectively. This authorization may be used one or several times. The aggregate maximum face value of the shares which the Company may acquire pursuant to this authorization is NOK 833,358, which equalled approximately 2.5% of the Company’s share capital. Acquisitions of shares pursuant to this authorization may only take place if the Company’s distributable reserves according to the most recent balance sheet exceed the purchase price for the shares to be acquired. The Board is free to determine how the Company’s own shares will be acquired and sold, provided that an acquisition under this authorization must be in accordance with prudent and good business practice, with due consideration to losses which may have occurred after the balance-sheet date or to expected losses. The authorization is valid until the earlier of the date of Annual General Meeting of 2021 and 30 June 2021. This authorization replaced the authorization for acquisition of own shares granted by the Annual General Meeting on 9 May 2019. The Board has proposed that the Annual General Meeting to be held in May 2021 repeats the authorization granted to the Board in 2020 to acquire own shares of a maximum face value of NOK 833,358 (equal to approximately 2.5%), and that the new mandate shall expire at the earliest of the Annual General Meeting in 2022 and 30 June 2022. It is further proposed that the new authorization shall replace all previous authorizations to the Board to purchase own shares. Deviation from the Recommendation: The Board authorizations granted by the Annual General Meeting in 2020 to increase the share capital and to acquire own shares respectively are not limited to defined purposes. The same applies to the Board authorizations to be proposed to the Annual General Meeting in 2021. The Board however believes that it is in the best interest of the Company that the Board has flexibility to use the authorizations as considered necessary and advantageous from time to time at the Board's discretion, always considering the interests of the Company's shareholders and other stakeholders. It should be noted that the authorization to increase the share capital has restrictions as to waiver of the pre-emptive right of shareholders and certain other restrictions as described above. 4. Equal treatment of shareholders and transactions with close associates Any decision to waive the pre-emption rights of existing shareholders to subscribe for shares in the event of an increase in share capital should be justified. Where the board of directors resolves to carry out an increase in share capital and waive the pre-emption rights of existing shareholders on the basis of a mandate granted to the board, the justification should be publicly disclosed in a stock exchange announcement issued in connection with the increase in share capital. Any transactions the company carries out in its own shares should be carried out either through the stock exchange or at prevailing stock exchange prices if carried out in any other way. If there is limited liquidity in the company’s shares, the company should consider other ways to ensure equal treatment of all shareholders. In the event of any not immaterial transactions between the company and shareholders, a shareholder´s parent company, members of the board of directors, executive personnel, or close associates of any such parties, the board should arrange for a valuation to be obtained from an independent third party. This will not apply if the transaction requires the approval of the general meeting pursuant to the requirements of the Public Companies Act. Independent valuations should also be arranged in respect of transactions between companies in the same group where any of the companies involved have minority shareholders.
Page 146 of 157
Pre-emptive rights and transactions in own shares If the proposed Board authorization to increase the share capital referred to above is approved by the Annual General Meeting in 2021, the Board is not authorized to waive the shareholder's pre-emptive rights in connection with a share capital increase under the authorization. In the event the Board would propose to the general meeting that the pre-emptive rights of shareholders should be waived, this proposal will be justified in the notice of the general meeting and disclosed in a stock exchange notice in connection with the capital increase. Any transactions carried out by the Company in its own shares will be carried out either on the Oslo Stock Exchange or at prevailing stock market prices. In situations with limited liquidity in the Company’s shares, the Board will consider alternative means to ensure the equal treatment of shareholders. Transactions between related parties The Company is not aware of any potential conflicts of interest between the duties owed to the Company by the members of the Board or the Company’s management, and their private interests or other duties. The Company is party to facility lease agreements with companies that are controlled by shareholders of AKVA group; however, these are all based on arm’s length market terms. In order to avoid conflicts of interest, the Company has guidelines pursuant to which the members of the Board and the company’s management must act. Deviation from the Recommendation: None other than as stated above 5. Shares and negotiability The company should not limit any party's ability to own, trade or vote for shares in the company. The company should provide an account of any restrictions on owning, trading, or voting for shares in the company. The Company's shares are freely negotiable. The Articles of Association place no restrictions on negotiability. Deviation from the Recommendation: None 6. General meetings The board of directors should ensure that the company's shareholders can participate in the general meeting. The board of directors should ensure that:
• the resolutions and supporting information distributed are sufficiently detailed, comprehensive, and specific to allow shareholders to form a view on all matters to be considered at the meeting
• any deadline for shareholders to give notice of their intention to attend the meeting is set as close to the date of the meeting as possible
• the members of the board of directors and the chairman of the nomination committee are present at the general meeting
• the general meeting is able to elect an independent chairman for the general meeting
• shareholders should be able to vote on each individual matter, including on each individual candidate nominated for election. Shareholders who cannot attend the
Page 147 of 157
meeting in person should be given the opportunity to vote. The company should design the form for the appointment of a proxy to make voting on each individual matter possible and should nominate a person who can act as a proxy for shareholders
The Annual General Meeting in 2020 was in all material respect carried out in accordance with recommendation no. 6 of the Code with the following exceptions:
- The Company does not appoint an independent proxy to vote on behalf of shareholders. In the Company’s opinion the shareholder interests are duly protected through participation with a personal proxy or by granting a proxy with voting instructions to the chairman of the meeting, the chairman of the Board or any person appointed by him
- The agenda and proxy form for the Annual General Meeting did not open for voting in individual candidates for the Board. The nomination committee made a recommendation for a board composition reflecting several criteria, where inter alia stakeholder interests, independence, competence, and experience have been weighed to provide a representative and skilled board. This would not be possible to achieve with separate voting for individual candidates.
The Annual General Meeting in 2020 was chaired by an independent chairman. It is the intention of the Board to nominate an independent chairman also for future general meetings. Deviation from the Recommendation: None other than as stated above 7. Nomination committee The company should have a nomination committee, and the nomination committee should be laid down in the company’s articles of association. The general meeting should stipulate guidelines for the duties of the nomination committee, elect the chairperson and members of the nomination committee, and determine the committee’s remuneration. The nomination committee should have contact with shareholders, the board of directors and the company’s executive personnel as part of its work on proposing candidates for election to the board. The members of the nomination committee should be selected to take into account the interests of shareholders in general. The majority of the committee should be independent of the board of directors and the executive personnel. No more than one member of the nomination committee should be a member of the board of directors, and any such member should not offer himself for re-election to the board. The nomination committee should not include the company’s chief executive or any other executive personnel. The nomination committee’s duties should be to propose candidates for election to the board of directors and nomination committee (and corporate assembly where appropriate) and to propose the fees to be paid to members of these bodies. The nomination committee should justify why it is proposing each candidate separately. The company should provide information on the membership of the committee and any deadlines for proposing candidates. The Articles of Association provide for a nomination committee. The nomination committee shall evaluate and recommend candidates for directors elected by the shareholders as well
Page 148 of 157
as directors’ remuneration, both for the Board and for the nomination committee itself. The nomination committee shall consider and recommend resolutions at the general meeting on the following matters:
- Candidates for election as members of the Board - Candidates for election as members of the nomination committee and the chairman
of the committee - The proposed remuneration of the Board and the members of the nomination
committee - Any proposed amendments to the nomination committee Charter - Approve the text in the annual report (Corporate Governance section) of the
Company, related to the nomination committee The nomination committee shall consist of three members elected by the general meeting. The general meeting also elects the chairperson of the nomination committee. The nomination committee’s work is based on the nomination committee Charter approved by the Annual General Meeting in May 2007, which includes appropriate arrangements for shareholders to submit proposals to the committee for candidates for election. Composition The current nomination committee was elected by the Annual General Meeting on 7 May 2020 and consists of:
- Eivind Helland, (chair, for 1 year) General Manager, Blue Planet AS - Bjørnar Mikalsen (for 1 year), Head of Sales, Skretting Nord - Ingvald Fardal (for 1 year), MsC Business Administration
None of the nomination committee members are members of the Board. The nomination committee is of the opinion that the composition reflects the common interest of all the Company’s shareholders. The work of the committee The nominating committee has held 5 meetings since the Annual General Meeting in 2020. Deviation from the Recommendation: None 8. Board of directors: Composition and independence The composition of the board of directors should ensure that the board can attend to the common interests of all shareholders and meets the company’s need for expertise, capacity, and diversity. Attention should be paid to ensuring that the board can function effectively as a collegiate body. The composition of the board of directors should ensure that it can operate independently of any special interests. The majority of the shareholder-elected members of the board should be independent of the company’s executive personnel and material business contacts. At least two of the members of the board elected by shareholders should be independent of the company’s main shareholder(s). The board of directors should not include executive personnel. If the board does include executive personnel, the company should provide an explanation for this and implement consequential adjustments to the organisation of the work of the board, including the use of board committees to help ensure more independent preparation of matters for discussion by the board, cf. Section 9.
Page 149 of 157
The general meeting (or the corporate assembly where appropriate) should elect the chairman of the board of directors. The term of office for members of the board of directors should not be longer than two years at a time. The annual report should provide information to illustrate the expertise of the members of the board of directors, and information on their record of attendance at board meetings. In addition, the annual report should identify which members are considered to be independent. Members of the board of directors should be encouraged to own shares in the company. Composition of the Board According to the Articles of Association, the Board shall consist of four to ten members. The Board currently consists of the following 7 members: Hans Kristian Mong (Chairperson), Anne Breiby (Deputy Chairperson), Kristin Reitan Husebø, Frode Teigen, Ragnhild Ree, Helen Helland and Magnus Røkke. The 3 latter directors have been elected by and from the employees. All the shareholder-elected members of the Board are independent from executive management and material business contacts. Two of the shareholder-elected members of the Board are independent from the main shareholders of the Company. The Board elects the chair and the deputy chair. All the members of the Board are generally encouraged to own shares in the Company. Hans Kristian Mong and Frode Teigen represents the largest shareholder of the Company, Egersund Group AS. The other members of the Board are independent of shareholders and other stakeholders. Further details of the individual directors can be found in the annual Report. The nomination committee’s recommendation of candidates, including the basis of the recommendation, will be appended to the notice for the Annual General Meeting, which will be published on the Company’s website and on the Oslo Stock Exchange’s reporting site, www.newsweb.no. Deviation from the Recommendation: None other than as stated above regarding the Board's competence to elect the chairman of the Board. 9. The work of the board of directors The board of directors should issue instructions for its own work as well as for the executive management with particular emphasis on clear internal allocation of responsibilities and duties. The board of directors should ensure that members of the board of directors and executive personnel make the company aware of any material interests that they may have in items to be considered by the board of directors. In order to ensure a more independent consideration of matters of a material character in which the chairman of the board is, or has been, personally involved, the board's consideration of such matters should be chaired by some other member of the board.
Page 150 of 157
The Public Companies Act stipulates that large companies must have an audit committee. The entire board of directors should not act as the company’s audit committee. Smaller companies should consider establishing an audit committee. In addition to the legal requirements on the composition of the audit committee etc., the majority of the members of the committee should be independent. The board of directors should also consider appointing a remuneration committee in order to help ensure thorough and independent preparation of matters relating to compensation paid to the executive personnel. Membership of such a committee should be restricted to members of the board who are independent of the company’s executive personnel. The board of directors should provide details in the annual report of any board committees appointed. The board of directors should evaluate its performance and expertise annually. Board responsibilities The Board has the ultimate responsibility for the management and organisation of the Company and supervising routine management and business activities. This involves that the Board is responsible for establishing control arrangements to secure that the Company operates in accordance with the adopted values and the Code of Conduct as well as with shareholders’ expectations of good corporate governance. The Board primarily looks after the interests of all the shareholders but is also responsible to the Company’s other stakeholders. The Board’s main task is to ensure that the Company develops and creates shareholder value. Furthermore, the Board shall contribute to the shaping of and implementation of the Group’s strategy, ensure appropriate supervision and control of management and in other ways ensure that the Group is well operated and organised. The Board sets the objectives for the financial performance and adopts the Company’s plans and budgets. Items of major strategic or financial importance for the Group are the responsibility of the Board. The Board appoints the CEO, defines his or her work description and authority and sets his or her salary and other compensation. The Board each year produces an annual plan for its work as recommended. Instructions to the Board The latest version of the Board’s instructions was approved by the Board in a board meeting on 10 April 2014. The instructions cover the following points: Composition of the Board, the Board’s duties, day-to-day management, calling of Board meetings and related issues, the Board’s decisions, Board minutes, disqualification and conflict of interest, confidentiality obligation, convening general meetings, insider rules and ethical guidelines for conduct of business. The Board can decide to deviate from instructions in certain cases. The members of the Board shall pursuant to the instruction to the Board make the Company aware of any material interests that they may have in items to be considered by the Board. Financial Reporting The Board receives regular financial reports on the Group’s economic and financial status. Audit Committee In accordance with section 6-41 of the Act, AKVA group has established an audit committee, consisting of Anne Breiby (Chair) and Kristin Reitan Husebø. The Group CFO
Page 151 of 157
acts as the secretary of the committee. The mandate and work of the audit committee is described in further detail under item 10 below. The audit committee has been operating since 2011. 6 meetings were held in the committee during 2020. The remuneration committee The Company has established a remuneration committee, and the current Charter for the remuneration committee was approved by the Board in a board meeting on 21 September 2006. The committee’s tasks revolve around the CEO’s terms of employment and the remuneration of the executive management including salary levels, bonus systems, options schemes, pension schemes, employment contracts etc. The committee submits recommendations to the Board for final approval. The current members are Hans Kristian Mong (Chair) Kristin Reitan Husebø and Frode Teigen. The committee has had 1 meeting since the 2020 Annual General Meeting.
The Board’s self-evaluation The Board completes a self-evaluation annually in terms of efficiency, competence, and the Board’s duties in general. The evaluation is made available for the nomination committee. Deviation from the Recommendation: None 10. Risk management and internal control The board of directors must ensure that the company has sound internal control and systems for risk management that are appropriate in relation to the extent and nature of the company’s activities. Internal control and the systems should also encompass the company’s guidelines etc. for how it integrates considerations related to stakeholders into its creation of value. The board of directors should carry out an annual review of the company’s most important areas of exposure to risk and its internal control arrangements. The Board and internal control The Board ensures that the Company has appropriate internal control procedures and appropriate risk management systems tailored to its business. Managing operational risk primarily takes place within the operational subsidiaries, but with the Company’s management as an active driving force through its positions in the boards of the subsidiaries. Generally, the subsidiaries have established adequate practices for such risk management. The Group is exposed to currency, interest rate, and market risk, as well as credit risk and operational risk. The Group has implemented a quality management system which details the processes related to continuous improvements and operational risks. AKVA group ASA is ISO 9001:2015 certified by the accredited certification body DNV. The Groups' financial guidelines ensure the monitoring of financial risk. Management of exposure in financial markets, including currency, interest rate and counterparty risk, is emphasised in the Company’s governing documents. Further details on these principles are provided in note 16 to the Group's financial statements and AKVA group’s financial statements.
Page 152 of 157
The Group has developed an authority matrix which is included in its governing documents. Management regularly prepares performance reports that are reviewed by the Board. The interim financial statements are subject to review in board meetings. The Board’s work plan The Board has established an annual work plan that includes an annual review of compliance of external and internal laws and regulations, risk and the HSE-situation, financial risks and identification of risk related to the strategic goals and risk handling. By carrying out the established work plan, the Board controls that the Company has sound internal control and systems for risk management for the Company’s activities, including systems suitable for controlling the compliance with the Company’s guidelines for how it integrates considerations related to stakeholders into its creation of value. Audit committee The mandate of the committee is to monitor and evaluate the Group’s financial reporting, including to evaluate substantial accounting issues, accounting principles and procedures applied by the Group in its financial reporting to the Oslo Stock Exchange. The committee is to evaluate the work of the Group’s external auditor, including the auditor’s independence from management and compliance with rules and regulations regarding services beyond financial audit. The committee also discusses the scope of the audit with the external auditor as well as evaluates reports from the auditor to the Board and management of the Group. The audit committee nominates external auditor for the Group as well as propose compensation for the external auditor to the Board. The audit committee is also monitoring the Groups internal control systems, including managements operational and financial risk management. The audit committee is free to address any other issue it finds necessary to fulfil its mandate. Deviation from the Recommendation: None 11. Remuneration of the board of directors The remuneration of the board of directors should reflect the board’s responsibility, expertise, time commitment and the complexity of the company’s activities. The remuneration of the board of directors should not be linked to the company’s performance. The company should not grant share options to members of its board. Members of the board of directors and/or companies with which they are associated should not take on specific assignments for the company in addition to their appointment as a member of the Board. If they do nonetheless take on such assignments this should be disclosed to the full board. The remuneration for such additional duties should be approved by the board. Any remuneration in addition to normal directors’ fees should be specifically identified in the annual report. It is the Board’s opinion that the size of the remuneration of the Board is in compliance with the criteria in the recommendation concerning inter alia the Board’s responsibility and expertise. Furthermore, the following applies to the remuneration:
• The remuneration is not linked to the company’s performance, and the Board members are not granted share options
Page 153 of 157
• None of the Board members and/or companies with which they are associated, have taken on specific assignments for the Company in addition to their appointment as a member of the Board.
• The remuneration of the Board is proposed to the general meeting by the nomination committee
Deviation from the Recommendation: None 12. Remuneration of the executive management The board of directors is required by law to prepare guidelines for the remuneration of the executive personnel. These guidelines are communicated to the Annual General Meeting. The board of director’s statement on the remuneration of executive personnel should be a separate appendix to the agenda for the general meeting. It should also be clear which aspects of the guidelines are advisory and which, if any, are binding. The general meeting should vote separately on each of these aspects of the guidelines. The guidelines for the remuneration of the executive personnel should set out the main principles applied in determining the salary and other remuneration of the executive personnel. The guidelines should help to ensure convergence of the financial interests of the executive personnel and the shareholders. Performance-related remuneration of the executive personnel in the form of share options, bonus programmes or the like should be linked to value creation for shareholders or the company’s earnings performance over time. Such arrangements, including share option arrangements, should be an incentive to good performance and be based on quantifiable factors over which the employee in question can have influence. Performance-related remuneration should be subject to an absolute limit. Guidelines and terms The main principles for the Company’s executive personnel remuneration policy is that the basic salary shall promote value creation in the Company and contribute to aligned interests between shareholders and executive personnel. The basic salary shall not be of a type or size that may negatively affect the Company’s reputation. As the industry leader in our sector, AKVA group is dependent on being able to offer compensation that enable AKVA to recruit the most able managers. It is the Board’s policy to employ the most competent managers by offering compensation packages that are competitive with those offered in other similar industries and in the international market. The Board has established a remuneration committee, which shall make recommendations to the Board with respect to the remuneration of the Company's CEO and other executive personnel. The Board and the remuneration committee have the responsibility to establish guidelines and recommendations with regards to the remuneration of the CEO and the executive management. Each year the compensation committee undertakes a thorough review of the remuneration and other compensation to the CEO and the executive management. The review is based upon market sampling of similar positions. The structure and level of the remuneration and incentive system for the CEO and the executive management is determined by the Board. The fixed remuneration and performance-based remuneration is described in the notes to the annual accounts. The total remuneration to the CEO and other members of the executive management consists of base salary, variable salary, benefits in kind and pension schemes. Performance-related remuneration of the executive management in the form of bonus programmes, share-based incentives or similar shall be linked to value creation in the
Page 154 of 157
Company over time. Such arrangements shall incentivise performance and be based on quantifiable factors that the employee may influence. As recommended in the Code, the performance-related remuneration is capped by being limited to a certain fraction of recipients' annual salary. Share based incentive schemes are limited by a maximum number of shares in the Company that can be allocated. In accordance with the Public Companies Act and the Code, the guidelines for the remuneration of the CEO and the executive management are made available on the Company's website and communicated in the notes to the annual accounts. Deviation from the Recommendation: None. 13. Information and communications routine The board of directors should establish guidelines for the company’s reporting of financial and other information based on openness and taking into account the requirement for equal treatment of all participants in the securities market. The board of directors should establish guidelines for the company’s contact with shareholders other than through general meetings. Annual and periodic accounts The Company normally presents provisional annual accounts in late February. The complete annual report including annual financial statements and the Directors’ report is sent to all shareholders and other stakeholders in March/April and presented at the Annual General Meeting. The Company reports financially on a quarterly basis and thus more frequent than required by statutory law. The company also makes its interim accounts publicly available through the Oslo Stock Exchange publication system, as well as through presentations that are open to the public. The Company’s financial calendar is published on the Company’s website and through the Oslo Stock Exchange publication system. All shareholders have equal access to financial and other material company information. Other market information Public presentations are conducted in connection with the Company’s interim reports. The interim presentation is also made available on the Company’s website and through the Oslo Stock Exchange publication system. In the interim report the CEO reviews the result for the past period and comments on the development for the various products and market segments. Furthermore, the CEO provides a summary of the market outlook and future short-term prospects. The CFO also participates in these presentations. The CEO and CFO also maintain a dialog with and make regular presentations to analysts and potential investors. The Company considers it essential to keep shareholders and potential investors informed about its economic and financial development. Significant importance is also attached to securing that the same information is released to the whole market at the same time. From time to time the Company will prepare an updated company presentation which is made available on the Company’s website, http://ir.akvagroup.com/investor-relations/financial-info-/other-presentations-and-reports. Deviation from the Recommendation: None 14. Take-overs The board of directors should establish guiding principles for how it will act in the event of a take-over bid.
Page 155 of 157
In a bid situation, the company´s board of directors and management have an independent responsibility to help ensure that shareholders are treated equally, and that the company’s business activities are not disrupted unnecessarily. The board has a particular responsibility to ensure that shareholders are given sufficient information and time to form a view of the offer. The board of directors should not hinder or obstruct take-over bids for the company’s activities or shares. Any agreement with the bidder that acts to limit the company’s ability to arrange other bids for the company’s shares should only be entered into where it is self-evident that such an agreement is in the common interest of the company and its shareholders. This provision shall also apply to any agreement on the payment of financial compensation to the bidder if the bid does not proceed. Any financial compensation should be limited to the costs the bidder has incurred in making the bid. Agreements entered into between the company and the bidder that are material to the market's evaluation of the bid should be publicly disclosed no later than at the same time as the announcement that the bid will be made is published. In the event of a take-over bid for the company’s shares, the company’s board of directors should not exercise mandates or pass any resolutions with the intention of obstructing the take-over bid unless this is approved by the general meeting following the announcement of the bid. If an offer is made for a company’s shares, the company’s board of directors should issue a statement making a recommendation as to whether shareholders should or should not accept the offer. The board’s statement on the offer should make it clear whether the views expressed are unanimous, and if this is not the case it should explain the basis on which specific members of the board have excluded themselves from the board’s statement. The board should arrange a valuation from an independent expert. The valuation should include an explanation and should be made public no later than at the time of the public disclosure of the board´s statement. Any transaction that is in effect a disposal of the company’s activities should be decided by a general meeting (or the corporate assembly where relevant). The Board has established guidelines in the event of an offer for all or a substantial majority of the shares in AKVA group is made. In the event of a take-over bid for the shares in the Company, the Board shall ensure that shareholders in the Company are treated equally, and that the Company’s business activities are not disrupted unnecessarily. The Board shall ensure that shareholders are given sufficient information and time to form a view of an offer. The Board shall not seek to prevent or obstruct take-over bids for the Company’s business or shares unless there are particular reasons to do so. Any agreement with a bidder for the shares of the Company that acts to restrict the Company’s ability to pursue and engage for alternative bids for the Company’s shares should only be entered into where such an agreement clearly is in the common interest of the Company and the shareholders. This provision shall also apply to any agreement on the payment of financial compensation to a bidder if the bid does not proceed. In the event of a take-over bid for the Company’s shares, the Board shall not exercise authorizations or pass any resolutions with the intention of obstructing the take-over bid unless this is approved by the general meeting subsequent to the announcement of the bid.
Page 156 of 157
If an offer is made for the shares in the Company, the Board shall issue a statement making a recommendation as to whether shareholders should or should not accept the offer. The Board's statement on a bid shall make it clear whether the views expressed are unanimous, and if this is not the case it shall explain the basis on which specific members of the board have excluded themselves from the board's statement. Before issuing its final statement, the board shall, where appropriate, arrange for an evaluation of the financial aspects of the bid from an independent expert. The evaluation shall include an explanation and shall be made public no later than at the time the Board's statement is made public. Deviation from the Recommendation: None. 15. Auditor The board of directors should ensure that the auditor submits the main features of the plan for the audit of the company to the audit committee annually. The board of directors should invite the auditor to meetings that deal with the annual accounts. At these meetings, the auditor should report on any material changes in the company’s accounting principles and key aspects of the audit, comment on any material estimated accounting figures and report all material matters on which there has been disagreement between the auditor and the executive management of the company. The board of directors should at least once a year review the company’s internal control procedures with the auditor, including weaknesses identified by the auditor and proposals for improvement. The board of directors should establish guidelines in respect of the use of the auditor by the company’s executive management for services other than the audit. An outline of the work planned by the auditor is presented to the Company's audit committee each year. The auditor is always invited to be present during the Board’s discussion of the annual accounts. At this meeting, the board is briefed on the annual accounts and any other issues of particular concern to the auditor. Part of the meeting is also executed without the presence of the CEO and other executive management. The board has implemented guidelines in respect of use of the auditor by the executive management for services other than the audit. Deviation from the Recommendation: None.
Page 157 of 157