Embed Size (px)
Citation preview
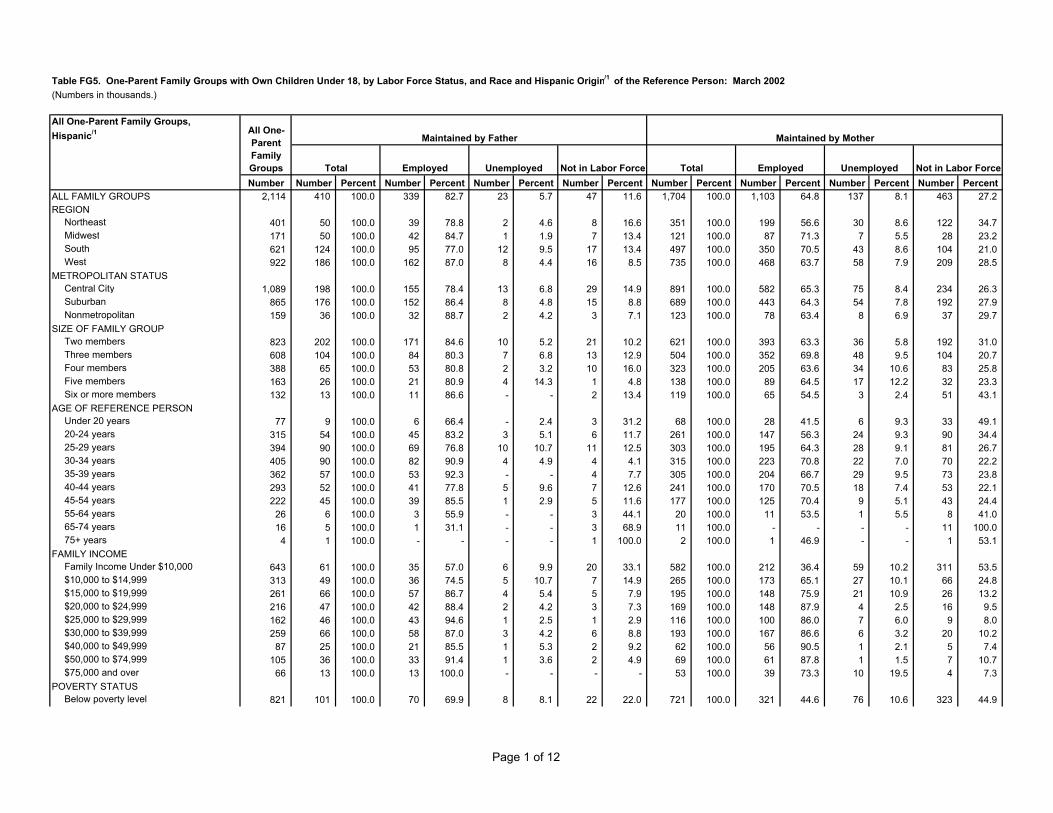
Table FG5. One-Parent Family Groups with Own Children Under 18, by Labor Force Status, and Race and Hispanic Origin/1/ of the Reference Person: March 2002(Numbers in thousands.)(leading dots indicate sub-parts)All One-Parent Family Groups, Hispanic/1/ All One-
Parent Family Groups
Maintained by Father Maintained by Mother
Total Employed Unemployed Not in Labor Force Total Employed Unemployed Not in Labor ForceNumber Number Percent Number Percent Number Percent Number Percent Number Percent Number Percent Number Percent Number Percent
ALL FAMILY GROUPS 2,114 410 100.0 339 82.7 23 5.7 47 11.6 1,704 100.0 1,103 64.8 137 8.1 463 27.2 REGION
.Northeast 401 50 100.0 39 78.8 2 4.6 8 16.6 351 100.0 199 56.6 30 8.6 122 34.7
.Midwest 171 50 100.0 42 84.7 1 1.9 7 13.4 121 100.0 87 71.3 7 5.5 28 23.2
.South 621 124 100.0 95 77.0 12 9.5 17 13.4 497 100.0 350 70.5 43 8.6 104 21.0
.West 922 186 100.0 162 87.0 8 4.4 16 8.5 735 100.0 468 63.7 58 7.9 209 28.5 METROPOLITAN STATUS
.Central City 1,089 198 100.0 155 78.4 13 6.8 29 14.9 891 100.0 582 65.3 75 8.4 234 26.3
.Suburban 865 176 100.0 152 86.4 8 4.8 15 8.8 689 100.0 443 64.3 54 7.8 192 27.9
.Nonmetropolitan 159 36 100.0 32 88.7 2 4.2 3 7.1 123 100.0 78 63.4 8 6.9 37 29.7 SIZE OF FAMILY GROUP
.Two members 823 202 100.0 171 84.6 10 5.2 21 10.2 621 100.0 393 63.3 36 5.8 192 31.0
.Three members 608 104 100.0 84 80.3 7 6.8 13 12.9 504 100.0 352 69.8 48 9.5 104 20.7
.Four members 388 65 100.0 53 80.8 2 3.2 10 16.0 323 100.0 205 63.6 34 10.6 83 25.8
.Five members 163 26 100.0 21 80.9 4 14.3 1 4.8 138 100.0 89 64.5 17 12.2 32 23.3
.Six or more members 132 13 100.0 11 86.6 - - 2 13.4 119 100.0 65 54.5 3 2.4 51 43.1 AGE OF REFERENCE PERSON
.Under 20 years 77 9 100.0 6 66.4 - 2.4 3 31.2 68 100.0 28 41.5 6 9.3 33 49.1
.20-24 years 315 54 100.0 45 83.2 3 5.1 6 11.7 261 100.0 147 56.3 24 9.3 90 34.4
.25-29 years 394 90 100.0 69 76.8 10 10.7 11 12.5 303 100.0 195 64.3 28 9.1 81 26.7
.30-34 years 405 90 100.0 82 90.9 4 4.9 4 4.1 315 100.0 223 70.8 22 7.0 70 22.2
.35-39 years 362 57 100.0 53 92.3 - - 4 7.7 305 100.0 204 66.7 29 9.5 73 23.8
.40-44 years 293 52 100.0 41 77.8 5 9.6 7 12.6 241 100.0 170 70.5 18 7.4 53 22.1
.45-54 years 222 45 100.0 39 85.5 1 2.9 5 11.6 177 100.0 125 70.4 9 5.1 43 24.4
.55-64 years 26 6 100.0 3 55.9 - - 3 44.1 20 100.0 11 53.5 1 5.5 8 41.0
.65-74 years 16 5 100.0 1 31.1 - - 3 68.9 11 100.0 - - - - 11 100.0
.75+ years 4 1 100.0 - - - - 1 100.0 2 100.0 1 46.9 - - 1 53.1 FAMILY INCOME
.Family Income Under $10,000 643 61 100.0 35 57.0 6 9.9 20 33.1 582 100.0 212 36.4 59 10.2 311 53.5
.$10,000 to $14,999 313 49 100.0 36 74.5 5 10.7 7 14.9 265 100.0 173 65.1 27 10.1 66 24.8
.$15,000 to $19,999 261 66 100.0 57 86.7 4 5.4 5 7.9 195 100.0 148 75.9 21 10.9 26 13.2
.$20,000 to $24,999 216 47 100.0 42 88.4 2 4.2 3 7.3 169 100.0 148 87.9 4 2.5 16 9.5
.$25,000 to $29,999 162 46 100.0 43 94.6 1 2.5 1 2.9 116 100.0 100 86.0 7 6.0 9 8.0
.$30,000 to $39,999 259 66 100.0 58 87.0 3 4.2 6 8.8 193 100.0 167 86.6 6 3.2 20 10.2
.$40,000 to $49,999 87 25 100.0 21 85.5 1 5.3 2 9.2 62 100.0 56 90.5 1 2.1 5 7.4
.$50,000 to $74,999 105 36 100.0 33 91.4 1 3.6 2 4.9 69 100.0 61 87.8 1 1.5 7 10.7
.$75,000 and over 66 13 100.0 13 100.0 - - - - 53 100.0 39 73.3 10 19.5 4 7.3 POVERTY STATUS
.Below poverty level 821 101 100.0 70 69.9 8 8.1 22 22.0 721 100.0 321 44.6 76 10.6 323 44.9
Page 1 of 12

.At or above poverty level 1,293 309 100.0 269 86.9 15 4.9 25 8.2 984 100.0 782 79.5 61 6.2 140 14.2 ALL FAMILY GROUPS 2,114 410 100.0 339 82.7 23 5.7 47 11.6 1,704 100.0 1,103 64.8 137 8.1 463 27.2 NUMBER OF OWN CHILDREN UNDER 18 YEARS
.One own child under 18 1,070 249 100.0 208 83.7 12 4.8 29 11.5 821 100.0 538 65.5 49 5.9 235 28.6
.Two own children under 18 593 107 100.0 87 81.7 9 8.4 11 9.9 486 100.0 330 68.0 48 9.8 108 22.2
.Three own children under 18 310 43 100.0 34 81.0 - - 8 19.0 267 100.0 163 61.0 30 11.1 75 27.9
.Four or more own children under 18 141 11 100.0 9 78.9 2 21.1 - - 130 100.0 72 55.8 11 8.6 46 35.6 OWN CHILDREN 6-17 YEARS
.Without own children 6-17 674 186 100.0 160 85.6 14 7.6 13 6.8 488 100.0 285 58.4 37 7.6 165 33.9
.One own child 6-17 761 142 100.0 110 77.5 6 4.1 26 18.3 619 100.0 428 69.1 39 6.3 152 24.6
.Two own children 6-17 440 55 100.0 49 88.4 2 3.8 4 7.7 385 100.0 262 68.2 35 9.1 87 22.7
.Three own children 6-17 176 21 100.0 17 78.5 - - 5 21.5 154 100.0 95 61.3 20 13.1 39 25.6
.Four or more own children 6-17 63 5 100.0 4 76.1 1 23.9 - - 58 100.0 34 57.7 6 10.3 19 32.0 OWN CHILDREN 12-17 YEARS
.Without own children 12-17 1,258 282 100.0 229 81.3 20 7.1 33 11.6 976 100.0 610 62.5 76 7.8 290 29.7
.One own child 12-17 615 109 100.0 94 85.9 2 2.0 13 12.1 506 100.0 338 66.7 43 8.4 126 24.9
.Two own children 12-17 195 13 100.0 11 79.1 1 9.4 2 11.5 181 100.0 127 70.3 17 9.3 37 20.5
.Three or more own children 12-17 46 6 100.0 6 100.0 - - - - 40 100.0 28 69.2 2 3.8 11 27.0 OWN CHILDREN 6-11 YEARS
.Without own children 6-11 1,178 274 100.0 236 86.0 14 5.2 24 8.8 905 100.0 568 62.8 66 7.3 270 29.9
.One own child 6-11 636 92 100.0 68 74.0 8 8.6 16 17.3 544 100.0 385 70.9 37 6.8 121 22.3
.Two own children 6-11 250 38 100.0 31 81.0 1 3.3 6 15.8 212 100.0 134 63.1 27 12.9 51 24.1
.Three or more own children 6-11 49 6 100.0 4 76.4 - - 1 23.6 44 100.0 16 37.6 7 15.3 21 47.1 OWN CHILDREN UNDER 6 YEARS
.Without own children under 6 1,038 174 100.0 135 77.4 7 3.9 33 18.7 864 100.0 607 70.3 71 8.2 186 21.5
.One own child under 6 834 181 100.0 164 90.5 10 5.5 7 4.0 653 100.0 390 59.7 50 7.6 214 32.7
.Two own children under 6 190 41 100.0 31 76.5 6 13.5 4 10.0 149 100.0 93 62.8 15 10.2 40 26.9
.Three or more own children under 6 52 13 100.0 9 65.7 1 8.2 4 26.1 38 100.0 13 34.3 2 4.1 23 61.5 OWN CHILDREN UNDER 3 YEARS
.Without own children under 3 1,470 261 100.0 212 81.4 14 5.5 34 13.2 1,209 100.0 825 68.2 103 8.5 281 23.3
.One own child under 3 583 129 100.0 115 88.9 7 5.5 7 5.6 454 100.0 260 57.3 33 7.4 160 35.3
.Two or more own children under 3 61 20 100.0 12 60.4 2 9.9 6 29.7 41 100.0 18 44.5 1 2.3 22 53.1 AGE OF OWN CHILDREN
.With own children under 18 years 2,114 410 100.0 339 82.7 23 5.7 47 11.6 1,704 100.0 1,103 64.8 137 8.1 463 27.2
.Without own children under 12 years 443 73 100.0 63 86.1 - - 10 13.9 370 100.0 258 69.8 21 5.7 91 24.6
.With own children under 12 years 1,671 337 100.0 276 82.0 23 6.9 37 11.1 1,334 100.0 846 63.4 116 8.7 373 27.9
.Without own children under 6 years 1,038 174 100.0 135 77.4 7 3.9 33 18.7 864 100.0 607 70.3 71 8.2 186 21.5
.With own children under 6 years 1,076 236 100.0 204 86.7 17 7.0 15 6.3 840 100.0 496 59.1 66 7.9 277 33.0
.Without own children under 5 years 1,161 204 100.0 163 80.0 8 4.0 33 16.0 958 100.0 672 70.1 79 8.2 208 21.7
.With own children under 5 years 953 206 100.0 176 85.4 15 7.3 15 7.2 746 100.0 432 57.9 59 7.8 256 34.3
.Without own children under 3 years 1,470 261 100.0 212 81.4 14 5.5 34 13.2 1,209 100.0 825 68.2 103 8.5 281 23.3
.With own children under 3 years 644 149 100.0 127 85.1 9 6.1 13 8.8 495 100.0 279 56.3 34 6.9 182 36.8
.Without own children under 1 year 1,898 346 100.0 290 83.7 19 5.6 37 10.7 1,552 100.0 1,032 66.5 124 8.0 396 25.5
.With own children under 1 year 216 64 100.0 50 77.3 4 6.3 11 16.4 152 100.0 72 47.1 13 8.7 67 44.2
.Without own children 3-5 years 1,526 295 100.0 239 81.2 15 5.0 41 13.8 1,231 100.0 809 65.7 96 7.8 327 26.5
.With own children 3-5 years 588 115 100.0 100 86.5 9 7.5 7 6.0 473 100.0 295 62.3 41 8.8 137 28.9
.Without own children 6-11 years 1,178 274 100.0 236 86.0 14 5.2 24 8.8 905 100.0 568 62.8 66 7.3 270 29.9
Page 2 of 12

.With own children 6-11 years 936 136 100.0 104 76.1 9 6.8 23 17.2 800 100.0 536 67.0 71 8.9 193 24.1
.Without own children 12-17 years 1,258 282 100.0 229 81.3 20 7.1 33 11.6 976 100.0 610 62.5 76 7.8 290 29.7
.With own children 12-17 years 856 128 100.0 110 85.9 3 2.6 15 11.5 728 100.0 493 67.7 61 8.4 174 23.9
.Without own children 6-17 years 674 186 100.0 160 85.6 14 7.6 13 6.8 488 100.0 285 58.4 37 7.6 165 33.9
.With own children 6-17 years 1,440 224 100.0 180 80.3 9 4.1 35 15.6 1,217 100.0 819 67.3 100 8.2 298 24.5 OWN CHILDREN IN SPECIFIED AGE GROUPS
.Children in two or more age groups 923 124 100.0 102 82.3 7 5.7 15 12.0 799 100.0 521 65.2 70 8.8 208 26.0
.Families with children 12-17 only 318 58 100.0 50 87.7 - - 7 12.3 261 100.0 179 68.6 12 4.8 69 26.7
.Families with children 6-11 only 303 67 100.0 45 67.7 3 5.2 18 27.1 237 100.0 166 70.4 22 9.3 48 20.3
.Families with children 3-5 only 228 57 100.0 52 90.4 5 8.8 - 0.8 171 100.0 109 63.5 14 8.2 48 28.2
.Families with children under 3 only 341 105 100.0 90 85.8 8 7.5 7 6.7 237 100.0 129 54.4 18 7.8 90 37.8
.Under 6 only 674 186 100.0 160 85.6 14 7.6 13 6.8 488 100.0 285 58.4 37 7.6 165 33.9
.Some under 6, some 6-17 402 49 100.0 45 90.5 2 4.9 2 4.6 353 100.0 211 60.0 29 8.3 112 31.7
.6-17 only 1,038 174 100.0 135 77.4 7 3.9 33 18.7 864 100.0 607 70.3 71 8.2 186 21.5 Footnotes:1/ Hispanics may be of any race.2/ In past reports: 'Maried Spouse Absent, Excluding Separated.'3/ In past reports: 'Married Spouse Absent, Separated.'"Own Children" exclude ever-married children under 18 years.- Represents or rounds to zero.Source: U.S. Census Bureau, Population Division.Internet Release Date: June 12, 2003
Page 3 of 12
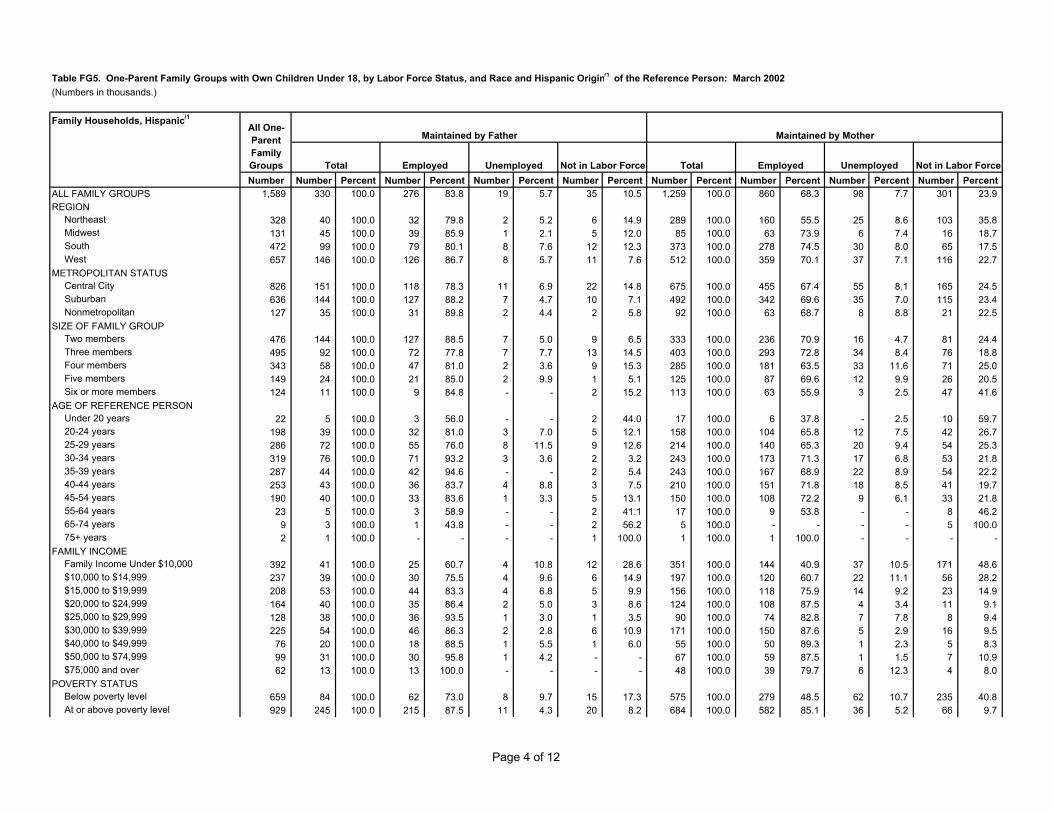
Table FG5. One-Parent Family Groups with Own Children Under 18, by Labor Force Status, and Race and Hispanic Origin/1/ of the Reference Person: March 2002(Numbers in thousands.)
Family Households, Hispanic/1/
All One-Parent Family Groups
Maintained by Father Maintained by Mother
Total Employed Unemployed Not in Labor Force Total Employed Unemployed Not in Labor ForceNumber Number Percent Number Percent Number Percent Number Percent Number Percent Number Percent Number Percent Number Percent
ALL FAMILY GROUPS 1,589 330 100.0 276 83.8 19 5.7 35 10.5 1,259 100.0 860 68.3 98 7.7 301 23.9 REGION
.Northeast 328 40 100.0 32 79.8 2 5.2 6 14.9 289 100.0 160 55.5 25 8.6 103 35.8
.Midwest 131 45 100.0 39 85.9 1 2.1 5 12.0 85 100.0 63 73.9 6 7.4 16 18.7
.South 472 99 100.0 79 80.1 8 7.6 12 12.3 373 100.0 278 74.5 30 8.0 65 17.5
.West 657 146 100.0 126 86.7 8 5.7 11 7.6 512 100.0 359 70.1 37 7.1 116 22.7 METROPOLITAN STATUS
.Central City 826 151 100.0 118 78.3 11 6.9 22 14.8 675 100.0 455 67.4 55 8.1 165 24.5
.Suburban 636 144 100.0 127 88.2 7 4.7 10 7.1 492 100.0 342 69.6 35 7.0 115 23.4
.Nonmetropolitan 127 35 100.0 31 89.8 2 4.4 2 5.8 92 100.0 63 68.7 8 8.8 21 22.5 SIZE OF FAMILY GROUP
.Two members 476 144 100.0 127 88.5 7 5.0 9 6.5 333 100.0 236 70.9 16 4.7 81 24.4
.Three members 495 92 100.0 72 77.8 7 7.7 13 14.5 403 100.0 293 72.8 34 8.4 76 18.8
.Four members 343 58 100.0 47 81.0 2 3.6 9 15.3 285 100.0 181 63.5 33 11.6 71 25.0
.Five members 149 24 100.0 21 85.0 2 9.9 1 5.1 125 100.0 87 69.6 12 9.9 26 20.5
.Six or more members 124 11 100.0 9 84.8 - - 2 15.2 113 100.0 63 55.9 3 2.5 47 41.6 AGE OF REFERENCE PERSON
.Under 20 years 22 5 100.0 3 56.0 - - 2 44.0 17 100.0 6 37.8 - 2.5 10 59.7
.20-24 years 198 39 100.0 32 81.0 3 7.0 5 12.1 158 100.0 104 65.8 12 7.5 42 26.7
.25-29 years 286 72 100.0 55 76.0 8 11.5 9 12.6 214 100.0 140 65.3 20 9.4 54 25.3
.30-34 years 319 76 100.0 71 93.2 3 3.6 2 3.2 243 100.0 173 71.3 17 6.8 53 21.8
.35-39 years 287 44 100.0 42 94.6 - - 2 5.4 243 100.0 167 68.9 22 8.9 54 22.2
.40-44 years 253 43 100.0 36 83.7 4 8.8 3 7.5 210 100.0 151 71.8 18 8.5 41 19.7
.45-54 years 190 40 100.0 33 83.6 1 3.3 5 13.1 150 100.0 108 72.2 9 6.1 33 21.8
.55-64 years 23 5 100.0 3 58.9 - - 2 41.1 17 100.0 9 53.8 - - 8 46.2
.65-74 years 9 3 100.0 1 43.8 - - 2 56.2 5 100.0 - - - - 5 100.0
.75+ years 2 1 100.0 - - - - 1 100.0 1 100.0 1 100.0 - - - - FAMILY INCOME
.Family Income Under $10,000 392 41 100.0 25 60.7 4 10.8 12 28.6 351 100.0 144 40.9 37 10.5 171 48.6
.$10,000 to $14,999 237 39 100.0 30 75.5 4 9.6 6 14.9 197 100.0 120 60.7 22 11.1 56 28.2
.$15,000 to $19,999 208 53 100.0 44 83.3 4 6.8 5 9.9 156 100.0 118 75.9 14 9.2 23 14.9
.$20,000 to $24,999 164 40 100.0 35 86.4 2 5.0 3 8.6 124 100.0 108 87.5 4 3.4 11 9.1
.$25,000 to $29,999 128 38 100.0 36 93.5 1 3.0 1 3.5 90 100.0 74 82.8 7 7.8 8 9.4
.$30,000 to $39,999 225 54 100.0 46 86.3 2 2.8 6 10.9 171 100.0 150 87.6 5 2.9 16 9.5
.$40,000 to $49,999 76 20 100.0 18 88.5 1 5.5 1 6.0 55 100.0 50 89.3 1 2.3 5 8.3
.$50,000 to $74,999 99 31 100.0 30 95.8 1 4.2 - - 67 100.0 59 87.5 1 1.5 7 10.9
.$75,000 and over 62 13 100.0 13 100.0 - - - - 48 100.0 39 79.7 6 12.3 4 8.0 POVERTY STATUS
.Below poverty level 659 84 100.0 62 73.0 8 9.7 15 17.3 575 100.0 279 48.5 62 10.7 235 40.8
.At or above poverty level 929 245 100.0 215 87.5 11 4.3 20 8.2 684 100.0 582 85.1 36 5.2 66 9.7
Page 4 of 12
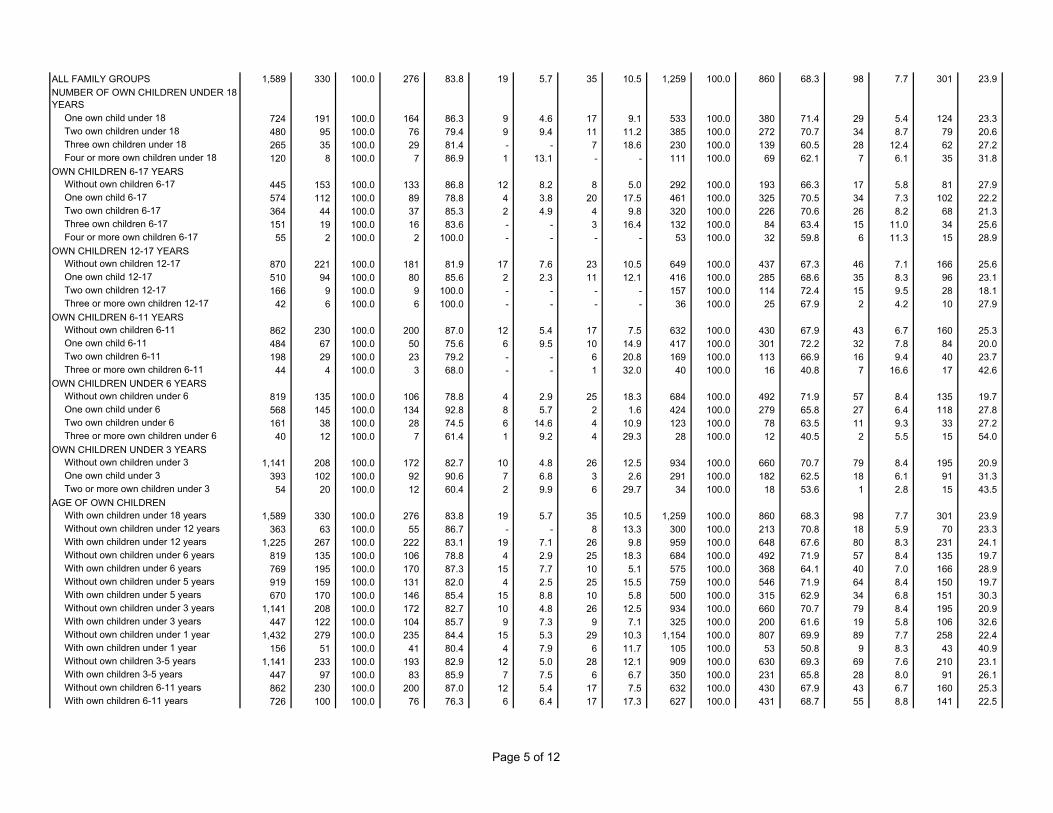
ALL FAMILY GROUPS 1,589 330 100.0 276 83.8 19 5.7 35 10.5 1,259 100.0 860 68.3 98 7.7 301 23.9 NUMBER OF OWN CHILDREN UNDER 18 YEARS
.One own child under 18 724 191 100.0 164 86.3 9 4.6 17 9.1 533 100.0 380 71.4 29 5.4 124 23.3
.Two own children under 18 480 95 100.0 76 79.4 9 9.4 11 11.2 385 100.0 272 70.7 34 8.7 79 20.6
.Three own children under 18 265 35 100.0 29 81.4 - - 7 18.6 230 100.0 139 60.5 28 12.4 62 27.2
.Four or more own children under 18 120 8 100.0 7 86.9 1 13.1 - - 111 100.0 69 62.1 7 6.1 35 31.8 OWN CHILDREN 6-17 YEARS
.Without own children 6-17 445 153 100.0 133 86.8 12 8.2 8 5.0 292 100.0 193 66.3 17 5.8 81 27.9
.One own child 6-17 574 112 100.0 89 78.8 4 3.8 20 17.5 461 100.0 325 70.5 34 7.3 102 22.2
.Two own children 6-17 364 44 100.0 37 85.3 2 4.9 4 9.8 320 100.0 226 70.6 26 8.2 68 21.3
.Three own children 6-17 151 19 100.0 16 83.6 - - 3 16.4 132 100.0 84 63.4 15 11.0 34 25.6
.Four or more own children 6-17 55 2 100.0 2 100.0 - - - - 53 100.0 32 59.8 6 11.3 15 28.9 OWN CHILDREN 12-17 YEARS
.Without own children 12-17 870 221 100.0 181 81.9 17 7.6 23 10.5 649 100.0 437 67.3 46 7.1 166 25.6
.One own child 12-17 510 94 100.0 80 85.6 2 2.3 11 12.1 416 100.0 285 68.6 35 8.3 96 23.1
.Two own children 12-17 166 9 100.0 9 100.0 - - - - 157 100.0 114 72.4 15 9.5 28 18.1
.Three or more own children 12-17 42 6 100.0 6 100.0 - - - - 36 100.0 25 67.9 2 4.2 10 27.9 OWN CHILDREN 6-11 YEARS
.Without own children 6-11 862 230 100.0 200 87.0 12 5.4 17 7.5 632 100.0 430 67.9 43 6.7 160 25.3
.One own child 6-11 484 67 100.0 50 75.6 6 9.5 10 14.9 417 100.0 301 72.2 32 7.8 84 20.0
.Two own children 6-11 198 29 100.0 23 79.2 - - 6 20.8 169 100.0 113 66.9 16 9.4 40 23.7
.Three or more own children 6-11 44 4 100.0 3 68.0 - - 1 32.0 40 100.0 16 40.8 7 16.6 17 42.6 OWN CHILDREN UNDER 6 YEARS
.Without own children under 6 819 135 100.0 106 78.8 4 2.9 25 18.3 684 100.0 492 71.9 57 8.4 135 19.7
.One own child under 6 568 145 100.0 134 92.8 8 5.7 2 1.6 424 100.0 279 65.8 27 6.4 118 27.8
.Two own children under 6 161 38 100.0 28 74.5 6 14.6 4 10.9 123 100.0 78 63.5 11 9.3 33 27.2
.Three or more own children under 6 40 12 100.0 7 61.4 1 9.2 4 29.3 28 100.0 12 40.5 2 5.5 15 54.0 OWN CHILDREN UNDER 3 YEARS
.Without own children under 3 1,141 208 100.0 172 82.7 10 4.8 26 12.5 934 100.0 660 70.7 79 8.4 195 20.9
.One own child under 3 393 102 100.0 92 90.6 7 6.8 3 2.6 291 100.0 182 62.5 18 6.1 91 31.3
.Two or more own children under 3 54 20 100.0 12 60.4 2 9.9 6 29.7 34 100.0 18 53.6 1 2.8 15 43.5 AGE OF OWN CHILDREN
.With own children under 18 years 1,589 330 100.0 276 83.8 19 5.7 35 10.5 1,259 100.0 860 68.3 98 7.7 301 23.9
.Without own children under 12 years 363 63 100.0 55 86.7 - - 8 13.3 300 100.0 213 70.8 18 5.9 70 23.3
.With own children under 12 years 1,225 267 100.0 222 83.1 19 7.1 26 9.8 959 100.0 648 67.6 80 8.3 231 24.1
.Without own children under 6 years 819 135 100.0 106 78.8 4 2.9 25 18.3 684 100.0 492 71.9 57 8.4 135 19.7
.With own children under 6 years 769 195 100.0 170 87.3 15 7.7 10 5.1 575 100.0 368 64.1 40 7.0 166 28.9
.Without own children under 5 years 919 159 100.0 131 82.0 4 2.5 25 15.5 759 100.0 546 71.9 64 8.4 150 19.7
.With own children under 5 years 670 170 100.0 146 85.4 15 8.8 10 5.8 500 100.0 315 62.9 34 6.8 151 30.3
.Without own children under 3 years 1,141 208 100.0 172 82.7 10 4.8 26 12.5 934 100.0 660 70.7 79 8.4 195 20.9
.With own children under 3 years 447 122 100.0 104 85.7 9 7.3 9 7.1 325 100.0 200 61.6 19 5.8 106 32.6
.Without own children under 1 year 1,432 279 100.0 235 84.4 15 5.3 29 10.3 1,154 100.0 807 69.9 89 7.7 258 22.4
.With own children under 1 year 156 51 100.0 41 80.4 4 7.9 6 11.7 105 100.0 53 50.8 9 8.3 43 40.9
.Without own children 3-5 years 1,141 233 100.0 193 82.9 12 5.0 28 12.1 909 100.0 630 69.3 69 7.6 210 23.1
.With own children 3-5 years 447 97 100.0 83 85.9 7 7.5 6 6.7 350 100.0 231 65.8 28 8.0 91 26.1
.Without own children 6-11 years 862 230 100.0 200 87.0 12 5.4 17 7.5 632 100.0 430 67.9 43 6.7 160 25.3
.With own children 6-11 years 726 100 100.0 76 76.3 6 6.4 17 17.3 627 100.0 431 68.7 55 8.8 141 22.5
Page 5 of 12

.Without own children 12-17 years 870 221 100.0 181 81.9 17 7.6 23 10.5 649 100.0 437 67.3 46 7.1 166 25.6
.With own children 12-17 years 719 109 100.0 95 87.6 2 1.9 11 10.5 610 100.0 424 69.5 51 8.4 135 22.1
.Without own children 6-17 years 445 153 100.0 133 86.8 12 8.2 8 5.0 292 100.0 193 66.3 17 5.8 81 27.9
.With own children 6-17 years 1,144 177 100.0 144 81.2 6 3.6 27 15.2 967 100.0 667 69.0 81 8.3 220 22.7 OWN CHILDREN IN SPECIFIED AGE GROUPS
.Children in two or more age groups 791 108 100.0 89 82.4 6 5.3 13 12.3 682 100.0 455 66.6 60 8.7 168 24.6
.Families with children 12-17 only 239 47 100.0 42 88.9 - - 5 11.1 191 100.0 133 69.8 9 4.8 49 25.5
.Families with children 6-11 only 199 44 100.0 28 65.0 2 4.1 14 30.9 155 100.0 115 74.4 14 9.1 25 16.5
.Families with children 3-5 only 153 48 100.0 44 92.5 4 7.5 - - 105 100.0 76 72.1 5 4.6 24 23.2
.Families with children under 3 only 208 82 100.0 72 87.7 8 9.3 2 3.0 126 100.0 82 64.7 10 7.8 35 27.5
.Under 6 only 445 153 100.0 133 86.8 12 8.2 8 5.0 292 100.0 193 66.3 17 5.8 81 27.9
.Some under 6, some 6-17 325 42 100.0 37 88.9 2 5.8 2 5.3 283 100.0 175 61.8 23 8.3 85 30.0
.6-17 only 819 135 100.0 106 78.8 4 2.9 25 18.3 684 100.0 492 71.9 57 8.4 135 19.7 Footnotes:1/ Hispanics may be of any race.2/ In past reports: 'Maried Spouse Absent, Excluding Separated.'3/ In past reports: 'Married Spouse Absent, Separated.'"Own Children" exclude ever-married children under 18 years.- Represents or rounds to zero.Source: U.S. Census Bureau, Population Division.Internet Release Date: June 12, 2003
Page 6 of 12
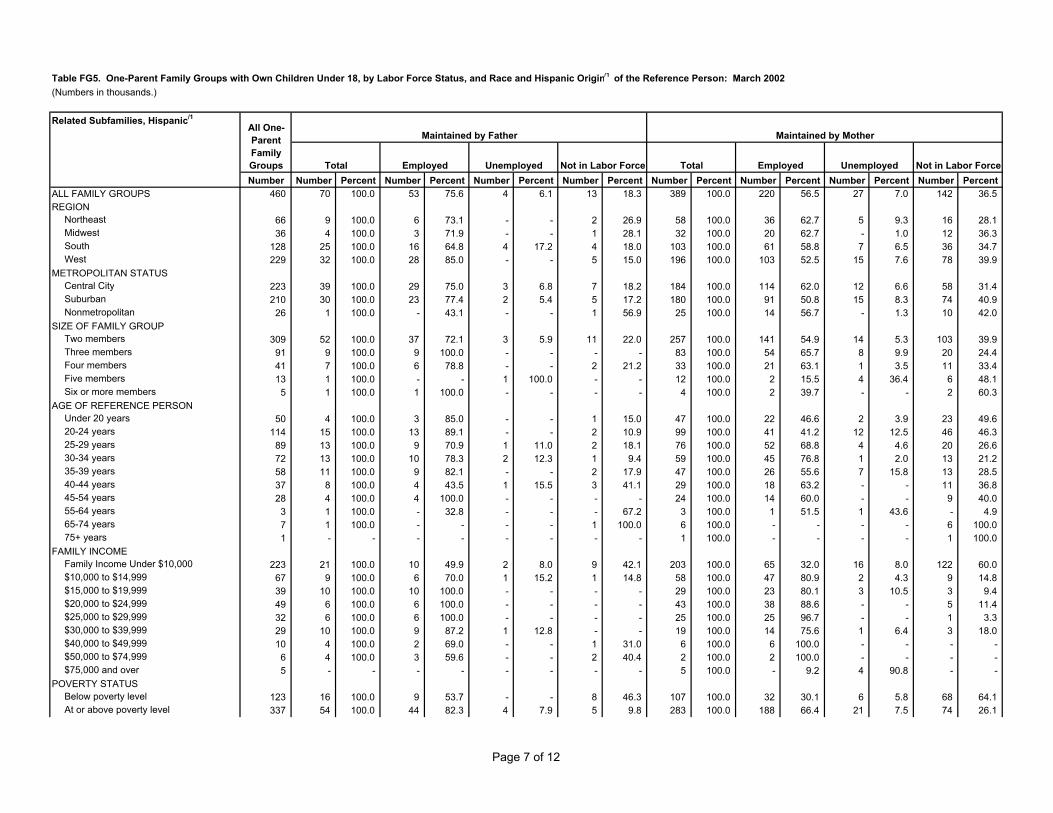
Table FG5. One-Parent Family Groups with Own Children Under 18, by Labor Force Status, and Race and Hispanic Origin/1/ of the Reference Person: March 2002(Numbers in thousands.)
Related Subfamilies, Hispanic/1/
All One-Parent Family Groups
Maintained by Father Maintained by Mother
Total Employed Unemployed Not in Labor Force Total Employed Unemployed Not in Labor ForceNumber Number Percent Number Percent Number Percent Number Percent Number Percent Number Percent Number Percent Number Percent
ALL FAMILY GROUPS 460 70 100.0 53 75.6 4 6.1 13 18.3 389 100.0 220 56.5 27 7.0 142 36.5 REGION
.Northeast 66 9 100.0 6 73.1 - - 2 26.9 58 100.0 36 62.7 5 9.3 16 28.1
.Midwest 36 4 100.0 3 71.9 - - 1 28.1 32 100.0 20 62.7 - 1.0 12 36.3
.South 128 25 100.0 16 64.8 4 17.2 4 18.0 103 100.0 61 58.8 7 6.5 36 34.7
.West 229 32 100.0 28 85.0 - - 5 15.0 196 100.0 103 52.5 15 7.6 78 39.9 METROPOLITAN STATUS
.Central City 223 39 100.0 29 75.0 3 6.8 7 18.2 184 100.0 114 62.0 12 6.6 58 31.4
.Suburban 210 30 100.0 23 77.4 2 5.4 5 17.2 180 100.0 91 50.8 15 8.3 74 40.9
.Nonmetropolitan 26 1 100.0 - 43.1 - - 1 56.9 25 100.0 14 56.7 - 1.3 10 42.0 SIZE OF FAMILY GROUP
.Two members 309 52 100.0 37 72.1 3 5.9 11 22.0 257 100.0 141 54.9 14 5.3 103 39.9
.Three members 91 9 100.0 9 100.0 - - - - 83 100.0 54 65.7 8 9.9 20 24.4
.Four members 41 7 100.0 6 78.8 - - 2 21.2 33 100.0 21 63.1 1 3.5 11 33.4
.Five members 13 1 100.0 - - 1 100.0 - - 12 100.0 2 15.5 4 36.4 6 48.1
.Six or more members 5 1 100.0 1 100.0 - - - - 4 100.0 2 39.7 - - 2 60.3 AGE OF REFERENCE PERSON
.Under 20 years 50 4 100.0 3 85.0 - - 1 15.0 47 100.0 22 46.6 2 3.9 23 49.6
.20-24 years 114 15 100.0 13 89.1 - - 2 10.9 99 100.0 41 41.2 12 12.5 46 46.3
.25-29 years 89 13 100.0 9 70.9 1 11.0 2 18.1 76 100.0 52 68.8 4 4.6 20 26.6
.30-34 years 72 13 100.0 10 78.3 2 12.3 1 9.4 59 100.0 45 76.8 1 2.0 13 21.2
.35-39 years 58 11 100.0 9 82.1 - - 2 17.9 47 100.0 26 55.6 7 15.8 13 28.5
.40-44 years 37 8 100.0 4 43.5 1 15.5 3 41.1 29 100.0 18 63.2 - - 11 36.8
.45-54 years 28 4 100.0 4 100.0 - - - - 24 100.0 14 60.0 - - 9 40.0
.55-64 years 3 1 100.0 - 32.8 - - - 67.2 3 100.0 1 51.5 1 43.6 - 4.9
.65-74 years 7 1 100.0 - - - - 1 100.0 6 100.0 - - - - 6 100.0
.75+ years 1 - - - - - - - - 1 100.0 - - - - 1 100.0 FAMILY INCOME
.Family Income Under $10,000 223 21 100.0 10 49.9 2 8.0 9 42.1 203 100.0 65 32.0 16 8.0 122 60.0
.$10,000 to $14,999 67 9 100.0 6 70.0 1 15.2 1 14.8 58 100.0 47 80.9 2 4.3 9 14.8
.$15,000 to $19,999 39 10 100.0 10 100.0 - - - - 29 100.0 23 80.1 3 10.5 3 9.4
.$20,000 to $24,999 49 6 100.0 6 100.0 - - - - 43 100.0 38 88.6 - - 5 11.4
.$25,000 to $29,999 32 6 100.0 6 100.0 - - - - 25 100.0 25 96.7 - - 1 3.3
.$30,000 to $39,999 29 10 100.0 9 87.2 1 12.8 - - 19 100.0 14 75.6 1 6.4 3 18.0
.$40,000 to $49,999 10 4 100.0 2 69.0 - - 1 31.0 6 100.0 6 100.0 - - - -
.$50,000 to $74,999 6 4 100.0 3 59.6 - - 2 40.4 2 100.0 2 100.0 - - - -
.$75,000 and over 5 - - - - - - - - 5 100.0 - 9.2 4 90.8 - - POVERTY STATUS
.Below poverty level 123 16 100.0 9 53.7 - - 8 46.3 107 100.0 32 30.1 6 5.8 68 64.1
.At or above poverty level 337 54 100.0 44 82.3 4 7.9 5 9.8 283 100.0 188 66.4 21 7.5 74 26.1
Page 7 of 12

ALL FAMILY GROUPS 460 70 100.0 53 75.6 4 6.1 13 18.3 389 100.0 220 56.5 27 7.0 142 36.5 NUMBER OF OWN CHILDREN UNDER 18 YEARS
.One own child under 18 309 52 100.0 37 72.1 3 5.9 11 22.0 257 100.0 141 54.9 14 5.3 103 39.9
.Two own children under 18 91 9 100.0 9 100.0 - - - - 83 100.0 54 65.7 8 9.9 20 24.4
.Three own children under 18 41 7 100.0 6 78.8 - - 2 21.2 33 100.0 21 63.1 1 3.5 11 33.4
.Four or more own children under 18 19 3 100.0 1 54.3 1 45.7 - - 16 100.0 3 21.5 4 27.4 8 51.1 OWN CHILDREN 6-17 YEARS
.Without own children 6-17 211 29 100.0 23 78.3 1 4.7 5 17.0 182 100.0 86 47.3 16 9.0 80 43.7
.One own child 6-17 166 27 100.0 19 69.9 2 6.2 6 23.9 140 100.0 92 65.9 2 1.8 45 32.3
.Two own children 6-17 55 9 100.0 9 100.0 - - - - 46 100.0 31 68.9 3 6.5 11 24.6
.Three own children 6-17 22 3 100.0 1 43.4 - - 2 56.6 19 100.0 9 45.1 6 29.4 5 25.6
.Four or more own children 6-17 6 3 100.0 1 54.3 1 45.7 - - 3 100.0 2 58.2 - - 1 41.8 OWN CHILDREN 12-17 YEARS
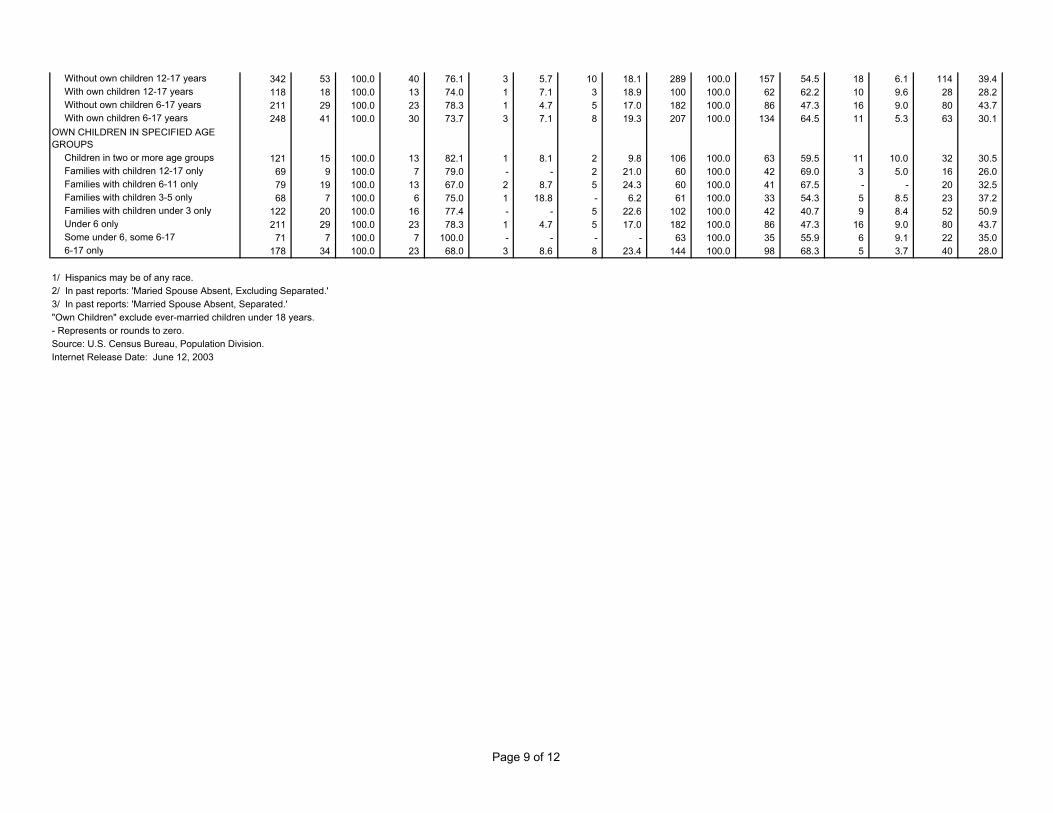
.Without own children 12-17 342 53 100.0 40 76.1 3 5.7 10 18.1 289 100.0 157 54.5 18 6.1 114 39.4
.One own child 12-17 93 13 100.0 12 86.5 - - 2 13.5 80 100.0 48 60.2 8 9.7 24 30.1
.Two own children 12-17 21 4 100.0 1 34.4 1 29.6 2 36.0 17 100.0 11 64.5 2 11.2 4 24.3
.Three or more own children 12-17 3 - - - - - - - - 3 100.0 3 100.0 - - - - OWN CHILDREN 6-11 YEARS
.Without own children 6-11 285 38 100.0 30 78.4 1 3.7 7 17.9 247 100.0 128 51.7 19 7.8 100 40.5
.One own child 6-11 135 25 100.0 17 68.6 2 6.7 6 24.7 111 100.0 76 68.6 2 2.2 32 29.2
.Two own children 6-11 34 6 100.0 5 80.1 1 19.9 - - 28 100.0 16 57.9 6 19.8 6 22.2
.Three or more own children 6-11 5 1 100.0 1 100.0 - - - - 3 100.0 - - - - 3 100.0 OWN CHILDREN UNDER 6 YEARS
.Without own children under 6 178 34 100.0 23 68.0 3 8.6 8 23.4 144 100.0 98 68.3 5 3.7 40 28.0
.One own child under 6 242 32 100.0 26 80.0 1 4.4 5 15.7 210 100.0 104 49.8 18 8.7 87 41.4
.Two own children under 6 29 3 100.0 3 100.0 - - - - 26 100.0 15 59.6 4 14.5 7 25.9
.Three or more own children under 6 11 1 100.0 1 100.0 - - - - 10 100.0 2 16.2 - - 8 83.8 OWN CHILDREN UNDER 3 YEARS
.Without own children under 3 277 46 100.0 33 72.3 4 9.4 8 18.3 231 100.0 147 63.7 12 5.1 72 31.2
.One own child under 3 176 25 100.0 20 81.6 - - 5 18.4 151 100.0 73 48.1 16 10.3 63 41.7
.Two or more own children under 3 7 - - - - - - - - 7 100.0 - - - - 7 100.0 AGE OF OWN CHILDREN
.With own children under 18 years 460 70 100.0 53 75.6 4 6.1 13 18.3 389 100.0 220 56.5 27 7.0 142 36.5
.Without own children under 12 years 69 9 100.0 7 79.0 - - 2 21.0 60 100.0 42 69.0 3 5.0 16 26.0
.With own children under 12 years 391 62 100.0 46 75.1 4 6.9 11 18.0 329 100.0 178 54.2 24 7.4 126 38.4
.Without own children under 6 years 178 34 100.0 23 68.0 3 8.6 8 23.4 144 100.0 98 68.3 5 3.7 40 28.0
.With own children under 6 years 282 37 100.0 30 82.5 1 3.8 5 13.7 245 100.0 122 49.5 22 9.0 102 41.5
.Without own children under 5 years 202 39 100.0 26 68.5 4 11.1 8 20.4 163 100.0 109 67.0 7 4.2 47 28.8
.With own children under 5 years 258 32 100.0 27 84.2 - - 5 15.8 226 100.0 111 48.9 21 9.1 95 42.1
.Without own children under 3 years 277 46 100.0 33 72.3 4 9.4 8 18.3 231 100.0 147 63.7 12 5.1 72 31.2
.With own children under 3 years 183 25 100.0 20 81.6 - - 5 18.4 158 100.0 73 45.9 16 9.8 70 44.2
.Without own children under 1 year 402 57 100.0 45 77.9 4 7.5 8 14.6 344 100.0 202 58.6 23 6.7 120 34.8
.With own children under 1 year 58 13 100.0 9 65.2 - - 5 34.8 45 100.0 18 40.4 4 9.8 22 49.8
.Without own children 3-5 years 329 54 100.0 39 71.5 3 5.4 12 23.1 276 100.0 157 57.1 18 6.6 100 36.3
.With own children 3-5 years 130 17 100.0 15 88.8 1 8.4 - 2.8 114 100.0 63 55.1 9 8.0 42 36.9
.Without own children 6-11 years 285 38 100.0 30 78.4 1 3.7 7 17.9 247 100.0 128 51.7 19 7.8 100 40.5
.With own children 6-11 years 174 32 100.0 23 72.2 3 8.9 6 18.8 142 100.0 92 64.8 8 5.7 42 29.5
Page 8 of 12
.Without own children 12-17 years 342 53 100.0 40 76.1 3 5.7 10 18.1 289 100.0 157 54.5 18 6.1 114 39.4
.With own children 12-17 years 118 18 100.0 13 74.0 1 7.1 3 18.9 100 100.0 62 62.2 10 9.6 28 28.2
.Without own children 6-17 years 211 29 100.0 23 78.3 1 4.7 5 17.0 182 100.0 86 47.3 16 9.0 80 43.7
.With own children 6-17 years 248 41 100.0 30 73.7 3 7.1 8 19.3 207 100.0 134 64.5 11 5.3 63 30.1 OWN CHILDREN IN SPECIFIED AGE GROUPS
.Children in two or more age groups 121 15 100.0 13 82.1 1 8.1 2 9.8 106 100.0 63 59.5 11 10.0 32 30.5
.Families with children 12-17 only 69 9 100.0 7 79.0 - - 2 21.0 60 100.0 42 69.0 3 5.0 16 26.0
.Families with children 6-11 only 79 19 100.0 13 67.0 2 8.7 5 24.3 60 100.0 41 67.5 - - 20 32.5
.Families with children 3-5 only 68 7 100.0 6 75.0 1 18.8 - 6.2 61 100.0 33 54.3 5 8.5 23 37.2
.Families with children under 3 only 122 20 100.0 16 77.4 - - 5 22.6 102 100.0 42 40.7 9 8.4 52 50.9
.Under 6 only 211 29 100.0 23 78.3 1 4.7 5 17.0 182 100.0 86 47.3 16 9.0 80 43.7
.Some under 6, some 6-17 71 7 100.0 7 100.0 - - - - 63 100.0 35 55.9 6 9.1 22 35.0
.6-17 only 178 34 100.0 23 68.0 3 8.6 8 23.4 144 100.0 98 68.3 5 3.7 40 28.0 Footnotes:1/ Hispanics may be of any race.2/ In past reports: 'Maried Spouse Absent, Excluding Separated.'3/ In past reports: 'Married Spouse Absent, Separated.'"Own Children" exclude ever-married children under 18 years.- Represents or rounds to zero.Source: U.S. Census Bureau, Population Division.Internet Release Date: June 12, 2003
Page 9 of 12
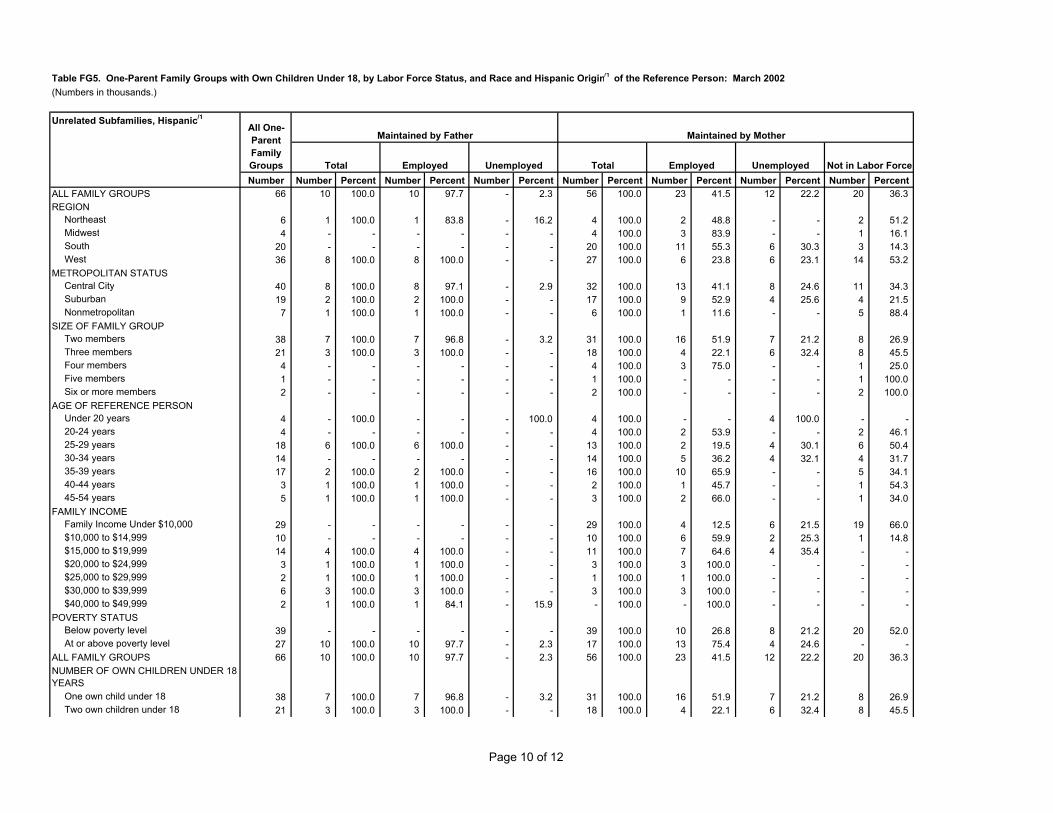
Table FG5. One-Parent Family Groups with Own Children Under 18, by Labor Force Status, and Race and Hispanic Origin/1/ of the Reference Person: March 2002(Numbers in thousands.)
Unrelated Subfamilies, Hispanic/1/
All One-Parent Family Groups
Maintained by Father Maintained by Mother
Total Employed Unemployed Total Employed Unemployed Not in Labor ForceNumber Number Percent Number Percent Number Percent Number Percent Number Percent Number Percent Number Percent
ALL FAMILY GROUPS 66 10 100.0 10 97.7 - 2.3 56 100.0 23 41.5 12 22.2 20 36.3 REGION
.Northeast 6 1 100.0 1 83.8 - 16.2 4 100.0 2 48.8 - - 2 51.2
.Midwest 4 - - - - - - 4 100.0 3 83.9 - - 1 16.1
.South 20 - - - - - - 20 100.0 11 55.3 6 30.3 3 14.3
.West 36 8 100.0 8 100.0 - - 27 100.0 6 23.8 6 23.1 14 53.2 METROPOLITAN STATUS
.Central City 40 8 100.0 8 97.1 - 2.9 32 100.0 13 41.1 8 24.6 11 34.3
.Suburban 19 2 100.0 2 100.0 - - 17 100.0 9 52.9 4 25.6 4 21.5
.Nonmetropolitan 7 1 100.0 1 100.0 - - 6 100.0 1 11.6 - - 5 88.4 SIZE OF FAMILY GROUP
.Two members 38 7 100.0 7 96.8 - 3.2 31 100.0 16 51.9 7 21.2 8 26.9
.Three members 21 3 100.0 3 100.0 - - 18 100.0 4 22.1 6 32.4 8 45.5
.Four members 4 - - - - - - 4 100.0 3 75.0 - - 1 25.0
.Five members 1 - - - - - - 1 100.0 - - - - 1 100.0
.Six or more members 2 - - - - - - 2 100.0 - - - - 2 100.0 AGE OF REFERENCE PERSON
.Under 20 years 4 - 100.0 - - - 100.0 4 100.0 - - 4 100.0 - -
.20-24 years 4 - - - - - - 4 100.0 2 53.9 - - 2 46.1
.25-29 years 18 6 100.0 6 100.0 - - 13 100.0 2 19.5 4 30.1 6 50.4
.30-34 years 14 - - - - - - 14 100.0 5 36.2 4 32.1 4 31.7
.35-39 years 17 2 100.0 2 100.0 - - 16 100.0 10 65.9 - - 5 34.1
.40-44 years 3 1 100.0 1 100.0 - - 2 100.0 1 45.7 - - 1 54.3
.45-54 years 5 1 100.0 1 100.0 - - 3 100.0 2 66.0 - - 1 34.0 FAMILY INCOME
.Family Income Under $10,000 29 - - - - - - 29 100.0 4 12.5 6 21.5 19 66.0
.$10,000 to $14,999 10 - - - - - - 10 100.0 6 59.9 2 25.3 1 14.8
.$15,000 to $19,999 14 4 100.0 4 100.0 - - 11 100.0 7 64.6 4 35.4 - -
.$20,000 to $24,999 3 1 100.0 1 100.0 - - 3 100.0 3 100.0 - - - -
.$25,000 to $29,999 2 1 100.0 1 100.0 - - 1 100.0 1 100.0 - - - -
.$30,000 to $39,999 6 3 100.0 3 100.0 - - 3 100.0 3 100.0 - - - -
.$40,000 to $49,999 2 1 100.0 1 84.1 - 15.9 - 100.0 - 100.0 - - - - POVERTY STATUS
.Below poverty level 39 - - - - - - 39 100.0 10 26.8 8 21.2 20 52.0
.At or above poverty level 27 10 100.0 10 97.7 - 2.3 17 100.0 13 75.4 4 24.6 - - ALL FAMILY GROUPS 66 10 100.0 10 97.7 - 2.3 56 100.0 23 41.5 12 22.2 20 36.3 NUMBER OF OWN CHILDREN UNDER 18 YEARS
.One own child under 18 38 7 100.0 7 96.8 - 3.2 31 100.0 16 51.9 7 21.2 8 26.9
.Two own children under 18 21 3 100.0 3 100.0 - - 18 100.0 4 22.1 6 32.4 8 45.5
Page 10 of 12

.Three own children under 18 4 - - - - - - 4 100.0 3 75.0 - - 1 25.0
.Four or more own children under 18 3 - - - - - - 3 100.0 - - - - 3 100.0 OWN CHILDREN 6-17 YEARS
.Without own children 6-17 18 4 100.0 4 94.6 - 5.4 14 100.0 5 39.4 4 29.5 4 31.1
.One own child 6-17 21 3 100.0 3 100.0 - - 18 100.0 11 58.7 2 13.2 5 28.1
.Two own children 6-17 22 3 100.0 3 100.0 - - 19 100.0 5 25.5 6 31.4 8 43.1
.Three own children 6-17 3 - - - - - - 3 100.0 2 73.9 - - 1 26.1
.Four or more own children 6-17 2 - - - - - - 2 100.0 - - - - 2 100.0 OWN CHILDREN 12-17 YEARS
.Without own children 12-17 46 8 100.0 8 97.3 - 2.7 38 100.0 16 42.8 12 31.9 10 25.2
.One own child 12-17 12 2 100.0 2 100.0 - - 10 100.0 4 42.3 - 3.1 5 54.6
.Two own children 12-17 7 - - - - - - 7 100.0 3 37.4 - - 4 62.6
.Three or more own children 12-17 1 - - - - - - 1 100.0 - - - - 1 100.0 OWN CHILDREN 6-11 YEARS
.Without own children 6-11 31 6 100.0 5 96.1 - 3.9 25 100.0 10 41.4 4 17.7 10 40.9
.One own child 6-11 17 1 100.0 1 100.0 - - 16 100.0 9 53.3 2 13.1 5 33.6
.Two own children 6-11 18 3 100.0 3 100.0 - - 15 100.0 4 28.5 6 40.0 5 31.5 OWN CHILDREN UNDER 6 YEARS
.Without own children under 6 41 6 100.0 6 100.0 - - 36 100.0 16 45.8 8 23.4 11 30.9
.One own child under 6 24 4 100.0 4 94.6 - 5.4 20 100.0 7 33.9 4 20.2 9 45.9 OWN CHILDREN UNDER 3 YEARS
.Without own children under 3 52 7 100.0 7 100.0 - - 44 100.0 18 39.9 12 27.9 14 32.2
.One own child under 3 14 2 100.0 2 90.7 - 9.3 11 100.0 5 47.7 - - 6 52.3 AGE OF OWN CHILDREN
.With own children under 18 years 66 10 100.0 10 97.7 - 2.3 56 100.0 23 41.5 12 22.2 20 36.3
.Without own children under 12 years 11 2 100.0 2 100.0 - - 9 100.0 4 40.8 - 3.4 5 55.8
.With own children under 12 years 55 8 100.0 8 97.3 - 2.7 47 100.0 19 41.6 12 25.9 15 32.5
.Without own children under 6 years 41 6 100.0 6 100.0 - - 36 100.0 16 45.8 8 23.4 11 30.9
.With own children under 6 years 24 4 100.0 4 94.6 - 5.4 20 100.0 7 33.9 4 20.2 9 45.9
.Without own children under 5 years 41 6 100.0 6 100.0 - - 36 100.0 16 45.8 8 23.4 11 30.9
.With own children under 5 years 24 4 100.0 4 94.6 - 5.4 20 100.0 7 33.9 4 20.2 9 45.9
.Without own children under 3 years 52 7 100.0 7 100.0 - - 44 100.0 18 39.9 12 27.9 14 32.2
.With own children under 3 years 14 2 100.0 2 90.7 - 9.3 11 100.0 5 47.7 - - 6 52.3
.Without own children under 1 year 64 10 100.0 10 97.7 - 2.3 54 100.0 23 42.8 12 22.9 19 34.3
.With own children under 1 year 2 - - - - - - 2 100.0 - - - - 2 100.0
.Without own children 3-5 years 55 8 100.0 8 97.2 - 2.8 47 100.0 22 46.3 8 17.7 17 36.1
.With own children 3-5 years 11 2 100.0 2 100.0 - - 9 100.0 1 15.9 4 46.5 3 37.6
.Without own children 6-11 years 31 6 100.0 5 96.1 - 3.9 25 100.0 10 41.4 4 17.7 10 40.9
.With own children 6-11 years 35 4 100.0 4 100.0 - - 31 100.0 13 41.5 8 25.9 10 32.6
.Without own children 12-17 years 46 8 100.0 8 97.3 - 2.7 38 100.0 16 42.8 12 31.9 10 25.2
.With own children 12-17 years 19 2 100.0 2 100.0 - - 18 100.0 7 38.6 - 1.7 11 59.7
.Without own children 6-17 years 18 4 100.0 4 94.6 - 5.4 14 100.0 5 39.4 4 29.5 4 31.1
.With own children 6-17 years 48 6 100.0 6 100.0 - - 42 100.0 18 42.2 8 19.8 16 38.0 OWN CHILDREN IN SPECIFIED AGE GROUPS
.Children in two or more age groups 11 - - - - - - 11 100.0 3 30.8 - - 8 69.2
.Families with children 12-17 only 11 2 100.0 2 100.0 - - 9 100.0 4 40.8 - 3.4 5 55.8
.Families with children 6-11 only 26 4 100.0 4 100.0 - - 21 100.0 10 48.8 8 37.4 3 13.8
Page 11 of 12
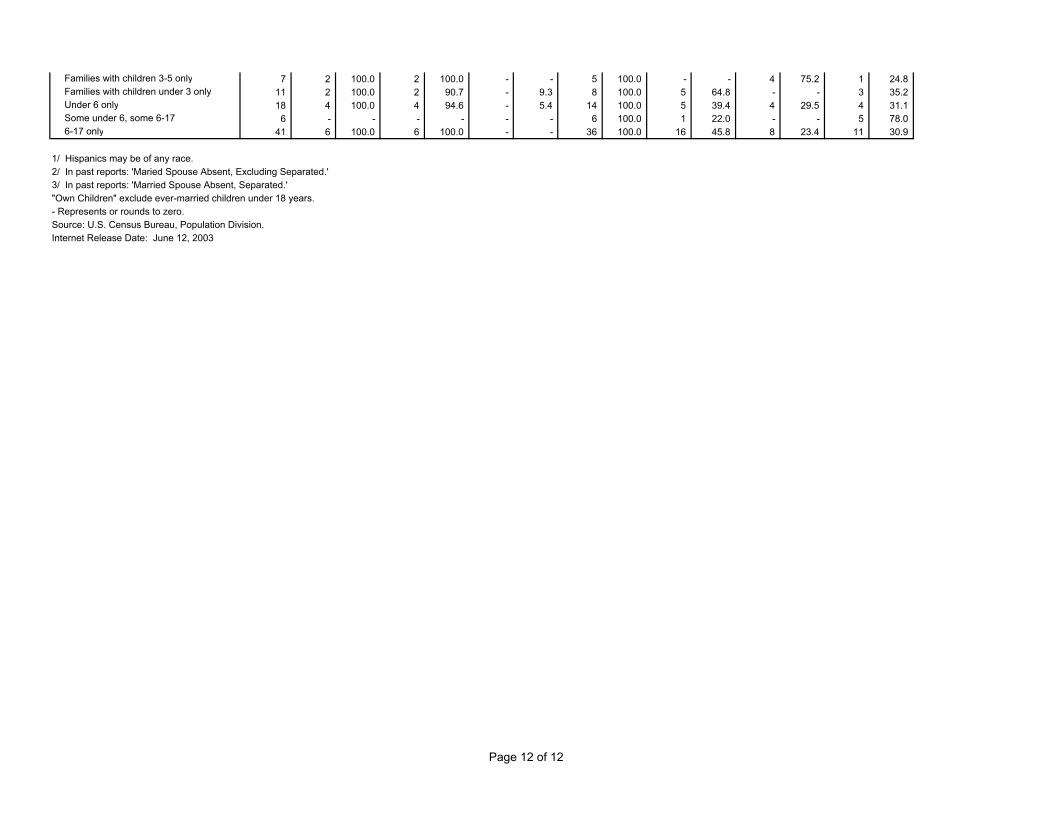
.Families with children 3-5 only 7 2 100.0 2 100.0 - - 5 100.0 - - 4 75.2 1 24.8
.Families with children under 3 only 11 2 100.0 2 90.7 - 9.3 8 100.0 5 64.8 - - 3 35.2
.Under 6 only 18 4 100.0 4 94.6 - 5.4 14 100.0 5 39.4 4 29.5 4 31.1
.Some under 6, some 6-17 6 - - - - - - 6 100.0 1 22.0 - - 5 78.0
.6-17 only 41 6 100.0 6 100.0 - - 36 100.0 16 45.8 8 23.4 11 30.9 Footnotes:1/ Hispanics may be of any race.2/ In past reports: 'Maried Spouse Absent, Excluding Separated.'3/ In past reports: 'Married Spouse Absent, Separated.'"Own Children" exclude ever-married children under 18 years.- Represents or rounds to zero.Source: U.S. Census Bureau, Population Division.Internet Release Date: June 12, 2003
Page 12 of 12

![Breakout by Race / Ethnicity [Weighted] - CCSSE · Total 7,861 100.0 25,667 100.0 1,138 100.0 50,617 100.0 234,634 100.0 74,299 100.0 18,695 100.0 4g. Worked with classmates outside](https://img.pdfslide.us/doc/110x75/5ac86cc17f8b9a6b578c1ca7/breakout-by-race-ethnicity-weighted-7861-1000-25667-1000-1138-1000-50617.jpg)