Embed Size (px)
Citation preview

Page 1 of 109
Page 2 of 109
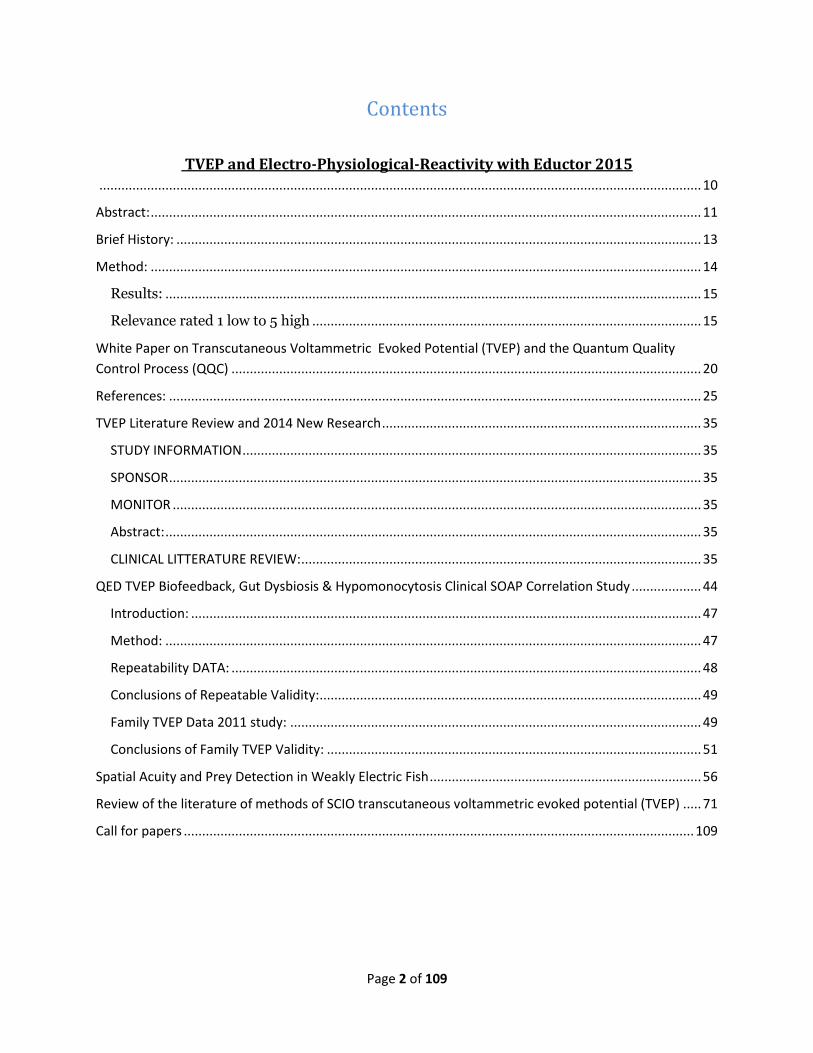
Contents
TVEP and Electro-Physiological-Reactivity with Eductor 2015
.................................................................................................................................................................... 10
Abstract: ...................................................................................................................................................... 11
Brief History: ............................................................................................................................................... 13
Method: ...................................................................................................................................................... 14
Results: .................................................................................................................................................. 15
Relevance rated 1 low to 5 high .......................................................................................................... 15
White Paper on Transcutaneous Voltammetric Evoked Potential (TVEP) and the Quantum Quality
Control Process (QQC) ................................................................................................................................ 20
References: ................................................................................................................................................. 25
TVEP Literature Review and 2014 New Research ....................................................................................... 35
STUDY INFORMATION ............................................................................................................................. 35
SPONSOR ................................................................................................................................................. 35
MONITOR ................................................................................................................................................ 35
Abstract: .................................................................................................................................................. 35
CLINICAL LITTERATURE REVIEW: ............................................................................................................. 35
QED TVEP Biofeedback, Gut Dysbiosis & Hypomonocytosis Clinical SOAP Correlation Study ................... 44
Introduction: ........................................................................................................................................... 47
Method: .................................................................................................................................................. 47
Repeatability DATA: ................................................................................................................................ 48
Conclusions of Repeatable Validity: ........................................................................................................ 49
Family TVEP Data 2011 study: ................................................................................................................ 49
Conclusions of Family TVEP Validity: ...................................................................................................... 51
Spatial Acuity and Prey Detection in Weakly Electric Fish .......................................................................... 56
Review of the literature of methods of SCIO transcutaneous voltammetric evoked potential (TVEP) ..... 71
Call for papers ........................................................................................................................................... 109

Page 3 of 109
“Yes Carl my friend, incredible claims needs incredible, vast, decade’s old,
scientific, double blind, clinical and time tested evidence. There have been many
medication testing theories and devices proven false and some devices like the
Russian headphone laser, muscle testing and point probe devices are proven
fraudulent. There is a 50 year old plus proven electro-chemical science of
Voltammetry that requires electrodes to detect the electronic signature of an
item. This cannot be done thru a bottle. Even a spectroscope cannot detect well
thru a bottle. The science of Transcutaneous Voltammetric Evoked Potential
(TVEP) has over 30 years of scientific valid testing. And now in 2014-2015 we
have retested TVEP and revalidated the process. Here is a journal of the 2015
clinical studies. “ IJMSHNEM Doctor of Sociology Brad V Johnson

Page 4 of 109

Page 5 of 109

Page 6 of 109

Page 7 of 109
Please Read: http://qqc-electronic-tongue.com/
http://indavideo.hu/video/Clinical_Evaluation_of_the_QQC_Electronic_Tongue
http://indavideo.hu/video/Medication_Testing_for_Dummies http://qqc-electronic-
tongue.com/useruploads/files/an_electronic_tongue_based_on_voltammetry_review_of_articles.pdf

Page 8 of 109
IJMSHNEM Ethics Supervisor & Institutional Director: Dr. of Sociology Brad Victor
Johnson, Dean of the International Medical University of Natural Education -- IMUNE
Editorial Consultant: Alejandro Arregui Henk, Argentina,
IJMSHNEM Associates:
Alejandro Arregui Henk, Argentina, - Chris King, - Dr Igor Cetojevic, Cyprus- Dr Bill
Cunningham, USA, - Dr. Kofi Ghartey, Africa, - Dr. Amanda Velloen, South Africa, -Dr.
Danis Gyorgy MD, Hungary, --Dr. Debbie Drake, M.D., Canada, - Dr. Sarca Ovidiu, M.D.,
Romania, --Andreea Taflan, --Dr. Steve Small, USA, -- Dr Pauline Wills, USA, -- Bala Lodhia,
Canada, --Anna Marie Stinton, Romania, --Dr. Gulyas Kinga, Hungary, -- Dr. Aurel Bacean,
M.D., Romania, --Dr. Oana Bacean, M.D., Romania, --Dr. Theron Francois, M.D., South
Africa, --Turako Yuy, Homeopath, Japan, -- Dr. Ho, M.D., China, --Gage Tarant, Dr.Marco,
Antonio, Rodriguez Infante, Mexico, - Dr. Alex Von Pelet, Germany, -- Dr. Hilf Klara MD
Hungary, -- Dr. Bacean Aurel MD, Romania, --Dr. Gebhard Gerhing MD, Bavaria, Dr.
Hobian Veronica, Romania.
Welcome to our first journal of 2015. The company Biofeedback srl has been accepted by a new ethics
committee as indicated by the next letter. The studies published in this journal have all been under the
scrutiny and supervision of this ethics committee. All of the studies in this journal have had ethics
supervision of institutional review boards or the like. And we welcome this new ethics review board to
our team of research associates.
This journal will have articles about GSRtDCs electro stimulation to help insight, hormone, erection,
chess ability, memory, focus, learning among others. Stories and details of Alzheimer’s are also
contained. Please see, read, review and consider the call for papers in the back of this journal. We wish
to broaden our knowledge of natural and energetic medicine.
Brad Victor Johnson

Page 9 of 109

Page 10 of 109
TVEP and Electro-Physiological-Reactivity
with Eductor 2015 Supervising Researchers and Medical Review Staff: Dr Klara Hilf, Dr. Marco,
Antonio, Rodriguez Infante, Dr. Hobian Veronica and Dr. Maria Baicu
Therapist: Rita Nemenyi, IMUNE Qualified GSRtDCs Research Technician
Permission of the Ethic Committee of the National Institute of Recovery Physical
Medicine and Balneo-Climatology, Bucharest, Romania
Institution: International Medical University
Sponsor: Biofeedback Srl
Dates: Feb, 27, 2015 Place: Budapest, Hungary

Page 11 of 109
Abstract: As we have shown everything is an energetic collection of fields that hold atoms in their places. These
fields that make us up are reactive with the environment. We must decide what is appropriate to eat
and what to avoid. This education starts at the earliest of ages. Most of our current biological electro
detection of what is good or bad for us takes place in the nasal-pharynx between smell and taste. The
shape receptors of the smell and taste buds are electronic voltammetric field detectors. They sense a
proper voltammetric fields that says it is good for nutrition or what is bad. The taste receptors do not
absorb or metabolize the nutrient they only test it for intake by measuring the shape of the fields with
the shape receptors of the tongue. Voltammetry is the science of analysis of the electrical fields of a
substance.
We have shown the patent for the process of the QQC voltammetric analyzer. This device has been
designed to work like the human tongue and to recognize the voltammetric signatures of items. These
signatures are maintained as a 22x22x22 matrix of 10,648 separate shape vectors that constitute one
signature. Since these fields reflect shapes they have a 3 Dimensional component and are referred to as
the trivector voltammetric signatures. These complex signatures can be amplified and inputted into the
body as part of the Xrroid process in the EPFX, SCIO, Indigo, or what is now known as the Eductor.
The Xrroid analysis is where the SCIO device measures the reaction of the body to over 10,000
substances at the calibrated speed of the body reaction. During the calibration of the SCIO device to the
subject the device will measure the voltammetric field of the patient and then send in the QQC. Then
the voltammetric signature of what is generally known as the weakest reactive substance (distilled
water) is sent in over 20 times and the highest known reactive substance combination is sent in 4 times.
The starting speed is 103rd of a second. If the subject does not react significantly to the reactive
substance versus the non-reactive distilled water the speed is reset minus one to 102nd of a second. The
speed drops in this increment till the subject has a significant reaction to the reactive substances and it
is repeatable. This then gives us a measure of the speed the subject reacts to items. Research in the
1980s showed that patients on morphine reacted much slower to norm patients. Then a variety of
reactive speeds was shown thus making a speed of reactivity calibration need for proper testing.
There are several factors that can interfere with the testing of reactivity. If we test and test an item over
and over there is adaptation. An aberrant movement, electrical wave form, or a brain wave surge can
affect a reading. So we have seen that the reading of reactivity to a single item is not as significant as we
would like. Till we could put a subject into a Faraday cage and perfectly control mental aberrations it is
not likely. But we have seen that if we measure family reactions we can get some good insight into the
reactivity fields of a subject. Research has shown that these families that we use to develop risk profiles
are worth medical attention. In this review over one hundred thousand subject studies have verified the
TVEP reactive families and the risk profiles have resulted from this work.
In this study over one hundred subjects were measured for Xrroid analysis on either a normal setting or
a placebo setting. This was done to validate the TVEP validity and show that on normal setting there
would be much more replication of data.

Page 12 of 109
Proper Ethics committee and IRB were used and informed consent from subjects. The study took place
in Europe and in America. Subjects were asked to do several measures of their wellness and they were
measured for their Xrroid reactivity profiles before and after the test. Repeated items were counted in
placebo versus real testing.

Page 13 of 109
Introduction: IT IS OUR BASIC HYPOTHESIS THAT A SMALL DC PULSED MICRO-CURRENT VOLTAMMETRIC PATTERN
APPLIED TO THE BODY CAN STIMULATE A REACTIVITY REACTION. THIS REACTIVITY MAY INDICATE A
POSITIVE REACTION TO A NUTRIENT OR A NEGATIVE REACTION TO A TOXIN. THIS EFFECT CAN BE
MAXIMIZED WITH AN AUTOFOCUSED CYBERNETIC PULSE. THIS HAS BEEN PROVEN WITH THE EPFX,
QXCI, SCIO, EDUCTOR AND A HOST OF OTHER RESEARCHERS HAVE MADE SUCH TECHNOLOGY. NOW WE
ARE TESTING THE NEWEST ADVANCE THE EDUCTOR WHICH HAS AN EXTRA TWO SIGNAL GENERATORS.
WE FIRST USE THE EDUCTOR DEVICE TO MEASURE THE BODY ELECTRIC FOR VOLTAGE, AMPERAGE,
RESISTANCE, HYDRATION, OXIDATION AND ACID ALKALINE BALANCE PLUS OUTPUT OF DISSIMILAR
CONDUCTION MATERIALS. AND ONCE WE KNOW THE BODY ELECTRIC FACTORS WE CAN APPLY AN
APPROPRIATE TAILORED ELECTRO-POTENTIAL SIMILAR SIGNAL TO THE BODY. THEN WE MEASURE THE
ELECTRO RESPONSE AND USE IT TO MAKE THE NEXT STIMULATION. THIS MAKES AN AUTO FOCUSED
CYBERNETIC LOOP WHERE THE BODY ELECTRIC CAN GUIDE THE DEVELOPMENT OF THE STIMULATION
OF THE SYNAPTIC FUNCTION. THIS HAS BEEN SHOWN TO BE ABLE TO INCREASE MENTAL ACUITY.
WE CAN CALIBRATE THE REACTION TIME OF A PERSON TO KNOW HIGH AND LOW REACTIVITY
SUBSTANCES. ONCE WE KNOW THE BASIC BODY ELECTRIC LEVELS AND REACTIVITY SPEED, WE CAN
BEGIN TO MEASURE REACTIVITY. BY APPLYING A VOLTAMMETIC SIGNATURE AND THEN MEASURING
THE BODY GSR REACTION. IN THIS STUDY WE WISH TO FURTHER TEST THIS HYPOTHESIS.
Brief History: Micro-current Cranial Electro Stimulation MCES is a new advance in Cranial Electro Stimulation CES and
energetic medicine. "Electrotherapy" has been in use for over 2000 years, as shown by the clinical
literature of the early Roman physician, Scribonius Largus, who wrote in the Compositiones Medicae of
46 AD that his patients should stand on a live black torpedo fish for the relief of a variety of medical
conditions, including gout and headaches. Claudius Galen (131 - 201 AD) also suggested using the shocks
from the electrical fish for medical therapies. There is evidence of electro-therapy in ancient Babylon
and Egypt. The body works on electro signals and electro stimulation of low current helps homeostatsis.
Low intensity electrical stimulation is believed to have originated in the studies of galvanic currents in
humans and animals as conducted by Giovanni Aldini, Alessandro Volta and others in the 18th
century, Aldini had experimented with galvanic head current as early as 1794 (upon himself) and
reported the successful treatment of patients suffering from melancholia depression using direct low-
intensity currents in 1804.
Modern research into low intensity electrical stimulation of the brain was begun by Leduc and Rouxeau
in France (1902). In 1949, the Soviet Union expanded research of CES to include the treatment
of anxiety as well as sleeping disorders.

Page 14 of 109
In the 1960s and 1970s, it was common for physicians and researchers to place electrodes on the eyes,
thinking that any other electrode site would not be able to penetrate the cranium. It was later found
that placing electrodes on the forehead was far more convenient, and quite effective.
CES was initially studied for insomnia and called electro-sleep therapy; it is also known as Cranial-
Electro Stimulation and Transcranial Electrotherapy.
One of the mechanism of action for CES is that the pulses of electric current increase the ability of
neural cells to produce serotonin, dopamine DHEA endorphins and other neurotransmitters stabilizing
the neurohormonal system. Since a slight stimulation of a pulsed milliamp current increases osmosis it is
shown that neurhormones work better from the increased osmosis.
It has been demonstrated that through CES, an electric current is engrossed upon the hypothalamic
region; during this process, CES electrodes are placed near to the face with the ground at the lower
body.
Current research shows an increase of the brain's levels of serotonin, norepinephrine, and dopamine,
and a decrease in its level of cortisol. After a MCES treatment, users are in an "alert, yet relaxed" state,
characterized by increased alpha and decreased delta brain waves as seen on EEG.
In 1972, a specific form of addiction release CES was developed by Dr. Margaret Patterson, providing
small pulses of electric current across the head to ameliorate the effects of acute and chronic
withdrawal from addictive substances. She named her treatment "NeuroElectric Therapy (NET)".
I worked with Margaret and treated rock star Pete Townsend for drug addiction. This is why the SCIO
system has had the MCES capacity built in.
The SCIO, Eductor technology is a descendent of the EPFX system US FDA registered in 1989 still in
registered for sale in America. Since 1989 we have sold over 35,000 such systems under the registered
name of EPFX, QXCI, Indigo, SCIO and Eductor. There have been well over 500,000,000 patient visits with
all getting some MCES, and not one reported case of any significant risk. Over 200 studies and articles
have been written and published on these systems and no report of any risk. It has passed all safety
tests since 1989 and all risk analysis has proved it to be insignificant risk.
The systems outlined have a potential of 0-4 volts which is beneath the human threshold of perception,
and 0-7 milliamps which makes it safe and for most subtle and undetectable.
For over 26 years reports of stress reduction, relaxation, anxiety reduction, emotional balance, addiction
release, insomnia reduction and sleep induction have been reported from the users and doctors.
The Eductor has a second wave form generator that can further intensify the CES effect. All this was
done with a cybernetic loop technology guided by the patient body electric reactions to the stimuli. Thus
we can further intensify the CES effect over older antiquated non-cybernetic technology.
Method: All subjects are volunteers who gave informed consent in writing. We used ages from 17 To 72 Male and female. They were part of a math speed and language memory study where we also looked at their TVEP reactions and compared it to known aspects of the patient.

Page 15 of 109
We first established a control reference group of ten subject reactions by asking them to solve the math problems or remember the words with no device. We observed practice effect and just how much time and effort normal subjects used to solve the problems.
Then the same researcher asked the questions to the subjects. The subjects were read an example, then asked to solve with no stimulation, then with a single generator and then with two signal generators.
Then the researcher recorded the TVEP data and reviewed it at a later time for its relevance with a
subjective relevance rating determined by the technician.
Results:
Relevance rated 1 low to 5 high
Subject #
Data Review DATE
TVEP Relevance Emotions panel relevance
1 25.01.2015
4 5
2 25 Jan 2015 5 5
3 25 Jan 2015 4 5
4 25 Jan 2015
4 5
5 25 Jan 2015
5 3
6 25 Jan 2015
5 4
7 25 Jan 2015 3 5
8 25 Jan 2015 4 5
9 26 Jan 2015 5 1
10 26 Jan 2015
4 2
11 26 Jan 2015 3 1
12 26 Jan 2015 2 5
13 26 Jan 2015 5 5
14 26 Jan 2015 5 5
15 27 Jan 2015 1 5
16 27 Jan 2015 3 5
17 27 Jan 2015
5 5
18 27 Jan 2015
5 4
19 27 Jan 2015
5 5
20 27 Jan 2015 4 5
21 27 Jan 2015 3 3
22 28 Jan 2015 4 3

Page 16 of 109
23 28 Jan 2015
5 5
24 28 Jan 2015 3 2
25 28 Jan 2015 4 4
27 28 Jan 2015 5 5
28 28 Jan 2015 5 4
29 8 Jan 2015
5 5
30 8 Jan 2015
5 5
31 8 Jan 2015
4 5
32 8 Jan 2015
5 5
33 8 Jan 2015
3 2
34 8 Jan 2015
2 4
35 8 Jan 2015
5 4
36 9 Jan 2015
5 4
37 9 Jan 2015
4 2
38 9 Jan 2015
4 4
39 9 Jan 2015
5 5
40 9 Jan 2015
5 5
41 8 Jan 2015
3 3
42 9 Jan 2015
5 4
43 9 Jan 2015
3 5
44 10 Jan 2015
5 5
44 10 Jan 2015
5 5
45 10 Jan 2015
4 4
45 10 Jan 2015
5 4
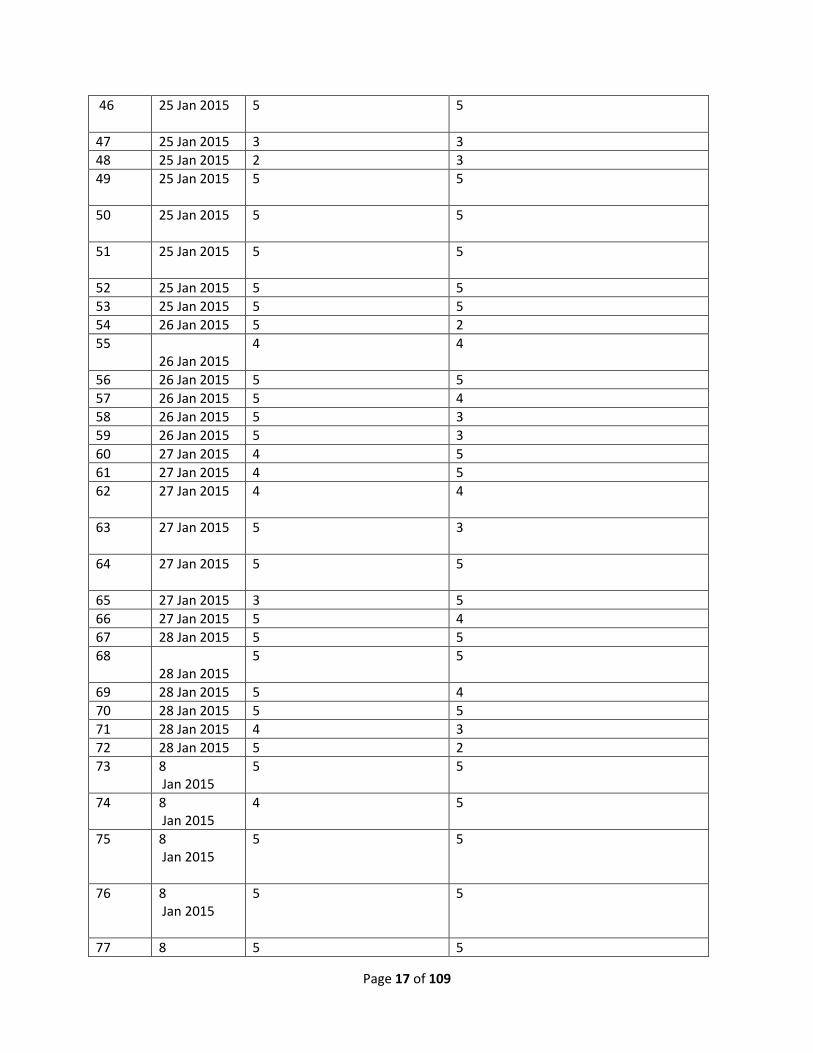
Page 17 of 109
46 25 Jan 2015
5 5
47 25 Jan 2015 3 3
48 25 Jan 2015 2 3
49 25 Jan 2015
5 5
50 25 Jan 2015
5 5
51 25 Jan 2015
5 5
52 25 Jan 2015 5 5
53 25 Jan 2015 5 5
54 26 Jan 2015 5 2
55 26 Jan 2015
4 4
56 26 Jan 2015 5 5
57 26 Jan 2015 5 4
58 26 Jan 2015 5 3
59 26 Jan 2015 5 3
60 27 Jan 2015 4 5
61 27 Jan 2015 4 5
62 27 Jan 2015
4 4
63 27 Jan 2015
5 3
64 27 Jan 2015
5 5
65 27 Jan 2015 3 5
66 27 Jan 2015 5 4
67 28 Jan 2015 5 5
68 28 Jan 2015
5 5
69 28 Jan 2015 5 4
70 28 Jan 2015 5 5
71 28 Jan 2015 4 3
72 28 Jan 2015 5 2
73 8 Jan 2015
5 5
74 8 Jan 2015
4 5
75 8 Jan 2015
5 5
76 8 Jan 2015
5 5
77 8 5 5

Page 18 of 109
Jan 2015
78 8 Jan 2015
4 4
79 8 Jan 2015
5 5
80 9 Jan 2015
5 4
81 9 Jan 2015
5 5
82 9 Jan 2015
4 1
83 9 Jan 2015
5 4
84 9 Jan 2015
5 5
85 8 Jan 2015
5 5
86 9 Jan 2015
3 3
87 9 Jan 2015
2 5
88 10 Jan 2015
4 4
89 10 Jan 2015
5 5
90 10 Jan 2015
5 5
91 10 Jan 2015
5 5
92 9 Jan 2015
2 5
93 10 Jan 2015
4 3
94 10 Jan 2015
5 2
95 10 Jan 2015
5 5
96 10 Jan 2015
5 5
Average = 4.4 Average = 4.2
The subjective double blind rating of effectiveness shows the SCIO’s ability to display relevant
physiological and emotional concerns.

Page 19 of 109
Placebo group
1 5 Jan 2015
3 3
2 5 Jan 2015
2 3
3 5 Jan 2015
1 2
4 5 Jan 2015
2 2
5 5 Jan 2015
1 2
6 10 Jan 2015
1 2
7 10 Jan 2015
2 3
8 10 Jan 2015
2 3
9 10 Jan 2015
1 2
10 10 Jan 2015
2 2
11 10 Jan 2015
1 1
Average = 1.6 Average = 2.3
Discussion:
Placebo to treatment group shows a very high significance, but we need to understand the
subjectivity of this test and realize that these results are not as profound as they might appear.
All of the doctors using this technology report its extreme value, but also it is not 100% reliable and all
results must be considered with further testing. There is indeed a TVEP effect but the technology is
just starting and needs much more research to be a fully defined diagnostic tool.
Till then the TVEP provides a valued set of opinions and thought provocation. But be sure to pursue a
more researched mode of diagnostics to validate your results.
The Risk Profile list of 40 categories also showed strong correlation in this study but we will publish
those results later.
TVEP has a valuable role in modern medicine.

Page 20 of 109
White Paper on Transcutaneous
Voltammetric Evoked Potential
(TVEP) and the Quantum Quality
Control Process (QQC) By Prof Desire’ Dubounet
Basic 5th grade science tells us. We are made of atoms and atoms are made almost exclusively of electrons, protons and neutrons. None of us can in any way perceive this simple truth presented to us in 5th grade. We live in the false belief that there is solid flesh in our bodies, when we know that it is not true. The outer area of any atom or molecule is made of the electrons. The electrons have a very strong electric charge. So strong that two electrons can almost never touch, the energetic charge will repel them. No atom ever touches another atom. No molecule ever touches another molecule. Everything is held together with energetic, quantum, electro-static-magnetic fields, or other subatomic forces. All of life is mostly electrons and protons that never touch but only interact trough quantic-electro-magnetic-static fields. Our bodies are made of electromagnetic fields from the electrons and protons in us. These are the basic forces of electricity. All of the interactions of life are energetic and electrical at some level. This is a 5th grade science fact.
The electrons generate the fields around them and the atoms and molecules that contain them can only interact through the field interactions. In some compounds the electron fields are held in tightly, such as in glass or other minerals. The electron fields cannot interact very freely. These items are largely inert, meaning they do not interact well with other molecular fields. Plants absorb minerals thru their roots and through the process of photosynthesis and quantum electro dynamics (QED) the outer electrons gain field energy and become freer. QED tells us that when an electron absorbs a photon (like a sunlight particle) the electron goes to a higher quantic state of energy. The high states of the hot electrons in sugar make energy for animals thru Adenosine Tri-phosphate (ATP). So the minerals go from inert substances to electron field interactive. In Biology electron field interaction is needed for life. And since the chemical companies cannot induce the proper electron field state thru their synthetic process, synthetic chemistry is incompatible with the human body.
The way the outer electrons and free protons are placed in a molecule is key. Also the quantic availability of the outer quantic shells is important. Ions and ionic forces are also key as are Van derWalls forces. The higher the electron strength, the more the interactions. The structure of the molecules will give it an individual electrical field in 3 dimensions. These produce a measurable field.
And yet so-called modern medicine ignores these simple facts. But one scientist, and electrical engineer who worked on the Apollo project for AC electronics, saw that the body electric could be measured and changed. We could detect and affect the body electric with extremely safe simple means.

Page 21 of 109
The purpose of this collection of articles is to make the scientific proof of the body electric and how it interacts or reacts to substances. Our research and literature review will verify the following.
1. All things are made of quantic-electro-magnetic-static fields. How these fields interact with each other dictates the results of interaction.
2. The fields of individual substances have particular individual field signatures that can be assayed using electrode based voltammetry.
3. A special voltammetric system for analyzing a wide variety of substance in a natural human like system has been developed and used for over two decades with incredible reproducible and clinical results. This is the QQC system first developed in 1988 and trademarked in the US in 1995. Sold worldwide it has had clinical and experimental validation. This QQC device is made to measure the electrical fields of a substance using 3 dimensional voltammetric techniques. A patent pending application for this individual QQC is contained within.
4. All vertrabrates have an electro-sense detection system. Salt water animals have an advantage living in an electro-conductive medium. Air livings mammals such as humans have a weak field detection system. The field of a substance will need to be amplified ten to the sixth times to get good readings on a human.
5. The electro-detection sense of the human is an extension of the olfaction system and is mostly trancutaneous.
6. Galvanic skin resistance is the one way to measure electro-sense detection. When coupled with voltammetric readings of electro-physiological reactivity (EPF) the accuracy is extended.

Page 22 of 109
7. The SCIO system is designed to be able to input a 3D QQC signal pattern and the assay the EPR voltammetric changes of a person to the stimuli. A catalogue of the EPR reaction patterns can then be evaluated for signal strength and duration.
8. The ionic exchange rate in the body human is approximately one hundredths of a sec. we can further calibrate to an individual reaction EPR speed. When we test a series of items at the best maximum reaction speed we call this process the Xrroid. The word Xrroid first coined by the developer of the system in 1989 in the FDA registration of the EPFX Electro-Physiological-Feedback-Xrroid.
9. This process is prone to internal and external intervention. Adaptation response of the person can change reaction strengths in sequential testing. So the companies have always used a disclaimer to state the fact that although the EPR is interesting it should not be considered as diagnostic. It is pre-diagnostic at best.
10. The stimulation or input of the QQC voltammetric signature of a substance is a know voltammetric signal and can be used to measure skin resistance. This is over the skin. The signal is a challenge to the body and the differences of pre and post signal measure can give us a EPR measure. Thus it is an measure of an electrical evoked potential. The whole process is then termed the Transcutaneous Voltammetric Evoked Potential (TVEP). A patent pending application for the SCIO individual TVEP is included.
11. Resistance to energetic medicine is profound from those with no electrical background or who were sick in 5th grade. The drug companies fear and loathe drugless therapies or electrical processes.
Global analysis of the charge stability of a person is akin to measuring the amount of free electrons to free protons. Most electrons and protons are bond tightly inside an atom. Electrons in the outer shell can be free or in a quantum imbalance seeking to balance a outer shell. This accounts for chemical bonds. So a direct global measure of ph can be detected and affected. There is a profound science of analysis of the body electric. ECG, EMG, EEG, GSR, to mention a few. But till now the body electric has been secondary and not of primary concern.
There has also been a vast body of research showing that electro-stimulation can be helpful to the body. Work on tens, electro-osmosis, wound healing, and micro-current device of an incredible range. Few have sought to interface theses two areas of medicine of measuring the body electric and then affecting the body electric. We can detect electrical aberrations in the body and then affect them. To measure an factor of the body electric and stimulate the body with a safe signal and then auto-focus the next pulse using a cybernetic loop using feedback principles. To measure the body electric, find aberrations of oscillation, reactivity, electro potential, resistance etc, and then to affect or repair these aberrations through micro-current stimulations.
A computer could read these signals and over 250,000 bits of data a sec. and check for anomalies or aberrations in the body electric. The non-linear fuzzy logic system can assay problems in the body electric such as but not inclusive, osmotic distension, dehydration from osmotic irregularities, oxidation disturbances, muscle tone disorders, dystonia, low voltage potential, low amperage, power index disorders, membrane capacitance dysfunction, ionic inductance dysfunction, reaction profile dysfunction, brain wave irregularities, heart rhythm irregularities, muscular problems of power transfer, and many others. In short dysfunction in the global body electric. We can measure muscle disorders and effect repair. When a current of known oscillations is sent through healthy tissue (input) a known output is received on the other side (output). When there is soft tissue damage the output readings are

Page 23 of 109
different in a known way. When there is hard tissue or muscle damage there is also a predictable output.
Then with a medically safe micro-current pulse the computer could attempt repair of these aberrations. The pulse is designed to electrically rectify or remedy injured tissue through muscular re-education or wound healing in the vernacular. The pulse can reduce pain, rejuvenate tissue, promote healing, and promote osmosis, balance oxidation issues, correct aberrant brain wave, muscle load disorders, and many other electrical issues. It is designed as a universal electro-physiological feedback system.
The SCIO/Eductor system measures 238 electrical variables every 2000th of a second or more. The oscillations of these variables allow us to calculate electro-potential. We can calculate voltage, amperage, resistance, hydration index, oxidation index, Proton pressure, Electron pressure, reactance, wattage power index, susceptance, capacitance, inductance and other electrical virtual readings of the body.
There are many counterfeit copies of the SCIO, some which are complete flim flam conartist nonfunctioning boxes. So be careful but only the Dr. Nelson approved SCIO or Eternale really works. The medical doctors have no teaching of the body electric. They are tJanht about synthetic drugs and surgery, so they fear the unknown body electric. Especially when their ego is assaulted and they must admit they don’t know something. So they sit back with fear. Only a few are bold enough with courage to even learn more. Bold enough to apply 5th grade science.

Page 24 of 109

Page 25 of 109
References:
1. ^ a b 21CFR882.5800, Part 882 ("Neurological Devices")
2. ^ a b Smith RB, Cranial Electrotherapy Stimulation: Its First Fifty Years
3. ^ a b c Sidney Klawansky (July 1995). "Meta-Analysis of Randomized Controlled Trials of Cranial
Electrostimulation: Efficacy in Treating Selected Psychological and Physiological Conditions". Journal of
Nervous & Mental Disease 183 (7): 478–484.
4. ^ a b Stephen Barrett, M.D. (January 28, 2008). "Dubious Claims Made for NutriPax and Cranial
Electrotherapy Stimulation". QuackWatch.
5. ^ Stillings D. A Survey Of The History Of Electrical Stimulation For Pain To 1900 Med.Instrum 9: 255-259
1975
6. ^ a b Zaghi S, Acar M, Hultgren B, Boggio PS, Fregni F. (2009). Noninvasive brain stimulation with low-
intensity electrical currents: putative mechanisms of action for direct and alternating current stimulation. The
Neuroscientist
7. ^ Leduc S. La narcose electrique. Ztschr. fur Electrother., 1903, XI, 1: 374-381, 403-410.
8. ^ Leduc S., Rouxeau A. Influence du rythme et de la period sur la production de l’inhibition par les courants
intermittents de basse tension. C.R. Seances Soc.Biol., 1903,55, VII-X : 899-901
9. ^ L.A. Geddes (1965). Electronarcosis. Med.Electron.biol.Engng. Vol.3, pp. 11–26. Pergamon Press
10. ^ Гиляровский В.А., Ливенцев Н.М., Сегаль Ю.Е., Кириллова З.А. Электросон (клинико-
физиологическое исследование). М., "Медгиз", 2 изд. М., "Медгиз", 1958, 166 с.
11. ^ Bystritsky, A, Kerwin, L and Feusner, J (2008). "A pilot study of cranial electrotherapy stimulation for
generalized anxiety disorder". Journal of Clinical Psychiatry 69 (3): 412–
417.doi:10.4088/JCP.v69n0311. PMID 18348596.
12. ^ Appel, C. P. (1972). Effect of electrosleep: Review of research. Goteborg Psychology Report, 2, 1-24
13. ^ doi:10.1300/J184v09n02_02
14. ^ Iwanovsky, A., & Dodge, C. H. (1968). Electrosleep and electroanesthesia–theory and clinical experience.
Foreign Science Bulletin, 4 (2), 1-64
15. ^ DOI: 10.1007/s11940-008-0040-y
16. ^ Dr. Margaret A. Patterson. Effects of Neuro-Electric Therapy (N.E.T.) In Drug Addiction: Interim Report.
Bull Narc. 1976 Oct-Dec;28(4):55-62. PubMed PMID 1087892.
17. ^ Patterson MA. Electrotherapy: addictions and neuroelectric therapy. Nurs Times. 1979 Nov
29;75(48):2080-3. PubMed PMID 316129.
18. ^ Kirsch, D. L. (2002). The science behind cranial electrotherapy stimulation. Edmonton, Alberta: Medical
Scope Publishing

Page 26 of 109
19. ^ doi:10.1300/J184v09n02_02
20. ^ Kirsch, Daniel L., "Science Behind Cranial Electrotherapy Stimulation", 2nd edition, 2002
21. ^ Bystritsky, Alexander, Kerwin, Lauren and Feusner, Jamie. (2008
url=http://www.ncbi.nlm.nih.gov/pubmed/18348596). "A pilot study of cranial electrotherapy stimulation
for generalized anxiety disorder.". Journal of Clinical Psychiatry 69: 412–
417. doi:10.4088/JCP.v69n0311. PMID 18348596.
22. ^ Kirsch, D. & , Smith, R.B. (2000). The use of cranial electrotherapy stimulation in the management of
chronic pain: A review. NeuroRehabilitation, 14, 85-94
23. ^ P. Cevei, M. Cevei and I. Jivet. (2011) Experiments in Electrotherapy for Pain Relief Using a Novel
Modality Concept. IFMBE, Volume 36, Part 2, 164-167. DOI: 10.1007/978-3-642-22586-4_35
24. ^ Winick, Reid L. Cranial electrotherapy stimulation (CES): a safe and effective low cost means of anxiety
control in a dental practice. General Dentistry. 47(1):50-55, 1999.
25. ^ Lichtbroun, A.S., Raicer, M.M.C. and Smith, R.B. The treatment of fibromyalgia with cranial electrotherapy
stimulation. Journal of Clinical Rheumatology. 7(2):72-78, 2001.
26. ^ Weiss, Marc F. The treatment of insomnia through use of electrosleep: an EEG study. Journal of Nervous
and Mental Disease. 157(2):108 120, 1973
27. ^ Matteson M et al. An exploratory investigation of CES as an employee stress management technique.
Journal of Health and Human Resource Administration. 9:93 109, 1986
28. ^ Smith R et al. Electrosleep in the management of alcoholism. Biological Psychiatry. 10(6):675 680, 1975
29. ^ Smith R et al. The use of transcranial electrical stimulation in the treatment of cocaine and/or
polysubstance abuse, 2002
30. ^ FDA medical device classifications
31. ^ Gilula MF, Kirsch DL. (2005). Cranial electrotherapy stimulation review: a safer alternative to
psychopharmaceuticals in the treatment of depression. Journal of Neurotherapy, 9(2), 63-77.
32. ^ Gilula, M.F. & Kirsch, D.L. Cranial Electrotherapy Stimulation Review: A Safer Alternative to
Psychopharmaceuticals in the Treatment of Depression. Journal of Neurotherapy, Vol. 9(2) 2005.
doi:10.1300/J184v09n02_02
33. ^ Zaghi, S. et. al. (2009) Noninvasive Brain Stimulation with Low-Intensity Electrical Currents: Putative
Mechanisms of Action for Direct and Alternating Current Stimulation. The Neuroscientist.December 29,
2009 as doi:10.1177/1073858409336227
34. ^ Kennerly, Richard. QEEG analysis of cranial electrotherapy: a pilot study. Journal of Neurotherapy (8)2,
2004.

Page 27 of 109
http://www.downloads.imune.net/journals/
http://www.downloads.imune.net/medicalbooks/978-615-5169-19-
9%20TVEP%20and%20Medication%20Testing%20(the%20research).pdf
http://www.downloads.imune.net/medicalbooks/TVEP%20The%20Clinical%20Experience%20complete.pdf

Page 28 of 109

Page 29 of 109

Page 30 of 109

Page 31 of 109
Page 32 of 109

Page 33 of 109

Page 34 of 109
Page 35 of 109
TVEP Literature Review and 2014 New
Research
STUDY INFORMATION
SUPERVISING RESEARCHER: Dr. Danis György, MD, Licensed Hungarian Medical Doctor
Written and edited by IMUNE STAFF
PUBLICATION DATE: June 2014
SPONSOR
Mandelay Kft., H-1089 Budapest, Kalvaria ter 2., Hungary, Phone: 36-1-303-6043, Fax: 36-1-210-9340
MONITOR IMUNE (International Medical University of Natural Education)
Abstract: The SCIO device is EC registered to detect the Transcutaneous Voltammetric Evoked Potential (TVEP) of
a patient. Using electrodes placed over the skin (Transcutaneous) measuring volt, amp, resistance and
oscillation changes (Voltammetric) and measuring reactions to stimuli (Evoked Potential) the SCIO
device is registered to do TVEP. In this article a brief review of medical doctor studies published in peer
reviewed medical journals done over a twenty year period in England, Canada, America, Hungary,
Germany, Switzerland, South Africa, Mozambique, France, Japan, Ghana, China, and Romania will
more than validate the TVEP. Studies have shown time tested validity and medical acceptance of the art
of TVEP.
In this study we assay the amount of repeated items in a pre and post Xrroid test of treatment versus
placebo testing. In the placebo group the test is set on subspace only. During our research on patients
we test the pre and post Xrroid test of over 10,000 voltammetric signatures of various items after a
treatment or a placebo treatment. The top reactant items are calculated. In the post test significantly
more repeated items show that the TVEP reactivity is functioning compared to the placebo group.
There have been tens of thousands of therapists confirming the TVEP everyday in the field and
thousands of testimonials. But this paper is just to present the peer reviewed medical papers and the
new 2014 research as proof of the validity of safety and efficacy of the TVEP.
CLINICAL LITTERATURE REVIEW: In 1974 the first TVEP study at Youngstown State University showed a transcutaneous reaction of people
to a photo Evoked Potential. The voltammetric fields were measured with and old fashioned polygraph
device. see Nelson 1974

Page 36 of 109
1985 studies showed an ability to increase TVEP data accuracy with a computer handled data stream.
In 1986 patients in Germany and Finland were measured for TVEP reactions to compounds after the
Chernobyl disaster. This has a strong correlate to the TVEP results in Japan after the recent 2011 crisis.
The electro-physiological reactions to different Voltammetric patterns of nosodes, allerodes, isodes,
sarcodes and other compounds can give us family or trends of reactivity patterns. This was first
registered with the FDA in 1989, had the CE mark in 1996 and a new TVEP CE mark in 2010.

Page 37 of 109
The following medical supervised studies on TVEP electro-physiological reactivity were done to the
letter of the law and past peer review and were published in medical journals.
The first study of these TVEP family patterns were done here in Denver, Colorado in 1983.

Page 38 of 109

Page 39 of 109
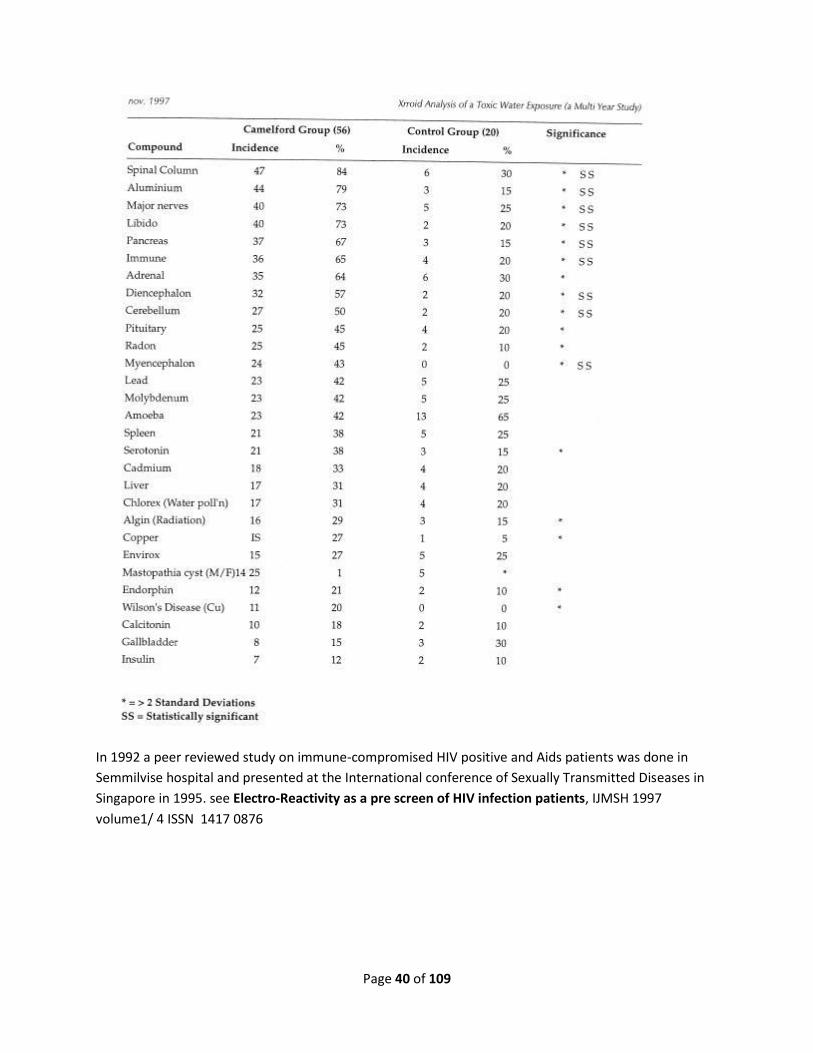
An English study was done in 1990 at the city of a toxic aluminum spill in 1988, Camelford, England.
Here a TVEP reactivity profile was developed testing hundreds of people exposed to excess Aluminum
toxicity. See IJMSH 1997 volume1/ 4 ISSN 1417 0876
Page 40 of 109
In 1992 a peer reviewed study on immune-compromised HIV positive and Aids patients was done in
Semmilvise hospital and presented at the International conference of Sexually Transmitted Diseases in
Singapore in 1995. see Electro-Reactivity as a pre screen of HIV infection patients, IJMSH 1997
volume1/ 4 ISSN 1417 0876

Page 41 of 109
The yearlong study of almost 2,000 patients showed the TVEP as a valuable tool for study.
Title: Electro-Physiological Reactivity Profiles
Supervizing researcher: Dr Istvan Bandics MD Licensed Hungarian Medical doctor. This
study was done at the Hippocampus clinic in Budapest on 1834 patients attending the
clinic in 1994. Studies done with the supervision of a local ethics committee and all
subjects gave informed consent to participate as part of their intake form.
Abstract:
During the course of a one year period the 1834 patients in our clinic were all asked
in their intake form to participate in a study. All patients were treated with the
EPFX device. The types of disease trends these patients presented were evaluated by
one of the medical doctors on staff. The EPR reactivity profile was checked by the
EPFX device. A comparison of the EPR reactivity patterns yielded a Risk probability
profile. The results of this profile are reported here.

Page 42 of 109
At the Szent Janos hospital in 1995 Budapest a TVEP study was done on cataract patients. Both of these
studies proved TVEP reactions patterns to be helpful and significant in detection of disease patterns. see
XRROID reactivity patterns in Cataract patients, IJMSH 1997 volume1/ 4 ISSN 1417 0876
Another study of the Electrical Reactivity of Patients to Nosodes, Allersode, Isodes, and Sarcodes IJMSH
1997 volume1/ 4 ISSN 1417 0876 showed a high correlation of reactivity to clinical diagnosis.

Page 43 of 109

Page 44 of 109
A 2002 several Canadian medical studies showed the Value of the TVEP. This is but one.
QED TVEP Biofeedback, Gut Dysbiosis &
Hypomonocytosis Clinical SOAP Correlation
Study IRB supervision: Under the supervision of Ethics International of Romania acting as the IRB for this study
under rights of International law. This study was commissioned by Ethics International in 2001.
Gut Dysbiosis multidimensional analysis is compared to bioelectric Quantum Electro Dynamic
Biofeedback (QEDBF). QEDBF’s key VARHOPE & Cellular Vitality Index (CVI) indicators are clinically
correlated with subjective clinical context of stress to determine if they reliably mirror conventional of

Page 45 of 109
systemic Hyper or Hypo-Monocytosis, Hyperlipidemia, and Hyperuricemia, or other Immune indexes
that indicate confirmation of the activation of the immune cascade (called the TH2 Induction Stress
Response which leads to lymphoma and autoimmune disease). We intend to determine how and
where QEDBF can be used as a prediagnostic integrated medicine tool to help navigate personalized
health record by providing a safe, reliable and objective non-invasive bioenergetic information
gathering tool.
In particular, the body electric and its bioterrain balance were measured and show ill health may
ensue as a result of low mineral resistance causing abnormally high conductivity. Vitality can be
measured now with QEDBF to indicate states of Low Resistivity, along with reliable detection of low
adrenal Voltage and lymphatic Amperage for drive and willpower, along with indicators of pH
balance, Phase Angle of cellular permeability, Resonance Frequency Pattern to objectify anxiety states
or exhaustion, Reaction Speed to indicate enzymatic response, and other electrical measurements to
indicate Cellular Vitality Index (CVI). The data gathered efficiently and safely by the addition of the
integrated medicine tool QEDBF provided a bird’s eye view at a fraction of the time and conventional
laboratory costs, while successfully mapping many suspected but heretofore hidden stressors and
especially pathogens leading to gut dysbiosis. These repeatable, predictable disease patterns are
reliably detected electrically with QEDBF and hint in advance at the unfolding of chronic illness, which
predictably cause increased morbidity and mortality in middle aged, ambulatory community based
patients seeking stress, pain and relaxation management.
Principal Investigator: Dr. Deborah Anne Drake, BSc, MD, CCFP(EM), FCFP, CQI
Nutritionist Jennifer Hough, Research Nurse Practitioner Joanne Hunter, Research Assistant Darria
Pressey, Statistical Assistant Electrical Engineer Vivian Jones
Location: Health Cirquet Integrated Family Medicine Center, #311- 6633 Hwy 7 East, Markham, Ontario,
Canada, L9L 3P6 905-294-3322. Copyright 2002, 2009 All Rights Reserved.
Abstract: This Gut Dysbiosis study to quantify immune induction, comparing old to new tools like
biocommunication scanners like the QEDBF, is the first study of its kind in Canada to confirm the safety
and efficacy of the Quantum Electro Dynamic Bio- Feedback (QEDBF) using the Electro-physiologic
Feedback Xrroid or EPFX scanner as well as to confirm the recognition of bioterrain disruption. We
map with subjective surveys, compared to conventional and complementary testing methods to map
the lay out of the immune systems, nutrition, toxic load, mood, social stress and other factors like
Candidiasis, parasite overload or celiac disease. We compare the QEDBF findings with the high clinical
suspicion that stressed individuals, as determined by low peripheral white blood cell absolute
Monocyte count, may harbor occult pathogenic infections.
We studied 50 voluntary, ambulatory, community based male and female middle aged patients in
great detail, using 7 health surveys, dozens of conventional and research screening tests in
hematology, biochemistry, autoimmune, specialized brain cerebro-ganglioside markers. We tested a

Page 46 of 109
further 50 subjects with QEDBF for comparison and trends, and further compared 10 randomly
selected subjects to be evaluated with QEDBF testing. The goal is to determine what historical, risk, or
symptoms, signs or lab tests provide the forewarning. It appears through observation that illness and
immune induction are forecast when the bioterrain conditions permit loss of homeostasis. This study
focuses on the correlation of hyper or hypomonocytosis with low Resistivity, (low grounding minerals
from a variety of causes). We correlate stress and exhaustion from biochemical and bioelectric
perspective and attempt to map under close research control, the comparison of conventional and
bioelectric impairments, using bioelectric vectors, called VARHOPE score, Cellular Vitality Index (CVI
and Phase Angle (PA).
Furthermore, we predict the worse the electrical grounding and mineralization, as detected with low
Resistivity scores, the higher the prevalence of subsequent bioterrain shift, and thus colonization of a
change in flora, ultimately culminating in reduced infection resistance, Candidiasis, Fungal and
pathogenic overgrowth, and the resultant induction of the immune cascade which should be
measureable. The worse the homeostasis, we predict the worse the oxygenation, hydration and
nutritional status, digestion and weight. The lower the cellular vitality index (CVI), we predict the
worse the healing speed or increased chance of infection or relapses, leading to higher than normal
rates of Signal Transduction Pathway Immune cascading, leading to chronic illness, and the 4 top
North American Disease Killers – Cardiovascular, Cancerous , Autoimmune diseases and Iatrogenic
death. (This preventable escalating predictable cascade follows the Autoimmune/TNFalpha/Celiac tri-
genes on chromosome 6, triggering the TH2 Signal Transduction Pathway of body defense and stress
response, leading to platelet aggregation, Betaoncogene induced Lymphoma, and Interleukin IL6 & IL8
Inflammatory cytokines and White Blood Cell Neutrophilic degranulation.)
In 2006 a large scale study of over 97,000 patients on almost 300,000 patent visits has further confirmed
the safety and effectiveness of the TVEP study.
970,000+ Study of the
Safety and Efficacy
of the TVEP families in the SCIO Device
Abstract: A global and momentous research project was developed for the last two years. The
SCIO device is a Universal Electro-Physiological device used for stress reduction and patient treatment.
Over 2,200 qualified biofeedback therapists joined our Ethics Committee study to evaluate how stress
reduction using the SCIO device could help a wide variety of diseases.
The device and thus the study has insignificant risk. There was a staff of medical doctors who
designed and supervised the study.

Page 47 of 109
Over 97,000 patients gave informed consent and participated in the study. The study would
conclusively prove safety and efficacy of the SCIO Device. With over 60% of these patients having
multiple visits. There were over 275,000 patient visits. With a total record of the SCIO patient
information, therapy parameters and reactivity data.
Two of the 2,200 plus therapists were given blank devices that were completely visually the same
but were none functional. These two blind therapists were then given 35 patients each. This was to
evaluate the double blind component of the placebo effect as compared to the device. Thus the studied
groups were a placebo group, a subspace group, and an attached harness group.
This is just the first study in a long task of analysis in truly break down the data totally. This
study verifies the safety and efficacy of the SCIO device as well as the validity of the TVEP family
reactivity. There were small effects seen in the placebo group, larger effects in the subspace, and
astounding effects in the real harness group.
Qualified studies are being organized in China after the success the SCIO had in treating and helping the
China Olympic team in 2008.
Project Nahinga in South Africa, Ghana and Mozambique has shown the validity of the TVEP in AIDS
patients.
So now we have reviewed how over 2,300 medical personnel have done clinical tests on over 100,000
patients on well over 300,000 patient visits in over 50 different peer reviewed published medical
studies. And now we will review the current 2011 data.
Introduction:
Method: Now in this study using the clinical protocol we would like to develop and test TVEP patterns for allergy,
organic disease, and infection. By finding patient with medical diagnosis or qualified opinion of a disease
we will test the patient and compare his TVEP results to others with the same disease versus the control
groups we have from other studies.
The hypothesis is that TVEP patterns can be used to help in pre-diagnostic ways to help us to understand
patients better.

Page 48 of 109
Repeatability DATA:
Romania:
TOTAL TREATMENT SUBJECTS: 72 - Total repeating items: 5154
Average: 71.16 repeating items per patient
Total Placebo subjects 32: Total repeating items: 1076
Average: 33.62 repeating items per patient
USA:
TOTAL TREATMENT SUBJECTS: 64 - TOTAL REPEATING ITEMS: 4748
AVERAGE: 74.18
Total Placebo subjects 24. Total repeating items: 810
AVERAGE: 33.75
HUNGARY:
TOTAL TREATMENT Subjects: 28 Total repeating items: 2176
Average: 77.7 repeating items per patient
Total Placebo Subjects: 24 Total repeating items: 5874
Average: 24.45 repeating items per patient
____________________________________________________
Subjects total= 244
Treatment subjects= 164 Average repeated items= 73.2
Placebo subjects= 80 Average repeated Items= 30.2

Page 49 of 109
Conclusions of Repeatable Validity: The odds of a single item being at the top of the reactivity score is about one in ten thousand. The odds
of it repeating at the top are thus one in ten million. The odds of an item being in the top three standard
deviations from the mean are about one in 2000. Repeating in the top 3 standard deviations the odds
are about one in 4000. Chance would dictate the odds of repeating items to reoccur at about 10 items in
two tests.
In our subspace Placebo test the system uses a prayer wheel variation of the I-Ching and we see over 33
items reoccurring during Placebo tests. In the placebo test the QQC TVEP treatment is off.
In our treatment group there was over 70 items consistently repeating which shows a dramatic scientific
significance of the TVEP validity. Thus our TVEP function has validity. But what of the choices? Are the
choices relevant to the disease risk state? Let’s compare the old research with our new data.
Family TVEP Data 2011 study: Stress- Of the 244 2011 subjects so far tested Nine five showed stress. 15 of these were in the Placebo
group. The placebo group showed no similarities of reactivity but the TVEP treatment group showed
consistency of these items on SPSS review.
1. 630 ANTI-STRESS (NV) I Combo remedy for excess stress improves the effects of stress about 15% to 20%. , 2. 799 STRESS FORMULA I Supplies nutrients depleted by stress. 3. 955 EU-STRESS (DR) I Combo remedy to help deal with stress. 4. 1024 KIDNEY, OVARIAN, ADRENAL (DR) I Sarcode remedy for tissue rebuilding and detox. ], 1025 KIDNEY, PROSTATE,
ADRENAL (DR) I Sarcode remedy for tissue rebuilding and detox. 5. 710 FATTY ACID LIQUESCENCE (NV) I Combo remedy supplying the most chronic nutritional deficiency.],
Brain Fatigue- 12 of the treatment group reported having Brain fatigue. They had 80% reaction to these
items on SPSS analysis.
1. 940 PULMO LIQUITROPHIC (DR) | Combo remedy to assist in lung repair.
2. 937 OXY LIQUITROPHIC (DR) | Combo remedy for oxygenation and energizing aid.
3. 701 ADRENAL LIQUESCENCE (NV) I Combo remedy for hypo-adrenia or to provide adrenal stimulation.
4. 670 MEMORY (NV) | Combo remedy for any memory (brain) disorder, stimulate oxygen, increase attention.
Pain- Ten patients reported pain in the 2011 tests. They had 80% reaction to these items on SPSS
analysis.
1. 2810 POLYNEURITIS | Multiple neurological inflammations or nerve compressions.,
2. 920 B LIQUITROPHIC (DR) | Combo remedy supplying vitamin Bs, mental depression, pellagra.
3. (431 L-PHENYLALANINE | Amino acid used for pain control.
4. 743 MAJOR NERVES (NV) | Combo remedy for all nervous diseases, ids neurological
involvement.

Page 50 of 109
Digestive- Twelve patients reported digestion disturbance. They had 80% reaction to these items on
SPSS analysis.
1. 641 DIGESTIVE ENZYME (NV) | Combo remedy for stabilizing digestive organs, ids indigestion.
2. 709 DIGESTIVE ENZYME LIQUESCENCE (NV) | Combo remedy for stabilizing the digestive system.
3. 785 DIGESTIVE GLANDULAR, GENERAL | For anti inflammation enzyme and cancer therapy, use
at bed, on empty stomach.
4. 939 PROPEPSIA LIQUITROPHIC (DR) | Combo remedy to stimulate and balance digestive enzyme
release.
Connective Tissue injury - There was 5 cases of connective tissue injury reported in the treatment
group. They had 80% reaction to these items on SPSS analysis.
1. 376 FLEX-ABILITY (SHUJIN, CHIH) | Herb to increase flexiblility. 2. 594 Cervical nosode and sarcode of all tissues and diseases of the neck or cervical vertebrae. nerve disorder 3. 595 CONNECTIVE TISSUE | Sarcode of connective tissue, ids fault 4. 648 FLEX (NV) | Combo remedy for promoting flexibility of joints and muscles. 5. 707 CONNECTIVE TISSUE LIQUESCENCE (NV) | Combo remedy for connective tissue disease, helps repair tissue.,
AIDS- There were 3 AIDS patients tested in 2011. They had 80% reaction to these items on SPSS
analysis.
1. 928 HEMO-A LIQUITROPHIC (DR) | Combo remedy to assist in blood (hemoglobin) auto-immune disorders.
2. (937 OXY LIQUITROPHIC (DR) | Combo remedy for oxygenation and energizing aid.
3. 714 HERBAL LIQUID BEE POLLEN LIQUESCENCE (NV) | Combo remedy for increasing oxidation.
Cataracts- There were 3 patients with cataracts treated with the TVEP and pre and post measures.
They had 80% reaction to these items on SPSS analysis.
1. sucrose
2. aspartame
3. glucose
4. cataract nosode
Infections- There were 5 reported cases of infections reported They had 80% reaction to these items
on SPSS analysis.
1. 606 BAC (NV) | Combo remedy for bacterial immune stimulation.
2. 726 THYMUS LIQUESCENCE (NV) | Combo remedy for stimulating thymus and immune function.
3. 903 BACTERIA FUGE (DR) | Combo remedy for bacterial immune stimulation.
4. 1760 ACIDOPHILUS | Bowel (colon, intestine) flora bacteria, can id flora imbalance, good food.
Page 51 of 109
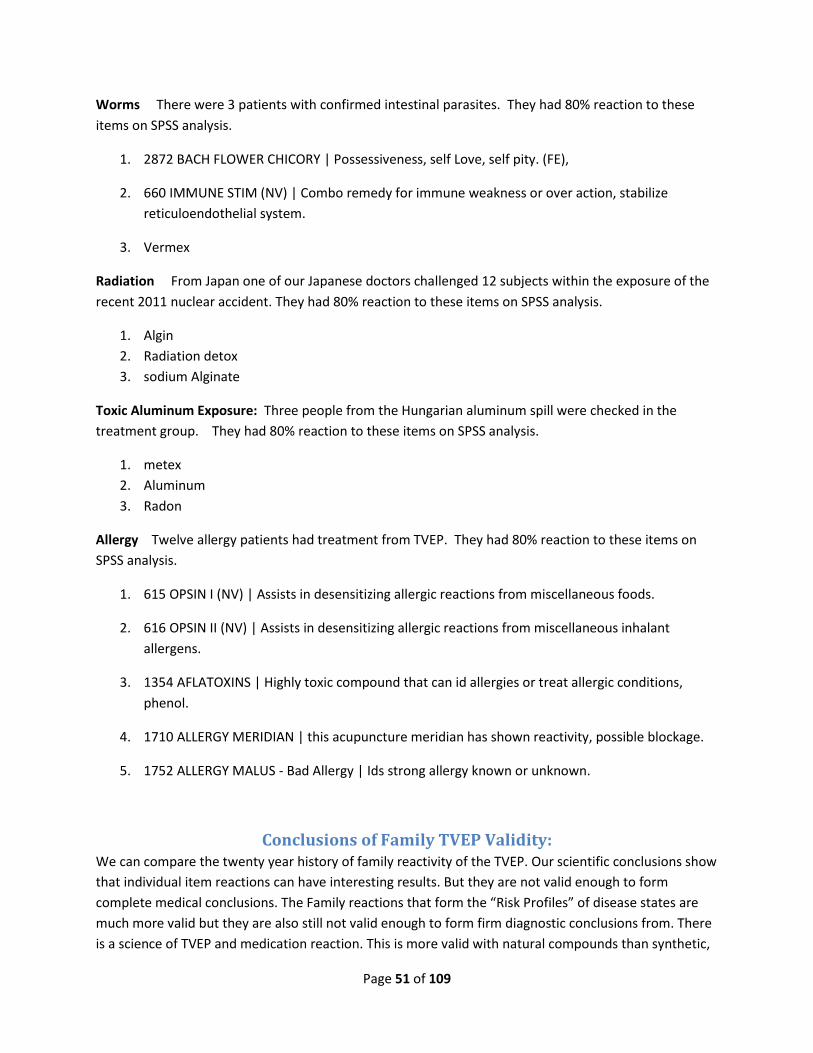
Worms There were 3 patients with confirmed intestinal parasites. They had 80% reaction to these
items on SPSS analysis.
1. 2872 BACH FLOWER CHICORY | Possessiveness, self Love, self pity. (FE),
2. 660 IMMUNE STIM (NV) | Combo remedy for immune weakness or over action, stabilize
reticuloendothelial system.
3. Vermex
Radiation From Japan one of our Japanese doctors challenged 12 subjects within the exposure of the
recent 2011 nuclear accident. They had 80% reaction to these items on SPSS analysis.
1. Algin
2. Radiation detox
3. sodium Alginate
Toxic Aluminum Exposure: Three people from the Hungarian aluminum spill were checked in the
treatment group. They had 80% reaction to these items on SPSS analysis.
1. metex
2. Aluminum
3. Radon
Allergy Twelve allergy patients had treatment from TVEP. They had 80% reaction to these items on
SPSS analysis.
1. 615 OPSIN I (NV) | Assists in desensitizing allergic reactions from miscellaneous foods.
2. 616 OPSIN II (NV) | Assists in desensitizing allergic reactions from miscellaneous inhalant
allergens.
3. 1354 AFLATOXINS | Highly toxic compound that can id allergies or treat allergic conditions,
phenol.
4. 1710 ALLERGY MERIDIAN | this acupuncture meridian has shown reactivity, possible blockage.
5. 1752 ALLERGY MALUS - Bad Allergy | Ids strong allergy known or unknown.
Conclusions of Family TVEP Validity: We can compare the twenty year history of family reactivity of the TVEP. Our scientific conclusions show
that individual item reactions can have interesting results. But they are not valid enough to form
complete medical conclusions. The Family reactions that form the “Risk Profiles” of disease states are
much more valid but they are also still not valid enough to form firm diagnostic conclusions from. There
is a science of TVEP and medication reaction. This is more valid with natural compounds than synthetic,
Page 52 of 109
making this hard for medical people who live by using synthetic drugs to replicate or even understand.
This science is still in its infancy after almost twenty years. A full disclaimer of the questionable Xrroid
results and probable risk profile results must be used and made aware to all users. These constitute
probabilities and can turn the doctor to deeper more refined medical techniques. The TVEP is of pre-
diagnostic interest only.

Page 53 of 109

Page 54 of 109
Page 55 of 109

Page 56 of 109
Notice the reference to TRANSDERMAL reactivity, meaning skin resistance.
Spatial Acuity and Prey Detection in Weakly
Electric Fish David Babineau1, John E. Lewis2,3HYPERLINK "http://www.ploscompbiol.org/article/info:doi%2F10.1371%2Fjournal.pcbi.0030038" \l "cor1"*, André Longtin1,3 1 Department of Physics, University of Ottawa, Ottawa, Ontario, Canada, 2 Department of Biology, University of Ottawa, Ottawa, Ontario, Canada, 3 Center for Neural Dynamics, University of Ottawa, Ottawa, Ontario, Canada Abstract It is well-known that weakly electric fish can exhibit extreme temporal acuity at the behavioral level, discriminating time intervals in the submicrosecond range. However, relatively little is known about the spatial acuity of the electrosense. Here we use a recently developed model of the electric field generated by Apteronotus leptorhynchus to study spatial acuity and small signal extraction. We show that the quality of sensory information available on the lateral body surface is highest for objects close to the fish's midbody, suggesting that spatial acuity should be highest at this location. Overall, however, this information is relatively blurry and the electrosense exhibits relatively poor acuity. Despite this apparent limitation, weakly electric fish are able to extract the minute signals generated by small prey, even in the presence of large background signals. In fact, we show that the fish's poor spatial acuity may actually enhance prey detection under some conditions. This occurs because the electric image produced by a spatially dense background is relatively “blurred” or spatially uniform. Hence, the small spatially localized prey signal “pops out” when fish motion is simulated. This shows explicitly how the back-and-forth swimming, characteristic of these fish, can be used to generate motion cues that, as in other animals, assist in the extraction of sensory information when signal-to-noise ratios are low. Our study also reveals the importance of the structure of complex electrosensory backgrounds. Whereas large-object spacing is favorable for discriminating the individual elements of a scene, small spacing can increase the fish's ability to resolve a single target object against this background. Author Summary Extracting and characterizing small signals in a noisy background is a universal problem in sensory processing. In human audition, this is referred to as the cocktail party problem. Weakly electric knifefish face a similar difficulty. Objects in their environment produce distortions in a self-generated electric field that are used for navigation and prey capture in the dark. While we know prey signals are small (microvolt range), and other environmental signals can be many times larger, we know very little about prey detection in a natural electrosensory landscape. To better understand this problem, we present an analysis of small object discrimination and detection using a recently developed model of the fish's electric field. We show that the electric sense is extremely blurry: two prey must be about five diameters apart to produce distinct signals. But this blurriness can be an asset when prey must be detected in a background of large distracters. We show that the commonly observed “knife-like” scanning behaviour of these fish causes a prey signal to “pop-out” from the blurry background signal. Our study is the first to our knowledge to describe specific motion-generated electrosensory cues, and it provides a novel example of how self-motion can be used to enhance sensory processing. Citation: Babineau D, Lewis JE, Longtin A (2007) Spatial Acuity and Prey Detection in Weakly Electric Fish.

Page 57 of 109
PLoS Comput Biol 3(3): e38. doi:10.1371/journal.pcbi.0030038 Editor: Karl J. Friston, University College London, United Kingdom Received: Janust 24, 2006; Accepted: January 4, 2007; Published: March 2, 2007 Copyright: © 2007 Babineau et al. This is an open-access article distributed under the terms of the Creative Commons Attribution License, which permits unrestricted use, distribution, and reproduction in any medium, provided the original author and source are credited. Funding: This research was funded by grants from the Natural Sciences and Engineering Research Council of Canada to AL and JEL and a CFI/OIT New Opportunities Award to JEL. Competing interests: The authors have declared that no competing interests exist. Abbreviations: ELL, electrosensory lateral line lobe; EO, electric organ; SNR, signal-to-noise ratio * To whom correspondence should be addressed. E-mail: [email protected] Introduction Weakly electric fish are commonly found in the freshwater systems of South America and Africa [1,2]. These nocturnal fish use a unique sensory modality, called the “electrosense,” to help them navigate, communicate, and find prey in the absence of strong visual cues [3]. The electrosense involves a specialized electric organ that emits an electric discharge resulting in a dipole-like electric field in the surrounding water [4]. The transdermal potential (the so-called “electric image”) is continuously monitored via electroreceptors found in the skin layer. Changes in the spatial properties of the electric image can provide cues that help the fish determine the location, size, and electrical properties of nearby objects [5–10]. Recent studies have shed new light on the weakly electric fish's perceptual world. In the context of distance perception, the amplitude and width of an electric image were shown to be analogous to visual contrast and blur [11]. The electric image produced by an object can also be distorted by nearby objects; consequently, conductive objects can act as electrosensory “mirrors” [12]. In contrast with the visual sense, however, the electrosense has no focusing mechanism and is limited to the near-field, so it is generally considered a “rough” sensory modality [13–16]. In fact, the range of active electrolocation in weakly electric fish is likely only about one body length [7], and considerably less for small prey-like objects [17]. Within this range, much is known about the fish's temporal acuity [18,19], but relatively little is known about the fish's ability to resolve multiple nearby objects. Here, we consider the notion of “electro-acuity,” analogous to the notion of visual acuity found in the visuo–sensory lexicon, to investigate the quality of electrosensory information in the spatial domain. A common measure of acuity in other sensory systems is the just-noticeable difference, or the minimum difference between two stimuli such that they are perceptually distinct [20]. In the present context, we consider an analogous measure to describe the quality of electrosensory input available for a discrimination task. We define this measure as the minimum spatial separation of two objects (Smin), such that two distinct peaks remain in the electric image on the fish's skin (Figure 1). Using a 2-D finite element method model of A. leptorhynchus' electric field [9], we show that Smin is smallest in the fish's midbody and decreases for objects placed farther away from the fish. This suggests an interesting contrast with the “electrosensory fovea” in the head region [10,17], where the highest density of electroreceptors is found [21]. Overall, we found that electroacuity is poor relative to visual acuity in humans, but is comparable with that of the human somatosensory system.

Page 58 of 109
Figure 1. Electric Images Produced by Two Prey-Like Objects and Determination of Smin The head is at position 0 m along the rostro–caudal axis. The midbody is at 0.11 m, and the tail is at 0.21 m. All interobject distances are center-to-center, and object-to-fish lateral distances (i.e., perpendicular to fish midline) are from object center to skin surface. (A) Electric field potential in the presence of two identical prey-like objects (modeled as 0.3-cm diameter discs with a conductivity of 0.0303 S/m; water conductivity: 0.023 S/m). Objects do not affect the field much due to their small size and conductivity similar to the water. The Smin (14 mm) is also shown for a specific prey position (left prey located 0.11 m caudally from the tip of the head and 0.012 m laterally to the skin). The potential at different points is measured with respect to a reference electrode placed laterally to the fish in the far field, near the zero potential line [9]. (B) Overlays of electric images for three different object locations illustrating the increase in image amplitude in the caudal direction (x) and the decrease in amplitude for increasing lateral distances (y). (x,y) = (0.05, 0.03), (0.05, 0.015), (0.1, 0.015) m. As described in Materials and Methods, these images

Page 59 of 109
are computed as the difference between the transdermal potentials measured with and without the object present. (C) Overlays of electric images for three distinct interprey distances (see inset). Blue trace shows Smin, when the two peaks in the electric image are just noticeable. Computation of the images is as in (B). Location of more-rostral prey as in (A). doi:10.1371/journal.pcbi.0030038.g001 Despite the apparent low quality of electrosensory signals, weakly electric fish are able to detect small prey [7,17]. Although there is no direct evidence, it is reasonable to assume that they do so even in the presence of noisy background signals [7]. In a related task (object tracking), background noise has been shown to degrade performance [22,23]. Single-cell recordings in midbrain neurons have further revealed that some low-frequency background signals can interfere with directional selectivity [24]. It is thus believed that some of the natural behaviors exhibited by the fish play a central role in signal extraction. In particular, simulations have suggested that tail-bending could improve object detection by increasing the electric image's amplitude [13,14]. It has also been suggested that the back-and-forth swimming, or scanning motion, observed in these fish could be used to generate specific electrolocation cues [25–28], although this has not yet been demonstrated. Indeed, to elucidate the nature of these motion-related cues, we have simulated this scanning motion and show that, under some conditions, this behavior could assist in extracting small prey-like signals from large background ones. We show that the component of the electric image produced by a sufficiently dense background does not change during scanning, whereas the one produced by the prey object, albeit miniscule in comparison, does. This process is similar to motion-related cues and active sensing techniques seen in other contexts [28,29]. Results In the following analyses, we use our previously described finite-element model of the electric field produced by A. leptorhynchus (see Materials and Methods and [9,30]).Figure 1A shows the simulated dipole-like potential map for this fish in the presence of two prey-like objects. Such objects do not greatly perturb the fish's natural field due to their small size and conductivity (which is similar to that of the water). Figure 1B shows overlays of electric images due to single objects at different locations (i.e., each image is computed separately). Such images show characteristic shapes but vary systematically in amplitude and width with rostral–caudal and lateral location [5,9,10]. Figure 1C shows images produced by object pairs for three different interobject distances (shown in inset). Prey-like objects that are located too close together (green trace) produce a single peak in the electric image (similar to the images in Figure 1B), while objects separated by a larger distance produce two distinct peaks (red trace). The blue trace illustrates the electric image in which two peaks are just barely distinguishable; we define the associated interobject distance as Smin. Thus, Smin, measured in these noiseless conditions, delineates a limit to electroacuity. A smaller Smin suggests better electroacuity (i.e., increased spatial resolution). For this specific prey-like object and rostro–caudal location, the Smin is 14 mm. This suggests that, at this lateral distance, these two objects must be separated by at least 14 mm, a distance approximately five times their diameter, to be distinguished. Electroacuity varies for different lateral and rostro–caudal object locations (Figure 2, see insets). Figure 2A and 2C shows the effects of object size and conductivity, respectively, on electroacuity for different lateral positions (rostro–caudal position fixed near the fish's midpoint, 0.11 m). Smin increases (electroacuity decreases) for objects that are placed farther away from the fish, regardless of object size or conductivity. When objects are far from the fish, Smin is roughly independent of object size (Figure 2A). At the closest location possible for the largest object (blue curve), Smin is smaller than for the other object sizes. This is a consequence of the relative sharpening of the image for close large objects (see Figure 1B). The sharpness of an image can be quantified by the reciprocal of its normalized width (width divided by amplitude). Image sharpness decreases (normalized width increases) with lateral distance

Page 60 of 109
and, in general, is independent of object size [5]. However, object size becomes a factor for locations close to the skin (see largest object in Figure 2A and 2B), as larger objects produce relatively sharper images in these cases [9]. Note also that there is a slight inflection at a lateral distance of 0.016 m (Figure 2A and 2C) due to the spatial heterogeneity of the electric field (higher density of field lines near the zero potential line, which curves rostrally as seen in Figure 1A).
Figure 2. Effect of Object Location and Conductivity on Spatial Electroacuity In all panels, see fish insets for approximate lateral and rostro–caudal locations where Smin was calculated. Error bars represent the sampling that was used to calculate the Smin (either 0.5 or 1 mm). Lateral distance is measured as object center to fish skin (as in Figure 1). (A) Effect of lateral distance on Smin for three distinct object diameters (rostro–caudal location, x = 0.11 m). Red, 0.3 cm (prey size); green, 1 cm; blue, 2 cm. Object conductivity fixed at 0.0303 S/m (prey conductivity). (B) Effect of rostro–caudal position on Smin for same object sizes and conductivity as (A), with a lateral distance of 0.012 m. (C) Effect of lateral distance on Smin for three distinct object conductivities (rostro–caudal location, x = 0.11m). Red, 0.0005 S/m (plant conductivity); green, 0.0303 S/m (prey conductivity); blue, 0.5 S/m. Object diameters fixed at 0.3 cm (prey size). (D) Effect of rostro–caudal position on Smin for same object diameter and conductivities as in (C), with a

Page 61 of 109
lateral distance of 0.012 m. doi:10.1371/journal.pcbi.0030038.g002 Figure 2B and 2D shows the effects of object size and conductivity, respectively, on electroacuity for different rostro–caudal positions (lateral object center-to-skin distance fixed at 0.012 m). In general, Smin is smaller for larger objects, all along the length of the fish. The largest objects (2 cm) can actually be distinguished in the artificial condition of overlapping (i.e., the two objects are fused into a single composite peanut-shaped object), suggesting a mechanism for shape discrimination under some conditions. The position x = 0.11 m suggests a point of optimal acuity along the side of the fish. The two peaks in the image can be distinguished more easily for objects in this region because this is the rostro–caudal location where electric images are sharpest [9,10], so that there is minimal interaction between the individual images produced by each object. Object conductivity has comparatively little effect on the Smin in both lateral and rostro–caudal directions (Figure 2C and 2D). Overall, Smin varies much more in the lateral direction than in the rostro–caudal direction (compare Figure 2A–2C and 2B–2D) due to the relatively large changes in image sharpness as lateral object distance increases [5,8]. The effect of water conductivity on electroacuity was also studied for a specific location (x = 0.11 m, y = 0.015 m). For the range of water conductivity values found in the rivers in which A. leptorhynchus live (between 0.00085 and 0.01135 S/m [2]), Smin changes only slightly. As an overall trend, Smin decreased as water conductivity diminished (from 15.5 to 12.5 mm as water conductivity decreased from 0.05 to 0.0005 S/m). As a first step toward understanding electroacuity in a more natural context, the electric images produced by differently sized arrays of background objects (with “plant-like” conductivity) were studied systematically. In Figure 3A, the red trace shows the electric image produced by a single such object located 0.11 m caudally from the tip of the fish's head (red object in inset located close to the fish's midpoint). The orange trace shows the electric image produced by three objects: the central one (red) plus one (orange) added 0.03 m on each side. In a similar progression, electric images are shown for up to 11 objects. With larger numbers of aligned objects, the electric images converge. Thus, for an array of seven objects (approximately a fish body length), the image is almost the same as with 11 objects. The electric images are each marked by a singular peak because the interobject distance is too small (at this lateral distance of 0.05 m) to resolve different peaks, i.e., object separation is less than Smin. The small bumps at approximately 0.03 m and 0.2 m are due to abrupt changes in fish geometry near the head and tail, respectively, and are not due to individual objects within the background array. Similar results were also observed for object arrays positioned closer to the fish, where different peaks were observed in the electric image, as well as for solid bars of increasing widths (unpublished data). Figure 3B shows the effect of changing the object spacing in similar arrays. At the largest spacing (red), the image is dominated by the contribution from the central object. For arrays that are more spatially dense (green, blue), the contributions of individual objects are blurred, resulting in an image with a broad peak.
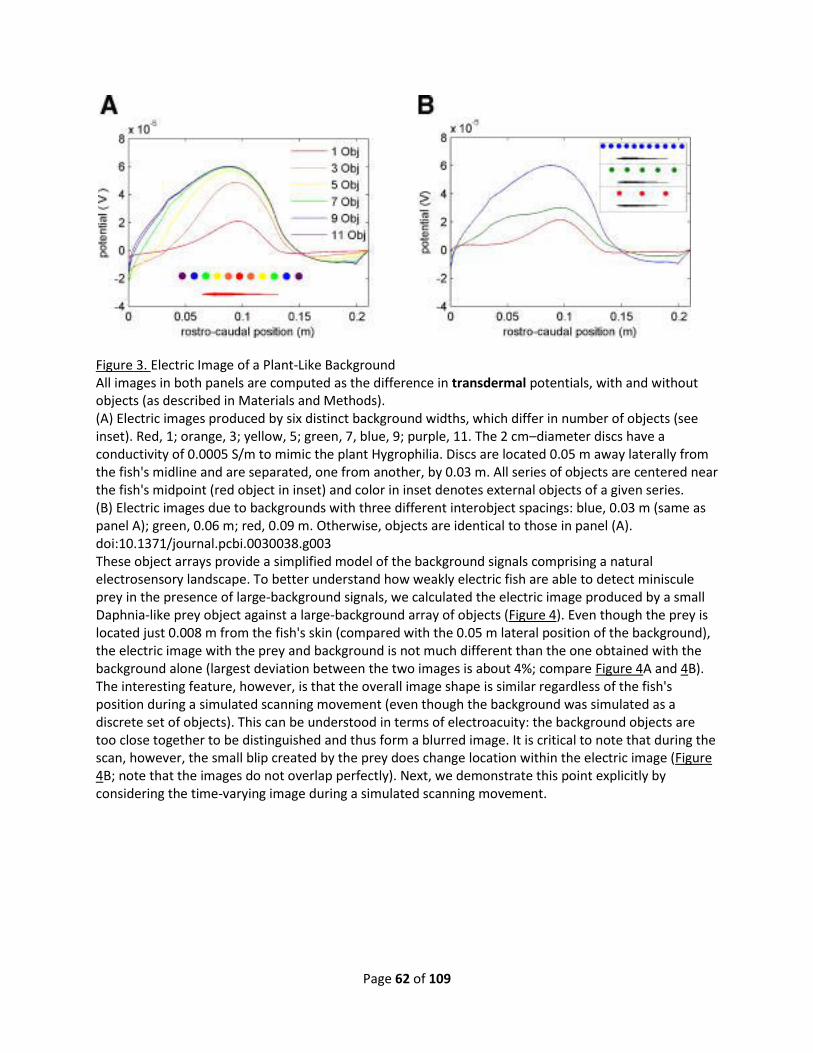
Page 62 of 109
Figure 3. Electric Image of a Plant-Like Background All images in both panels are computed as the difference in transdermal potentials, with and without objects (as described in Materials and Methods). (A) Electric images produced by six distinct background widths, which differ in number of objects (see inset). Red, 1; orange, 3; yellow, 5; green, 7, blue, 9; purple, 11. The 2 cm–diameter discs have a conductivity of 0.0005 S/m to mimic the plant Hygrophilia. Discs are located 0.05 m away laterally from the fish's midline and are separated, one from another, by 0.03 m. All series of objects are centered near the fish's midpoint (red object in inset) and color in inset denotes external objects of a given series. (B) Electric images due to backgrounds with three different interobject spacings: blue, 0.03 m (same as panel A); green, 0.06 m; red, 0.09 m. Otherwise, objects are identical to those in panel (A). doi:10.1371/journal.pcbi.0030038.g003 These object arrays provide a simplified model of the background signals comprising a natural electrosensory landscape. To better understand how weakly electric fish are able to detect miniscule prey in the presence of large-background signals, we calculated the electric image produced by a small Daphnia-like prey object against a large-background array of objects (Figure 4). Even though the prey is located just 0.008 m from the fish's skin (compared with the 0.05 m lateral position of the background), the electric image with the prey and background is not much different than the one obtained with the background alone (largest deviation between the two images is about 4%; compare Figure 4A and 4B). The interesting feature, however, is that the overall image shape is similar regardless of the fish's position during a simulated scanning movement (even though the background was simulated as a discrete set of objects). This can be understood in terms of electroacuity: the background objects are too close together to be distinguished and thus form a blurred image. It is critical to note that during the scan, however, the small blip created by the prey does change location within the electric image (Figure 4B; note that the images do not overlap perfectly). Next, we demonstrate this point explicitly by considering the time-varying image during a simulated scanning movement.
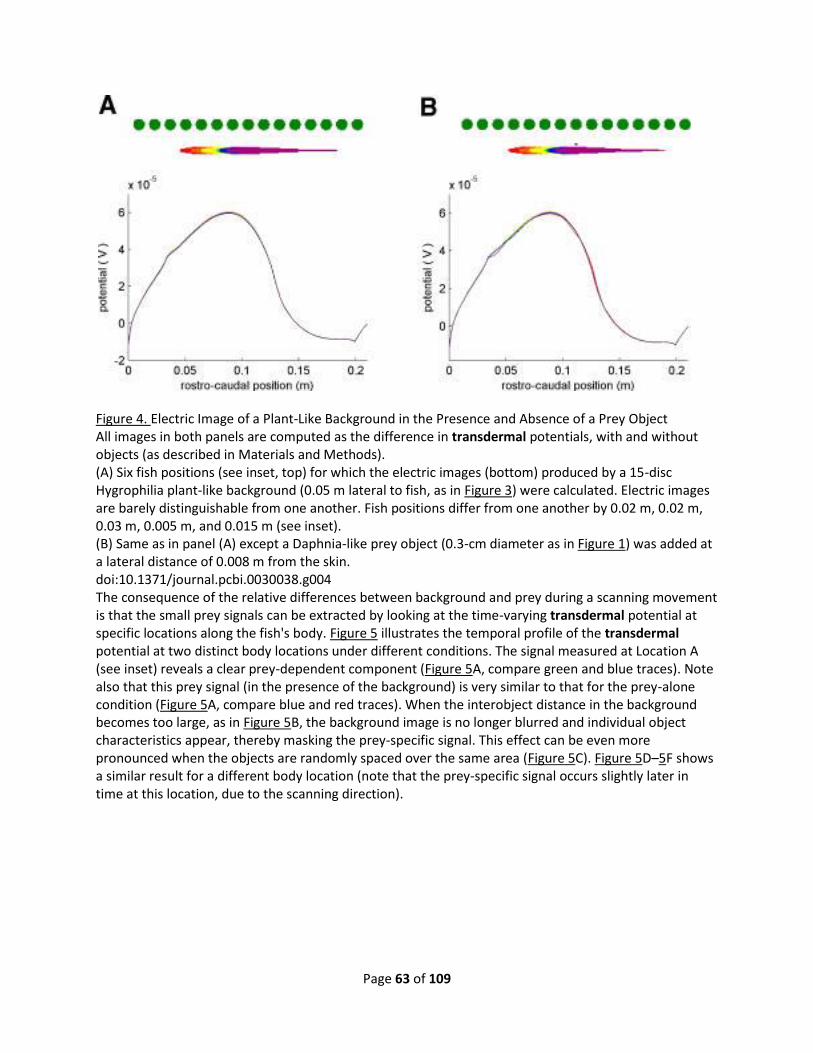
Page 63 of 109
Figure 4. Electric Image of a Plant-Like Background in the Presence and Absence of a Prey Object All images in both panels are computed as the difference in transdermal potentials, with and without objects (as described in Materials and Methods). (A) Six fish positions (see inset, top) for which the electric images (bottom) produced by a 15-disc Hygrophilia plant-like background (0.05 m lateral to fish, as in Figure 3) were calculated. Electric images are barely distinguishable from one another. Fish positions differ from one another by 0.02 m, 0.02 m, 0.03 m, 0.005 m, and 0.015 m (see inset). (B) Same as in panel (A) except a Daphnia-like prey object (0.3-cm diameter as in Figure 1) was added at a lateral distance of 0.008 m from the skin. doi:10.1371/journal.pcbi.0030038.g004 The consequence of the relative differences between background and prey during a scanning movement is that the small prey signals can be extracted by looking at the time-varying transdermal potential at specific locations along the fish's body. Figure 5 illustrates the temporal profile of the transdermal potential at two distinct body locations under different conditions. The signal measured at Location A (see inset) reveals a clear prey-dependent component (Figure 5A, compare green and blue traces). Note also that this prey signal (in the presence of the background) is very similar to that for the prey-alone condition (Figure 5A, compare blue and red traces). When the interobject distance in the background becomes too large, as in Figure 5B, the background image is no longer blurred and individual object characteristics appear, thereby masking the prey-specific signal. This effect can be even more pronounced when the objects are randomly spaced over the same area (Figure 5C). Figure 5D–5F shows a similar result for a different body location (note that the prey-specific signal occurs slightly later in time at this location, due to the scanning direction).

Page 64 of 109
Figure 5. Transdermal Potential at Two Distinct Points on the Fish's Body During Simulated Motion To calculate each image, 21 different fish positions were used. In all cases, images are the raw transdermal potential with the mean removed to more easily compare the different curves. Black arrow shows direction of the simulated scanning motion used to generate the time series shown, with a scanning speed of 0.1 m/s. The legend in (A) applies to all panels. (A) Transdermal potential at a skin location 0.11 m caudal from the tip of the fish's head (point A in inset) for three different conditions: background alone (green), the background and prey (blue), and prey alone (red). Background objects are as in Figures 3 and 4. The spacing between the individual objects in the background is 0.03 m; the lateral distance of the background is 0.05 m from the midline. The lateral distance of the prey object (as in Figure 4) is 0.008 m. (B) Same as in panel (A) except for a larger interobject spacing (0.06 m) in the background. (C) Same as in panel (A) except that the background objects are randomly spaced, as shown by the inset, with same mean spacing as (B). (D–F) Same as the upper panels (A–C, respectively) except that the transdermal potential is shown for a skin position 0.085 m caudal from the tip of the fish's head (point B in inset). doi:10.1371/journal.pcbi.0030038.g005 Figure 5A and 5B suggests that as the objects within the background are increasingly separated, the prey will be less distinguishable. We confirm these observations in terms of a signal-to-noise ratio (SNR) of prey signal versus background (see Materials and Methods). The SNR decreases with increasing interobject separation in the background (Figure 6; left axis, blue trace). For reference, we can compare this situation with the expected discriminability of two individual objects (see Materials and Methods),
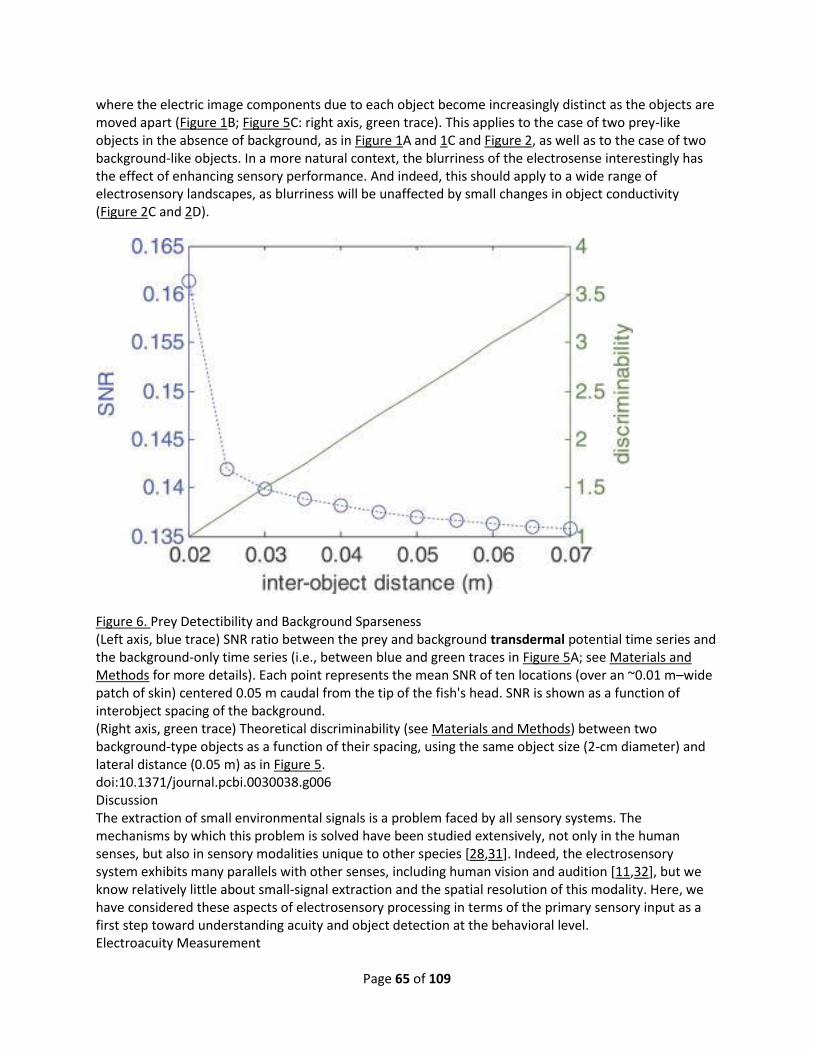
Page 65 of 109
where the electric image components due to each object become increasingly distinct as the objects are moved apart (Figure 1B; Figure 5C: right axis, green trace). This applies to the case of two prey-like objects in the absence of background, as in Figure 1A and 1C and Figure 2, as well as to the case of two background-like objects. In a more natural context, the blurriness of the electrosense interestingly has the effect of enhancing sensory performance. And indeed, this should apply to a wide range of electrosensory landscapes, as blurriness will be unaffected by small changes in object conductivity (Figure 2C and 2D).
Figure 6. Prey Detectibility and Background Sparseness (Left axis, blue trace) SNR ratio between the prey and background transdermal potential time series and the background-only time series (i.e., between blue and green traces in Figure 5A; see Materials and Methods for more details). Each point represents the mean SNR of ten locations (over an ~0.01 m–wide patch of skin) centered 0.05 m caudal from the tip of the fish's head. SNR is shown as a function of interobject spacing of the background. (Right axis, green trace) Theoretical discriminability (see Materials and Methods) between two background-type objects as a function of their spacing, using the same object size (2-cm diameter) and lateral distance (0.05 m) as in Figure 5. doi:10.1371/journal.pcbi.0030038.g006 Discussion The extraction of small environmental signals is a problem faced by all sensory systems. The mechanisms by which this problem is solved have been studied extensively, not only in the human senses, but also in sensory modalities unique to other species [28,31]. Indeed, the electrosensory system exhibits many parallels with other senses, including human vision and audition [11,32], but we know relatively little about small-signal extraction and the spatial resolution of this modality. Here, we have considered these aspects of electrosensory processing in terms of the primary sensory input as a first step toward understanding acuity and object detection at the behavioral level. Electroacuity Measurement

Page 66 of 109
Many recent studies have contributed to our understanding of electrosensory scene analysis [9,26,27,33,34]. In particular, Rother et al. [12] have shown that the electric image due to two objects is the result of complex interactions between the effects of each object. To extend these studies in the context of object discrimination, we have introduced the notion of electroacuity. This measure, comparable to the notion of visual acuity, has helped us quantify the “sharpness” of the electrosense in the spatial domain. Studies have suggested that this was a rather “rough” sensory modality [7,14], and our findings, in terms of the sensory input, confirm this quantitatively. For example, we found that two prey-like objects located within the range of natural prey detection (which is typically less than 20 mm, [17]), must be separated by 9 mm for the electric image to show features of both objects (Figure 2). We characterize this limit by the quantity Smin, analogous to the psychophysical notion of the just noticeable difference and the Rayleigh criterion in optics (see Materials and Methods). Electroacuity is much lower than human visual acuity [35]. In contrast, the electrosense fares much better when compared with tactile two-point discrimination in humans, where thresholds are as high as 50 mm in some body locations [36,37]. The magnitude of Smin will increase with the disparity in both the image amplitudes and widths for the two objects. It will also be influenced by nonlinear effects between image amplitude and image width for close pairs of objects (which our simulations implicitly capture), but we have not systematically investigated them here (but see [12]). That said, to a reasonable approximation, Smin is proportional to the normalized width of the image due to each of the objects (see Materials and Methods). Figure 2B shows that for locations in the rostral half of the fish, Smin changes relatively little. This interesting feature is primarily due to the uniformity of the field in this range: the current lines are nearly perpendicular to the fish body axis. The field uniformity is a result of the spatial filtering effects (smoothing) due to the tapered body shape [9,10,38]. This means that the spatial extent of an object's influence on this field (image sharpness) will be relatively constant. For locations closer to the midbody, the field lines are more concentrated (i.e., the field is not as uniform as for more rostral locations), so the influence of the object is more focused. The image amplitude also increases in this range of body locations (Figure 1B; Figure 5 of [9]), further contributing to a sharper image. However, as outlined in detail in Materials and Methods, although the image amplitude increases, then decreases, in the rostro-to-caudal direction [9], Smin is determined by image sharpness (normalized image width) and is much less sensitive to absolute amplitude (Figure 2B, compare red and green traces). In terms of the quality of sensory input, our results reveal a point of optimal electroacuity located in the fish's midbody. This is in contrast to the notion that optimal discrimination should occur near the fish's head region, the electrosensory fovea, which has the highest density of electroreceptors [21]. However, determining acuity in the head region is a complex task due to a number of factors. For example, some enclosed environments can interact with this geometry and produce an electric “funneling” effect that increases the local field amplitude and enhances object discrimination [39,40]. Although these studies were performed on a different species of electric fish (pulse-type discharge) with a different electric organ morphology, a detailed investigation of the head region in A. leptorhynchus (the species we consider here) is still warranted. This will, however, require a more complicated 3-D model, so determining how the electric field, body geometry, and receptor density combine to determine electroacuity in the electrosensory fovea is not possible at this time. Nevertheless, on the lateral body surface, the combination of body geometry and current density are such that electric images are sharpest in the midbody [9], thus allowing the objects to be closer in that region before their electric images blur and form a single peak. This apparent tradeoff between more receptors rostrally and higher-quality images caudally may explain why prey detection occurs at approximately equal rates over all rostro–caudal locations [17]. An additional consideration, which again points to interesting future research, is that our current model does not account for the electric field dynamics that could in principle cause midbody acuity to vary over
Page 67 of 109
the electric organ discharge cycle. It is possible, for example, that the lowest Smin seen here in the midbody region may shift to other locations for other phases of the cycle, due to the spatial variation of the field in time [38]. In a strict sense, the values we obtain for Smin can be considered as an upper-bound limit on spatial acuity, since various noise sources would undoubtedly result in lower acuity at the behavioural level. However, there are additional cues available from the electric image, and potentially from other sensory modalities, which could help distinguish adjacent objects, and hence increase acuity. Specifically, the electric image produced by two objects is still wider than the image of one of the objects alone, even when their individual peaks are not discernable (see Figure 1C). Moreover, we have only considered two adjacent objects located in parallel with the fish's contour. Indeed, different criteria are required to measure the discrimination of objects that are situated one-behind-the-other (i.e., perpendicular to the fish's contour). Rother et al. [12] have studied such object locations, but not in the context of spatial acuity. We have shown that electroacuity did not vary with object conductivity. This implies that the fish's ability to resolve two equally sized, equally conductive objects is the same, regardless of whether these objects are animate or inanimate. However, it is possible that the addition of environmental noise to the electric images would make one of these types of objects more “resolvable,” as the SNR would be greater for high-conductivity objects. Water conductivity, on the other hand, does (slightly) affect Smin. Our results are in accord with other findings, which state that object detection is best-achieved in low-conductivity water [17,41,42], confirming the notion that increased water conductivity acts as a type of electrosensory “fog.” To resolve all of these issues, further behavioral experiments are required. Our current studies using a 2-D electric field model [9] have generated many hypotheses to test in such experiments. Despite the fact that the 2-D model very accurately reproduces many spatial aspects of the electric field [9], ultimately a more detailed 3-D model of the time-varying electric field will be necessary. Measuring electroacuity (behaviorally) in these fish could be accomplished by using a forced-choice experimental paradigm. In this task, the fish could be trained to choose between a single object and a pair of objects, with a reward given for the choice of the latter. An estimate of electroacuity could be obtained by tracking the accuracy of the choices as the interobject distance was decreased (see [33,43,44] for similar protocols). Prey Detection in Weakly Electric Fish Weakly electric fish are subject to a wide range of stimuli in natural electrosensory landscapes. Large conducting boundaries, such as rocks or the river bottom, constitute extensive background clutter [27]. The fish therefore has the challenging task of extracting small prey signals from enormous background ones. To investigate this scenario, we have modeled a plant-like background. We have shown that, as this background increases in width, the electric images produced on the fish's skin converge (i.e., the images are blurred). In fact, the image is not much different for background arrays ranging from 0.18 m to 0.3 m wide. In the presence of such a large-background image, the Smin for prey objects would be much larger than for the conditions we have considered thus far, and may in fact be defined only for much larger objects. In other words, as discussed in the following, the electric image component due to the background obscured that due to the two small prey-like objects. Figure 4 clearly indicates that the effect of a prey is miniscule in the presence of a relatively large-background array. Even at different times during a simulated scanning behavior, the prey only affected the image due to the background by a few percent at most. This suggests that for any static “snapshot” the fish would not be able to extract the prey signal from the large-background signal. On the other hand, weakly electric fish are known to detect minuscule signals under some laboratory conditions [17,45], and presumably can do so in the wild while hunting. We suggest that movement is required in these situations. In fact, due to the blurring effect, the background component of the electric image does not change with fish scanning, whereas the prey component does (see Figure 4B). As a

Page 68 of 109
consequence, the small-prey signal is revealed during the scanning motion by looking at the transdermal potential at individual locations on the fish's body (Figure 5A and 5D). In contrast, when background objects are more separated, the prey signal remains confounded by the background (Figure 5B, 5C, 5E, and 5F). The separation of small signals from background is a universal problem in sensory processing. In vision, the so-called figure-from-ground separation has been extensively studied; luminance and contrast differences between figure and ground provide information-rich cues for this task. In the absence of such cues, however, relative motion (due to figure, background, or observer motion) can provide information that is critical for effective figure-ground separation [29,46]. Motion of an auditory stimulus can also provide cues for sound-source localization in a noisy background [47,48]. Though the particular mechanisms involved in each sense may differ [47], both rely on coherent changes in stimulus parameters (spatial correlation in vision, systematic sweep of interaural time delays in audition). Similarly, we have shown that motion can also lead to small-signal detection in an electrosensory landscape under certain conditions. When the constituent objects of a complex scene are close enough to each other to result in a blurred (spatially uniform) image, a small spatially localized prey signal will pop out due to motion cues (and without motion the prey signal is masked by the large background). On the other hand, to evaluate the specific features of a scene, a greater spacing among constituent objects is required (see Figure 6). Electrosensory Processing It is important to note that we have only considered the information available to the electrosensory system and have not considered the potential for extracting this information. Information encoded by individual electroreceptor afferents will be pooled in the hindbrain electrosensory lateral line lobe (ELL). Here, the principle neurons, ELL pyramidal neurons, have receptive fields that vary systematically in size across three somatotopic maps. The largest of these receptive fields (lateral segment map) are about 2 cm in width along the body axis of the fish; the smallest receptive fields (centromedial segment map) are about 0.5 cm in width [26,49]. As previous studies have shown, the different maps may take on different roles depending on the type of information available [26,50]. In the context of this paper, the most focused images due to nearby prey objects may be preferentially encoded using pyramidal neurons of the centromedial segment (smaller receptive fields), and the more blurred images due to background objects may be encoded by neurons of the lateral segment (larger receptive fields). In addition, there are mechanisms in the ELL (via feedback pathways) that can cancel out predictable or redundant stimuli [51,52]. In principle, when the background is spatially uniform (blurred), such feedback mechanisms could cancel out the large-image component due to the background and further enhance small signal extraction during scanning. Recent studies on the signal processing features of ELL neurons have shown that coherence to spatially global time-varying input is high-pass [53], suggesting again that responses to spatially dense backgrounds can be filtered out. Information encoded by ELL neurons is transmitted to higher-order neurons of the midbrain. Recent studies have described plasticity and motion sensitivity in these neurons [24,54], but further studies will be required to determine how these neurons contribute to the computations involved with prey detection and discrimination in complex landscapes. Conclusion It has been widely hypothesized that the stereotypical back-and-forth scanning behavior exhibited by weakly electric fish could be used to generate electrolocation cues [25,55,56]. In fact, cues obtained by self-motion are used by many different animals to extract relevant sensory features [28]. For example, primates move their fingers laterally to detect fine features in textured surfaces, which would otherwise go unnoticed [57]; rodents perform whisking behaviors [58]; and insects, such as mantids, can obtain information about an object's depth using a side-to-side “peering” movement (by means of motion parallax cues; [59]). Such examples have led to the reasonable notion that the exploratory behaviors

Page 69 of 109
exhibited by weakly electric fish, such as the aforementioned scanning, act similarly to provide relevant information from complex electrosensory scenes. Our study describes the nature of these motion-generated cues for the first time, and indeed shows that their effectiveness depends on context. In particular, our results predict that weakly electric fish should exhibit the specific search behavior that is most suitable for signal extraction in a given context. The scanning behavior would be best suited for spatially dense or uniform backgrounds, whereas the fish might preferentially use tail-bending in cases where the background is sparse (as in Figure 5B, 5C, 5D, and 5F where the prey component is confounded with the background signal). In future studies, we aim to determine which behaviors are used most frequently by the fish to explore electrosensory landscapes with varying spatial characteristics. Materials and Methods The 2-D electric field of a 21-cm A. leptorhynchus was simulated using a finite-element–method model described previously in [9]. Briefly, the model reproduces the field measured at one phase of the quasisinusoidal electric organ discharge. It consists of three components: an electric organ (EO), a body compartment, and a thin skin layer. The EO current density and the conductivities of the three components were optimized using raw data provided by Christopher Assad [38]. The optimized EO current density is spatially structured; as compared with a simple dipole, it is skewed toward the tail. Such a profile in the EO current density, as well as the spatial filtering due to the tapered body shape, reproduces the asymmetric “multipole” electric field [9,10,27]. To distinguish this situation from that of a simple dipole, we sometimes refer to the fish's electric field as “dipole-like.” This model is a 2-D simplification that is static in time, and so, in principle, any results derived from it are qualitative. It is important to note, however, that the model provides a quantitatively accurate representation of the data measured in the horizontal plane [9], and thus should be very reliable. Of course, as we note in the Results and Discussion sections, there are some questions that will require a detailed time-varying 3-D model. Electric images were calculated in one of two ways using custom MATLAB subroutines. In Figures 1–4, images are defined as the differences in transdermal potential, with and without objects present (this has become the standard definition of an electric image, [5]). In Figure 5, images are displayed as the raw transdermal potential, the natural electrosensory input. All images are shown only for the side of the fish body closest to the objects. Water conductivity was set to 0.023 S/m, as in [38]. The prey chosen, Daphnia magna, was modeled as a 3 mm–diameter disc with a conductivity of 0.0303 S/m, as in [15,17]. The background objects (2-cm discs) simulated throughout this paper were based on the conductivity of the aquatic plant Hygrophilia [22] (0.0005 S/m). The goal was not to mimic the plant's geometry accurately, but rather to get a general idea of the effects caused by varying backgrounds with plant-like conductivity and size. To estimate the fish's ability to resolve two distinct objects (electroacuity), the minimal distance Smin was calculated. This measure is the interobject distance, which delimits an electric image with one peak from one with two peaks (for example, see Figure 1C). This quantity depends on a number of parameters such as the object's size, its rostro–caudal and lateral location, and the water conductivity. We can develop more intuition for how Smin behaves assuming that images of objects are idealized Gaussians. Consider two Gaussians along the x-axis, of similar standard deviation δ and amplitudes, but centered on μ1 and (-μ1 ), respectively. Assuming linear superposition, their sum along the x-axis will have one or two maxima, depending on the relation between the standard deviation and the mean, i.e., on the relative width. It can be shown that Smin in this case corresponds to (2δ). If the amplitudes of the Gaussians change in the same way, as they do when the object is closer to the fish, Smin remains the same; it will increase, however, if there is disparity in the amplitudes. Smin will also increase with increasing image width. Although this provides some insight on the behavior of Smin, it is important to note that linear superposition is not valid in general (for example, see Rother et al. [12]). Also, all of the

Page 70 of 109
images we show are computed using our model, which can accommodate arbitrary object combinations. In no cases do we assume linear superposition of images due to individual objects. For a given pair of objects, the rostral object's center coordinates were chosen as the spatial location for which the Smin was determined. Therefore, this object was held stationary during a given Smin measurement. The caudal object was moved systematically in the caudal direction until two distinct peaks appeared in the electric image (object center-to-skin distance was kept constant). Using this technique, Smin measurements were accurate to within 0.5 or 1 mm, representing the chosen sampling (see error bars in Figure 2). In the last part of the paper, where fish motion is simulated, a scanning speed of 0.1 m/s was chosen, which is in the range of measured weakly electric fish scanning velocities [45,56]. For quantifying the SNR between the two different transdermal potential time series (Figure 5, green and blue curves), i.e., the ones produced by the background alone (Φ back) and by the background and prey (Φ back+prey), a root-mean-squared difference measure was used (Equation 1):
where n represents the number of different fish locations that were simulated, i.e., samples of the transdermal potential at a given body location during a 1-s scan (we chose n = 21). A large SNR value means that the two time series are very distinct. We have also quantified the discriminability of two objects as they are separated (Equation 2). Here, we assumed that the separate (simulated) electric images generated by each object is a spatial Gaussian function (along one dimension; each of mean μi and width δi) and have computed the discriminability d’ [60,61]:

Page 71 of 109
Review of the literature of methods of SCIO
transcutaneous voltammetric evoked
potential (TVEP)
Intro:
There are many processes for the manufacture of small sensors with reproducible surfaces,
including electrochemical sensors. The conductive material can also be formed on the person’s
skin (transcutaneous) by many conductive methods. In the Electro-Physiological Feedback
Xrroid (EPFX) aka SCIO the sensors or electrodes are a carbon (graphite) impregnated polymer
to allow equal availability of electron flow. The EPFX was registered for reactivity measures,
stress reduction and muscle
measures in 1989 in America.
Since the system has been
registered world wide as a
medical device. The system
can measure the reactions of a
patient to an applied
voltammetric signature.
These signatures come from the
QQC voltammetric patterns. (see
QQC
www.voltametriaqqc.ro)
The EPFX SCIO TVEP then can calculate the reaction and display the reaction scores.
This article will serve as a literature review of current philosophy and utilization of the many
techniques of transcutaneous voltammetry TVEP as a basis of our patent application.
TVEP

Page 72 of 109
CO2 sensors/ transmitters
calibration-free low-cost infrared sensor for HVAC and OEM application www.senseair.com
Sterile Techniques
Improve Sterile Techniques Via New Cleaning SOP. See How & Try Samples www.Foamtecintlwcc.com
Oxygen Analyzers
Extremely Accurate and Easy To Use For Nitrox and Air Quick Checks www.Nuvair.com
Micron Optics, Inc
Fiber Bragg Grating monitoring systems for optical sensing www.micronoptics.com
Baumer Electric Sensors
Your Source for Baumer Sensors! Call for Support, Price & Delivery. www.connectorconcepts.com
Maitreya
Your Source for EPFX / SCIO! Call for Support, Price & Delivery. www.maitreya.com
Representative Image of the EPFX/SCIO:
Inventors:
Nelson W.C.
Sirbu C.P.
Plaque It!
Application Number:
OSIM Of Romania
M/11506
Publication Date:
Filing Date:
10/17/2006
View Patent Images:
Export Citation:
Assignee:
SCIO International, Oradea, Romania
Primary Class;
44: Service Medicale
Other Classes:
427/80, 29/592.100, 361/283.200, 156/73.100, 29/417, 361/283.100, 216/65, 427/79, 29/831,
29/846
International Classes:
C12Q1/00; G01N33/543; G01R3/00
Field of Search:
29/846, 29/831, 29/595, 156/73.1, 427/79, 29/417, 29/592.1, 361/301, 361/283, 216/65, 427/80
US Patent References:
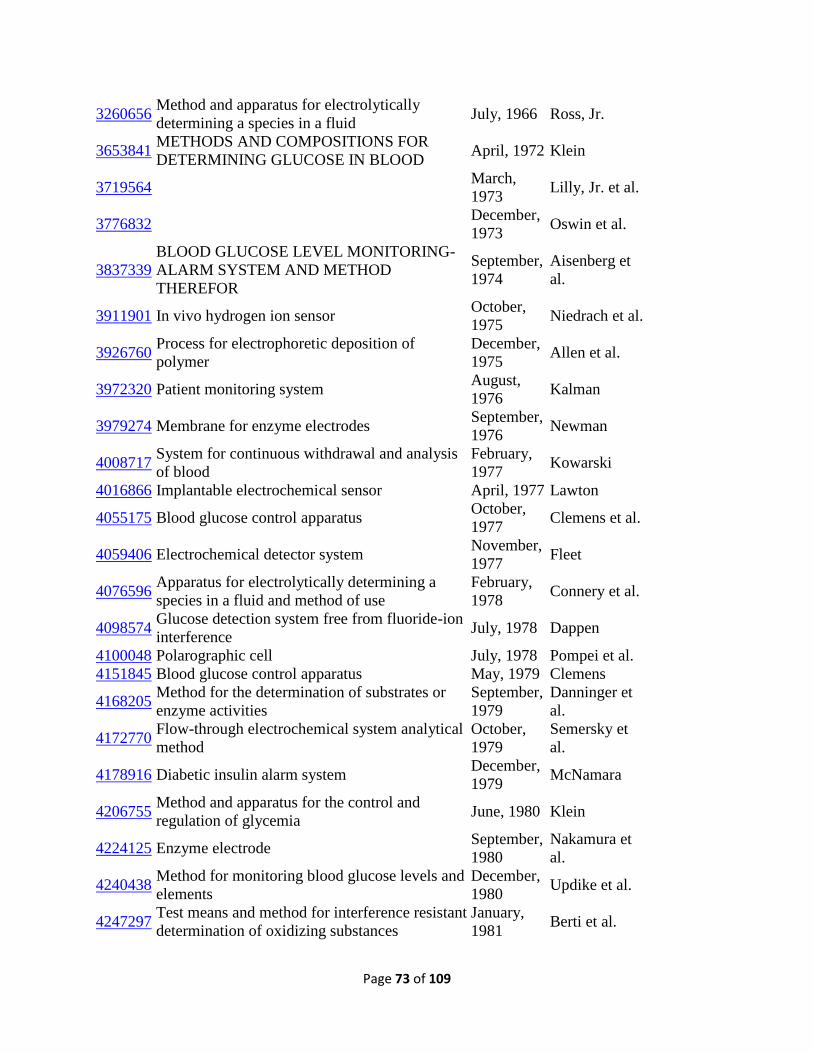
Page 73 of 109
3260656
Method and apparatus for electrolytically
determining a species in a fluid July, 1966 Ross, Jr.
3653841
METHODS AND COMPOSITIONS FOR
DETERMINING GLUCOSE IN BLOOD April, 1972 Klein
3719564
March,
1973 Lilly, Jr. et al.
3776832
December,
1973 Oswin et al.
3837339
BLOOD GLUCOSE LEVEL MONITORING-
ALARM SYSTEM AND METHOD
THEREFOR
September,
1974
Aisenberg et
al.
3911901 In vivo hydrogen ion sensor October,
1975 Niedrach et al.
3926760
Process for electrophoretic deposition of
polymer
December,
1975 Allen et al.
3972320 Patient monitoring system August,
1976 Kalman
3979274 Membrane for enzyme electrodes September,
1976 Newman
4008717
System for continuous withdrawal and analysis
of blood
February,
1977 Kowarski
4016866 Implantable electrochemical sensor April, 1977 Lawton
4055175 Blood glucose control apparatus October,
1977 Clemens et al.
4059406 Electrochemical detector system November,
1977 Fleet
4076596
Apparatus for electrolytically determining a
species in a fluid and method of use
February,
1978 Connery et al.
4098574
Glucose detection system free from fluoride-ion
interference July, 1978 Dappen
4100048 Polarographic cell July, 1978 Pompei et al.
4151845 Blood glucose control apparatus May, 1979 Clemens
4168205
Method for the determination of substrates or
enzyme activities
September,
1979
Danninger et
al.
4172770
Flow-through electrochemical system analytical
method
October,
1979
Semersky et
al.
4178916 Diabetic insulin alarm system December,
1979 McNamara
4206755
Method and apparatus for the control and
regulation of glycemia June, 1980 Klein
4224125 Enzyme electrode September,
1980
Nakamura et
al.
4240438
Method for monitoring blood glucose levels and
elements
December,
1980 Updike et al.
4247297
Test means and method for interference resistant
determination of oxidizing substances
January,
1981 Berti et al.

Page 74 of 109
4340458 Glucose sensor July, 1982 Lerner et al.
4352960
Magnetic transcutaneous mount for external
device of an associated implant
October,
1982 Dormer et al.
4356074
Substrate specific galactose oxidase enzyme
electrodes
October,
1982 Johnson
4365637 Perspiration indicating alarm for diabetics December,
1982 Johnson
4366033
Method for determining the concentration of
sugar using an electrocatalytic sugar sensor
December,
1982 Richter et al.
4375399
Molecule selective sensor for industrial use and
procedure for its preparation
March,
1983 Havas et al.
4384586 Method and apparatus for pH recording May, 1983 Christiansen
4390621
Method and device for detecting glucose
concentration June, 1983 Bauer
4401122
Cutaneous methods of measuring body
substances
August,
1983 Clark, Jr.
4404066
Method for quantitatively determining a
particular substrate catalyzed by a multisubstrate
enzyme
September,
1983 Johnson
4418148 Multilayer enzyme electrode membrane November,
1983 Oberhardt
4427770 High glucose-determining analytical element January,
1984 Chen et al.
4431004 Implantable glucose sensor February,
1984 Bessman et al.
4436094
Monitor for continuous in vivo measurement of
glucose concentration
March,
1984 Cerami
4440175 Membrane electrode for non-ionic species April, 1984 Wilkins
4450842 Solid state reference electrode May, 1984 Zick et al.
4458686
Cutaneous methods of measuring body
substances July, 1984 Clark, Jr.
4461691
Organic conductive films for semiconductor
electrodes July, 1984 Frank
4469110
Device for causing a pinprick to obtain and to
test a drop of blood
September,
1984 Slama
4477314 Method for determining sugar concentration October,
1984 Richter et al.
4484987
Method and membrane applicable to implantable
sensor
November,
1984 Gough
4522690 Electrochemical sensing of carbon monoxide June, 1985 Venkatasetty
4524114 Bifunctional air electrode June, 1985 Samuels et al.
4526661
Electrochemical hydrogenation of nicotinamide
adenine dinucleotide July, 1985 Steckhan et al.
4534356 Solid state transcutaneous blood gas sensors August,
1985 Papadakis
4538616 Blood sugar level sensing and monitoring September, Rogoff
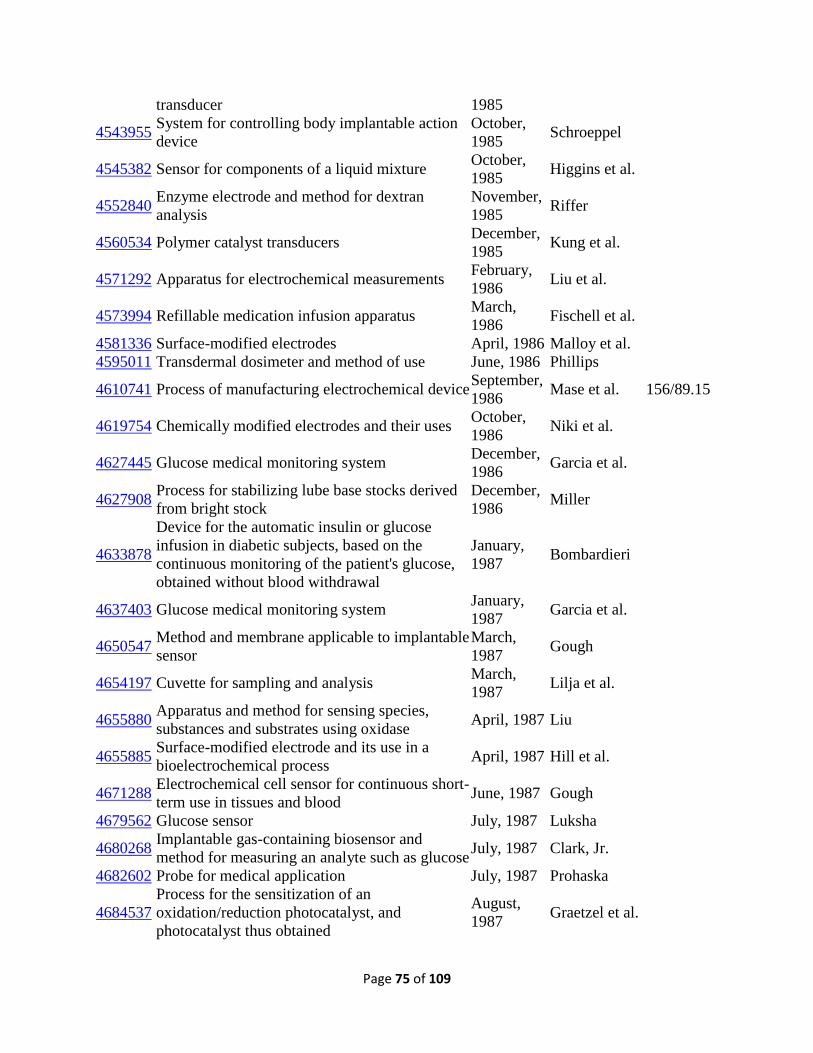
Page 75 of 109
transducer 1985
4543955
System for controlling body implantable action
device
October,
1985 Schroeppel
4545382 Sensor for components of a liquid mixture October,
1985 Higgins et al.
4552840
Enzyme electrode and method for dextran
analysis
November,
1985 Riffer
4560534 Polymer catalyst transducers December,
1985 Kung et al.
4571292 Apparatus for electrochemical measurements February,
1986 Liu et al.
4573994 Refillable medication infusion apparatus March,
1986 Fischell et al.
4581336 Surface-modified electrodes April, 1986 Malloy et al.
4595011 Transdermal dosimeter and method of use June, 1986 Phillips
4610741 Process of manufacturing electrochemical device September,
1986 Mase et al. 156/89.15
4619754 Chemically modified electrodes and their uses October,
1986 Niki et al.
4627445 Glucose medical monitoring system December,
1986 Garcia et al.
4627908
Process for stabilizing lube base stocks derived
from bright stock
December,
1986 Miller
4633878
Device for the automatic insulin or glucose
infusion in diabetic subjects, based on the
continuous monitoring of the patient's glucose,
obtained without blood withdrawal
January,
1987 Bombardieri
4637403 Glucose medical monitoring system January,
1987 Garcia et al.
4650547
Method and membrane applicable to implantable
sensor
March,
1987 Gough
4654197 Cuvette for sampling and analysis March,
1987 Lilja et al.
4655880
Apparatus and method for sensing species,
substances and substrates using oxidase April, 1987 Liu
4655885
Surface-modified electrode and its use in a
bioelectrochemical process April, 1987 Hill et al.
4671288
Electrochemical cell sensor for continuous short-
term use in tissues and blood June, 1987 Gough
4679562 Glucose sensor July, 1987 Luksha
4680268
Implantable gas-containing biosensor and
method for measuring an analyte such as glucose July, 1987 Clark, Jr.
4682602 Probe for medical application July, 1987 Prohaska
4684537
Process for the sensitization of an
oxidation/reduction photocatalyst, and
photocatalyst thus obtained
August,
1987 Graetzel et al.
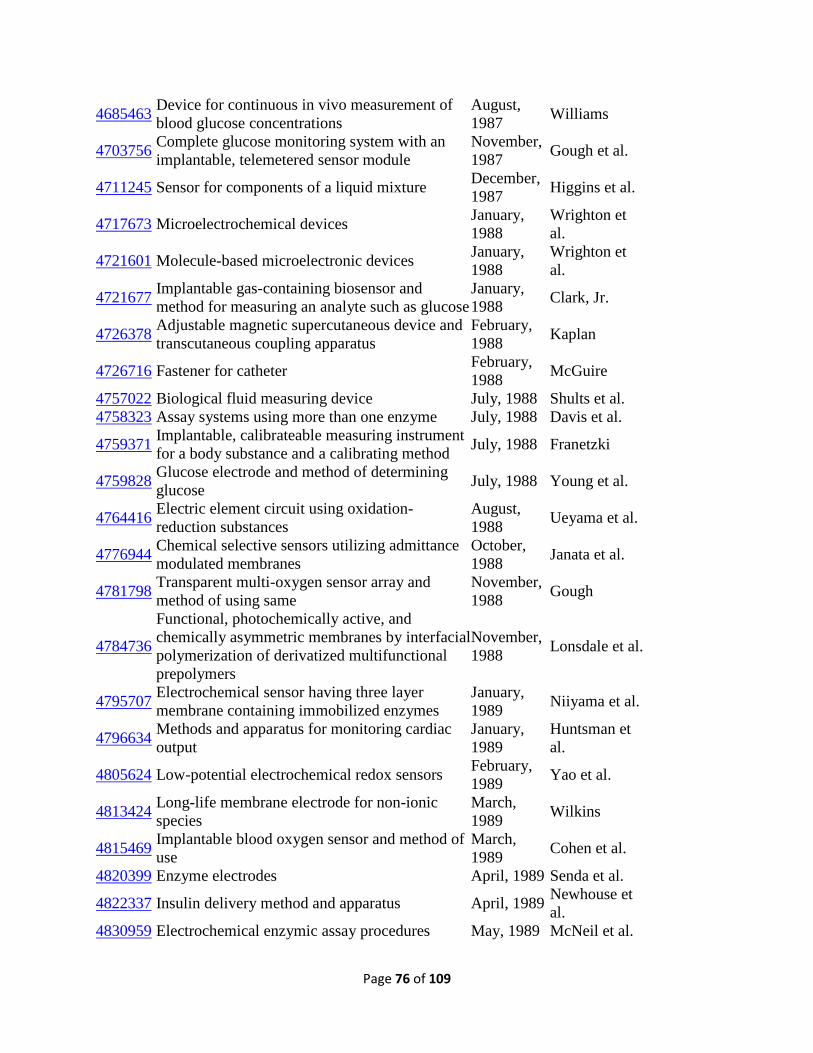
Page 76 of 109
4685463
Device for continuous in vivo measurement of
blood glucose concentrations
August,
1987 Williams
4703756
Complete glucose monitoring system with an
implantable, telemetered sensor module
November,
1987 Gough et al.
4711245 Sensor for components of a liquid mixture December,
1987 Higgins et al.
4717673 Microelectrochemical devices January,
1988
Wrighton et
al.
4721601 Molecule-based microelectronic devices January,
1988
Wrighton et
al.
4721677
Implantable gas-containing biosensor and
method for measuring an analyte such as glucose
January,
1988 Clark, Jr.
4726378
Adjustable magnetic supercutaneous device and
transcutaneous coupling apparatus
February,
1988 Kaplan
4726716 Fastener for catheter February,
1988 McGuire
4757022 Biological fluid measuring device July, 1988 Shults et al.
4758323 Assay systems using more than one enzyme July, 1988 Davis et al.
4759371
Implantable, calibrateable measuring instrument
for a body substance and a calibrating method July, 1988 Franetzki
4759828
Glucose electrode and method of determining
glucose July, 1988 Young et al.
4764416
Electric element circuit using oxidation-
reduction substances
August,
1988 Ueyama et al.
4776944
Chemical selective sensors utilizing admittance
modulated membranes
October,
1988 Janata et al.
4781798
Transparent multi-oxygen sensor array and
method of using same
November,
1988 Gough
4784736
Functional, photochemically active, and
chemically asymmetric membranes by interfacial
polymerization of derivatized multifunctional
prepolymers
November,
1988 Lonsdale et al.
4795707
Electrochemical sensor having three layer
membrane containing immobilized enzymes
January,
1989 Niiyama et al.
4796634
Methods and apparatus for monitoring cardiac
output
January,
1989
Huntsman et
al.
4805624 Low-potential electrochemical redox sensors February,
1989 Yao et al.
4813424
Long-life membrane electrode for non-ionic
species
March,
1989 Wilkins
4815469
Implantable blood oxygen sensor and method of
use
March,
1989 Cohen et al.
4820399 Enzyme electrodes April, 1989 Senda et al.
4822337 Insulin delivery method and apparatus April, 1989 Newhouse et
al.
4830959 Electrochemical enzymic assay procedures May, 1989 McNeil et al.

Page 77 of 109
4832797 Enzyme electrode and membrane May, 1989 Vadgama et
al.
RE32947
Magnetic transcutaneous mount for external
device of an associated implant June, 1989 Dormer et al.
4840893
Electrochemical assay for nucleic acids and
nucleic acid probes June, 1989 Hill et al.
4848351 Medical electrode assembly July, 1989 Finch
4871351 Implantable medication infusion system October,
1989 Feingold
4871440 Biosensor October,
1989 Nagata et al.
4874500 Microelectrochemical sensor and sensor array October,
1989 Madou et al.
4890620
Two-dimensional diffusion glucose substrate
sensing electrode
January,
1990 Gough
4894137 Enzyme electrode January,
1990
Takizawa et
al.
4897162 Pulse voltammetry January,
1990
Lewandowski
et al.
4897173 Biosensor and method for making the same January,
1990 Nankai et al.
4909908 Electrochemical cncentration detector method March,
1990 Ross et al.
4911794 Measuring with zero volume cell March,
1990 Parce et al.
4917800
Functional, photochemically active, and
chemically asymmetric membranes by interfacial
polymerization of derivatized multifunctional
prepolymers
April, 1990 Lonsdale et al.
4919141 Implantable electrochemical sensor April, 1990 Zier et al.
4919767 Sensor and method for analyte determination April, 1990 Vadgama et
al.
4923586 Enzyme electrode unit May, 1990 Katayama et
al.
4927516 Enzyme sensor May, 1990 Yamaguchi et
al.
4934369
Intravascular blood parameter measurement
system June, 1990 Maxwell
4935105 Methods of operating enzyme electrode sensors June, 1990 Churchouse
4935345
Implantable microelectronic biochemical sensor
incorporating thin film thermopile June, 1990 Guilbeau et al.
4938860 Electrode for electrochemical sensors July, 1990 Wogoman
4944299
High speed digital telemetry system for
implantable device July, 1990 Silvian
4950378 Biosensor August,
1990 Nagata

Page 78 of 109
4953552 Blood glucose monitoring system September,
1990 DeMarzo
4954129 Hydrodynamic clot flushing September,
1990 Giuliani et al.
4969468
Electrode array for use in connection with a
living body and method of manufacture
November,
1990 Byers et al.
4970145 Immobilized enzyme electrodes November,
1990 Bennetto et al.
4974929
Fiber optical probe connector for physiologic
measurement devices
December,
1990 Curry
4986271 Vivo refillable glucose sensor January,
1991 Wilkins
4994167 Biological fluid measuring device February,
1991 Shults et al.
5001054 Method for monitoring glucose March,
1991 Wagner
5058592
Adjustable mountable doppler ultrasound
transducer device
October,
1991 Whisler
5070535
Transcutaneous power and signal transmission
system and methods for increased signal
transmission efficiency
December,
1991
Hochmair et
al.
5082550
Enzyme electrochemical sensor electrode and
method of making it
January,
1992 Rishpon et al.
5082786
Glucose sensor with gel-immobilized glucose
oxidase and gluconolactonase
January,
1992 Nakamoto
5089112
Electrochemical biosensor based on immobilized
enzymes and redox polymers
February,
1992
Skotheim et
al.
5095904 Multi-peak speech procession March,
1992 Seligman et al.
5101814
System for monitoring and controlling blood
glucose April, 1992 Palti
5108564
Method and apparatus for amperometric
diagnostic analysis April, 1992
Szuminsky et
al.
5109850
Automatic blood monitoring for medication
delivery method and apparatus May, 1992 Blanco et al.
5120420 Biosensor and a process for preparation thereof June, 1992 Nankai et al.
5126034 Bioelectrochemical electrodes June, 1992 Carter et al.
5133856 Ion sensor July, 1992 Yamaguchi et
al.
5135003 Automatic sphygmomanometer August,
1992 Souma
5141868 Device for use in chemical test procedures August,
1992 Shanks et al.
5161532 Integral interstitial fluid sensor November,
1992 Joseph
5165407 Implantable glucose sensor November, Wilson et al.

Page 79 of 109
1992
5174291
Process for using a measuring cell assembly for
glucose determination
December,
1992
Schoonen et
al.
5190041
System for monitoring and controlling blood
glucose
March,
1993 Palti
5192416
Method and apparatus for batch injection
analysis
March,
1993 Wang et al.
5198367 Homogeneous amperometric immunoassay March,
1993 Aizawa et al.
5202261
Conductive sensors and their use in diagnostic
assays April, 1993 Musho et al.
5205920
Enzyme sensor and method of manufacturing the
same April, 1993 Oyama et al.
5208154
Reversibly immobilized biological materials in
monolayer films on electrodes May, 1993 Weaver et al.
5209229
Apparatus and method employing plural
electrode configurations for cardioversion of
atrial fibrillation in an arrhythmia control system
May, 1993 Gilli
5217595 Electrochemical gas sensor June, 1993 Smith et al.
5229282
Preparation of biosensor having a layer
containing an enzyme, electron acceptor and
hydrophilic polymer on an electrode system
July, 1993 Yoshioka et
al.
5250439 Use of conductive sensors in diagnostic assays October,
1993 Musho et al.
5262035 Enzyme electrodes November,
1993 Gregg et al.
5262305 Interferant eliminating biosensors November,
1993 Heller et al.
5264103
Biosensor and a method for measuring a
concentration of a substrate in a sample
November,
1993
Yoshioka et
al.
5264104 Enzyme electrodes November,
1993 Gregg et al.
5264106 Enhanced amperometric sensor November,
1993 McAleer et al.
5271815 Method for measuring glucose December,
1993 Wong
5279294 Medical diagnostic system January,
1994
Anderson et
al.
5286362
Method and sensor electrode system for the
electrochemical determination of an analyte or
an oxidoreductase as well as the use of suitable
compounds therefor
February,
1994 Hoenes et al.
5286364 Surface-modified electochemical biosensor February,
1994
Yacynych et
al.
5288636 Enzyme electrode system February,
1994
Pollmann et
al.

Page 80 of 109
5293546
Oxide coated metal grid electrode structure in
display devices
March,
1994 Tadros et al.
5320098 Optical transdermal link June, 1994 Davidson
5320725
Electrode and method for the detection of
hydrogen peroxide June, 1994 Gregg et al.
5322063
Hydrophilic polyurethane membranes for
electrochemical glucose sensors June, 1994 Allen et al.
5337747 Implantable device for estimating glucose levels August,
1994 Neftel
5352348 Method of using enzyme electrode October,
1994 Young et al.
5356786 Interferant eliminating biosensor October,
1994 Heller et al.
5368028
System for monitoring and controlling blood and
tissue constituent levels
November,
1994 Palti
5372133
Implantable biomedical sensor device, suitable
in particular for measuring the concentration of
glucose
December,
1994 Hogen Esch
5376251
Carbon micro-sensor electrode and method for
preparing it
December,
1994 Kaneko et al.
5378628
Sensor for measuring the amount of a
component in solution
January,
1995 Grātzel et al.
5387327
Implantable non-enzymatic electrochemical
glucose sensor
February,
1995 Khan
5390671 Transcutaneous sensor insertion set February,
1995 Lord et al.
5391250 Method of fabricating thin film sensors February,
1995 Cheney et al. 156/268
5395504
Electrochemical measuring system with
multizone sensors
March,
1995 Saurer et al.
5411647
Techniques to improve the performance of
electrochemical sensors May, 1995 Johnson et al.
5437999 Electrochemical sensor August,
1995 Diebold et al. 204/403.11
5469846
Implantable non-enzymatic electrochemical
glucose sensor
November,
1995 Khan
5494562 Electrochemical sensors February,
1996 Maley et al.
5496453
Biosensor and method of quantitative analysis
using the same
March,
1996
Uenoyama et
al.
5497772 Glucose monitoring system March,
1996
Schulman et
al.
5531878 Sensor devices July, 1996 Vadgama et
al.
5545191
Method for optimally positioning and securing
the external unit of a transcutaneous transducer
August,
1996 Mann et al.

Page 81 of 109
of the skin of a living body
5560357
D.C. epidermal biopotential sensing electrode
assembly and apparatus for use therewith
October,
1996 Faupel et al.
5565085 Method for quantifying specific compound October,
1996 Ikeda et al.
5567302
Electrochemical system for rapid detection of
biochemical agents that catalyze a redox
potential change
October,
1996 Song et al.
5568806 Transcutaneous sensor insertion set October,
1996
Cheney, II et
al.
5569186
Closed loop infusion pump system with
removable glucose sensor
October,
1996 Lord et al.
5582184
Interstitial fluid collection and constituent
measurement
December,
1996 Erickson et al.
5582697
Biosensor, and a method and a device for
quantifying a substrate in a sample liquid using
the same
December,
1996 Ikeda et al.
5582698 Sensor package December,
1996 Flaherty et al.
5586553 Transcutaneous sensor insertion set December,
1996 Halili et al.
5589326 Osmium-containing redox mediator December,
1996 Deng et al. 435/4
5593852 Subcutaneous glucose electrode January,
1997 Heller et al.
5596150
Capacitance probe for fluid flow and volume
measurements
January,
1997 Arndt et al.
5617851
Ultrasonic transdermal system for withdrawing
fluid from an organism and determining the
concentration of a substance in the fluid
April, 1997 Lipkovker
5628890 Electrochemical sensor May, 1997 Carter et al.
5651869 Biosensor July, 1997 Yoshioka et
al.
5660163 Glucose sensor assembly August,
1997
Schulman et
al.
5670031 Electrochemical sensor September,
1997 Hintsche et al.
5680858
Method and apparatus for in vivo determination
of the concentration in a body fluid of
metabolically significant substances
October,
1997 Hansen et al.
5682233 Interstitial fluid sampler October,
1997 Brinda
5695623 Glucose measuring device December,
1997 Michel et al.
5708247
Disposable glucose test strips, and methods and
compositions for making same
January,
1998 McAleer et al.

Page 82 of 109
5711861
Device for monitoring changes in analyte
concentration
January,
1998 Ward et al.
5711862
Portable biochemical measurement device using
an enzyme sensor
January,
1998 Sakoda et al.
5741211
System and method for continuous monitoring of
diabetes-related blood constituents April, 1998 Renirie et al.
5807375
Analyte-controlled liquid delivery device and
analyte monitor
September,
1998 Gross et al.
5822715
Diabetes management system and method for
controlling blood glucose
October,
1998
Worthington
et al.
5840020 Monitoring method and a monitoring equipment November,
1998
Heinonen et
al.
Foreign References:
DE2903216 August,
1979
DE227029 September,
1985
DE3740149 June, 1989
DE3934299 October,
1990
EP0010375 April, 1980
Electrostatographic processing system.
EP0026995 April, 1981
Thin carbon-cloth-based electrocatalytic gas
diffusion electrodes, processes, and
electrochemical cells comprising the same.
EP0048090 March,
1982
Substrate specific galactose oxidase enzyme
electrodes.
EP0078636 May, 1983
Sensor for components of a liquid mixture.
EP0096288 December,
1983
Process for the electrochemical hydrogenation of
nicotin-amide-adenine dinucleotide.
EP0125139 November,
1984 Assay techniques utilising specific binding agents.
EP0127958 December,
1984 Sensor electrode systems.
EP0136362 April, 1985
BIOSENSOR.
EP0170375 February,
1986 Devices for use in chemical test procedures.
EP0177743 April, 1986
Enzyme electrodes.
EP0080304 May, 1986
Stabilization of oxidase.
EP0184909 June, 1986
Bioelectrochemical assay and apparatus.
EP0193676 September,
1986 Solid state electrode.
EP0206218 December,
Electrode for electrochemical sensors.

Page 83 of 109
1986
EP0230472 August,
1987
BIOSENSOR AND METHOD OF
MANUFACTURING SAME.
EP0241309 October,
1987 Measurement of electroactive species in solution.
EP0245073 November,
1987
A complete glucose monitoring system with an
implantable, telemetered sensor module.
EP0278647 August,
1988 Electronchemical processes involving enzymes.
EP0359831 March,
1990
BIOSENSOR AND PROCESS FOR ITS
PRODUCTION
EP0368209 May, 1990
A process for immobilizing an enzyme on an
electrode surface.
EP0390390 October,
1990
Electrochemical biosensor based on immobilized
enzymes and redox polymers.
EP0400918 December,
1990 Enzyme sensor.
EP0453283 October,
1991 An integral interstitial fluid sensor.
EP0470290 February,
1992 Electrochemical enzymatic sensor.
EP0255291 June, 1992
Method and apparatus for electrochemical
measurements.
GB1394171 May, 1975
GB1599241 September,
1981
GB2073891 October,
1981
GB2154003 February,
1988
GB2204408 November,
1988
GB2254436 October,
1992
GB2287472 September,
1995
JP5441191 April, 1979
JP5510581 January,
1980
JP5510583 January,
1980

Page 84 of 109
JP5510584 January,
1980
JP5512406 January,
1980
JP56163447 December,
1981 ENZYME ELECTRODE
JP5770448 April, 1982
JP60173457 September,
1985 BIOSENSOR
JP60173458 September,
1985 BIOSENSOR
JP60173459 September,
1985 BIOSENSOR
JP6190050 May, 1986
JP6285855 April, 1987
JP62114747 May, 1987
CONTINUOUS CASTING METHOD FOR
METALLIC BAR
JP6358149 March,
1988
JP63128252 May, 1988
BIOSENSOR
JP63139246 June, 1988
BIOSENSOR
JP63294799 December,
1988
METHOD FOR SIMULTANEOUSLY
MEASURING GLUCOSE AND 1,5-
ANHYDROGLYCITOL
JP63317757 December,
1988 GLUCOSE SENSOR
JP63317758 December,
1988 MANUFACTURE OF BIOSENSOR
JP1114746 May, 1989
JP1114747 May, 1989
JP1124060 May, 1989
JP1134244 May, 1989
JP1156658 June, 1989
JP0262958 March,
1990
JP2120655 May, 1990
JP2287145 November,
1990
JP2310457 December,
1990
JP0326956 February,

Page 85 of 109
1991
JP0328752 February,
1991
JP3202764 September,
1991 FLEXIBLE PROTECTIVE BELLOWS
JP0572171 March,
1993
JP5196595 August,
1993
JP0755757 March,
1995
JP0772585 March,
1995
JP07286987 October,
1995 G01N027/28
METHOD FOR ASSEMBLING THIN-FILM
SENSOR
JP8285814 November,
1996
JP8285815 November,
1996
JP0921778 January,
1997
JP9101280 April, 1997
JP9285459 November,
1997
JP10170471 June, 1998
BIOSENSOR
SU1281988 January,
1987
WO/1985/005119 November,
1985
PROCESS FOR THE SENSITIZATION OF AN
OXIDOREDUCTION PHOTOCALATYST, AND
PHOTOCATALYST THUS OBTAINED
WO/1989/008713 September,
1989
METHOD AND APPARATUS FOR
AMPEROMETRIC DIAGNOSTIC ANALYSIS
WO/1990/005300 May, 1990
METHOD FOR ELECTRICAL DETECTION OF
A BINDING REACTION
WO/1990/005910 May, 1990
WHOLLY MICROFABRICATED BIOSENSORS
AND PROCESS FOR THE MANUFACTURE
AND USE THEREOF
WO/1991/001680 February,
1991
SYSTEM FOR MONITORING AND
CONTROLLING BLOOD GLUCOSE
WO/1991/004704 April, 1991
IMPLANTABLE DEVICE FOR MEASURING
GLUCOSE LEVELS
WO/1991/015993 October,
IMPLANTABLE GLUCOSE SENSOR
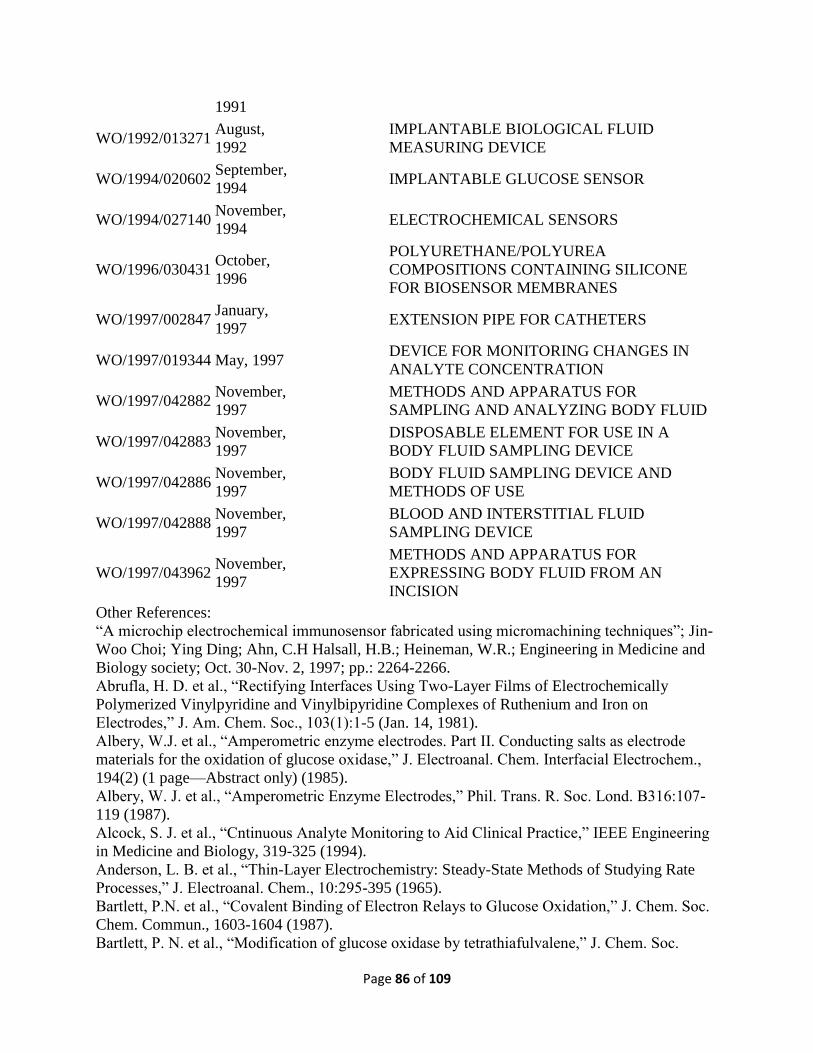
Page 86 of 109
1991
WO/1992/013271 August,
1992
IMPLANTABLE BIOLOGICAL FLUID
MEASURING DEVICE
WO/1994/020602 September,
1994 IMPLANTABLE GLUCOSE SENSOR
WO/1994/027140 November,
1994 ELECTROCHEMICAL SENSORS
WO/1996/030431 October,
1996
POLYURETHANE/POLYUREA
COMPOSITIONS CONTAINING SILICONE
FOR BIOSENSOR MEMBRANES
WO/1997/002847 January,
1997 EXTENSION PIPE FOR CATHETERS
WO/1997/019344 May, 1997
DEVICE FOR MONITORING CHANGES IN
ANALYTE CONCENTRATION
WO/1997/042882 November,
1997
METHODS AND APPARATUS FOR
SAMPLING AND ANALYZING BODY FLUID
WO/1997/042883 November,
1997
DISPOSABLE ELEMENT FOR USE IN A
BODY FLUID SAMPLING DEVICE
WO/1997/042886 November,
1997
BODY FLUID SAMPLING DEVICE AND
METHODS OF USE
WO/1997/042888 November,
1997
BLOOD AND INTERSTITIAL FLUID
SAMPLING DEVICE
WO/1997/043962 November,
1997
METHODS AND APPARATUS FOR
EXPRESSING BODY FLUID FROM AN
INCISION
Other References:
“A microchip electrochemical immunosensor fabricated using micromachining techniques”; Jin-
Woo Choi; Ying Ding; Ahn, C.H Halsall, H.B.; Heineman, W.R.; Engineering in Medicine and
Biology society; Oct. 30-Nov. 2, 1997; pp.: 2264-2266.
Abrufla, H. D. et al., “Rectifying Interfaces Using Two-Layer Films of Electrochemically
Polymerized Vinylpyridine and Vinylbipyridine Complexes of Ruthenium and Iron on
Electrodes,” J. Am. Chem. Soc., 103(1):1-5 (Jan. 14, 1981).
Albery, W.J. et al., “Amperometric enzyme electrodes. Part II. Conducting salts as electrode
materials for the oxidation of glucose oxidase,” J. Electroanal. Chem. Interfacial Electrochem.,
194(2) (1 page—Abstract only) (1985).
Albery, W. J. et al., “Amperometric Enzyme Electrodes,” Phil. Trans. R. Soc. Lond. B316:107-
119 (1987).
Alcock, S. J. et al., “Cntinuous Analyte Monitoring to Aid Clinical Practice,” IEEE Engineering
in Medicine and Biology, 319-325 (1994).
Anderson, L. B. et al., “Thin-Layer Electrochemistry: Steady-State Methods of Studying Rate
Processes,” J. Electroanal. Chem., 10:295-395 (1965).
Bartlett, P.N. et al., “Covalent Binding of Electron Relays to Glucose Oxidation,” J. Chem. Soc.
Chem. Commun., 1603-1604 (1987).
Bartlett, P. N. et al., “Modification of glucose oxidase by tetrathiafulvalene,” J. Chem. Soc.

Page 87 of 109
Chem. Commun., 16 (1 page—Abstract only) (1990).
Bartlett, P. N. et al., “Strategies for the Development of Amperometric Enzyme Electrodes,”
Biosensors, 3:359-379 (1987/88).
Bindra, D.S. et al., “Design in Vitro Studies of a Needle-Type Glucose Sensor for Subcutaneous
Monitoring”, Anal. Chem., 63(17):1692-1696 (Sep. 1, 1991).
Bobbioni-Hanch, E. et al., “Lifespan of subcutaneous glucase sensors and their performances
during dynamic glycaemia changes in rats,” J. Biomed. Eng. 15:457-463 (1993).
Brandt, J. et al., “Covalent attachment of proteins to polysaccharide carriers by means of
benzoquinone,” Biochim. Biophys. Acta, 386(1) (1 page Abstract only) (1975).
Brownlee, M. et al., “A Glucose-Controlled Insulin-Delivery System: Semisynthetic Insulin
Bound to Lectin”, Science, 206(4423):1190-1191 (Dec. 7, 1979).
Cass, A.E.G. et al., “Ferricinum Ion As An Electron Acceptor for Oxido-Reductases,” J.
Electroanal. Chem., 190:117-127 (1985).
Cass, A.E.G. et al., “Ferrocene-Mediated Enzyme Electrode for Amperometric Determination of
Glucose”, Anal. Chem., 56(4):667-671 (Apr. 1984).
Castner, J. F. et al., “Mass Transport and Reaction Kinetic Parameters Determined
Electrochemically for Immobilized Glucose Oxidase,” Biochemistry, 23(10):2203-2210 (1984).
Claremont, D.J. et al., “Biosensors for Continuous In Vivo Glucose Monitoring”, IEEE
Engineering in Medicine and Biology Society 10th Annual International Conference, New
Orleans, Louisiana, 3 pgs. (Nov. 4-7, 1988).
Clark, L.C. et al., “Differential Anodic Enzymic Polarography for the Measurement of Glucose”,
Oxygen Transport to Tissue: Instrumentation, Methods, and Physiology, 127-132 (1973).
Clark, L.C., Jr. et al., “Electrode Systems for Continuous Monitoring in Cardiovascular
Surgery,” Annals New York Academy of Sciences, pp. 29-45 (1962).
Clark, L.C., et al., “Long-term Stability of Electroenzymatic Glucose Sensors Implanted in
Mice,” Trans. Am. Soc. Artif. Intern. Organs, XXXIV:259-265 (1988).
Clarke, W. L., et al., “Evaluating Clinical Accuracy of Systems for Self-Monitoring of Blood
Glucose,” Diabetes Care, 10(5):622-628 (Sep.-Oct. 1987).
Csöregi, E. et al., “Design, Characterization, and One-Point in Vivo Calibration of a
Subcutaneously Implanted Glucose Electrode,” Anal. Chem. 66(19):3131-3138 (Oct. 1, 1994).
Csöregi, E. et al., “Design and Optimization of a Selective Subcutaneously Implantable Glucose
Electrode Based on “Wired” Glucose Oxidase,” Anal. Chem. 67(7):1240-1244 (Apr. 1, 1995).
Csöregi, E. et al., “On-Line Glucose Monitoring by Using Microdialysis Sampling and
Amperometric Detection Based on “Wired” Glucose Oxidase in Carbon Paste,” Mikrochim.
Acta. 121:31-40 (1995).
Davis, G., “Electrochemical Techniques for the Development of Amperometric Biosensors”,
Biosensors, 1:161-178 (1985).
Degani, Y. et al., “Direct Electrical Communication between Chemically Modified Enzymes and
Metal Electrodes. I. Electron Transfer from Glucose Oxidase to Metal Electrodes via Electron
Relays, Bound Covalently to the Enzyme,” J. Phys. Chem., 91(6):1285-1289 (1987).
Degani, Y. et al., “Direct Electrical Communication between Chemically Modified Enzymes and
Metal Electrodes. 2. Methods for Bonding Electron-Transfer Relays to Glucose Oxidase and D-
Amino-Acid Oxidase,” J. Am. Chem. Soc., 110(8):2615-2620 (1988).
Degani, Y. et al., “Electrical Communication between Redox Centers of Glucose Oxidase and
Electrodes via Electrostatically and Covalently Bound Redox Polymers,”J. Am. Chem. Soc.
111:2357-2358 (1989).
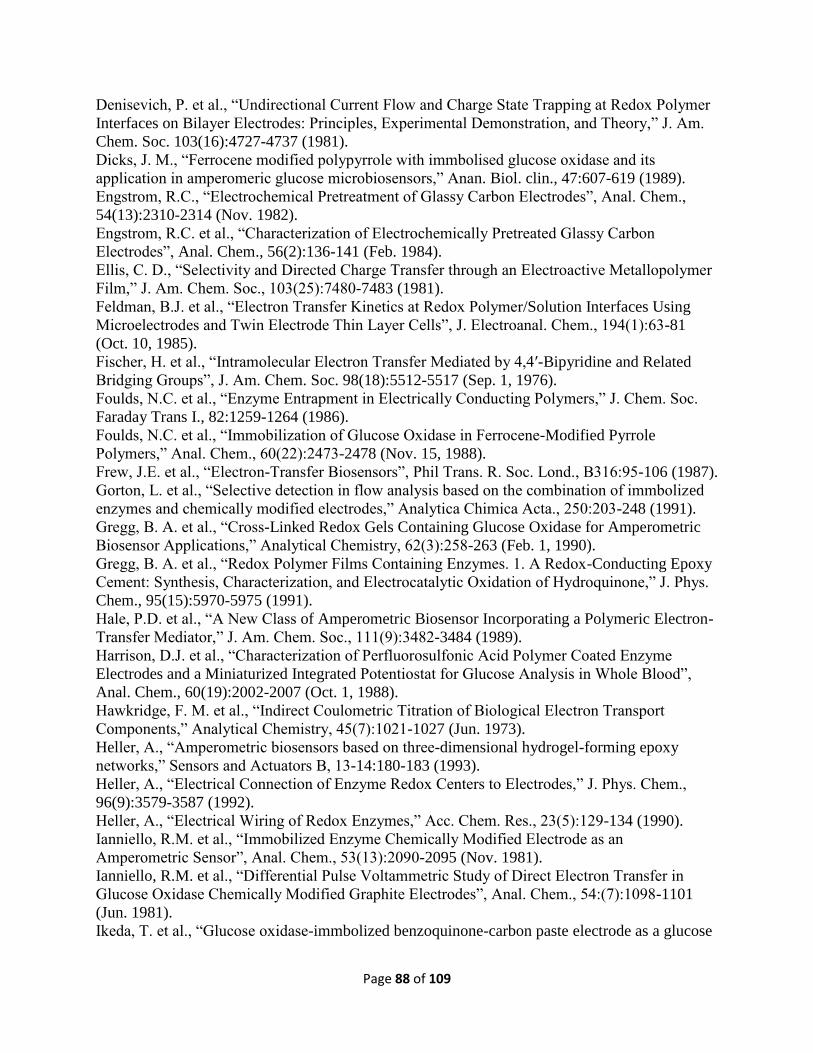
Page 88 of 109
Denisevich, P. et al., “Undirectional Current Flow and Charge State Trapping at Redox Polymer
Interfaces on Bilayer Electrodes: Principles, Experimental Demonstration, and Theory,” J. Am.
Chem. Soc. 103(16):4727-4737 (1981).
Dicks, J. M., “Ferrocene modified polypyrrole with immbolised glucose oxidase and its
application in amperomeric glucose microbiosensors,” Anan. Biol. clin., 47:607-619 (1989).
Engstrom, R.C., “Electrochemical Pretreatment of Glassy Carbon Electrodes”, Anal. Chem.,
54(13):2310-2314 (Nov. 1982).
Engstrom, R.C. et al., “Characterization of Electrochemically Pretreated Glassy Carbon
Electrodes”, Anal. Chem., 56(2):136-141 (Feb. 1984).
Ellis, C. D., “Selectivity and Directed Charge Transfer through an Electroactive Metallopolymer
Film,” J. Am. Chem. Soc., 103(25):7480-7483 (1981).
Feldman, B.J. et al., “Electron Transfer Kinetics at Redox Polymer/Solution Interfaces Using
Microelectrodes and Twin Electrode Thin Layer Cells”, J. Electroanal. Chem., 194(1):63-81
(Oct. 10, 1985).
Fischer, H. et al., “Intramolecular Electron Transfer Mediated by 4,4′-Bipyridine and Related
Bridging Groups”, J. Am. Chem. Soc. 98(18):5512-5517 (Sep. 1, 1976).
Foulds, N.C. et al., “Enzyme Entrapment in Electrically Conducting Polymers,” J. Chem. Soc.
Faraday Trans I., 82:1259-1264 (1986).
Foulds, N.C. et al., “Immobilization of Glucose Oxidase in Ferrocene-Modified Pyrrole
Polymers,” Anal. Chem., 60(22):2473-2478 (Nov. 15, 1988).
Frew, J.E. et al., “Electron-Transfer Biosensors”, Phil Trans. R. Soc. Lond., B316:95-106 (1987).
Gorton, L. et al., “Selective detection in flow analysis based on the combination of immbolized
enzymes and chemically modified electrodes,” Analytica Chimica Acta., 250:203-248 (1991).
Gregg, B. A. et al., “Cross-Linked Redox Gels Containing Glucose Oxidase for Amperometric
Biosensor Applications,” Analytical Chemistry, 62(3):258-263 (Feb. 1, 1990).
Gregg, B. A. et al., “Redox Polymer Films Containing Enzymes. 1. A Redox-Conducting Epoxy
Cement: Synthesis, Characterization, and Electrocatalytic Oxidation of Hydroquinone,” J. Phys.
Chem., 95(15):5970-5975 (1991).
Hale, P.D. et al., “A New Class of Amperometric Biosensor Incorporating a Polymeric Electron-
Transfer Mediator,” J. Am. Chem. Soc., 111(9):3482-3484 (1989).
Harrison, D.J. et al., “Characterization of Perfluorosulfonic Acid Polymer Coated Enzyme
Electrodes and a Miniaturized Integrated Potentiostat for Glucose Analysis in Whole Blood”,
Anal. Chem., 60(19):2002-2007 (Oct. 1, 1988).
Hawkridge, F. M. et al., “Indirect Coulometric Titration of Biological Electron Transport
Components,” Analytical Chemistry, 45(7):1021-1027 (Jun. 1973).
Heller, A., “Amperometric biosensors based on three-dimensional hydrogel-forming epoxy
networks,” Sensors and Actuators B, 13-14:180-183 (1993).
Heller, A., “Electrical Connection of Enzyme Redox Centers to Electrodes,” J. Phys. Chem.,
96(9):3579-3587 (1992).
Heller, A., “Electrical Wiring of Redox Enzymes,” Acc. Chem. Res., 23(5):129-134 (1990).
Ianniello, R.M. et al., “Immobilized Enzyme Chemically Modified Electrode as an
Amperometric Sensor”, Anal. Chem., 53(13):2090-2095 (Nov. 1981).
Ianniello, R.M. et al., “Differential Pulse Voltammetric Study of Direct Electron Transfer in
Glucose Oxidase Chemically Modified Graphite Electrodes”, Anal. Chem., 54:(7):1098-1101
(Jun. 1981).
Ikeda, T. et al., “Glucose oxidase-immbolized benzoquinone-carbon paste electrode as a glucose

Page 89 of 109
sensor,” Agric. Biol. Chem., 49(2) (1 page—Abstract only) (1985).
Ikeda, T. et al., “Kinetics of Outer-Sphere Electron Transfers Between Metal Complexes in
Solutions and Polymeric Films on Modified Electrodes” J. Am. Chem. Soc., 103(25):7422-7425
(Dec. 16, 1981).
Johnson, J. M. et al., “Potential-Dependent Enzymatic Activity in an Enzyme Thin-Layer Cell,”
Anal. Chem. 54:1377-1383 (1982).
Johnson, K.W., “Reproducible Electrodeposition of Biomolecules for the Fabrication of
Miniature Electroenzymatic Biosensors”, Sensors and Actuators B Chemical, B5:85-89 (1991).
Jönsson, G. et al., “An Amperometric Glucose Sensor Made by Modification of a Graphite
Electrode Surface With Immbolized Glucose Oxidase and Adsorbed Mediator”, Biosensors,
1:355-368 (1985).
Josowicz, M. et al., “Electrochemical Pretreatment of Thin Film Platinum Electrodes”, J.
Elecrochem. Soc., 135(1):112-115 (Jan. 1988).
Katakis, I. et al., “Electrostatic Control of the Electron Transfer Enabling Binding of
Recombinant Glucose Oxidase and Redox Polyelectrolytes,” J. Am. Chem. Soc., 116(8):3617-
3618 (1994).
Katakis, I. et al., “L-α-Glycerophosphate and L-Lactate Electrodes Based on the Electrochemical
“Wiring” of Oxidases,” Analytical Chemistry, 64(9):1008-1013 (May 1, 1992).
Kenausis, G. et al., “Wiring of glucose oxidase and lactate oxidase within a hydrogel made with
poly(vinyl pyridine) complexed with [Os(4,4′-dimethoxy-2,2′-bipyridine)2CI]+/2+,” J. Chem.
Soc. Faraday Trans., 92(20):4131-4136 (1996).
Koudelka, M. et al., “In-Vivo Behaviour of Hypodermically Implanted Microfabricated Glucose
Sensors”, Biosensors & Bioelectronics, 6(1):31-36 (1991).
Kulys, J. et al., “Mediatorless peroxidase electrode and preparation of bienzyme sensors,”
Bioelectrochemistry and Bioenergetics, 24:305-311 (1990).
Lager, W. et al., “Implantable Electrocatalytic Glucose Sensor,” Horm. Metab. Res., 26:526-530
(Nov. 1994).
Lindner, E. et al. “Flexible (Kapton-Based) Microsensor Arrays of High Stability for
Cardiovascular Applications”, J. Chem. Soc.Faraday Trans., 89(2):361-367 (Jan. 21, 1993).
Maidan, R. et al., “Elimination of Electrooxidizable Interferant-Produced Currents in
Amperometric Biosensors,” Analytical Chemistry, 64(23);2889-2896 (Dec. 1, 1992).
Mastrototaro, J.J. et al., “An Electroenzymatic Glucose Sensor Fabricated on a Flexible
Substrate”, Sensors and Biosensors B Chemical, B5:139-144 (1991).
McNeil, C. J. et al., “Thermostable Reduced Nicotinamide Adenine Dinucleotide Oxidase:
Application to Amperometric Enzyme Assay,” Anal. Chem., 61(1):25-29 (Jan. 1, 1989).
Miyawaki, O. et al., “Electrochemical and Glucose Oxidase Coenzyme Activity of Flavin
Adenine Dinucleotide Covalently Attached to Glassy Carbon at the Adenine Amino Group”,
Biochimica et Biophysica Acta, 838:60-68 (1985).
Moatti-Sirat, D. et al., “Evaluating in vitro and in vivo the interference of ascorbate and
acetaminophen on glucose detection by a needle-type glucose sensor,” Biosensors &
Bioelectronics, 7(5):345-352 (1992).
Moatti-Sirat, D. et al., “Reduction of acetaminophen interference in glucose sensors by a
composite Nafion membrane: demonstration in rats and man,” Diabetologica, 37(6) (1 page—
Abstract only) (Jun. 1994).
Moatti-Sirat, D. et al., “Towards continuous glucose monitoring: in vivo evaluation of a
miniaturized glucose sensor implanted for several days in rat subcutaneous tissue,” Diabetologia,

Page 90 of 109
35(3) (1 page—Abstract only) (Mar. 1992).
Nagy, G. et al., “A New Type of Enzyme Electrode: The Ascorbic Acid Eliminator Electrode,”
Life Sciences, 31(23):2611-2616 (1982).
Nakamura, S. et al., “Effect of Periodate Oxidation on the Structure and Properties of Glucose
Oxidase,” Biochimica et Biophysica Acta., 445:294-308 (1976).
Narazimhan, K. et al., “p-Benzoquinone activation of metal oxide electrodes for attachment of
enzymes,” Enzyme Microb. Technol., 7(6) (1 page—Abstract only) (1985).
Ohara, T.J. et al., “Glucose Electrodes Based on Cross-Linked [Os(bpy)2Cl]+/2+ Complexed
Poly(I-vinylimadazole) Films,” Analytical Chemistry, 65(23):3512-3516 (Dec. 1, 1993).
Ohara, T.J., “Osmium Bipyridyl Redox Polymers Used in Enzyme Electrodes,” Platinum Metals
Rev., 39(2):54-62 (Apr. 1995).
Ohara, T. J. et al., ““Wired” Enzyme Electrodes for Amperometric Determination of Glucose of
Lactate in the Presence of Interfering Substances,” Analytical Chemistry, 66(15):2451-2457
(Aug. 1, 1994).
Olievier, C. N. et al., “In vivo Measurement of Carbon Dioxide Tension with a Miniature
Electrode,” Pflugers Arch. 373:269-272 (1978).
Paddock, R. et al., “Electrocatalytic reduction of hydrogen peroxide via direct electron transfer
from pyrolytic graphite electrodes to irreversibly adsorbed cytochrome c peroxidase,” J.
Electroanal. Chem. 260:487-494 (1989).
Palleschi, G. et al., “A Study of Interferences in Glucose Measurements in Blood by Hydrogen
Peroxide Based Glucose Probes”, Anal. Biochem., 159:114-121 (1986).
Pankratov, I. et al., “Sol-gel derived renewable-surface biosensors,” Journal of Electroanalytical
Chemistry, 393:35-41 (1995).
Pathak, C. P. et al., “Rapid Photopolymerizsation of Immunoprotective Gels in Contact with
Cells and Tissue,” J. Am. Chem. Soc., 114(21):8311-8312 (1992).
Pickup, J., “Developing glucose sensors for in vivo use,” Tibtech, 11: 285-289 (Jul. 1993).
Pickup, J. C. et al., “In vivo molecular sensing in diabetes mellitus: an implantable glucose
sensor with direct electron transfer,” Diabetologia, 32(3):213-217 (1989).
Pickup, J. et al., “Potentially-implantable, amperometric glucose sensors with mediated electron
transfer: improving the operating stability,” Biosensors, 4(2) (1 page—Abstract only) (1989).
Pishko, M.V. et al., “Amperometric Glucose Microelectrodes Prepared Through Immobilization
of Glucose Oxidase in Redox Hydrogels”, Anal. Chem., 63(20):2268-2272 (Oct. 15, 1991).
Poitout, V. et al., “A glucose monitoring system for on line estimation in man of blood glucose
concentration using a miniaturized glucose sensor implanted in the subcutaneous tissue and a
wearable control unit,” Diabetologia, 36(7) (1 page—Abstract only) (Jul. 1993).
Poitout, V. et al., “Calibration in dogs of a subcutaneous miniaturized glucose sensor using a
glucose meter for blood glucose determination,” Biosensors & Bioelectronics, 7:587-592 (1992).
Poitout, V. et al., “In vitro and in vivo evaluation in dogs of a miniaturized glucose sensor,”
ASAIO Transactions, 37(3) (1 page—Abstract only) (Jul.-Sep. 1991).
Pollak, A. et al., “Enzyme Immobilization by Condensation Copolymerization into Cross-Linked
Polyacrylamide Gels,” J. Am. Chem. Soc., 102(20):6324-6336 (1980).
Reach, G. et al., “Can Continuous Glucose Monitoring Be Used for the Treatment of Diabetes?”
Analytical Chemistry, 64(6):381-386 (Mar. 15, 1992).
Rebrin, K. et al., “Automated Feedback Control of Subcutaneous Glucose Concentration in
Diabetic Dogs”, Diabetologia, 32(8):573-576 (Aug. 1989).
Sakakida, M. et al., “Ferrocene-mediate needle-type glucose sensor covered with newly designed

Page 91 of 109
biocompatible membrane,” Sensors and Actuators B, 13-14:319-322 (1993).
Samuels, G. J. et al., “An Electrode-Supported Oxidation Catalyst Based on Ruthenium (IV). pH
“Encapsulation” in a Polymer Film,” J. Am. Chem. Soc., 103(2):307-312 (1981).
Sasso, S.V. et al., “Electropolymerized 1,2-Diaminobenzene as a Means to Prevent Interferences
and Fouling and to Stabilize Immobilized Enzyme in Electrochemical Biosensors”, Anal. Chem.,
62(11):1111-1117 (Jun. 1, 1990).
Scheller, F. et al., “Enzyme electrodes and their application,” Phil. Trans. R. Soc. Lond., B
316:85-94 (1987).
Schmehl, R.H. et al., “The Effect of Redox Site Concentration on the Rate of Mediated
Oxidation of Solution Substrates by a Redox Copolymer Film”, J. Electroanal. Chem., 152:97-
109 (Aug. 25, 1983).
Shichiri, M. et al., “Glycaemic Control in Pancreatetomized Dogs with a Wearable Artificial
Endocrine Pancreas”, Diabetologia, 24(3):179-184 (Mar. 1983).
Sittampalam, G. et al., “Surface-Modified Electrochemical Detector for Liquid
Chromatography”, Anal. Chem., 55(9):1608-1610 (Aug. 1983).
Soegijoko, S. et al., Horm. Metabl. Res., Suppl. Ser, 12 (1 page—Abstract only) (1982).
Sprules, S. D. et al., “Evaluation of a New Disposable Screen-Printed Sensor Strip for the
Measurement of NADH and Its Modificaiton to Produce a Lactate Biosensor Employing
Microliter Volumes,” Electroanalysis, 8(6):539-543 (1996).
Sternberg, F. et al., “Calibration Problems of Subcutaneous Glucosensors when Applied “in-
Situ” in Man,” Horm. metabl. Res. 26:524-525 (1994).
Sternberg, R. et al., “Covalent Enzyme Coupling on Cellulose Acetate Membranes for Glucose
Sensor Development,” Analytical Chemistry, 60(24):2781-2786 (Dec. 15, 1988).
Sternberg, R. et al., “Study and Development of Multilayer Needle-type Enzyme-based Glucose
Microsensors,” Biosensors, 4:27-40 (1988).
Suekane, M., “Immbolization of glucose isomerase,” Zeitschrift für Allgemeine Mikrobiologie,
22(8):565-576 (1982).
Tajima, S. et al., “Simulated Determination of Glucose and 1,5-Anydroglucitol”, Chemical
Abstracts, 111(25):394 111:228556g (Dec. 18, 1989).
Tarasevich, M.R. “Bioelectrocatalysis”, Comprehensive Treatise of Electrochemistry, 10 (Ch.
4):231-295 (1985).
Tatsuma, T. et al., “Enzyme Monolayer- and Bilayer-Modified Tin Oxide Electrodes for the
Determination of Hydrogen Peroxide and Glucose,” Anal. Chem., 61(21):2352-2355 (Nov. 1,
1989).
Taylor, C. et al., “Wiring of glucose oxidase within a hydrogel made with polyvinyl imidazole
complexed with [(Os-4,4′-dimethoxy-2,2′-bipyridine)C1]+/2+,” Journal of Electroanalytical
Chemistry, 396:511-515 (1995).
Trojanowicz, M. et al., “Enzyme Entrapped Polypyrrole Modified Electrode for Flow-Injection
Determination of Glucose,” Biosensors & Bioelectronics, 5:149-156 (1990).
Turner, A.P.F. et al., “Diabetes Mellitus: Biosensors for Research and Management”,
Biosensors, 1:85-115 (1985).
Turner, R. F. B. et al., “A Biocompatible Enzyme Electrode for Continuous in vivo Glucose
Monitoring in Whole Blood,” Sensors and Actuators, B1(1-6):561-564 (Jan. 1990).
Tuzhi, P. et al., “Constant Potential Pretreatment of Carbon Fiber Electrodes for in Vivo
Electrochemistry”, Analytical Letters, 24(6):935-945 (1991).
Umaha, M., “Protein-Modified Electrochemically Active Biomaterial Surface,” U.S. Army

Page 92 of 109
Research Office Report, (12 pages) (Dec. 1988).
Urban, G. et al., “Miniaturized Thin-Film Biosensors Using Covalently Immobilized Glucose
Oxidase” Biosensors & Bioelectronics, 6(7):555-562 (1991).
Velho, G. et al., “In Vitro and In Vivo Stability of Electrode Potentials in Needle-Type Glucose
Sensors”, Diabetes, 38(2):164-171 (Feb. 1989).
Velho, G. et al., “Strategies for calibrating a subcutaneous glucose sensor,” Biomed. Biochim.
Acta, 48(11/12):957-964 (1989).
Von Woedtke, T. et al., “In Situ Calibration of Implanted Electrochemical Glucose Sensors,”
Biomed. Biochim. Acta, 48(11/12):943-952 (1989).
Vreeke, M. S. et al., “Chapter 15: Hydrogen Peroxide Electrodes Based on Electrical Connection
of Redox Centers of Various Peroxidases to Electrodes through a Three-Dimensional Electron-
Relaying Polymer Network,” Diagnostic Biosensor Polymers. 7 pgs. (Jul. 26, 1993).
Vreeke, M. et al., “Hydrogen Peroxide and β-Nicotinamide Adenine Dinucleotide Sensing
Amperometric Electrodes Based on Electrical Connection of Horseradish Peroxidase Redox
Centers to Electrodes through a Three-Dimensional Electron Relaying Polymer Network,”
Analytical Chemistry, 64(24):3084-3090 (Dec. 15, 1992).
Wang, J. et al., “Activation of Glassy Carbon Electrodes by Alternating Current Electrochemical
Treatment”, Analytica Chimica Acta, 167:325-334 (Jan. 1985).
Wang, J. et al., “Amperometric biosensing of organic peroxides with peroxidase-modified
electrodes,” Analytica Chimica Acta. 254:81-88 (1991).
Wang, D. L. et al., “Miniaturized Flexible Amperometric Lactate Probe,” Analytical Chemistry,
65(8):1069-1073 (Apr. 15, 1993).
Wang, J. et al., “Screen-Printable Sol-Gel Enzyme-Containing Carbon Inks,” Analytical
Chemistry, 68(15):2705-2708 (Aug. 1, 1996).
Wang, J. et al., “Sol-Gel-Derived Metal-Dispersed Carbon Composite Amperometric
Biosensors,” Electroanalysis, 9(1):52-55 (1997).
Williams, D.L. et al., “Electrochemical-Enzymatic Analysis of Blood Glucose and Lactate”,
Anal. Chem., 42(1):118-121 (Jan. 1970).
Wilson, G. S. et al., “Progress toward the Development of an Implantable Sensor for Glucose,”
Chemical Chemistry, 38(9):1613-1617 (1992).
Yabuki, S. et al., “Electro-conductive Enzyme Membrane,” J. Chem. Soc. Chem. Commun.,
945-946 (1989).
Yang, L. et al., “Determination of Oxidase Enzyme Substrate Using Cross-Flow Thin-Layer
Amperometry,” Electroanalysis, 8(8-9):716-721 (1996).
Yao, S.J. et al., “The Interference of Ascorbate and Urea in Low-Potential Electrochemical
Glucose Sensing”, Proceedings of the Twelfth Annual International Conference of the IEEE
Engineering in Medicine and Biology Society, 12(2):487-489 (Nov. 1-4, 1990).
Yao, T. et al., “A Chemically-Modified Enzyme Membrane Electrode As An Amperometric
Glucose Sensor,” Analytica Chimica Acta., 148:27-33 (1983).
Ye, L. et al., “High Current Density “Wired” Quinoprotein Glucose Dehydrogenase Electrode,”
Anal. Chem., 65(3):238-241 (Feb. 1, 1993).
Yildiz, A. et al., “Evaluation of an Improved Thin-Layer Electrode,” Analytical Chemistry,
40(70):1018-1024 (Jun. 1968).
Zarnzow, K. et al., New Wearable Continuous Blood Glucose Monitor (BGM) and Artificial
Pancreas (AP), Diabetes, 39-5A(20) (May 1990).
Zhang, Y. et al., “Application of cell culture toxicity tests to the development of implantable

Page 93 of 109
biosensors,” Biosensors & Bioelectronics, 6:653-661 (1991).
Zhang, Y. et al., “Elimination of the Acetaminophen Interference in an Implantable Glucose
Sensor,” Anal. Chem. 66:1183-1188 (1994).
Serotonin (5-HT) released by activated white blood cells in a biological fuel cell provide a potential energy source for electricity generation Justin, Gusphyl A. Sun, Mingui Zhang, Yingze Cui, X. Tracy Sclabassi, Robert Student Member, IEEE, Department of Bioengineering, University of Pittsburgh, Pittsburgh, PA 15261, USA. email: [email protected];
This paper appears in: Engineering in Medicine and Biology Society, 2006. EMBS '06. 28th Annual International
Conference of the IEEE
Publication Date: Aug. 30 2006-Sept. 3 2006
On page(s): 4115-4118
Location: New York, NY,
ISSN: 1557-170X
ISBN: 1-4244-0032-5
Digital Object Identifier: 10.1109/IEMBS.2006.259280
Current Version Published: 2008-03-05
Abstract
Previous studies by our group have demonstrated the ability of white blood cells to generate small electrical currents, on the
order of 1 - 3¿A/cm2, when placed at the anode compartment of a proton exchange membrane (PEM) biological fuel cell.
In this research study, an electrochemical technique is used to further investigate the electron transfer ability of activated
white blood cells at interfacing electrodes in an attempt to elucidate the mechanism of electron transfer in the original
biological fuel cell experiments. Cyclic voltammograms were obtained for human white blood cells using a three-electrode
system. The working and counter electrodes were made from carbon felt and platinum, respectively, while the reference was
a saturated calomel electrode (SCE). Oxidation peaks were observed at an average potential of 363 mV vs. SCE for the
PMA/ionomycin activated white blood cells in glucose solution. However a corresponding reduction peak was not observed,
suggesting irreversibility of the redox reaction. The cyclic voltammograms recorded for the white blood cells bear very close
similarities to those of the neurotransmitter serotonin (5-HT). Serotonin released by white blood cells into the extracellular
environment may be irreversibly oxidized at the working electrode in the cyclic voltammetry experiments and at the PEM
biological fuel cell anode in our earlier electrochemical cell studies.
Other References
Abel, P. U.; von Woedtke, T. Biosensors for in vivo glucose measurement: can we cross
the experimental stage. Biosens Bioelectron 2002, 17, 1059-1070.
Armour, et al., Application of Chronic Intravascular Blood Glucose Sensor in Dogs, ,
Diabetes, vol. 39, Dec. 1990 pp. 1519-1526.
Asberg, et al., Hydrogels of a Conducting Conjugated Polymer as 3-D Enzyme Electrode,
Biosensors Bioelectronics, pp. 199-207 (2003).
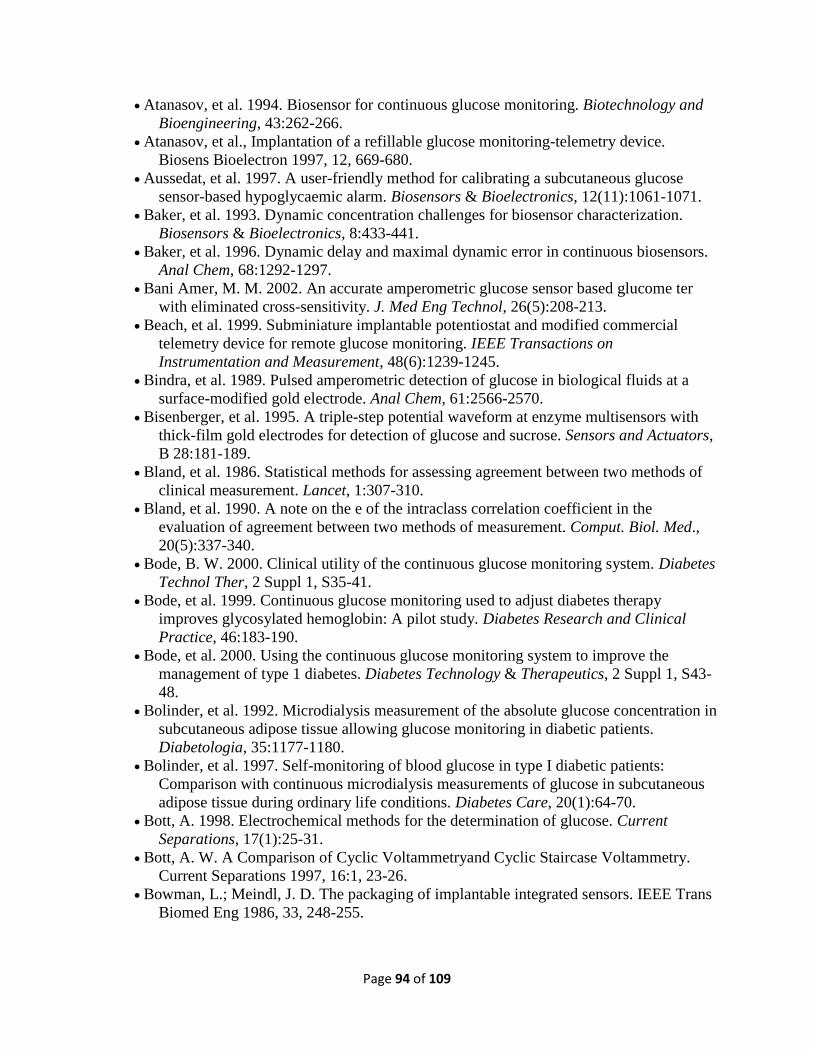
Page 94 of 109
Atanasov, et al. 1994. Biosensor for continuous glucose monitoring. Biotechnology and
Bioengineering, 43:262-266.
Atanasov, et al., Implantation of a refillable glucose monitoring-telemetry device.
Biosens Bioelectron 1997, 12, 669-680.
Aussedat, et al. 1997. A user-friendly method for calibrating a subcutaneous glucose
sensor-based hypoglycaemic alarm. Biosensors & Bioelectronics, 12(11):1061-1071.
Baker, et al. 1993. Dynamic concentration challenges for biosensor characterization.
Biosensors & Bioelectronics, 8:433-441.
Baker, et al. 1996. Dynamic delay and maximal dynamic error in continuous biosensors.
Anal Chem, 68:1292-1297.
Bani Amer, M. M. 2002. An accurate amperometric glucose sensor based glucome ter
with eliminated cross-sensitivity. J. Med Eng Technol, 26(5):208-213.
Beach, et al. 1999. Subminiature implantable potentiostat and modified commercial
telemetry device for remote glucose monitoring. IEEE Transactions on
Instrumentation and Measurement, 48(6):1239-1245.
Bindra, et al. 1989. Pulsed amperometric detection of glucose in biological fluids at a
surface-modified gold electrode. Anal Chem, 61:2566-2570.
Bisenberger, et al. 1995. A triple-step potential waveform at enzyme multisensors with
thick-film gold electrodes for detection of glucose and sucrose. Sensors and Actuators,
B 28:181-189.
Bland, et al. 1986. Statistical methods for assessing agreement between two methods of
clinical measurement. Lancet, 1:307-310.
Bland, et al. 1990. A note on the e of the intraclass correlation coefficient in the
evaluation of agreement between two methods of measurement. Comput. Biol. Med.,
20(5):337-340.
Bode, B. W. 2000. Clinical utility of the continuous glucose monitoring system. Diabetes
Technol Ther, 2 Suppl 1, S35-41.
Bode, et al. 1999. Continuous glucose monitoring used to adjust diabetes therapy
improves glycosylated hemoglobin: A pilot study. Diabetes Research and Clinical
Practice, 46:183-190.
Bode, et al. 2000. Using the continuous glucose monitoring system to improve the
management of type 1 diabetes. Diabetes Technology & Therapeutics, 2 Suppl 1, S43-
48.
Bolinder, et al. 1992. Microdialysis measurement of the absolute glucose concentration in
subcutaneous adipose tissue allowing glucose monitoring in diabetic patients.
Diabetologia, 35:1177-1180.
Bolinder, et al. 1997. Self-monitoring of blood glucose in type I diabetic patients:
Comparison with continuous microdialysis measurements of glucose in subcutaneous
adipose tissue during ordinary life conditions. Diabetes Care, 20(1):64-70.
Bott, A. 1998. Electrochemical methods for the determination of glucose. Current
Separations, 17(1):25-31.
Bott, A. W. A Comparison of Cyclic Voltammetryand Cyclic Staircase Voltammetry.
Current Separations 1997, 16:1, 23-26.
Bowman, L.; Meindl, J. D. The packaging of implantable integrated sensors. IEEE Trans
Biomed Eng 1986, 33, 248-255.

Page 95 of 109
Brauker, et al. Sustained expression of high levels of human factor IX from human cells
implanted within an immunoisolation device into athymic rodents. Hum Gene Ther
1998, 9, 879-888.
Bremer, et al. 1999. Is blood glucose predictable from previous values? A solicitation for
data. Diabetes, 48:445-451.
Bremer, et al. 2001. Benchmark data from the literature for evaluation of new glucose
sensing technologies. Diabetes Technology & Therapeutics, 3:409-418.
Cai, et al., A wireless, remote query glucose biosensor based on a pH-sensitive polymer.
Anal Chem 2004, 76, 4038-4043.
Chen, et al. 2002. Defining the period of recovery of the glucose concentration after its
local perturbation by the implantation of a miniature sensor. Clin. Chem. Lab. Med.,
40:786-789.
Chia, C. W.; Saudek, C. D. Glucose sensors: toward closed loop insulin delivery.
Endocrinol Metab Clin North Am 2004, 33, 175-95, xi.
Choleau, et al. 2002. Calibration of a subcutaneous amperometric glucose sensor
implanted for 7 days in diabetic patients. Part 2. Superiority of the one-point
calibration method. Biosensors and Bioelectronics, 17:647-654.
Choleau, et al. 2002. Calibration of a subcutaneous amperometric glucose sensor. Part 1.
Effect of measurement uncertainties on the determination of sensor sensitivity and
background current. Biosensors and Bioelectronics, 17:641-646.
Clarke et al., “Evaluating Clinical Accuracy of Systems for Self-Monitoring of Blood
Glucose,” Diabetes Care, vol. 10, No. 5, pp. 622-628, (Sep.-Oct. 1987).
Cox, et al., Accuracy of perceiving blood glucose in IDDM. Diabetes Care 1985, 8, 529-
536.
Csöregi, et al. 1994. Amperometric microbiosensors for detection of hydroen peroxide
and glucose based on peroxidase-modified carbon fibers. Electroanalysis, 6:925-933.
Dai, et al., Hydrogel Membranes with Mesh Size Asymmetry Based on the Gradient
Crosslink of Poly(vinyl alcohol), Journal of Membrane Science 156 (1999) 67-79.
D'Arrigo, et al. Poro -Si based bioreactors for glucose monitoring and drugs production.
Proc. of SPIE 2003, 4982, 178-184.
Dixon, et al. 2002. Characterization in vitro and in vivo of the oxygen dependence of an
enzyme/polymer biosensor for monitoring brain glucose. Journal of Neuroscience
Methods, 119:135-142.
El-Sa'ad, et al. Moisture Absorption by Epoxy Resins: the Reverse Thermal Effect.
Journal of Materials Science 1990, 25, 3577-3582.
Ernst, et al. 2002. Reliable glucose monitoring through the use of microsystem
technology. Anal. Bioanal. Chem., 373:758-761.
Fare, et al. 1998. Functional characterization of a conducting polymer-based
immunoassay system. Biosensors & Bioelectronics, 13(3-4):459-470.
Feldman, et al. A continuous glucose sensor based on wired enzyme technology—results
from a 3-day trial in patients with type 1 diabetes. Diabetes Technol Ther 2003, 5, 769-
779.
Fraser, et al. Biosensors in the Body, Continous in Vivo Monitoring, Wiley Series of
Biomaterials Science and Engineering, 1997, Chapter 4, Principles of Long-term Fully
Implantable Sensors with Emphasis on Radiotelemetric Monitoring of Blood Glucose
from inside a Subcutaneous Foreign Body Capsule pp. 118-137.

Page 96 of 109
Frost, et al. 2002. Implantable chemical sensors for real-time clinical monitoring:
Progress and challenges. Current Opinion in Chemical Biology, 6:633-641.
Garg, et al. 1999. Correlation of fingerstick blood glucose measurements with
GlucoWatch biographer glucose results in young subjects with type 1 diabetes.
Diabetes Care, 22(10):1708-1714.
Garg, et al., Improved Glucose Excursions Using an Implantable Real-Time Continuous
Glucose Sensor in Adults with Type I Diabetes. Diabetes Care 2004, 27, 734-738.
Geller, et al. use of an immunoisolation device for cell transplantation and tumor
immunotherapy. Ann NY Acad Sci 1997, 831, 438-451.
Gerritsen, et al. Influence of inflammatory cells and serum on the performance of
implantable glucose sensors. J Biomed Mater Res 2001, 54, 69-75.
Gerritsen, et al. 1999. Performance of subcutaneously implanted glucose sensors for
continuous monitoring. The Netherlands Journal of Medicine, 54:167-179.
Gerritsen, M. 2000. Problems associated with subcutaneously implanted glucose sensors.
Diabetes Care, 23(2):143-145.
Gilligan, et al. 1994. Evaluation of a subcutaneous glucose sensor out to 3 months in a
dog model. Diabetes Care, 17(8):882-887.
Gilligan, et al. Feasibility of continuo long-term glucose monitoring from a subcutaneous
glucose sensor in humans. Diabetes Technol Ther 2004, 6, 378-386.
Godsland, et al., Maximizing the Success Rate of Minimal Model Insulin Sensivity
Mearsurement in Humans: The Importance of Basal Glucose Levels, , The
Biochemical Society and the Medical Research Society, (2001) 1-9.
Gough, et al. 2000. Immobilized glucose oxidase in implantable glucose sensor
technology. Diabetes Technology & Therapeutics, 2(3):377-380.
Gregg, et al. Cross-Linked Redox Gels Containing Glucose Oxidase for Amperometric
Biosensor Applications, Anal. Chem. (1990) 62, 258-263.
Gross, et al. 2000. Efficacy and reliability of the continuous glucose monitoring system.
Diabetes Technology & Therapeutics, 2 Suppl 1, S19-26.
Gross, et al. 2000. Performance evaluation of the MiniMed® continuous glucose monitoring
system during patient home use. Diabetes Technology & Therapeutics, 2(1):49-56.
Gross, T., “Letters to the Editor Re: Diabetes Technology & Therapeutics, 2000;2:49-
56,” vol. 3, No. 1, p. 130-131, 2001.
Hall, et al. 1998. Electrochemical oxidation of hydrogen peroxide at platinum electrodes.
Part. 1. An adsorption-controlled mechanism. Electrochimica Acta, 54(5-6):579-588.
Hall, et al. 1998. Electrochemical oxidation of hydrogen peroxide at platinum electrodes.
Part II: Effect of potential. Electrochimica Acta, 43(14-15):2015-2024.
Hall, et al. 1999. Electrochemical oxidation of hydrogen peroxide at platinum electrodes.
Part III: Effect of temperature. Electrochimica Acta, 44:2455-2462.
Hall, et al. 1999. Electrochemical oxidation of hydrogen peroxide at platinum electrodes.
Part IV: Phosphate buffer dependence. Electrochimica Acta, 44:4573-4582.
Hall, et al. 2000. Electrochemical oxidation of hydrogen peroxide at platinum electrodes.
Part V: Inhibition by chloride. Electrochimica Acta, 45:3573-3579.
Heise, et al. 2003. Hypoglycemia warning signal and glucose sensors: Requirements and
concepts. Diabetes Technology & Therapeutics, 5:563-571.
Heller, A. Implanted electrochemical glucose sensors for the management of diabetes.
Annu Rev Biomed Eng 1999, 1, 153-175.

Page 97 of 109
Heller, A. Plugging metal connectors into enzymes. Nat Biotechnol 2003, 21, 631-2.
Heller, A. Electrical Connection of Enzyme Redox Centers to Electrodes, J. Phys. Chem.
1992, 96, pp. 3579-3587.
Hitchman, M. L. 1978. “Measurement of Dissolved Oxygen.” In Elving, et al. (Eds.).
Chemical Analysis, vol. 49, Chap. 3, pp. 34-49, 59-123. New York: John Wiley &
Sons.
Hrapovic, S.; Luong, J. H. Picoamperometric detection of glucose at ultrasmall platinum-
based biosensors: preparation and characterization. Anal Chem 2003, 75, 3308-3315.
Huang, C., O'Grady, W.E.; Yeager, E. Electrochemical Generation of Oxygen. 1: The
Effects of Anions and Cations on Hydrogen Chemisorption and Aniodic Oxide Film
Formation on Platinum Electrode. 2: The Effects of Anions and Cations on Oxygen
Generation on Platinum Electrode, pp. 1-116, Aug. 1975.
Hunter, et al., Minimally Invasive Glucose Sensor and Insulin Delivery System. MIT
Home Automation and Healthcare Consortium 2000.
Ishikawa, et al. 1998. Initial evaluation of a 290-μm diameter subcutaneous glucose
sensor: Glucose monitoring with a biocompatible, flexible-wire, enzyme-based
amperometric microsensor in diabetic and nondiabetic humans. Journal of Diabetes
and Its Complications, 12:295-301.
Jablecki, et al. 2000. Simulations of the frequency response of implantable glucose
sensors. Analytical Chemistry, 72:1853-1859.
Jaremko, et al. 1998. Advances toward the implantable artificial pancreas for treatment of
diabetes. Diabetes Care, 21(3):444-450.
Jensen, et al. 1997. Fast wave forms for pulsed electrochemical detection of glucose by
incorporation of reductive desorption of oxidation products. Analytical Chemistry,
69(9):1776-1781.
Jeutter, D. C. A transcutaneous implanted battery recharging and biotelemeter power
switching system. IEEE Trans Biomed Eng 1982, 29, 314-321.
Johnson, et al. 1992. In vivo evaluation of an electroenzymatic glucose sensor implanted
in subcutaneous tissue. Biosensors & Bioelectronics, 7:709-714.
Jovanovic, L. 2000. The role of continuous glucose monitoring in gestational diabetes
mellitus. Diabetes Technology & Therapeutics, 2 Suppl 1, S67-71.
Kang, S. K.; Jeong, R. A.; Park, S.; Chung, T. D.; Park, S.; Kim, H. C. In vitro and short-
term in vivo characteristics of a Kel-F thin film modified glucose sensor. Anal Sci
2003, 19, 1481-1486.
Kargol, et al. Studies on the structural properties of porous membranes: measurement of
linear dimensions of solutes. Biophys Chem 2001, 91, 263-271.
Kaufman, F. R. 2000. Role of the continuous glucose monitoring system in pediatric
patients. Diabetes Technology & Therapeutics, 2 Suppl 1, S49-52.
Kerner, W. 2001. Implantable glucose sensors: Present status and future developments.
Exp. Clin. Endocrinol. Diabetes, 109 Suppl 2, S341-346.
Koschinsky, et al. 2001. Sensors for glucose monitoring: Technical and clinical aspects.
Diabetes Metab. Res. Rev., 17:113-123.
Kovatchev, et al., “Evaluating the accuracy of continuous glucose-monitoring sensors:
continuous glucose-error grid analysis illustrated by TheraSense Freestyle Navigator
data”, Diabetes Care, vol. 27, No. 8, 1922-1928, (Aug. 2004).

Page 98 of 109
Kraver, K.; Guthanus, M. R.; Strong, T.; Bird, P.; Cha, G.; Hoeld, W.; Brown, R. A
mixed-signal sensor interface microinstrument. Sensors and Actuators A: Physical
2001, 91, 266-277.
Krouwer, J. S. 2002. Setting performance goals and evaluating total analytical error for
diagnostic assays. Clinical Chemistry, 48(6):919-927.
Kruger, et al. 2000. Psychological motivation and patient education: A role for
continuous glucose monitoring. Diabetes Technology & Therapeutics, 2 Suppl 1, S93-
97.
Kurnik, et al. 1999. Application of the mixtures of experts algorithm for signal processing
in a noninvasive glucose monitoring system. Sensors and Actuators, B 60:19-26.
Lacourse, et al. 1993. Optimization of waveforms for pulsed amperometric detection of
carbohydrates based on pulsed voltammetry. Analytical Chemistry, 65:50-52.
Lee, et al. Effects of pore size, void volume, and pore connectivity on tissue responses.
Society for Biomaterials 1999, 25th
Annual Meeting, 171.
Lerner, et al. 1984. An implantable electrochemical glucose sensor. Ann. N. Y. Acad. Sci.,
428:263-278.
Leypoldt, et al. 1984. Model of a two-substrate enzyme electrode for glucose. Anal.
Chem., 56:2896-2904.
Luong, et al., Solubilization of Multiwall Carbon Nanotubes by 3-
Aminopropyltriethoxysilane Towards the Fabrication of Electrochemical Biosensors
with Promoted Elecron Transfer, Electroanalysis 16 No. 1-2, pp. 132-139. (2004).
Lynch, et al. 2001. Estimation-based model predictive control of blood glucose in type I
diabetics: A simulation study. Proceedings of the IEEE 27th Annual Northeast
Bioengineering Conference, pp. 79-80.
Lynn, P. A. 1971. Recursive digital filters for biological signals. Med. & Biol. Engng.,
9:37-43.
Makale, et al. 2003. Tissue window chamber system for validation of implanted oxygen
sensors. Am. J. Physiol. Heart Circ. Physiol., 284:H2288-2294.
Malin, et al. Noninvasive Prediction of Glucose by Near-Infrared Diffuse Reflectance
Spectroscopy. Clinical Chemistry, 45:9, 1651-1658, 1999.
Mancy, et al. 1962. A galvanic cell oxygen analyzer. Journal of Electroanalytical
Chemistry, 4:65-92.
Maran, et al. 2002. Continuous subcutaneous glucose monitoring in diabetic patients: A
multicenter analysis. Diabetes Care, 25(2):347-352.
March, W. F. Dealing with the delay. Diabetes Technol Ther 2002, 4, 49-50.
Martin, R. F. 2000. General Deming regression for estimating systematic bias and its
confidence interval in method-comparison studies. Clinical Chemistry, 46(1):100-104.
Mastrototaro, et al. 2003. Reproducibility of the continuous glucose monitoring system
matches previous reports and the intended use of the product. Diabetes Care, 26:256;
author reply 257.
Mastrototaro, J. J. The MiniMed continuous glucose monitoring system. Diabetes
Technol Ther 2000, 2 Suppl 1, S13-8.
McCartney, et al., Near-infrared fluorescence lifetime assay for serum glucose based on
allophycocyanin-labeled concanavalin A. Anal Biochem 2001, 292, 216-221.

Page 99 of 109
McGrath, et al. The use of differential measurements with a glucose biosensor for
interference compensation during glucose determinations by flow injection analysis.
Biosens Bioelectron 1995, 10, 937-943.
McKean, et al. A Telemetry Instrumentation System for Chronically Implanted Glucose
and Oxygen Sensors, Transactions on Biomedical Engineering vol. 35, No. 7 Jul. 1988
pp. 526-532.
Memoli, et al. A comparison between different immobilised glucoseoxidase-based
electrodes. J Pharm Biomed Anal 2002, 29, 1045-1052.
Metzger, et al. 2002. Reproducibility of glucose measurements using the glucose sensor.
Diabetes Care, 25(6):1185-1191.
Miller, A. Human monocyte/macrophage activation and interleukin 1 generation by
biomedical polymers. J Biomed Mater Res 1988, 23, 713-731.
Miller, et al. Generation of IL-1 like activity in response to biomedical polymer implants:
a comparison of in vitro and in vivo models, J Biomed Mater Res 1989, 23, 1007-1026.
Miller, et al. In vitro stimulation of fibroblast activity by factors generated from human
monocytes activated by biomedical polymers. Journal of J Biomed Mater Res 1989,
23, 911-930.
Moatti-Sirat, et al., Towards continuous glucose monitoring: in vivo evaluation of a
miniaturized glucose sensor implanted for several days in rat subcutaneous tissue.
Diabetologia 1992, 35, 224-230.
Monsod, et al. 2002. Do sensor glucose levels accurately predict plasma glucose
concentrations during hypoglycemia and hyperinsulinemia? Diabetes Care, 25(5):889-
893.
Moussy, et al. 1994. A miniaturized Nafion-based glucose sensor: In vitro and in vivo
evaluation in dogs. Int. J. Artif. Organs, 17(2):88-94.
Mowery, et al. Preparation and characterization of hydrophobic polymeric films that are
thromboresistant via nitric oxide release. Biomaterials 2000, 21, 9-21.
Nam, et al. A novel fabrication method of macroporous biodegradable polymer scaffolds
using gas foaming salt as a porogen additive. J Biomed Mater Res 2000, 53, 1-7.
Neuburger, et al. 1987. Pulsed amperometric detection of carbohydrates at gold
electrodes with a two-step potential waveform. Anal. Chem., 59:150-154.
Ohara, T. J.; Rajagopalan, R.; Heller, A. “Wired” enzyme electrodes for amperometric
determination of glucose or lactate in the presence of interfering substances. Anal
Chem 1994, 66, 2451-2457.
Okuda, J.; Miwa, I. Mutarotase effect on micro determinations of D-glucose and its
anomers with—D-glucose oxidase. Anal Biochem 1971, 43, 312-315.
Palmisano, et al. 2000. Simultaneous monitoring of glucose and lactate by an interference
and cross-talk free dual electrode amperometric biosensor based on electropolymerized
thin films. Biosensors & Bioelectronics, 15:531-539.
Panteleon, et al. 2003. The role of the independent variable to glucose sensor calibration.
Diabetes Technology & Therapeutics, 5(3):401-410.
Parker, et al. 1999. A model-based algorithm for blood glucose control in type I diabetic
patients. IEEE Trans. Biomed. Eng., 46(2):148-157.
Patel, H.; Li, X.; Karan, H. I. Amperometric glucose sensors based on ferrocene
containing polymeric electron transfer systems-a preliminary report. Biosens
Bioelectron 2003, 18, 1073-6.

Page 100 of 109
Pichert, J. W.; Campbell, K.; Cox, D. J.; D'Lugin, J. J.; Moffat, J. W.; Polonsky, W. H.;
CN ,—P. o. G. D. P. S. G. Issues for the coming age of continuous glucose monitoring.
Diabetes Educ 2000, 26, 969-980.
Pickup, et al., Responses and Calibration of Amperometric Glucose Sensors Implanted in
the Subcutaneous Tissue of Man, ACTA Diabetol, pp. 143-148. (1993).
Pitzer, et al. 2001. Detection of hypogylcemia with the GlucoWatch biographer. Diabetes
Care, 24(5):881-885.
Poirier, et al. 1998. Clinical and statistical evaluation of self-monitoring blood glucose
meters. Diabetes Care, 21(11):1919-1924.
Poitout, et al. 1993. A glucose monitoring system for on line estimation in man of blood
glucose concentration using a miniaturized glucose sensor implanted in the
subcutaneous tissue and a wearable control unit. Diabetologia, 36:658-663.
Postlethwaite, et al. 1996. Interdigitated array electrode as an alternative to the rotated
ring-disk electrode for determination of the reaction products of dioxygen reduction.
Analytical Chemistry, 68:2951-2958.
Quinn, C. A.; Connor, R. E.; Heller, A. Biocompatible, glucose-permeable hydrogel for
in situ coating of implantable biosensors. Biomaterials 1997, 18, 1665-1670.
Ratner, B.D. Reducing capsular thickness and enhancing angiogenesis around implant
drug release systems. J Control Release 2002, 78, 211-218.
Reach, et al. A Method for Evaluating in vivo the Functional Characteristics of Glucose
Sensors. Biosensors 1986, 2, 211-220.
Reach, G. 2001. Which threshold to detect hypoglycemia? Value of receiver-operator
curve analysis to find a compromise between sensitivity and specificity. Diabetes
Care, 24(5):803-804.
Reach, G., “Letters to the Editor Re: Diabetes Technology & Therapeutics, 2000;2:49-
56,” vol. 3, No. 1, p. 129-130, 2001.
Rebrin, et al. 1999. Subcutaneous glucose predicts plasma glucose independent of
insulin: Implications for continuous monitoring. Am. J. Physiol., 277:E561-71.
Rhodes, et al. 1994. Prediction of pocket-portable and implantable glucose enzyme
electrode performance from combined species permeability and digital simulation
analysis. Analytical Chemistry, 66(9):1520-1529.
Rinken, et al. 1998. Calibration of glucose biosensors by using pre-steady state kinetic
data. Biosensors & Bioelectronics, 13:801-807.
Sakakida, et al. Development of Ferrocene-Mediated Needle-Type Glucose Sensor as a
Measure of True Subcutaneous Tissue Glucose Concentrations, Artif. Organs Today,
vol. 2 No. 2, pp. 145-158 (1992).
Sakakida, et al. Ferrocene-Mediated Needle Type Glucose Sensor Covered with Newly
Designed Biocompatible Membran, Sensors and Actuators B, vol. 13-14, pp. 319-322
(1993).
Sansen, et al. 1985. “Glucose sensor with telemetry system.” In Ko, W. H. (Ed.).
Implantable Sensors for Closed Loop Prosthetic Systems. Chap. 12, pp. 167-175,
Mount Kisco, NY: Futura Publishing Co.
Sansen, et al. 1990. A smart sensor for the voltammetric measurement of oxygen or
glucose concentrations. Sensors and Actuators, B 1:298-302.
Schmidt, et al. 1993. Glucose concentration in subcutaneous extracellular space. Diabetes
Care, 16(5):695-700.

Page 101 of 109
Schmidtke, D. W.; Heller, A. Accuracy of the one-point in vivo calibration of “wired”
glucose oxidase electrodes implanted in jugular veins of rats in periods of rapid rise
and decline of the glucose concentration. Anal Chem 1998, 70, 2149-2155.
Schoemaker, et al. 2003. The SCGM1 system: Subcutaneous continuous glucose
monitoring based on microdialysis technique. Diabetes Technology & Therapeutics,
5(4):599-608.
Selam, J. L. Management of diabetes with glucose sensors and implantable insulin
pumps. From the dream of the 60s to the realities of the 90s. ASAIO J 1997, 43, 137-
142.
Service, R. F. Can sensors make a home in the body? Science 2002, 297, 962-3.
Shichiri, et al. Glycaemic Control in Pancreatectomized Dogs with a Wearable Artificial
Endocrine Pancreas, Diabetologia (1983) 24 pp. 179-184.
Shichiri, et al., Membrane Design For Extending the Long-Life of an Implantable
Glucose Sensor, Diab. Nutr. Metab., 2, pp. 309-313 (1989).
Shichiri, et al., Needle Type Glucose Sensor for Wearable Artificial Endocrine Pancreas,
Implantable Sensors for Closed-Loop Prosthetic Systems, Chapter 15, pp. 197-210.
Shichiri, et al., Telemetry Glucose Monitoring Device with Needle-type Glucose Sensor:
A Useful Tool for Blood Glucose Monitoring in Diabetic Individuals, Diabetes Care, Inc.
Vo. 9, No. 3, 1986 pp. 298-301.
Shichiri,et al. Wearable artificial endocrine pancrease with needle-type glucose sensor.
Lancet 1982, 2, 1129-1131.
Shults, et al. A Telemetry-Instrumentation System for Monitoring Multiple
Subcutaneously Implanted Glucose Sensors, Transactions on Biomedical Engineering
vol. 41, No. 10 Oct. 1994. pp. 937-942.
Sieminski, et al. Biomaterial-microvasculature interactions. Biomaterials 2000, 21, 2233-
2241.
Skyler, J. S. 2000. The economic burden of diabetes and the benefits of improved
glycemic control: The potential role of a continuous glucose monitoring system.
Diabetes Technology & Therapeutics, 2 Suppl 1, S7-12.
Sokolov, et al. 1995. Metrological opportunities of the dynamic mode of operating an
enzyme amperometric biosensor. Med. Eng. Phys., 17(6):471-476.
Sproule, et al. 2002. Fuzzy pharmacology: Theory and applications. Trends in
Pharmacological Sciences, 23(9):412-417.
Sriyudthsak, et al., Enzyme-epoxy membrane based glucose analyzing system and
medical applications. Biosens Bioelectron 1996, 11, 735-742.
Steil, et al. 2003. Determination of plasma glucose during rapid glucose excursions with a
subcutaneous glucose sensor. Diabetes Technology & Therapeutics, 5(1):27-31.
Sternberg, et al. 1996. Does fall in tissue glucose precede fall in blood glucose?
Diabetologia, 39:609-612.
Sternberg, et al. Study and Development of Multilayer Needle-type Enzymebased Glucose
Microsensors, Biosensors vol. 4 pp. 27-40 (1988).
Street, et al. 1988. A note on computing robust regression estimates via iteratively
reweighted least squares. The American Statistician, 42(2):152-154.
Tamura, T., et al., “Preliminary study of continuous glucose monitoring with a
microdialysis technique and a null method—a numerical analysis,” Frontiers Med.
Biol. Engng., 10:2:147-156 (2000).

Page 102 of 109
Tanenberg, et al. 2000. Continuous glucose monitoring system: A new approach to the
diagnosis of diabetic gastroparesis. Diabetes Technology & Therapeutics, 2 Suppl 1,
S73-80.
Tang, et al. Fibrin(ogen) mediates acute inflammatory responses to biomaterials. J Exp
Med 1993, 178, 2147-2156.
Tang, et al. Inflammatory responses to biomaterials. Am J Clin Pathol 1995, 103, 466-
471.
Tang, et al. Mast cells mediate acute inflammatory responses to implanted biomaterials.
Proc Natl Acad Sci U S A 1998, 95, 8841-8846.
Tang, et al. Molecular determinants of acute inflammatory responses to biomaterials. J
Clin Invest 1996, 97, 1329-1334.
Thome-Duret, et al. 1996. Modification of the sensitivity of glucose sensor implanted
into subcutaneous tissue. Diabetes Metabolism, 22:174-178.
Thome-Duret, et al. Continuous glucose monitoring in the free-moving rat. Metabolism
1998, 47, 799-803.
Thompson, et al., In Vivo Probes: Problems and Perspectives, Department of Chemistry,
University of Toronto, Canada, pp. 255-261.
Tibell, et al. Survival of macroencapsulated allogeneic parathyroid tissue one year after
transplantation in nonimmunosuppressed humans. Cell Transplant 2001, 10, 591-9.
Tierney, et al. 2000. The GlucoWatch® biographer: A frequent, automatic and
noninvasive glucose monitor. Ann. Med., 32:632-641.
Tierney, M. J.; Garg, S.; Ackerman, N. R.; Fermi, S. J.; Kennedy, J.; Lopatin, M.; Potts,
R. O.; Tamada, J. A. Effect of acetaminophen on the accuracy of glucose
measurements obtained with the GlucoWatch biographer. Diabetes Technol Ther 2000,
2, 199-207.
Tilbury, et al. 2000. Receiver operating characteristic analysis for intelligent medical
systems—A new approach for finding confidence intervals. IEEE Transactions on
Biomedical Engineering, 47(7):952-963.
Trajanoski, et al. 1998. Neural predictive controller for insulin delivery using the
subcutaneous route. IEEE Transactions on Biomedical Engineering, 45(9):1122-1134.
Trecroci, D. A Glimpse into the Future- Continuous Monitoring of Glucose with a
Microfiber. Diabetes Interview 2002, 42-43.
U.S. Appl. No. 09/447,227, filed Nov. 22, 1999, (See Image File Wrapper).
U.S. Appl. No. 10/632,537, filed Aug. 1, 2003, (See Image File Wrapper).
U.S. Appl. No. 10/633,329, filed Aug. 1, 2003, (See Image File Wrapper).
U.S. Appl. No. 10/633,367, filed Aug. 1, 2003, (See Image File Wrapper).
U.S. Appl. No. 10/633,404, filed Aug. 1, 2003, (See Image File Wrapper).
U.S. Appl. No. 10/646,333, filed Aug. 22, 2003, (See Image File Wrapper).
U.S. Appl. No. 10/647,065, filed Aug. 22, 2003, (See Image File Wrapper).
U.S. Appl. No. 10/648,849, filed Aug. 22, 2003. (See Image File Wrapper).
U.S. Appl. No. 10/695,636, filed Oct. 28, 2003, (See Image File Wrapper).
U.S. Appl. No. 10/789,359, filed Feb. 26, 2004, (See Image File Wrapper).
U.S. Appl. No. 10/838,658, filed May 3, 2004, (See Image File Wrapper).
U.S. Appl. No. 10/838,909, filed May 3, 2004, (See Image File Wrapper).
U.S. Appl. No. 10/838,912, filed May 3, 2004, (See Image File Wrapper).
U.S. Appl. No. 10/842,716, filed May 10, 2004, (See Image File Wrapper).

Page 103 of 109
U.S. Appl. No. 10/846,150, filed May 14, 2004, (See Image File Wrapper).
U.S. Appl. No. 10/885,476, filed Jul. 6, 2004, (See Image File Wrapper).
U.S. Appl. No. 10/896,312, filed Jul. 21, 2004, (See Image File Wrapper).
U.S. Appl. No. 10/896,637, filed Jul. 21, 2004, (See Image File Wrapper).
U.S. Appl. No. 10/896,639, filed Jul. 21, 2004, (See Image File Wrapper).
U.S. Appl. No. 10/896,772, filed Jul. 21, 2004, (See Image File Wrapper).
U.S. Appl. No. 10/897,377, filed Jul. 21, 2004, (See Image File Wrapper).
U.S. Appl. No. 11/077,643, filed Mar. 10, 2005, (See Image File Wrapper).
U.S. Appl. No. 11/077,693, filed Mar. 10, 2005, (See Image File Wrapper).
U.S. Appl. No. 11/077,713, filed Mar. 10, 2005, (See Image File Wrapper).
U.S. Appl. No. 11/077,714, filed Mar. 10, 2005, (See Image File Wrapper).
U.S. Appl. No. 11/077,739, filed Mar. 10, 2005, (See Image File Wrapper).
U.S. Appl. No. 11/077,740, filed Mar. 10, 2005, (See Image File Wrapper).
U.S. Appl. No. 11/077,763, filed Mar. 10, 2005, (See Image File Wrapper).
U.S. Appl. No. 11/077,765, filed Mar. 10, 2005, (See Image File Wrapper).
U.S. Appl. No. 11/077,883, filed Mar. 10, 2005, (See Image File Wrapper).
U.S. Appl. No. 11/078,072, filed Mar. 10, 2005, (See Image File Wrapper).
U.S. Appl. No. 11/078,230, filed Mar. 10, 2005, (See Image File Wrapper).
U.S. Appl. No. 11/078,232, filed Mar. 10, 2005, (See Image File Wrapper).
U.S. Appl. No. 11/157,365, filed Jun. 21, 2005, (See Image File Wrapper).
U.S. Appl. No. 11/157,746, filed Jun. 21, 2005, (See Image File Wrapper).
U.S. Appl. No. 11/158,227, filed Jun. 21, 2005, (See Image File Wrapper).
U.S. Appl. No. 11/201,445, filed Aug. 10, 2005, (See Image File Wrapper).
Updike et al. 1994. Improved long-term performance in vitro and in vivo. ASAIO
Journal, 40(2):157-163.
Updike et al. 1997. Principles of long-term fully implanted sensors with emphasis on
radiotelemtric monitoring of blood glucose from inside a subcutaneous foreign body
capsule (FBC). In Fraser, D. M. (Ed.). Biosensors in the Body: Continuous in vivo
Monitoring. Chap. 4, pp. 117-137, Hoboken, NJ: John Wiley.
Updike , et al. 1967. The enzyme electrode. Nature, 214:986-988.
Updike , et al. 1979. Continuous glucose monitor based on an immobilized enzyme
electrode detector. J Lab Clin Med, 93(4):518-527.
Updike, et al. 1982. Implanting the glucose enzyme electrode: Problems, progress, and
alternative solutions. Diabetes Care, 5(3):207-212.
Updike , et al. 2000. A subcutaneous glucose sensor with improved longevity, dynamic
range, and stability of calibration. Diabetes Care, 23(2):208-214.
Valdes, et al. 2000. In vitro and in vivo degradation of glucose oxidase enzyme used for
an implantable glucose biosensor. Diabetes Technol. Ther., 2:367-376.
Velho, et al., In vitro and in vivo stability of electrode potentials in needle-type glucose
sensors. Influence of needle material. Diabetes 1989, 38, 164-171.
Velho, et al., Strategies for Calibrating a Subcutaneous Glucose Sensor, Biomed.
Biochim. 48, 11/12, 957-964.
Wade Jr., L.G. Organic Chemistry, Chapter 17, Reactions of Aromatic Compounds pp.
762-763.
Page 104 of 109
Wagner, et al. 1998. Continuous amperometric monitoring of glucose in a brittle diabetic
chimpanzee with a miniature subcutaneous electrode. Proc. Natl. Acad. Sci. USA,
95:6379-6382.
Wang, J.; Liu, J.; Chen, L.; Lu, F. Highly Selective Membrane-Free, Mediator-Free
Glucose Biosensor. Anal. Chem. 1994, 66, 3600-3603.
Wang, X.; Pardue, H. L. Improved ruggedness for membrane-based amperometric
sensors using a pulsed amperometric method. Anal Chem 1997, 69, 4482-4489.
Ward, et al. 2002. A new amperometric glucose microsensor: In vitro and short-term in
vivo evaluation. Biosensors & Bioelectronics, 17:181-189.
Ward, et al. 1999. Assessment of chronically implanted subcutaneous glucose sensors in
dogs: The effect of surrounding fluid masses. ASAIO Journal, 45:555-561.
Ward, et al. 2000. Rise in background current over time in a subcutaneous glucose sensor
in the rabbit: Relevance to calibration and accuracy. Biosensors & Bioelectronics,
15:53-61.
Ward, W. K.; Wood, M. D.; Troupe, J. E. Understanding Spontaneous Output
Fluctuations of an Amperometric Glucose Sensor: Effect of Inhalation Anesthesia and
Use of a Nonenzyme Containing Electrode. ASAIO Journal 2000, 540-546.
Wientjes, K. J. C. Development of a glucose sensor for diabetic patients. 2000.
Wilkins, et al. 1992. Progress toward the development of an implantable sensor for
glucose. Clin. Chem., 38(9):1613-1617.
Wilkins, et al. 1995. Integrated implantable device for long-term glucose monitoring.
Biosens. Bioelectron., 10:485-494.
Wilkins, et al., Glucose monitoring: state of the art and future possibilities. Med Eng
Phys 1995, 18, 273-288.
Wilson, et al. 2000. Enzyme-based biosensors for in vivo measurements. Chem. Rev.,
100:2693-2704.
Wilson, et al., Progress Toward the Development of an Implantable Sensor for Glucose,
Clinical Chemistry, vol. 38, No. 9, 1992 pp. 1613-1617.
Wood, W., et al., Hermetic Sealing with Epoxy. Mechanical Engineering Mar. 1990, 1-3.
Wu, et al. 1999. In situ electrochemical oxygen generation with an immunoisolation
device. Ann. N.Y. Acad. Sci., 875:105-125.
Yang, et al., A Comparison of Physical Properties and Fuel Cell Performance of Nafion
and Zirconium Phosphate/Nafion Composite Membranes, Journal Of Membrane
Science 237 (2004) 145-161.
Yang, et al. 1998. Development of needle-type glucose sensor with high selectivity.
Science and Actuators,B 46:249-256.
Zavalkoff, et al. 2002. Evaluation of conventional blood glucose monitoring as an
indicator of integrated glucose values using a continuous subcutaneous sensor.
Diabetes Care, 25(9):1603-1606.
Zhang, et al. 1994. Elimination of the acetaminophen interference in an implantable
glucose sensor. Analytical Chemistry, 66(7):1183-1188.
Zhu, et al. 2002. Planar amperometric glucose sensor based on glucose oxidase
immobilized by chitosan film on Prussian Blue layer. Sensors, 2:127-136

Page 105 of 109

Page 106 of 109

Page 107 of 109

Page 108 of 109

Page 109 of 109
Call for papers


![[Your school's name] Manual del Estudiante Student Parent...Galveston ISD Manual del Estudiante y Padres Page of 109. Galveston ISD Manual del Estudiante y Padres Page of 109](https://img.pdfslide.us/doc/110x75/5e7f9db148f3e67b390564b9/your-schools-name-manual-del-estudiante-student-parent-galveston-isd-manual.jpg)