Embed Size (px)
Citation preview
Page 1
HESSI Data Analysis WorkshopFebruary 7, 2001NASA-GSFCHESSIHESSI
High Energy Solar Spectroscopic Imager
Use or disclosure of data contained on this page is subject to the restrictions on the volume cover
HESSI QUICKLOOK DATA, SOFTWARE AND SIMULATED DATA
J McTiernanUniversity of California, Berkeley
Page 2
HESSI Data Analysis WorkshopFebruary 7, 2001NASA-GSFCHESSIHESSI
High Energy Solar Spectroscopic Imager
Use or disclosure of data contained on this page is subject to the restrictions on the volume cover
Page 3
HESSI Data Analysis WorkshopFebruary 7, 2001NASA-GSFCHESSIHESSI
High Energy Solar Spectroscopic Imager
Use or disclosure of data contained on this page is subject to the restrictions on the volume cover
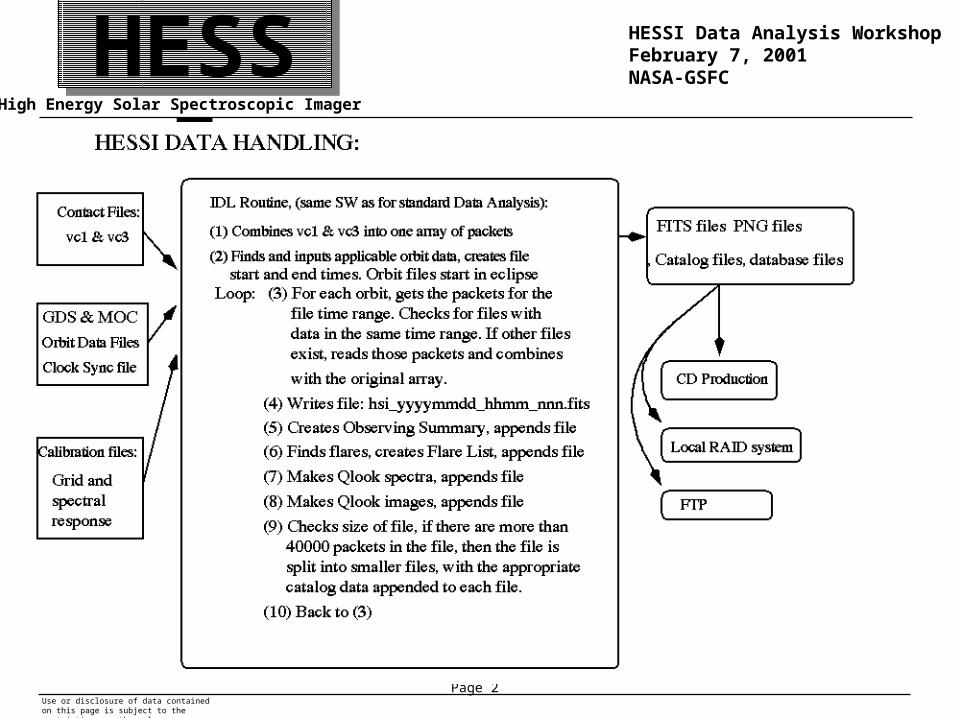
HSI_CONTACT2FITS• IDL routine, runs automatically in SOC (Science Ops Center)• INPUT: • Telemetry files (vc1, stored instrument state-of-health, vc3, stored
science) • Orbit Data from GDS• Calibration Files
Page 4
HESSI Data Analysis WorkshopFebruary 7, 2001NASA-GSFCHESSIHESSI
High Energy Solar Spectroscopic Imager
Use or disclosure of data contained on this page is subject to the restrictions on the volume cover
HSI_CONTACT2FITS• Checks smex packet header info for uncorrected bit errors, checks
packet header for invalid app_id, out of sequence packets, bad collect times, and flags bad packets.
• Combines and sorts packets into one array.• Finds and inputs orbit data, determines file start and end times. Orbit
files start and end in eclipse• Loops through orbits:
Page 5
HESSI Data Analysis WorkshopFebruary 7, 2001NASA-GSFCHESSIHESSI
High Energy Solar Spectroscopic Imager
Use or disclosure of data contained on this page is subject to the restrictions on the volume cover
For each Orbit:
• Gets packets for the orbit time range• Checks for files with data in the same time range. If other files are found,
the packets are read in and combined with the original array. (Old files are discarded after the new files are written). Filedb.status is set to -1. The file version number is incremented.
• Duplicate packets are deleted. (Note that duplicate packets flagged as 'bad' are discarded first).
• Checks file size, if there are more than 40000 packets (40 Mb), splits into smaller files.
• Writes FITS file: hsi_yyyymmdd_hhmm_nnn.fits• Next orbit
Page 6
HESSI Data Analysis WorkshopFebruary 7, 2001NASA-GSFCHESSIHESSI
High Energy Solar Spectroscopic Imager
Use or disclosure of data contained on this page is subject to the restrictions on the volume cover
For Each File:• Creates Observing Summary, appends file
• Calculates background, finds flares, creates Flare List, appends file
• Makes Qlook Spectra, appends file
• Makes Qlook Images, appends file
• Fills database structure for those files, {hsi_filedb}
• Next File
Page 7
HESSI Data Analysis WorkshopFebruary 7, 2001NASA-GSFCHESSIHESSI
High Energy Solar Spectroscopic Imager
Use or disclosure of data contained on this page is subject to the restrictions on the volume cover
HESSI Data Products• FITS files: usually 1 per orbit, telemetry packets with appended catalog• PNG files, images, spectra, and count rate plots, online• Daily Catalog files, online: hessi_catalog_yyyymmdd.fits• HESSI Flare List, online : hessi_flare_list.fits, also an ascii file:
hessi_flare_list.ascii• Database file, contains file names, time ranges, online : hsi_filedb.fits• CD list file, lists files on each CD, online• Clock Sync file, syncs spacecraft time to UT, online
Page 8
HESSI Data Analysis WorkshopFebruary 7, 2001NASA-GSFCHESSIHESSI
High Energy Solar Spectroscopic Imager
Use or disclosure of data contained on this page is subject to the restrictions on the volume cover
HESSI Data Products: Observing Summary• spin-averaged count rates in 9 energy bands, summed over detectors
• particle detector rates
• modulation variance, 2 Coarsest collimators
• S/C position and velocity
• Instrument Log: Housekeeping, State of Health data for systems
• Background data for each detector segment, particle detector
• Flags for: ['SAA passage', 'Eclipse', 'Flare' , 'Non-Solar Event', 'Front Ratio', 'Decimation', 'IDPU Control Version Number', 'Cryocooler Power', 'Cold Plate Temp', 'IDPU Temp', 'Cold Plate Supply', 'HV28 Supply', 'Actuator Supply', 'Fast Housekeeping', 'S/C Transmitter', 'S/C in Sunlight', 'SSR State', 'Attenuator state']
Page 9
HESSI Data Analysis WorkshopFebruary 7, 2001NASA-GSFCHESSIHESSI
High Energy Solar Spectroscopic Imager
Use or disclosure of data contained on this page is subject to the restrictions on the volume cover
HESSI Data Products: Flare List• Id number
• Start, peak and end times, in energy range [12.0, 25.0] keV
• peak count rate, counts/sec/segment, in the energy range
• total counts
• Background Count rate and Time Range
• Highest energy of observed photons
• Flare position, arcsec from Sun center, and string rep.
• Flags for flares that start/end in Eclipse or SAA, flares at file SOF, EOF
• Solar-Non-solar event flag
• Detector Id's (Fronts only are used for flares, both can be used for others)
• File(s) which have the data
• Active Region number
Page 10
HESSI Data Analysis WorkshopFebruary 7, 2001NASA-GSFCHESSIHESSI
High Energy Solar Spectroscopic Imager
Use or disclosure of data contained on this page is subject to the restrictions on the volume cover
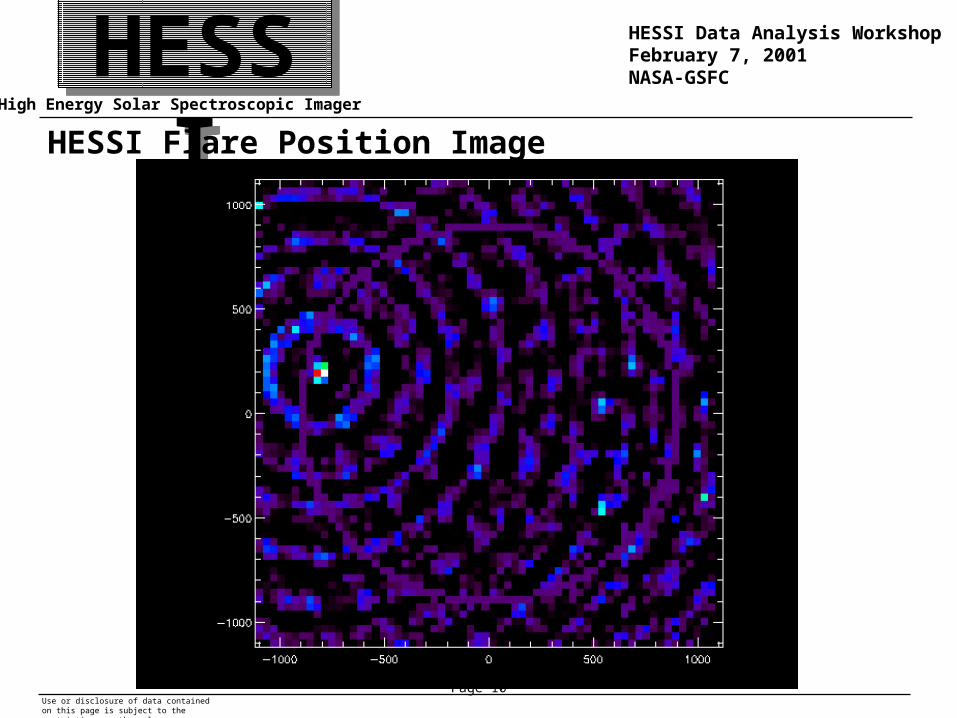
HESSI Flare Position Image
Page 11
HESSI Data Analysis WorkshopFebruary 7, 2001NASA-GSFCHESSIHESSI
High Energy Solar Spectroscopic Imager
Use or disclosure of data contained on this page is subject to the restrictions on the volume cover
HESSI Data Products: Quicklook Spectra• Count and photon spectra as a function of time
• Thermal + double power law photon spectra,
• dE = E/2 energy resolution.
Page 12
HESSI Data Analysis WorkshopFebruary 7, 2001NASA-GSFCHESSIHESSI
High Energy Solar Spectroscopic Imager
Use or disclosure of data contained on this page is subject to the restrictions on the volume cover
HESSI Data Products: Quicklook Images• Images in the energy bands given by the Observing Summary, If
possible, Cadence determined by Count Rate. (Presently only 4 second peak)
Page 13
HESSI Data Analysis WorkshopFebruary 7, 2001NASA-GSFCHESSIHESSI
High Energy Solar Spectroscopic Imager
Use or disclosure of data contained on this page is subject to the restrictions on the volume cover
Tests of SOC software • Local Tests: vc1 & vc3 simulated in raw data files, (no headers or
frames). Realistic orbit data, HSI_CONTACT2FITS run from IDL session. Results in simulated data files online at http://hessi.ssl.berkeley.edu/data/test_data/.
• Test of SOC scripts: vc1 & vc3, simulated data, HSI_CONTACT2FITS run in script, script then queues the data for CD production and FTP.
• Test contacts: vc1 & vc3 from HESSI, no orbit data, no "flare", FITS file with Obs summary, but no flare list.
Page 14
HESSI Data Analysis WorkshopFebruary 7, 2001NASA-GSFCHESSIHESSI
High Energy Solar Spectroscopic Imager
Use or disclosure of data contained on this page is subject to the restrictions on the volume cover
Access to catalog data • IDL> obj = obj_new(‘hsi_obs_summary’)• IDL> data = obj -> getdata(obs_time_interval = ‘1-SEP-2000’+ $
[‘ 01:00’, ‘ 02:00’])• IDL> data= obj -> getdata(filename =‘hsi_20000901_0000_001.fits’)• data is a structure with countrate and time• To plot:• IDL> obj -> plot
Page 15
HESSI Data Analysis WorkshopFebruary 7, 2001NASA-GSFCHESSIHESSI
High Energy Solar Spectroscopic Imager
Use or disclosure of data contained on this page is subject to the restrictions on the volume cover
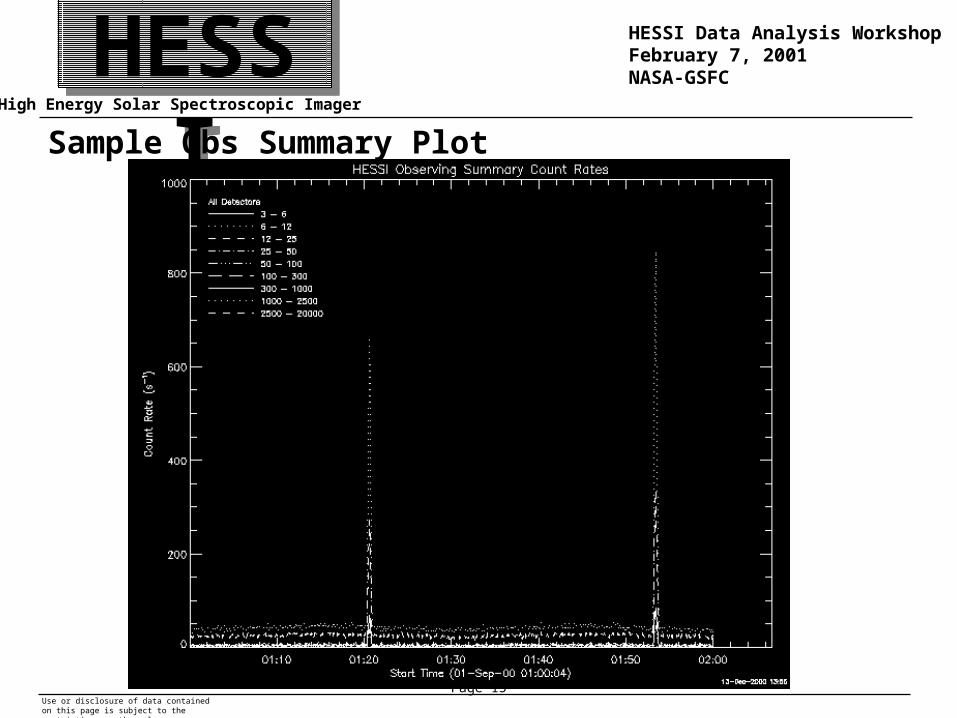
Sample Obs Summary Plot
Page 16
HESSI Data Analysis WorkshopFebruary 7, 2001NASA-GSFCHESSIHESSI
High Energy Solar Spectroscopic Imager
Use or disclosure of data contained on this page is subject to the restrictions on the volume cover
Access to Catalog data (cont.)• 5 objects in obs_summary, • hsi_obs_summ_rate, • hsi_obs_summ_flag, • hsi_mod_variance, • hsi_particle_rate, • hsi_ephemeris• For data structure:• IDL> data = obj -> getdata(class_name = ‘obs_summ_rate’)• For object reference:
• IDL> data = obj ->getdata(class_name = ‘obs_summ_rate’, /object_reference)
Page 17
HESSI Data Analysis WorkshopFebruary 7, 2001NASA-GSFCHESSIHESSI
High Energy Solar Spectroscopic Imager
Use or disclosure of data contained on this page is subject to the restrictions on the volume cover
Access to Catalog Data (cont.)• Two more objects:• hsi_obs_background, for each flare a background spectrum, same energy
bands as the obs_summary, all detector segments• hsi_flare_list• Same syntax, getdata, plot, list, etc…• Some other routines (Kim): hsi_ui_flarecat() is a widget interface,
hsi_read_flarelist, hsi_select_flare, hsi_format_flare
Page 18
HESSI Data Analysis WorkshopFebruary 7, 2001NASA-GSFCHESSIHESSI
High Energy Solar Spectroscopic Imager
Use or disclosure of data contained on this page is subject to the restrictions on the volume cover
HSI_FILEDB• Each file is recorded as an entry in the filedb structure. This is written
into a FITS file, which is opened and read and rewritten for every ground station contact. The database file for all level 0 data will be distributed as part of the software.
• Contents: • version = A version number • file_id = file name • orbit_start = Orbit number (from GDS) at start of the file • orbit_end = Orbit number (from GDS) at end of the file
• start_time = data start time
• end_time = data end time
• status_flag = set to -1 if the file has been discarded, and the packets are contained in another file, set to 0 if the file exists
• npackets = Number of packets
Page 19
HESSI Data Analysis WorkshopFebruary 7, 2001NASA-GSFCHESSIHESSI
High Energy Solar Spectroscopic Imager
Use or disclosure of data contained on this page is subject to the restrictions on the volume cover
Simulating Data:• Set "sim" keywords: See
http://sprg.ssl.berkeley.edu/~jimm/hessi/sim_keywords_20010110.html• Also http://sprg.ssl.berkeley.edu/~cmj/hessi/doc.html
• Sample:
• IDL> a = [0.1, 1.0, 0.1, 3.0, 60.0, 3.0, 10.0, 1.5]
• IDL> energy = 3.0+indgen(497)
• IDL> photon_flux = f_vth_bpow(e, a)
• IDL> o = obj_new('hsi_eventlist') (or o = obj_new('hsi_image'))
• IDL> o -> set, sim_background = 1.0, sim_ut_ref = anytim('31-aug-2000 0:00'), sim_xyoffset = [-800.0, 200.0], sim_energy_band = [3.0, 500.0], sim_a2d_index_mask = bytarr(27)+1, sim_use_spectrum = 1, sim_atten_state = 1, sim_photon_flux_ptr = ptr_new(photon_flux), sim_photon_energy_ptr = ptr_new(energy)
Page 20
HESSI Data Analysis WorkshopFebruary 7, 2001NASA-GSFCHESSIHESSI
High Energy Solar Spectroscopic Imager
Use or disclosure of data contained on this page is subject to the restrictions on the volume cover
Simulating Data (cont):
• Changing the image model: Here is a double source:• IDL> model = replicate({hsi_gaussian_str}, 2)
• IDL> model[0].ampitude = 1.0• IDL> model[0].xypos = [0.0, 0.0]• IDL> model[0].xysigma = [5.0, 5.0]• IDL> model[1].amplitude = 0.5• IDL> model[1].xypos = [20.0, 20.0]• IDL> model[1].xysigma= [3.0, 3.0]• IDL> o -> set, sim_model = model• Also, you can pass in an image array with a number of point sources• Curved gaussians (courtesy of M. Aschwanden) will be available soon
Page 21
HESSI Data Analysis WorkshopFebruary 7, 2001NASA-GSFCHESSIHESSI
High Energy Solar Spectroscopic Imager
Use or disclosure of data contained on this page is subject to the restrictions on the volume cover
Simulating Data (cont):
• IDL> ;get eventlist
• IDL> e = o -> getdata(/all, time_range = [0, 0], energy_range = [0, 0], $ a2d_index_mask = bytarr(27)+1)
• IDL> ;write out the eventlist
• IDL> o -> write, out_filename = 'hsi_10.fits', time_range = [0, 0]
• Instead of using the flux and energy keywords, we certainly could have used the spec_model and spec_pars keywords (with /sim_use_spectrum set), e.g.,
• IDL> o -> set, sim_spec_model = 'f_vth_bpow'
• IDL> o -> set, sim_ spec_pars = [0.1, 1.0, 0.1, 3.0, 60.0, 3.0, 10.0, 1.5]
Page 22
HESSI Data Analysis WorkshopFebruary 7, 2001NASA-GSFCHESSIHESSI
High Energy Solar Spectroscopic Imager
Use or disclosure of data contained on this page is subject to the restrictions on the volume cover
Simulating Data (cont):
• We also can use sim_photons_per_coll as before:
• IDL> o -> set, sim_photons_per_coll = 1000, $ sim_bkgd_photons_per_coll = 100
Page 23
HESSI Data Analysis WorkshopFebruary 7, 2001NASA-GSFCHESSIHESSI
High Energy Solar Spectroscopic Imager
Use or disclosure of data contained on this page is subject to the restrictions on the volume cover
Simulating Flares:• Hsi_sim_flare: Online, partially tested, includes input spectra in terms of
photons/sec/keV/cm2, spectra in terms of spectral models and parameters different spectra and time histories for different sources, different Attenuator States, etc.
• IDL> hsi_sim_flare, /random_flare chooses random everything.• IDL> spec_pars = fltarr(8, 3)• IDL> spec_pars[*, 0] = [0.01, 1.0, 0.01, 6.0, 60.0, 6.0, 10.0, 1.5]• IDL> spec_pars[*, 1] = [0.1, 1.0, 0.1, 3.0, 60.0, 3.0, 10.0, 1.5]• IDL> spec_pars[*, 2] = [1.0, 0.2, 0.01, 6.0, 60.0, 6.0, 10.0, 1.5]• IDL> hsi_sim_flare, spec_pars = spec_pars, flare_start_ut = '2-nov-2002
01:00', flare_end_ut = '2-nov-2002 01:12', flare_peak_ut = '2-nov-2002 01:20'
• /neupert_effect keyword simulates the Neupert Effect• See http://sprg.ssl.berkeley.edu/~jimm/hsi_sim_flare.html
Page 24
HESSI Data Analysis WorkshopFebruary 7, 2001NASA-GSFCHESSIHESSI
High Energy Solar Spectroscopic Imager
Use or disclosure of data contained on this page is subject to the restrictions on the volume cover
Simulated Data Set (old, but still useful)• hessi.ssl.berkeley.edu/data/test_data• Includes 7 days (31-Aug,to 6-Sep-2000)• Includes Level 0 files, daily catalog files hsi_flare_list, and hsi_filedb file• To use: Load data into local directory• Set $HSI_DATA_ARCHIVE to that directory• Note that all of the features of the catalog data shown here are not in this
data set.• Every version of the Qlook software will be compatible with this data set.
(Each qlook object and structure has a version number which is recorded in the FITS binary table for that object or structure. The information about which version is current is kept in the routine HSI_QLOOK_VERSION_CONTROL)