Embed Size (px)
Citation preview

Page 1
Component Industry TrendsDriven by New End-User
Equipment
VHS
321
4 5 6
7 8 9
0* #

Page 2
Agenda
Impedance Measurement Basics
Measurement Discrepancies
Measurement Techniques Error Compensation

Page 3
Impedance Definition
Impedance is the total opposition a deviceor circuit offers to the flow of a periodic current
AC test signal (amplitude and frequency)
Includes real and imaginary elements
Z = R + j X Z = R + j B
B
G
R X

Page 4
Impedance Measurement Plane
O-
Z = R + jX = |Z|
= ARCTANXR
|Z|
Resistive
Real Axis
Ima
gin
ary
Axi
s
Ca
pac
itive
Ind
uct
ive
+j
-j
|Z| = R + X 2 2
D U T
( )
O-
-O

Page 5
Admittance Measurement Plane
O-
Y = G + jB = |Y|
= ARCTANBG
|Y|
Conductive
Real Axis
Ima
gin
ary
Axi
s
Ind
uct
ive
Ca
pac
itive
+j
-j
|Y| = G + B 2 2
D U T
( )
O-
-O
Y=1/Z

Page 6
Agenda
Impedance Measurement Basics
Measurement Discrepancies
Measurement Techniques Error Compensation

Page 7
Which Value is Correct?
Z Analyzer
Q : 165Q : 165
Q = 120
LCR meter
L : 5.231 uH?
?Q : 120
LCR meter
LCR meter
D U T
D U T
L : 5.310 uH
5.310 uH5.231 uH

Page 8
Measurement Discrepancy Reasons
Component Dependency Factors
Measurement Errors
True, Effective, and Indicated Values
Circuit Mode (Translation Equations)

Page 9Kobe Instrument Division
Back to Basics - LCRZ Module
Measurement Discrepancy Reasons
Component Dependency Factors
Test signal level
Test signal frequency
DC bias, voltage and current
Environment (temperature, humidity, etc.)

Page 10
Component ParasiticsComplicate the Measurements

Page 11
Real World Capacitor Model Includes Parasitics

Page 12
Quality and Dissipation Factors
Q =
R
Energy lost
Energy stored=
X
R
0 Q O
s
s
O
Different from the Q associated
with resonators and filters
The better the component, then
D = 1
Q , mainly used for capacitors

Page 13
Capacitor Reactance vs. Frequency
Capacitor Model|X|
Frequency
X = wL
X =1
wC
L
C

Page 14
Example Capacitor ResonanceImpedance vs. Frequency
A: |Z|A MAX 50.00B MAX 100.0 deg
B: MKR 6 320 000.000 Hz
MAG 47.2113
PHASE 659.015 mdeg
A MIN 20.00 START 1 000 000.000 Hz STOP 15 000 000.000 Hz
0
B MIN -100.0 deg
m
m

Page 15Kobe Instrument Division
Back to Basics - LCRZ Module
C Variations with Test Signal Level
SMD Capacitors, Various dielectric constants K
Vac
C
Low K
Mid K
High K
C vs DC Voltage BiasType I and II SMD Capacitors
Vdc
Type I
Type II
C / %
0 50 100
0
2
-2
-4
-6
-8
-10
-20
NPO (low K)
X7R (high K)
C vs AC Test Signal Level

Page 16Kobe Instrument Division
Back to Basics - LCRZ Module
C vs. Temperature
Type I and II SMD Capacitors
T / C
Type I
Type II
C / %
-60 60 140
10
15
5
0
-5
-10
-15
-20
NPO (low K)
X7R (high K)
-20 20 100

Page 17
L vs. DC Current Bias LevelPower Inductors
Idc
L / %
0 50 100
0
2
-2
-4
-6
-8
-10
-20

Page 18
Component Dependency Factors
Test signal frequency
Test signal level
DC bias, voltage and current
Environment ( temperature, humidity, etc.)
Aging
Component's current state

Page 19
Which Value Do We Measure?
TRUE
EFFECTIVE
INDICATED +/-
Instrument Test fixture Real world device
%

Page 20
Measurement Set-Up
DUT
R + jXx x
Test
FixtureInstrument
Port
Extension

Page 21
Sources of Measurement Errors
Measurement technique inaccuracies
Fixture residuals
RFI and other noise
DUT stray and lead parasitics
Port Extension complex residuals

Page 22
Sources of Measurement Errors
DUT
R + jXx x
Test
FixtureInstrument
Port
Extension
TechniqueInaccuracies Residuals Noise
Parasitics
ComplexResiduals

Page 23
Actions for Limiting Measurement Errors
DUT
R + jXx x
Test
FixtureInstrument
Port
Extension
CalibrationCompensation
Guarding
LOADCompensation
EShielding

Page 24
What Do Instruments...
I-V Method Reflection CoefficientMethod
Measured
Direct
I, V
Z =
Ls , Lp, Cs, Cp, Rs or ESR, Rp, D, Q
Calculations
Model basedApproximations
C
R
CR
p
p
ss
D U T ?
x,y
Z = Zo1 +1 -I
V
Measure ? Calculate ? Approximate ?

Page 25
Circuit Mode
Requires Simplified Models
No L Capacitor Model
Complete Capacitor ModelRs,Ls,Rp,Cp ?
TOO C
OMPLEX

Page 26
Circuit Mode
Large C Small C
No L Capacitor Model
Series model Parallel model
Rs
Rp
C
Rs Cs
Rp
Cp
Small L Large L
Rs vs Rp , who wins ?
SMD

Page 27
Which Model is Correct ?
Both are correct
One is a better approximation
For high Q or low D components,
Cs Cp
C
R
CRC = C (1 + D )
p
p
sss p
2

Page 28
Agenda
Impedance Measurement Basics
Measurement Discrepancies Measurement Techniques Error Compensation

Page 29
Measurement Techniques
Auto Balancing Bridge
Resonant (Q-adapter / Q-Meter)
RF I-V
Network Analysis (Reflection Coefficient)
TDR (Time Domain Reflectometry)
I-V (Probe)

Page 30
Measurement Technique Topics
Technique Selection Criteria
Theory of Operation
Advantages and Disadvantages of each technique
Expanded connection information and theory for auto balancing bridge (r4 terminal pair) instruments
Error Compensation to minimize measurement error

Page 31
Measurement Technique Selection Criteria
Frequency
DUT Impedance
Required measurement accuracy
Electrical test conditions
Measurement parameters
Physical characteristics of the DUT

Page 32
Frequency vs. Measurement Techniques
Network Analysis
100KHz
1 10 100 1K 10K 100K 1M 10M 100M 1G 10G
Frequency (Hz)
Auto Balancing Bridge
5HZ 40MHz
22KHz 70MHz
Resonant
I-V
10KHz 110MHz
30MHz
RF I-V
1 MHz 1.8 GHz

Page 33
Z and C vs. Frequency
1 10 100 1K 10K 100K 1M 10M 100M 1G
10M
1M
100K
10K
1K
100
10
1
100m
1mF
10mF
100mF
100uF
10uF
1uF
100nF
10nF1nF
10pF100fF
1fF
Frequency (Hz)
Impe
danc
e (O
hms)
160
100pF1pF
10fF

Page 34
Reactance Chart
1 10 100 1K 10K 100K 1M 10M 100M 1G
10M
1M
100K
10K
1K
100
10
1
100m
10nH
1nH
100p
H
100n
H1u
H
10uH
100u
H1m
H10m
H10
0mH
10H
1KH
100K
H
1mF
10mF
100mF
100uF
10uF
1uF
100nF
10nF1nF
10pF100fF
1fF
Frequency (Hz)
Impe
danc
e (O
hms)

Page 35
Solution by Frequency Comparison
Frequency
10M
1M
100K
10K
1K
100101
100m
Impedance
(O
hm
s)
10m1m
100M
100K 1M 10M 100M 1G Hz10G
Network Analysis
RF I-V
10 100 1K 10K
I-V (Probe)
Auto Balancing Bridge

Page 36
Which is the Best ?
All are good
Each has advantages and disadvantages
Multiple techniques may be required

Page 37
Auto Balancing BridgeTheory of Operation
V
-
+
2
V1
DUT
V = I R2 2 2
Z = V
I
1
2 =
V R
V
21
2
H L R2
I2
Virtual ground
II = I2

Page 38
Auto Balancing Bridge
Most accurate, basic accuracy 0.05%
Widest measurement range
Widest range of electrical test conditions
Simple-to-use
Advantages and Disadvantages
Low frequency, f < 40MHz
C,L,D,Q,R,X,G,B,Z,Y,O,...

Page 39
Performing High Q / Low D Measurement is Difficult
Q = X
R
l
-jX
+jX
R
Impedance of very high Q device
Very small R, difficult to measure
R1
X1

Page 40
Resonance (Q - Meter) Technique
Theory of OperationTune C so the circuit resonates
At resonance X = -X , only R remainsD C D
V~OSC
Tuning C (X c) V
L (X ), RD DDUT
e I= eZ
X = = (at resonance)C VI
R VeD
Q = = =|V|
e|X |
RD
D |X |
RD
C

Page 41
Resonant Method
Advantages and Disadvantages
requires experienced user
Vector Scalar
automatic and fast manual and slow
easy to use
No compensationlimited compensation
75kHz - 30MHz 22kHz - 70MHz
Very good for high Q - low D measurements
Requires reference coil for capacitors
Limited L,C values accuracy

Page 42
I - V Probe TechniqueTheory of Operation
V2
V 1
DUT
V = I R2 2 2
Z = V
I
1
2
= V R
V
21
2
I2
R2

Page 43
I-V (Probe)
Medium frequency, 10kHz < f < 110MHz
Moderate accuracy and measurement range
Advantages and Disadvantages
Grounded and in-circuit measurements
Simple-to-use

Page 44
RF I-VTheory of Operation
Vi
Vv
Ro
Ro
Vi
Vv
Ro
Ro DUT DUT
Voltage
Current Voltag
eDetection
Detection
CurrentDetection Detectio
n
High Impedance Test Head Low Impedance Test Head

Page 45
RF I-V
High frequency, 1MHz < f < 1.8GHz
Most accurate method at > 100 MHz
Grounded device measurement
Advantages and Disadvantages

Page 46
Network Analysis (Reflection) Technique
Theory of Operation
DUT
V
VINC
R
V
VINC
RZ - ZL O
Z + ZL O
==

Page 47
Network Analysis
High frequency
- Suitable, f > 100 kHz
Moderate accuracy
Limited impedance measurement range(DUT should be around 50 ohms)
Advantages and Disadvantages
- Best, f > 1.8 GHz

Page 48H
TDRTheory of Operation
V
VINC
RZ - Z
L O
Z + ZL O
==
ZL
DUT
Oscilloscope
Step Generator
VVINC R
Series R & L
Parallel R & C
0t

Page 49
TDNA (TDR)
Reflection and transmission measurements
Single and multiple discontinuities or impedance
Advantages and Disadvantages
DUT impedance should be around 50 ohms
mismatches ("Inside" look at devices)
Good for test fixture design, transmission lines,
high frequency evaluations
Not accurate for m or M DUTs
or with multiple reflections

Page 50
Simple Selection RulesSummary
Auto balancing bridge,
I-V, in-circuit and grounded measurements,medium frequency, 10KHz < f < 110MHz
low frequency, f < 40MHz
Network analysis,
Resonant, high Q and low D
TDNA, discontinuities and distributed
characteristics
high frequency, f > 1.8 GHz
RF I-V, high frequency impedance measurement,1MHz < f < 1.8GHz

Page 51
Measurement Methods and HP products
Auto Balancing Bridge(Four-Terminal Pair)
Resonant (Q-Meter)
RF I-V
Measurement Method HP Products Frequency range
HP 41941A Impedance Probe (withHP 4194A)HP 4193A Vector Impedance Meter
HP 42851A Q Adapter ( with HP 4285A)
10KHz to 100MHz
400KHz to 110MHz
10Hz to 40MHz
5Hz to 13MHz
20Hz to 1MHz spot
100Hz to 10MHz spot
75KHz to 30MHz
75KHz to 30 MHz
HP 4263A LCR Meter
HP 4284A Precision LCR Meter
HP 4192A LF Impedance Analyzer
HP 4194A Impedance/Gain-Phase Analyzer
HP 4285A Precision LCR Meter
HP 427xA LCR Meters
HP 4286A RF LCR MeterHP 4291A Impedance/Material Analyzer
100Hz to 100 kHz spot
1 MHz to 1 GHz1 MHz to 1.8 GHz
I-V (Probe)

Page 52
Measurement Methods and HP products (cont.)
Network Analysis (Reflection Coefficient)
TDNA (TDR)
Measurement Method HP Products Frequency range
300KHz to 1.3GHz/6GHz
130MHz to 13.5GHz/20GHz
45 MHz to 100GHz
5Hz to 500MHz
100 kHz to 500MHz
100 kHz to 1.8 GHz
HP 8751A Network Analyzer
HP 8752C/8753D RF Network Analyzers
HP 8510B Network Analyzer
HP 54121T Digitizing Oscilloscope and TDR
HP 4195A Network/Spectrum Analyzerwith HP 41951A Impedance Test Set
HP 8752C/8753D RF Network Analyzers
HP 8719C/8720C Network Analyzers
HP 8510B Network Analyzer
HP 8719C/8720C Network Analyzers
HP 4396A Network/Spectrum Analyzerwith HP 43961A Impedance Test Kit

Page 53
Selecting a Test Frequency
Ideal case is at operating conditions
Reality, must make trade-offs
Too high a frequency adds measurement,
test fixture and instrument errors
m and M DUTs more diffucult to measure

Page 54
Measurement Tradeoff Example
1 10 100 1K 10K100K1M 10M100M1G
10M
1M
100K
10K
1K
100
10
1
100m
1mF
10mF100mF
100uF
10uF
1uF
100nF
10nF1nF
10pF100fF
1fF
F (Hz)
100pF1pF
10fFZ ( )
4284A @ 1MHz (1600 ) : 0.05%
42
84
A
41
94
A
41
94
1
41
95
A
Want to measure 100 pF ideal capacitor @ 200 MHz
4194A @ 10MHz (160 ) : 1.3 %
4194A @ 40MHz ( 40 ) : 5.2 %
41941A @ 40MHz ( 40 ) : 3.6 %
41941A @ 100MHz ( 16 ) : 6.2 %
4195A @ 200MHz ( 8 ) : 1.9 %
Accuracy comparison

Page 55
Auto Balancing BridgeA: CpA MAX 13.00 pFB MAX 350.0 m
B: D MKR 1 006 570.375 Hz
Cp 10.0742 pF
A/DIV 500.0 fF START 1 000.000 Hz STOP 40 000 000.000 HzB\DIV 50.00 m
D

Page 56
I - VA: CpA MAX 13.00 pFB MAX 1.000
B: D MKR 1 011 579.454 Hz
Cp 10.4523 pF
A/DIV 500.0 fF START 100 000.000 Hz STOP 100 000 000.000 HzB MIN 0.000
D

Page 57
Network Analysis
A: REF13.00p
[ F ]
B: REF MKR 1 018 519.448 Hz Cp 10.7531p F
DIV START 100 000.000 Hz STOP 500 000 000.000 Hz500.0f
D
IMPEDANCE
180.0 [ F ]
RBW: 3 KHZ ST: 6.15 sec RANGE: A= 0, T= 0dBm
36.00
DIV

Page 58
Agenda
Impedance Measurement Basics
Measurement Discrepancies Measurement Techniques Error Compensation

Page 59
Error Compensation to Minimize Measurement Errors
Compensation and Calibration (Compensation = Calibration)–Definition of Compensation and Calibration–Cable correction
OPEN/SHORT Compensation–Basic Theory–Problems which can not be eliminated by OPEN/SHORT compensation
OPEN/SHORT/LOAD Compensation–Basic Theory–Load device selection
Practical Examples Summary

Page 60
To define the "Calibration Plane" at which measurement accuracy is specified
Definition of Calibration
Z Analyzer
LCR Meter
Standard Device
100
Calibration Plane
(Measurement accuracy is specified.)
!
100

Page 61
Cable Correction
Definition : Calibration Plane extension
using specified HP cables
(HP 16048A/B/D/E)
LCR
Meter
LCR
Meter
HP Measurement Cable
Calibration Plane Calibration Plane

Page 62
Definition of CompensationTo reduce the effects of error sources existing
between the DUT and the instrument's "Calibration Plane".
Z Analyzer
LCR Meter
Fixture
Cables
Scanner, etc.
100
+ZZ DUT
100
2 types of compensation
- OPEN/SHORT compensation
- OPEN/SHORT/LOAD compensation
Calibration Plane

Page 63
OPEN/SHORT Compensation- Basic Theory -
Zdut
Rs Ls
Co Go
Hc
Hp
Lp
Lc
Zm
StrayResidual
Test Fixture Residuals
Admittance ( Yo )Impedance ( Zs )Zs = Rs + jLs
Yo = Go + jCo
Zdut =1 - (Zm - Zs)Yo
Zm - Zs

Page 64
OPEN/SHORT Compensation Issues Problem 1
SCANNER ComplicatedResiduals
Stray capacitance
Residual inductance
Residual resistance
DUT
Difficulty to eliminate complicated residuals
LCR Meter

Page 65
OPEN/SHORT Compensation Issue
Problem 2
Difficulty to eliminate Phase Shift Error
LCR MeterDUT
Test Fixture
Not a standard length cable*
* Or not an HP cable
Page 66
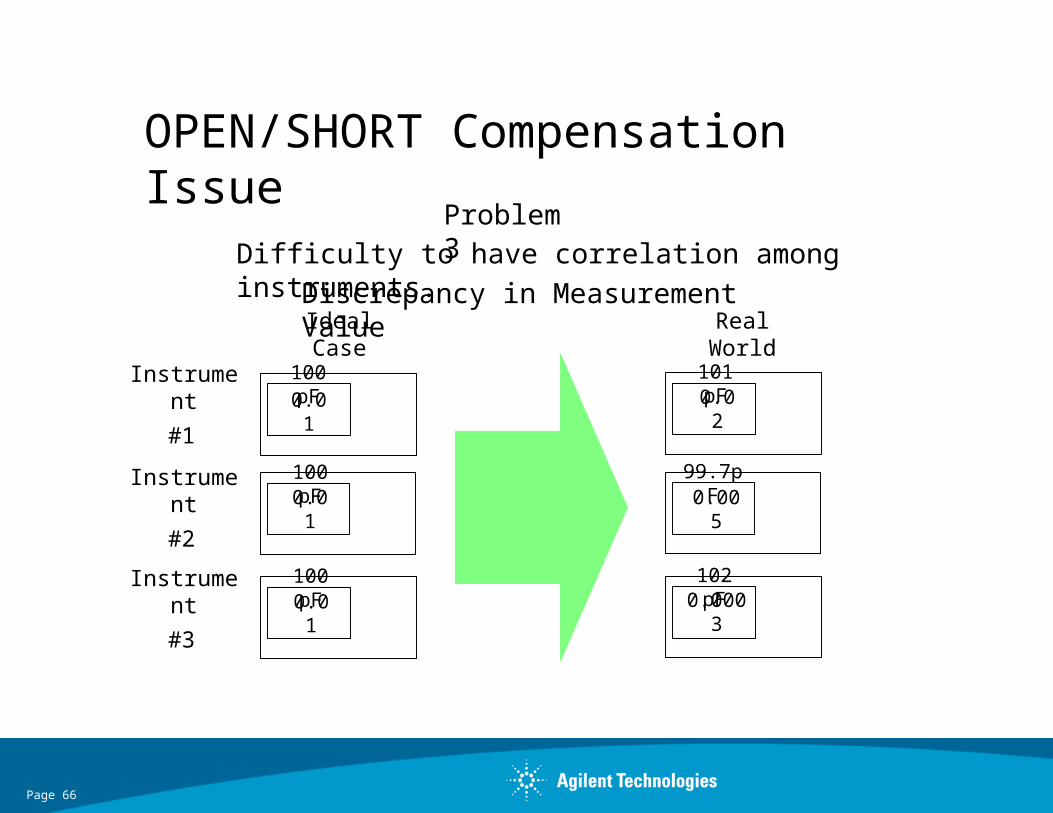
OPEN/SHORT Compensation Issue
Problem 3Difficulty to have correlation among instruments.
Discrepancy in Measurement Value
100 pF
100 pF
100 pF
99.7pF
101 pF
102 pF
Ideal Case Real World
0.01
0.01
0.01
0.02
0.005
0.0003
Instrument
#1
Instrument
#2
Instrument
#3

Page 67
OPEN/SHORT/LOAD Compensation
- Basic Theory -
ZdutA B
C DDUTV 2V1
Unknown 2-terminal
Impedance
Instrument
I1 I2
pair circuit

Page 68
OPEN/SHORT/LOAD Compensation
- Basic Theory -
Zstd (Zo - Zsm) (Zxm - Zs) *
Zxm - Zs) (Zo - Zxm)Zdut =
Zo : OPEN measurement value
Zs : SHORT measurement vaue
Zsm : Measurement value of LOAD device
Zstd : True value of LOAD device
Zxm : Measurement value of DUT
Zdut : Corrected value of DUT
* These are complex vectors. Conversions to
real and imaginary components are necessary

Page 69
OPEN/SHORT/LOAD Compensation
Eliminates phase shift error
Maximizes correlation between instruments
Eliminates complicated residuals

Page 70
OPEN/SHORT/LOAD Compensation Effects
)(
1
2
C-m
ea
sure
me
nt
err
or
[%]
Frequency [kHz]
800 1000600400200
OPEN/SHORT compensation
OPEN/SHORT/LOAD compensation)(
3

Page 71
Procedure of OPEN/SHORT/LOAD Compensation
1. Measure LOAD device
2. Input LOAD measurement value
as a reference value.
Direct-connected test fixture
as accurately as possible.

Page 72
Procedure of OPEN/SHORT/LOAD Compensation
3. Perform OPEN/SHORT/LOAD compensation at the test terminal.
4. Measure DUT at the test terminal.
Test Terminal
Test Fixture with complicated residuals

Page 73
LOAD Device Selection- Consideration 1 -
When you measure DUTs which have various impedance values,
Select a LOAD device whose impedance value is 100 ~ 1k.
When you measure a DUT which has only one impedance value,
Select a LOAD device whose impedance value is close to that of the DUT to be measured.

Page 74
LOAD Device Selection- Consideration 2 -
Select pure and stable capacitance or resistance
LOAD value must be accurately known.
loads (low D capacitors - i.e. mica)

Page 75
Practical Examples
4284A
16047C
DUT
DUT
4285A
16048D
16047A
(A) (B)
(1) (1)
(2)

Page 76
Practical Examples
4285A
DUT
4285A
16048A
(C) (D)
DUT
16047A
Non-HP
Cable
SCANNER
(1) (1)
(2) (2)

Page 77
Practical Example
(E)
4195A 16092A
41951A
(2)
(1)

Page 78
SummaryCalibration and Compensation Comparison
Theory
Calibration
Cable correction
Compensation
OPEN/SHORT
Compensation
OPEN/SHORT/LOAD
Compensation
Eliminate instrument system errorsDefine the "Calibration Plane using a CAL standard
Eliminate the effects of cable errorExtend "Calibration Plane" to the end of the cable
Eliminate the effects of error sources existing between "Calibration Plane" and DUT
Eliminate the effects of simple fixture residuals
Eliminate the effects of complex fixture residuals

Page 79
SummaryWhich compensation technique should you select?
- Selection Guideline -
InstrumentsFixture Connection
Primary Fixture Secondary Fixture
Residual
Compensation
OPEN/SHORT only
Cable correction + OPEN/SHORT
OPEN/SHORT/LOAD
OPEN/SHORTor
OPEN/SHORT/LOAD
Direct Test Fixture
Complicated FixtureScanner, etc.
Direct Test Fixture
Other Fixtures
DirectTest Fixture
Specified HP Cable
Non-specified HP cable
Non-HP cable
Self-made Test Fixture
(4284A, 4285A etc.)
Z Analyzer
LCR Meter Cable correction + OPEN/SHORT/LOAD