Embed Size (px)
Citation preview

Annual Report Packaging management for a world on the move: evolution or revolution?
2016
Together > Good sorting > Better recycling

2 I Annual Report 2016
Hungry for more?Go to www.fostplus.be
For the purpose of this Annual Report, Fost Plus has restricted itself to supplying key figures. Additional information is available on our website.

2 I Annual Report 2016 Annual Report 2016 I 3
Annual Report 2016
Table of contents4 | Foreword At a major crossroads
6 | Key figures 2016 Collecting and recycling
8 | Key figures 2016 Costs and revenues
10 | P+MD – on the eve of a new era Making the right choices for expanding the collection of plastic packaging
12 | Working together for more public cleanliness Mobilising all parties in the battle against litter
14 | Sorting – whenever and wherever Sorting away from home is the logical step
16 | Investing in cooperation and communication Crucial factors for efficient and sustainable recycling
18 | Contributing to a more sustainable economy Reducing the environmental impact throughout the chain
20 | Financial figures22 | Statutory bodies

4 I Annual Report 2016
At a major crossroads
William Vermeir Managing Director
Baudouin Van EeckhoutChairman
Dear Reader,
This past year was highlighted by two crucial themes for Fost Plus: the extended collection of plastic packaging and the battle against litter. We are happy to report that we have made significant breakthroughs on both fronts. Selective collection will be extended: once the optimal scenario has been determined, we will commence the general roll-out. On the litter front, Vlaanderen Mooi and Be WaPP have launched campaigns for increased public cleanliness on a scale never before seen in Belgium. And that’s just the beginning.
We are quite aware that many are following the progress of these projects with impatience. But we are not about to jump into the deep end. The introduction of a new collection scenario will have a major impact on all parties, so it cannot be taken lightly. Bringing about a sustainable change of behaviour in litter and public cleanliness will take time, and can only be assessed in the long-term.
In the meantime, the outside world is not standing still. There are dramatic changes to be seen everywhere within the recycling industry. European approval of the Circular Economy Package is gradually taking form and this will have a huge impact on how our economy deals with our resources. New technologies and new insights are gaining momentum, while new players are coming into the market.
In this rapidly evolving context, we need to continually exercise a critical eye as we examine our role and responsibility as an organisation. What role should we play in the future? How do
we keep our systems viable, affordable and acceptable for all stakeholders? These are all critical questions and our organisation is uniquely placed to bring the stakeholders in the packaging chain together to address them.
The time has come, in other words, to think outside the box and look for sustainable solutions that are in everyone’s best interest. We hope you will join us in our search.
The time has come to think outside the box and look for sustainable
solutions.

4 I Annual Report 2016

6 I Annual Report 2016
Key figures 2016 – Collection and recyclingIn 2016, 87.4% of the household packaging brought onto the market by Fost Plus members was recycled. 90.1% was valorized.
Collection and recycling resultsFost Plus recycled almost 680 kT of household packaging in 2016, accounting for 87.4% of the total volume placed on the market. Including recovery, we are valorizing 90.1% of all household packaging in Belgium. The figures per type of material reveal several striking trends. For example, our members declared less glass than in 2015, probably as a conse-quence of increased excise duties on spirits. As in previous years, we continue to see our
collection rates for paper-cardboard decrease due to parallel collection circuits and falling sales of newspapers and magazines. The Interregional Packaging Commission is investigat-ing whether the distribution key for paper-cardboard, in which only 25% of the collected volumes are considered packaging, is still correct.
Recycling and valorization results (tons)
MATERIAL Recycled tonsMarket (estimate) Members Fost Plus
Tons on market Recycling vs. market (1)
Tons declared by members
Recycling vs. tons declared
Paper-cardboard 179 089 218 483 82.0% 193 389 92.6%
Paper-cardboard 161 782 200 723 80.6% 175 971 91.9%
Beverage cartons 17 308 (5) 17 760 97.5% 17 417 99.4%
Glass 341 866 312 740 109.3% 294 687 116.0% (2)
Plastic 83 502 (3) (5) 230 659 36.2% 212 410 39.3%
Bottles and flasks 66 707 (5) 88 572 75.3% 85 763 77.8%
Metals 75 441 (3) (4) (5) 77 002 98.0% 73 509 102.6% (2)
Others 38 (3) 4 619 0.8% 4 148 0.9%
TOTAL RECYCLING 679 937 843 503 80.6% 778 142 87.4%
PMD residu (energy recovery) 20 864 2.7%
TOTAL VALORISATION 700 801 90.1%
(1) This recycling percentage is based on an estimate of the total market for household packaging and is provided for information purposes only.(2) The recycling percentage is higher than 100% . This is because, among other things, not all Belgian entities responsible for packaging are Fost Plus members. In the case of glass, the impact of parallel imports (estima-
ted at 30 KT) is also taken into account.(3) Including recycled materials not covered by the basic scenario, primarily polyethylene, polypropylene and polystyrene (see Article 8 of the Fost Plus accreditation).(4) Including metal packaging recovered from household waste incinerators and ash ripening centres: (29,673 t).(5) Tonnages test projects P+MD included.

6 I Annual Report 2016 Annual Report 2016 I 7
Recycled close to home Fost Plus strives to recycle collected materials as close to home as possible. This allows us to limit the environmental impact of transportation and logistics. It also simplifies inspec-tions carried out on the processing of the materials.
Specifically, in 2016 more than 99% of the collected household packaging was processed into recycled raw materials in Belgium or elsewhere in Europe. 74.1% was processed here in Belgium, 24.1% in our neighboring countries (the Netherlands, Germany and France) and 1.5% in the rest of Europe. Only a very limited amount (0.3%) was processed outside Europe.
European leader The latest figures from Eurostat – for the year 2014 – clearly show that Belgium is still leaving the rest of Europe behind when it comes to recy-cling packaging waste. The figures include household packaging as well as industrial packaging.
0%
10%
20%
30%
40%
50%
60%
70%
80%
90%
European goal
1.5%Europe other
0.3%Outside Europe
2.9%France
12.3%The Netherlands
8.9%Germany 74.1%
Belgium
Bel
gium
Czec
h R
epub
lic
Ger
man
y
Swed
en
Slov
enia
Spai
n
The
Net
herla
nds
Den
mar
k
Aus
tria
Italy
Slov
akia
Fran
ce
ave
rage
EU
Luxe
mbo
urg
Bul
garia
Port
ugal
Esto
nia
UK
Latv
ia
Finl
and
Nor
way
Pola
nd
Lith
uani
a
Croa
tia
Hun
gary
Liec
hten
stei
n
Mal
ta

8 I Annual Report 2016
Evolution of material revenues and member contributionsMaterial revenues fell slightly in 2016, to EUR 59.6 million compared to EUR 60.4 million in 2015. Prices for recycled PET reached historically low levels, partly due to persistently low oil prices. Prices for steel also remained subdued. The only bright spot was an increase in the prices of paper-cardboard, which compensated the decline somewhat.
However, the most striking aspect is the strong increase in member contributions, from EUR 64.2 million in 2015 to EUR 72.1 million in 2016 – an increase of 12.3%. Green Dot tariffs increased for quite a few materials. Here, increased member contributions offset two trends: falling material revenues on the one hand and rising Fost Plus costs on the other.
In 2016, we observed a further fall in material revenues and another strong rise in member contributions.
Key figures 2016 - Costs and revenuesFost Plus applies a transparent and simple financial model. The revenues from the sale of collected materials, together with the member contributions must cover all the collecting and sorting costs.
2007 2008 2009 2010 2011 2012 2013 2014 2015 20160
10
20
30
40
50
60
70
80
90
77,9
64,7
43,541,0
51,9
72,2
86,3
58,4
61,564,0
44,7
26,2
62,2 60,9
64,2
72,1
63,0
60,4
62,4
Revenues (mio EUR)
Member contributions
Material revenues
59,6

8 I Annual Report 2016 Annual Report 2016 I 9
Number of membersOn 31 December 2016, Fost Plus had 4,967 members. The number of members remained relatively stable in comparison with 2015. During the year, 173 new businesses joined Fost Plus. Companies that terminated their membership in 2016 generally did so because they have terminated their activities or because they are no longer responsible for packaging.
Tonnage and contributionsThe amount of packaging declared by our members in 2016 decreased by 0.7% compared to 2015, with a total of 778,100 tonnes. Their total contribution amounted to EUR 72.1 million, which is an increase of 12.3% compared to 2015. This evolution was mainly due to higher Green Dot tariffs for the majority of materials.
CompositionFood and beverages combined account for the largest share of disposable house-hold packaging, at 73% of the total weight and 69% of the total contribution. Furthermore, a limited number of members account for a high percentage of the total contribution. In 2016, 5% of members paid 89% of the total contribution.
Breakdown of revenues Member contributions and revenues from the sale of collected materials repre-sent 49.7% and 41.5% of our revenues, respectively. The member contribution has risen strongly in recent years, while material revenues show a downward trend.
Breakdown of costsOur costs were EUR 149.3 million in 2016, a 12.8% increase compared to 2015. An important part of that increase stems from the resources we are making available in our efforts to combat litter and increase public cleanliness. Other than that, the increase in waste levies and the introduction of road charging on heavy goods vehicles also play an important part.
Tonnage per group of products
Breakdown of revenues versus breakdown of costs
COSTS2016
0.3%Financial revenues
REVENUES2016
Food and beverages combined account for three quarters of the total amount of packaging declared.
TONNAGE
32%Food
41%Beverages
5%Hygiene and cosmetics
3%Cleaning and maintenance
12%Other
7%Service packaging
3.9% Communications
7.2% General costs
84.8%Operational costs
(collecting and sorting, quality control)
4.1%Contribution to
the Regions
49.7% Member contributions
41.5%Material revenues
8.4%Material
provisions

10 I Annual Report 2016
Successful test projects in six municipalitiesSix Belgian municipalities began test projects early in 2016 to investigate the extended collection of plastic packaging. The blue bag was replaced by a purple bag, into which residents could sort hard plastic packaging alongside normal PMD. Depending on the scenario, soft plastics such as films and bags were included as well. The test projects were closely monitored by an advisory committee including representatives from the local councils, regions, waste companies and the Interregional Packaging Commission.
Enthusiasm among residentsResidents were enthusiastic about the test projects and participated in vast numbers. The environmental benefit proved to be the strongest motivator. Residents think it is impor-tant that the extra packaging they sort is recycled appropriately. Depending upon the scenario, we were able to collect between 1.5 and 5.5 kg of extra packaging material per resident. And there is still room for improvement, because an examination of the residual waste bags showed that some types of packaging had not yet been sorted. When in doubt, residents clearly only sort the waste about which they are certain. A survey of participants indicated a clear preference for a scenario in which hard and soft plastics can go together.
Sorting centre investments neededThe extension calls for additional investments in the sorting centres. Participating centres succeeded fairly well in sorting the fractions during the course of the project, but improve-ments will have to be made in efficiency, quality and speed if the extended collection is to be introduced across the entire country. The investments are considerable and require a clear plan and commitment for the future.
Recycling remains a challengeThe extension’s success stands or falls on recycling at the end of the process. It is pointless to collect packaging for which there are no recycling applications. This does not pres-ent a problem for some packaging such as polypropylene-based or polyethylene-based
P+MD, on the eve of a new eraThe test projects for the extended collection of plastics have yielded very promising results. An in-depth analysis must now map out the ecological and economic impact of the various scenarios, so that we can make the right choices by the end of 2017.
Depending upon the scenario, we were able to collect between 1.5 and 5.5 kg of extra packaging material per resident.

10 I Annual Report 2016 Annual Report 2016 I 11
Fost Plus is fully committed to extending the plastic fraction and is currently investigating
which scenario is the most suitable one.
P+MD IN FIGURES
Test projects in
6 municipalities
Over
120,000 residents
4 sorting centres
Up to
5.5 kg extra collected per resident
Budget of EUR
1.3 million
products. Plastic films—about half of the P+MD collected—can also be recycled, provided they are of sufficiently consistent quality and investments are made in recycling technolo-gy and capacity.However, there are few or no applications for some types of packaging. Examples in this category include multilayer packaging and packaging made from opaque PET. Further research in close cooperation with the recycling companies should tell us whether it is worthwhile to collect this packaging.
Right choice for the futureThe introduction of a new plastics collection scenario will have a major effect upon all parties involved in waste collection, including municipalities, intermunicipal companies, waste companies, sorting centres and residents. Fost Plus wants a sustainable scenario, which guarantees optimal recycling. To this end, we commenced a study in late 2016 in which seven scenarios were compared, including the existing scenario with the pink bag which is used in a number of municipalities. Our aim is to determine which types of packaging should be collected, which collection methods are the most suitable and which fractions should be sorted. The results should allow us and our partners to determine the optimal scenario by the end of 2017.

12 I Annual Report 2016
MunicipalitiesTowards an effective policy of public cleanlinessThe municipalities and intermunicipal companies are crucial partners in our approach to litter. Vlaanderen Mooi and Be WaPP are helping them introduce sustainable and efficient public cleanliness policies that are adapted to local needs. In Flanders, 37 municipali-ties and 3 intermunicipal companies are being coached by staff from Vlaanderen Mooi (formerly Indevuilbak) over a two-year period. They work together to tackle problem areas and draw up plans for street cleaning and litter bins. In Wallonia, more than 170 municipal-ities have responded to a call for project initiated by Be WaPP to purchase street sweeping machines, litter bins and smoking poles. A budget of EUR 3.5 million has been set aside for this. Vlaanderen Mooi and Be WaPP also arrange information sessions and disseminate best practices across the entire country. Both organisations are encouraging municipalities to enforce their anti-littering policies more effectively.
Working together for more public cleanlinessIn 2016, Fost Plus signed agreements with the three regions to join forces and tackle the country’s litter problem, leading to the implementation of our ambitious plans. Today, we have two teams—one in Flanders and one in Wallonia—supporting everyone who wishes to work on a cleaner environment. We have already begun working together with the Brussels-Capital Region on similar initiatives in 2017.
OUR APPROACH TO LITTER IN FIGURES
Coaching of
57 Flemish communities
Over
40,000participants in the Grand Nettoyage
de Printemps (Great Spring Clean) in Wallonia
Over
1,100 stores keep their
surroundings clean and tidy
EUR
17 millionfunding from the industry
We are mobilising all parties in the battle against litter with a single objective: a sustainable
change in behaviour.

12 I Annual Report 2016 Annual Report 2016 I 13
CitizensA clean and tidy neighbourhood for allPublic cleanliness is dear to the heart for many people. Everyone likes a nice and clean neighbourhood. Many of our campaigns have mobilised large numbers of citizens. The Grand Nettoyage de Printemps (Great Spring Clean) in Wallonia involved more than 40,000 participants, twice as many as in 2015. In Flanders, essential materials such as bin bags, fluo-rescent jackets and grippers were provided during the many local spring cleaning campaigns. Both regions are working on reward systems for youth movements, associations, schools and individuals who take on the responsibility of keeping certain areas, parks or neighbourhoods clean on a permanent basis.
In Wallonia, the Grand Nettoyage de Printemps
(Great Spring Clean) campaign united over
40,000 participants.
CompaniesSincere financial and practical commitmentCompanies are making a significant financial contribution to the battle against litter through the collaboration agreements with the regions. An annual budget of EUR 17 million has been set aside to this end. But many companies are also very active on the ground. During the Retail Clean-Up Days for example, more than 1,100 Comeos members carried out large-scale clean-up campaigns around stores and supermarkets, covering an area equivalent to 1,150 football pitches. Likewise, Unizo had earlier launched a similar campaign for local shops. We are also seeing an increasing number of volunteer initiatives: businesses are raising awareness among their employees and suppliers, improving their litter bin infrastructure and organising clean-up campaigns as and when needed. They can also sign a charter, through their federations, in which they make a long-term commitment to greater public cleanliness.
LES MAGASINS BELGES FONT PLACE NETTE
DANS LEUR QUARTIERParticipez et inscrivez-vous chez votre responsable de magasin.
Du 21 au 27 novembre 2016, une série de magasins belges organisent avec leur personnel des opérations de ramassage des déchets dans leur quartier. Et notre magasin participe aussi ! Parce que vivre et faire ses courses dans un quartier propre c’est toujours plus agréable. Envie de vous retrousser les manches vous aussi ? Inscrivez-vous maintenant chez votre responsable de magasin. Plus d’infos sur www.bewapp.be

14 I Annual Report 2016
PMD collection in companiesCompulsory across BelgiumOn 1 January 2016 Wallonia introduced the PMD sorting obligation, in line with Brussels and Flanders. This means that businesses and organisations across Belgium are now required to collect their PMD selectively. The introduction of the new regulation had a positive effect on quantities collected: a rise from 4,800 tonnes in 2015 to 5,465 tonnes in 2016. These figures refer only to companies that have concluded a specific ‘PMD—Compa-nies’ contract with their waste collection company. In practice, the tonnages are signifi-cantly higher. A large proportion of the PMD collected from (smaller) businesses ends up in the domestic stream, for which no separate figures are available. We have also noticed an improvement in quality. The residual waste rate continued to fall, dropping to 21.8%.
The Sort Store makes it easyIn early 2016 the Sort Store, a brand-new web shop aimed at businesses and organisations seeking to introduce or improve their sorting, went live. Posters, stickers and other communi-cation materials can be downloaded and ordered there, and visitors can discover all kinds of tips and tricks to motivate staff and help avoid mistakes when sorting. More than 1,300 com-panies ordered their communication material from the shop in 2016 and orders continue to rise.
Sorting—whenever and whereverSorting away from home remains an important objective for Fost Plus. In 2016, the sorting of PMD became compulsory across the country; yet another step in the right direction. There is a clear demand from consumers too: wherever they go, they expect to be able to sort their waste just like they would at home.
Sorting is the logical step for more and more companies and organisations.”
PMD collected from companies (quantity in t)
2012 2013 2014 2015 20160
500
1.000
1.500
2.000
2.500
3.000
3.500
4.000
4.500
5.000
5.500
1.165
2.148
4.170
4.801
5.465

14 I Annual Report 2016 Annual Report 2016 I 15
Sorting is the logical step for more and more companies and organisations.”
SORTING AWAY FROM HOMEIN FIGURES
5,465 tonnesof PMD collected from companies
Over
27,000 PMD bags for events
115 sorting islands
at the Belgian seaside
Sorting away from homeCustom projectsOur efforts for sorting away from home largely centre on tourism and leisure time. We have opted for a specific approach, tailoring communication and infrastructure to the location and the target group. In recent years, we have helped various holiday parks, recreation areas, sports centres, zoos, camp sites and youth hostels to introduce waste sorting. We are also making our presence ever more keenly felt at large cultural and sports events. In 2016, for example, we worked together with the organisers of Tomorrowland.Over the past summer, more than 100 sorting islands appeared on the beaches of eight seaside municipalities, including Ostend and De Panne. We collected an estimated 5 tonnes of PMD. We also helped the Antwerp and Ostend airports introduce sorting, following on from our efforts at Brussels Airport. After a series of successful projects at Flemish universities, another 25,000 students at universities in Brussels and Wallonia have been actively sorting their waste since the beginning of the academic year.
Visitors of sports centres have been sorting their waste for a while now.

16 I Annual Report 2016
Investing in cooperation and communicationThe collection and recycling of household packaging waste involves a great many different parties, from the companies that put the packaged products on the market to the citizens who sort the packaging at home. Fost Plus invests in close cooperation and communication with all parties, enabling them to play their role in the system to the full.
Members and partners satisfiedSurveys of our members and partners have shown that they are highly satisfied with our activities. At least 94% of our members and 96% of our partners state that they are satisfied with the cooperation. They also see Fost Plus as an organisation which protects the environment, communicates well and provides high-quality services. Members are least satisfied with the annual declaration they are required to make, and the paperwork it involves. Partners give lower scores for the reporting and registration systems. Members and partners alike are very satisfied with the support they receive from our staff.
Basis for future improvementThe survey results offer a basis for future improvement projects. We are looking at how we might better assist members with their annual declaration, by offering more online support and continuing to optimise our applications. We are also investigating the potential for a standardized multi-declaration platform, in which members can use their data for declarations in other countries or for other organi-sations.At the same time, we are investing in a full renewal of our partners’ ICT applica-tions. We are working in close cooperation with the intermunicipal companies and waste companies to produce a new registration system for collected and sorted materials. We are also looking at whether and how new technologies, such as the Internet of Things, can bring added value to the monitoring, optimisation and fore-casting of the various activities in the field.
The extent to which Fost Plus helps protect our environment
The manner in which Fost Plus communicates
The extent to which Fost Plus delivers high-quality service
The extent to which Fost Plus operates efficiently
The extent to which Fost Plus is a dynamic organisation
94% of members are satisfied about their collaboration with Fost Plus…
The level of general satisfaction of Fost Plus members
The level of general satisfaction of Fost Plus partners
121 2 43 42
72 5 51 35
52 5 52 36
52 5 56 32
42 6 53 35
42 4 55 35
94 43 44
not at all satisfied not satisfied satisfied very satisfied extremely satisfied
not at all satisfied not satisfied satisfied very satisfied extremely satisfied
... along with 96% of partners
The extent to which Fost Plus helps protect our environment 124 40 45
The manner in which Fost Plus communicates 95 45 41
The extent to which Fost Plus delivers high-quality service 75 45 44
Reporting/Data Warehouse 28 45217
Profost registration system 31 12508
Contact person 39 39202

16 I Annual Report 2016 Annual Report 2016 I 17
Cooperation and communication
are crucial to efficient and sustainable recycling.”
Sorting for a better future“Think of the future, keep sorting.” This was the baseline for our most recent national cam-paign, which was continued in 2016 on the radio, television and social media. The aim is to motivate people and create a positive experience around sorting. The message establishes the link between the still exemplary sorting behaviour of consumers and its direct result: more recycling, a cleaner and tidier environment and a better future for our children. In 2017, we will continue our offensive on social media, where we aim to increase support for our activities and turn our followers into true ambassadors.

18 I Annual Report 2016
Contribution to a more sustainable economyEurope is fully committed to the recycling economy as witnessed by the ambitious Circular Economy Package. Companies must do all they can to assure re-use and recycling throughout the life cycle, from production and consumption through to waste management. Fost Plus supports its members in this process and makes great efforts to improve the sustainability of its own activities.
Not only do we help our members operate in a more sustainable way, we also assess our own activities.
More easily recycled packagingFost Plus helps its members to develop packaging which is both more sustainable and easier to recycle. We accomplish this by disseminating information on materials which are hard to recycle, such as opaque PET, and keeping our members up to date regarding sus-tainable alternatives. In November 2016, for example, we held our third Greener Packaging Seminar, which attracted a great deal of interest.
Our members can also come to us for specific advice. We were closely involved in the de-velopment of new meat packaging for an important retailer and helped various companies to develop a sustainable packaging policy. We also offer a variety of tools with which com-panies can test and improve the recyclability of their packaging. Finally, we began a study in 2016 to identify the global environmental impact of collection and recycling, including the reduction of CO2 emissions, the positive effect on water consumption and air quality and the more sustainable use of raw materials.
Fost Plus offers a variety of tools with which companies can test and improve the recyclability of their packaging.

18 I Annual Report 2016 Annual Report 2016 I 19
Lean & Green AwardIn June 2016 Fost Plus had the honour of receiving the Lean and Green Award from the Flanders Institute for Logistics. The award recognises companies that draw up a specific plan to emit 20% less CO2 in the next five years. To achieve this objective Fost Plus works in close cooperation with the intermunicipal companies and waste com-panies directly involved in the collection of the materials in the field. Attention is paid to a broad range of activities including the optimisation of collection routes to reduce the kilometres travelled, trainings on eco-friendly driving and investments in a more environmentally-friendly fleet.
&
Clear e-commerce rulesOnline shopping has been growing in popularity for years. Today, it is estimated that about 6% of Belgian trade takes place through the internet, and 40% of this is with foreign companies: a trend which presents Fost Plus with several challenges. Online shopping leads to an increase in transport packaging and the use of additional protective materials. Not all foreign traders are Fost Plus members. In 2016, we set out guidelines for the packaging responsibilities of these companies. They are aimed primarily at web shops which specifically address the Belgian market.

20 I Annual Report 2016
Profit and loss account (EUR)
Financial figures
Profit and loss accountOperating income amounts to EUR 157 million. It comes from two principal sources: material revenues and contributions of members. Material revenues amount to EUR 84.7 million including revenue of EUR 25.1 million from non-packaging paper-cardboard. These revenues are transferred to the intermunicipal companies. Material revenues are at ap-proximately the same level as in 2015. Member contributions amount to EUR 72.1 million.
Operating expenses amount to EUR 161.6 million. The “miscellaneous services and goods” (EUR 166.8 million) include collection and sorting costs, the transferred revenues from non-packaging paper-cardboard, the contribution to the regions, the costs of tackling lit-ter, and the costs of communications, IT and other services. The negative sum of EUR 12.1 million for “provisions for risks and losses” comprises an amount receivable for material revenues of EUR 6.15 million, which will be factored into future Green Dot tariffs, and a return of EUR 5.92 million from material provisions accrued in previous years.
The profit and loss account closes with a negative result of EUR 4.6 million.
Allocation of resultsIn accordance with Article 17 of the Articles of Association, the Board of Directors propos-es carrying over the negative result of this financial year (EUR 4,646,080), as well as the results carried over from previous financial years, to the next financial year.
2016 2015
Turnover 156,057,633 146,799,985
Other operating income 977,794 966,477
SALES AND SERVICES 157,035,427 147,766,462
Miscellaneous services and goods 166,839,218 149,457,934
Salaries and social security charges 5,753,429 5,091,341
Depreciation 970,205 959,531
Write-downs -36,123 50,133
Provisions for risks and losses -12,067,640 -12,165,105
Other operating expenses 174,963 220,235
COST OF SALES AND SERVICES 161,634,052 143,614,069
OPERATING RESULT -4,598,625 4,152,393
Income from circulating assets 30,523 124,694
Other financial income 43,502 12,612
FINANCIAL INCOME 74,025 137,306
Other financial expenses 121,480 99,914
FINANCIAL EXPENSES 121,480 99,914
RESULT -4,646,080 4,189,785
EXCEPTIONAL EXPENSES 3,192
RESULT TO BE APPLIED -4,646,080 4,186,593
20 I Annual Report 2016 Annual Report 2016 I 21
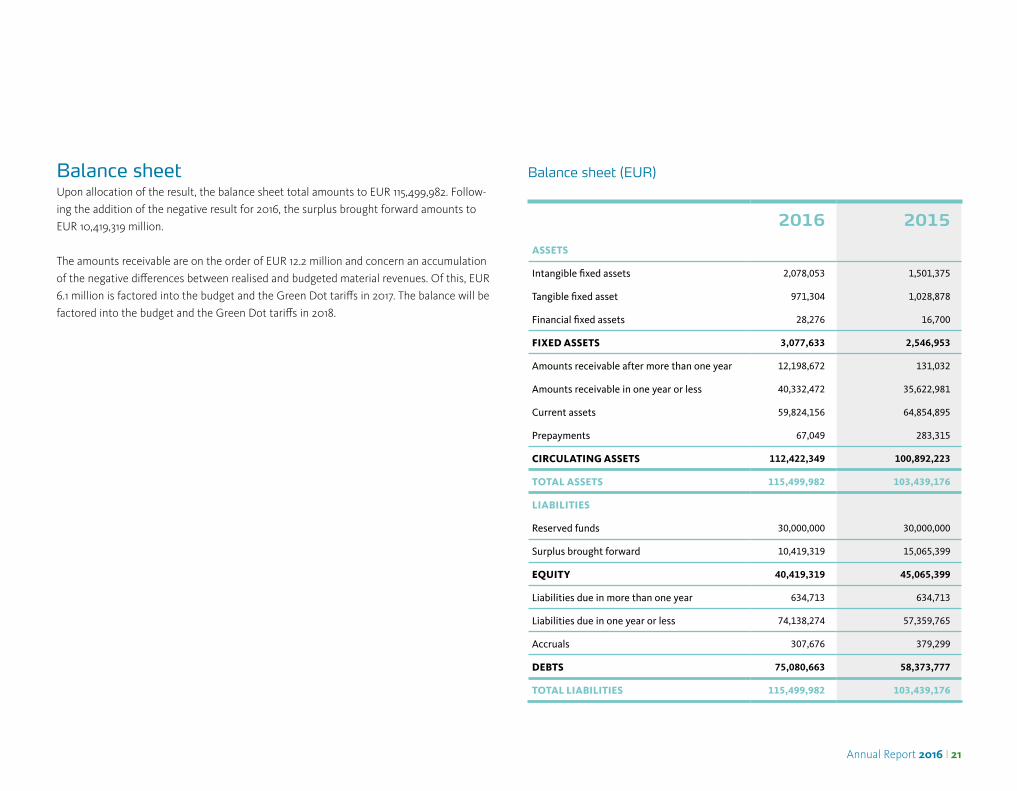
Balance sheet (EUR)Balance sheetUpon allocation of the result, the balance sheet total amounts to EUR 115,499,982. Follow-ing the addition of the negative result for 2016, the surplus brought forward amounts to EUR 10,419,319 million.
The amounts receivable are on the order of EUR 12.2 million and concern an accumulation of the negative differences between realised and budgeted material revenues. Of this, EUR 6.1 million is factored into the budget and the Green Dot tariffs in 2017. The balance will be factored into the budget and the Green Dot tariffs in 2018.
2016 2015ASSETS
Intangible fixed assets 2,078,053 1,501,375
Tangible fixed asset 971,304 1,028,878
Financial fixed assets 28,276 16,700
FIXED ASSETS 3,077,633 2,546,953
Amounts receivable after more than one year 12,198,672 131,032
Amounts receivable in one year or less 40,332,472 35,622,981
Current assets 59,824,156 64,854,895
Prepayments 67,049 283,315
CIRCULATING ASSETS 112,422,349 100,892,223
TOTAL ASSETS 115,499,982 103,439,176
LIABILITIES
Reserved funds 30,000,000 30,000,000
Surplus brought forward 10,419,319 15,065,399
EQUITY 40,419,319 45,065,399
Liabilities due in more than one year 634,713 634,713
Liabilities due in one year or less 74,138,274 57,359,765
Accruals 307,676 379,299
DEBTS 75,080,663 58,373,777
TOTAL LIABILITIES 115,499,982 103,439,176

22 I Annual Report 2016
Statutory bodies (as of 01.01.2017)
Associate membersACE Belgium • Agoria • Aldi Holding • Aleris Aluminium • Amcor Flexibles Transpac • Beiersdorf • Boost Nutrition • Borealis Polymers • Brasseries Alken-Maes • Brasseurs Belges • Buurtsuper.be • Carrefour Belgium • Coca-Cola European Partners • Colgate-Palmolive Belgium • Comeos • Confédération Belge de l’Industrie Laitière • Danone Belgique • Detic • Douwe Egberts Retail Belgium • Enteco • Etn. Delhaize Frères et Cie Le Lion • Etn. Fr. Colruyt • Federplast.be • Ferrero • Fetra • Fevia • FrieslandCampina Belgium • GSV • Henkel Belgium • Ikea Belgium • InBev Belgium • Inovyn Manufacturing Belgium • L’Oréal Belgilux • Lotus Bakeries • Makro Cash & Carry Belgium • Mars Belgium • Mondelez Belgium • Nestlé Belgilux • Nutricia Belgique • O-I Europe •Pharma.be • Procter & Gamble Distribution Company (Europe) • Sources Top • Spadel • Tabaserv • Total Petrochemicals & Refining • Unilever Belgium • Van Genechten Packaging • Vandemoortele Lipids • Vinum & Spiritus Association Belgium • VPK Packaging Group
Board of DirectorsChairman:
B. Van EeckhoutSecretary:
J. GoossensAuditor:
KPMG Réviseurs d’EntreprisesMembers:
L. Ardies - Buurtsuper.be • A. Adriaensen - Pharma.be J. Clinkemalie - Henkel • T. Couplez - Friesland Campina D. De Ridder - Ikea • F. De Roose - Aleris Aluminium J. de Somer - Van Genechten Packaging • K. De Vries - Unilever Belgium • P. Diercxsens - Danone Belgium M. du Bois - Spadel • J. Eylenbosch - Coca-Cola
European Partners • T. Lammens - Etn. Delhaize Frères et Cie Le Lion • P. Léglise - Carrefour Belgium J.-P. Lenoir - Arcelor Mittal • C. Moris - Fevia F. Poets - Inbev Belgium • S. Rijckbosch - L’Oreal K. Roelstraete - Tabaserv N. Robin - O.I. Europe H. Van Roost - Total Petrochemicals & Refining W. Van Veen - Fetra • F. Vandewal - ACE BelgiumP. Ven - Federplast.be • M. Vercaeren - Etn. Fr. Colruyt W. Vermeir - Fost Plus
Observers:V. Biebel - VBO • A. Deplae - UCM A. Lebrun - UWE • A. Nachtergaele - FEVIA E. Vanassche - VOKA • P. Vanden Abeele - UNIZO L. Verheyen - BECI • G. Verwilghen - COMEOS F. Van Tiggelen - Detic
Executive CommitteeChairman:
W. VermeirMembers:
D. De Ridder, P. Diercxsens, M. du Bois, P. Léglise, H. Van Roost
Observer:B. Van Eeckhout
Remuneration CommitteeChairman:
B. Van Eeckhout Members:
J. Cauwenberghs, K. De Maesschalck, G. Rollo Collura, S. Van den Eynde, J. Goossens, W. Vermeir
Audit CommitteeChairman:
B. Van EeckhoutMembers: K. De Vries, H. Van Roost, J. Goossens, W. Vermeir
Fost Plus work groups• Communication J. Goossens, Director Finance & Communication• Materials Glass, metals, paper-cardboard, drinks cartons
and plastics M. Van Gaever, Director Operations• Research & Development S. Boussemaere, Director Projects & Development• Green Dot J. Goossens, Director Finance & Communication• Operations M. Van Gaever, Director Operations• Legislation J. Goossens, Director Finance & Communication• Prevention S. Boussemaere, Director Projects & Development• Litter S. Boussemaere, Director Projects & Development• Public & Regulatory Affairs
W. Vermeir, Managing Director

22 I Annual Report 2016

© Fost Plus June 2017Editor: Johan Goossens • Production: Bold&pepper nv • Printed on recycled paper.
Fost Plus vzw • Olympiadenlaan 2 • BE-1140 BrusselT + 32 2 775 03 50 • F + 32 2 771 16 96 • [email protected] www.fostplus.be