Embed Size (px)
Citation preview

Package ‘stpm’August 20, 2017
Type Package
Title Stochastic Process Model for Analysis of Longitudinal andTime-to-Event Outcomes
Version 1.6.8
Date 2017-08-20
Author I. Y. Zhbannikov, Liang He, K. G. Arbeev, A. I. Yashin.
Maintainer Ilya Y. Zhbannikov <[email protected]>
Description Utilities to estimate parameters of the models with survival functionsinduced by stochastic covariates. Miscellaneous functions for data preparationand simulation are also provided. For more information, see:(i)``Stochastic model for analysis of longitudinal data on aging and mortality''by Yashin A. et al. (2007),Mathematical Biosciences, 208(2), 538-551, <DOI:10.1016/j.mbs.2006.11.006>;(ii) ``Health decline, aging and mortality: how are they related?''by Yashin A. et al. (2007),Biogerontology 8(3), 291(302), <DOI:10.1007/s10522-006-9073-3>.
License GPL
Imports sas7bdat,stats,nloptr,survival,tools
LinkingTo Rcpp,RcppArmadillo
Depends R (>= 2.10), Rcpp (>= 0.11.1), mice
VignetteBuilder knitr
Suggests knitr (>= 1.11)
RoxygenNote 6.0.1
NeedsCompilation yes
Repository CRAN
Date/Publication 2017-08-20 16:20:17 UTC
R topics documented:ex_data . . . . . . . . . . . . . . . . . . . . . . . . . . . . . . . . . . . . . . . . . . . 2
1

2 ex_data
func1 . . . . . . . . . . . . . . . . . . . . . . . . . . . . . . . . . . . . . . . . . . . . 3getNextY.cont . . . . . . . . . . . . . . . . . . . . . . . . . . . . . . . . . . . . . . . . 3getNextY.cont2 . . . . . . . . . . . . . . . . . . . . . . . . . . . . . . . . . . . . . . . 4getNextY.discr . . . . . . . . . . . . . . . . . . . . . . . . . . . . . . . . . . . . . . . . 5getNextY.discr.m . . . . . . . . . . . . . . . . . . . . . . . . . . . . . . . . . . . . . . 5getPrevY.discr . . . . . . . . . . . . . . . . . . . . . . . . . . . . . . . . . . . . . . . . 6getPrevY.discr.m . . . . . . . . . . . . . . . . . . . . . . . . . . . . . . . . . . . . . . 6longdat . . . . . . . . . . . . . . . . . . . . . . . . . . . . . . . . . . . . . . . . . . . 7m . . . . . . . . . . . . . . . . . . . . . . . . . . . . . . . . . . . . . . . . . . . . . . 7mu . . . . . . . . . . . . . . . . . . . . . . . . . . . . . . . . . . . . . . . . . . . . . . 8prepare_data . . . . . . . . . . . . . . . . . . . . . . . . . . . . . . . . . . . . . . . . . 8prepare_data_cont . . . . . . . . . . . . . . . . . . . . . . . . . . . . . . . . . . . . . . 9prepare_data_discr . . . . . . . . . . . . . . . . . . . . . . . . . . . . . . . . . . . . . 10sigma_sq . . . . . . . . . . . . . . . . . . . . . . . . . . . . . . . . . . . . . . . . . . 11simdata_cont . . . . . . . . . . . . . . . . . . . . . . . . . . . . . . . . . . . . . . . . 11simdata_discr . . . . . . . . . . . . . . . . . . . . . . . . . . . . . . . . . . . . . . . . 12simdata_gamma_frailty . . . . . . . . . . . . . . . . . . . . . . . . . . . . . . . . . . . 14simdata_time_dep . . . . . . . . . . . . . . . . . . . . . . . . . . . . . . . . . . . . . . 15sim_pobs . . . . . . . . . . . . . . . . . . . . . . . . . . . . . . . . . . . . . . . . . . 16spm . . . . . . . . . . . . . . . . . . . . . . . . . . . . . . . . . . . . . . . . . . . . . 17spm.impute . . . . . . . . . . . . . . . . . . . . . . . . . . . . . . . . . . . . . . . . . 19spm_continuous . . . . . . . . . . . . . . . . . . . . . . . . . . . . . . . . . . . . . . . 20spm_con_1d . . . . . . . . . . . . . . . . . . . . . . . . . . . . . . . . . . . . . . . . . 22spm_con_1d_g . . . . . . . . . . . . . . . . . . . . . . . . . . . . . . . . . . . . . . . 23spm_discrete . . . . . . . . . . . . . . . . . . . . . . . . . . . . . . . . . . . . . . . . 25spm_pobs . . . . . . . . . . . . . . . . . . . . . . . . . . . . . . . . . . . . . . . . . . 26spm_projection . . . . . . . . . . . . . . . . . . . . . . . . . . . . . . . . . . . . . . . 28spm_time_dep . . . . . . . . . . . . . . . . . . . . . . . . . . . . . . . . . . . . . . . . 29stpm . . . . . . . . . . . . . . . . . . . . . . . . . . . . . . . . . . . . . . . . . . . . . 31trim . . . . . . . . . . . . . . . . . . . . . . . . . . . . . . . . . . . . . . . . . . . . . 32trim.leading . . . . . . . . . . . . . . . . . . . . . . . . . . . . . . . . . . . . . . . . . 32trim.trailing . . . . . . . . . . . . . . . . . . . . . . . . . . . . . . . . . . . . . . . . . 32vitstat . . . . . . . . . . . . . . . . . . . . . . . . . . . . . . . . . . . . . . . . . . . . 33
Index 34
ex_data This is the longitudinal genetic dataset.
Description
This is the longitudinal genetic dataset.
Author(s)
Liang He

func1 3
func1 An internal function to compute m and gamma based on continuous-time model (Yashin et. al., 2007)
Description
An internal function to compute m and gamma based on continuous-time model (Yashin et. al.,2007)
Usage
func1(tt, y, a, f1, Q, f, b, theta)
Arguments
tt tt - time
y y
a a (see Yashin et. al, 2007)
f1 f1 (see Yashin et. al, 2007)
Q Q (see Yashin et. al, 2007)
f f (see Yashin et. al, 2007)
b b (see Yashin et. al, 2007)
theta theta
Value
list(m, gamma) Next values of m and gamma (see Yashin et. al, 2007)
getNextY.cont An internal function to compute next Y based on continous-time model(Yashin et. al., 2007)
Description
An internal function to compute next Y based on continous-time model (Yashin et. al., 2007)
Usage
getNextY.cont(y1, t1, t2, a, f1, Q, f, b, mu0, theta, u, R)

4 getNextY.cont2
Arguments
y1 y1
t1 t1
t2 t2
a a (see Yashin et. al, 2007)
f1 f1 (see Yashin et. al, 2007)
Q Q (see Yashin et. al, 2007)
f f (see Yashin et. al, 2007)
b b (see Yashin et. al, 2007)
mu0 mu (see Yashin et. al, 2007)
theta theta (see Yashin et. al, 2007)
u (see Akushevich et. al, 2007)
R (see Akushevich et. al, 2007)
Value
y.next Next value of Y
getNextY.cont2 An internal function to compute next value of physiological variable Y
Description
An internal function to compute next value of physiological variable Y
Usage
getNextY.cont2(y1, t1, t2, b, a, f1)
Arguments
y1 y1
t1 t1
t2 t2
b b (see Yashin et. al, 2007)
a a (see Yashin et. al, 2007)
f1 f1 (see Yashin et. al, 2007)
Value
y.next Next value of y

getNextY.discr 5
getNextY.discr An internal function to compute the next value of physiological vari-able Y based on discrete-time model (Akushevich et. al., 2005)
Description
An internal function to compute the next value of physiological variable Y based on discrete-timemodel (Akushevich et. al., 2005)
Usage
getNextY.discr(y1, u, R, Sigma)
Arguments
y1 y1
u u (see Akushevich et. al, 2005)
R R (see Akushevich et. al, 2005)
Sigma Sigma (see Akushevich et. al, 2005)
Value
y.next Next value of y
getNextY.discr.m An internal function to compute next m based on dicrete-time model
Description
An internal function to compute next m based on dicrete-time model
Usage
getNextY.discr.m(y1, u, R)
Arguments
y1 y1
u u
R R
Value
m Next value of m (see Yashin et. al, 2007)

6 getPrevY.discr.m
getPrevY.discr An internal function to compute previous value of physiological vari-able Y based on discrete-time model
Description
An internal function to compute previous value of physiological variable Y based on discrete-timemodel
Usage
getPrevY.discr(y2, u, R, Sigma)
Arguments
y2 y2
u u
R R
Sigma Sigma
Value
y1 Previous value of y
getPrevY.discr.m An internal function to compute previous m based on discrete-timemodel
Description
An internal function to compute previous m based on discrete-time model
Usage
getPrevY.discr.m(y2, u, R)
Arguments
y2 y2
u u
R R
Value
m Next value of m (see Yashin et. al, 2007)

longdat 7
longdat This is the longitudinal dataset.
Description
This is the longitudinal dataset.
Author(s)
Ilya Y Zhbannikov <[email protected]>
m An internal function to compute m from
Description
An internal function to compute m from
Usage
m(y, t1, t2, a, f1)
Arguments
y Current value of Y
t1 t1
t2 t2
a a (see Yashin et. al, 2007)
f1 f1 (see Yashin et. al, 2007)
Value
m m (see Yashin et. al, 2007)

8 prepare_data
mu An internal function to compute mu
Description
An internal function to compute mu
Usage
mu(y, mu0, b, Q, theta, tt)
Arguments
y Current value of y
mu0 mu0 (see Yashin et. al, 2007)
b b (see Yashin et. al, 2007)
Q Q (see Yashin et. al, 2007)
theta theta (see Yashin et. al, 2007)
tt t (time)
Value
mu Next value of mu
prepare_data Data pre-processing for analysis with stochastic process modelmethodology.
Description
Data pre-processing for analysis with stochastic process model methodology.
Usage
prepare_data(x, col.id = NULL, col.status = NULL, col.age = NULL,col.age.event = NULL, covariates = NULL, interval = 1, impute = TRUE,verbose = FALSE)

prepare_data_cont 9
Arguments
x A path to the file with table of follow-up oservations (longitudinal table). Fileformats: csv, sas7bdat
col.id A name of column containing subject ID. This ID should be the same in bothx (longitudinal) and y (vital statistics) tables. None: if col.id not provided, thefirst column of the x and first column of the y will be used by default.
col.status A name of the column containing status variable (0/1, which is an indicator ofdeath/censoring). Note: if not provided - then the column #2 from the y (vitalstatistics) dataset will be used.
col.age A name of age column (also called ’t1’). This column represents a time (age) ofmeasurement. If not provided then the 3rd column from the longitudinal dataset(x) will be used.
col.age.event A name of ’event’ column. The event column indicates a time when the evenoccured (e.g. system failure). Note: if not provided then the 3rd column fromthe y (vital statistics) dataset will be used.
covariates A list of covariates (physiological variables). If covariates not provided, then allcolumns from longitudinal table having index > 3 will be used as covariates.
interval A number of breaks between observations for data for discrete model. Thisinterval must be numeric (integer). Default = 1 unit of time.
impute Multiple imputation ndicator. If TRUE then missing observations will be im-puted with multiple imputation. Default = TRUE.
verbose A verbosing output indicator. Default=FALSE.
Value
A list of two elements: first element contains a preprocessed data for continuous model, with ar-bitrary intervals between observations and second element contains a prepocessed data table for adiscrete model (with constant intervals between observations).
Examples
## Not run:library(stpm)data <- prepare_data(x=system.file("extdata","longdat.csv",package="stpm"))head(data[[1]])head(data[[2]])
## End(Not run)
prepare_data_cont Prepares continuouts-time dataset.
Description
Prepares continuouts-time dataset.

10 prepare_data_discr
Usage
prepare_data_cont(merged.data, col.status.ind, col.id.ind, col.age.ind,col.age.event.ind, col.covar.ind, verbose, impute, dt)
Arguments
merged.data a longitudinal study dataset.
col.status.ind index of "status" column.
col.id.ind subject id column index.
col.age.ind index of the age column.col.age.event.ind
an index of the column which represents the time in which event occured.
col.covar.ind a set of column indexes which represent covariates.
verbose turns on/off verbosing output.
impute Multiple imputation ndicator. If TRUE then missing observations will be im-puted with multiple imputation.
dt interval between observations.
prepare_data_discr Prepares discrete-time dataset.
Description
Prepares discrete-time dataset.
Usage
prepare_data_discr(merged.data, interval, col.status.ind, col.id.ind,col.age.ind, col.age.event.ind, col.covar.ind, verbose, impute)
Arguments
merged.data a longitudinal study dataset.
interval interval between observations.
col.status.ind index of "status" column.
col.id.ind subject id column index.
col.age.ind index of the age column.col.age.event.ind
an index of the column which represents the time in which event occured.
col.covar.ind a set of column indexes which represent covariates.
verbose turns on/off verbosing output.
impute Multiple imputation ndicator. If TRUE then missing observations will be im-puted with multiple imputation. Filling the last cell

sigma_sq 11
sigma_sq An internal function to compute sigma square analytically
Description
An internal function to compute sigma square analytically
Usage
sigma_sq(t1, t2, b)
Arguments
t1 t1
t2 t2
b b (see Yashin et. al, 2007)
Value
sigma_square (see Akushevich et. al, 2005)
simdata_cont Multi-dimensional simulation function for continuous-time SPM.
Description
Multi-dimensional simulation function for continuous-time SPM.
Usage
simdata_cont(N = 10, a = -0.05, f1 = 80, Q = 2e-08, f = 80, b = 5,mu0 = 1e-05, theta = 0.08, ystart = 80, tstart = 30, tend = 105,dt = 1, sd0 = 1, nobs = NULL, gomp = TRUE)
Arguments
N Number of individuals.
a A k by k matrix, represents the adaptive capacity of the organism
f1 A trajectory that corresponds to the long-term average value of the stochasticprocess Y(t), which describes a trajectory of individual covariate (physiologicalvariable) influenced by different factors represented by a random Wiener processW(t). This is a vector with length of k.
Q A matrix k by k, which is a non-negative-definite symmetric matrix, representsa sensitivity of risk function to deviation from the norm.
12 simdata_discr
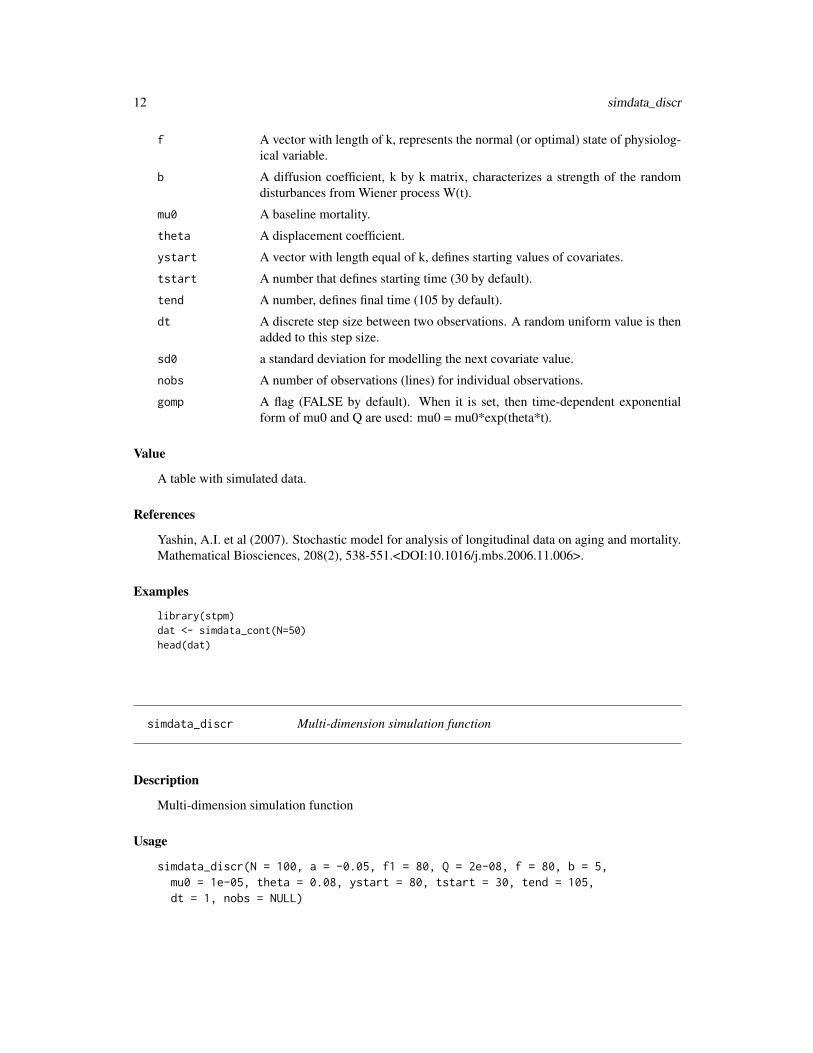
f A vector with length of k, represents the normal (or optimal) state of physiolog-ical variable.
b A diffusion coefficient, k by k matrix, characterizes a strength of the randomdisturbances from Wiener process W(t).
mu0 A baseline mortality.
theta A displacement coefficient.
ystart A vector with length equal of k, defines starting values of covariates.
tstart A number that defines starting time (30 by default).
tend A number, defines final time (105 by default).
dt A discrete step size between two observations. A random uniform value is thenadded to this step size.
sd0 a standard deviation for modelling the next covariate value.
nobs A number of observations (lines) for individual observations.
gomp A flag (FALSE by default). When it is set, then time-dependent exponentialform of mu0 and Q are used: mu0 = mu0*exp(theta*t).
Value
A table with simulated data.
References
Yashin, A.I. et al (2007). Stochastic model for analysis of longitudinal data on aging and mortality.Mathematical Biosciences, 208(2), 538-551.<DOI:10.1016/j.mbs.2006.11.006>.
Examples
library(stpm)dat <- simdata_cont(N=50)head(dat)
simdata_discr Multi-dimension simulation function
Description
Multi-dimension simulation function
Usage
simdata_discr(N = 100, a = -0.05, f1 = 80, Q = 2e-08, f = 80, b = 5,mu0 = 1e-05, theta = 0.08, ystart = 80, tstart = 30, tend = 105,dt = 1, nobs = NULL)

simdata_discr 13
Arguments
N Number of individuals
a A k by k matrix, which characterize the rate of the adaptive response.
f1 A particular state, which is a deviation from the normal (or optimal). This is avector with length of k.
Q A matrix k by k, which is a non-negative-definite symmetric matrix.
f A vector-function (with length k) of the normal (or optimal) state.
b A diffusion coefficient, k by k matrix.
mu0 mortality at start period of time.
theta A displacement coefficient of the Gompertz function.
ystart A vector with length equal to number of dimensions used, defines starting valuesof covariates. Default ystart = 80.
tstart Starting time (age). Can be a number (30 by default) or a vector of two num-bers: c(a, b) - in this case, starting value of time is simulated via uniform(a,b)distribution.
tend A number, defines final time (105 by default).
dt A time step (1 by default).
nobs A number, defines a number of observations (lines) for an individual, NULL bydefault.
Value
A table with simulated data.
References
Akushevich I., Kulminski A. and Manton K. (2005), Life tables with covariates: Dynamic modelfor Nonlinear Analysis of Longitudinal Data. Mathematical Population Studies, 12(2), pp.: 51-80.<DOI:10.1080/08898480590932296>.
Examples
library(stpm)data <- simdata_discr(N=100)head(data)

14 simdata_gamma_frailty
simdata_gamma_frailty This script simulates data using familial frailty model.We use the following variation: gamma(mu, ssq),where mu is the mean and ssq is sigma square. See:https://www.rocscience.com/help/swedge/webhelp/swedge/Gamma_Distribution.htm
Description
This script simulates data using familial frailty model. We use the following variation: gamma(mu,ssq), where mu is the mean and ssq is sigma square. See: https://www.rocscience.com/help/swedge/webhelp/swedge/Gamma_Distribution.htm
Usage
simdata_gamma_frailty(N = 10, f = list(at = "-0.05", f1t = "80", Qt ="2e-8", ft = "80", bt = "5", mu0t = "1e-3"), step = 1, tstart = 30,tend = 105, ystart = 80, sd0 = 1, nobs = NULL, gamma_mu = 1,gamma_ssq = 0.5)
Arguments
N Number of individuals.
f a list of formulas that define age (time) - dependency. Default: list(at="a",f1t="f1", Qt="Q*exp(theta*t)", ft="f", bt="b", mu0t="mu0*exp(theta*t)")
step An interval between two observations, a random uniformally-distributed valueis then added to this step.
tstart Starting time (age). Can be a number (30 by default) or a vector of two num-bers: c(a, b) - in this case, starting value of time is simulated via uniform(a,b)distribution.
tend A number, defines final time (105 by default).
ystart A starting value of covariates.
sd0 A standard deviation for modelling the next covariate value, sd0 = 1 by default.
nobs A number of observations (lines) for individual observations.
gamma_mu A parameter which is a mean value, default = 1
gamma_ssq A sigma squared, default = 0.5.
Value
A table with simulated data.
References
Yashin, A. et al (2007), Health decline, aging and mortality: how are they related? Biogerontology,8(3), 291-302.<DOI:10.1007/s10522-006-9073-3>.

simdata_time_dep 15
Examples
library(stpm)dat <- simdata_gamma_frailty(N=10)head(dat)
simdata_time_dep Simulation function for continuous trait with time-dependant coeffi-cients.
Description
Simulation function for continuous trait with time-dependant coefficients.
Usage
simdata_time_dep(N = 10, f = list(at = "-0.05", f1t = "80", Qt = "2e-8", ft= "80", bt = "5", mu0t = "1e-3"), step = 1, tstart = 30, tend = 105,ystart = 80, sd0 = 1, nobs = NULL)
Arguments
N Number of individuals.
f a list of formulas that define age (time) - dependency. Default: list(at="a",f1t="f1", Qt="Q*exp(theta*t)", ft="f", bt="b", mu0t="mu0*exp(theta*t)")
step An interval between two observations, a random uniformally-distributed valueis then added to this step.
tstart Starting time (age). Can be a number (30 by default) or a vector of two num-bers: c(a, b) - in this case, starting value of time is simulated via uniform(a,b)distribution.
tend A number, defines final time (105 by default).
ystart A starting value of covariates.
sd0 A standard deviation for modelling the next covariate value, sd0 = 1 by default.
nobs A number of observations (lines) for individual observations.
Value
A table with simulated data.
References
Yashin, A. et al (2007), Health decline, aging and mortality: how are they related? Biogerontology,8(3), 291-302.<DOI:10.1007/s10522-006-9073-3>.

16 sim_pobs
Examples
library(stpm)dat <- simdata_time_dep(N=100)head(dat)
sim_pobs Multi-dimension simulation function for data with partially observedcovariates (multidimensional GenSPM) with arbitrary intervals
Description
Multi-dimension simulation function for data with partially observed covariates (multidimensionalGenSPM) with arbitrary intervals
Usage
sim_pobs(N = 10, aH = -0.05, aL = -0.01, f1H = 60, f1L = 80,QH = 2e-08, QL = 2.5e-08, fH = 60, fL = 80, bH = 4, bL = 5,mu0H = 8e-06, mu0L = 1e-05, thetaH = 0.08, thetaL = 0.1, p = 0.25,ystart = 80, tstart = 30, tend = 105, dt = 1, sd0 = 1,mode = "observed", gomp = FALSE, nobs = NULL)
Arguments
N Number of individuals.
aH A k by k matrix, which characterize the rate of the adaptive response when Z =1.
aL A k by k matrix, which characterize the rate of the adaptive response when Z =0.
f1H A particular state, which if a deviation from the normal (or optimal) when Z =1. This is a vector with length of k.
f1L A particular state, which if a deviation from the normal (or optimal) when Z =0. This is a vector with length of k.
QH A matrix k by k, which is a non-negative-definite symmetric matrix when Z = 1.
QL A matrix k by k, which is a non-negative-definite symmetric matrix when Z = 0.
fH A vector-function (with length k) of the normal (or optimal) state when Z = 1.
fL A vector-function (with length k) of the normal (or optimal) state when Z = 0.
bH A diffusion coefficient, k by k matrix when Z = 1.
bL A diffusion coefficient, k by k matrix when Z = 0.
mu0H mortality at start period of time when Z = 1.
mu0L mortality at start period of time when Z = 0.
thetaH A displacement coefficient of the Gompertz function when Z = 1.

spm 17
thetaL A displacement coefficient of the Gompertz function when Z = 0.
p A proportion of carriers in a sumulated population (default p = 0.25).
ystart A vector with length equal to number of dimensions used, defines starting valuesof covariates.
tstart A number that defines starting time (30 by default).
tend A number, defines final time (105 by default).
dt A discrete step size between two observations. A random uniform value is thenadded to this step size.
sd0 A standard deviation for modelling the next physiological variable (covariate)value.
mode Can have the following values: "observed" (default), "unobserved". This repre-sents a type of group to simulate: a group with observed variable Z, or groupwith unbobserved variable Z.
gomp A flag (FALSE by default). When it is set, then time-dependent exponentialform of mu0 and Q are used: mu0 = mu0*exp(theta*t).
nobs A number of observations (lines) for individual observations.
Value
A table with simulated data.
References
Arbeev, K.G. et al (2009). Genetic model for longitudinal studies of aging, health, and longevity
Yashin, A.I. et al (2007). Stochastic model for analysis of longitudinal data on aging and mortality.Mathematical Biosciences, 208(2), 538-551.<DOI:10.1016/j.mbs.2006.11.006>.
Examples
library(stpm)dat <- sim_pobs(N=50)head(dat)
spm A central function that estimates Stochastic Process Model parametersa from given dataset.
Description
A central function that estimates Stochastic Process Model parameters a from given dataset.

18 spm
Usage
spm(x, model = "discrete", formulas = list(at = "a", f1t = "f1", Qt = "Q",ft = "f", bt = "b", mu0t = "mu0"), start = NULL, tol = NULL,stopifbound = FALSE, lb = NULL, ub = NULL, pinv.tol = 0.01,theta.range = seq(0.01, 0.2, by = 0.001), verbose = FALSE, gomp = FALSE,opts = list(algorithm = "NLOPT_LN_NELDERMEAD", maxeval = 100, ftol_rel =1e-08))
Arguments
x A dataset: is the output from prepare_data(...) function and consists of twoseparate data tables: (1) a data table for continuous-time model and (2) a datatable for discrete-time model.
model A model type. Choices are: "discrete", "continuous" or "time-dependent".
formulas A list of parameter formulas used in the "time-dependent" model. Default:formulas=list(at="a", f1t="f1", Qt="Q", ft="f", bt="b", mu0t="mu0").
start A starting values of coefficients in the "time-dependent" model.
tol A tolerance threshold for matrix inversion (NULL by default).
stopifbound A flag (default=FALSE) if it is set then the optimization stops when any of theparametrs achives lower or upper boundary.
lb Lower boundary, default NULL.
ub Upper boundary, default NULL.
pinv.tol A tolerance threshold for matrix pseudo-inverse. Default: 0.01.
theta.range A user-defined range of the parameter theta used in discrete-time optimizationand estimating of starting point for continuous-time optimization.
verbose A verbosing output indicator (FALSE by default).
gomp A flag (FALSE by default). When it is set, then time-dependent exponentialform of mu0 and Q are used: mu0 = mu0*exp(theta*t), Q = Q*exp(theta*t).
opts A list of options for nloptr. Default value: opt=list(algorithm="NLOPT_LN_NELDERMEAD",maxeval=100, ftol_rel=1e-8).Please see nloptr documentation for more information.
Value
For "discrete" and "continuous" model types: (1) a list of model parameter estimates for the discretemodel type described in "Life tables with covariates: Dynamic Model for Nonlinear Analysis ofLongitudinal Data", Akushevich et al, 2005.<DOI:10.1080/08898480590932296>, and (2) a list ofmodel parameter estimates for the continuous model type described in "Stochastic model for analy-sis of longitudinal data on aging and mortality", Yashin et al, 2007, Math Biosci.<DOI:10.1016/j.mbs.2006.11.006>.
For the "time-dependent" model (model parameters depend on time): a set of model parameterestimates.

spm.impute 19
References
Yashin, A. et al (2007), Stochastic model for analysis of longitudinal data on aging and mortality.Mathematical Biosciences, 208(2), 538-551.
Akushevich I., Kulminski A. and Manton K. (2005). Life tables with covariates: Dynamic modelfor Nonlinear Analysis of Longitudinal Data. Mathematical Popu-lation Studies, 12(2), pp.: 51-80.<DOI: 10.1080/08898480590932296>.
Yashin, A. et al (2007), Health decline, aging and mortality: how are they related? Biogerontology,8(3), 291-302.<DOI:10.1007/s10522-006-9073-3>.
Examples
## Not run:library(stpm)data.continuous <- simdata_cont(N=1000)data.discrete <- simdata_discr(N=1000)data <- list(data.continuous, data.discrete)p.discr.model <- spm(data)p.discr.modelp.cont.model <- spm(data, model="continuous")p.cont.modelp.td.model <- spm(data,model="time-dependent",f=list(at="aa*t+bb", f1t="f1", Qt="Q", ft="f", bt="b", mu0t="mu0"),start=list(a=-0.001, bb=0.05, f1=80, Q=2e-8, f=80, b=5, mu0=1e-3))p.td.model
## End(Not run)
spm.impute Multiple Data Imputation with SPM
Description
Multiple Data Imputation with SPM
Usage
spm.impute(dataset, minp = 5, theta_range = seq(0.01, 0.2, by = 0.001))
Arguments
dataset A longitudinal dataset with missing observations
minp Number of imputations. Default: 5
theta_range A range of parameter theta used for optimization, default: seq(0.01, 0.15, by=0.001).

20 spm_continuous
Value
A list(imputed, imputations)
imputed An imputed dataset.
imputations Temporary imputed datasets used in multiple imputaitons.
Examples
## Not run:library(stpm)##Data preparation ##data <- simdata_discr(N=1000, dt = 2)miss.id <- sample(x=dim(data)[1], size=round(dim(data)[1]/4)) # ~25% missing dataincomplete.data <- dataincomplete.data[miss.id,5] <- NAincomplete.data[miss.id-1,6] <- NA## End of data preparation ##
# Estimate parameters from the complete dataset #p <- spm_discrete(data, theta_range = seq(0.075, 0.09, by=0.001))p
##### Multiple imputation with SPM #####imp.data <- spm.impute(dataset=incomplete.data,
minp=5,theta_range=seq(0.075, 0.09, by=0.001))$imputed
head(imp.data)## Estimate SPM parameters from imputed data and compare them to the p ##pp.test <- spm_discrete(imp.data, theta_range = seq(0.075, 0.09, by=0.001))pp.test
## End(Not run)
spm_continuous Continuous multi-dimensional optimization
Description
Continuous multi-dimensional optimization
Usage
spm_continuous(dat, a = -0.05, f1 = 80, Q = 2e-08, f = 80, b = 5,mu0 = 2e-05, theta = 0.08, stopifbound = FALSE, lb = NULL,ub = NULL, verbose = FALSE, pinv.tol = 0.01, gomp = FALSE,opts = list(algorithm = "NLOPT_LN_NELDERMEAD", maxeval = 100, ftol_rel =1e-08))

spm_continuous 21
Arguments
dat A data table.
a A starting value of the rate of adaptive response to any deviation of Y from f1(t).
f1 A starting value of the average age trajectories of the variables which process isforced to follow.
Q Starting values of the quadratic hazard term.
f A starting value of the "optimal" value of variable which corresponds to theminimum of hazard rate at a respective time.
b A starting value of a diffusion coefficient representing a strength of the randomdisturbance from Wiener Process.
mu0 A starting value of the baseline hazard.
theta A starting value of the parameter theta (axe displacement of Gompertz function).
stopifbound Estimation stops if at least one parameter achieves lower or upper boundaries.#’Check the NLopt website for a description of the algorithms. Default: NLOPT_LN_NELDERMEAD
lb Lower bound of parameters under estimation.
ub Upper bound of parameters under estimation. The program stops when the num-ber of function evaluations exceeds maxeval. Default: 500.
verbose An indicator of verbosing output.
pinv.tol A tolerance value for pseudo-inverse of matrix gamma (see Yashin, A.I. et al(2007). Stochastic model for analysis of longitudinal data on aging and mortal-ity. Mathematical Biosciences, 208(2), 538-551.<DOI:10.1016/j.mbs.2006.11.006>.)
gomp A flag (FALSE by default). When it is set, then time-dependent exponentialform of mu0 is used: mu0 = mu0*exp(theta*t).
opts A list of options for nloptr. Default value: opt=list(algorithm="NLOPT_LN_NELDERMEAD",maxeval=100, ftol_rel=1e-8).Please see nloptr documentation for more information.
Details
spm_continuous runs much slower that discrete but more precise and can handle time intervalswith different lengths.
Value
A set of estimated parameters a, f1, Q, f, b, mu0, theta and additional variable limit which indicatesif any parameter achieved lower or upper boundary conditions (FALSE by default).
status Optimization status (see documentation for nloptr package).
LogLik A logarithm likelihood.
objective A value of objective function (given by nloptr).
message A message given by nloptr optimization function (see documentation for nloptr package).
References
Yashin, A.I. et al (2007). Stochastic model for analysis of longitudinal data on aging and mortality.Mathematical Biosciences, 208(2), 538-551.<DOI:10.1016/j.mbs.2006.11.006>.

22 spm_con_1d
Examples
library(stpm)#Reading the data:data <- simdata_cont(N=2)head(data)#Parameters estimation:pars <- spm_continuous(dat=data,a=-0.05, f1=80,
Q=2e-8, f=80, b=5, mu0=2e-5)pars
spm_con_1d Fitting a 1-D SPM model with constant parameters
Description
This function implements a analytical solution to estimate the parameters in the continuous SPMmodel by assuming all the parameters are constants.
Usage
spm_con_1d(spm_data, a = NA, b = NA, q = NA, f = NA, f1 = NA,mu0 = NA, theta = NA, lower = c(), upper = c(),control = list(xtol_rel = 1e-06), global = FALSE, verbose = TRUE,ahessian = FALSE)
Arguments
spm_data A dataset for the SPM model. See the STPM package for more details about theformat.
a The initial value for the paramter a. The initial value will be predicted if notspecified.
b The initial value for the paramter b. The initial value will be predicted if notspecified.
q The initial value for the paramter q. The initial value will be predicted if notspecified.
f The initial value for the paramter f . The initial value will be predicted if notspecified.
f1 The initial value for the paramter f1. The initial value will be predicted if notspecified.
mu0 The initial value for the paramter µ0 in the baseline hazard. The initial valuewill be predicted if not specified.
theta The initial value for the paramter θ in the baseline hazard. The initial value willbe predicted if not specified.
lower A vector of the lower bound of the parameters.

spm_con_1d_g 23
upper A vector of the upper bound of the parameters.
control A list of the control parameters for the optimization paramters.
global A logical variable indicating whether the MLSL (TRUE) or the L-BFGS (FALSE)algorithm is used for the optimization.
verbose A logical variable indicating whether initial information is printed.
ahessian A logical variable indicating whether the approximate (FALSE) or analytical(TRUE) Hessian is returned.
Value
est The estimates of the parameters.
hessian The Hessian matrix of the estimates.
lik The minus log-likelihood.
con A number indicating the convergence. See the ’nloptr’ package for more details.
message Extra message about the convergence. See the ’nloptr’ package for more details.
References
He, L., Zhbannikov, I., Arbeev, K. G., Yashin, A. I., and Kulminski, A.M., 2017. Genetic stochasticprocess model for detecting pleiotropic and interaction effects with longitudinal data.
Examples
{library(stpm)dat <- simdata_cont(N=500)colnames(dat) <- c("id", "xi", "t1", "t2", "y", "y.next")res <- spm_con_1d(as.data.frame(dat), a=-0.05, b=2, q=1e-8, f=80, f1=90, mu0=1e-3, theta=0.08)}
spm_con_1d_g Fitting a 1-D genetic SPM model with constant parameters
Description
This function implements a continuous genetic SPM model by assuming all the parameters areconstants.
Usage
spm_con_1d_g(spm_data, gene_data, a = NA, b = NA, q = NA, f = NA,f1 = NA, mu0 = NA, theta = NA, effect = c("a"), lower = c(),upper = c(), control = list(xtol_rel = 1e-06), global = FALSE,verbose = TRUE, ahessian = FALSE)

24 spm_con_1d_g
Arguments
spm_data A dataset for the SPM model. See the STPM pacakge for more details about theformat.
gene_data A two column dataset containing the genotypes for the individuals in spm_data.The first column id is the ID of the individuals in spm_data, and the secondcolumn geno is the genotype.
a The initial value for the paramter a. The initial value will be predicted if notspecified.
b The initial value for the paramter b. The initial value will be predicted if notspecified.
q The initial value for the paramter q. The initial value will be predicted if notspecified.
f The initial value for the paramter f . The initial value will be predicted if notspecified.
f1 The initial value for the paramter f1. The initial value will be predicted if notspecified.
mu0 The initial value for the paramter µ0 in the baseline hazard. The initial valuewill be predicted if not specified.
theta The initial value for the paramter θ in the baseline hazard. The initial value willbe predicted if not specified.
effect A character vector of the parameters that are linked to genotypes. The vectorcan contain any combination of a, b, q, f, mu0.
lower A vector of the lower bound of the parameters.
upper A vector of the upper bound of the parameters.
control A list of the control parameters for the optimization paramters.
global A logical variable indicating whether the MLSL (TRUE) or the L-BFGS (FALSE)algorithm is used for the optimization.
verbose A logical variable indicating whether initial information is printed.
ahessian A logical variable indicating whether the approximate (FALSE) or analytical(TRUE) Hessian is returned.
Value
est The estimates of the parameters.
hessian The Hessian matrix of the estimates.
lik The minus log-likelihood.
con A number indicating the convergence. See the ’nloptr’ package for more details.
message Extra message about the convergence. See the ’nloptr’ package for more details.
beta The coefficients of the genetic effect on the parameters to be linked to genotypes.

spm_discrete 25
References
He, L., Zhbannikov, I., Arbeev, K. G., Yashin, A. I., and Kulminski, A.M., 2017. Genetic stochasticprocess model for detecting pleiotropic and interaction effects with longitudinal data.
Examples
## Not run:library(stpm)data(ex_spmcon1dg)res <- spm_con_1d_g(ex_data$spm_data, ex_data$gene_data,a = -0.02, b=0.2, q=0.01, f=3, f1=3, mu0=0.01, theta=1e-05,upper=c(-0.01,3,0.1,10,10,0.1,1e-05), lower=c(-1,0.01,0.00001,1,1,0.001,1e-05),effect=c('q'))
## End(Not run)
spm_discrete Discrete multi-dimensional optimization
Description
Discrete multi-dimensional optimization
Usage
spm_discrete(dat, theta_range = seq(0.02, 0.2, by = 0.001), tol = NULL,verbose = FALSE)
Arguments
dat A data table.
theta_range A range of theta parameter (axe displacement of Gompertz function), default:from 0.001 to 0.09 with step of 0.001.
tol A tolerance threshold for matrix inversion (NULL by default).
verbose An indicator of verbosing output.
Details
This function is way more faster that continuous spm_continuous_MD(...) (but less precise) andused mainly in estimation a starting point for the spm_continuous_MD(...).
Value
A list of two elements ("Ak205", "Ya2007"): (1) estimated parameters u, R, b, Sigma, Q, mu0, thetaand (2) estimated parameters a, f1, Q, f, b, mu0, theta. Note: b and mu0 from first list are differentfrom b and mu0 from the second list.

26 spm_pobs
References
Akushevich I., Kulminski A. and Manton K. (2005), Life tables with covariates: Dynamic modelfor Nonlinear Analysis of Longitudinal Data. Mathematical Population Studies, 12(2), pp.: 51-80.<DOI:10.1080/08898480590932296>.
Examples
library(stpm)data <- simdata_discr(N=10)#Parameters estimationpars <- spm_discrete(data)pars
spm_pobs Continuous-time multi-dimensional optimization for SPM with par-tially observed covariates (multidimensional GenSPM)
Description
Continuous-time multi-dimensional optimization for SPM with partially observed covariates (mul-tidimensional GenSPM)
Usage
spm_pobs(x = NULL, y = NULL, aH = -0.05, aL = -0.01, f1H = 60,f1L = 80, QH = 2e-08, QL = 2.5e-08, fH = 60, fL = 80, bH = 4,bL = 5, mu0H = 8e-06, mu0L = 1e-05, thetaH = 0.08, thetaL = 0.1,p = 0.25, stopifbound = FALSE, algorithm = "NLOPT_LN_NELDERMEAD",lb = NULL, ub = NULL, maxeval = 500, verbose = FALSE,pinv.tol = 0.01, mode = "observed", gomp = TRUE, ftol_rel = 1e-06)
Arguments
x A data table with genetic component.
y A data table without genetic component.
aH A k by k matrix. Characterizes the rate of the adaptive response for Z = 1.
aL A k by k matrix. Characterize the rate of the adaptive response for Z = 0.
f1H A deviation from the norm (or optimal) state for Z = 1. This is a vector of lengthk.
f1L A deviation from the norm (or optimal) for Z = 0. This is a vector of length k.
QH A matrix k by k, which is a non-negative-definite symmetric matrix for Z = 1.
QL A matrix k by k, which is a non-negative-definite symmetric matrix for Z = 0.
fH A vector with length of k. Represents the normal (or optimal) state for Z = 1.
fL A vector with length of k. Represents the normal (or optimal) state for Z = 0.

spm_pobs 27
bH A diffusion coefficient, k by k matrix for Z = 1.
bL A diffusion coefficient, k by k matrix for Z = 0.
mu0H A baseline mortality for Z = 1.
mu0L A baseline mortality for Z = 0.
thetaH A displacement coefficient for Z = 1.
thetaL A displacement coefficient for Z = 0.
p a hyphotetical percentage of presence of partially observed covariate in a popu-lation (default p=0.25).
stopifbound If TRUE then estimation stops if at least one parameter achieves lower or upperboundaries.
algorithm An optimization algorithm used, can be one of those provided by nloptr. #’Checkthe NLopt website for a description of the algorithms. Default: NLOPT_LN_NELDERMEAD
lb Lower bound of parameter values.
ub Upper bound of parameter values.
maxeval Maximum number of iterations of the algorithm for nloptr optimization. Theprogram stops when the number of function evaluations exceeds maxeval. De-fault: 500.
verbose An indicator of verbosing output (FALSE by default).
pinv.tol A tolerance value for pseudo-inverse of matrix gamma (see Yashin, A.I. et al(2007). Stochastic model for analysis of longitudinal data on aging and mortal-ity. Mathematical Biosciences, 208(2), 538-551.<DOI:10.1016/j.mbs.2006.11.006>.)
mode Can be one of the following: "observed" (default), "unobserved" or "combined".mode = "observed" represents analysing only dataset with observed variable Z.mode = "unobserved" represents analysing only dataset of unobserved variableZ. mode = "combined" denoted joint analysis of both observed and unobserveddatasets.
gomp A flag (FALSE by default). When it is set, then time-dependent exponentialform of mu0 is used: mu0 = mu0*exp(theta*t).
ftol_rel Relative tolerance threshold for likelihood function (defalult: 1e-6), see http://ab-initio.mit.edu/wiki/index.php/NLopt_Reference
Value
A set of estimated parameters aH, aL, f1H, f1H, QH, QL, fH, fL, bH, bL, mu0H, mu0L, thetaH,thetaL, p and additional variable limit which indicates if any parameter achieved lower or upperboundary conditions (FALSE by default).
References
Arbeev, K.G. et al (2009). Genetic model for longitudinal studies of aging, health, and longevity
Yashin, A.I. et al (2007). Stochastic model for analysis of longitudinal data on aging and mortality.Mathematical Biosciences, 208(2), 538-551.<DOI:10.1016/j.mbs.2006.11.006>.

28 spm_projection
Examples
## Not run:library(stpm)#Reading the data:data <- sim_pobs(N=1000)head(data)#Parameters estimation:pars <- spm_pobs(x=data)pars
## End(Not run)
spm_projection A data projection with previously estimated or user-defined parame-ters. Projections are constructed for a cohort with fixed or normallydistributed initial covariates.
Description
A data projection with previously estimated or user-defined parameters. Projections are constructedfor a cohort with fixed or normally distributed initial covariates.
Usage
spm_projection(x, N = 100, ystart = 80, model = "discrete", tstart = 30,tend = 105, dt = 1, sd0 = 1, nobs = NULL, gomp = TRUE)
Arguments
x A list of parameters from output of the spm(...) function.
N A number of individuals to simulate, N=100 by default.
ystart A vector of starting values of covariates (variables), ystart=80 by default.
model A model type. Choices are: "discrete", "continuous" or "time-dependent".
tstart Start time (age), default=30. Can be an interval: c(a, b) - in this case, the startingtime is sumulated via runif(1, a, b).
tend End time (age), default=105.
dt A time interval between observations, dt=1 by default.
sd0 A standard deviation value for simulation of the next value of variable. sd0=1by default.
nobs A number of observations (lines) for i-th individual.
gomp A flag (FALSE by default). When it is set, then time-dependent exponentialform of mu0 and Q are used: mu0 = mu0*exp(theta*t), Q = Q*exp(theta*t).Only for continous-time SPM.

spm_time_dep 29
Value
An object of ’spm.projection’ class with two elements. (1) A simulated data set. (2) A summarystatistics which includes (i) age-specific means of state variables and (ii) Survival probabilities.
References
Yashin, A. et al (2007), Stochastic model for analysis of longitudinal data on aging and mortality.Mathematical Biosciences, 208(2), 538-551.
Akushevich I., Kulminski A. and Manton K. (2005). Life tables with covariates: Dynamic modelfor Nonlinear Analysis of Longitudinal Data. Mathematical Popu-lation Studies, 12(2), pp.: 51-80.<DOI: 10.1080/08898480590932296>.
Yashin, A. et al (2007), Health decline, aging and mortality: how are they related? Biogerontology,8(3), 291-302.<DOI:10.1007/s10522-006-9073-3>.
Examples
## Not run:library(stpm)# Setting up the modelmodel.par <- list()model.par$a <- matrix(c(-0.05, 1e-3, 2e-3, -0.05), nrow=2, ncol=2, byrow=TRUE)model.par$f1 <- matrix(c(90, 35), nrow=1, ncol=2)model.par$Q <- matrix(c(1e-8, 1e-9, 1e-9, 1e-8), nrow=2, ncol=2, byrow=TRUE)model.par$f <- matrix(c(80, 27), nrow=1, ncol=2)model.par$b <- matrix(c(6, 2), nrow=2, ncol=2)model.par$mu0 <- 1e-6model.par$theta <- 0.09# Projection# Discrete-time modeldata.proj.discrete <- spm_projection(model.par, N=5000, ystart=c(80, 27))plot(data.proj.discrete$stat$srv.prob)# Continuous-time modeldata.proj.continuous <- spm_projection(model.par, N=5000,ystart=c(80, 27), model="continuous")plot(data.proj.continuous$stat$srv.prob)# Time-dependent modelmodel.par <- list(at = "-0.05", f1t = "80", Qt = "2e-8",ft= "80", bt = "5", mu0t = "1e-5*exp(0.11*t)")data.proj.time_dependent <- spm_projection(model.par, N=500,ystart=80, model="time-dependent")plot(data.proj.time_dependent$stat$srv.prob, xlim = c(30,105))
## End(Not run)
spm_time_dep spm_time_dep : a function for the model with time-dependent modelparameters.
30 spm_time_dep
Description
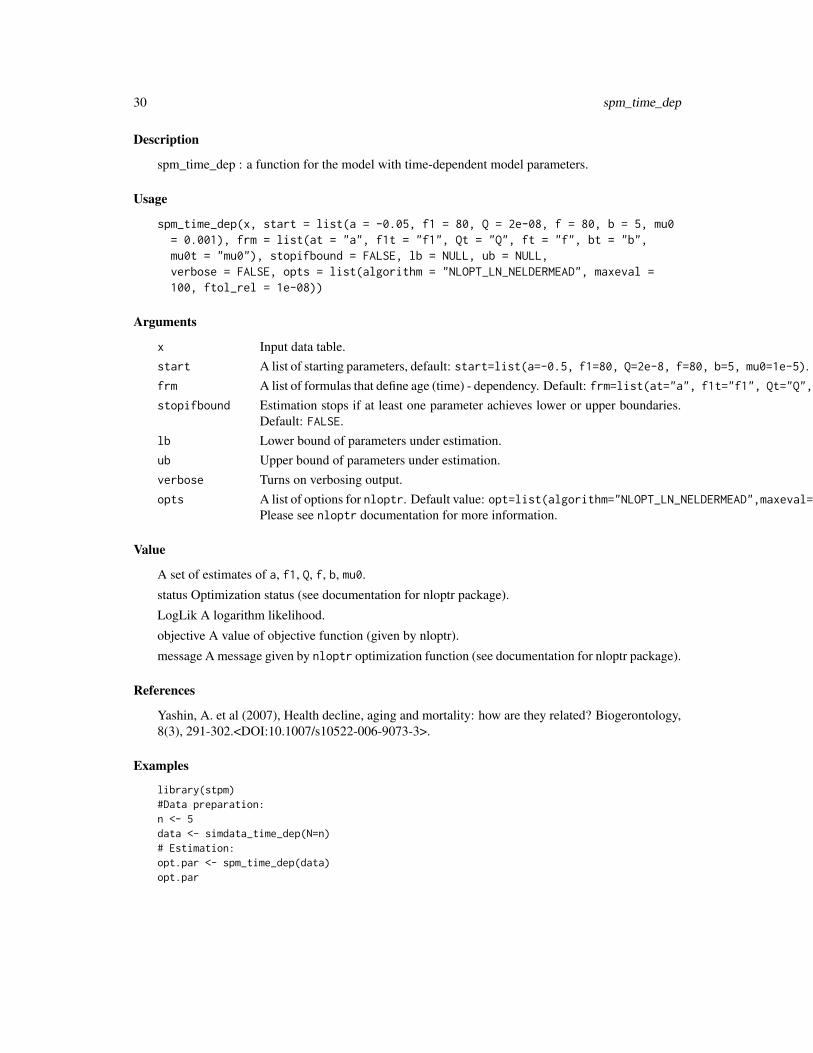
spm_time_dep : a function for the model with time-dependent model parameters.
Usage
spm_time_dep(x, start = list(a = -0.05, f1 = 80, Q = 2e-08, f = 80, b = 5, mu0= 0.001), frm = list(at = "a", f1t = "f1", Qt = "Q", ft = "f", bt = "b",mu0t = "mu0"), stopifbound = FALSE, lb = NULL, ub = NULL,verbose = FALSE, opts = list(algorithm = "NLOPT_LN_NELDERMEAD", maxeval =100, ftol_rel = 1e-08))
Arguments
x Input data table.start A list of starting parameters, default: start=list(a=-0.5, f1=80, Q=2e-8, f=80, b=5, mu0=1e-5).frm A list of formulas that define age (time) - dependency. Default: frm=list(at="a", f1t="f1", Qt="Q", ft="f", bt="b",mu0t="mu0").stopifbound Estimation stops if at least one parameter achieves lower or upper boundaries.
Default: FALSE.lb Lower bound of parameters under estimation.ub Upper bound of parameters under estimation.verbose Turns on verbosing output.opts A list of options for nloptr. Default value: opt=list(algorithm="NLOPT_LN_NELDERMEAD",maxeval=100, ftol_rel=1e-8).
Please see nloptr documentation for more information.
Value
A set of estimates of a, f1, Q, f, b, mu0.
status Optimization status (see documentation for nloptr package).
LogLik A logarithm likelihood.
objective A value of objective function (given by nloptr).
message A message given by nloptr optimization function (see documentation for nloptr package).
References
Yashin, A. et al (2007), Health decline, aging and mortality: how are they related? Biogerontology,8(3), 291-302.<DOI:10.1007/s10522-006-9073-3>.
Examples
library(stpm)#Data preparation:n <- 5data <- simdata_time_dep(N=n)# Estimation:opt.par <- spm_time_dep(data)opt.par

stpm 31
stpm Stochastic Process Model for Analysis of Longitudinal and Time-to-Event Outcomes
Description
Utilities to estimate parameters of the models with survival functions induced by stochastic covari-ates. Miscellaneous functions for data preparation and simulation are also provided. For more infor-mation, see: "Stochastic model for analysis of longitudinal data on aging and mortality" by YashinA. et al, 2007, Mathematical Biosciences, 208(2), 538-551 <DOI:10.1016/j.mbs.2006.11.006>.
Author(s)
I. Y. Zhbannikov, Liang He, K. G. Arbeev, A. I. Yashin.
References
Yashin, A. et al (2007), Stochastic model for analysis of longitudinal data on aging and mortality.Mathematical Biosciences, 208(2), 538-551.
Akushevich I., Kulminski A. and Manton K. (2005). Life tables with covariates: Dynamic modelfor Nonlinear Analysis of Longitudinal Data. Mathematical Popu-lation Studies, 12(2), pp.: 51-80.<DOI: 10.1080/08898480590932296>.
Yashin, A. et al (2007), Health decline, aging and mortality: how are they related? Biogerontology,8(3), 291-302.<DOI:10.1007/s10522-006-9073-3>.
Examples
## Not run:library(stpm)#Prepare data for optimizationdata <- prepare_data(x=system.file("extdata","longdat.csv",package="stpm"), covariates="BMI")#Parameters estimation (default model: discrete-time):p.discr.model <- spm(data)p.discr.model# Continuous-time model:p.cont.model <- spm(data, model="continuous")p.cont.model#Model with time-dependent coefficients:data <- prepare_data(x=system.file("extdata","longdat.csv",package="stpm"), covariates="BMI")p.td.model <- spm(data, model="time-dependent")p.td.model
## End(Not run)

32 trim.trailing
trim Returns string w/o leading or trailing whitespace
Description
Returns string w/o leading or trailing whitespace
Usage
trim(x)
Arguments
x a string to trim
trim.leading Returns string w/o leading whitespace
Description
Returns string w/o leading whitespace
Usage
trim.leading(x)
Arguments
x a string to trim
trim.trailing Returns string w/o trailing whitespace
Description
Returns string w/o trailing whitespace
Usage
trim.trailing(x)
Arguments
x a string to trim

vitstat 33
vitstat Vital (mortality) statistics.
Description
Vital (mortality) statistics.
Author(s)
Ilya Y Zhbannikov <[email protected]>

Index
∗Topic Stochasticstpm, 31
∗Topic allostaticstpm, 31
∗Topic dataex_data, 2longdat, 7vitstat, 33
∗Topic hazardstpm, 31
∗Topic load,stpm, 31
∗Topic longitudinalstpm, 31
∗Topic model,stpm, 31
∗Topic processstpm, 31
∗Topic quadraticstpm, 31
∗Topic studies,stpm, 31
∗Topic time-to-eventstpm, 31
ex_data, 2
func1, 3
getNextY.cont, 3getNextY.cont2, 4getNextY.discr, 5getNextY.discr.m, 5getPrevY.discr, 6getPrevY.discr.m, 6
longdat, 7
m, 7mu, 8
prepare_data, 8prepare_data_cont, 9prepare_data_discr, 10
sigma_sq, 11sim_pobs, 16simdata_cont, 11simdata_discr, 12simdata_gamma_frailty, 14simdata_time_dep, 15spm, 17spm.impute, 19spm_con_1d, 22spm_con_1d_g, 23spm_continuous, 20spm_discrete, 25spm_pobs, 26spm_projection, 28spm_time_dep, 29stpm, 31stpm-package (stpm), 31
trim, 32trim.leading, 32trim.trailing, 32
vitstat, 33
34