Embed Size (px)
Citation preview
Package ‘seqplots’July 6, 2018
Type Package
Title An interactive tool for visualizing NGS signals and sequencemotif densities along genomic features using average plots andheatmaps
Version 1.18.0
Date 2014-09-15
Maintainer Przemyslaw Stempor <[email protected]>
Description SeqPlots is a tool for plotting next generation sequencing(NGS) based experiments' signal tracks, e.g. reads coverage fromChIP-seq, RNA-seq and DNA accessibility assays like DNase-seq andMNase-seq, over user specified genomic features, e.g. promoters, genebodies, etc. It can also calculate sequence motif density profilesfrom reference genome. The data are visualized as average signalprofile plot, with error estimates (standard error and 95% confidenceinterval) shown as fields, or as series of heatmaps that can be sortedand clustered using hierarchical clustering, k-means algorithm andself organising maps. Plots can be prepared using R programminglanguage or web browser based graphical user interface (GUI)implemented using Shiny framework. The dual-purpose implementationallows running the software locally on desktop or deploying it onserver. SeqPlots is useful for both for exploratory data analyses andpreparing replicable, publication quality plots. Other features of thesoftware include collaboration and data sharing capabilities, as wellas ability to store pre-calculated result matrixes, that combine manysequencing experiments and in-silico generated tracks with multipledifferent features. These binaries can be further used to generate newcombination plots on fly, run automated batch operations or share withcolleagues, who can adjust their plotting parameters without loadingactual tracks and recalculating numeric values. SeqPlots relays onBioconductor packages, mainly on rtracklayer for data input andBSgenome packages for reference genome sequence and annotations.
License GPL-3
URL http://github.com/przemol/seqplots
BugReports http://github.com/przemol/seqplots/issues
Depends R (>= 3.2.0)
1
2 getPlotSetArray
Imports methods, IRanges, BSgenome, digest, rtracklayer,GenomicRanges, Biostrings, shiny (>= 0.13.0), DBI, RSQLite,plotrix, fields, grid, kohonen, parallel, GenomeInfoDb, class,S4Vectors, ggplot2, reshape2, gridExtra, jsonlite, DT (>=0.1.0), RColorBrewer, Rsamtools, GenomicAlignments
Suggests testthat, BiocStyle, knitr, rmarkdown, covr
VignetteBuilder knitr
biocViews ChIPSeq, RNASeq, Sequencing, Software, Visualization
LazyLoad yes
RoxygenNote 6.0.1
Collate 'MotifSetup-class.R' 'PlotSetPair-class.R''PlotSetArray-class.R' 'PlotSetList-class.R''deployServerInstance.R' 'generic_methods.R''getPlotSetArray.R' 'helper_functions.R' 'int_getSF.R''int_ggHeatmapPlotWrapper.R' 'int_heatmapPlotWrapper.R''int_imPlot2.R' 'int_plotMext.R' 'plotAverage.R''plotHeatmap.R' 'run.R' 'seqplots-package.R' 'zzz.R'
git_url https://git.bioconductor.org/packages/seqplots
git_branch RELEASE_3_7
git_last_commit 981ee76
git_last_commit_date 2018-04-30
Date/Publication 2018-07-05
Author Przemyslaw Stempor [aut, cph, cre]
R topics documented:getPlotSetArray . . . . . . . . . . . . . . . . . . . . . . . . . . . . . . . . . . . . . . . 2MotifSetup-class . . . . . . . . . . . . . . . . . . . . . . . . . . . . . . . . . . . . . . 5plot . . . . . . . . . . . . . . . . . . . . . . . . . . . . . . . . . . . . . . . . . . . . . 6plotAverage . . . . . . . . . . . . . . . . . . . . . . . . . . . . . . . . . . . . . . . . . 8plotHeatmap . . . . . . . . . . . . . . . . . . . . . . . . . . . . . . . . . . . . . . . . . 11PlotSetArray-class . . . . . . . . . . . . . . . . . . . . . . . . . . . . . . . . . . . . . 15PlotSetList-class . . . . . . . . . . . . . . . . . . . . . . . . . . . . . . . . . . . . . . 16PlotSetPair-class . . . . . . . . . . . . . . . . . . . . . . . . . . . . . . . . . . . . . . 16run . . . . . . . . . . . . . . . . . . . . . . . . . . . . . . . . . . . . . . . . . . . . . . 17seqplots . . . . . . . . . . . . . . . . . . . . . . . . . . . . . . . . . . . . . . . . . . . 18seqplots-generic . . . . . . . . . . . . . . . . . . . . . . . . . . . . . . . . . . . . . . . 20
Index 22
getPlotSetArray Process genomic signal
Description
Function to process genomic signal from tracks and/or motif data, calculate statistics. This functionshould be used as the entry point to the SeqPlots pipeline and followed by plotting function(s).
getPlotSetArray 3
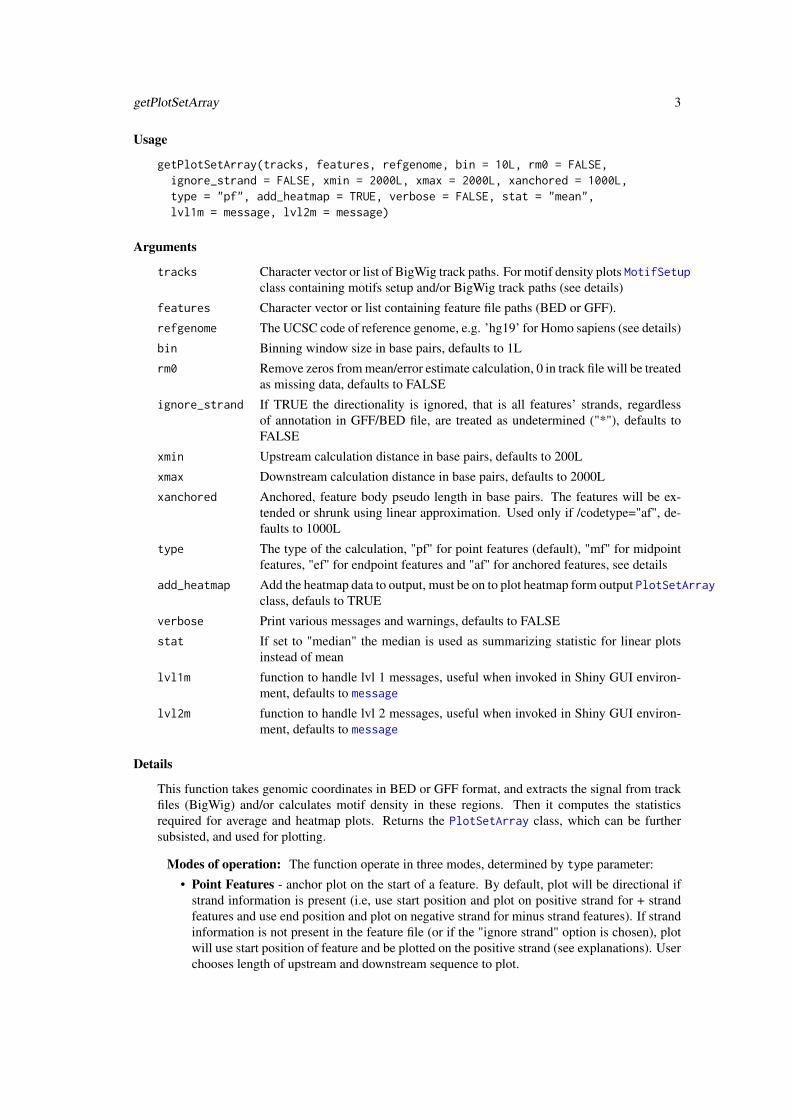
Usage
getPlotSetArray(tracks, features, refgenome, bin = 10L, rm0 = FALSE,ignore_strand = FALSE, xmin = 2000L, xmax = 2000L, xanchored = 1000L,type = "pf", add_heatmap = TRUE, verbose = FALSE, stat = "mean",lvl1m = message, lvl2m = message)
Arguments
tracks Character vector or list of BigWig track paths. For motif density plots MotifSetupclass containing motifs setup and/or BigWig track paths (see details)
features Character vector or list containing feature file paths (BED or GFF).
refgenome The UCSC code of reference genome, e.g. ’hg19’ for Homo sapiens (see details)
bin Binning window size in base pairs, defaults to 1L
rm0 Remove zeros from mean/error estimate calculation, 0 in track file will be treatedas missing data, defaults to FALSE
ignore_strand If TRUE the directionality is ignored, that is all features’ strands, regardlessof annotation in GFF/BED file, are treated as undetermined ("*"), defaults toFALSE
xmin Upstream calculation distance in base pairs, defaults to 200L
xmax Downstream calculation distance in base pairs, defaults to 2000L
xanchored Anchored, feature body pseudo length in base pairs. The features will be ex-tended or shrunk using linear approximation. Used only if /codetype="af", de-faults to 1000L
type The type of the calculation, "pf" for point features (default), "mf" for midpointfeatures, "ef" for endpoint features and "af" for anchored features, see details
add_heatmap Add the heatmap data to output, must be on to plot heatmap form output PlotSetArrayclass, defauls to TRUE
verbose Print various messages and warnings, defaults to FALSE
stat If set to "median" the median is used as summarizing statistic for linear plotsinstead of mean
lvl1m function to handle lvl 1 messages, useful when invoked in Shiny GUI environ-ment, defaults to message
lvl2m function to handle lvl 2 messages, useful when invoked in Shiny GUI environ-ment, defaults to message
Details
This function takes genomic coordinates in BED or GFF format, and extracts the signal from trackfiles (BigWig) and/or calculates motif density in these regions. Then it computes the statisticsrequired for average and heatmap plots. Returns the PlotSetArray class, which can be furthersubsisted, and used for plotting.
Modes of operation: The function operate in three modes, determined by type parameter:
• Point Features - anchor plot on the start of a feature. By default, plot will be directional ifstrand information is present (i.e, use start position and plot on positive strand for + strandfeatures and use end position and plot on negative strand for minus strand features). If strandinformation is not present in the feature file (or if the "ignore strand" option is chosen), plotwill use start position of feature and be plotted on the positive strand (see explanations). Userchooses length of upstream and downstream sequence to plot.
4 getPlotSetArray
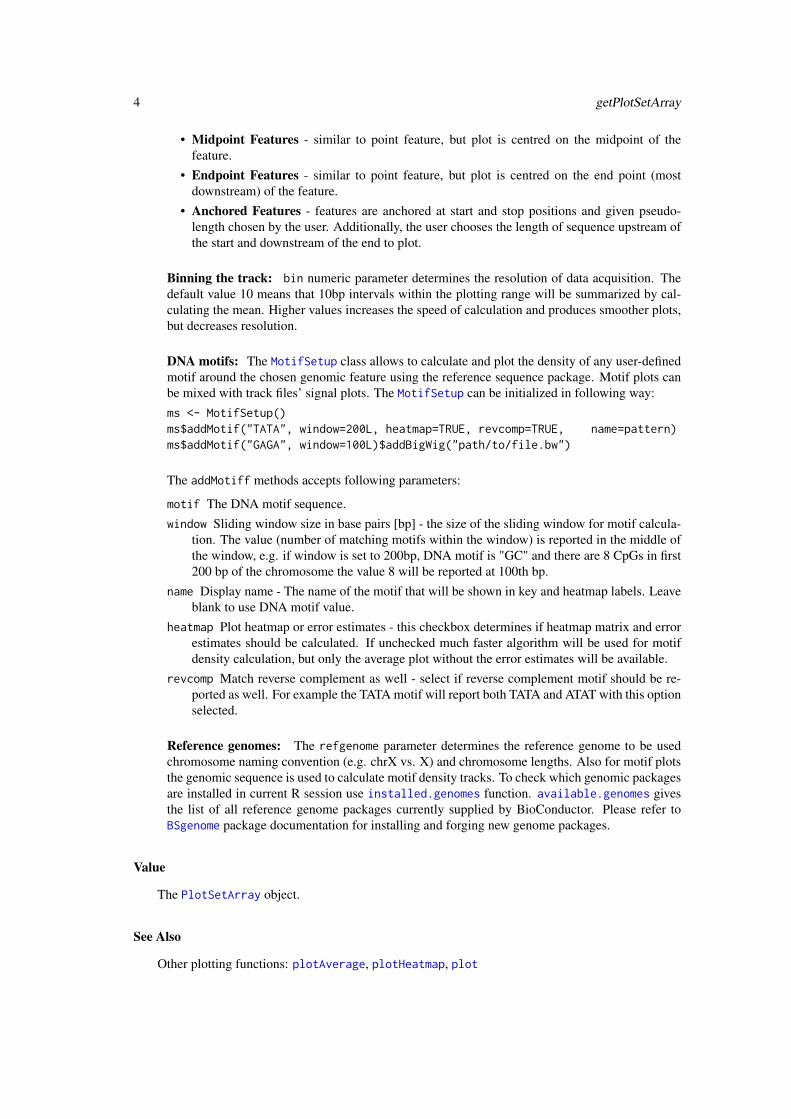
• Midpoint Features - similar to point feature, but plot is centred on the midpoint of thefeature.
• Endpoint Features - similar to point feature, but plot is centred on the end point (mostdownstream) of the feature.
• Anchored Features - features are anchored at start and stop positions and given pseudo-length chosen by the user. Additionally, the user chooses the length of sequence upstream ofthe start and downstream of the end to plot.
Binning the track: bin numeric parameter determines the resolution of data acquisition. Thedefault value 10 means that 10bp intervals within the plotting range will be summarized by cal-culating the mean. Higher values increases the speed of calculation and produces smoother plots,but decreases resolution.
DNA motifs: The MotifSetup class allows to calculate and plot the density of any user-definedmotif around the chosen genomic feature using the reference sequence package. Motif plots canbe mixed with track files’ signal plots. The MotifSetup can be initialized in following way:ms <- MotifSetup()ms$addMotif("TATA", window=200L, heatmap=TRUE, revcomp=TRUE, name=pattern)ms$addMotif("GAGA", window=100L)$addBigWig("path/to/file.bw")
The addMotiff methods accepts following parameters:
motif The DNA motif sequence.window Sliding window size in base pairs [bp] - the size of the sliding window for motif calcula-
tion. The value (number of matching motifs within the window) is reported in the middle ofthe window, e.g. if window is set to 200bp, DNA motif is "GC" and there are 8 CpGs in first200 bp of the chromosome the value 8 will be reported at 100th bp.
name Display name - The name of the motif that will be shown in key and heatmap labels. Leaveblank to use DNA motif value.
heatmap Plot heatmap or error estimates - this checkbox determines if heatmap matrix and errorestimates should be calculated. If unchecked much faster algorithm will be used for motifdensity calculation, but only the average plot without the error estimates will be available.
revcomp Match reverse complement as well - select if reverse complement motif should be re-ported as well. For example the TATA motif will report both TATA and ATAT with this optionselected.
Reference genomes: The refgenome parameter determines the reference genome to be usedchromosome naming convention (e.g. chrX vs. X) and chromosome lengths. Also for motif plotsthe genomic sequence is used to calculate motif density tracks. To check which genomic packagesare installed in current R session use installed.genomes function. available.genomes givesthe list of all reference genome packages currently supplied by BioConductor. Please refer toBSgenome package documentation for installing and forging new genome packages.
Value
The PlotSetArray object.
See Also
Other plotting functions: plotAverage, plotHeatmap, plot
MotifSetup-class 5
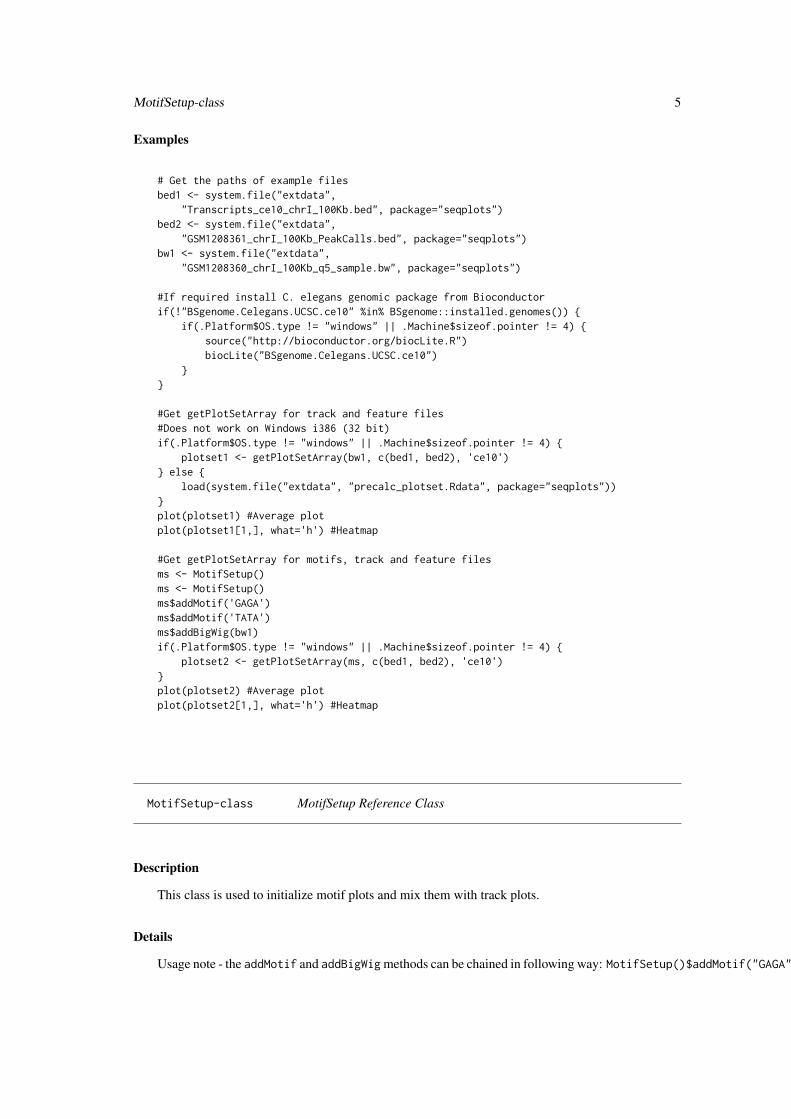
Examples
# Get the paths of example filesbed1 <- system.file("extdata",
"Transcripts_ce10_chrI_100Kb.bed", package="seqplots")bed2 <- system.file("extdata",
"GSM1208361_chrI_100Kb_PeakCalls.bed", package="seqplots")bw1 <- system.file("extdata",
"GSM1208360_chrI_100Kb_q5_sample.bw", package="seqplots")
#If required install C. elegans genomic package from Bioconductorif(!"BSgenome.Celegans.UCSC.ce10" %in% BSgenome::installed.genomes()) {
if(.Platform$OS.type != "windows" || .Machine$sizeof.pointer != 4) {source("http://bioconductor.org/biocLite.R")biocLite("BSgenome.Celegans.UCSC.ce10")
}}
#Get getPlotSetArray for track and feature files#Does not work on Windows i386 (32 bit)if(.Platform$OS.type != "windows" || .Machine$sizeof.pointer != 4) {
plotset1 <- getPlotSetArray(bw1, c(bed1, bed2), 'ce10')} else {
load(system.file("extdata", "precalc_plotset.Rdata", package="seqplots"))}plot(plotset1) #Average plotplot(plotset1[1,], what='h') #Heatmap
#Get getPlotSetArray for motifs, track and feature filesms <- MotifSetup()ms <- MotifSetup()ms$addMotif('GAGA')ms$addMotif('TATA')ms$addBigWig(bw1)if(.Platform$OS.type != "windows" || .Machine$sizeof.pointer != 4) {
plotset2 <- getPlotSetArray(ms, c(bed1, bed2), 'ce10')}plot(plotset2) #Average plotplot(plotset2[1,], what='h') #Heatmap
MotifSetup-class MotifSetup Reference Class
Description
This class is used to initialize motif plots and mix them with track plots.
Details
Usage note - the addMotif and addBigWig methods can be chained in following way: MotifSetup()$addMotif("GAGA",window=200L)$addBigWig("path/to/file.bw")
6 plot
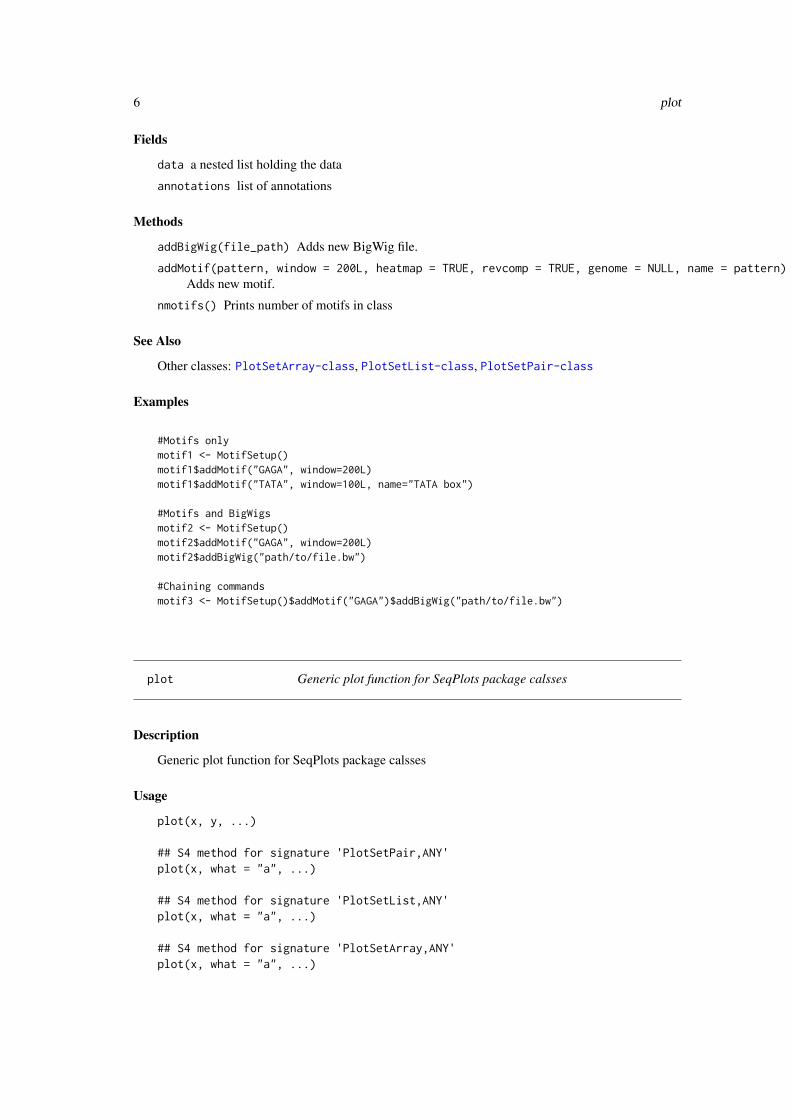
Fields
data a nested list holding the data
annotations list of annotations
Methods
addBigWig(file_path) Adds new BigWig file.
addMotif(pattern, window = 200L, heatmap = TRUE, revcomp = TRUE, genome = NULL, name = pattern)Adds new motif.
nmotifs() Prints number of motifs in class
See Also
Other classes: PlotSetArray-class, PlotSetList-class, PlotSetPair-class
Examples
#Motifs onlymotif1 <- MotifSetup()motif1$addMotif("GAGA", window=200L)motif1$addMotif("TATA", window=100L, name="TATA box")
#Motifs and BigWigsmotif2 <- MotifSetup()motif2$addMotif("GAGA", window=200L)motif2$addBigWig("path/to/file.bw")
#Chaining commandsmotif3 <- MotifSetup()$addMotif("GAGA")$addBigWig("path/to/file.bw")
plot Generic plot function for SeqPlots package calsses
Description
Generic plot function for SeqPlots package calsses
Usage
plot(x, y, ...)
## S4 method for signature 'PlotSetPair,ANY'plot(x, what = "a", ...)
## S4 method for signature 'PlotSetList,ANY'plot(x, what = "a", ...)
## S4 method for signature 'PlotSetArray,ANY'plot(x, what = "a", ...)
plot 7
Arguments
x This argument should be one of SeqPlots classes: PlotSetArray, PlotSetListor PlotSetPair
y For plotting SeqPlots classes this argument is ignored, used for default function-ality of plot function.
... Other parameters controlong the plot, see plotAverage for avareange plot andplotHeatmap for heatmaps.
what This argument takes a character determining if avareange plot ("a", default) orheatmap ("h") will be plotted.
Value
Returns NULL for avareange plot and cluster report data.frame for hetamap - see plotHeatmap fordetails.
Methods (by class)
• x = PlotSetPair,y = ANY: Method plot for signature ’PlotSetPair’
• x = PlotSetList,y = ANY: Method plot for signature ’PlotSetList’
• x = PlotSetArray,y = ANY: Method plot for signature ’PlotSetPair’
See Also
getPlotSetArray
Other plotting functions: getPlotSetArray, plotAverage, plotHeatmap
Examples
#load precalculated PlotSetArrays "plotset1" and "plotset2", usually these#objects are the output of getPlotSetArray functionload(system.file("extdata", "precalc_plotset.Rdata", package="seqplots"))
#plot with default valuesplot(plotset2) #Average plotplot(plotset2[1,], what='h') #Heatmap
#setting plot optionsplot(plotset2, main='Title', xlab='Relative position [bp]', ylab='Signal',
colvec=rainbow(6, 0.7, 0.5), labels=LETTERS, legend_ext=TRUE,legend_ext_pos='topright', legend_pos='topleft', ln.h=9)
plot(plotset2[2,], what='h', main="The heatmap", labels=LETTERS,ord = c(3,1,2), sortrows = TRUE, clusters = 2, clstmethod = "hclust",cex.main = 20, cex.lab = 12, cex.legend = 12, xlab = "Rel. pos. [bp]",ylab = "Signal", autoscale = FALSE, zmin = 0, zmax = 20,clspace = rev(rainbow(4, 0.7, 0.5)) )
8 plotAverage
plotAverage Create the average plot
Description
Draw an average plot from PlotSetArray, PlotSetList, PlotSetPair or properly formatted listin active graphics window. Axes and titles, keys and other plot elements are controlled by functionparameters.
Usage
plotAverage(plotset, keepratio = FALSE, labels = NULL, xlim = NULL,ylim = NULL, main = NULL, xlab = "", ylab = "",plotScale = "linear", type = "full", error.estimates = TRUE,legend = TRUE, legend_ext = FALSE, legend_pos = "topright",legend_ext_pos = "topleft", cex.axis = 14, cex.lab = 16,cex.main = 20, cex.legend = 10, ln.v = TRUE, ln.h = NULL,colvec = NULL, pointsize = 12, ...)
## S4 method for signature 'list'plotAverage(plotset, keepratio = FALSE, labels = NULL,xlim = NULL, ylim = NULL, main = NULL, xlab = "", ylab = "",plotScale = "linear", type = "full", error.estimates = TRUE,legend = TRUE, legend_ext = FALSE, legend_pos = "topright",legend_ext_pos = "topleft", cex.axis = 14, cex.lab = 16,cex.main = 20, cex.legend = 10, ln.v = TRUE, ln.h = NULL,colvec = NULL, pointsize = 12, ...)
## S4 method for signature 'PlotSetPair'plotAverage(plotset, keepratio = FALSE,labels = NULL, xlim = NULL, ylim = NULL, main = NULL, xlab = "",ylab = "", plotScale = "linear", type = "full",error.estimates = TRUE, legend = TRUE, legend_ext = FALSE,legend_pos = "topright", legend_ext_pos = "topleft", cex.axis = 14,cex.lab = 16, cex.main = 20, cex.legend = 10, ln.v = TRUE,ln.h = NULL, colvec = NULL, pointsize = 12, ...)
## S4 method for signature 'PlotSetList'plotAverage(plotset, keepratio = FALSE,labels = NULL, xlim = NULL, ylim = NULL, main = NULL, xlab = "",ylab = "", plotScale = "linear", type = "full",error.estimates = TRUE, legend = TRUE, legend_ext = FALSE,legend_pos = "topright", legend_ext_pos = "topleft", cex.axis = 14,cex.lab = 16, cex.main = 20, cex.legend = 10, ln.v = TRUE,ln.h = NULL, colvec = NULL, pointsize = 12, ...)
## S4 method for signature 'PlotSetArray'plotAverage(plotset, keepratio = FALSE,labels = NULL, xlim = NULL, ylim = NULL, main = NULL, xlab = "",ylab = "", plotScale = "linear", type = "full",error.estimates = TRUE, legend = TRUE, legend_ext = FALSE,
plotAverage 9
legend_pos = "topright", legend_ext_pos = "topleft", cex.axis = 14,cex.lab = 16, cex.main = 20, cex.legend = 10, ln.v = TRUE,ln.h = NULL, colvec = NULL, pointsize = 12, ...)
Arguments
plotset The dataset to plot - can be PlotSetArray, PlotSetList, PlotSetPair orproperly formated list
keepratio If TRUE keep 1:1 aspect ratio of the figure; defaults to FALSElabels The character vector giving labels used in experiment key. The defaults NULL
value indicates taht feature/track file names will be used to generate the labels.xlim the x limits (x1, x2) of the plot. Note that x1 > x2 is allowed and leads to a
"reversed axis". The default value, NULL, indicates that the whole range presentin plotset will be plotted.
ylim the y limits (y1, y2) of the plot. Note that x1 > x2 is allowed and leads to a"reversed axis". The default value, NULL, indicates that the range will be autocalculated including space for error estimates.
main The main title of the plot, shown in top-centred part of the figure; defaults toNULL (not visible)
xlab Label shown below horizontal axis; default to "" (empty)ylab Label shown below vertical axis; default to "" (empty)plotScale scale the available data before plotting, can be "linear" (do not scale, default),
"log2" or "zscore"type If set to "legend" only the legend/key will be plotted.error.estimates
Indicates if error estimates are plotted, defaults to TRUElegend Indicates if key describing the PlotSetPairs is shown, defaults to TRUElegend_ext Indicates if key describing error estimates is shown, defaults to FALSElegend_pos The position of main key, defaults to ’topright’legend_ext_pos The position of error estimates key, defaults to ’topleft’cex.axis Axis numbers font size in points, defaults to 14cex.lab Axis labels font size in points, Defaults to 16cex.main Main title font size in points, defaults to 20cex.legend Keys labels font size in points, defaults to 10ln.v Determins if vertical guide line(s) should be plotted (TRUE) or ommitted (FALSE).
For anchored plots 2 lines indicating the start and end of anchored distane areplotted.
ln.h Determins if horizontal guide line should is plotted. Numeric value of the pa-rameter indicates the Y-axis position of the lie, NULL (default) indicates to omit
colvec The vector of colours used to plot the lines and error estimate fields. If setvalue NULL (default) the automatically generated colour values will be used.Accpeted values are: vector of any of the three kinds of R colour specifications,i.e., either a colour name (as listed by colors()), a hexadecimal string of the form"#rrggbb" or "#rrggbbaa" (see rgb), or a positive integer i meaning palette()[i].See col2rgb.
pointsize The default font point size to be used for plots. Defaults to 12 (1/72 inch).... other graphical parameters passed to plot.default (see plot.default, par and
section "Details" below)
10 plotAverage
Details
Relevant parameters passed to plot.default function:
log a character string which contains "x" if the x axis is to be logarithmic, "y" if the y axis is to belogarithmic and "xy" or "yx" if both axes are to be logarithmic.
ann a logical value indicating whether the default annotation (title and x and y axis labels) shouldappear on the plot.
axes a logical value indicating whether both axes should be drawn on the plot. Use graphicalparameter "xaxt" or "yaxt" to suppress just one of the axes.
rame.plot a logical indicating whether a box should be drawn around the plot.
panel.first an "expression" to be evaluated after the plot axes are set up but before any plottingtakes place. This can be useful for drawing background grids or scatterplot smooths. Notethat this works by lazy evaluation: passing this argument from other plot methods may wellnot work since it may be evaluated too early.
panel.last an expression to be evaluated after plotting has taken place but before the axes, titleand box are added. See the comments about panel.first.
asp the y/x aspect ratio, see plot.window.
Value
NULL
Methods (by class)
• list: Method for signature plotset=’list’
• PlotSetPair: Method for signature plotset=’PlotSetPair’
• PlotSetList: Method for signature plotset=’PlotSetList’
• PlotSetArray: Method for signature plotset=’PlotSetArray’
Author(s)
Przemyslaw Stempor
See Also
Other plotting functions: getPlotSetArray, plotHeatmap, plot
Examples
# Get the paths of example filesbed1 <- system.file("extdata",
"Transcripts_ce10_chrI_100Kb.bed", package="seqplots")bed2 <- system.file("extdata",
"GSM1208361_chrI_100Kb_PeakCalls.bed", package="seqplots")bw1 <- system.file("extdata",
"GSM1208360_chrI_100Kb_q5_sample.bw", package="seqplots")
#If required install C. elegans genomic package from Bioconductorif(!"BSgenome.Celegans.UCSC.ce10" %in% BSgenome::installed.genomes()) {
if(.Platform$OS.type != "windows" || .Machine$sizeof.pointer != 4) {source("http://bioconductor.org/biocLite.R")biocLite("BSgenome.Celegans.UCSC.ce10")
plotHeatmap 11
}}
#Get getPlotSetArray for track and feature filesif(.Platform$OS.type != "windows" || .Machine$sizeof.pointer != 4) {
plotset1 <- getPlotSetArray(bw1, c(bed1, bed2), 'ce10')} else {
load(system.file("extdata", "precalc_plotset.Rdata", package="seqplots"))}
plotAverage(plotset1) # equivalent to plot(plotset1) or plotset1$plot()
plotHeatmap Plot heatmap with optional clustering
Description
Draw the heatmap plot from PlotSetArray, PlotSetList, PlotSetPair classes or properly for-matted list (see details) in active graphics window. Axes and titles, keys and other plot elementsare controlled by function parameters.
Usage
plotHeatmap(plotset, main = "", labels = NA, legend = TRUE,keepratio = FALSE, plotScale = "no", sortrows = FALSE, clusters = 5L,clstmethod = "kmeans", include = NULL, ssomt1 = 2L, ssomt2 = 2L,cex.main = 16, cex.lab = 12, cex.axis = 12, cex.legend = 12,xlab = "", ylab = "", autoscale = TRUE, zmin = 0, zmax = 10,xlim = NULL, ln.v = TRUE, s = 0.01, indi = TRUE, o_min = NA,o_max = NA, colvec = NULL, clspace = NULL, pointsize = 12,embed = FALSE, ggplot = FALSE, raster = FALSE, ...)
## S4 method for signature 'list'plotHeatmap(plotset, main = "", labels = NA,legend = TRUE, keepratio = FALSE, plotScale = "no", sortrows = FALSE,clusters = 5L, clstmethod = "kmeans", include = NULL, ssomt1 = 2L,ssomt2 = 2L, cex.main = 16, cex.lab = 12, cex.axis = 12,cex.legend = 12, xlab = "", ylab = "", autoscale = TRUE, zmin = 0,zmax = 10, xlim = NULL, ln.v = TRUE, s = 0.01, indi = TRUE,o_min = NA, o_max = NA, colvec = NULL, clspace = NULL,pointsize = 12, embed = FALSE, ggplot = FALSE, raster = FALSE, ...)
## S4 method for signature 'PlotSetPair'plotHeatmap(plotset, main = "", labels = NA,legend = TRUE, keepratio = FALSE, plotScale = "no", sortrows = FALSE,clusters = 5L, clstmethod = "kmeans", include = NULL, ssomt1 = 2L,ssomt2 = 2L, cex.main = 16, cex.lab = 12, cex.axis = 12,cex.legend = 12, xlab = "", ylab = "", autoscale = TRUE, zmin = 0,zmax = 10, xlim = NULL, ln.v = TRUE, s = 0.01, indi = TRUE,o_min = NA, o_max = NA, colvec = NULL, clspace = NULL,
12 plotHeatmap
pointsize = 12, embed = FALSE, ggplot = FALSE, raster = FALSE, ...)
## S4 method for signature 'PlotSetList'plotHeatmap(plotset, main = "", labels = NA,legend = TRUE, keepratio = FALSE, plotScale = "no", sortrows = FALSE,clusters = 5L, clstmethod = "kmeans", include = NULL, ssomt1 = 2L,ssomt2 = 2L, cex.main = 16, cex.lab = 12, cex.axis = 12,cex.legend = 12, xlab = "", ylab = "", autoscale = TRUE, zmin = 0,zmax = 10, xlim = NULL, ln.v = TRUE, s = 0.01, indi = TRUE,o_min = NA, o_max = NA, colvec = NULL, clspace = NULL,pointsize = 12, embed = FALSE, ggplot = FALSE, raster = FALSE, ...)
## S4 method for signature 'PlotSetArray'plotHeatmap(plotset, main = "", labels = NA,legend = TRUE, keepratio = FALSE, plotScale = "no", sortrows = FALSE,clusters = 5L, clstmethod = "kmeans", include = NULL, ssomt1 = 2L,ssomt2 = 2L, cex.main = 16, cex.lab = 12, cex.axis = 12,cex.legend = 12, xlab = "", ylab = "", autoscale = TRUE, zmin = 0,zmax = 10, xlim = NULL, ln.v = TRUE, s = 0.01, indi = TRUE,o_min = NA, o_max = NA, colvec = NULL, clspace = NULL,pointsize = 12, embed = FALSE, ggplot = FALSE, raster = FALSE, ...)
Arguments
plotset The dataset to plot - can be PlotSetArray, PlotSetList, PlotSetPair orproperly formatted list
main The main title of the plot, shown in top-centre part of the figure; defaults toNULL (not visible)
labels The character vector giving sub-titles of heatmaps (plotted over the heatmap andbelow the main title). The defaults NULL value indicates that feature/track filenames will be used to generate the sub-titles.
legend if TRUE plot the colour key
keepratio If TRUE keep 1:1 aspect ratio of the figure; defaults to FALSE
plotScale scale the available data before plotting, can be "linear" (do not scale, default),"log2" or "zscore"
sortrows If "increasing" or "decreasing" the rows of heatmap will be sorted by meanvalue across all heatmaps, defaults to FALSE - not sorted. For backwards com-patibility TRUE is synonymous to "increasing".
clusters The number of cluster for "kmeans" and "hclust", ignored for "ssom", defaultsto 5L
clstmethod Determines the heatmap clustering algorithm "kmeans" for k-means (default,see kmeans), "hclust" (see hclust) for hierarchical clustering, "ssom" for (su-per) self organising map (see supersom) with torus topology, "bed_scores" touse scores stored in BED/GFF file as cluster indicates, and "none" of FALSE toturn off the clustering
include The logical vector indicating if given subplot should influence clustering andsorting, if given element is FALSE the sub-heatmap will be still plotted, and theorder of data rows will be determined by clustering/sorting other sub-heatmaps,defaults to NULL, which incluses all - equivalent to rep(TRUE, length(plotset))
plotHeatmap 13
ssomt1 Determines , the dimensionality of SOM - number of neurons in 1st dimension,number of resulting clusters equals ssomt1*ssomt2, defaults to 2L
ssomt2 Determines , the dimensionality of SOM - number of neurons in 2st dimension,number of resulting clusters equals ssomt1*ssomt2, defaults to 2L
cex.main Main title font size in points, defaults to 16
cex.lab Axis labels font size in points, Defaults to 12
cex.axis Axis numbers font size in points, defaults to 12
cex.legend Keys labels font size in points, defaults to 12
xlab label below x-axis
ylab label below y-axis
autoscale if TRUE the colour keys will be auto scaled
zmin global minimum value on colour key, ignored if autoscale is TRUE
zmax global maximum value on colour key, ignored if autoscale is TRUE
xlim the x limits (x1, x2) of the plot. Note that x1 > x2 is allowed and leads to a"reversed axis". The default value, NULL, indicates that the whole range presentin plotset will be plotted.
ln.v Determins if vertical guide line(s) should be plotted (TRUE) or ommitted (FALSE).For anchored plots 2 lines indicating the start and end of anchored distance areplotted.
s The saturation value used to auto scale colour key limits, defaults to 0.01
indi If TRUE (defaults) the independent colour keys will be plotted below heatmaps,if FALSE the commmon colour key is shown rightmost
o_min vector of length equal to number of sub heatmaps determining minimum valueon color key for each sub plot, if NULL (default) or NA the global settings areused, ignored in indi is FALSE
o_max vector of length equal to number of sub heatmaps determining maximum valueon color key for each sub plot, if NULL (default) or NA the global settings areused, ignored in indi is FALSE
colvec The vector or list of colour values used generate sub-heatmaps colorspaces. IfNULL (default) the automatically generated colour values will be used for allsub-heatmaps. If single color is provided, the sequential colorspace reging fromgiven color to white will be created. If the vector of colors is provided, thecontinous pallete will be created using these colors. NA value indicates defaultcolor pallete to be used for give sub-heatmap. Accepted values are: vector ofany of the three kinds of R colour specifications, i.e., either a color name (aslisted by colors()), a hexadecimal string of the form "#rrggbb" or "#rrggbbaa"(see rgb), or a positive integer i meaning palette()[i]. See col2rgb.
clspace The colours pace of the heatmap, see grDevices
pointsize The default font point size to be used for plots. Defaults to 12 (1/72 inch).
embed If TRUE plot single (first) heatmap without using grid system. Useful to embedheatmap in complex layouts, see layout and par for details. Defaults to FALSE.
ggplot Use ggplot2 package instead of standard R graphics, defaults to FALSE
raster The bitmap raster is used to plot the heatmap image, see "useRaster" option inimage function and geom_raster function for details, defaults to FALSE
... parameters passed to internal plotting function
14 plotHeatmap
Value
The cluster report data.frame, giving cluster assignments and sorting order for each feature. Itcontains following columns:
• originalOrder - number of feature (row) in GFF/BED, can be used to restore original orderafter sorting on cluster ID
• ClusterID - the numeric ID of the cluster. The topmost cluster on the heatmap is annotatedwith 1, and the bottom cluster with k, where k equals to number of clusters selected, exportedonly if clustering is enabled
• SortingOrder - the order imposed on heatmap by sorting by mean row(s) values, exportedonly if sorting is enabled
• FinalOrder - the final order of heatmap’s rows, this can be influenced by sorting and cluster-ing; 1 indicates topmost row
Methods (by class)
• list: Method for signature list with following format: list[[FEATURE]][[TRACK/MOTIF]][[KEY_VALUE]]
• PlotSetPair: Method for signature PlotSetPair
• PlotSetList: Method for signature PlotSetList
• PlotSetArray: Method for signature PlotSetArray
See Also
Other plotting functions: getPlotSetArray, plotAverage, plot
Examples
# Get the paths of example filesbed1 <- system.file("extdata",
"Transcripts_ce10_chrI_100Kb.bed", package="seqplots")bed2 <- system.file("extdata",
"GSM1208361_chrI_100Kb_PeakCalls.bed", package="seqplots")bw1 <- system.file("extdata",
"GSM1208360_chrI_100Kb_q5_sample.bw", package="seqplots")
#If required install C. elegans genomic package from Bioconductorif(!"BSgenome.Celegans.UCSC.ce10" %in% BSgenome::installed.genomes()) {
if(.Platform$OS.type != "windows" || .Machine$sizeof.pointer != 4) {source("http://bioconductor.org/biocLite.R")biocLite("BSgenome.Celegans.UCSC.ce10")
}}
#Get getPlotSetArray for track and feature filesif(.Platform$OS.type != "windows" || .Machine$sizeof.pointer != 4) {
plotset1 <- getPlotSetArray(bw1, c(bed1, bed2), 'ce10')} else {
load(system.file("extdata", "precalc_plotset.Rdata", package="seqplots"))}
# equivalent to plot(plotset1, what='h') or plotset1$plot(what='h')plotHeatmap(plotset1[1])
PlotSetArray-class 15
PlotSetArray-class PlotSetArray Reference Class
Description
PlotSetArray Reference Class
Fields
data a nested list holding the data
annotations list of annotations
Methods
anno(n) Extracts the genomic locations for nth feature as GRanges
as.array(x, ...) Converts PlotSetArray calss to matrix of PlotSeqPairs
get(i, j) Subseting method, returns PlotSetArray
getByID(i) Subseting method, returns PlotSeqList
getPairs(i) Subseting method, takes pair IDs list, returns PlotSetList
getRow(i) Subseting method, get row of data as list
info() Outputs data.frame describing the content of PlotSetList
nfeatures() Outputs the number of features in the PlotSetArray
ntracks() Outputs the number of tracks in the PlotSetArray
pairind() Outputs the list of pair IDs
plot(...) Plot the PlotSetArray, i.e. all PlotSetPairs within class. See plot for datails.
subset(i, j) Subseting method, get PlotSetPair as list
unlist() Flattens PlotSetArray to PlotSetList
Subsetting
x is an object of PlotSetArray class:
• x[1:2,1:2] produces PlotSetArray with 2 feature(s) and 2 tracks.
• x[1:2] produces PlotSetList with 2 feature/tracks pairs.
• x[[1]] produces single PlotSetPair.
• unlist(x) produces PlotSetList with all feature/tracks pairs.
• x$as.array() produces the matrix of PlotSetPair classes with all feature/tracks pairs.
See Also
Other classes: MotifSetup-class, PlotSetList-class, PlotSetPair-class
16 PlotSetPair-class
PlotSetList-class PlotSetList Reference Class
Description
PlotSetList Reference Class
Fields
data a nested list holding the data
annotations list of annotations
Methods
get(i) Subseting method
info() Outputs data.frame describing the content of PlotSetList
npaires() Outputs the number (integer) of PlotSetPairs in the PlotSetList
plot(what = "a", ...) Plot the PlotSetList, i.e. all PlotSetPairs in the list. See plot for datails.
Subsetting
x is an object of PlotSetList class:
• x[1:2] produces PlotSetList with 2 feature/tracks pairs.
• x[[1]] produces single PlotSetPair.
See Also
Other classes: MotifSetup-class, PlotSetArray-class, PlotSetPair-class
PlotSetPair-class PlotSetPair Reference Class
Description
PlotSetPair Reference Class
Fields
means numeric vector of means
stderror numeric vector of standard errors
conint numeric vector of 95% confidence intervals
all_ind numeric vector giving the relative position of the bins in the genome
numeric value giving the length of anchored distance, NULL for point feature plots
desc character string describing the PlotSetPair
heatmap numeric matrix used for plotting the heatmap
run 17
Methods
as.list() Convert to PlotSetPair list.
plot(what = "a", ...) Plot the PlotSetPair class. See plot for datails.
See Also
Other classes: MotifSetup-class, PlotSetArray-class, PlotSetList-class
run SeqPlots innitiation
Description
This function initaite SeqPlots and oppens web browser with graphical user interface (GUI).
Usage
run(root = file.path(path.expand("~"), "SeqPlots_data"), debug = FALSE, ...)
Arguments
root the path to data directory, it will be created if not existing
debug run the SeqPlots in debug mode, i.e. with R console embedded in web interface
... arguments sent to runApp function
Details
The default data directory is "~/SeqPlots_data".
Value
Normally returns nothing (NULL), returns an error if one accrued. Usage messages are shown in Rconsole.
Author(s)
Przemyslaw Stempor
Examples
# run()
18 seqplots
seqplots SeqPlots - An interactive tool for visualizing NGS signals and se-quence motif densities along genomic features using average plots andheatmaps.
Description
SeqPlots is a tool for plotting next generation sequencing (NGS) based experiments’ signal tracks,e.g. reads coverage from ChIP-seq, RNA-seq and DNA accessibility assays like DNase-seq andMNase-seq, over user specified genomic features, e.g. promoters, gene bodies, etc. It can alsocalculate sequence motif density profiles from reference genome. The data are visualized as aver-age signal profile plot, with error estimates (standard error and 95 of heatmaps that can be sortedand clustered using hierarchical clustering, k-means algorithm and self organising maps. Plots canbe prepared using R programming language or web browser based graphical user interface (GUI)implemented using Shiny framework. The dual-purpose implementation allows running the soft-ware locally on desktop or deploying it on server. SeqPlots is useful for both for exploratory dataanalyses and preparing replicable, publication quality plots. Other features of the software includecollaboration and data sharing capabilities, as well as ability to store pre-calculated result matrixes,that combine many sequencing experiments and in-silico generated tracks with multiple differentfeatures. These binaries can be further used to generate new combination plots on fly, run auto-mated batch operations or share with colleagues, who can adjust their plotting parameters withoutloading actual tracks and recalculating numeric values. SeqPlots relays on Bioconductor packages,mainly on rtracklayer for data input and BSgenome packages for reference genome sequence andannotations.
Details
Useful links:
• Project web page: https://github.com/Przemol/seqplots
• Online documentation: http://przemol.github.io/seqplots/
• Project wiki: https://github.com/przemol/seqplots/wiki
• Issue tracker: http://github.com/przemol/seqplots/issues
• Bug reports: http://github.com/przemol/seqplots/issues/new
Author(s)
Przemyslaw Stempor
References
R project and Bioconductor:
• R Core Team (2014). R: A language and environment for statistical computing. R Foundationfor Statistical Computing, Vienna, Austria. URL http://www.R-project.org/.
• Bioconductor: Open software development for computational biology and bioinformatics R.Gentleman, V. J. Carey, D. M. Bates, B.Bolstad, M.Dettling, S. Dudoit, B. Ellis, L. Gautier, Y.Ge, and others 2004, Genome Biology, Vol. 5, R80. URL http://www.bioconductor.org/.
• RStudio and Inc. (2014). shiny: Web Application Framework for R. R package version 0.10.1.http://shiny.rstudio.com/.
seqplots 19
• Other CRAN packages: digest, DBI,RSQLite, jsonlite, plotrix, fields, grid, kohonen, Cairo,parallel
• Bioconductor packages: IRanges, BSgenome, Rsamtools, rtracklayer, GenomicRanges andBiostrings
JavaScript and CSS
• jQuery framework - http://jquery.com
• Bootstrap - http://getbootstrap.com
• DataTables, Table plug-in for jQuery - http://www.datatables.net
• jQuery File Upload Plugin - https://github.com/blueimp/jQuery-File-Upload
• jQuery throttle - http://benalman.com/projects/jquery-throttle-debounce-plugin/
• jQuery Cookie Plugin - https://github.com/carhartl/jquery-cookie
• Modernizer JS library - http://modernizr.com
• JavaScript Templates - https://github.com/blueimp/JavaScript-Templates
• JavaScript Color Picker - http://jscolor.com
• md5-js - https://github.com/wbond/md5-js
• Font Awesome - http://fortawesome.github.io/Font-Awesome
• Google Fonts - https://www.google.com/fonts
• jQuery user interface - http://jqueryui.com (documentation)
• jquery.tocify.js: jQuery Table of Contents - https://github.com/gfranko/jquery.tocify.js (documentation)
• Strapdown https://github.com/arturadib/strapdown (documentation)
• Bootswatch themes - http://bootswatch.com (documentation)
• google-code-prettify - https://code.google.com/p/google-code-prettify (documenta-tion)
• marked - https://github.com/chjj/marked (documentation)
Important conceptual contribution to the project
• Liu T, Ortiz J, Taing L, Meyer C, Lee B, Zhang Y, Shin H, Wong S, Ma J, Lei Y, et al. 2011.Cistrome: an integrative platform for transcriptional regulation studies. Genome Biology 12:R83.
• Thomas Williams, Colin Kelley and others (2010). Gnuplot 4.4: an interactive plotting pro-gram. URL http://www.R-project.org/.
• Kent, W.J., Sugnet, C.W., Furey, T.S., Roskin, K.M., Pringle, T.H., Zahler, A.M. and Haussler,a. D. (2002). The Human Genome Browser at UCSC. Genome Research. 12:996-1006.
• Kent WJ, Zweig AS, Barber G, Hinrichs AS, Karolchik D. (2010). BigWig and BigBed:enabling browsing of large distributed datasets. Bioinformatics. 1;26(17):2204-7
• Nicol, J.W., Helt, G.A., Blanchard, S.G., Raja, A. and Loraine, A.E. (2009). The IntegratedGenome Browser: free software for distribution and exploration of genome-scale datasets.Bioinformatics (Oxford, England). 25:2730-1.
• Thorvaldsdottir, H., Robinson, J.T. and Mesirov, J.P. (2012). Integrative Genomics Viewer(IGV): high-performance genomics data visualization and exploration. Briefings in bioinfor-matics. bbs017
Server deployment
20 seqplots-generic
• Shiny Server - https://github.com/rstudio/shiny-server
• ShinyApps - https://github.com/rstudio/shinyapps
Publications containing figures made by SeqPlots
• Chen RA, Stempor P, Down TA, Zeiser E, Feuer SK, Ahringer J. Extreme HOT regions areCpG-dense promoters in C. elegans and humans. Genome Res 24(7):1138-1146 Jul 2014
seqplots-generic SeqPlots generic methods
Description
Generic operators working with PlotSetArray, PlotSetList and PlotSetPair to subset or flattenthe data structure.
Usage
## S4 method for signature 'PlotSetList,ANY,ANY,ANY'x[i, j, ..., drop = TRUE]
## S4 method for signature 'PlotSetList,ANY,ANY'x[[i, j, ...]]
## S4 method for signature 'PlotSetArray,ANY,missing,ANY'x[i, j, ..., drop = TRUE]
## S4 method for signature 'PlotSetArray,ANY,vector,ANY'x[i, j]
## S4 method for signature 'PlotSetArray,ANY,ANY'x[[i, j, ...]]
Arguments
x an object of class PlotSetArray, PlotSetList or PlotSetPair
i indices specifying elements to extract or replace. Indices are numeric or charactervectors or empty (missing) or NULL. Numeric values are coerced to integer asby as.integer (and hence truncated towards zero). Character vectors will bematched to the names of the object (or for matrices/arrays, the dimnames): see‘Character indices’ below for further details.For [-indexing only: i, j, ... can be logical vectors, indicating elements/slicesto select. Such vectors are recycled if necessary to match the correspondingextent. i, j, ... can also be negative integers, indicating elements/slices toleave out of the selection.When indexing arrays by [ a single argument i can be a matrix with as manycolumns as there are dimensions of x; the result is then a vector with elementscorresponding to the sets of indices in each row of i.An index value of NULL is treated as if it were integer(0).
j see description for i
seqplots-generic 21
... see description for i
drop For matrices and arrays. If TRUE the result is coerced to the lowest possibledimension (see the examples). This only works for extracting elements, not forthe replacement. See drop for further details.
Value
If x is PlotSetArray class:
• x[1:2,1:2] produces PlotSetArray with 2 feature(s) and 2 tracks.
• x[1:2] produces PlotSetList with 2 feature/tracks pairs.
• x[[1]] produces single PlotSetPair.
• x$as.array() produces the matrix of PlotSetPair classes with all feature/tracks pairs.
If x is PlotSetList class:
• x[1:2] produces PlotSetList with 2 feature/tracks pairs.
• x[[1]] produces single PlotSetPair.
See Also
Extract
Index
∗Topic seqplotsrun, 17
[,PlotSetArray,ANY,missing,ANY-method(seqplots-generic), 20
[,PlotSetArray,ANY,vector,ANY-method(seqplots-generic), 20
[,PlotSetList,ANY,ANY,ANY-method(seqplots-generic), 20
[[,PlotSetArray,ANY,ANY-method(seqplots-generic), 20
[[,PlotSetList,ANY,ANY-method(seqplots-generic), 20
as.integer, 20available.genomes, 4
BSgenome, 4
col2rgb, 9, 13
dimnames, 20drop, 21
Extract, 21
geom_raster, 13getPlotSetArray, 2, 7, 10, 14grDevices, 13
hclust, 12
image, 13installed.genomes, 4
kmeans, 12
layout, 13list, 8, 9, 11, 12, 14
message, 3MotifSetup, 3, 4MotifSetup (MotifSetup-class), 5MotifSetup-class, 5
names, 20
par, 9, 13plot, 4, 6, 7, 10, 14–17plot,PlotSetArray,ANY-method (plot), 6plot,PlotSetList,ANY-method (plot), 6plot,PlotSetPair,ANY-method (plot), 6plot.default, 9, 10plotAverage, 4, 7, 8, 14plotAverage,list-method (plotAverage), 8plotAverage,PlotSetArray-method
(plotAverage), 8plotAverage,PlotSetList-method
(plotAverage), 8plotAverage,PlotSetPair-method
(plotAverage), 8plotHeatmap, 4, 7, 10, 11plotHeatmap,list-method (plotHeatmap),
11plotHeatmap,PlotSetArray-method
(plotHeatmap), 11plotHeatmap,PlotSetList-method
(plotHeatmap), 11plotHeatmap,PlotSetPair-method
(plotHeatmap), 11PlotSetArray, 3, 4, 7–9, 11, 12, 14, 15, 20, 21PlotSetArray (PlotSetArray-class), 15PlotSetArray-class, 15PlotSetList, 7–9, 11, 12, 14–16, 20, 21PlotSetList (PlotSetList-class), 16PlotSetList-class, 16PlotSetPair, 7–9, 11, 12, 14–16, 20, 21PlotSetPair (PlotSetPair-class), 16PlotSetPair-class, 16
run, 17runApp, 17
seqplots, 18seqplots-generic, 20seqplots-package (seqplots), 18supersom, 12
22