Embed Size (px)
Citation preview
Package ‘MethComp’March 31, 2015
Version 1.22.2
Date 2013-05-08
Title Functions for Analysis of Agreement in Method Comparison Studies
Author Bendix Carstensen, Lyle Gurrin, Claus Ekstrom, Michal Figurski
Maintainer Bendix Carstensen <[email protected]>
Depends R (>= 3.0.0), nlme
Suggests R2WinBUGS, BRugs, rjags, coda, lattice, lme4
Description Methods (standard and advanced) for analysis of agreementbetween measurement methods.
License GPL (>= 2)
URL http://BendixCarstensen.com/MethComp/
NeedsCompilation no
Repository CRAN
Date/Publication 2015-03-31 18:44:43
R topics documented:abconv . . . . . . . . . . . . . . . . . . . . . . . . . . . . . . . . . . . . . . . . . . . . 2AltReg . . . . . . . . . . . . . . . . . . . . . . . . . . . . . . . . . . . . . . . . . . . . 3Ancona . . . . . . . . . . . . . . . . . . . . . . . . . . . . . . . . . . . . . . . . . . . 6BA.est . . . . . . . . . . . . . . . . . . . . . . . . . . . . . . . . . . . . . . . . . . . . 7BA.plot . . . . . . . . . . . . . . . . . . . . . . . . . . . . . . . . . . . . . . . . . . . 10BlandAltman . . . . . . . . . . . . . . . . . . . . . . . . . . . . . . . . . . . . . . . . 14bothlines . . . . . . . . . . . . . . . . . . . . . . . . . . . . . . . . . . . . . . . . . . . 17cardiac . . . . . . . . . . . . . . . . . . . . . . . . . . . . . . . . . . . . . . . . . . . . 18CardOutput . . . . . . . . . . . . . . . . . . . . . . . . . . . . . . . . . . . . . . . . . 19check.MCmcmc . . . . . . . . . . . . . . . . . . . . . . . . . . . . . . . . . . . . . . . 20choose.trans . . . . . . . . . . . . . . . . . . . . . . . . . . . . . . . . . . . . . . . . . 22corr.measures . . . . . . . . . . . . . . . . . . . . . . . . . . . . . . . . . . . . . . . . 23DA.reg . . . . . . . . . . . . . . . . . . . . . . . . . . . . . . . . . . . . . . . . . . . . 24Deming . . . . . . . . . . . . . . . . . . . . . . . . . . . . . . . . . . . . . . . . . . . 27
1
2 abconv
Enzyme . . . . . . . . . . . . . . . . . . . . . . . . . . . . . . . . . . . . . . . . . . . 29fat . . . . . . . . . . . . . . . . . . . . . . . . . . . . . . . . . . . . . . . . . . . . . . 29glucose . . . . . . . . . . . . . . . . . . . . . . . . . . . . . . . . . . . . . . . . . . . 30hba.MC . . . . . . . . . . . . . . . . . . . . . . . . . . . . . . . . . . . . . . . . . . . 31hba1c . . . . . . . . . . . . . . . . . . . . . . . . . . . . . . . . . . . . . . . . . . . . 32MCmcmc . . . . . . . . . . . . . . . . . . . . . . . . . . . . . . . . . . . . . . . . . . 33Meth . . . . . . . . . . . . . . . . . . . . . . . . . . . . . . . . . . . . . . . . . . . . . 37Meth.sim . . . . . . . . . . . . . . . . . . . . . . . . . . . . . . . . . . . . . . . . . . 40MethComp . . . . . . . . . . . . . . . . . . . . . . . . . . . . . . . . . . . . . . . . . 42milk . . . . . . . . . . . . . . . . . . . . . . . . . . . . . . . . . . . . . . . . . . . . . 45ox . . . . . . . . . . . . . . . . . . . . . . . . . . . . . . . . . . . . . . . . . . . . . . 46ox.MC . . . . . . . . . . . . . . . . . . . . . . . . . . . . . . . . . . . . . . . . . . . . 47PBreg . . . . . . . . . . . . . . . . . . . . . . . . . . . . . . . . . . . . . . . . . . . . 48PEFR . . . . . . . . . . . . . . . . . . . . . . . . . . . . . . . . . . . . . . . . . . . . 50perm.repl . . . . . . . . . . . . . . . . . . . . . . . . . . . . . . . . . . . . . . . . . . 51plot.MCmcmc . . . . . . . . . . . . . . . . . . . . . . . . . . . . . . . . . . . . . . . . 52plot.PBreg . . . . . . . . . . . . . . . . . . . . . . . . . . . . . . . . . . . . . . . . . . 54plot.VarComp . . . . . . . . . . . . . . . . . . . . . . . . . . . . . . . . . . . . . . . . 55plvol . . . . . . . . . . . . . . . . . . . . . . . . . . . . . . . . . . . . . . . . . . . . . 57predict.PBreg . . . . . . . . . . . . . . . . . . . . . . . . . . . . . . . . . . . . . . . . 58rainman . . . . . . . . . . . . . . . . . . . . . . . . . . . . . . . . . . . . . . . . . . . 59sbp . . . . . . . . . . . . . . . . . . . . . . . . . . . . . . . . . . . . . . . . . . . . . . 61sbp.MC . . . . . . . . . . . . . . . . . . . . . . . . . . . . . . . . . . . . . . . . . . . 62scint . . . . . . . . . . . . . . . . . . . . . . . . . . . . . . . . . . . . . . . . . . . . . 63TDI . . . . . . . . . . . . . . . . . . . . . . . . . . . . . . . . . . . . . . . . . . . . . 64to.wide . . . . . . . . . . . . . . . . . . . . . . . . . . . . . . . . . . . . . . . . . . . 65VitCap . . . . . . . . . . . . . . . . . . . . . . . . . . . . . . . . . . . . . . . . . . . . 66
Index 67
abconv Derive linear conversion coefficients from a set of indeterminate coef-ficients
Description
If a method comparison model is defined as ymi = αm + βmµi,m = 1, 2 y_mi = alpha_m +beta_m*mu_i, m=1,2 the coefficients of the linear conversion from method 1 to 2 are computedas: α2|1 = −α2 − α1β2/β1 alpha_(2|1) = -alpha_2-alpha_1*beta_2/beta_1 β2|1 = β2/β1 Moroverthe the point where the linear conversion function intersects the identity line is computed too.. Thefunction is designed to work on numerical vectors of posterior samples from BUGS output.
Usage
abconv( a1, b1 = 1:4, a2 = NULL, b2 = NULL,col.names = c("alpha.2.1", "beta.2.1", "id.2.1") )
AltReg 3
Arguments
a1 Numerical vector of intercepts for first method. Alternatively a dataframe wherethe vectors are selected from.
b1 Numerical vector of slopes for first method. If a1 is a dataframe, b1 is assumedto be a numerical vector of length 4 pointing to the columns of a1 with theintercepts and slopes.
a2 Numerical vector of intercepts for second method.
b2 Numerical vector of slopes for second method.
col.names Names for the resulting three vectors.
Value
A dataframe with three columns: intercept and slope for the conversion from method 1 to method2, and the value where the conversion is the identity.
Author(s)
Bendix Carstensen, Steno Diabetes Center, http://BendixCarstensen.com
References
B Carstensen: Comparing and predicting between several methods of measurement, Biostatistics,5, pp 399-413, 2004
See Also
BA.plot, MCmcmc
Examples
abconv( 0.3, 0.9, 0.8, 0.8 )
AltReg Estimate in a method comparison model with replicates
Description
Estimates in the general model for method comparison studies with replicate measurements byeach method, allowing for a linear relationship between methods, using the method of alternatingregressions.
4 AltReg
Usage
AltReg( data,linked = FALSE,
IxR = linked,MxI = TRUE,
varMxI = FALSE,eps = 0.001,
maxiter = 50,trace = FALSE,sd.lim = 0.01,
Transform = NULL,trans.tol = 1e-6 )
Arguments
data Data frame with the data in long format, (or a Meth object) i.e. it must havecolumns meth, item, repl and y
linked Logical. Are the replicates linked across methods? If true, a random item byrepl is included in the model, otherwise not.
IxR Logical, alias for linked.
MxI Logical, should the method by item effect (matrix effect) be in the model?
varMxI Logical, should the method by item effect have method-specific variances. Ig-nored if only two methods are compared. See details.
eps Convergence criterion, the test is the max of the relative change since last itera-tion in both mean and variance parameters.
maxiter Maximal number of iterations.
trace Should a trace of the iterations be printed? If TRUE iteration number, conver-gence criterion and current estimates of means and sds are printed.
sd.lim Estimated standard deviations below sd.lim are disregarded in the evaluationof convergence. See details.
Transform A character string, or a list of two functions, each other’s inverse. The measure-ments are transformed by this before analysis. Possibilities are: "exp", "log","logit", "pctlogit" (transforms percentages by the logit), "sqrt", "sq" (square),"cll" (complementary log-minus-log), "ll" (log-minus-log). For further detailssee choose.trans.
trans.tol The tolerance used to check whether the supplied transformation and its inversecombine to the identity. Only used if Transform is a list of two functions.
Details
When fitting a model with both IxR and MxI interactions it may become very unstable to havedifferent variances of the MxI random effects for each method, and hence the default option is tohave a constant MxI variance across methods. On the other hand it may be grossly inadequate toassume these variances to be identical.
AltReg 5
If only two methods are compared, it is not possible to separate different variances of the MxI effect,and hence the varMxI is ignored in this case.
The model fitted is formulated as:
ymir = αm + βm(µi + air + cmi) + emir
and the relevant parameters to report are the estimates sds of air and cmi multiplied with the cor-resonidng βm. Therefore, different values of the variances for MxI and IxR are reported also whenvarMxI==FALSE. Note that varMxI==FALSE is the default and that this is the opposite of the defaultin BA.est.
Value
An object of class c("MethComp","AltReg"), which is a list with three elements:
Conv A 3-way array with the 2 first dimensions named "To:" and "From:", with meth-ods as levels. The third dimension is classifed by the linear parameters "alpha","beta", and "sd".
VarComp A matrix with methods as rows and variance components as columns. Entriesare the estimated standard deviations.
data The original data used in the analysis, with untransformed measurements (ys).This is needed for plotting purposes.
Moreover, if a transformation was applied before analysis, an attribute "Transform" is present; a listwith two elements trans and inv, both of which are functions, the first the transform, the last theinverse.
Author(s)
Bendix Carstensen, Steno Diabetes Center, <[email protected]>, http://BendixCarstensen.com.
References
B Carstensen: Comparing and predicting between several methods of measurement. Biostatistics(2004), 5, 3, pp. 399–413.
See Also
BA.est, DA.reg, Meth.sim, MethComp
Examples
data( ox )ox <- Meth( ox )## Not run:ox.AR <- AltReg( ox, linked=TRUE, trace=TRUE, Transform="pctlogit" )str( ox.AR )ox.AR# plot the resulting conversion between methodsplot(ox.AR,pl.type="conv",axlim=c(20,100),points=TRUE,xaxs="i",yaxs="i",pch=16)# - or the rotated plot
6 Ancona
plot(ox.AR,pl.type="BA",axlim=c(20,100),points=TRUE,xaxs="i",yaxs="i",pch=16)## End(Not run)
Ancona Data from a rating experiment of recorgnizing point counts.
Description
At the course "Statsitical Analysis of Method Comparison Studies" ai the SISMEC conference inAncona, on 28 September 2011, the participants on the course were used as raters of ten pictures ofpoints. Pitures were shown 3 times each to the participants, and they assessed the number of pointsin each.
Usage
data(Ancona)
Format
A data frame with 510 observations on the following 4 variables.
rater a factor with 17 levels
item a numeric vector indicating the pictures shown. The value is the actual number of points.
repl a numeric vector, replicate number
score a numeric vector, the number of points in item
Source
The course "Statsitical Analysis of Method Comparison Studies" ai the SISMEC conference inAncona, on 28 September 2011.
Examples
library( MethComp )data( Ancona )Anc <- Meth( Ancona, 1, 2, 3, 4 )
BA.est 7
BA.est Bias and variance components for a Bland-Altman plot.
Description
A variance component model is fitted to method comparison data with replicate measurements ineach method by item stratum. The purpose is to simplify the construction of a correct Bland-Altman-plot when replicate measurements are available, and to give the REML-estimates of therelevant variance components.
Usage
BA.est( data, linked=TRUE, IxR=has.repl(data),MxI=has.repl(data),
corMxI=FALSE,varMxI=TRUE,IxR.pr=FALSE,bias=TRUE, alpha=0.05,
Transform = NULL,trans.tol = 1e-6,random.raters = FALSE,lmecontrol = lmeControl(msMaxIter=300),weightfunction = c("mean", "median")
)## S3 method for class 'BA.est'
bias( obj, ref=1, ... )VC.est( data,
IxR = has.repl(data), linked = IxR,MxI = has.repl(data), matrix = MxI,
corMxI = FALSE,varMxI = TRUE,bias = TRUE,
print = FALSE,random.raters = FALSE,
lmecontrol = lmeControl(msMaxIter=300))
Arguments
data A Meth object representing method comparison data with replicate measure-ments, i.e. with columns meth, item, repl and y.
linked Logical. Are replicates linked within item across methods?
IxR Logical. Should an item by repl interaction be included in the model. This isneeded when the replicates are linked within item across methods, so it is justanother name for the linked argument. If linked= is given, this is ignored.
8 BA.est
MxI Logical. Should the method by item interaction (matrix effect) be included inthe model.
matrix Logical. Alias for MxI.
corMxI Logical. Should the method by item interaction allow coorelated effects withinitem. Ignored if only two methods are compared.
varMxI Logical. Should the method by item interaction have a variance that varies be-tween methods. Ignored if only two methods are compared.
IxR.pr Logical. Should the item by repl interaction variation be included in the predic-tion standard deviation?
bias Logical. Should a systematic bias between methods be estimated? If FALSE nobias between methods are assumed, i.e. αm = 0,m = 1, . . .M .
alpha Numerical. Significance level. By default the value 2 is used when computingprediction intervals, otherwise the 1−α/2 t-quantile is used. The number of d.f.is taken as the number of units minus the number of items minus the number ofmethods minus 1 (I −M − 1).
Transform Transformation applied to data (y) before analysis. See check.trans for possi-ble values.
trans.tol Numerical. The tolerance used to check whether the supplied transformationand its inverse combine to the identity.
random.raters Logical. Should methods/raters be considered as random. Defaults to FALSEwhich corresponds to a fixed effect of methods/raters.
lmecontrol A list of control parameters passed on to lme.
weightfunction Function to weigh variance components for random raters. Defaults to mean butcan also be median.
obj A BA.est object from which to extract the biases between methods.
ref Numeric or character. The reference method for the biases: the method withbias 0.
print Logical. Should the estimated bias and variance components be printed?
... Further arguments passed on. Currently ignored.
Details
The model fitted is:
y = αm + µi + cmi + air + emir, var(cmi) = τ2m, var(air) = ω2, var(emir) = σ2m,
We can only fit separate variances for the τs if more than two methods are compared (i.e. nM > 2),hence varMxI is ignored when nM==2.
The function VC.est is the workhorse; BA.est just calls it. VC.est figures out which model to fitby lme, extracts results and returns estimates. VC.est is also used as part of the fitting algorithmin AltReg, where each iteration step requires fit of this model. The function VC.est is actuallyjust a wrapper for the functions VC.est.fixed that handles the case with fixed methods (usually2 or three) i.e. the classical method comparison problem, and VC.est.random that handles thesituation where "methods" are merely a random sample of raters from some population of raters;and therefore are regarded as random.
BA.est 9
Value
BA.est returns an object of class c("MethComp","BA.est"), a list with four elements Conv, VarComp,LoA, RepCoef; VC.est returns (invisibly!) a list with elements Bias, VarComp, Mu, RanEff. Theselist components are:
Conv 3-dimensional array with dimensions "To", "From" and unnamed. The first twodimensions have the methods compared as levels, the last one c("alpha","beta","sd.pred","LoA: lower","upper").It represents the mean conversions between methods and the prediction standarddeviation.Where "To" and "From" take the same value the value of the "sd" component is√2 times the residual variation for the method. If IxR.pr=TRUE the variation be-
tween replicates are included too, i.e.√
2(σ2m + ω2) sqrt[2(sigma_m^2+omega^2)].
VarComp A matrix of variance components (on the SD scale) with methods as rows andvariance components "IxR", "MxI" and "res" as columns.
LoA Four-column matrix with mean difference, lower and upper limit of agreementand prediction SD. Each row in the matrix represents a pair of methods.
RepCoef Two-column matrix of repeatability SDs and repeatability coefficients. The SDsare the standard deviation of the difference between two measurements by thesame method on the item under identical circumstances; the repeatability coeffi-cient the numerical extent of the prediction interval for this difference, i.e. 2
√2
times the sd.
Mu Estimates of the item-specific parameters.
RanEff Estimates of the random effects from the model (BLUPS). This is a (possiblyempty) list with possible elements named MxI and IxR according to whetherthese random effects are in the model.
The returned object has an attribute, Transform with the transformation applied to data beforeanalysis, and its inverse — see choose.trans.
Author(s)
Bendix Carstensen
References
Carstensen, Simpson & Gurrin: Statistical models for assessing agreement in method comparisonstudies with replicate measurements, The International Journal of Biostatistics: Vol. 4 : Iss. 1,Article 16. http://www.bepress.com/ijb/vol4/iss1/16.
See Also
BA.plot, perm.repl
Examples
data( ox )ox <- Meth( ox )summary( ox )
10 BA.plot
BA.est( ox )BA.est( ox, linked=FALSE )BA.est( ox, linked=TRUE, Transform="pctlogit" )## Not run:data( sbp )BA.est( sbp )BA.est( sbp, linked=FALSE )# Check what you get from VC.eststr( VC.est( sbp ) )## End(Not run)
BA.plot Bland-Altman plot of differences versus averages.
Description
For two vectors of equal length representing measurements of the same quantity by two differentmethods, the differences are plotted versus the average. The limits of agreement (prediction limitsfor the differences) are plotted, optionally a regression of differences of means is given too. Workswith Meth and MethComp objects too.
Usage
BA.plot( y1, y2, meth.names = NULL,wh.comp = 1:2,pl.type = "BA",dif.type = "const",sd.type = "const",model = if( inherits(y1,"Meth") & has.repl(y1) ) "exch"
else NULL,eqax = FALSE,
axlim = if( is.data.frame(y1) ) range(y1$y) else range(c(y1,y2)),diflim = NULL,grid = TRUE,
N.grid = 10,col.grid = grey(0.9),points = TRUE,
col.points = "black",cex.points = 1,pch.points = 16,
lwd = c(3,1,1),col.lines = "blue",repl.conn = FALSE,col.conn = "gray",lwd.conn = 1,
xlab = NULL,ylab = NULL,eqn = FALSE,

BA.plot 11
col.eqn = col.lines,font.eqn = 2,digits = 2,
Transform = if( mult ) "log" else NULL,mult = FALSE,alpha = NULL,... )
Arguments
y1 Numerical vector of measurements by 1st method. Can also be a Meth or aMethComp object, see details.
y2 Numerical vector of measurements by 2nd method. Must of same length as x.Ignored if a Meth or a MethComp objects is given for y1.
meth.names Label for the method names.
wh.comp Which methods should be compared. Either numerical or character.
pl.type What type of plot should be made, "BA" for differences versus averages, "conv"for method 1 versus method 2.
dif.type How should difference depend on the averages. "const" or "lin".
sd.type How should the standard deviation depend on the averages. "const" or "lin".
model Should a variance component model be used to compute the limits of agree-ment? If NULL a simple analysis is made; other possibilities are "exch" or"linked" for exchangeable or linked replicates.
eqax Should the axes be identical? If a Bland-Altman plot is drawn, the axis for thedifferences will have the same extent as the axis for the averages, but centeredon 0 (see diflim).
axlim The limits of the axes.
diflim The limits of the difference axis.
grid Should a grid be drawn? If numeric it indicates the places where the grid isdrawn.
N.grid How many grid-lines should be drawn.
col.grid What should be the color of the grid?
points Logical. Should the observed points be drawn?
col.points What color should they have?
cex.points How large should they be?
pch.points What plot character for the points
lwd Numerical vector of 3, giving the width of the conversion line (mean difference)and the limits of agreement.
col.lines What color should the lines have.
repl.conn Should replicate measurements be connected (within items)?
col.conn Color of connecting lines.
12 BA.plot
lwd.conn Width of connecting lines.
xlab x-axis label.
ylab y-axis label.
eqn Logical. Should the equations linking the methods be shown on the plot? Ifa Bland-Altman plot is made, both the equations linking the methods and theequation for the differences versus the averages are shown.
col.eqn Color for equations
font.eqn Font for equations
digits How many digits after the decimal point should be used when showing the equa-tions.
Transform Transformation applied to data prior to analysis. Plots are made on the originalscale after back-transformation.
mult Logical. If TRUE, ratios of measurement instead of differences will be plottedin the Bland-Altman plot on a logarithmic axis, and limits of agreement will begiven on this scale? This gives the same analysis as using Transform="log",but a different plot. Using another transformation than the log is accommodated,but no LoA is shown on the axis.
alpha 1 minus the confidence level. If NULL a multiplier of 2 is used for constructingprediction limits, otherwise a t-quantile with d.f. equal th number of items minus1.
... Further parameters passed on to plot.MethComp
Details
A plot of the relationship between the methods is produced; either a Bland-Altman plot of the differ-ences versus averages, or a 45 degree rotation as a conversion between the methods. If model=NULLa simple regression of averages on differences is made by calling DA.reg, and the specified conver-sion plotted.
Value
An object of class MethComp and either DA.reg (if model=NULL) or BA.est (if model is character).
Author(s)
Bendix Carstensen <[email protected]>, http://BendixCarstensen.com.
References
JM Bland and DG Altman: Statistical methods for assessing agreement between two methods ofclinical measurement, Lancet, i, 1986, pp. 307-310.
JM Bland and DG Altman. Measuring agreement in method comparison studies. Statistical Meth-ods in Medical Research, 8:136-160, 1999.
B Carstensen: Comparing methods of measurement: Extending the LoA by regression. Stat Med.2010 Feb 10;29(3):401-10.
BA.plot 13
See Also
BA.est, DA.reg, MCmcmc.
Examples
data( ox )ox <- Meth( ox )# The simplest possible Bland-Altman plotBA.plot( ox )
## With bells and whistles, comparing the naive and modelpar( mfrow=c(2,2) )BA.plot( ox, model=NULL, repl.conn=TRUE, col.lines="blue",
axlim=c(0,100), diflim=c(-50,50), xaxs="i", yaxs="i",las=1, eqn=TRUE, dif.type="lin", pl.type="BA", sd.type="lin",grid=1:9*10, digits=3,font.eqn=1)
par(new=TRUE)BA.plot( ox, model="linked", repl.conn=TRUE, col.lines="red",
axlim=c(0,100), diflim=c(-50,50), xaxs="i", yaxs="i",las=1, eqn=FALSE, dif.type="lin", pl.type="BA", sd.type="lin",grid=1:0*10, digits=3)
BA.plot( ox, model=NULL, repl.conn=TRUE, col.lines="blue",axlim=c(0,100), diflim=c(-50,50), xaxs="i", yaxs="i",las=1, eqn=TRUE, dif.type="lin", pl.type="conv", sd.type="lin",grid=1:9*10, digits=3,font.eqn=1)
par(new=TRUE)BA.plot( ox, model="linked", repl.conn=TRUE, col.lines="red",
axlim=c(0,100), diflim=c(-50,50), xaxs="i", yaxs="i",las=1, eqn=FALSE, dif.type="lin", pl.type="conv", sd.type="lin",grid=1:9*10, digits=3)
# The same again, but now logit-transformedBA.plot( ox, model=NULL, repl.conn=TRUE, col.lines="blue",
axlim=c(0,100), diflim=c(-50,50), xaxs="i", yaxs="i",las=1, eqn=TRUE, dif.type="lin", pl.type="BA", sd.type="lin",grid=1:9*10, digits=3,font.eqn=1,Transform="pctlogit")
par(new=TRUE)BA.plot( ox, model="linked", repl.conn=TRUE, col.lines="red",
axlim=c(0,100), diflim=c(-50,50), xaxs="i", yaxs="i",las=1, eqn=FALSE, dif.type="lin", pl.type="BA", sd.type="lin",grid=1:0*10, digits=3,Transform="pctlogit")
BA.plot( ox, model=NULL, repl.conn=TRUE, col.lines="blue",axlim=c(0,100), diflim=c(-50,50), xaxs="i", yaxs="i",las=1, eqn=TRUE, dif.type="lin", pl.type="conv", sd.type="lin",grid=1:9*10, digits=3,font.eqn=1,Transform="pctlogit")
par(new=TRUE)BA.plot( ox, model="linked", repl.conn=TRUE, col.lines="red",
axlim=c(0,100), diflim=c(-50,50), xaxs="i", yaxs="i",las=1, eqn=FALSE, dif.type="lin", pl.type="conv", sd.type="lin",grid=1:9*10, digits=3,Transform="pctlogit")
14 BlandAltman
BlandAltman Bland-Altman plot of differences versus averages. Deprecated, for-merly known as BA.plot, likely to disappear from the package.
Description
For two vectors of equal length representing measurements of the same quantity by two differentmethods, the differences are plotted versus the average. The limits of agreement (prediction limitsfor the differences) are plotted, optionally a regression of differences of means is given too.
Usage
BlandAltman(x, y,x.name = NULL,y.name = NULL,maintit = "",
cex = 1,pch = 16,
col.points = "black",col.lines = "blue",
limx = NULL,limy = NULL,ymax = NULL,eqax = FALSE,xlab = NULL,ylab = NULL,print = TRUE,
reg.line = FALSE,digits = 2,mult = FALSE,alpha,... )
AB.plot( y1, y2,meth.names = NULL,mean.repl = FALSE,conn.repl = !mean.repl,lwd.conn = 1,col.conn = "black",
comp.levels = 2:1,... )
Arguments
x Numerical vector of measurements by 1st method.
y Numerical vector of measurements by 2nd method. Must of same length as x.
x.name Label for the 1st method (x).
BlandAltman 15
y.name Label for the 2nd method (y).
maintit Main title for the plot
cex Character expansion for the points.
pch Plot symbol for points.
col.points Color for the points.
col.lines Color for the lines indicating limits of agreement.
limx x-axis limits.
limy y-axis limits.
ymax Scalar. The y-axis will extend from -ymax to +ymax.
eqax Logical. Should the range on x- and y- axes be the same?
xlab x-axis label.
ylab y-axis label.
print Logical: Should the limits of agreement and the c.i.s of these be printed?
reg.line If TRUE, the regression line of x-y on (x+y)/2 is drawn. If numerical the re-gression equation is printed with the given number of digits after the decimalpoints.
digits How many decimal places should be used when printing limits of agreement?Used both for the printing of results and for annotation of the plot.
mult Logical. Should data be log-transformed and reporting be on a multiplicativescale?
alpha 1 minus confidence level used when computing confidence intervals and limitsof agreement, i.e. the t(1-alpha/2) quantile is used. If not supplied the standardvalue of 2 is used for computing LoA.
y1 Measurements by method 1. Alternatively a Meth object or a dataframe withcolumns meth, item, y, and possibly repl.
y2 Corresponding measurements by method 2. Ignored if y1 is a dataframe.
meth.names Names for the two methods. Used for annotation of the plot. If not supplied andy1 is a dataframe names are derived from the factor level names of meth.
mean.repl Logical. If there are replicate measurements by each method should the meansby item and meth be formed before further ado. WARNING: This will give toonarrow limits of agreement.
conn.repl Logical. Should replicates from the same item be connected?
lwd.conn Line width of connecting lines
col.conn Color of connecting lines
comp.levels Levels of the meth factor to compare. May be used to switch the order of themethods compared by specifying comp.meth=2:1.
... Further arguments passed on from BA.plot to BlandAltman and possibly fur-ther to the plot function. The arguments passed to BlandAltman are used forfine-tuning the appearance of the plot.
16 BlandAltman
Value
An object of class BA.check; list with 3 elements:
LoA A vector of length 3 with Limits of Agreement.
p.value P-values for three hypothese: 1) Constant variance - this is the test of 0 slopein the regression of absolute residuals on averages. 2) Constant difference - thisis the test of 0 slop in the regression of differences on averages. 3) Differenceequal to 0 - this is usually a lame thing to use.
reg.res A 3× 4 matrix with (in the first row) the results from regressing the averages onthe means, and in the two other rows the derived relationships between meth-ods. In each line the intercept (alpha), slope (beta), the prediction standarddeviation (pr.sd) and half the width of the prdiction interval (pr.int).
Author(s)
Bendix Carstensen <[email protected]>, http://BendixCarstensen.com.
References
JM Bland and DG Altman: Statistical methods for assessing agreement between two methods ofclinical measurement, Lancet, i, 1986, pp. 307-310.
JM Bland and DG Altman. Measuring agreement in method comparison studies. Statistical Meth-ods in Medical Research, 8:136-160, 1999.
B Carstensen: Comparing methods of measurement: Extending the LoA by regression. Stat Med.2010 Feb 10;29(3):401-10.
See Also
BA.plot, MCmcmc.
Examples
data( ox )par( mfrow=c(1,2) )# Wrong to use mean over replicatesmtab <- with( ox, tapply( y, list(item, meth), mean ) )CO <- mtab[,"CO"]pulse <- mtab[,"pulse"]BlandAltman( CO, pulse )
# (almost) Right to use replicates singlypar( mfrow=c(1,1) )oxw <- to.wide( ox )CO <- oxw[,"CO"]pulse <- oxw[,"pulse"]BlandAltman( CO, pulse, mult=TRUE )BlandAltman( CO, pulse, eqax=TRUE )
data( plvol )
bothlines 17
BA.plot( plvol )BA.plot( plvol, reg.line=TRUE )BA.plot( plvol, reg.line=2 )
bothlines Add regression lines to a plot
Description
Add the regression lines of y on x AND x on y to the plot. Optionally add the line obtained byallowing errors in both variables (Deming regression).
Usage
bothlines(x, y, Dem = FALSE, sdr = 1, col = "black", ...)
Arguments
x Numeric vectory Numeric vectorDem Logical. Should the Deming regression line be added too?sdr Numeric. The assumed ratio of standard deviations used in the Deming regres-
sion.col Colour of the lines. Can be a vector of up to 3 elements, one for each line.... Additional arguments passed on to abline, which does the actual plotting.
Value
None.
Author(s)
Bendix Carstensen, Steno Diabetes Center, http://BendixCarstensen.com
See Also
abline.
Examples
data( ox )oxw <- to.wide(ox)attach( oxw )plot( CO, pulse )abline(0,1)bothlines( CO, pulse, Dem=TRUE, col=rainbow(3), lwd=2 )plot( CO, pulse,pch=16 )abline(0,1, col=gray(0.7), lwd=2)bothlines( CO, pulse, Dem=TRUE, col=c(rep("transparent",2),"black"), lwd=2 )
18 cardiac
cardiac Measurement of cardiac output by two different methods.
Description
For each subject cardiac output is measured repeatedly (three to six times) by impedance cardiog-raphy (IC) and radionuclide ventriculography (RV).
Usage
data(cardiac)
Format
A data frame with 120 observations on the following 4 variables.
meth a factor with levels IC RV
item a numeric vector giving the item number.
repl a numeric vector with replicate number.
y the measuremnts of cardiac output.
Details
It is not entirely clear from the source whether the replicates are exchangeable within (method,item)or whether they represent pairs of measurements. From the description it looks as if replicates arelinked between methods, but in the paper they are treated as if they were not.
Source
The dataset is adapted from table 4 in: JM Bland and DG Altman: Measuring agreement in methodcomparison studies. Statistical Methods in Medical Research, 8:136-160, 1999. Originally suppliedto Bland \& Altman by Dr LS Bowling, see: Bowling LS, Sageman WS, O’Connor SM, ColeR, Amundson DE. Lack of agreement between measurement of ejection fraction by impedancecardiography versus radionuclide ventriculography. Critical Care Medicine 1993; 21: 1523-27.
Examples
data(cardiac)cardiac <- Meth(cardiac)summary(cardiac)# Visually check exchangeabilityplot( cardiac )plot( perm.repl( cardiac ) )BA.est(cardiac)# Run MCmcmc using BRugs for an insufficient amount of iterations## Not run: card.mi.ir <- MCmcmc( cardiac,
beta=FALSE, random=c("mi","ir"),n.iter=100, trace=T )
CardOutput 19
print( card.mi.ir )## End(Not run)
CardOutput Measurements of Cardiac output.
Description
Two different ways of measuring cardiac output and oxygen saturation in 15 critically ill persons.
Usage
data(CardOutput)
Format
A data frame with 15 observations on the following 8 variables.
Age Patient age
Diag Diagnosis, a factor with levels sepsis, cardiogenic, hypothermia
VO2 Oxygen consumption
Svo2 Mixed venous O2 saturation
Scvo2 Central venous oxygen saturation
TCO Thermodilution-derived cardiac output
FCO Fick-derived cardiac output.
Sex Sex, a factor with levels F, M
Source
Avi A. Weinbroum, Philippe Biderman, Dror Soffer, Joseph M. Klausner & Oded Szold:
Reliability of cardiac output calculation by the fick principle and central venous oxygen saturationin emergency conditions.
Journal of Clinical Monitoring and Computing (2008) 22: 361-366
Examples
data(CardOutput)

20 check.MCmcmc
check.MCmcmc Functions to graphically assess the convergence of the MCMC-simulation in a MCmcmc object
Description
These functions display traces, posterior densities and autocorrelation functions for the relevantsubset of the parameters in a MCmcmc object.
Usage
## S3 method for class 'MCmcmc'trace( obj, what = "sd",
scales = c("same", "free"),layout = "col",aspect = "fill", ...)
## S3 method for class 'MCmcmc'post( obj, what ="sd",
check = TRUE,scales = "same",layout = "row",
lwd = 2,col,
plot.points = FALSE,aspect = "fill", ... )
## S3 method for class 'MCmcmc'pairs( x, what = "sd",
subset,col = NULL,pch = 16,cex = 0.2,
scales = "free", ... )
Arguments
obj A MCmcmc object.
x A MCmcmc object.
what Character indicating what parameters to plot. Possible values are "sd" or "var"which gives plots for the variance components (on the sd. scale), "beta" or"slope", which gives plots for slope parameters and "alpha" or "int", whichgives plots for the intercept parameters.
check.MCmcmc 21
scales Character vector of length two, with possible values "same" or "free", indicatingwhether x- and y-axes of the plots should be constrained to be the same acrosspanels. For pairs only the first element is used to decide whether all panlesshould have the same axes.
layout Character. If "col" parameters are displayed columnwise by method, if "row"they are displayed row-wise.
aspect How should the panels be scaled. Default ("fill") is to make a panels take upas much place as possible.
check Logical. Should the density plots be separate for each chain (in order to checkconvergence) or should the chains be merged.
lwd Width of the lines used for plotting of the posterior densities.
col Color of the lines points used for plotting of the posterior densities.
plot.points Logical. Should a rug with actual data points be plotted beneath the density.
pch Plot symbol for the points.
subset Character or numerical indicating the columns of the posterior that should beplotted by pairs.
cex Plot character size for points in pairs.
... Further aruments passed on to the Lattice function called: trace calls xyplotfrom the coda package, post calls densityplot from the coda package,pairs calls pairs from the graphics package.
Details
A Lattice plot is returned, which means that it must printed when these functions are called in abatch program or inside another function or for-loop.
trace plots traces of the sampled chains, post plots posterior densities of the parameters and pairsplots a scatter-plot matrix of bivariate marginal posterior distributions.
Value
A Lattice plot.
Author(s)
Bendix Carstensen, Steno Diabetes Center, <[email protected]>, http://BendixCarstensen.com.
See Also
MCmcmc, plot.MCmcmc, ox.MC, sbp.MC
Examples
# Load a provided MCmcmc objectdata( ox.MC )trace.MCmcmc( ox.MC, what="beta" )pairs.MCmcmc( ox.MC, what="sd" )
22 choose.trans
choose.trans Functions to handle transformations of measuremnt results.
Description
Choose a function and inverse based on a text string; check whether two functions actually are eachothers inverse.
Usage
choose.trans( tr )check.trans( trans, y, trans.tol = 1e-05 )
Arguments
tr A character string, or a list of two functions, they should be each other’s inverse.Names of the list are ignored.
trans A list of two functions, each other’s inverse.
y Vector of numerical values where the functions should be each other’s inverse.
trans.tol Numerical constant indication how precise the evaulation should be.
Value
choose.trans returns a named list with two elements "trans" and "inv", both functions which areeach other’s inverse. This is intended to be stored as an attribute "Transform" with the resultingobject and used in plotting and reporting. All results will be on the transformed scale. If the trargument to choose.trans is a character constant, the appropriate named list of two functionswill be generated. Possibilities are: "exp", "log", "logit", "pctlogit" (transforms percentages by thelogit), "sqrt", "sq" (square), "cll" (complementary log-minus-log), "ll" (log-minus-log). If there isno match NULL is returned, which will correspond to no transformation.
check.trans returns nothing.
Author(s)
Bendix Carstensen, Steno Diabetes Center, http://www.biostat.ku.dk/~bxc.
Examples
choose.trans( "logit" )
corr.measures 23
corr.measures Correlation measures for method comparison studies. Please don’tuse them!
Description
Computes correlation, mean squared difference, concordance correlation coefficient and the asso-ciation coefficient. middle and ends are useful utilities for illustrating the shortcomings of theassociation measures, see the example.
Usage
corr.measures(x, y)middle(w, rm = 1/3)ends(w, rm = 1/3)
Arguments
x vector of measurements by one method.
y vector of measurements by another method.
w numerical vector.
rm fraction of data to remove.
Details
These measures are all flawed since they are based on the correlation in various guises. They fail toaddress the relevant problem of AGREEMENT. It is recommended NOT to use them. The examplegives an example, illustrating what happens when increasingly large chunks of data in the middleare removed.
Value
corr.measures return a vector with 4 elements. middle and ends return a logical vector pointingto the middle or the ends of the w after removing a fraction of rm from data.
Author(s)
Bendix Carstensen, Steno Diabetes Center, http://BendixCarstensen.com
References
Shortly...
See Also
MCmcmc.
24 DA.reg
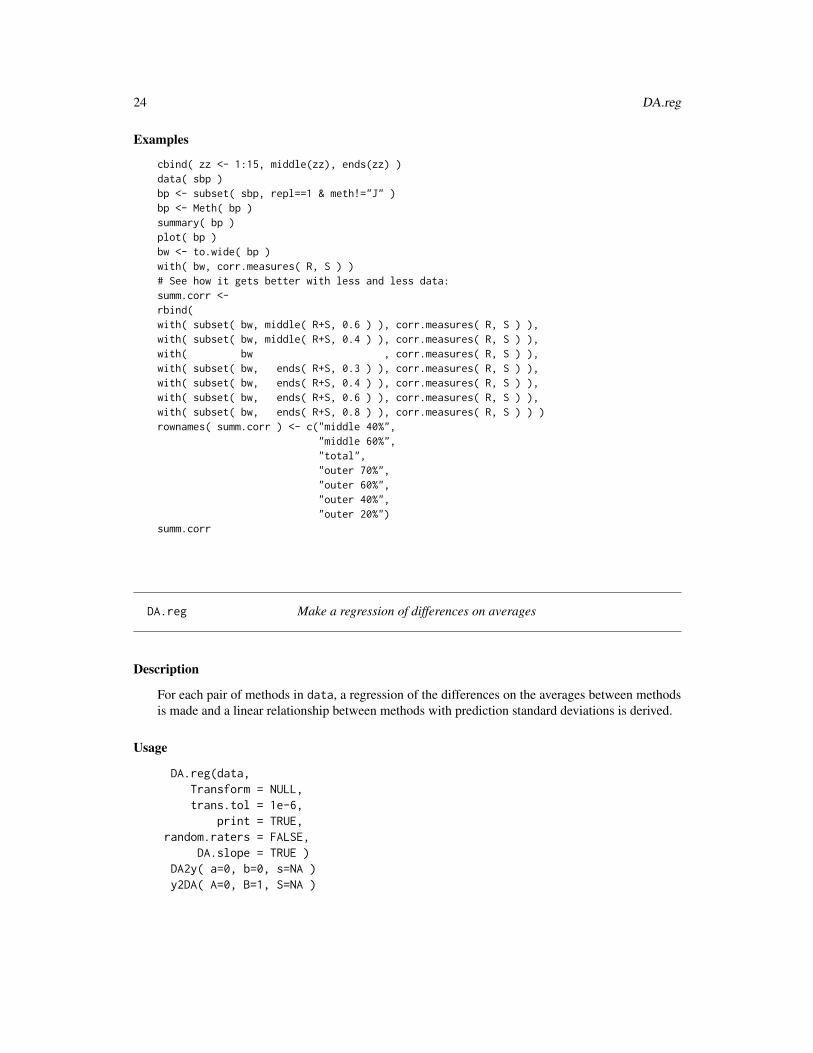
Examples
cbind( zz <- 1:15, middle(zz), ends(zz) )data( sbp )bp <- subset( sbp, repl==1 & meth!="J" )bp <- Meth( bp )summary( bp )plot( bp )bw <- to.wide( bp )with( bw, corr.measures( R, S ) )# See how it gets better with less and less data:summ.corr <-rbind(with( subset( bw, middle( R+S, 0.6 ) ), corr.measures( R, S ) ),with( subset( bw, middle( R+S, 0.4 ) ), corr.measures( R, S ) ),with( bw , corr.measures( R, S ) ),with( subset( bw, ends( R+S, 0.3 ) ), corr.measures( R, S ) ),with( subset( bw, ends( R+S, 0.4 ) ), corr.measures( R, S ) ),with( subset( bw, ends( R+S, 0.6 ) ), corr.measures( R, S ) ),with( subset( bw, ends( R+S, 0.8 ) ), corr.measures( R, S ) ) )rownames( summ.corr ) <- c("middle 40%",
"middle 60%","total","outer 70%","outer 60%","outer 40%","outer 20%")
summ.corr
DA.reg Make a regression of differences on averages
Description
For each pair of methods in data, a regression of the differences on the averages between methodsis made and a linear relationship between methods with prediction standard deviations is derived.
Usage
DA.reg(data,Transform = NULL,trans.tol = 1e-6,
print = TRUE,random.raters = FALSE,
DA.slope = TRUE )DA2y( a=0, b=0, s=NA )y2DA( A=0, B=1, S=NA )
DA.reg 25
Arguments
data A Meth object. May also be a data frame with columns meth, item and y.
Transform A character string, or a list of two functions, each other’s inverse. The measure-ments are transformed by this before analysis. Possibilities are: "exp", "log","logit", "pctlogit" (transforms percentages by the logit), "sqrt", "sq" (square),"cll" (complementary log-minus-log), "ll" (log-minus-log). For further detailssee choose.trans.
trans.tol The tolerance used to check whether the supplied transformation and its inversecombine to the identity. Only used if Transform is a list of two functions.
print Should the results be printed?
random.raters If methods really are a random selection of raters, neither intercept nor slopedifferent from 0 are sensible, so if this is TRUE, intercept and slope in the regres-sion of difference on averages are fixed to 0. Meaning that we are essentiallylooking at the raw differences as residuals.
DA.slope If this is TRUE, a slope of the differences in the verages is estimated, otherwisethe relationship is assumed constant.
a Intercept in the linear relation of the differences y1-y2 to the averages (y1+y2)/2.If a vector of length>1, this is used instead of a, b and s, and b and s are ignored.
b Slope in the linear relstion of the differences to the averages.
s SD from the regression of the differences in the averages. Can be NA.
A Intercept in the linear relation of y1 on y2.
B Slope in the linear relation of y1 on y2.
S SD for the linear relation of y1 on y2. Can be NA.
Details
If the input object contains replicate measurements these are taken as separate items in the orderthey appear in the dataset.
The functions DA2y and y2DA are convenience functions that convert the estimates of intercept, slopeand sd from the regression of D = y1 − y2 on A = (y1 + y2)/2, back and forth to the resultingintercept, slope and sd in the relationship between y1 and y2, cf. Carstensen (2010), equation 6.
DA2y takes intercept(a), slope(b) and sd(s) from the relationship (y1-y2)=a+b((y1+y2)/2)+e withsd(e)=s, and returns a two by 3 matrix with columns "int","slope","sd" and rows "y1|2","y2|1".
y2DA takes intercept(A), slope(B) and sd(S) from the relationship y1=A+B y2 + E with sd(E)=E, andreturns a vector of length 3 with names "int(t-f)","slope(t-f)","sd(t-f)", where t refers to"to" (y1 and f to "from" y2.
Value
DA.reg returns a MethComp object, i.e. a list with three components, Conv, VarComp, and data.Conv is a three-dimensional array, with dimensions To, From (both with levels equal to the methodsin data) and an unnamed dimension with levels "alpha", "beta", "sd.pred", "beta=1", referringto the linear relationship of To to From, "int(t-f)", "slope(t-f)", "sd(t-f)", referring to the
26 DA.reg
regression of the differences on the averages, and "int(sd)", "slope(sd)", and "s.d.=K", refer-ring to the regression of the absoulte residuals on the averages, and LoA-lo, LoA-hi, the limits ofagreement.
Converting from method l to method k using
yk|l = α+ βyl
with prediction standard deviation σ, just requires the entries [k,l,c("alpha","beta","sd.pred")],if we assume the s.d. is constant.
The next entry is the p-values for the hypothesis β = 1, intercept and slope of the SD of thedifferences as a linear function of the average and finally p-value of the hypothesis that standarderrors are constant over the range. The latter three are derived by regressing the absolute valuesof the residuals on the averages, and can be used to produce LoA where the s.d. increases (ordecreases) by the mean, using the function DA2y.
The VarComp element of the list is NULL, and only present for compatibility with the print methodfor MethComp objects.
The data element is the input dataframe. The measurements in y are left un-transformed, even ifdata are transformed (i.e. if the Transform attribute of the object is non-null).
DA2y returns a 2 by 3 matrix with rownames c("y1|2","y2|1") and columnnames c("int","slope","sd"),calculated under the assumption that the differences were formed as D <- y1 - y2.
y2DA returns a 3-component vector with names c("DA-int","DA-slope","DA-sd"), referring todifferences D=y1-y2 as a linear function of A=(y1+y2)/2.
Author(s)
Bendix Carstensen, Steno Diabetes Center, bxc$steno.dk, http://BendixCarstensen.com/MethComp
References
B. Carstensen: Comparing methods of measurement: Extending the LoA by regression. Stat Med,29:401-410, 2010.
Examples
data( milk )DA.reg( milk )data( sbp )print( DA.reg(sbp), digits=3 )# Slope, intercept : y1 = 0.7 + 1.2*y2 (0.4)A <- c(0.7,1.2,0.4)( y2DA( A ) )( DA2y( y2DA( A ) ) )
Deming 27
Deming Regression with errors in both variables (Deming regression)
Description
The function makes a regression of y on x, assuming that both x and y are measured with error. Thisproblem only has an analytical solution if the ratio of the variances is known, hence this is requiredas an input parameter.
Usage
Deming(x, y, vr = sdr^2, sdr = sqrt(vr),boot = FALSE, keep.boot = FALSE, alpha = 0.05)
Arguments
x numerical variable.
y numerical variable.
vr The assumed known ratio of the (residual) variance of the ys relative to that ofthe xs. Defaults to 1.
sdr do. for standard deviations. Defaults to 1. vr takes precedence if both are given.
boot Should bootstrap estimates of standard errors of parameters be done? If boot==TRUE,1000 bootstrap samples are done, if boot is numeric, boot samples are made.
keep.boot Should the 4-column matrix of bootstrap samples be returned? If TRUE, thesummary is printed, but the matrix is returned invisibly. Ignored if boot=FALSE
alpha What significance level should be used when displaying confidence intervals?
Details
The formal model underlying the procedure is based on a so called functional relationship:
xi = ξi + e1i, yi = α+ βξi + e2i
with var(e1i) = σ, var(e2i) = λσ, where λ is the known variance ratio.
The estimates of the residual variance is based on a weighting of the sum of squared deviations inboth directions, divided by n − 2. The ML estimate would use 2n instead, but in the model weactually estimate n+ 2 parameters — α, β and the n ξs.
This is not in Peter Sprent’s book (see references).
28 Deming
Value
If boot==FALSE a named vector with components Intercept, Slope, sigma.x, sigma.y, where xand y are substituted by the variable names.
If boot==TRUE a matrix with rows Intercept, Slope, sigma.x, sigma.y, and colums giving theestimates, the bootstrap standard error and the bootstrap estimate and c.i. as the 0.5, α/2 and 1−α/2quantiles of the sample.
If keep.boot==TRUE this summary is printed, but a matrix with columns Intercept, Slope, sigma.x,sigma.y and boot rows is returned.
Author(s)
Bendix Carstensen, Steno Diabetes Center, <[email protected]>, http://BendixCarstensen.com.
References
Peter Sprent: Models in Regression, Methuen & Co., London 1969, ch.3.4.
WE Deming: Statistical adjustment of data, New York: Wiley, 1943. [This is a reference takenfrom a reference list — I never saw the book myself].
See Also
MCmcmc
Examples
# 'True' valuesM <- runif(100,0,5)# Measurements:x <- M + rnorm(100)y <- 2 + 3 * M + rnorm(100,sd=2)# Deming regression with equal variances, variance ratio 2.Deming(x,y)Deming(x,y,vr=2)Deming(x,y,boot=TRUE)bb <- Deming(x,y,boot=TRUE,keep.boot=TRUE)str(bb)# Plot data with the two classical regression linesplot(x,y)abline(lm(y~x))ir <- coef(lm(x~y))abline(-ir[1]/ir[2],1/ir[2])abline(Deming(x,y,sdr=2)[1:2],col="red")abline(Deming(x,y,sdr=10)[1:2],col="blue")# Comparing classical regression and "Deming extreme"summary(lm(y~x))Deming(x,y,vr=1000000)
Enzyme 29
Enzyme Enzyme activity data
Description
Three measurement of enzyme activity on 24 patients. The measurements is of the enzymes sucraseand alkaline phosphatase. The interest is to compare the ’homogenate’ and ’pellet’ methods.
Usage
data(Enzyme)
Format
A data frame with 72 observations on the following 3 variables.
meth a factor with levels SucHom SucPel Alkphos, representing three different measurements, i.e.homogenate and pellet values of sucrase, as well as homogenate values of alkaline.
item a numeric vector, the person ID for the 24 patients
y a numeric vector, the measurements on the enzyme activity.
Source
R. L. Carter; Restricted Maximum Likelihood Estimation of Bias and Reliability in the Comparisonof Several Measuring Methods; Biometrics, Dec., 1981, Vol. 37, No. 4, pp. 733-741.
Examples
data(Enzyme)Enzyme <- Meth( Enzyme )summary( Enzyme )# plot( Enzyme )
fat Measurements of subcutaneous and visceral fat
Description
43 persons had Subcutaneous and Visceral fat thickness measured at Steno Diabetes Center in 2006by two observers; all measurements were done three times. The interest is to compare the mea-surements by the two observers. Persons are items, observers are methods, the three replicates areexchangeable within (person,observer)=(item,method)
Usage
data(fat)
30 glucose
Format
A data frame with 258 observations on the following 6 variables.
Id Person id.
Obs Observers, a factor with levels KL and SL.
Rep Replicate — exchangeable within person and observer.
Sub Subcutaneous fat measured in cm.
Vic Visceral fat measured in cm.
Examples
data(fat)str(fat)vic <- Meth( fat, meth=2, item=1, repl="Rep", y="Vic" )str(vic)BA.est( vic, linked=FALSE )
glucose Glucose measurements by different methods
Description
74 persons in 5 centres in Finland had blood glucose measured by 11 different methods, based on4 different types of blood. Each person had blood sampled at 0, 30, 60 and 120 min after a 75 gglucose load.
Usage
data(glucose)
Format
A data frame with 1302 observations on the following 6 variables.
meth Method of measurement. A factor with 11 levels: n.plas1 n.plas2 h.cap h.blood h.plash.serum m.plas m.serum o.cap s.serum k.plas.
type Type of blood sample. A factor with 4 levels: blood plasma serum capil
item Person id.
time Time of blood sampling. Minutes since glucose load.
cent Center of sampling. Except for the two first methods, n.plas1 and n.plas2, samples wereanalyzed at the centres too
y Glucose measurement in mmol/l.
Source
The study was conducted at the National Public Health Institute in Helsinki by Jaana Lindstrom.
hba.MC 31
References
B Carstensen, J Lindstrom, J Sundvall, K Borch-Johnsen1, J Tuomilehto & the DPS Study Group:Measurement of Blood Glucose: Comparison between different Types of Specimens. Annals ofClinical Biochemistry, to appear.
Examples
data( glucose )str( glucose )# Use only plasma and serum as methods and make a Bland-Altman plotgluc <- subset( glucose, type %in% c("plasma","serum") )gluc$meth <- gluc$typegluc$repl <- gluc$timeBA.plot( gluc )
hba.MC A MCmcmc object from the hba1c data
Description
This object is included for illustrative purposes. It is a result of a 5-hour run using MCmcmc, withn.iter=100000.
Usage
data(hba.MC)
Format
The format is a MCmcmc object.
Details
The data are the venous measurements from the hba1c dataset, using the day of analysis as replicate.Measurements are taken to be linked within replicate (=day of analysis).
Examples
data(hba.MC)attr(hba.MC,"mcmc.par")# print.MCmcmc(hba.MC)# One of the chains is really fishy (it's the first one)# trace.MCmcmc(hba.MC)# trace.MCmcmc(hba.MC,"beta")# Try to have a look, excluding the first chain# hba.MCsub <- subset.MCmcmc(hba.MC,chains=-1)# trace.MCmcmc(hba.MCsub)# trace.MCmcmc(hba.MCsub,"beta")
32 hba1c
# A MCmcmc object also has class mcmc.list, so we can use the# coda functions for covergence diagnostics:# acfplot( subset.MCmcmc(hba.MC, subset="sigma"))
hba1c Measurements of HbA1c from Steno Diabetes Center
Description
Three analysers (machines) for determination of HbA1c (glycosylated haemoglobin) were testedon samples from 38 individuals. Each had drawn a venous and capillary blood sample. These wereanalysed on five different days.
Usage
data(hba1c)
Format
A data frame with 835 observations on the following 6 variables.
dev Type of machine used. A factor with levels BR.V2, BR.VC and Tosoh.
type Type of blood analysed (capillary or venous). A factor with levels Cap Ven
item Person-id. A numeric vector
d.samp Day of sampling.
d.ana Day of laboratory analysis.
y The measured value of HbA1c.
Details
In the terminology of method comparison studies, methods is the cross-classification of dev andtype, and replicate is d.ana. It may be of interest to look at the effect of time between d.ana andd.samp, i.e. the time between sampling and analysis.
Source
Bendix Carstensen, Steno Diabetes Center.
References
These data were analysed as example in: Carstensen: Comparing and predicting between severalmethods of measurement, Biostatistics 5, pp. 399–413, 2004.
MCmcmc 33
Examples
data(hba1c)str(hba1c)hb1 <- with( hba1c,
Meth( meth = interaction(dev,type),item = item,repl = d.ana-d.samp,
y = y, print=TRUE ) )
MCmcmc Fit a model for method comparison studies using WinBUGS
Description
A model linking each of a number of methods of measurement linearly to the "true" value is set upin BUGS and run via the function bugs from the R2WinBUGS package.
Usage
MCmcmc( data,bias = "linear",IxR = has.repl(data), linked = IxR,MxI = TRUE, matrix = MxI,
varMxI = nlevels(factor(data$meth)) > 2,n.chains = 4,n.iter = 2000,
n.burnin = n.iter/2,n.thin = ceiling((n.iter-n.burnin)/1000),
bugs.directory = getOption("bugs.directory"),debug = FALSE,
bugs.code.file = "model.txt",clearWD = TRUE,
code.only = FALSE,ini.mult = 2,list.ini = TRUE,
org = FALSE,program = "JAGS",
Transform = NULL,trans.tol = 1e-6,
... )## S3 method for class 'MCmcmc'summary( object, alpha=0.05, ...)## S3 method for class 'MCmcmc'print( x, digits=3, alpha=0.05, ... )## S3 method for class 'MCmcmc'subset( x, subset=NULL, allow.repl=FALSE, chains=NULL, ... )## S3 method for class 'MCmcmc'
34 MCmcmc
mcmc( x, ... )
Arguments
data Data frame with variables meth, item, repl and y, possibly a Meth object. yrepresents a measurement on an item (typically patient or sample) by methodmeth, in replicate repl.
bias Character. Indicating how the bias between methods should be modelled. Possi-ble values are "none", "constant", "linear" and "proportional". Only thefirst three letters are significant. Case insensitive.
IxR Logical. Are the replicates linked across methods, i.e. should a random item byrepl be included in the model.
linked Logical, alias for IxR.
MxI Logical, should a meth by item effect be included in the model?
matrix Logical, alias for MxI.
varMxI Logical, should the method by item effect have method-specific variances. Ig-nored if only two methods are compared.
n.chains How many chains should be run by WinBUGS — passed on to bugs.
n.iter How many total iterations — passed on to bugs.
n.burnin How many of these should be burn-in — passed on to bugs.
n.thin How many should be sampled — passed on to bugs.
bugs.directory Where is WinBUGS (>=1.4) installed — passed on to bugs. The default is to usea parameter from options(). If you use this routinely, this is most convenientlyset in your .Rprofile file.
debug Should WinBUGS remain open after running — passed on to bugs.
clearWD Should the working directory be cleared for junk files after the running of Win-BUGS — passed on to bugs.
bugs.code.file Where should the bugs code go?
code.only Should MCmcmc just create a bugs code file and a set of inits? See the list.iniargument.
ini.mult Numeric. What factor should be used to randomly perturb the initial values forthe variance components, see below in details.
list.ini List of lists of starting values for the chains, or logical indicating whether start-ing values should be generated. If TRUE (the default), the function VC.est willbe used to generate initial values for the chains. list.ini is a list of lengthn.chains. Each element of which is a list with the following vectors as ele-ments:
mu - length Ialpha - length Mbeta - length Msigma.mi - length M - if M is 2 then length 1
MCmcmc 35
sigma.ir - length 1sigma.mi - length Msigma.res - length M
If code.only==TRUE, list.ini indicates whether a list of initial values is re-turned (invisibly) or not. If code.only==FALSE, list.ini==FALSE is ignored.
org Logical. Should the posterior of the original model parameters be returned too?If TRUE, the MCmcmc object will have an attribute, original, with the posteriorof the parameters in the model actually simulated.
program Which program should be used for the MCMC simulation. Possible values are"BRugs", "openbugs", "ob" (openBUGS/BRugs), "winbugs", "wb" (WinBUGS),"jags" (JAGS). Case insensitive. Defaults to "JAGS" since: 1) JAGS is availableon all platforms and 2) JAGS seems to be faster than BRugs on (some) windowsmachines.
Transform Transformation of data (y) before analysis. See choose.trans.
trans.tol The tolerance used to check whether the supplied transformation and its inversecombine to the identity.
... Additional arguments passed on to bugs.
object An MCmcmc object
alpha 1 minus the the confidence level
x An MCmcmc object
digits Number of digits after the decimal point when printing.
subset Numerical, character or list giving the variables to keep. If numerical, the vari-ables in the MCmcmc object with these numbers are selected. If character, eachelement of the character vector is "grep"ed against the variable names, and thematches are selected to the subset. If a list each element is used in turn, numeri-cal and character elements can be mixed.
allow.repl Should duplicate columns be allowed in the result?
chains Numerical vector giving the number of the chains to keep.
Details
The model set up for an observation ymir is:
ymir = αm + βm(µi + bir + cmi) + emir
where bir is a random item by repl interaction (included if "ir" %in% random) and cmi is arandom meth by item interaction (included if "mi" %in% random). The µi’s are parameters in themodel but are not monitored — only the αs, βs and the variances of bir, cmi and emir are monitoredand returned. The estimated parameters are only determined up to a linear transformation of the µs,but the linear functions linking methods are invariant. The identifiable conversion parameters are:
αm·k = αm − αkβm/βk, βm·k = βm/βk
The posteriors of these are derived and included in the posterior, which also will contain theposterior of the variance components (the SDs, that is). Furthermore, the posterior of the point

36 MCmcmc
where the conversion lines intersects the identity as well as the prediction SDs between any pairs ofmethods are included.
The function summary.MCmcmc method gives estimates of the conversion parameters that are con-sistent. Clearly,
median(β1·2) = 1/median(β2·1)
because the inverse is a monotone transformation, but there is no guarantee that
median(α1·2) = median(−α2·1/β2·1)
and hence no guarantee that the parameters derived as posterior medians produce conversion linesthat are the same in both directions. Therefore, summary.MCmcmc computes the estimate for α2·1 as
(median(α1·2)−median(α2·1)/median(β2·1))/2
and the estimate of α1·2 correspondingly. The resulting parameter estimates defines the same lines.
Value
If code.only==FALSE, an object of class MCmcmc which is a mcmc.list object of the relevant pa-rameters, i.e. the posteriors of the conversion parameters and the variance components transformedto the scales of each of the methods.
Furthermore, the object have the following attributes:
random Character vector indicating which random effects ("ir","mi") were included inthe model.
methods Character vector with the method names.
data The data frame used in the analysis. This is used in plot.MCmcmc when plottingpoints.
mcmc.par A list giving the number of chains etc. used to generate the object.
original If org=TRUE, an mcmc.list object with the posterior of the original model pa-rameters, i.e. the variance components and the unidentifiable mean parameters.
Transform The transformation used to the measurements before the analysis.
If code.only==TRUE, a list containing the initial values is generated.
Author(s)
Bendix Carstensen, Steno Diabetes Center, http://BendixCarstensen.com, Lyle Gurrin, Univer-sity of Melbourne, http://www.epi.unimelb.edu.au/about/staff/gurrin-lyle.
References
B Carstensen: Comparing and predicting between several methods of measurement, Biostatistics,5, pp 399-413, 2004
See Also
BA.plot, plot.MCmcmc, print.MCmcmc, check.MCmcmc

Meth 37
Examples
data( ox )str( ox )ox <- Meth( ox )# Writes the BUGS program to your consoleMCmcmc( ox, MI=TRUE, IR=TRUE, code.only=TRUE, bugs.code.file="" )
### What is written here is not necessarily correct on your machine.# ox.MC <- MCmcmc( ox, MI=TRUE, IR=TRUE, n.iter=100, program="JAGS" )# ox.MC <- MCmcmc( ox, MI=TRUE, IR=TRUE, n.iter=100 )# data( ox.MC )# str( ox.MC )# print( ox.MC )
Meth Create a Meth object representing a method comparison study
Description
Creates a dataframe with columns meth, item, (repl) and y.
Usage
Meth( data=NULL,meth="meth", item="item", repl=NULL, y="y",print=!is.null(data), keep.vars=!is.null(data) )
## S3 method for class 'Meth'summary( object, ... )## S3 method for class 'Meth'plot(x, which = NULL,
col.LoA = "blue", col.pt = "black", cex.name = 2,var.range,diff.range,var.names = FALSE,
pch = 16,cex = 0.7,
Transform,... )
## S3 method for class 'Meth'mean(x, na.rm=TRUE, simplify=TRUE, ... )## S3 method for class 'Meth'sort(x, ... )## S3 method for class 'Meth'subset(x, ... )## S3 method for class 'Meth'sample( x,
how = "random",
38 Meth
N = if( how=="items" ) nlevels( x$item ) else nrow(x),... )
## S3 method for class 'Meth'transform(`_data`, ... )
Arguments
data A dataframe.
meth Vector of methods, numeric, character or factor. Can also be a number or char-acter referring to a column in data.
item Vector of items, numeric, character or factor. Can also be a number or characterreferring to a column in data.
repl Vector of replicate numbers, numeric, character or factor. Can also be a numberor character referring to a column in data.
y Vector of measurements. Can also be a character or numerical vector pointingto columns in data which contains the measurements by different methods ora dataframe with columns representing measurements by different methods. Inthis case the argument meth is ignored, and the names of the columns are takenas method names.
print Logical: Should a summary result be printed?
keep.vars Logical. Should the remaining variables from the dataframe data be transferredto the Meth object.
object A Meth object.
x A Meth object.
which A vector of indices or names of methods to plot. If NULL all methods in theobject are plotted.
col.LoA What color should be used for the limits of agreement.
col.pt What color should be used for the points.
cex.name Character expansion factor for plotting method names
var.range The range of both axes in the scatter plot and the x-axis in the Bland-Altmanplot be?
diff.range The range of yaxis in the Bland-Altman plot. Defaults to a range as the x-axis,but centered around 0.
var.names If logical: should the individual panels be labelled with the variable names?. Ifcharacter, then the values of the character will be used to label the methods.
pch Plot character for points.
cex Plot charcter expansion for points.
Transform Transformation used to the measurements prior to plotting. Function or charac-ter, see choose.trans for possible values.
na.rm Logical. Should NAs be removed before calculations?
simplify Should a Meth object with one row per (meth,item) be returned?
how Character. What sampling strategy should be used, one of "random", "linked"or "item". Only the first letter is significant. See details for explanation.
Meth 39
N How many observations should be sampled?
_data A Meth object.
... Ignored by the Meth and the summary and sample functions. In the plot func-tion, parameters passed on to both the panel function plotting methods againsteach other, as well as to those plotting differences against means.
Details
In order to perform analyses of method comparisons it is convenient to have a dataframe withclassifying factors, meth, item, and possibly repl and the response variable y. This function createssuch a dataframe, and gives it a class, Meth, for which there is a number of methods: summary -tabulation, plot - plotting and a couple of analysis methods.
If there are replicates in the values of item it is assumed that those observations represent replicatemeasurements and different replicate numbers are given to those.
sample.Meth samples a Meth object with replacement. If how=="random", a random sample of therows are sampled, the existing values of meth, item and y are kept but new replicate numbers aregenerated. If how=="linked", a random sample of the linked observations (i.e. observations withidentical item and repl values) are sampled with replacement and replicate numbers are kept. Ifhow=="item", items are sampled with replacement, and their observations are included the samplednumner of times.
Value
The Meth function returns a Meth object which is a dataframe with columns meth, item, (repl)and y. summary.Meth returns a table classified by method and no. of replicate measurements,extended with columns of the total number of items, total number of observations and the range ofthe measurements.
The mean.Meth returns a Meth object where means have been computed over replicates, and put ina variable mean.y. If simplify=TRUE, a smaller Meth object will be returned with only one rowper (meth,item), and the means in the variable y. This is useful if the definition of a particularmeasurement method is the mean of a specified number of replicate measuements. The functionsmean.Meth, median.Meth, max.Meth, and min.Meth behaves similarly, whereas sort.Meth justsorts the replicates within each (meth,item), and puts the results in a variable sort.y added Methobject.
The subset.Meth returns a subset of the Meth rows. If a subset of the methods is selected, the newmeth variable will have levels equal to the actually present levels of meth in the new Meth object.This is not the case if subsetting is done using "[".
Author(s)
Bendix Carstensen, <[email protected]>
Examples
data(fat)# Different ways of selecting columns and generating replicate numbersSub1 <- Meth(fat,meth=2,item=1,repl=3,y=4,print=TRUE)Sub2 <- Meth(fat,2,1,3,4,print=TRUE)

40 Meth.sim
Sub3 <- Meth(fat,meth="Obs",item="Id",repl="Rep",y="Sub",print=TRUE)summary( Sub3 )plot( Sub3 )
# Use observation in different columns as methodsdata( CardOutput )head( CardOutput )sv <- Meth( CardOutput, y=c("Svo2","Scvo2") )# Note that replicates are generated if a non-unique item-id is usedsv <- Meth( CardOutput, y=c("Svo2","Scvo2"), item="Age" )str( sv )# A summary is not created if the the first argument (data=) is not used:sv <- Meth( y=CardOutput[,c("Svo2","Scvo2")], item=CardOutput$VO2 )summary(sv)
# Sample itemsssv <- sample.Meth( sv, how="item", N=8 )
# More than two methodsdata( sbp )plot( Meth( sbp ) )# Creating non-unique replicate numbers per (meth,item) creates a warning:data( hba1c )hb1 <- with( hba1c,
Meth( meth=dev, item=item, repl=d.ana-d.samp, y=y, print=TRUE ) )hb2 <- with( subset(hba1c,type=="Cap"),
Meth( meth=dev, item=item, repl=d.ana-d.samp, y=y, print=TRUE ) )
Meth.sim Simulate a dataframe containing replicate measurements on the sameitems using different methods.
Description
Simulates a dataframe representing data from a method comparison study. It is returned as a Methobject.
Usage
Meth.sim( Ni = 100,Nm = 2,Nr = 3,nr = Nr,
alpha = rep(0,Nm),beta = rep(1,Nm),
mu.range = c(0, 100),sigma.mi = rep(5,Nm),sigma.ir = 2.5,

Meth.sim 41
sigma.mir = rep(5,Nm),m.thin = 1,i.thin = 1 )
Arguments
Ni The number of items (patient, animal, sample, unit etc.)Nm The number of methods of measurement.Nr The (maximal) number of replicate measurements for each (item,method) pair.nr The minimal number of replicate measurements for each (item,method) pair.
If nr<Nr, the number of replicates for each (meth,item) pair is uniformly dis-tributed on the points nr:Nr, otherwise nr is ignored. Different number of repli-cates is only meaningful if replicates are not linked, hence nr is also ignoredwhen sigma.ir>0.
alpha A vector of method-specific intercepts for the linear equation relating the "true"underlying item mean measurement to the mean measurement on each method.
beta A vector of method-specific slopes for the linear equation relating the "true"underlying item mean measurement to the mean measurement on each method.
mu.range The range across items of the "true" mean measurement. Item means are uni-formly spaced across the range. If a vector length Ni is given, the values of thatvector will be used as "true" means.
sigma.mi A vector of method-specific standard deviations for a method by item randomeffect. Some or all components can be zero.
sigma.ir Method-specific standard deviations for the item by replicate random effect.sigma.mir A vector of method-specific residual standard deviations for a method by item
by replicate random effect (residual variation). All components must be greaterthan zero.
m.thin Fraction of the observations from each method to keep.i.thin Fraction of the observations from each item to keep. If both m.thin and i.thin
are given the thinning is by their componentwise product.
Details
Data are simulated according to the following model for an observation ymir:
ymir = αm + βm(µi + bir + cmi) + emir
where bir is a random item by repl interaction (with standard deviation for method m the corre-sponding component of the vector σir), cmi is a random meth by item interaction (with standarddeviation for method m the corresponding component of the vector σmi) and emir is a residual er-ror term (with standard deviation for method m the corresponding component of the vector σmir).The µi’s are uniformly spaced in a range specified by mu.range.
Value
A Meth object, i.e. dataframe with columns meth, item, repl and y, representing results from amethod comparison study.

42 MethComp
Author(s)
Lyle Gurrin, University of Melbourne, http://www.epi.unimelb.edu.au/about/staff/gurrin-lyle
Bendix Carstensen, Steno Diabetes Center, http://BendixCarstensen.com
See Also
summary.Meth, plot.Meth, MCmcmc
Examples
Meth.sim( Ni=4, Nr=3 )xx <- Meth.sim( Nm=3, Nr=5, nr=2, alpha=1:3, beta=c(0.7,0.9,1.2), m.thin=0.7 )summary( xx )plot( xx )
MethComp Summarize conversion equations and prediction intervals betweenmethods.
Description
Takes the results from BA.est, DA.reg, AltReg or MCmcmc and returns a MethComp object, suitablefor displaying the relationship between methods in print pr graphic form.
Usage
MethComp(obj)## S3 method for class 'MethComp'print(x, digits=3, ... )## S3 method for class 'MethComp'plot(x,
wh.comp = 1:2,pl.type = "conv",dif.type = "lin",sd.type = "const",axlim = range(x$data$y,na.rm=TRUE),diflim = axlim-mean(axlim),points = FALSE,
repl.conn = FALSE,col.conn = "gray",lwd.conn = 1,
grid = TRUE,N.grid = 10,
col.grid = grey(0.9),lwd = c(3,1,1),
col.lines = "black",
MethComp 43
col.points = "black",pch.points = 16,
eqn = is.null(attr(x,"Transform")),col.eqn = col.lines,font.eqn = 2,digits = 2,mult = FALSE,alpha = NULL,... )
## S3 method for class 'MethComp'lines(x,
wh.comp = getOption("MethComp.wh.comp"),pl.type = getOption("MethComp.pl.type"),dif.type = getOption("MethComp.dif.type"),sd.type = getOption("MethComp.sd.type"),
col.lines = "black",lwd = c(3,1,1),
digits = 3,mult = FALSE,alpha = NULL,... )
## S3 method for class 'MethComp'points(x,
wh.comp = getOption("MethComp.wh.comp"),pl.type = getOption("MethComp.pl.type"),
col.points = "black",pch.points = 16,repl.conn = FALSE,col.conn = "gray",lwd.conn = 1,
mult = FALSE,... )
Arguments
obj A MethComp or MCmcmc object.
x A MethComp object.
wh.comp Numeric or character of length 2. Which two methods should be plotted.
pl.type Character. If "conv" it will be a plot of two methods against each other, other-wise it will be a plot of the 1st minus the 2nd versus the average; a Bland-Altmantype plot.
dif.type Character. If "lin" (the default) a linear relationship between methods is allowed.Otherwise a constant difference is assumed and LoA can be indicated on theplot.
sd.type Should the estimated dependence of the SD (from DA.reg be used when plottingprediction limits?
axlim The extent of the axes of the measurements.

44 MethComp
diflim The extent of the axis of the differences.
points Logical. Should the points be included in the plot.
repl.conn Logical. Should replcate measurements be connected; this assumes linked repli-cates.
col.conn Color of the lines connecting replicates.
lwd.conn Width of the connection lines.
grid Should there be a grid? If numerical, gridlines are drawn at these locations.
N.grid Numeric. How many gridlines? If a vector of length>1, it will be taken as theposition of the gridlines.
col.grid Color of the gridlines.
col.lines Color of the conversion lines.
lwd Numerical vector of length 3. Width of the conversion line and the predictionlimits.
pch.points Plot character for points.
col.points Color of the points.
eqn Logical. Should the conversion equation be printed on the plot.
col.eqn Color of the conversion formula
font.eqn font for the conversion formula
digits The number of digits after the decimal point in the conversion formulae.
mult Logical. Should ratios be plotted on a log-scale instead of differences on a linearscale? See description of the argument for BA.plot.
alpha 1 minus the confidence level for the prediction interval. If not given, the predic-tion interval is constructed as plus/minus twice the SD.
... Further arguments.
Details
Using MethComp on the results from BA.est or AltReg is not necessary, as these two functionsalready return objetcs of class MethComp.
plot.MethComp plots the conversion function with prediction limits; always using the original scaleof measurements. It also sets the options "MethComp.wh.cmp" indicating which two methods areplotted and "MethComp.pl.type" indicating whether a plot of methods against each other or aBland-Altman type plot of differences versus averages. By default the conversion lines are plotted.
lines.MethComp and points.MethComp adds conversion lines with prediction limits and points toa plot.
Value
MethComp returns a MethComp object, which is a list with three elements, Conv, a three-way arraygiving the linear conversion equations between methods, VarComp, a two-way array classified bymethods and variance components and data, a copy of the original Meth object supplied — see thedescription under BA.est.
milk 45
A MethComp object has an attribute Transform, which is either NULL, or a named list with el-ements trans and inv, both of which are functions. The first is the transformation applied tomeasurements before analysis; the results are all given on the transformed scale. The second is theinverse transformation; this is only used when plotting the resulting relationship between methods.
The methods print, plot, lines and points return nothing.
Author(s)
Bendix Carstensen, Steno Diabetes Center, <[email protected]>.
See Also
BA.est AltReg MCmcmc
Examples
data( ox )BA.ox <- BA.est( ox, linked=TRUE )print( BA.ox )## Not run:AR.ox <- AltReg( ox, linked=TRUE )print( AR.ox )plot( AR.ox )## End(Not run)
milk Measurement of fat content of human milk by two different methods.
Description
Fat content of human milk determined by measurement of glycerol released by enzymic hydrolysisof triglycerides (Trig) and measurement by the Standard Gerber method (Gerber). Units are (g/100ml).
Usage
data(milk)
Format
A data frame with 90 observations on the following 3 variables.
meth a factor with levels Gerber Trig
item sample id
y a numeric vector
46 ox
Source
The dataset is adapted from table 3 in: JM Bland and DG Altman: Measuring agreement in methodcomparison studies. Statistical Methods in Medical Research, 8:136-160, 1999. See: Lucas A, Hud-son GJ, Simpson P, Cole TJ, Baker BA. An automated enzymic micromethod for the measurementof fat in human milk. Journal of Dairy Research 1987; 54: 487-92.
Examples
data(milk)str(milk)milk <- Meth(milk)plot(milk)abline(0,1)
ox Measurement of oxygen saturation in blood
Description
61 children had their blood oxygen content measured at the Children’s Hospital in Melbourne,either with a chemical method analysing gases in the blood (CO) or by a pulse oximeter measuringtranscutaneously (pulse). Replicates are linked between methods; i.e. replicate 1 for each of thetwo methods are done at the same time. However, replicate measurements were taken in quicksuccession so the pairs of measurements are exchangeable within person.
Usage
data(ox)
Format
A data frame with 354 observations on the following 4 variables.
meth Measurement methods, factor with levels CO, pulse
item Id for the child
repl Replicate of measurements. There were 3 measurements for most children, 4 had only 2replicates with each method, one only 1
y Oxygen saturation in percent.
Examples
data(ox)str(ox)ox <- Meth(ox)with( ox, table(table(item)) )summary( ox )# The effect of basing LoA on means over replicates:
ox.MC 47
par( mfrow=c(1,2), mar=c(4,4,1,4) )BA.plot( ox , diflim=c(-20,20), axlim=c(20,100), repl.conn=TRUE )BA.plot( mean(ox), diflim=c(-20,20), axlim=c(20,100) )
ox.MC A MCmcmc object from the oximetry data.
Description
This object is included for illustrative purposes. It is a result of using MCmcmc, with n.iter=20000.
Usage
data(ox.MC)
Format
The format is a MCmcmc object.
Details
The data are the ox dataset, where measurements are linked within replicate (=day of analysis).
Examples
data(ox.MC)attr(ox.MC,"mcmc.par")## Not run:print.MCmcmc(ox.MC)trace.MCmcmc(ox.MC)trace.MCmcmc(ox.MC,"beta")post.MCmcmc(ox.MC)post.MCmcmc(ox.MC,"beta")
## End(Not run)# A MCmcmc object also has class mcmc.list, so we can use the# coda functions for covergence diagnostics:## Not run: acfplot( subset.MCmcmc(ox.MC, subset="sigma"))
48 PBreg
PBreg Passing-Bablok regression
Description
Implementation of the Passing-Bablok’s procedure for assessing of the equality of measurementsby two different analytical methods.
Usage
PBreg(x, y=NULL, conf.level=0.05, wh.meth=1:2)## S3 method for class 'PBreg'
print(x,...)
Arguments
x a Meth object, alternatively a numeric vector of measurements by method A, or adata frame of exactly two columns, first column with measurements by methodA, second column with measurements by method B.
y a numeric vector of measurements by method B - must be of the same lengthas x. If not provided, x must be the Meth object or a data frame of exactly 2columns.
conf.level confidence level for calculation of confidence boundaries - 0.05 is the default.
wh.meth Which of the methods from the Meth object are used in the regression.
... other parameters, currently ignored.
Details
This is an implementation of the original Passing-Bablok procedure of fitting unbiased linear regres-sion line to data in the method comparison studies. It calcualtes the unbiased slope and intercept,along with their confidence intervals. However, the tests for linearity is not yet fully implemented.
It doesn’t matter which results are assigned to "Method A" and "Method B", however the "MethodA" results will be plotted on the x-axis by the plot method.
Value
PBreg returns an object of class "PBreg", for which the print, predict and plot methods aredefined.
An object of class "PBreg" is a list composed of the following elements:
coefficients a matrix of 3 columns and 2 rows, containing the estimates of the intercept andslope, along with their confidence boundaries.
residuals defined as in the "lm" class, as the response minus the fitted value.
fitted.values the fitted values.
model the model data frame used.

PBreg 49
n a vector of two values: the number of observations read, and the number ofobservations used.
S A vector of all slope estimates.
I A vector of all intercept estimates.
adj A vector of fit parameters, where Ss is the number of estimated slopes (length(S)),K is the offset for slopes <(-1), M1 and M2 are the locations of confidenceboundaries in S, and l and L are the numbers of points above and below thefitted line, used in cusum calculation.
cusum A vector of cumulative sums of residuals sorted by the D-rank.
Di A vector of D-ranks.
Note
Please note that this method can become very computationally intensive for larger numbers of ob-servations. One can expect a reasonable computation times for datasets with fewer than 100 obser-vations.
Author(s)
Michal J. Figurski <[email protected]>
References
Passing, H. and Bablok, W. (1983), A New Biometrical Procedure for Testing the Equality of Mea-surements from Two Different Analytical Methods. Journal of Clinical Chemistry and ClinicalBiochemistry, Vol 21, 709–720
See Also
plot.PBreg, predict.PBreg, Deming.
Examples
## Model data frame generationa <- data.frame(x=seq(1, 30)+rnorm(mean=0, sd=1, n=30),
y=seq(1, 30)*rnorm(mean=1, sd=0.4, n=30))
## Call to PBregx <- PBreg(a)print(x)
par(mfrow=c(2,2))plot(x, s=1:4)
## A real data exampledata(milk)milk <- Meth(milk)summary(milk)PBmilk <- PBreg(milk)
50 PEFR
par(mfrow=c(2,2))plot(PBmilk, s=1:4)
PEFR Peak Expiratory Flow Rate (PEFR) measurements with Wright peakflow and mini Wright peak flow meter.
Description
Measurement of PEFR with Wright peak flow and mini Wright peak flow meter on 17 individuals.
Usage
data(PEFR)
Format
A data frame with 68 observations on the following 3 variables.
meth a factor with levels Wright and Mini, representing measurements by a Wright peak flowmeter and a mini Wright meter respectively, in random order.
item Numeric vector, the person ID.
y Numeric vector, the measurements, i.e. PEFR for the two measurements with a Wright peak flowmeter and a mini Wright meter respectively. The measurement unit is l/min.
repl Numeric vector, replicate number. Replicates are exchangeable within item.
Source
J. M. Bland and D. G. Altman (1986) Statistical Methods for Assessing Agreement Between TwoMethods of Clinical Measurement, Lancet. 1986 Feb 8;1(8476):307-10.
Examples
data(PEFR)PEFR <- Meth(PEFR)summary(PEFR)plot(PEFR)plot(perm.repl(PEFR))
perm.repl 51
perm.repl Manipulate the replicate numbering within (item,method)
Description
Replicate numbers are generated within (item,method) in a dataframe representing a method com-parison study. The function assumes that observations are in the correct order within each (item,method),i.e. if replicate observations are non-exchangeable within method, linked observations are assumedto be in the same order within each (item,method).
Usage
make.repl( data )has.repl( data )perm.repl( data )
Arguments
data A Meth object or a data frame with columns meth, item and y.
Details
make.repl just adds replicate numbers in the order of the data.frame rows. perm.repl is designedto explore the effect of permuting the replicates within (item,method). If replicates are truly ex-changeable within methods, the inference should be independent of this permutation.
Value
make.repl returns a dataframe with a column, repl added or replaced, whereas has.repl returnsa logical indicating wheter a combination of (meth,item) wioth more that one valid y- value.
perm.repl returns a dataframe of class Meth where the rows (i.e. replicates) are randomly permutedwithin (meth,item), and subsequently ordered by (meth,item,repl).
Author(s)
Bendix Carstensen, Steno Diabetes Center, http://www.biostat.ku.dk/~bxc
See Also
perm.repl

52 plot.MCmcmc
Examples
data(ox)xx <- subset( ox, item<4 )[,-3]cbind( xx, make.repl(xx) )cbind( make.repl(xx), perm.repl(xx) )data( ox )xx <- subset( ox, item<4 )cbind( xx, perm.repl(xx) )# Replicates are linked in the oximetry dataset, so randomly permuting# them clearly inflates the limits of agreement:par( mfrow=c(1,2), mar=c(4,4,1,4) )BA.plot( ox , ymax=30, digits=1 )BA.plot( perm.repl(ox), ymax=30, digits=1 )
plot.MCmcmc Plot estimated conversion lines and formulae.
Description
Plots the pairwise conversion formulae between methods from a MCmcmc object.
Usage
## S3 method for class 'MCmcmc'plot( x,
axlim = range( attr(x,"data")$y, na.rm=TRUE ),wh.cmp,
lwd.line = c(3,1), col.line = rep("black",2), lty.line=rep(1,2),eqn = TRUE, digits = 2,grid = FALSE, col.grid=gray(0.8),
points = FALSE,col.pts = "black", pch.pts = 16, cex.pts = 0.8,
... )
Arguments
x A MCmcmc object
axlim The limits for the axes in the panels
wh.cmp Numeric vector or vector of method names. Which of the methods should beincluded in the plot?
lwd.line Numerical vector of length 2. The width of the conversion line and the predic-tion limits. If the second values is 0, no prediction limits are drawn.
col.line Numerical vector of length 2. The color of the conversion line and the predictionlimits.

plot.MCmcmc 53
lty.line Numerical vector of length 2. The line types of the conversion line and theprediction limits.
eqn Should the conversion equations be printed on the plot?. Defaults to TRUE.
digits How many digits after the decimal point shoudl be used when printing the con-version equations.
grid Should a grid be drawn? If a numerical vector is given, the grid is drawn at thosevalues.
col.grid What color should the grid have?
points Logical or character. Should the points be plotted. If TRUE or "repl" paired val-ues of single replicates are plotted. If "perm", replicates are randomly permutedwithin (item, method) befor plotting. If "mean", means across replicates withinitem, method are formed and plotted.
col.pts What color should the observation have.
pch.pts What plotting symbol should be used.
cex.pts What scaling should be used for the plot symbols.
... Parameters to pass on. Currently not used.
Value
Nothing. The lower part of a (M-1) by (M-1) matrix of plots is drawn, showing the pairwise conver-sion lines. In the corners of each is given the two conversion equations together with the predictionstandard error.
See Also
MCmcmc, print.MCmcmc
Examples
## Not run: data( hba1c )## Not run: str( hba1c )## Not run: hba1c <- transform( subset( hba1c, type=="Ven" ),
meth = dev,repl = d.ana )
## End(Not run)## Not run: hb.res <- MCmcmc( hba1c, n.iter=50 )## Not run: data( hba.MC )## Not run: str( hba.MC )## Not run: par( ask=TRUE )## Not run: plot( hba.MC )## Not run: plot( hba.MC, pl.obs=TRUE )

54 plot.PBreg
plot.PBreg Passing-Bablok regression - plot method
Description
A plot method for the "PBreg" class object, that is a result of Passing-Bablok regression.
Usage
## S3 method for class 'PBreg'plot(x,
pch=21, bg="#2200aa33",xlim=c(0, max(x$model)), ylim=c(0, max(x$model)),xlab=x$meths[1], ylab=x$meths[2], subtype=1, colors =list(CI = "#ccaaff50", fit = "blue", ref = "#99999955",bars = "gray", dens = "#8866aaa0", ref2 = c("#1222bb99","#bb221299")), ...)
Arguments
x an object of class "PBreg"
pch Which plotting character should be used for the points.
bg Background colour for the plotting character.
xlim Limits for the x-axis.
ylim Limits for the y-axis.
xlab Label on the x-axis.
ylab Label on the y-axis.
subtype a numeric value or vector, that selects the desired plot subtype. Subtype 1 is anx-y plot of raw data with regression line and confidence boundaries for the fit asa shaded area. This is the default. Subtype 2 is a ranked residuals plot. Subtype3 is the "Cusum" plot useful for assessing linearity of the fit. Plot subtypes 1through 3 are standard plots from the 1983 paper by Passing and Bablok - seethe reference. Plot subtype 4 is a histogram (with overlaid density line) of theindividual slopes. The range of this plot is limited to 5 x IQR for better visibility.
colors A list of 6 elements allowing customization of colors of various plot elements.For plot subtype 1: "CI" is the color of the shaded confidence interval area; and"fit" is the color of fit line. For plot subtypes 2 & 3: "ref" is the color of thehorizontal reference line. For plot subtype 4: "bars" is the bar background color,"dens" is the color of the density line, and "ref2" is a vector of two colors forlines indicating the median and confidence limits.
... other parameters as in "plot", some of which are pre-defined for improvedappearance. This affects only the subtype 1 plot.
plot.VarComp 55
Author(s)
Michal J. Figurski <[email protected]>
References
Passing, H. and Bablok, W. (1983), A New Biometrical Procedure for Testing the Equality of Mea-surements from Two Different Analytical Methods. Journal of Clinical Chemistry and ClinicalBiochemistry, Vol 21, 709–720
See Also
PBreg, Deming.
Examples
## Model data frame generationa <- data.frame(x=seq(1, 30)+rnorm(mean=0, sd=1, n=30),
y=seq(1, 30)*rnorm(mean=1, sd=0.4, n=30))
## Call to PBregx <- PBreg(a)print(x)par(mfrow=c(2,2))plot(x, s=1:4)
## Or the same using "Meth" objecta <- Meth(a, y=1:2)x <- PBreg(a)print(x)par(mfrow=c(2,2))plot(x, s=1:4)
plot.VarComp Plot the a posteriori densities for variance components
Description
When a method comparison model i fitted and stored in a MCmcmc object, then the posterior distri-butions of the variance components are plotted, in separate displays for method.
Usage
## S3 method for class 'VarComp'plot( x,
which,lwd.line = rep(2, 4),col.line = c("red", "green", "blue", "black"),lty.line = rep(1, 4),
56 plot.VarComp
grid = TRUE,col.grid = gray(0.8),
rug = TRUE,probs = c(5, 50, 95),
tot.var = FALSE,same.ax = TRUE,
meth.names = TRUE,VC.names = "first",
... )
Arguments
x A MCmcmc object.
which For which of the compared methods should the plot be made?
lwd.line Line width for drawing the density.
col.line Color for drawing the densities.
lty.line Line type for drawing the densities.
grid Logical. Should a vertical grid be set up? If numeric it is set up at the valuesspecified. If same.ax, the range of the grid is taken to be the extent of the x-axisfor all plots.
col.grid The color of the grid.
rug Should a small rug at the bottom show posterior quantiles?
probs Numeric vector with numbers in the range from 0 to 100, indicating the posteriorpercentiles to be shown in the rug.
tot.var Should the posterior of the total variance also be shown?
same.ax Should the same axes be used for all methods?
meth.names Should the names of the methods be put on the plots?
VC.names Should the names of the variance components be put on the first plot ("first"),the last ("last"), all ("all") or none ("none"). Only the first letter is needed.
... Parameters passed on the density furnction that does the smoothing of the pos-terior samples.
Details
The function generates a series of plots, one for each method compared in the MCmcmc object sup-plied (or those chosen by which=). Therefore the user must take care to set mfrow or mfcol tocapture all the plots.
Value
A list with one element for each method. Each element of this is a list of densities, i.e. of objects ofclass density, one for each variance component.
plvol 57
Author(s)
Bendix Carstensen, www.biostat.ku.dk/~bxc
See Also
plot.MCmcmc, MCmcmc, check.MCmcmc
Examples
data( ox.MC )par( mfrow=c(2,1) )plot.VarComp( ox.MC, grid=c(0,15) )
plvol Measurements of plasma volume measured by two different methods.
Description
For each subject (item) the plasma volume is expressed as a percentage of the expected valuefor normal individuals. Two alternative sets of normal values are used, named Nadler and Hurleyrespectively.
Usage
data(plvol)
Format
A data frame with 198 observations on the following 3 variables.
meth a factor with levels Hurley and Nadler
item a numeric vector
y a numeric vector
Source
The datset is adapted from table 2 in: JM Bland and DG Altman: Measuring agreement in methodcomparison studies. Statistical Methods in Medical Research, 8:136-160, 1999. Originally suppliedto Bland \& Altman by C Dore, see: Cotes PM, Dore CJ, Liu Yin JA, Lewis SM, Messinezy M,Pearson TC, Reid C. Determination of serum immunoreactive erythropoietin in the investigation oferythrocytosis. New England Journal of Medicine 1986; 315: 283-87.
58 predict.PBreg
Examples
data(plvol)str(plvol)plot( y[meth=="Nadler"]~y[meth=="Hurley"],data=plvol,
xlab="Plasma volume (Hurley) (pct)",ylab="Plasma volume (Nadler) (pct)" )
abline(0,1)par( mar=c(4,4,1,4) )BA.plot(plvol)
predict.PBreg Passing-Bablok regression - predict method
Description
A predict method for the "PBreg" class object, that is a result of Passing-Bablok regression.
Usage
## S3 method for class 'PBreg'predict(object, newdata = object$model$x, interval="confidence",level=0.95,...)
Arguments
object an object of class "PBreg"newdata an optional vector of new values of x to make predictions for. If omitted, the
fitted values will be used.interval type of interval calculation - either confidence or none. The former is the
default.level tolerance/confidence level.... Not used.
Value
If interval is "confidence" this function returns a data frame with three columns: "fit", "lwr"and "upr" - similarly to predict.lm.
If interval is "none" a vector of predicted values is returned.
Author(s)
Michal J. Figurski <[email protected]>
References
Passing, H. and Bablok, W. (1983), A New Biometrical Procedure for Testing the Equality of Mea-surements from Two Different Analytical Methods. Journal of Clinical Chemistry and ClinicalBiochemistry, Vol 21, 709–720

rainman 59
See Also
PBreg, Deming.
Examples
## Model data frame generationa <- data.frame(x=seq(1, 30)+rnorm(mean=0, sd=1, n=30),
y=seq(1, 30)*rnorm(mean=1, sd=0.4, n=30))
## Call to PBregx <- PBreg(a)print(x)predict(x, interval="none")
## Or the same using "Meth" objecta <- Meth(a, y=1:2)x <- PBreg(a)print(x)predict(x)
rainman Perception of points in a swarm
Description
Five raters were asked to guess the number of points in a swarm for 10 different figures (which -unknown to the raters - were each repeated three times).
Usage
data(rainman)
Format
A data frame with 30 observations on the following 6 variables.
SAND The true number of points in the swarm. Each picture is replicated thriceME Ratings from judge 1TM Ratings from judge 2AJ Ratings from judge 3BM Ratings from judge 4LO Ratings from judge 5
Details
The raters had approximately 10 seconds to judge each picture, and they thought it were 30 differentpictures. Before starting the experiment they were shown 6 (unrelated) pictures and were told thenumber of points in each of those pictures. The SAND column contains the picture id (which isalso the true number of points in the swarm).
60 rainman
Source
Collected by Claus Ekstrom.
Examples
library(MethComp)data( rainman )str( rainman )RM <- Meth( rainman, item=1, y=2:6 )head( RM )BA.est( RM, linked=FALSE )library(lme4)mf <- lmer( y ~ meth + item + (1|MI),
data = transform( RM, MI=interaction(meth,item) ) )summary( mf )mr <- lmer( y ~ (1|meth) + (1|item) + (1|MI),
data = transform( RM, MI=interaction(meth,item) ) )summary( mr )
## Point swarms were generated by the following program### Not run:set.seed(2) # Originalnpoints <- sample(4:30)*4nplots <- 10pdf(file="swarms.pdf", onefile=TRUE)
s1 <- sample(npoints[1:nplots])print(s1)for (i in 1:nplots) {
n <- s1[i]set.seed(n)x <- runif(n)y <- runif(n)plot(x,y, xlim=c(-.15, 1.15), ylim=c(-.15, 1.15), pch=20, axes=F,
xlab="", ylab="")}s1 <- sample(npoints[1:nplots])print(s1)for (i in 1:nplots) {
n <- s1[i]set.seed(n)x <- runif(n)y <- runif(n)plot(y,x, xlim=c(-.15, 1.15), ylim=c(-.15, 1.15), pch=20, axes=F,
xlab="", ylab="")}s1 <- sample(npoints[1:nplots])print(s1)for (i in 1:nplots) {
n <- s1[i]
sbp 61
set.seed(n)x <- runif(n)y <- runif(n)plot(-x,y, xlim=c(-1.15, .15), ylim=c(-.15, 1.15), pch=20, axes=F,
xlab="", ylab="")}dev.off()
## End(Not run)
sbp Systolic blood pressure measured by three different methods.
Description
For each subject (item) there are three replicate measurements by three methods (two observers, Jand R and the automatic machine, S). The replicates are linked within (method,item).
Usage
data(sbp)
Format
A data frame with 765 observations on the following 4 variables:
meth Methods, a factor with levels J(observer 1), R(observer 2) and S(machine)item Person id, numeric.repl Replicate number, a numeric vectory Systolic blood pressure masurement, a numeric vector
Source
The dataset is adapted from table 1 in: JM Bland and DG Altman: Measuring agreement in methodcomparison studies. Statistical Methods in Medical Research, 8:136-160, 1999. Originally suppliedto Bland \& Altman by E. O’Brien, see: Altman DG, Bland JM. The analysis of blood pressure data.In O’Brien E, O’Malley K eds. Blood pressure measurement. Amsterdam: Elsevier, 1991: 287-314.
See Also
sbp.MC
Examples
data(sbp)par( mfrow=c(2,2), mar=c(4,4,1,4) )BA.plot( sbp, comp=1:2 )BA.plot( sbp, comp=2:3 )BA.plot( sbp, comp=c(1,3) )## Not run: BA.est( sbp, linked=TRUE )
62 sbp.MC
sbp.MC A MCmcmc object from the sbp data
Description
This object is included for illustrative purposes. It is a result of using MCmcmc, with n.iter=100000on the dataset sbp from this package.
Usage
data(sbp.MC)
Format
The format is a MCmcmc object.
Details
The basic data are measurements of systolic blood pressure from the sbp dataset. Measurementsare taken to be linked within replicate. The code used to generate the object was:
library(MethComp)data( sbp )spb <- Meth( sbp )sbp.MC <- MCmcmc( sbp, linked=TRUE, n.iter=100000, program="JAGS" ) )
Examples
data(sbp.MC)# How was the data generatedattr(sbp.MC,"mcmc.par")
# Traceplotstrace.MCmcmc(sbp.MC)trace.MCmcmc(sbp.MC,"beta")
# A MCmcmc object also has class mcmc.list, so we can use the# standard coda functions for convergence diagnostics:acfplot( subset.MCmcmc(sbp.MC,subset="sigma") )
# Have a look at the correlation between the 9 variance parameterspairs.MCmcmc( sbp.MC )
# Have a look at whether the MxI variance components are the same between methods:## Not run:pairs.MCmcmc( sbp.MC, subset=c("mi"), eq=TRUE,
panel=function(x,y,...){
scint 63
abline(0,1)abline(v=median(x),h=median(y),col="gray")points(x,y,...)}
)## End(Not run)
scint Relative renal function by Scintigraphy
Description
Measurements of the relative kidney function (=renal function) for 111 patients. The percentageof the total renal function present in the left kidney is determined by one reference method, DMSA(static) and by one of two dynamic methods, DTPA or EC.
Usage
data(scint)
Format
A data frame with 222 observations on the following 5 variables:
meth Measurement method, a factor with levels DMSA, DTPA, EC.
item Patient identification.
y Percentage of total kidney function in the left kidney.
age Age of the patient.
sex Sex of the patient, a factor with levels F, M.
Source
F. C. Domingues, G. Y. Fujikawa, H. Decker, G. Alonso, J. C. Pereira, P. S. Duarte: Comparisonof Relative Renal Function Measured with Either 99mTc-DTPA or 99mTc-EC Dynamic Scintigra-phies with that Measured with 99mTc-DMSA Static Scintigraphy. International Braz J Urol Vol.32 (4): 405-409, 2006
Examples
data(scint)str(scint)# Make a Bland-Altman plot for each of the possible comparisons:par(mfrow=c(1,2),mgp=c(3,1,0)/1.6,mar=c(3,3,1,3))BA.plot(scint,comp.levels=c(1,2),ymax=15,digits=1,cex=2)BA.plot(scint,comp.levels=c(1,3),ymax=15,digits=1,cex=2)

64 TDI
TDI Compute Lin’s Total deviation index
Description
This index calculates a value such that a certain fraction of difference between methods will benumerically smaller than this.
Usage
TDI( y1, y2, p = 0.05, boot = 1000, alpha = 0.05 )
Arguments
y1 Measurements by one method.
y2 Measurements by the other method
p The fraction of items with differences numerically exceeding the TDI
boot If numerical, this is the number of bootstraps. If FALSE no confidence intervalfor the TDI is produced.
alpha 1 - confidende degree.
Details
If boot==FALSE a single number, the TDI is returned. If boot is a number, the median and the1-alpha/2 central interval based on boot resamples are returned too, in a named vector of length 4.
Value
A list with 3 components. The names of the list are preceeded by the criterion percentage, i.e. thepercentage of the population that the TDI is devised to catch.
TDI The numerically computed value for the TDI. If boot is numeric, a vector ofmedian and a bootstrap c.i. is appended.
TDI The approximate value of the TDILimits of Agreement
Limits of agreement
Note
The TDI is a measure which esentially is a number K such that the interval [-K,K] contains thelimits of agreement.
Author(s)
Bendix Carstensen, [email protected]

to.wide 65
References
LI Lin: Total deviation index for measuring individual agreement with applications in laboratoryperformance and bioequivalence, Statistics in Medicine, 19, 255-270 (2000)
See Also
BA.plot,corr.measures
Examples
data(plvol)pw <- to.wide(plvol)with(pw,TDI(Hurley,Nadler))
to.wide Functions to convert between long and wide representations of data.
Description
These functions are merely wrappers for reshape. Given the complicated syntax of reshape andthe particularly simple structure of this problem, the functions facilitate the conversion enormously.
Usage
to.wide( data, warn=TRUE )to.long( data, vars )
Arguments
data A Meth object.
warn Logical. Should a warning be printed when replicates are taken as items?
vars The variables representing measurements by different methods. Either a char-acter vector of names, or a numerical vector with the number of the variables inthe dataframe.
Details
If data represents method comparisons with exchangeable replicates within method, the transfor-mation to wide format does not necessarily make sense. Also recognizes a
Value
A dataframe.
Author(s)
Bendix Carstensen, Steno Diabetes Center, http://BendixCarstensen.com
66 VitCap
See Also
perm.repl
Examples
data( milk )str( milk )mw <- to.wide( milk )str( mw )( mw <- subset( mw, as.integer(item) < 3 ) )to.long( mw, 3:4 )
VitCap Merits of two instruments designed to measure certain aspects of hu-man lung function (Vital Capacity)
Description
Measurement on certain aspects of human lung capacity for 72 patients on 4 instrument-operativecombination, i.e. two different instruments and two different users, a skilled one and a new one.
Usage
data(VitCap)
Format
A data frame with 288 observations on the following 5 variables.
meth a factor with levels StNew, StSkil, ExpNew and ExpSkil, representing the instrument by usercombinations. See below.
item a numeric vector, the person ID, i.e. the 72 patients
y a numeric vector, the measurements, i.e. vital capacity.
user a factor with levels New Skil, for the new user and the skilled user
instrument a factor with levels Exp and St, for the experimental instrument and the standard one.
Source
V. D. Barnett, Simultaneous Pairwise Linear Structural Relationships, Biometrics, Mar. 1969, Vol.25, No. 1, pp. 129-142.
Examples
data(VitCap)Vcap <- Meth( VitCap )str( Vcap )plot( Vcap )
Index
∗Topic datagenMeth.sim, 40perm.repl, 51to.wide, 65
∗Topic datasetsAncona, 6cardiac, 18CardOutput, 19Enzyme, 29fat, 29glucose, 30hba.MC, 31hba1c, 32milk, 45ox, 46ox.MC, 47PEFR, 50plvol, 57rainman, 59sbp, 61sbp.MC, 62scint, 63VitCap, 66
∗Topic designabconv, 2BA.est, 7BA.plot, 10BlandAltman, 14MCmcmc, 33MethComp, 42perm.repl, 51plot.MCmcmc, 52plot.VarComp, 55to.wide, 65
∗Topic manipbothlines, 17Meth, 37Meth.sim, 40perm.repl, 51
to.wide, 65∗Topic models
AltReg, 3BA.est, 7BA.plot, 10BlandAltman, 14check.MCmcmc, 20corr.measures, 23DA.reg, 24Deming, 27MCmcmc, 33plot.MCmcmc, 52plot.VarComp, 55TDI, 64
∗Topic nonlinearMCmcmc, 33
∗Topic regressionAltReg, 3corr.measures, 23DA.reg, 24Deming, 27MCmcmc, 33plot.MCmcmc, 52plot.VarComp, 55TDI, 64
AB.plot (BlandAltman), 14abconv, 2abline, 17AltReg, 3, 8, 42, 44, 45Ancona, 6
BA.est, 5, 7, 13, 42, 44, 45BA.plot, 3, 9, 10, 16, 36, 44, 65bias.BA.est (BA.est), 7BlandAltman, 14, 15bothlines, 17bugs, 33, 35
cardiac, 18
67

68 INDEX
CardOutput, 19check.MCmcmc, 20, 36, 57check.trans, 8check.trans (choose.trans), 22choose.trans, 4, 9, 22, 25, 35, 38corr.measures, 23, 65
DA.reg, 5, 13, 24, 42, 43DA2y (DA.reg), 24Deming, 27, 49, 55, 59density, 56densityplot, 21
ends (corr.measures), 23Enzyme, 29
fat, 29
glucose, 30
has.repl (perm.repl), 51hba.MC, 31hba1c, 31, 32
Lattice, 21lines.MethComp (MethComp), 42
make.repl (perm.repl), 51max.Meth (Meth), 37mcmc.list, 36mcmc.MCmcmc (MCmcmc), 33MCmcmc, 3, 13, 16, 21, 23, 28, 31, 33, 42, 43,
45, 47, 52, 53, 55, 57, 62mean.Meth (Meth), 37median.Meth (Meth), 37Meth, 4, 7, 10, 11, 15, 25, 34, 37, 39–41, 44,
48, 51, 65Meth.sim, 5, 40MethComp, 5, 9–12, 25, 42middle (corr.measures), 23milk, 45min.Meth (Meth), 37
ox, 46, 47ox.MC, 21, 47
pairs, 21pairs.MCmcmc (check.MCmcmc), 20PBreg, 48, 55, 59PEFR, 50
perm.repl, 9, 51, 51, 66plot.MCmcmc, 21, 36, 52, 57plot.Meth, 42plot.Meth (Meth), 37plot.MethComp, 12plot.MethComp (MethComp), 42plot.PBreg, 49, 54plot.VarComp, 55plvol, 57points.MethComp (MethComp), 42post.MCmcmc (check.MCmcmc), 20predict.PBreg, 49, 58print.MCmcmc, 36, 53print.MCmcmc (MCmcmc), 33print.MethComp (MethComp), 42print.PBreg (PBreg), 48
rainman, 59reshape, 65
sample.Meth (Meth), 37sbp, 61, 62sbp.MC, 21, 61, 62scint, 63sort.Meth (Meth), 37subset.MCmcmc (MCmcmc), 33subset.Meth (Meth), 37summary.MCmcmc (MCmcmc), 33summary.Meth, 42summary.Meth (Meth), 37
TDI, 64to.long (to.wide), 65to.wide, 65trace.MCmcmc (check.MCmcmc), 20transform.Meth (Meth), 37
VC.est, 34VC.est (BA.est), 7VitCap, 66
xyplot, 21
y2DA (DA.reg), 24


![Applied Numerical Linear Algebra. Lecture 9. · A nonzero vector y such that y ... New York, 1959] or [P. Halmos. Finite Dimensional Vector Spaces. Van Nostrand, New York, 1958]](https://img.pdfslide.us/doc/110x75/5b5aeae57f8b9a302a8cd215/applied-numerical-linear-algebra-lecture-9-a-nonzero-vector-y-such-that-y.jpg)