Embed Size (px)
Citation preview
Package ‘InSilicoVA’July 28, 2018
Type Package
Title Probabilistic Verbal Autopsy Coding with 'InSilicoVA' Algorithm
Version 1.2.2
Date 2018-07-25
Author Zehang Li, Tyler McCormick, Sam Clark
Maintainer Zehang Li <[email protected]>
Depends R (>= 2.15.0), rJava, coda, ggplot2, InterVA5
Description Computes individual causes of death and population cause-specific mortality fractions us-ing the 'InSilicoVA' algorithm from Mc-Cormick et al. (2016) <DOI:10.1080/01621459.2016.1152191>. It uses data derived from ver-bal autopsy (VA) interviews, in a format similar to the input of the widely used 'In-terVA4' method. This package provides general model fitting and customization for 'InSili-coVA' algorithm and basic graphical visualization of the output.
License GPL-2
RoxygenNote 6.0.1
NeedsCompilation no
Repository CRAN
Date/Publication 2018-07-28 15:30:06 UTC
R topics documented:InsilicoVA-package . . . . . . . . . . . . . . . . . . . . . . . . . . . . . . . . . . . . . 2causetext . . . . . . . . . . . . . . . . . . . . . . . . . . . . . . . . . . . . . . . . . . 3condprob . . . . . . . . . . . . . . . . . . . . . . . . . . . . . . . . . . . . . . . . . . 3condprobnum . . . . . . . . . . . . . . . . . . . . . . . . . . . . . . . . . . . . . . . . 3csmf.diag . . . . . . . . . . . . . . . . . . . . . . . . . . . . . . . . . . . . . . . . . . 4extract.prob . . . . . . . . . . . . . . . . . . . . . . . . . . . . . . . . . . . . . . . . . 6get.indiv . . . . . . . . . . . . . . . . . . . . . . . . . . . . . . . . . . . . . . . . . . . 7indivplot . . . . . . . . . . . . . . . . . . . . . . . . . . . . . . . . . . . . . . . . . . . 9insilico . . . . . . . . . . . . . . . . . . . . . . . . . . . . . . . . . . . . . . . . . . . . 11insilico.fit . . . . . . . . . . . . . . . . . . . . . . . . . . . . . . . . . . . . . . . . . . 18insilico.train . . . . . . . . . . . . . . . . . . . . . . . . . . . . . . . . . . . . . . . . . 20
1

2 InsilicoVA-package
physician_debias . . . . . . . . . . . . . . . . . . . . . . . . . . . . . . . . . . . . . . 23plot.insilico . . . . . . . . . . . . . . . . . . . . . . . . . . . . . . . . . . . . . . . . . 24print.insilico . . . . . . . . . . . . . . . . . . . . . . . . . . . . . . . . . . . . . . . . . 26print.insilico_summary . . . . . . . . . . . . . . . . . . . . . . . . . . . . . . . . . . . 28probbase . . . . . . . . . . . . . . . . . . . . . . . . . . . . . . . . . . . . . . . . . . . 29probbase3 . . . . . . . . . . . . . . . . . . . . . . . . . . . . . . . . . . . . . . . . . . 29RandomPhysician . . . . . . . . . . . . . . . . . . . . . . . . . . . . . . . . . . . . . . 30RandomVA1 . . . . . . . . . . . . . . . . . . . . . . . . . . . . . . . . . . . . . . . . . 30RandomVA2 . . . . . . . . . . . . . . . . . . . . . . . . . . . . . . . . . . . . . . . . . 31SampleCategory . . . . . . . . . . . . . . . . . . . . . . . . . . . . . . . . . . . . . . . 31SamplePhysician . . . . . . . . . . . . . . . . . . . . . . . . . . . . . . . . . . . . . . 32stackplot . . . . . . . . . . . . . . . . . . . . . . . . . . . . . . . . . . . . . . . . . . . 32summary.insilico . . . . . . . . . . . . . . . . . . . . . . . . . . . . . . . . . . . . . . 34updateIndiv . . . . . . . . . . . . . . . . . . . . . . . . . . . . . . . . . . . . . . . . . 36
Index 38
InsilicoVA-package Perform InSilicoVA algorithm and provide graphical summarizationof CSMF and COD distribution.
Description
Computes individual cause of death and population cause-specific mortality fractions using theInSilicoVA algorithm. Provides a simple graphical representation of the result.
Details
Package: InsilicoVAType: PackageVersion: 1.0Date: 2015-02-06License: GPL-2
Author(s)
Zehang Li, Tyler McCormick, Sam Clark
Maintainer: Zehang Li <[email protected]>
References
Tyler H. McCormick, Zehang R. Li, Clara Calvert, Amelia C. Crampin, Kathleen Kahn and SamuelJ. Clark Probabilistic cause-of-death assignment using verbal autopsies, arXiv preprint arXiv:1411.3042http://arxiv.org/abs/1411.3042 (2014)
causetext 3
causetext Translation list of COD codes
Description
This is the translation of COD abbreviation codes into their corresponding full names.
Format
A data frame with the translation of COD codes to their names on 68 CODs (both the version ofCOD only and COD with group code).
Examples
data(causetext)
condprob Conditional probability table used by InterVA-4
Description
This is a conditional probability matrix used by InterVA-4.2. There are 60 causes and 245 symp-toms. The orders of the rows and columns must not be changed.
Format
A data frame with 245 observations on 60 variables. Each observation is the conditional probability.
Examples
data(condprob)
condprobnum Conditional probability values used by InterVA-4
Description
This is a conditional probability matrix used by InterVA-4.2. There are 60 causes and 245 symp-toms.
Format
A data frame with 245 observations on 60 variables. Each observation is the conditional probability.
Examples
data(condprobnum)
4 csmf.diag
csmf.diag Convergence test for fitted InSilico model
Description
Produce convergence test for CSMFs from fitted "insilico" objects.
Usage
csmf.diag(csmf, conv.csmf = 0.02, test = c("gelman", "heidel")[2],verbose = TRUE, autoburnin = FALSE, which.sub = NULL, ...)
Arguments
csmf It could be either fitted "insilico" object, a list of fitted "insilico" objectfrom different chains of the same length but different starting values, i.e., differ-ent seed. Or it could be the matrix of CSMF obtained by insilico, or the listof matrices of CSMF. All CSMF could contain more than one subpopulations,but should be in the same format and order. And notice if the raw CSMF is usedinstead of the "insilico" object, external causes might need to be removedmanually by user is external.sep is TRUE when fitting the model.
conv.csmf The minimum mean CSMF to be checked. Default to be 0.02, which means anycauses with mean CSMF lower than 0.02 will not be tested.
test Type of test. Currently supporting Gelman and Rubin’s test (test = "gelman")for multi-chain test, and Heidelberger and Welch’s test (test = "heidel") forsingle-chain test.
verbose Logical indicator to return the test detail instead of one logical outcome forHeidelberger and Welch’s test. Default to be TRUE.
autoburnin Logical indicator of whether to omit the first half of the chain as burn in. Defaultto be FALSE since insilico return only the iterations after burnin by default.
which.sub the name of the sub-population to test when there are multiple in the fitted object.
... Arguments to be passed to heidel.diag or gelman.diag
Details
The tests are performed using heidel.diag and gelman.diag functions in coda package. The functiontakes either one or a list of output from insilico function, or only the iteration by CSMF matrix.Usually in practice, many causes with very tiny CSMF are hard to converge based on standard tests,thus it is suggested to check convergence for only causes with mean CSMF over certain thresholdby setting proper conv.csmf.
Note for Gelman and Rubin’s test, all chains should have the same length. If the chains are sampledwith automatically length determination, they might not be comparable by this test.
csmf.diag 5
Author(s)
Zehang Li, Tyler McCormick, Sam Clark
Maintainer: Zehang Li <[email protected]>
References
Tyler H. McCormick, Zehang R. Li, Clara Calvert, Amelia C. Crampin, Kathleen Kahn and SamuelJ. Clark Probabilistic cause-of-death assignment using verbal autopsies, arXiv preprint arXiv:1411.3042http://arxiv.org/abs/1411.3042 (2014)
Gelman, Andrew, and Donald B. Rubin. Inference from iterative simulation using multiple se-quences. Statistical science (1992): 457-472.
Brooks, Stephen P., and Andrew Gelman. General methods for monitoring convergence of iterativesimulations. Journal of computational and graphical statistics 7.4 (1998): 434-455.
Heidelberger, Philip, and Peter D. Welch. A spectral method for confidence interval generation andrun length control in simulations. Communications of the ACM 24.4 (1981): 233-245.
Heidelberger, Philip, and Peter D. Welch. Simulation run length control in the presence of an initialtransient. Operations Research 31.6 (1983): 1109-1144.
Schruben, Lee W. Detecting initialization bias in simulation output. Operations Research 30.3(1982): 569-590.
See Also
insilico, summary.insilico
Examples
# load sample data together with sub-population listdata(RandomVA2)
# extract InterVA style input datadata <- RandomVA2# extract sub-population information.subpop <- RandomVA2$sex
# run without sub-populationfit1a<- insilico( data, subpop = NULL,
Nsim = 400, burnin = 200, thin = 10 , seed = 1,auto.length = FALSE)
fit1b<- insilico( data, subpop = NULL,Nsim = 400, burnin = 200, thin = 10 , seed = 2,auto.length = FALSE)
fit1c<- insilico( data, subpop = NULL,Nsim = 400, burnin = 200, thin = 10 , seed = 3,auto.length = FALSE)
# single chain checkcsmf.diag(fit1a)
# multiple chains check

6 extract.prob
csmf.diag(list(fit1a, fit1b, fit1c), test = "gelman")
# with sub-populationsfit2a<- insilico( data, subpop = subpop,
Nsim = 400, burnin = 200, thin = 10 , seed = 1,auto.length = FALSE)
fit2b<- insilico( data, subpop = subpop,Nsim = 400, burnin = 200, thin = 10 , seed = 2,auto.length = FALSE)
fit2c<- insilico( data, subpop = subpop,Nsim = 400, burnin = 200, thin = 10 , seed = 3,auto.length = FALSE)
# single chain checkcsmf.diag(fit2a)
# multiple chains checkcsmf.diag(list(fit2a, fit2b, fit2c), test = "gelman", which.sub = "Men")
extract.prob Obtain conditional probabilities from training data
Description
This is the function internally used in insilico.train function.
Usage
extract.prob(train, gs, gstable, thre = 0.95, type = c("quantile", "fixed","empirical")[1], isNumeric = FALSE)
Arguments
train Training data, it should be in the same format as the testing data and containsone additional column (see cause below) specifying known cause of death. Thefirst column is also assumed to be death ID.
gs the name of the column in train that contains cause of death.
gstable The list of causes of death used in training data.
thre a numerical value between 0 to 1. It specifies the maximum rate of missingfor any symptoms to be considered in the model. Default value is set to 0.95,meaning if a symptom has more than 95% missing in the training data, it will beremoved.
get.indiv 7
type Three types of learning conditional probabilities are provided: “quantile” or“fixed”. Since InSilicoVA works with ranked conditional probabilities P(S|C),“quantile” means the rankings of the P(S|C) are obtained by matching the samequantile distributions in the default InterVA P(S|C), and “fixed” means P(S|C)are matched to the closest values in the default InterVA P(S|C) table. Empiricallyboth types of rankings produce similar results. The third option “empirical”means no rankings are calculated, only the raw P(S|C) values are returned.
isNumeric Indicator if the input is already in numeric form. If the input is coded numeri-cally such that 1 for “present”, 0 for “absent”, and -1 for “missing”, this indicatorcould be set to True to avoid conversion to standard InterVA format.
Value
cond.prob raw P(S|C) matrixcond.prob.alpha
ranked P(S|C) matrix
table.alpha list of ranks used
table.num list of median numerical values for each rank
symps.train training data after removing symptoms with too high missing rate.
get.indiv Get individual COD probabilities from InSilicoVA Model Fits
Description
This function calculates individual probabilities for each death and provide posterior credible inter-vals for each estimates. The default set up is to calculate the 95
Usage
get.indiv(object, data = NULL, CI = 0.95, is.aggregate = FALSE,by = NULL, java_option = "-Xmx1g", ...)
Arguments
object Fitted "insilico" object.
data data for the fitted "insilico" object. The first column of the data should be theID that matches the "insilico" fitted model.
CI Credible interval for posterior estimates.
is.aggregate logical indicator for constructing aggregated distribution rather than individualdistributions.
by list of column names to group by.
java_option Option to initialize java JVM. Default to “-Xmx1g”, which sets the maximumheap size to be 1GB.
... Not used.
8 get.indiv
Value
mean individual mean COD distribution matrix.
median individual median COD distribution matrix.
lower individual lower bound for each COD probability.
upper individual upper bound for each COD probability.
Author(s)
Zehang Li, Tyler McCormick, Sam Clark
Maintainer: Zehang Li <[email protected]>
References
Tyler H. McCormick, Zehang R. Li, Clara Calvert, Amelia C. Crampin, Kathleen Kahn and SamuelJ. Clark Probabilistic cause-of-death assignment using verbal autopsies, arXiv preprint arXiv:1411.3042http://arxiv.org/abs/1411.3042 (2014)
See Also
insilico, updateIndiv, plot.insilico
Examples
## Not run:data(RandomVA1)fit1<- insilico(RandomVA1, subpop = NULL,
Nsim = 1000, burnin = 500, thin = 10 , seed = 1,auto.length = FALSE)
summary(fit1, id = "d199")
# Calculate aggregated COD distributionsagg.csmf <- get.indiv(data = RandomVA1, fit1, CI = 0.95,
is.aggregate = TRUE, by = NULL)head(agg.csmf)
agg.by.sex.age <- get.indiv(data = RandomVA1, fit1, CI = 0.95,is.aggregate = TRUE, by = list("sex", "age"))
head(agg.by.sex.age$mean)
## End(Not run)

indivplot 9
indivplot plot aggregated COD distribution
Description
Produce a bar plot of the aggregated COD distribution as approximate CSMFs for a fitted "insilico"object.
Usage
indivplot(x, type = c("errorbar", "bar")[1], top = 10, causelist = NULL,which.plot = NULL, xlab = "Causes", ylab = "COD distribution",title = "COD distributions for the top causes", horiz = TRUE,angle = 60, fill = "lightblue", err_width = 0.4, err_size = 0.6,point_size = 2, border = "black", bw = FALSE, ...)
Arguments
x object from get.indiv function.
type An indicator of the type of chart to plot. "errorbar" for line plots of only theerror bars on single population; "bar" for bar chart with error bars on singlepopulation.
top The number of top causes to plot. If multiple sub-populations are to be plotted,it will plot the union of the top causes in all sub-populations.
causelist The list of causes to plot. It could be a numeric vector indicating the positionof the causes in the InterVA cause list (see causetext), or a vector of characterstring of the cause names. The argument supports partial matching of the causenames. e.g., "HIV/AIDS related death" could be abbreviated into "HIV"; "Otherand unspecified infect dis" could be abbreviated into "Other and unspecifiedinfect".
which.plot Specification of which group to plot if there are multiple.
xlab Labels for the causes.
ylab Labels for the CSMF values.
title Title of the plot.
horiz Logical indicator indicating if the bars are plotted horizontally.
angle Angle of rotation for the texts on x axis when horiz is set to FALSE
fill The color to fill the bars when type is set to "bar".
err_width Size of the error bars.
err_size Thickness of the error bar lines.
point_size Size of the points.
border The color to color the borders of bars when type is set to "bar".
bw Logical indicator for setting the theme of the plots to be black and white.
... Not used.
10 indivplot
Author(s)
Zehang Li, Tyler McCormick, Sam Clark
Maintainer: Zehang Li <[email protected]>
References
Tyler H. McCormick, Zehang R. Li, Clara Calvert, Amelia C. Crampin, Kathleen Kahn and SamuelJ. Clark Probabilistic cause-of-death assignment using verbal autopsies, arXiv preprint arXiv:1411.3042http://arxiv.org/abs/1411.3042 (2014)
See Also
insilico, summary.insilico
Examples
## Not run:# Toy example with 1000 VA deathsdata(RandomVA1)fit1<- insilico(RandomVA1, subpop = NULL,
Nsim = 1000, burnin = 500, thin = 10 , seed = 1,auto.length = FALSE)
summary(fit1, id = "d199")
# update credible interval for individual probabilities to 90%indiv.new <- get.indiv(fit1, CI = 0.9)fit1$indiv.prob.lower <- indiv.new$lowerfit1$indiv.prob.upper <- indiv.new$upperfit1$indiv.CI <- 0.9summary(fit1, id = "d199")
# get empirical aggregated COD distributionagg.csmf <- get.indiv(data = RandomVA2, fit1, CI = 0.95,
is.aggregate = TRUE, by = NULL)head(agg.csmf)
# aggregate individual COD distribution by sex and age# note the model was fitted assuming the same CSMF for all deaths# this aggregation provides an approximate CSMF for each sub-groupsagg.by.sex.age <- get.indiv(data = RandomVA2, fit1, CI = 0.95,
is.aggregate = TRUE, by = list("sex", "age"))head(agg.by.sex.age$mean)
# plot of aggregated individual COD distribution# 0. plot for all dataindivplot(agg.csmf, top = 10)# 1. plot for specific one groupindivplot(agg.by.sex.age, which.plot = "Men 60-", top = 10)# 2. comparing multiple groups

insilico 11
indivplot(agg.by.sex.age, which.plot = list("Men 60+", "Men 60-"),top = 5)
# 3. comparing multiple groups on selected causesindivplot(agg.by.sex.age, which.plot = list("Men 60-", "Women 60-"),
top = 0, causelist = c("HIV/AIDS related death","Pulmonary tuberculosis","Other and unspecified infect dis","Other and unspecified NCD"))
## End(Not run)
insilico Implement InSilicoVA methods
Description
This function implements InSilicoVA model. The InSilicoVA model is fitted with MCMC imple-mented in Java. For more detail, see the paper on http://arxiv.org/abs/1411.3042.
Usage
insilico(data, data.type = c("WHO2012", "WHO2016")[1], isNumeric = FALSE,updateCondProb = TRUE, keepProbbase.level = TRUE, CondProb = NULL,CondProbNum = NULL, datacheck = TRUE, datacheck.missing = TRUE,warning.write = FALSE, external.sep = TRUE, Nsim = 4000, thin = 10,burnin = 2000, auto.length = TRUE, conv.csmf = 0.02, jump.scale = 0.1,levels.prior = NULL, levels.strength = 1, trunc.min = 1e-04,trunc.max = 0.9999, subpop = NULL, java_option = "-Xmx1g", seed = 1,phy.code = NULL, phy.cat = NULL, phy.unknown = NULL,phy.external = NULL, phy.debias = NULL, exclude.impossible.cause = TRUE,no.is.missing = FALSE, indiv.CI = NULL, groupcode = FALSE, ...)
Arguments
data The original data to be used. It is suggested to use similar input as InterVA4,with the first column being death IDs and 245 symptoms. The only differencein input is InsilicoVA takes three levels: “present”, “absent”, and “missing (nodata)”. Similar to InterVA software, “present” symptoms takes value “Y”; “ab-sent” symptoms take take value “NA” or “”. For missing symptoms, e.g., ques-tions not asked or answered in the original interview, corrupted data, etc., theinput should be coded by “.” to distinguish from “absent” category. The orderof the columns does not matter as long as the column names are correct. It canalso include more unused columns than the standard InterVA4 input. But the firstcolumn should be the death ID. For example input data format, see RandomVA1and RandomVA2.
data.type Type of questionnaire. “WHO2012” corresponds to the standard input of In-terVA4, and “WHO2016” corresponds to the standard input of InterVA5.
12 insilico
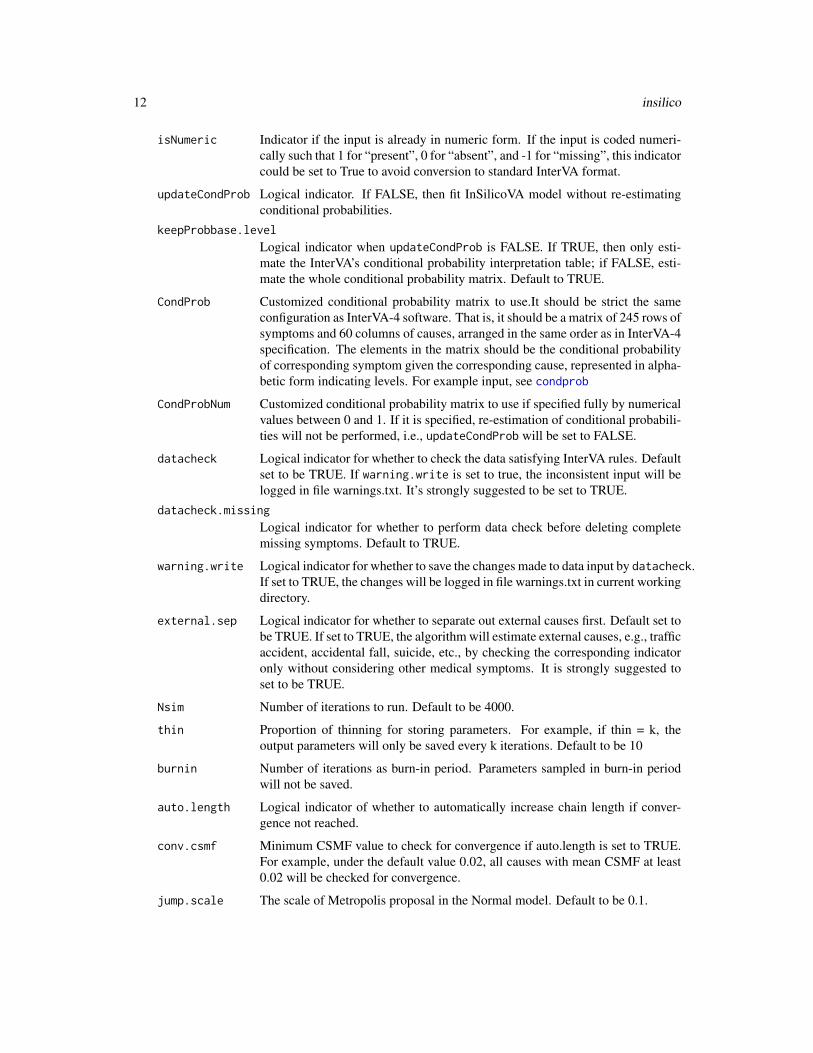
isNumeric Indicator if the input is already in numeric form. If the input is coded numeri-cally such that 1 for “present”, 0 for “absent”, and -1 for “missing”, this indicatorcould be set to True to avoid conversion to standard InterVA format.
updateCondProb Logical indicator. If FALSE, then fit InSilicoVA model without re-estimatingconditional probabilities.
keepProbbase.level
Logical indicator when updateCondProb is FALSE. If TRUE, then only esti-mate the InterVA’s conditional probability interpretation table; if FALSE, esti-mate the whole conditional probability matrix. Default to TRUE.
CondProb Customized conditional probability matrix to use.It should be strict the sameconfiguration as InterVA-4 software. That is, it should be a matrix of 245 rows ofsymptoms and 60 columns of causes, arranged in the same order as in InterVA-4specification. The elements in the matrix should be the conditional probabilityof corresponding symptom given the corresponding cause, represented in alpha-betic form indicating levels. For example input, see condprob
CondProbNum Customized conditional probability matrix to use if specified fully by numericalvalues between 0 and 1. If it is specified, re-estimation of conditional probabili-ties will not be performed, i.e., updateCondProb will be set to FALSE.
datacheck Logical indicator for whether to check the data satisfying InterVA rules. Defaultset to be TRUE. If warning.write is set to true, the inconsistent input will belogged in file warnings.txt. It’s strongly suggested to be set to TRUE.
datacheck.missing
Logical indicator for whether to perform data check before deleting completemissing symptoms. Default to TRUE.
warning.write Logical indicator for whether to save the changes made to data input by datacheck.If set to TRUE, the changes will be logged in file warnings.txt in current workingdirectory.
external.sep Logical indicator for whether to separate out external causes first. Default set tobe TRUE. If set to TRUE, the algorithm will estimate external causes, e.g., trafficaccident, accidental fall, suicide, etc., by checking the corresponding indicatoronly without considering other medical symptoms. It is strongly suggested toset to be TRUE.
Nsim Number of iterations to run. Default to be 4000.
thin Proportion of thinning for storing parameters. For example, if thin = k, theoutput parameters will only be saved every k iterations. Default to be 10
burnin Number of iterations as burn-in period. Parameters sampled in burn-in periodwill not be saved.
auto.length Logical indicator of whether to automatically increase chain length if conver-gence not reached.
conv.csmf Minimum CSMF value to check for convergence if auto.length is set to TRUE.For example, under the default value 0.02, all causes with mean CSMF at least0.02 will be checked for convergence.
jump.scale The scale of Metropolis proposal in the Normal model. Default to be 0.1.
insilico 13
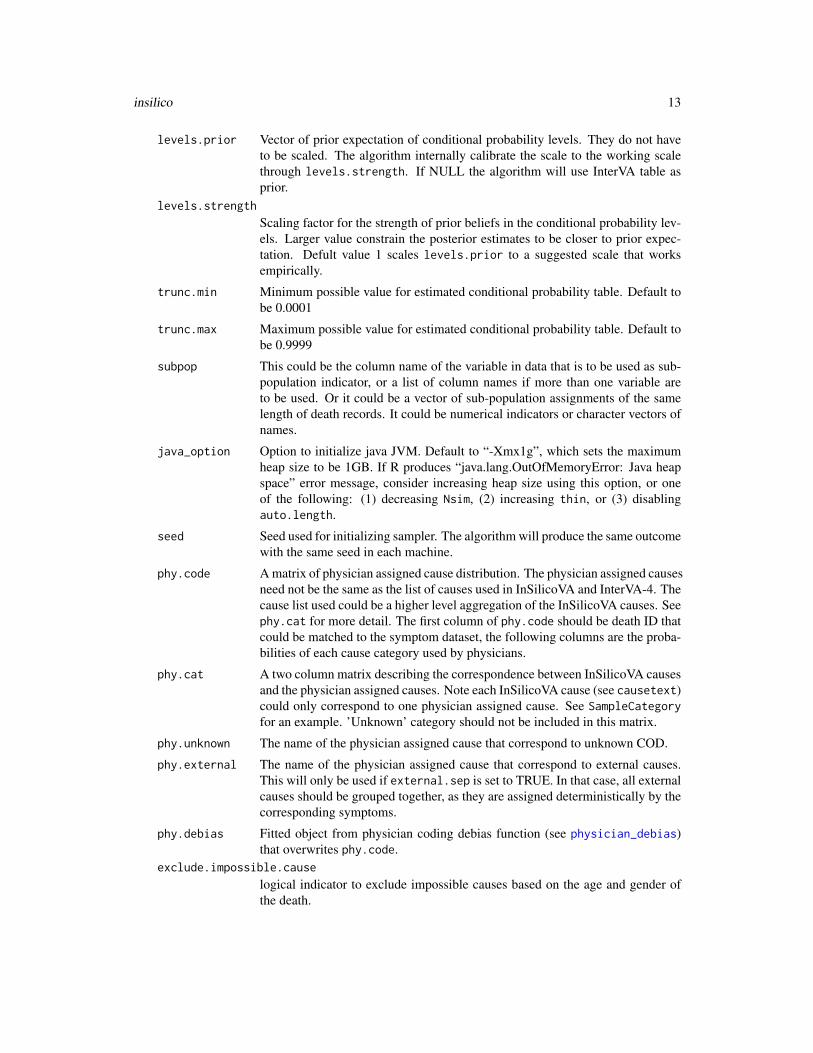
levels.prior Vector of prior expectation of conditional probability levels. They do not haveto be scaled. The algorithm internally calibrate the scale to the working scalethrough levels.strength. If NULL the algorithm will use InterVA table asprior.
levels.strength
Scaling factor for the strength of prior beliefs in the conditional probability lev-els. Larger value constrain the posterior estimates to be closer to prior expec-tation. Defult value 1 scales levels.prior to a suggested scale that worksempirically.
trunc.min Minimum possible value for estimated conditional probability table. Default tobe 0.0001
trunc.max Maximum possible value for estimated conditional probability table. Default tobe 0.9999
subpop This could be the column name of the variable in data that is to be used as sub-population indicator, or a list of column names if more than one variable areto be used. Or it could be a vector of sub-population assignments of the samelength of death records. It could be numerical indicators or character vectors ofnames.
java_option Option to initialize java JVM. Default to “-Xmx1g”, which sets the maximumheap size to be 1GB. If R produces “java.lang.OutOfMemoryError: Java heapspace” error message, consider increasing heap size using this option, or oneof the following: (1) decreasing Nsim, (2) increasing thin, or (3) disablingauto.length.
seed Seed used for initializing sampler. The algorithm will produce the same outcomewith the same seed in each machine.
phy.code A matrix of physician assigned cause distribution. The physician assigned causesneed not be the same as the list of causes used in InSilicoVA and InterVA-4. Thecause list used could be a higher level aggregation of the InSilicoVA causes. Seephy.cat for more detail. The first column of phy.code should be death ID thatcould be matched to the symptom dataset, the following columns are the proba-bilities of each cause category used by physicians.
phy.cat A two column matrix describing the correspondence between InSilicoVA causesand the physician assigned causes. Note each InSilicoVA cause (see causetext)could only correspond to one physician assigned cause. See SampleCategoryfor an example. ’Unknown’ category should not be included in this matrix.
phy.unknown The name of the physician assigned cause that correspond to unknown COD.
phy.external The name of the physician assigned cause that correspond to external causes.This will only be used if external.sep is set to TRUE. In that case, all externalcauses should be grouped together, as they are assigned deterministically by thecorresponding symptoms.
phy.debias Fitted object from physician coding debias function (see physician_debias)that overwrites phy.code.
exclude.impossible.cause
logical indicator to exclude impossible causes based on the age and gender ofthe death.
14 insilico
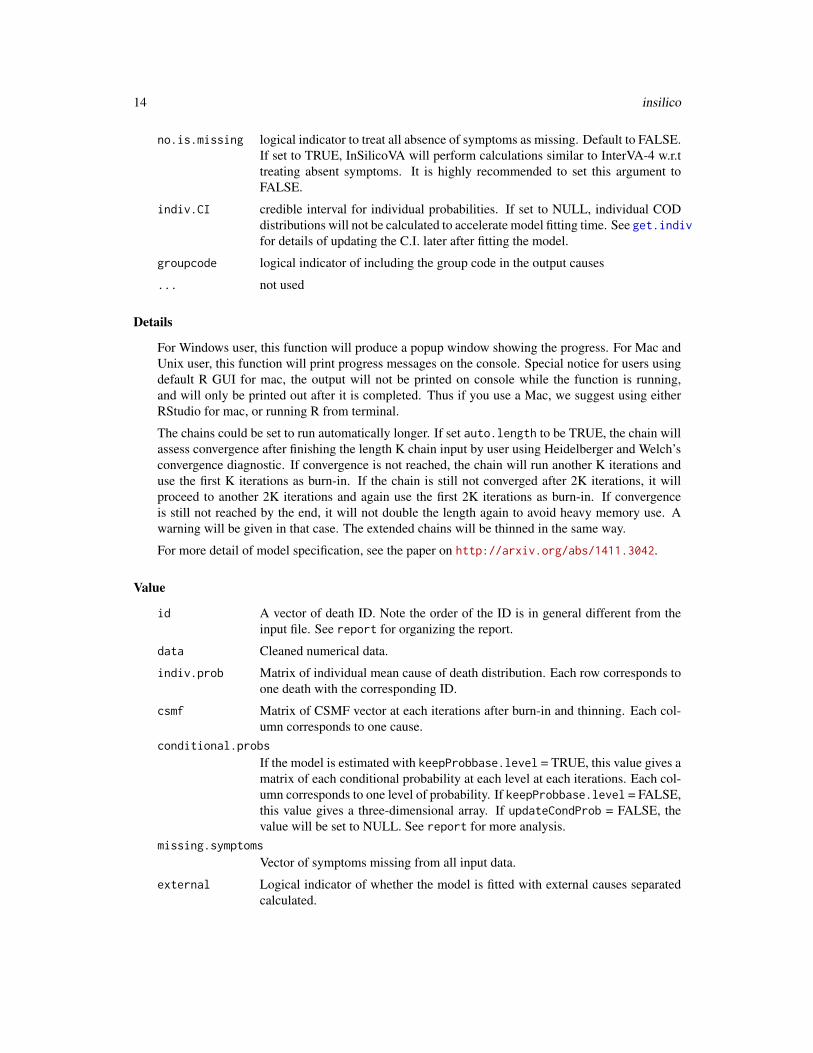
no.is.missing logical indicator to treat all absence of symptoms as missing. Default to FALSE.If set to TRUE, InSilicoVA will perform calculations similar to InterVA-4 w.r.ttreating absent symptoms. It is highly recommended to set this argument toFALSE.
indiv.CI credible interval for individual probabilities. If set to NULL, individual CODdistributions will not be calculated to accelerate model fitting time. See get.indivfor details of updating the C.I. later after fitting the model.
groupcode logical indicator of including the group code in the output causes
... not used
Details
For Windows user, this function will produce a popup window showing the progress. For Mac andUnix user, this function will print progress messages on the console. Special notice for users usingdefault R GUI for mac, the output will not be printed on console while the function is running,and will only be printed out after it is completed. Thus if you use a Mac, we suggest using eitherRStudio for mac, or running R from terminal.
The chains could be set to run automatically longer. If set auto.length to be TRUE, the chain willassess convergence after finishing the length K chain input by user using Heidelberger and Welch’sconvergence diagnostic. If convergence is not reached, the chain will run another K iterations anduse the first K iterations as burn-in. If the chain is still not converged after 2K iterations, it willproceed to another 2K iterations and again use the first 2K iterations as burn-in. If convergenceis still not reached by the end, it will not double the length again to avoid heavy memory use. Awarning will be given in that case. The extended chains will be thinned in the same way.
For more detail of model specification, see the paper on http://arxiv.org/abs/1411.3042.
Value
id A vector of death ID. Note the order of the ID is in general different from theinput file. See report for organizing the report.
data Cleaned numerical data.
indiv.prob Matrix of individual mean cause of death distribution. Each row corresponds toone death with the corresponding ID.
csmf Matrix of CSMF vector at each iterations after burn-in and thinning. Each col-umn corresponds to one cause.
conditional.probs
If the model is estimated with keepProbbase.level = TRUE, this value gives amatrix of each conditional probability at each level at each iterations. Each col-umn corresponds to one level of probability. If keepProbbase.level = FALSE,this value gives a three-dimensional array. If updateCondProb = FALSE, thevalue will be set to NULL. See report for more analysis.
missing.symptoms
Vector of symptoms missing from all input data.
external Logical indicator of whether the model is fitted with external causes separatedcalculated.

insilico 15
impossible.causes
Impossible cause-symptom pairs, if any.
indiv.CI The posterior credible interval to compute for individual COD probability dis-tributions. If set to NULL, only the posterior mean of the individual COD prob-abilities will be produced. Default to be 0.95.
indiv.prob.median
median probability of each cause of death for each individual death.indiv.prob.lower
lower CI bound for the probability of each cause of death for each individualdeath.
indiv.prob.upper
upper CI bound for the probability of each cause of death for each individualdeath.
errors Logs of deleted observations and reasons of deletion.
Author(s)
Zehang Li, Tyler McCormick, Sam Clark
Maintainer: Zehang Li <[email protected]>
References
Tyler H. McCormick, Zehang R. Li, Clara Calvert, Amelia C. Crampin, Kathleen Kahn and SamuelJ. Clark(2014) Probabilistic cause-of-death assignment using verbal autopsies, http://arxiv.org/abs/1411.3042Working paper no. 147, Center for Statistics and the Social Sciences, University of Washington
See Also
plot.insilico, summary.insilico, physician_debias
Examples
## Not run:data(RandomVA1)fit0<- insilico(RandomVA1, subpop = NULL,
Nsim = 20, burnin = 10, thin = 1 , seed = 1,auto.length = FALSE)
summary(fit0)summary(fit0, id = "d199")
#### Scenario 1: standard input without sub-population specification##fit1<- insilico(RandomVA1, subpop = NULL,
Nsim = 1000, burnin = 500, thin = 10 , seed = 1,auto.length = FALSE)
summary(fit1)plot(fit1)
16 insilico
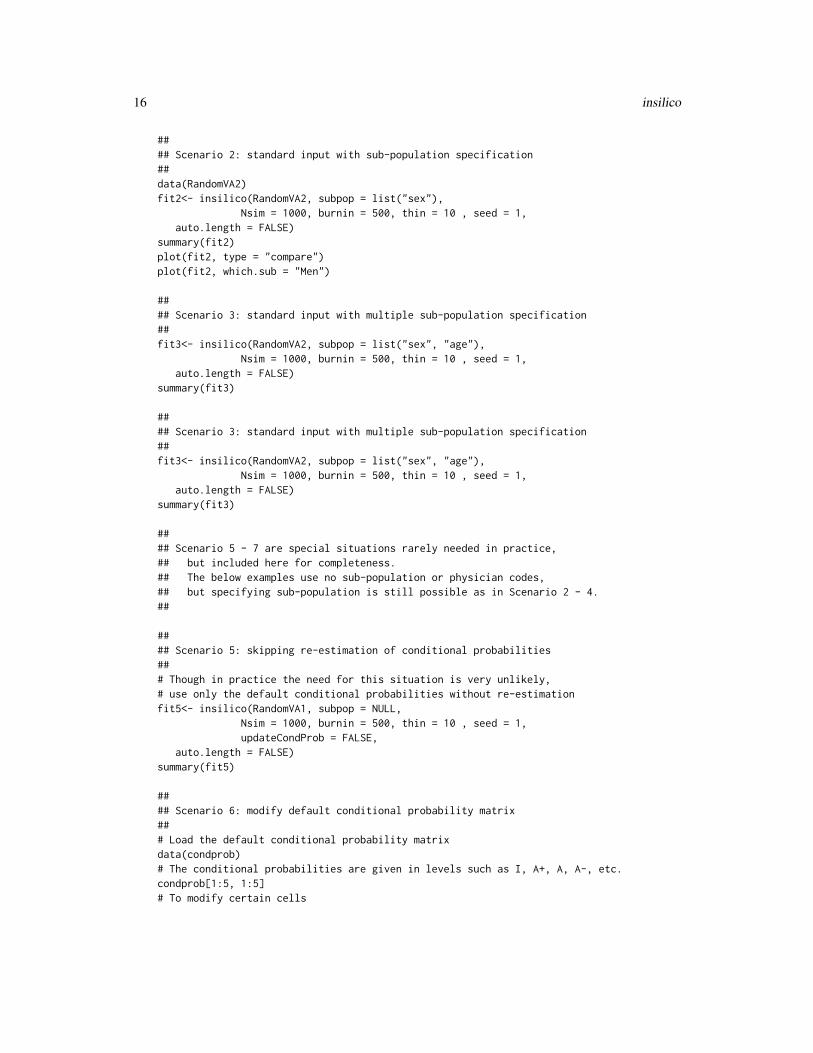
#### Scenario 2: standard input with sub-population specification##data(RandomVA2)fit2<- insilico(RandomVA2, subpop = list("sex"),
Nsim = 1000, burnin = 500, thin = 10 , seed = 1,auto.length = FALSE)
summary(fit2)plot(fit2, type = "compare")plot(fit2, which.sub = "Men")
#### Scenario 3: standard input with multiple sub-population specification##fit3<- insilico(RandomVA2, subpop = list("sex", "age"),
Nsim = 1000, burnin = 500, thin = 10 , seed = 1,auto.length = FALSE)
summary(fit3)
#### Scenario 3: standard input with multiple sub-population specification##fit3<- insilico(RandomVA2, subpop = list("sex", "age"),
Nsim = 1000, burnin = 500, thin = 10 , seed = 1,auto.length = FALSE)
summary(fit3)
#### Scenario 5 - 7 are special situations rarely needed in practice,## but included here for completeness.## The below examples use no sub-population or physician codes,## but specifying sub-population is still possible as in Scenario 2 - 4.##
#### Scenario 5: skipping re-estimation of conditional probabilities### Though in practice the need for this situation is very unlikely,# use only the default conditional probabilities without re-estimationfit5<- insilico(RandomVA1, subpop = NULL,
Nsim = 1000, burnin = 500, thin = 10 , seed = 1,updateCondProb = FALSE,
auto.length = FALSE)summary(fit5)
#### Scenario 6: modify default conditional probability matrix### Load the default conditional probability matrixdata(condprob)# The conditional probabilities are given in levels such as I, A+, A, A-, etc.condprob[1:5, 1:5]# To modify certain cells
insilico 17
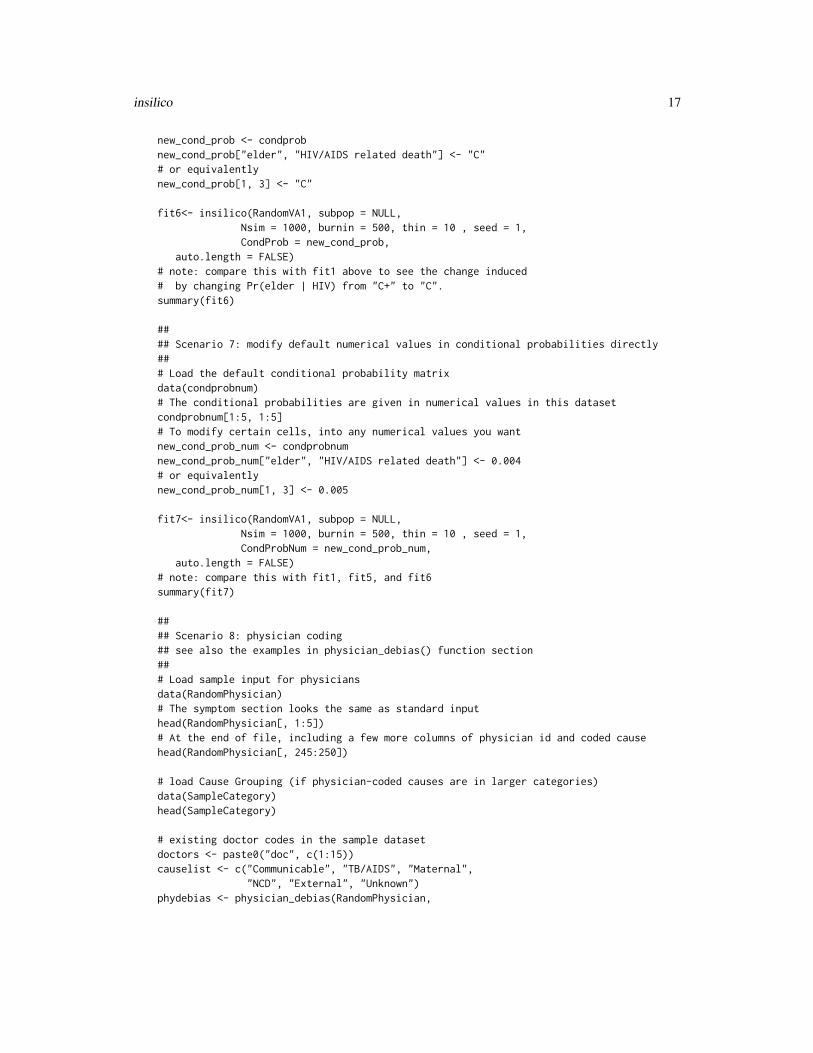
new_cond_prob <- condprobnew_cond_prob["elder", "HIV/AIDS related death"] <- "C"# or equivalentlynew_cond_prob[1, 3] <- "C"
fit6<- insilico(RandomVA1, subpop = NULL,Nsim = 1000, burnin = 500, thin = 10 , seed = 1,CondProb = new_cond_prob,
auto.length = FALSE)# note: compare this with fit1 above to see the change induced# by changing Pr(elder | HIV) from "C+" to "C".summary(fit6)
#### Scenario 7: modify default numerical values in conditional probabilities directly### Load the default conditional probability matrixdata(condprobnum)# The conditional probabilities are given in numerical values in this datasetcondprobnum[1:5, 1:5]# To modify certain cells, into any numerical values you wantnew_cond_prob_num <- condprobnumnew_cond_prob_num["elder", "HIV/AIDS related death"] <- 0.004# or equivalentlynew_cond_prob_num[1, 3] <- 0.005
fit7<- insilico(RandomVA1, subpop = NULL,Nsim = 1000, burnin = 500, thin = 10 , seed = 1,CondProbNum = new_cond_prob_num,
auto.length = FALSE)# note: compare this with fit1, fit5, and fit6summary(fit7)
#### Scenario 8: physician coding## see also the examples in physician_debias() function section### Load sample input for physiciansdata(RandomPhysician)# The symptom section looks the same as standard inputhead(RandomPhysician[, 1:5])# At the end of file, including a few more columns of physician id and coded causehead(RandomPhysician[, 245:250])
# load Cause Grouping (if physician-coded causes are in larger categories)data(SampleCategory)head(SampleCategory)
# existing doctor codes in the sample datasetdoctors <- paste0("doc", c(1:15))causelist <- c("Communicable", "TB/AIDS", "Maternal",
"NCD", "External", "Unknown")phydebias <- physician_debias(RandomPhysician,
18 insilico.fit
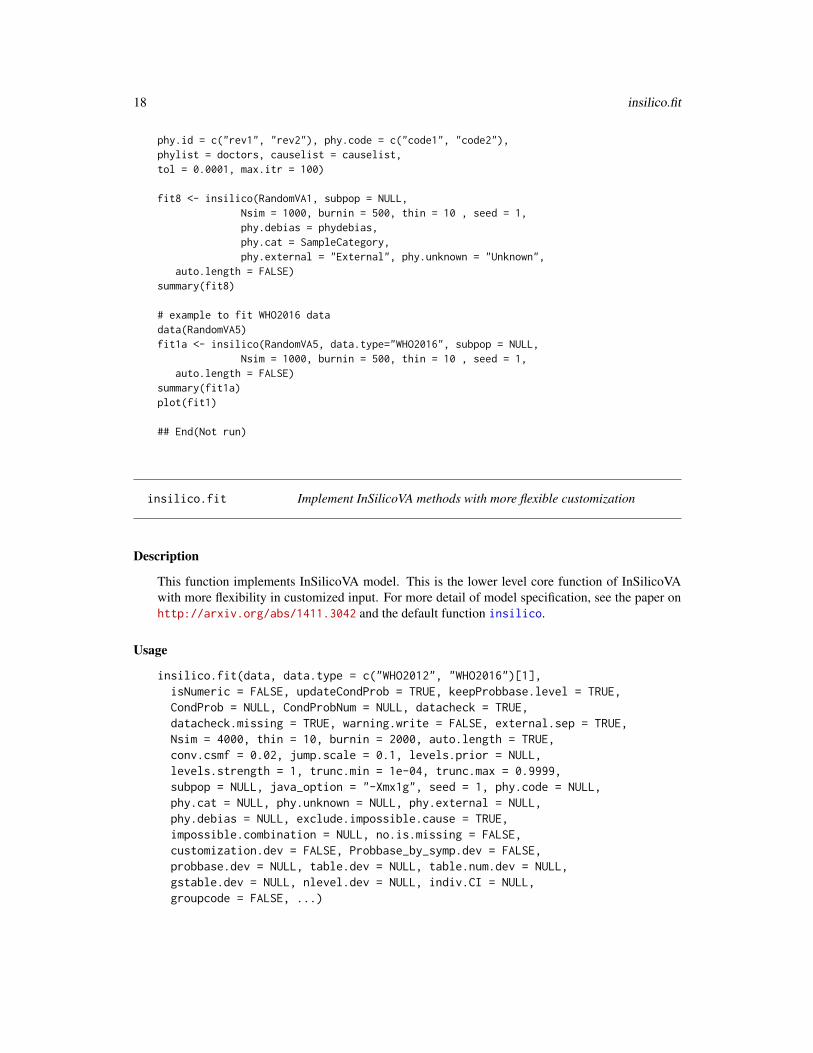
phy.id = c("rev1", "rev2"), phy.code = c("code1", "code2"),phylist = doctors, causelist = causelist,tol = 0.0001, max.itr = 100)
fit8 <- insilico(RandomVA1, subpop = NULL,Nsim = 1000, burnin = 500, thin = 10 , seed = 1,phy.debias = phydebias,phy.cat = SampleCategory,phy.external = "External", phy.unknown = "Unknown",
auto.length = FALSE)summary(fit8)
# example to fit WHO2016 datadata(RandomVA5)fit1a <- insilico(RandomVA5, data.type="WHO2016", subpop = NULL,
Nsim = 1000, burnin = 500, thin = 10 , seed = 1,auto.length = FALSE)
summary(fit1a)plot(fit1)
## End(Not run)
insilico.fit Implement InSilicoVA methods with more flexible customization
Description
This function implements InSilicoVA model. This is the lower level core function of InSilicoVAwith more flexibility in customized input. For more detail of model specification, see the paper onhttp://arxiv.org/abs/1411.3042 and the default function insilico.
Usage
insilico.fit(data, data.type = c("WHO2012", "WHO2016")[1],isNumeric = FALSE, updateCondProb = TRUE, keepProbbase.level = TRUE,CondProb = NULL, CondProbNum = NULL, datacheck = TRUE,datacheck.missing = TRUE, warning.write = FALSE, external.sep = TRUE,Nsim = 4000, thin = 10, burnin = 2000, auto.length = TRUE,conv.csmf = 0.02, jump.scale = 0.1, levels.prior = NULL,levels.strength = 1, trunc.min = 1e-04, trunc.max = 0.9999,subpop = NULL, java_option = "-Xmx1g", seed = 1, phy.code = NULL,phy.cat = NULL, phy.unknown = NULL, phy.external = NULL,phy.debias = NULL, exclude.impossible.cause = TRUE,impossible.combination = NULL, no.is.missing = FALSE,customization.dev = FALSE, Probbase_by_symp.dev = FALSE,probbase.dev = NULL, table.dev = NULL, table.num.dev = NULL,gstable.dev = NULL, nlevel.dev = NULL, indiv.CI = NULL,groupcode = FALSE, ...)

insilico.fit 19
Arguments
data see insilico
data.type see insilico
isNumeric see insilico
updateCondProb see insilico
keepProbbase.level
see insilico
CondProb see insilico
CondProbNum see insilico
datacheck see insilicodatacheck.missing
see insilico
warning.write see insilico
external.sep see insilico
Nsim see insilico
thin see insilico
burnin see insilico
auto.length see insilico
conv.csmf see insilico
jump.scale see insilico
levels.prior see insilico
levels.strength
see insilico
trunc.min see insilico
trunc.max see insilico
subpop see insilico
java_option see insilico
seed see insilico
phy.code see insilico
phy.cat see insilico
phy.unknown see insilico
phy.external see insilico
phy.debias see insilico
exclude.impossible.cause
see insilicoimpossible.combination
see insilico.train
no.is.missing see insilico
customization.dev
Logical indicator for customized variables

20 insilico.train
Probbase_by_symp.dev
Not tested yet.
probbase.dev The customized conditional probabilities of symptoms given causes, which couldbe in a different format than InterVA default, but it should consist of nlevel.devlevels rather than numerical values.
table.dev The table of level names in probbase.dev. Default to be NULL
table.num.dev The corresponding prior numerical values for each level in probbase.dev, inthe same order as table.dev. Default to be NULL
gstable.dev Table of gold standard causes for each death. Default to be NULL
nlevel.dev number of levels in probbase.dev. Default to be NULL
indiv.CI credible interval for individual probabilities
groupcode logical indicator of including the group code in the output causes
... unused arguments
Value
a insilico fit object, see see insilico for more detail.
Author(s)
Zehang Li, Tyler McCormick, Sam Clark
Maintainer: Zehang Li <[email protected]>
References
Tyler H. McCormick, Zehang R. Li, Clara Calvert, Amelia C. Crampin, Kathleen Kahn and SamuelJ. Clark(2014) Probabilistic cause-of-death assignment using verbal autopsies, http://arxiv.org/abs/1411.3042Working paper no. 147, Center for Statistics and the Social Sciences, University of Washington
See Also
plot.insilico, summary.insilico
insilico.train Modified InSilicoVA methods with training data
Description
This function implements InSilicoVA model with non-InterVA4 input data.
insilico.train 21
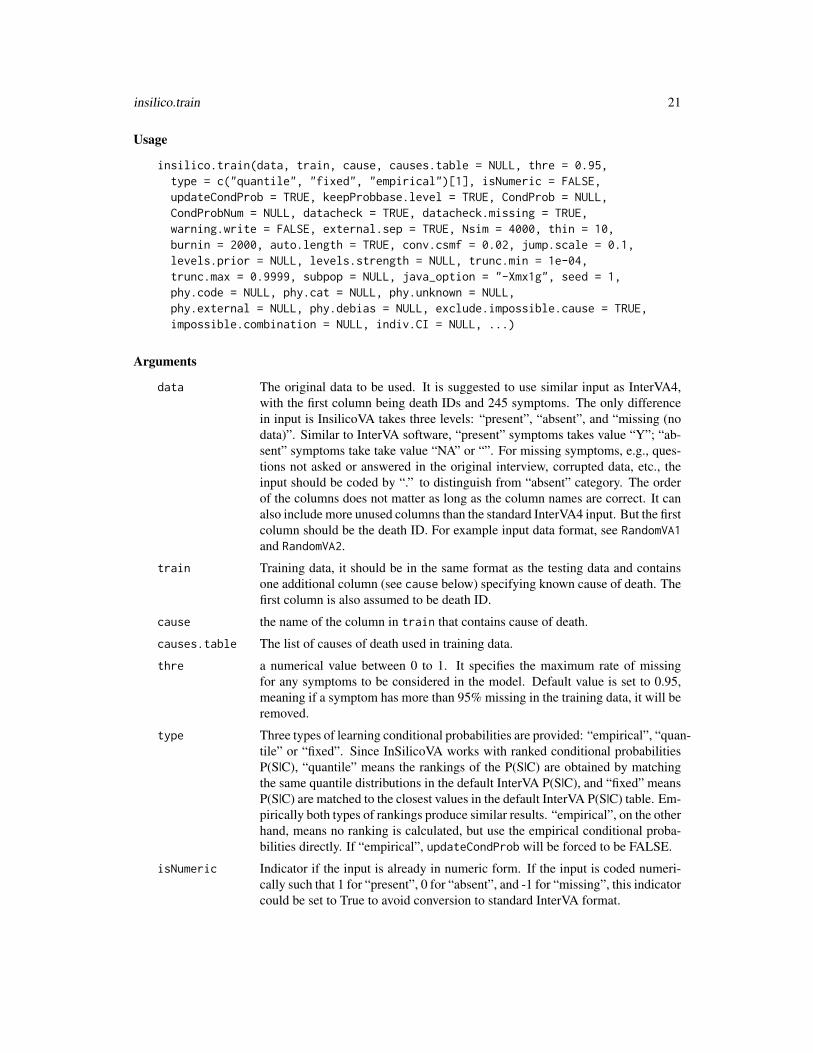
Usage
insilico.train(data, train, cause, causes.table = NULL, thre = 0.95,type = c("quantile", "fixed", "empirical")[1], isNumeric = FALSE,updateCondProb = TRUE, keepProbbase.level = TRUE, CondProb = NULL,CondProbNum = NULL, datacheck = TRUE, datacheck.missing = TRUE,warning.write = FALSE, external.sep = TRUE, Nsim = 4000, thin = 10,burnin = 2000, auto.length = TRUE, conv.csmf = 0.02, jump.scale = 0.1,levels.prior = NULL, levels.strength = NULL, trunc.min = 1e-04,trunc.max = 0.9999, subpop = NULL, java_option = "-Xmx1g", seed = 1,phy.code = NULL, phy.cat = NULL, phy.unknown = NULL,phy.external = NULL, phy.debias = NULL, exclude.impossible.cause = TRUE,impossible.combination = NULL, indiv.CI = NULL, ...)
Arguments
data The original data to be used. It is suggested to use similar input as InterVA4,with the first column being death IDs and 245 symptoms. The only differencein input is InsilicoVA takes three levels: “present”, “absent”, and “missing (nodata)”. Similar to InterVA software, “present” symptoms takes value “Y”; “ab-sent” symptoms take take value “NA” or “”. For missing symptoms, e.g., ques-tions not asked or answered in the original interview, corrupted data, etc., theinput should be coded by “.” to distinguish from “absent” category. The orderof the columns does not matter as long as the column names are correct. It canalso include more unused columns than the standard InterVA4 input. But the firstcolumn should be the death ID. For example input data format, see RandomVA1and RandomVA2.
train Training data, it should be in the same format as the testing data and containsone additional column (see cause below) specifying known cause of death. Thefirst column is also assumed to be death ID.
cause the name of the column in train that contains cause of death.
causes.table The list of causes of death used in training data.
thre a numerical value between 0 to 1. It specifies the maximum rate of missingfor any symptoms to be considered in the model. Default value is set to 0.95,meaning if a symptom has more than 95% missing in the training data, it will beremoved.
type Three types of learning conditional probabilities are provided: “empirical”, “quan-tile” or “fixed”. Since InSilicoVA works with ranked conditional probabilitiesP(S|C), “quantile” means the rankings of the P(S|C) are obtained by matchingthe same quantile distributions in the default InterVA P(S|C), and “fixed” meansP(S|C) are matched to the closest values in the default InterVA P(S|C) table. Em-pirically both types of rankings produce similar results. “empirical”, on the otherhand, means no ranking is calculated, but use the empirical conditional proba-bilities directly. If “empirical”, updateCondProb will be forced to be FALSE.
isNumeric Indicator if the input is already in numeric form. If the input is coded numeri-cally such that 1 for “present”, 0 for “absent”, and -1 for “missing”, this indicatorcould be set to True to avoid conversion to standard InterVA format.
22 insilico.train
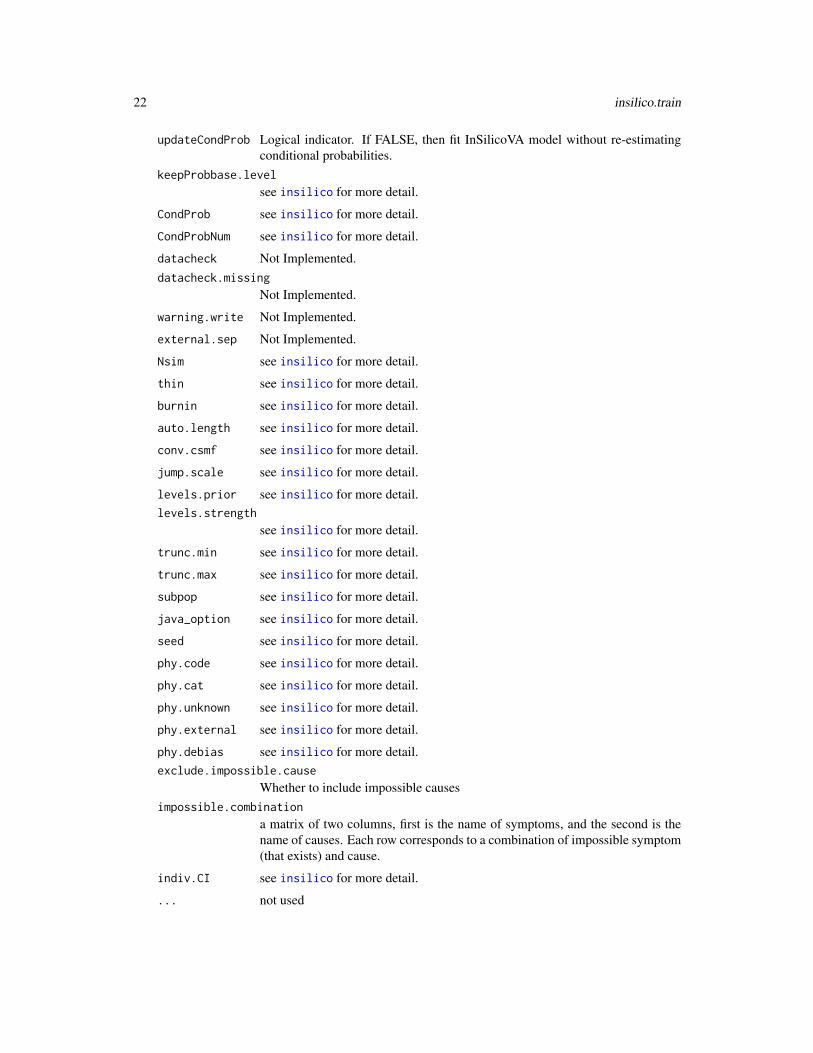
updateCondProb Logical indicator. If FALSE, then fit InSilicoVA model without re-estimatingconditional probabilities.
keepProbbase.level
see insilico for more detail.
CondProb see insilico for more detail.
CondProbNum see insilico for more detail.
datacheck Not Implemented.datacheck.missing
Not Implemented.
warning.write Not Implemented.
external.sep Not Implemented.
Nsim see insilico for more detail.
thin see insilico for more detail.
burnin see insilico for more detail.
auto.length see insilico for more detail.
conv.csmf see insilico for more detail.
jump.scale see insilico for more detail.
levels.prior see insilico for more detail.levels.strength
see insilico for more detail.
trunc.min see insilico for more detail.
trunc.max see insilico for more detail.
subpop see insilico for more detail.
java_option see insilico for more detail.
seed see insilico for more detail.
phy.code see insilico for more detail.
phy.cat see insilico for more detail.
phy.unknown see insilico for more detail.
phy.external see insilico for more detail.
phy.debias see insilico for more detail.exclude.impossible.cause
Whether to include impossible causesimpossible.combination
a matrix of two columns, first is the name of symptoms, and the second is thename of causes. Each row corresponds to a combination of impossible symptom(that exists) and cause.
indiv.CI see insilico for more detail.
... not used
physician_debias 23
Details
Please see insilico for more details about choosing chain length and OS system differences. Thisfunction implements InSilico with customized input format and training data.
For more detail of model specification, see the paper on http://arxiv.org/abs/1411.3042.
Value
insilico object
physician_debias Implement physician debias algorithm
Description
This function implements physician debias algorithm proposed in Salter-Townshend and Murphy(2013).
Usage
physician_debias(data, phy.id, phy.code, phylist, causelist, tol = 1e-04,max.itr = 5000, verbose = FALSE)
Arguments
data The original data to be used. It is suggested to use similar input as InterVA4,with the first column being death IDs. The only difference in input is InsilicoVAtakes three levels: “present”, “absent”, and “missing (no data)”. Similar to In-terVA software, “present” symptoms takes value “Y”; “absent” symptoms taketake value “NA” or “”. For missing symptoms, e.g., questions not asked or an-swered in the original interview, corrupted data, etc., the input should be codedby “.” to distinguish from “absent” category. The order of the columns doesnot matter as long as the column names are correct. Currently it cannot othernon-symptom columns such as subpopulation. And the first column should bethe death ID. Everything other than the death ID, physician ID, and physiciancodes should be symptoms.
phy.id vector of column names for physician ID
phy.code vector of column names for physician code
phylist vector of physician ID used in physician ID columns
causelist vector of causes used in physician code columns
tol tolerance of the EM algorithm
max.itr maximum iteration to run
verbose logical indicator for printing out likelihood change

24 plot.insilico
Value
code.debias Individual cause likelihood distribution
csmf Cause specific distribution in the sample
phy.bias Bias matrix for each physician
cond.prob Conditional probability of symptoms given causes
References
M. Salter-Townshend and T. B. Murphy (2013).Sentiment analysis of online media.In Algorithms from and for Nature and Life, pages 137-145, Springer.
Examples
data(RandomPhysician)head(RandomPhysician[, 1:10])## Not run:causelist <- c("Communicable", "TB/AIDS", "Maternal",
"NCD", "External", "Unknown")phydebias <- physician_debias(RandomPhysician, phy.id = c("rev1", "rev2"),phy.code = c("code1", "code2"), phylist = c("doc1", "doc2"),causelist = causelist, tol = 0.0001, max.itr = 5000)
# see the first physician's bias matrixround(phydebias$phy.bias[[1]], 2)
## End(Not run)
plot.insilico plot CSMF from a "insilico" object
Description
Produce a bar plot of the CSMFs for a fitted "insilico" object.
Usage
## S3 method for class 'insilico'plot(x, type = c("errorbar", "bar", "compare")[1],top = 10, causelist = NULL, which.sub = NULL, xlab = "Causes",ylab = "CSMF", title = "Top CSMF Distribution", horiz = TRUE,angle = 60, fill = "lightblue", err_width = 0.4, err_size = 0.6,point_size = 2, border = "black", bw = FALSE, ...)
plot.insilico 25
Arguments
x fitted "insilico" object
type An indicator of the type of chart to plot. "errorbar" for line plots of only theerror bars on single population; "bar" for bar chart with error bars on singlepopulation; "compare" for line charts on multiple sub-populations.
top The number of top causes to plot. If multiple sub-populations are to be plotted,it will plot the union of the top causes in all sub-populations.
causelist The list of causes to plot. It could be a numeric vector indicating the positionof the causes in the InterVA cause list (see causetext), or a vector of characterstring of the cause names. The argument supports partial matching of the causenames. e.g., "HIV/AIDS related death" could be abbreviated into "HIV"; "Otherand unspecified infect dis" could be abbreviated into "Other and unspecifiedinfect".
which.sub Specification of which sub-population to plot if there are multiple and type isset to "bar".
xlab Labels for the causes.
ylab Labels for the CSMF values.
title Title of the plot.
horiz Logical indicator indicating if the bars are plotted horizontally.
angle Angle of rotation for the texts on x axis when horiz is set to FALSE
fill The color to fill the bars when type is set to "bar".
err_width Size of the error bars.
err_size Thickness of the error bar lines.
point_size Size of the points.
border The color to color the borders of bars when type is set to "bar".
bw Logical indicator for setting the theme of the plots to be black and white.
... Not used.
Details
To-do
Author(s)
Zehang Li, Tyler McCormick, Sam Clark
Maintainer: Zehang Li <[email protected]>
References
Tyler H. McCormick, Zehang R. Li, Clara Calvert, Amelia C. Crampin, Kathleen Kahn and SamuelJ. Clark Probabilistic cause-of-death assignment using verbal autopsies, arXiv preprint arXiv:1411.3042http://arxiv.org/abs/1411.3042 (2014)
26 print.insilico
See Also
insilico, summary.insilico
Examples
## Not run:data(RandomVA1)#### Scenario 1: without sub-population specification##fit1<- insilico(RandomVA1, subpop = NULL,
Nsim = 1000, burnin = 500, thin = 10 , seed = 1,auto.length = FALSE)
# basic line plotplot(fit1)# basic bar plotplot(fit1, type = "bar")# line plot with customized lookplot(fit1, top = 15, horiz = FALSE, fill = "gold",
bw = TRUE, title = "Top 15 CSMFs", angle = 70,err_width = .2, err_size = .6, point_size = 2)
#### Scenario 2: with sub-population specification##data(RandomVA2)fit2<- insilico(RandomVA2, subpop = list("sex"),
Nsim = 1000, burnin = 500, thin = 10 , seed = 1,auto.length = FALSE)
summary(fit2)# basic side-by-side line plot for all sub-populationsplot(fit2, type = "compare", main = "Top 5 causes comparison")# basic line plot for specific sub-populationplot(fit2, which.sub = "Women", main = "Top 5 causes for women")# customized plot with only specified causes# the cause names need not be exact as InterVA cause list# substrings in InterVA cause list is enough for specification# e.g. the following two specifications are the samesome_causes_1 <- c("HIV/AIDS related death", "Pulmonary tuberculosis")some_causes_2 <- c("HIV", "Pulmonary")plot(fit2, type = "compare", horiz = FALSE, causelist = some_causes_1,
title = "HIV and TB fractions in two sub-populations",angle = 20)
## End(Not run)
print.insilico Print method for summarizing InSilicoVA Model Fits
print.insilico 27
Description
This function is the print method for class insilico.
Usage
## S3 method for class 'insilico'print(x, ...)
Arguments
x insilico object.
... not used
Author(s)
Zehang Li, Tyler McCormick, Sam Clark
Maintainer: Zehang Li <[email protected]>
References
Tyler H. McCormick, Zehang R. Li, Clara Calvert, Amelia C. Crampin, Kathleen Kahn and SamuelJ. Clark Probabilistic cause-of-death assignment using verbal autopsies, arXiv preprint arXiv:1411.3042http://arxiv.org/abs/1411.3042 (2014)
See Also
summary.insilico
Examples
## Not run:# load sample data together with sub-population listdata(RandomVA1)# extract InterVA style input datadata <- RandomVA1$data# extract sub-population information.# The groups are "HIV Positive", "HIV Negative" and "HIV status unknown".subpop <- RandomVA1$subpop
# run without subpopulationfit1<- insilico( data, subpop = NULL,
Nsim = 400, burnin = 200, thin = 10 , seed = 1,external.sep = TRUE, keepProbbase.level = TRUE)
fit1
## End(Not run)

28 print.insilico_summary
print.insilico_summary
Print method for summarizing InSilicoVA Model Fits
Description
This function is the print method for class insilico_summary.
Usage
## S3 method for class 'insilico_summary'print(x, ...)
Arguments
x insilico_summary object.
... not used
Author(s)
Zehang Li, Tyler McCormick, Sam Clark
Maintainer: Zehang Li <[email protected]>
References
Tyler H. McCormick, Zehang R. Li, Clara Calvert, Amelia C. Crampin, Kathleen Kahn and SamuelJ. Clark Probabilistic cause-of-death assignment using verbal autopsies, arXiv preprint arXiv:1411.3042http://arxiv.org/abs/1411.3042 (2014)
See Also
summary.insilico
Examples
## Not run:# load sample data together with sub-population listdata(RandomVA1)# extract InterVA style input datadata <- RandomVA1$data# extract sub-population information.# The groups are "HIV Positive", "HIV Negative" and "HIV status unknown".subpop <- RandomVA1$subpop
# run without subpopulationfit1<- insilico( data, subpop = NULL,
Nsim = 400, burnin = 200, thin = 10 , seed = 1,external.sep = TRUE, keepProbbase.level = TRUE)
probbase 29
summary(fit1)summary(fit1, top = 10)
# save individual COD distributions to filessummary(fit1, file = "results.csv")
## End(Not run)
probbase Conditional probability of InterVA4
Description
This is the table of conditional probabilities of symptoms given CODs, together with the data checkrules. The values are from InterVA-4.2.
Format
A data frame with 246 observations on 81 variables.
Examples
data(probbase)
probbase3 Conditional probability of InterVA4.03
Description
This is the table of conditional probabilities of symptoms given CODs. The values are fromInterVA-4.03.
Format
A data frame with 246 observations on 81 variables. Each observation is the conditional probability.
Examples
data(probbase)

30 RandomVA1
RandomPhysician 100 records of Sample Input together with two simulated physiciancodes
Description
This is the same dataset as in RandomVA2 with additional columns specifying physician ID andcodes.
Format
100 arbitrary input records.
Examples
data(RandomPhysician)head(RandomPhysician[, 1:10])
RandomVA1 1000 records of Sample Input
Description
This is a dataset consisting of 1000 arbitrary sample input deaths in the default format of InSilicoVA,i.e., the same input format as in InterVA-4 software and R package.
Format
1000 arbitrary input records.
Examples
data(RandomVA1)dim(RandomVA1)head(RandomVA1)

RandomVA2 31
RandomVA2 100 records of Sample Input
Description
This is a dataset consisting of 1000 arbitrary sample input deaths in the default format of InSilicoVAwith additional columns specifying age and sex, which could be served as characteristics in sub-population estimation.
Format
100 arbitrary input records.
Examples
data(RandomVA2)dim(RandomVA2)head(RandomVA2)
SampleCategory Correspondence between InterVA causes and the physician codedcause categories
Description
This is the matrix explaining the correspondence between InterVA causes and the physician codedcause categories.
Format
matrix of 2 columns
Examples
data(SampleCategory)head(SampleCategory)
32 stackplot
SamplePhysician 100 records of Sample debiased physician codes
Description
This is in the same format of the output running physician_debias. It is a data frame of 100 rows,and column represents ID and probability of the cause in each category.
Format
100 arbitrary input records.
Examples
data(SamplePhysician)head(SamplePhysician)
stackplot plot grouped CSMF from a "insilico" object
Description
Produce bar plot of the CSMFs for a fitted "insilico" object in broader groups.
Usage
stackplot(x, grouping = NULL, type = c("stack", "dodge")[1],order.group = NULL, order.sub = NULL, err = TRUE, CI = 0.95,sample.size.print = FALSE, xlab = "Group", ylab = "CSMF", ylim = NULL,title = "CSMF by broader cause categories", horiz = FALSE, angle = 60,err_width = 0.4, err_size = 0.6, point_size = 2, border = "black",bw = FALSE, ...)
Arguments
x fitted "insilico" object
grouping C by 2 matrix of grouping rule. If set to NULL, make it default.
type type of the plot to make
order.group list of grouped categories. If set to NULL, make it default.
order.sub Specification of the order of sub-populations to plot
err indicator of inclusion of error bars
CI confidence interval for error bars.
stackplot 33
sample.size.print
Logical indicator for printing also the sample size for each sub-population la-bels.
xlab Labels for the causes.
ylab Labels for the CSMF values.
ylim Range of y-axis.
title Title of the plot.
horiz Logical indicator indicating if the bars are plotted horizontally.
angle Angle of rotation for the texts on x axis when horiz is set to FALSE
err_width Size of the error bars.
err_size Thickness of the error bar lines.
point_size Size of the points.
border The color for the border of the bars.
bw Logical indicator for setting the theme of the plots to be black and white.
... Not used.
Author(s)
Zehang Li, Tyler McCormick, Sam Clark
Maintainer: Zehang Li <[email protected]>
References
Tyler H. McCormick, Zehang R. Li, Clara Calvert, Amelia C. Crampin, Kathleen Kahn and SamuelJ. Clark Probabilistic cause-of-death assignment using verbal autopsies, arXiv preprint arXiv:1411.3042http://arxiv.org/abs/1411.3042 (2014)
See Also
insilico, summary.insilico
Examples
data(RandomVA1)#### Scenario 1: without sub-population specification##fit1<- insilico(RandomVA1, subpop = NULL,
Nsim = 1000, burnin = 500, thin = 10 , seed = 1,auto.length = FALSE)
# stack bar plot for grouped causes# the default grouping could be seen fromdata(SampleCategory)stackplot(fit1, type = "dodge", xlab = "")
##
34 summary.insilico
## Scenario 2: with sub-population specification##data(RandomVA2)fit2<- insilico(RandomVA2, subpop = list("sex"),
Nsim = 1000, burnin = 500, thin = 10 , seed = 1,auto.length = FALSE)
stackplot(fit2, type = "stack", angle = 0)stackplot(fit2, type = "dodge", angle = 0)# Change the default grouping by separating TB from HIVdata(SampleCategory)SampleCategory[c(3, 9), ]SampleCategory[3, 2] <- "HIV/AIDS"SampleCategory[9, 2] <- "TB"stackplot(fit2, type = "stack", grouping = SampleCategory,
sample.size.print = TRUE, angle = 0)stackplot(fit2, type = "dodge", grouping = SampleCategory,
sample.size.print = TRUE, angle = 0)
# change the order of display for sub-population and cause groupsgroups <- c("HIV/AIDS", "TB", "Communicable", "NCD", "External",
"Maternal", "causes specific to infancy")subpops <- c("Women", "Men")stackplot(fit2, type = "stack", grouping = SampleCategory,
order.group = groups, order.sub = subpops,sample.size.print = TRUE, angle = 0)
summary.insilico Summarizing InSilicoVA Model Fits
Description
This function is the summary method for class insilico.
Usage
## S3 method for class 'insilico'summary(object, CI.csmf = 0.95, CI.cond = 0.95,file = NULL, top = 10, id = NULL, ...)
Arguments
object Fitted "insilico" object.CI.csmf Confidence interval for CSMF estimates.CI.cond Confidence interval for conditional probability estimatesfile Optional .csv file to write to. If it is specified, individual cause of death distri-
bution will be saved to the file.top Number of top causes to display on screen.id ID of specific death to display on screen.... Not used.

summary.insilico 35
Details
summary.insilico formats some basic information about the InSilicoVA fitted object on screenand show the several top CSMFs of user’s choice. See below for more detail.
Value
id.all all IDs of the deaths.
indiv individual Cause of Death distribution matrix.
csmf CSMF distribution and confidence interval for each cause.
csmf.ordered CSMF distribution and confidence interval for each cause, ordered by mean.
condprob Conditional probability matrix and confidence intervals.
updateCondProb Component of "insilico" object.keepProbbase.level
Component of "insilico" object.
datacheck Component of "insilico" object.
Nsim Component of "insilico" object.
thin Component of "insilico" object.
burnin Component of "insilico" object.
jump.scale Component of "insilico" object.
levels.prior Component of "insilico" object.levels.strength
Component of "insilico" object.
trunc.min Component of "insilico" object.
trunc.max Component of "insilico" object.
subpop_counts Component of "insilico" object.
showTop Component of "insilico" object.
Author(s)
Zehang Li, Tyler McCormick, Sam Clark
Maintainer: Zehang Li <[email protected]>
References
Tyler H. McCormick, Zehang R. Li, Clara Calvert, Amelia C. Crampin, Kathleen Kahn and SamuelJ. Clark Probabilistic cause-of-death assignment using verbal autopsies, arXiv preprint arXiv:1411.3042http://arxiv.org/abs/1411.3042 (2014)
See Also
insilico, plot.insilico
36 updateIndiv
Examples
## Not run:# load sample data together with sub-population listdata(RandomVA1)# extract InterVA style input datadata <- RandomVA1$data# extract sub-population information.# The groups are "HIV Positive", "HIV Negative" and "HIV status unknown".subpop <- RandomVA1$subpop
# run without subpopulationfit1<- insilico( data, subpop = NULL,
Nsim = 400, burnin = 200, thin = 10 , seed = 1,external.sep = TRUE, keepProbbase.level = TRUE)
summary(fit1)summary(fit1, top = 10)
# save individual COD distributions to filessummary(fit1, file = "results.csv")
## End(Not run)
updateIndiv Update individual COD probabilities from InSilicoVA Model Fits
Description
This function updates individual probabilities for each death and provide posterior credible intervalsfor each estimates.
Usage
updateIndiv(object, CI = 0.95, java_option = "-Xmx1g", ...)
Arguments
object Fitted "insilico" object.
CI Credible interval for posterior estimates.
java_option Option to initialize java JVM. Default to “-Xmx1g”, which sets the maximumheap size to be 1GB.
... Not used.
Value
object Updated "insilico" object.
updateIndiv 37
Author(s)
Zehang Li, Tyler McCormick, Sam Clark
Maintainer: Zehang Li <[email protected]>
References
Tyler H. McCormick, Zehang R. Li, Clara Calvert, Amelia C. Crampin, Kathleen Kahn and SamuelJ. Clark Probabilistic cause-of-death assignment using verbal autopsies, arXiv preprint arXiv:1411.3042http://arxiv.org/abs/1411.3042 (2014)
See Also
insilico, get.indiv
Examples
## Not run:data(RandomVA1)fit1a<- insilico(RandomVA1, subpop = NULL,
Nsim = 1000, burnin = 500, thin = 10 , seed = 1,auto.length = FALSE)
summary(fit1a, id = "d199")
# The following script updates credible interval for individualfit1b <- updateIndiv(fit1a, CI = 0.95)summary(fit1b, id = "d199")
## End(Not run)
Index
∗Topic InSilicoVAcsmf.diag, 4indivplot, 9insilico, 11insilico.fit, 18InsilicoVA-package, 2plot.insilico, 24stackplot, 32
∗Topic datasetscausetext, 3condprob, 3condprobnum, 3probbase, 29probbase3, 29RandomPhysician, 30RandomVA1, 30RandomVA2, 31SampleCategory, 31SamplePhysician, 32
causetext, 3, 9, 25condprob, 3, 12condprobnum, 3csmf.diag, 4
extract.prob, 6
gelman.diag, 4get.indiv, 7, 14, 37
heidel.diag, 4
indivplot, 9insilico, 5, 8, 10, 11, 18–20, 22, 26, 33, 35,
37insilico.fit, 18insilico.train, 19, 20InsilicoVA (InsilicoVA-package), 2InsilicoVA-package, 2
physician_debias, 13, 15, 23, 32
plot.insilico, 8, 15, 20, 24, 35print.insilico, 26print.insilico_summary, 28probbase, 29probbase3, 29
RandomPhysician, 30RandomVA1, 30RandomVA2, 31
SampleCategory, 31SamplePhysician, 32stackplot, 32summary.insilico, 5, 10, 15, 20, 26–28, 33,
34
updateIndiv, 8, 36
38