Embed Size (px)
Citation preview
Package ‘UPMASK’February 1, 2019
Type Package
Title Unsupervised Photometric Membership Assignment in StellarClusters
Version 1.2
Date 2019-01-28
Maintainer Alberto Krone-Martins <[email protected]>
Description An implementation of the UPMASK method for performing membershipassignment in stellar clusters in R. It is prepared to use photometry andspatial positions, but it can take into account other types of data. Themethod is able to take into account arbitrary error models, and it isunsupervised, data-driven, physical-model-free and relies on as fewassumptions as possible. The approach followed for membership assessment isbased on an iterative process, dimensionality reduction, a clusteringalgorithm and a kernel density estimation.
Depends R (>= 3.0)
License GPL (>= 3)
Imports parallel, MASS, RSQLite, DBI, dimRed, loe
NeedsCompilation no
RoxygenNote 6.0.1
Author Alberto Krone-Martins [aut, cre],Andre Moitinho [aut],Eduardo Bezerra [ctb],Leonardo Lima [ctb],Tristan Cantat-Gaudin [ctb]
Repository CRAN
Date/Publication 2019-02-01 17:43:33 UTC
R topics documented:UPMASK-package . . . . . . . . . . . . . . . . . . . . . . . . . . . . . . . . . . . . . 2analyse_randomKde2d . . . . . . . . . . . . . . . . . . . . . . . . . . . . . . . . . . . 4
1
2 UPMASK-package
analyse_randomKde2d_AutoCalibrated . . . . . . . . . . . . . . . . . . . . . . . . . . 5analyse_randomKde2d_smart . . . . . . . . . . . . . . . . . . . . . . . . . . . . . . . . 6create_randomKde2d . . . . . . . . . . . . . . . . . . . . . . . . . . . . . . . . . . . . 7create_smartTable . . . . . . . . . . . . . . . . . . . . . . . . . . . . . . . . . . . . . . 8getStarsAtHighestDensityRegion . . . . . . . . . . . . . . . . . . . . . . . . . . . . . . 9innerLoop . . . . . . . . . . . . . . . . . . . . . . . . . . . . . . . . . . . . . . . . . . 10kde2dForSubset . . . . . . . . . . . . . . . . . . . . . . . . . . . . . . . . . . . . . . . 12meanThreeSigRej . . . . . . . . . . . . . . . . . . . . . . . . . . . . . . . . . . . . . . 13outerLoop . . . . . . . . . . . . . . . . . . . . . . . . . . . . . . . . . . . . . . . . . . 14performCuts . . . . . . . . . . . . . . . . . . . . . . . . . . . . . . . . . . . . . . . . . 16takeErrorsIntoAccount . . . . . . . . . . . . . . . . . . . . . . . . . . . . . . . . . . . 17UPMASKdata . . . . . . . . . . . . . . . . . . . . . . . . . . . . . . . . . . . . . . . . 18UPMASKfile . . . . . . . . . . . . . . . . . . . . . . . . . . . . . . . . . . . . . . . . 20
Index 23
UPMASK-package Unsupervised Photometric Membership Assignment in Stellar Clus-ters
Description
An implementation of the UPMASK method for performing membership assignment in stellar clus-ters in R. It is prepared to use photometry and spatial positions, but it can take into account othertypes of data. The method is able to take into account arbitrary error models, and it is unsupervised,data-driven, physical-model-free and relies on as few assumptions as possible. The approach fol-lowed for membership assessment is based on an iterative process, principal component analysis, aclustering algorithm and a kernel density estimation.
Details
Package: UPMASKType: PackageVersion: 1.2Date: 2017-06-09License: GPL (>= 3)
UPMASK-package 3
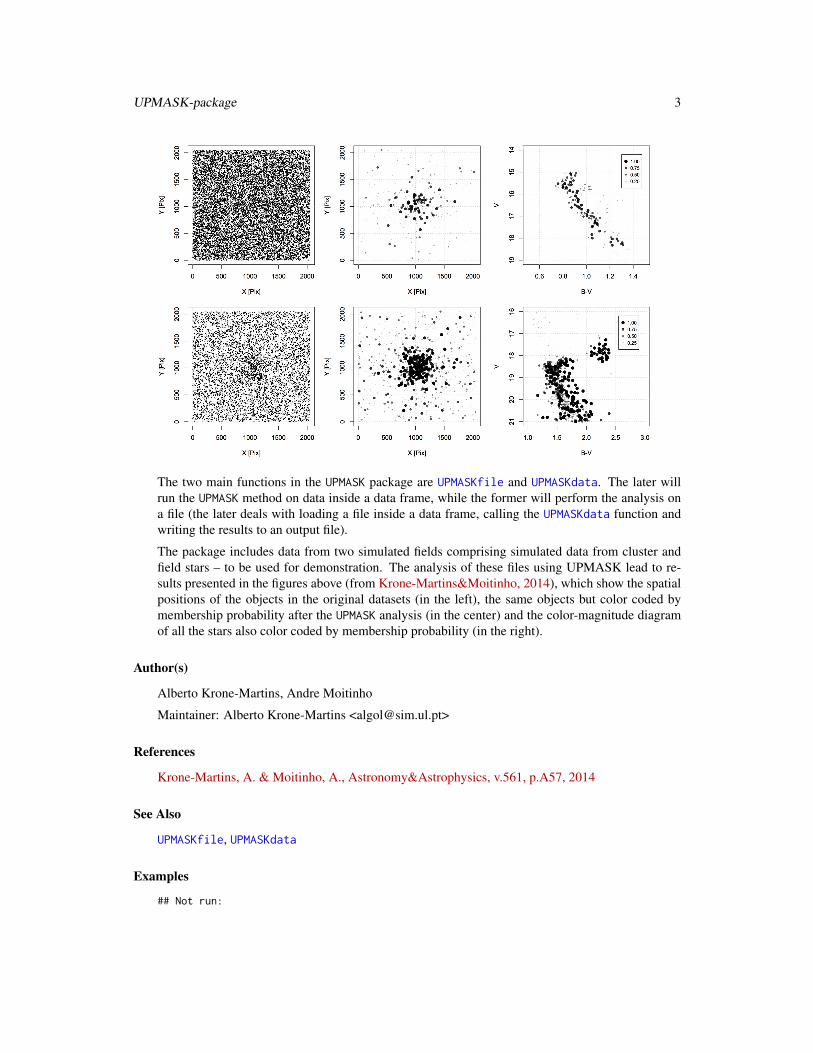
The two main functions in the UPMASK package are UPMASKfile and UPMASKdata. The later willrun the UPMASK method on data inside a data frame, while the former will perform the analysis ona file (the later deals with loading a file inside a data frame, calling the UPMASKdata function andwriting the results to an output file).
The package includes data from two simulated fields comprising simulated data from cluster andfield stars – to be used for demonstration. The analysis of these files using UPMASK lead to re-sults presented in the figures above (from Krone-Martins&Moitinho, 2014), which show the spatialpositions of the objects in the original datasets (in the left), the same objects but color coded bymembership probability after the UPMASK analysis (in the center) and the color-magnitude diagramof all the stars also color coded by membership probability (in the right).
Author(s)
Alberto Krone-Martins, Andre Moitinho
Maintainer: Alberto Krone-Martins <[email protected]>
References
Krone-Martins, A. & Moitinho, A., Astronomy&Astrophysics, v.561, p.A57, 2014
See Also
UPMASKfile, UPMASKdata
Examples
## Not run:
4 analyse_randomKde2d
## Example of how to run UPMASK using data from a file# Note: serious analysis require larger nRuns, and see UPMASKfile documentation# for the parametrization.# Write a string with the filename of the input and output filesinputFileName <- system.file("extdata",
"oc_12_500_1000_1.0_p019_0880_1_25km_120nR_withcolors.dat", package="UPMASK")outputFileName <- file.path(tempdir(), "RESULTS.dat")# Run UPMASKUPMASKfile(inputFileName, outputFileName, nRuns=5, starsPerClust_kmeans=25,
verbose=TRUE, fileWithHeader=TRUE)# Done, the results are written to the file outputFileName
## Example of how to run UPMASK using data from a data frame# Note: serious analysis require larger nRuns, and see UPMASKdata documentation# for the parametrization.# Load the data into a data frameinputFileName <- system.file("extdata",
"oc_12_5000_4000_4.0_p019_0900_1_15km_120nR_withcolors.dat", package="UPMASK")ocData <- read.table(inputFileName, header=TRUE)# Run UPMASKupmaskRes <- UPMASKdata(ocData, nRuns=5, starsPerClust_kmeans=25, verbose=TRUE)# Done, the results are in the data frame upmaskRes
# Clean the environmentrm(list=c("inputFileName","outputFileName","ocData","upmaskRes"))
## End(Not run)
analyse_randomKde2d Perform analysis of random 2d distributions
Description
analyse_randomKde2d will compute statistics from uniformly randomly created 2D fields basedon Kernel Density Estimations (calling the code create_randomKde2d).
Usage
analyse_randomKde2d(nfields=100, nstars, maxX, maxY, nKde=50,showStats=FALSE, returnStats=TRUE)
Arguments
nfields an integer with the number of individual field realisations
nstars an integer with the number of stars to consider
maxX the length of the field in X
maxY the length of the field in Y
analyse_randomKde2d_AutoCalibrated 5
nKde the number of samplings of the kernel in each direction
showStats a boolean indicating if the user wants to see statistics
returnStats a boolean indicating if the user wants statistics to be returned
Value
A data frame with the mean and sd fields containing the results of the random field analysis.
Author(s)
Alberto Krone-Martins, Andre Moitinho
Examples
# Runs the analysis on random fieldstoyRes <- analyse_randomKde2d(100, 200, 100, 100, showStats=TRUE)
# Clean the environmentrm(toyRes)
analyse_randomKde2d_AutoCalibrated
Perform analysis of random 2d distributions (auto calibrated)
Description
The experimental code analyse_randomKde2d_AutoCalibrated computes statistics from uni-formly randomly created 2D fields based on kernel density estimations (using create_randomKde2d).It runs for as many interations as necessary for the statistical measuremnt stabilize (but it will abortafter maxIter iterations is reached).
Usage
analyse_randomKde2d_AutoCalibrated(nstars, maxX, maxY, nKde=50, maxIter=40,showStats=FALSE, returnStats=TRUE)
Arguments
nstars an integer with the number of stars to consider
maxX the length of the field in X
maxY the length of the field in Y
nKde the number of samplings of the kernel in each direction
maxIter an integer with the maximum number of iterations
showStats a boolean indicating if the user wants to see statistics
returnStats a boolean indicating if the user wants statistics to be returned
6 analyse_randomKde2d_smart
Value
A data frame with the mean and sd fields containing the results of the random field analysis.
Author(s)
Alberto Krone-Martins, Andre Moitinho
Examples
# Runs the analysis on random fieldstoyRes <- analyse_randomKde2d_AutoCalibrated(100, 100, 100, 100, showStats=TRUE)
# Clean the environmentrm(toyRes)
analyse_randomKde2d_smart
Perform analysis of random 2d distributions
Description
analyse_randomKde2d_smart will compute statistics from uniformly randomly created 2D fieldsbased on Kernel Density Estimations (calling the code analyse_randomKde2d). However, if arandom field using the same number of stars was already computed in this run of UPMASK, it willavoid computing it again and will return the value that is stored in a SQLite database table. If therandom field was not yet analysed, it will run the analysis, store the result in the database table, andreturn the value.
Usage
analyse_randomKde2d_smart(nfields=100, nstars, maxX, maxY, nKde=50,showStats=FALSE, returnStats=TRUE, smartTableDB)
Arguments
nfields an integer with the number of individual field realisations
nstars an integer with the number of stars to consider
maxX the length of the field in X
maxY the length of the field in Y
nKde the number of samplings of the kernel in each direction
showStats a boolean indicating if the user wants to see statistics
returnStats a boolean indicating if the user wants statistics to be returned
smartTableDB a database connection to the smart look-up table
create_randomKde2d 7
Value
A data frame with the mean and sd fields containing the results of the random field analysis.
Author(s)
Alberto Krone-Martins, Andre Moitinho
Examples
# Create the smart look-up tablelibrary(RSQLite)stcon <- create_smartTable()
# Runs the analysis on random fieldssystem.time(toyRes1 <- analyse_randomKde2d_smart(300, 200, 100, 100, smartTableDB=stcon)) # slowsystem.time(toyRes2 <- analyse_randomKde2d_smart(300, 200, 100, 100, smartTableDB=stcon)) # quick
# Clean the environmentrm(list=c("toyRes1", "toyRes2"))dbDisconnect(stcon)
create_randomKde2d Compute the density based distance quantity using a 2D Kernel Den-sity Estimation
Description
create_randomKde2d will compute the 2D Kernel Density Estimation for a random sampling ofthe requested number of points and will return the quantiy (max(d)-mean(d))/sd(d), if the optionreturnDistance is set to TRUE.
Usage
create_randomKde2d(nstars, maxX, maxY, nKde=50, printPlots=FALSE,showStats=FALSE, returnDistance=FALSE)
Arguments
nstars an integer with the number of stars to considermaxX the length of the field in XmaxY the length of the field in YnKde the number of samplings of the kernel in each directionprintPlots a boolean indicating if the user wants to see plotsshowStats a boolean indicating if the user wants to see statisticsreturnDistance a boolean indicating if the user wants statistics to be returned
8 create_smartTable
Value
A double representing the density based distance quantity.
Author(s)
Alberto Krone-Martins, Andre Moitinho
References
Krone-Martins, A. & Moitinho, A., A&A, v.561, p.A57, 2014
Examples
# Compute the density based distance quantity with random fieldsdistVar <- create_randomKde2d(100, 10, 10, showStats=FALSE,
printPlots=FALSE, returnDistance=TRUE)
# Clean the environmentrm(distVar)
create_smartTable Create a look up table
Description
create_smartTable will create a look up table for random field analysis inside an SQLite database.The table is automatically filled each time UPMASK calls the function analyse_randomKde2d_smart.
Usage
create_smartTable()
Value
A data base connection to the SQLite database containing the smartTable.
Author(s)
Alberto Krone-Martins, Andre Moitinho
Examples
# Create the tablelibrary(RSQLite)stcon <- create_smartTable()
# Clean the environmentdbDisconnect(stcon)
getStarsAtHighestDensityRegion 9
getStarsAtHighestDensityRegion
Perform cut in the membership list based on the 2D space distribution
Description
getStarsAtHighestDensityRegion will compute the 2D Kernel Density Estimation for the re-quested subset of data and will return only the stars in the most dense region.
Usage
getStarsAtHighestDensityRegion(ocdata_out, threshold=2, posIdx=c(1,2),plotAnalysis=FALSE, verbose=FALSE)
Arguments
ocdata_out a data frame to use
threshold a double with the thresholding level
posIdx an array of integers indicating the columns of the data frame containing thespatial positions
plotAnalysis a boolean indicating if the anaylsis should be plotted
verbose a boolean indicating if the code should be verbose
Value
A data frame with the objects which were selected from ocdata_out
Author(s)
Alberto Krone-Martins, Andre Moitinho
Examples
# Create a simple data settoyDataDF <- data.frame(x=runif(50, 0, 10), y=runif(50, 0, 10), resMclust.class=rep(1, 50))toyDataDF <- rbind(toyDataDF, data.frame(x=rnorm(50, 2, 3),
y=rnorm(50, 4, 3), resMclust.class=rep(1, 50)))
# Perform the XY density based cuttoyRes <- getStarsAtHighestDensityRegion(toyDataDF)
# Clean the environmentrm(list=c("toyDataDF", "toyRes"))
10 innerLoop
innerLoop UPMASK inner loop
Description
innerLoop executes the UPMASK method’s inner loop and returns the stars which were consideredas cluster member stars.
The innerLoop perform the PCA, runs the clustering algorithm and check for overdensities in thespatial distribution for the clustered stars in the PC space using a 2d kernel density estimation.
Usage
innerLoop(ocdata_full, ocdata, classAlgol="kmeans", autoThresholdLevel=3,autoThreshold=TRUE, iiter=0, plotIter=FALSE, verbosity=1, starsPerClust_kmeans=50,nstarts_kmeans=50, runId=0, autoCalibrated=FALSE, stopIfEmpty=FALSE,positionDataIndexes=c(1,2), smartTableDB, nDimsToKeep=4, dimRed="PCA", scale=TRUE)
Arguments
ocdata_full a data frame with the data to perform the analysis
ocdata a data frame with the data to consider in the PCA step
classAlgol a string indicating the type of clustering algorithm to consider. Only k-means isimplemented at this moment (defaults to kmeans)
autoThresholdLevel
an integer indicating the level for thresholding of the spatial distribution
autoThreshold a boolean indicating if autoThresolding should be adopted (defaults to TRUE)
iiter and integer indicating the number of the iteration (passed by the outerLoop)
plotIter a boolean indicating if the user wants to see iteration plots (defaults to FALSE)
verbosity a flag indicating the verbosity level: it can be 0 (no screen output at all), 1(minimum), >=2 (all)
starsPerClust_kmeans
an integer with the average number of stars per k-means cluster
nstarts_kmeans an integer the amount of random re-initializations of the k-means clusteringmethod (usually it is not necessary to modify this)
runId an integer greater than zero indicating the run Id (passed by the outerLoop)
autoCalibrated a boolean indicating if the number of random field realizations for the cluster-ing check in the position space should be autocalibrated (experimental code,defaults to FALSE).
stopIfEmpty a boolean indicating if the code should completely stop if no spatial clusteringis detected (defaults to FALSE)
positionDataIndexes
an array of integers indicating the columns of the data frame containing thespatial position measurements
innerLoop 11
smartTableDB a database connection to the smart look-up table
nDimsToKeep an integer with the number of dimensions to consider (defaults to 4)
dimRed a string with the dimensionality reduction method to use (defaults to PCA. Theonly other options are LaplacianEigenmaps or None)
scale a boolean indicating if the data should be scaled and centered
Value
A data frame with objects considered as members at this iteration.
Author(s)
Alberto Krone-Martins, Andre Moitinho
References
Krone-Martins, A. & Moitinho, A., A&A, v.561, p.A57, 2014
Examples
## Not run:# Perform a one run of the innerLoop using a simulated open cluster with# spatial and photometric data# Load the data into a data framefileName <- "oc_12_500_1000_1.0_p019_0880_1_25km_120nR_withcolors.dat"inputFileName <- system.file("extdata", fileName, package="UPMASK")ocData <- read.table(inputFileName, header=TRUE)ocData <- data.frame(ocData, id=(1:length(ocData[,1]))) # create an id
# Prepare the data to run the inner loopposIdx <- c(1,2)photIdx <- c(3,5,7,9,11,19,21,23,25,27)
# Create the look up tablelibrary(RSQLite)stcon <- create_smartTable()
# Run the inner loopinnerLoopRes <- innerLoop(ocData, ocData[,photIdx], autoThresholdLevel=1, verbosity=2,
starsPerClust_kmeans=25, positionDataIndexes=posIdx,smartTableDB=stcon)
# Clean the environmentrm(list=c("inputFileName", "ocData", "posIdx", "photIdx", "innerLoopRes",
"fileName"))dbDisconnect(stcon)
## End(Not run)
12 kde2dForSubset
kde2dForSubset Compute the density based distance quantity using a 2D Kernel Den-sity Estimation
Description
kde2dForSubset will compute the 2D Kernel Density Estimation for the requested subset of dataand will return the quantiy (max(d)-mean(d))/sd(d) if the option returnDistance is set toTRUE.
Usage
kde2dForSubset(df, setw=1, n=50, showStats=TRUE, printPlots=TRUE,returnDistance=FALSE, positionDataIndexes=c(1,2))
Arguments
df a data frame to use
setw an integer with the class of the stars to perform the analysis
n the number of points in the regular grid of the density estimation
showStats a boolean indicating if the user wants to see output statistics
printPlots a boolean indicating if the user wants to see plots
returnDistance a boolean indicating if the distance between the max and the mean in units ofstandard deviations should be returned
positionDataIndexes
an array of integers indicating the columns of the file containing the spatial po-sition measurements
Value
A double representing the density based distance quantity.
Author(s)
Alberto Krone-Martins, Andre Moitinho
References
Krone-Martins, A. & Moitinho, A., A&A, v.561, p.A57, 2014
meanThreeSigRej 13
Examples
# Create a simple data set with the values and errorstoyDataDF <- data.frame(x=runif(50, 0, 10), y=runif(50, 0, 10), resMclust.class=rep(1, 50))
# Run the KDE 2D analysis for the required subsetdisV <- kde2dForSubset(toyDataDF, showStats=FALSE, printPlots=FALSE, returnDistance=TRUE)
# Clean the environmentrm(list=c("toyDataDF", "disV"))
meanThreeSigRej Perform cuts in the data
Description
meanThreeSigRej will perform an interative rejection using the mean and three sigma of the data.The function will compute the mean and standard deviation of the input vector, reject all entrieslying farther than three-sigma, and iterate until the mean varies (fractionaly) by less than the toler-ance value. The function will return a data frame with the mean, standard deviation value and thenumber of iterations until the convergence was reached.
Usage
meanThreeSigRej(vec, maxI, tolerance)
Arguments
vec a vector with the data to consider
maxI an integer with the maximum amount of iterations allowed
tolerance a double with the tolerance value (as (old-new)/old)
Value
A data frame with the fields mean, sd (the standard deviation) and convergenceAtIter (the itera-tion where the convergence was reached).
Author(s)
Alberto Krone-Martins, Andre Moitinho
14 outerLoop
Examples
# Create a simple data set with the values and errorstoyData <- c(rnorm(30, mean=0, sd=5), 10000, 1000)
# Call the function to perform cutstoyDataItStat <- meanThreeSigRej(toyData)
cat(paste("True mean = 0\n"))cat(paste("Before rejection mean =",round(mean(toyData),2),"\n"))cat(paste("After rejetion mean =",round(toyDataItStat$mean,2),"\n"))
# Clean the environmentrm(list=c("toyData", "toyDataItStat"))
outerLoop UPMASK outer loop
Description
outerLoop executes the UPMASK method’s outer loop on a data frame, and returns another dataframe as output, with the id of the object and it’s classification as a stellar cluster member or not.
The outerLoop perform cuts in the data if necessary (by calling performCuts), take errors in thedata table into account if the user request (by calling innerLoop), runs the inner loop (by callinginnerLoop) until convergence of the membership list or util the maximum number of iterations isreached.
Usage
outerLoop(ocdata_full, positionDataIndexes=c(1,2),photometricDataIndexes=c(3,5,7,9,11,19,21,23,25,27),photometricErrorDataIndexes=c(4,6,8,10,12,20,22,24,26,28), threshold=1, maxIter=25,plotIter=FALSE, verbose=FALSE, starsPerClust_kmeans=50, nstarts_kmeans=50,finalXYCut=FALSE, autoCalibrated=FALSE, considerErrors=FALSE, run=0,smartTableDB, nDimsToKeep=4, dimRed="PCA", scale=TRUE)
Arguments
ocdata_full a data frame with the data to perform the analysispositionDataIndexes
an array of integers indicating the columns of the data frame containing thespatial position measurements
photometricDataIndexes
an array of integers with the column numbers containing photometric measure-ments (or any other measurement to go into the PCA step)
outerLoop 15
photometricErrorDataIndexes
an array of integers with the column numbers containing the errors of the pho-tometric measurements
threshold a double indicating the thresholding level for the random field analysis
maxIter an integer the maximum amount of iterations of the outer loop before giving upconvergence (usually it is not necessary to modify this)
plotIter a boolean indicating if the user wants to see iteration plots
verbose a boolean indicating if the output to screen should be verbosestarsPerClust_kmeans
an integer with the average number of stars per k-means cluster
nstarts_kmeans an integer the amount of random re-initializations of the k-means clusteringmethod (usually it is not necessary to modify this)
finalXYCut a boolean indicating if a final cut in the XY space should be performed (defaultsto FALSE)
autoCalibrated a boolean indicating if the number of random field realizations for the cluster-ing check in the position space should be autocalibrated (experimental code,defaults to FALSE).
considerErrors a boolean indicating if the errors should be taken into account
run an integer greater than zero indicating the run number
smartTableDB a database connection to the smart look-up table
nDimsToKeep an integer with the number of dimensions to consider (defaults to 4)
dimRed a string with the dimensionality reduction method to use (defaults to PCA. Theonly other options are LaplacianEigenmaps or None)
scale a boolean indicating if the data should be scaled and centered
Value
A data frame with the id and class (member / not member) of each object at this run.
Author(s)
Alberto Krone-Martins, Andre Moitinho
References
Krone-Martins, A. & Moitinho, A., A&A, v.561, p.A57, 2014
Examples
## Not run:# Perform a one run of the outerLoop using a simulated open cluster with# spatial and photometric data# Load the data into a data framefileName <- "oc_12_500_1000_1.0_p019_0880_1_25km_120nR_withcolors.dat"inputFileName <- system.file("extdata", fileName, package="UPMASK")ocData <- read.table(inputFileName, header=TRUE)

16 performCuts
# Create the look up tablelibrary(RSQLite)stcon <- create_smartTable()
# Run the outer loopposIdx <- c(1,2)photIdx <- c(3,5,7,9,11,19,21,23,25,27)photErrIdx <- c(4,6,8,10,12,20,22,24,26,28)outerLoopRes <- outerLoop(ocData, posIdx, photIdx, PhotErrIdx,
starsPerClust_kmeans=25, verbose=TRUE, smartTableDB=stcon)
# Clean the environmentrm(list=c("inputFileName", "ocData", "posIdx", "photIdx", "photErrIdx",
"outerLoopRes", "fileName"))dbDisconnect(stcon)
## End(Not run)
performCuts Perform cuts in the data
Description
performCuts will perform cuts in the data. This function is provided as a place holder, and it isempty, but it is called by UPMASK, so if the user needs to perform cuts in the data for the UPMASKanalysis, this function should be tailored.
Usage
performCuts(originalData)
Arguments
originalData a data frame to use as the baseline
Value
A data frame.
Author(s)
Alberto Krone-Martins, Andre Moitinho
takeErrorsIntoAccount 17
Examples
# Create a simple data set with the values and errorstoyDataDF <- data.frame(x=runif(10, 0, 10), dx=rep(0.2, 10), y=runif(10, 0, 10),
dy=rep(0.1, 10))
# Call the function to perform cutsnewToyDataDF <- performCuts(toyDataDF)
# Clean the environmentrm(list=c("toyDataDF", "newToyDataDF"))
takeErrorsIntoAccount Take Errors Into Account for UPMASK analysis
Description
Based on a data frame containing measurements and errors, the takeErrorsIntoAccount willproduce another data frame where each measurement of the original data frame is replaced byanother value taken from a random distribution. The implemented error model is gaussian, so eachvalue of the output data frame will be a random sampling from a gaussian distribution where themean is the value in the original data frame (indicated by the photometricDataIndexes columnargument) and the standard deviation is the value from its corresponding error (indicated by thephotometricErrorDataIndexes column argument). The newly constructed dataframe is returnedby the function.
The user can adapt this function so it can take any error model into account during the UPMASKanalysis.
Usage
takeErrorsIntoAccount(originalData, dataIndexes, errorIndexes)
Arguments
originalData a data frame to use as the baseline
dataIndexes an array of integers indicating the columns corresponding to the measurements
errorIndexes an array of integers indicating the columns corresponding to the errors
Value
A data frame with the new values sampled from the error distributions.
Author(s)
Alberto Krone-Martins, Andre Moitinho
18 UPMASKdata
References
Krone-Martins, A. & Moitinho, A., A&A, v.561, p.A57, 2014
Examples
# Create a simple data set with the values and errorstoyDataDF <- data.frame(x=runif(10, 0, 10), dx=rep(0.2, 10), y=runif(10, 0, 10),
dy=rep(0.1, 10))
# Apply the error models to create another data framenewToyDataDF <- takeErrorsIntoAccount(toyDataDF, c(1,3), c(2,4))
# Plot the resultsplot(toyDataDF$x, toyDataDF$y)points(newToyDataDF$x, newToyDataDF$y, pch=19, cex=0.8, col="red")
# Clean the environmentrm(list=c("toyDataDF", "newToyDataDF"))
UPMASKdata Run UPMASK in a data frame
Description
UPMASKdata executes the UPMASK method on a data frame, and returns another data frame asoutput, including the membership analysis result as additional columns.
UPMASKdata is a method for performing membership assignment in stellar clusters. The distributedcode is prepared to use photometry and spatial positions, but it can take into account other types ofdata as well. The method is able to take into account arbitrary error models (the used must rewritethe takeErrorsIntoAccount function), and it is unsupervised, data-driven, physical-model-freeand relies on as few assumptions as possible. The approach followed for membership assessment isbased on an iterative process, dimensionality reduction, a clustering algorithm and a kernel densityestimation.
Usage
UPMASKdata(dataTable, positionDataIndexes=c(1,2),photometricDataIndexes=c(3,5,7,9,11,19,21,23,25,27),photometricErrorDataIndexes=c(4,6,8,10,12,20,22,24,26,28), threshold=1,classAlgol="kmeans", maxIter=25, starsPerClust_kmeans=25, nstarts_kmeans=50,nRuns=8, runInParallel=FALSE, paralelization="multicore", independent=TRUE,verbose=FALSE, autoCalibrated=FALSE, considerErrors=FALSE,finalXYCut=FALSE, nDimsToKeep=4, dimRed="PCA", scale=TRUE)
UPMASKdata 19
Arguments
dataTable a data frame with the data to perform the analysispositionDataIndexes
an array of integers indicating the columns of the data frame containing thespatial position measurements
photometricDataIndexes
an array of integers with the column numbers containing photometric measure-ments (or any other measurement to go into the PCA step)
photometricErrorDataIndexes
an array of integers with the column numbers containing the errors of the pho-tometric measurements
threshold a double indicating the thresholding level for the random field analysis
classAlgol a string indicating the type of clustering algorithm to consider. Only k-means isimplemented at this moment (defaults to kmeans)
maxIter an integer the maximum amount of iterations of the outer loop before giving upconvergence (usually it is not necessary to modify this)
starsPerClust_kmeans
an integer with the average number of stars per k-means cluster
nstarts_kmeans an integer the amount of random re-initializations of the k-means clusteringmethod (usually it is not necessary to modify this)
nRuns the total number of individual runs to execute the total number of outer loop runsto execute
runInParallel a boolean indicating if the code should run in parallel
paralelization a string with the type of paralilization to use. the paralelization can be: "mul-ticore" or "MPIcluster". At this moment only "multicore" is implemented (de-faults to multicore).
independent a boolean indicating if non-parallel runs should be completely independent
verbose a boolean indicating if the output to screen should be verbose
autoCalibrated a boolean indicating if the number of random field realizations for the cluster-ing check in the position space should be autocalibrated (experimental code,defaults to FALSE).
considerErrors a boolean indicating if the errors should be taken into account
finalXYCut a boolean indicating if a final cut in the XY space should be performed (defaultsto FALSE)
nDimsToKeep an integer with the number of dimensions to consider (defaults to 4)
dimRed a string with the dimensionality reduction method to use (defaults to PCA. Theonly other options are LaplacianEigenmaps or None)
scale a boolean indicating if the data should be scaled and centered
Value
A data frame with the original data used to run the method and additional columns indicating theclassification at each run, as well as a membership probability in the frequentist sense.
20 UPMASKfile
Author(s)
Alberto Krone-Martins, Andre Moitinho
References
Krone-Martins, A. & Moitinho, A., A&A, v.561, p.A57, 2014
Examples
## Not run:# Analyse a simulated open cluster using spatial and photometric data# Load the data into a data framefileNameI <- "oc_12_500_1000_1.0_p019_0880_1_25km_120nR_withcolors.dat"inputFileName <- system.file("extdata", fileNameI, package="UPMASK")ocData <- read.table(inputFileName, header=TRUE)
# Example of how to run UPMASK using data from a data frame# (serious analysis require at least larger nRuns)posIdx <- c(1,2)photIdx <- c(3,5,7,9,11,19,21,23,25,27)photErrIdx <- c(4,6,8,10,12,20,22,24,26,28)
upmaskRes <- UPMASKdata(ocData, posIdx, photIdx, PhotErrIdx, nRuns=2,starsPerClust_kmeans=25, verbose=TRUE)
# Create a simple raw plot to see the resultspCols <- upmaskRes[,length(upmaskRes)]/max(upmaskRes[,length(upmaskRes)])plot(upmaskRes[,1], upmaskRes[,2], col=rgb(0,0,0,pCols), cex=0.5, pch=19)
# Clean the environmentrm(list=c("inputFileName", "ocData", "posIdx", "photIdx", "photErrIdx",
"upmaskRes", "pCols"))
## End(Not run)
UPMASKfile Run UPMASK in a file
Description
UPMASKfile executes the UPMASK method using a file as an input and writes another file as anoutput. This is a wrapper function that only reads a file into an R data frame, calls the UPMASKdatafunction using this data frame and the parameters passed by the user and writes the output intoanother file.
UPMASKfile 21
Usage
UPMASKfile(filenameWithPathInput, filenameWithPathOuput,positionDataIndexes=c(1,2), photometricDataIndexes=c(3,5,7,9,11,19,21,23,25,27),photometricErrorDataIndexes=c(4,6,8,10,12,20,22,24,26,28), threshold=1,maxIter=20, starsPerClust_kmeans=50, nstarts_kmeans=50, nRuns=5,runInParallel=FALSE, paralelization="multicore", independent=TRUE, verbose=FALSE,autoCalibrated=FALSE, considerErrors=FALSE, finalXYCut=FALSE,fileWithHeader=FALSE, nDimsToKeep=4, dimRed="PCA", scale=TRUE)
Arguments
filenameWithPathInput
a string indicating the file containing the data to run UPMASK on (with fullpath)
filenameWithPathOuput
a string indicating the file where the output shall be written (with full path)positionDataIndexes
an array of integers indicating the columns of the file containing the spatial po-sition measurements
photometricDataIndexes
an array of integers with the column numbers containing photometric measure-ments (or any other measurement to go into the PCA step)
photometricErrorDataIndexes
an array of integers with the column numbers containing the errors of the pho-tometric measurements
threshold a double indicating the thresholding level for the random field analysis
maxIter an integer the maximum amount of iterations of the outer loop before giving upconvergence (usually it is not necessary to modify this)
starsPerClust_kmeans
an integer with the average number of stars per k-means cluster
nstarts_kmeans an integer the amount of random re-initializations of the k-means clusteringmethod (usually it is not necessary to modify this)
nRuns the total number of individual runs to execute the total number of outer loop runsto execute
runInParallel a boolean indicating if the code should run in parallel
paralelization a string with the type of paralilization to use. the paralelization can be: "mul-ticore" or "MPIcluster". At this moment only "multicore" is implemented (de-faults to multicore).
independent a boolean indicating if non-parallel runs should be completely independent
verbose a boolean indicating if the output to screen should be verbose
autoCalibrated a boolean indicating if the number of random field realizations for the cluster-ing check in the position space should be autocalibrated (experimental code,defaults to FALSE).
considerErrors a boolean indicating if the errors should be taken into account
22 UPMASKfile
finalXYCut a boolean indicating if a final cut in the XY space should be performed (defaultsto FALSE)
fileWithHeader a boolean indicating if the input file has a text header
nDimsToKeep an integer with the number of dimensions to consider (defaults to 4)
dimRed a string with the dimensionality reduction method to use (defaults to PCA. Theonly other options are LaplacianEigenmaps or None)
scale a boolean indicating if the data should be scaled and centered
Author(s)
Alberto Krone-Martins, Andre Moitinho
References
Krone-Martins, A. & Moitinho, A., A&A, v.561, p.A57, 2014
Examples
## Not run:# Analyse a simulated open cluster using spatial and photometric data# Create strings with filenamesfileNameI <- "oc_12_500_1000_1.0_p019_0880_1_25km_120nR_withcolors.dat"inputFileName <- system.file("extdata", fileNameI, package="UPMASK")outputFileName <- file.path(tempdir(), "up-RESULTS.dat")
# Example of how to run UPMASK using data from a file# (serious analysis require at least larger nRuns)posIdx <- c(1,2)photIdx <- c(3,5,7,9,11,19,21,23,25,27)photErrIdx <- c(4,6,8,10,12,20,22,24,26,28)UPMASKfile(inputFileName, outputFileName, posIdx, photIdx, photErrIdx, nRuns=5,
starsPerClust_kmeans=25, verbose=TRUE, fileWithHeader=TRUE)
# Open the resulting file to inspect the resultstempResults <- read.table(outputFileName, header=TRUE)
# Create a simple raw plot to see the resultspCols <- tempResults[,length(tempResults)]/max(tempResults[,length(tempResults)])plot(tempResults[,1], tempResults[,2], col=rgb(0,0,0,pCols), cex=0.5, pch=19)
# Clean the environmentrm(list=c("tempResults", "inputFileName", "outputFileName", "pCols", "fileNameI"))
## End(Not run)
Index
∗Topic cluster,innerLoop, 10outerLoop, 14UPMASKdata, 18
∗Topic methods,innerLoop, 10outerLoop, 14UPMASKdata, 18
∗Topic misc,UPMASKfile, 20
∗Topic multivariate,innerLoop, 10outerLoop, 14UPMASKdata, 18
∗Topic nonparametricinnerLoop, 10outerLoop, 14UPMASKdata, 18
∗Topic packageUPMASK-package, 2
∗Topic utilitiesanalyse_randomKde2d, 4analyse_randomKde2d_AutoCalibrated,
5analyse_randomKde2d_smart, 6create_randomKde2d, 7create_smartTable, 8getStarsAtHighestDensityRegion, 9kde2dForSubset, 12meanThreeSigRej, 13performCuts, 16takeErrorsIntoAccount, 17UPMASKfile, 20
analyse_randomKde2d, 4, 6analyse_randomKde2d_AutoCalibrated, 5analyse_randomKde2d_smart, 6, 8
create_randomKde2d, 4, 5, 7create_smartTable, 8
getStarsAtHighestDensityRegion, 9
innerLoop, 10, 14
kde2dForSubset, 12
meanThreeSigRej, 13
outerLoop, 14
performCuts, 14, 16
takeErrorsIntoAccount, 17, 18
UPMASK (UPMASK-package), 2UPMASK-package, 2UPMASKdata, 3, 18UPMASKfile, 3, 20
23