Embed Size (px)
Citation preview
Pacific Northwest Second-Growth Forest Carbon Dynamics and Tree Diversity
Justin L. Kirsch, Alexandra N. Kazakova, Emily B. Anderson and Dylan G. FischerField Ecology Laboratory, The Evergreen State College, Olympia, WA
Contact: [email protected], [email protected], [email protected]
Mg C
ha
-1 y
-1
2
4
6
8
gC
m-2
y-1
200
400
600
800
1000
1200
1400
biomass
Mg C
ha-1
100
200
300
400present
not present
ANPPtree NCER
INTRODUCTION
•Terrestrial forest ecosystems can represent a major carbon sink and may even account for missing C in global budgeting (Keeling et al. 1996, Fan et al.1998, Carey et al. 2001, Giardina et al. 2005).
•Studying productivity and carbon cycling in previously disturbed and second-growth habitats has become particularly important as fewer terrestrial ecosystems remain undisturbed.
•Other experiments (esp. in grassland and marine systems) suggest a positive relationship between ecosystem productivity and speciesdiversity (Naeem et al. 1994, Tilman et al.1996, 2001, Hector et al. 1999)
•Finally, key dominant plant species can play a major role in determining the productivity of ecosystems (Ellison et al. 2005). Species differences in functional traits can be important as drivers of ecosystem productivity and are well recognized as important controls on processes (Scott and Binkley 1997, Binkley and Menyailo 2005).
•Our primary goal was to identify biological determinants of variation in productivity and C uptake in a second-growth forest ecosystem.
IMPLICATIONS AND FUTURE RESEARCH
•More diverse forests may also be more productive, and sequester more carbon.
•Significant variation in ANPP exists within this second-growth forest, suggesting minor changes in forest composition, environmental variables, and topography can have big implications for forest carbon uptake
•These estimates of ANPP provide a baseline for estimation of carbon sequestration in local PNW forests
Acknowledgements
This work was made possible by the Evergreen Field Ecology Lab Group, the academic programs IES – 2005/6, IES 2006/7, Field Ecology, and Temperate Rainforests 2007. For field and lab support we also thank Alison Styring, Paul Przybylowicz, Carri LeRoy, Rob Cole, Jora Rehm-Lorber, Kyle Galloway, Pat Babbin, Josh Brann, Jordan Erickson, Don Loft, Margaret Pryor, Casey Broderick, and Lindsey Wright. Financial support has been provided by the Evergreen State College Foundation, Evergreen Sponsored Research, The Evergreen Fund for Innovation, and Microsoft Corporation.
ABSTRACTIn order to determine patterns in carbon (C) storage and flux rates in a Pacific Northwest second-growth forest, we assess variability in tree above-ground net primary productivity (ANPP- litterfall=ANPPtree), net soil CO2 efflux (NCER) and understory community in relation to diversity of multiple coniferous, deciduous, and a nitrogen (N) fixing tree species (Alnus rubra). Four major findings arose from our study: 1) We find a positive linear relationship between ANPPtree and tree species richness, where overstory richness explained 35% of ANPPtree
(r2=0.35, P=0.005; Figure 2); 2) There was no significant difference in mean ANPPtree among stands dominated by multiple evergreen, deciduous, and an N-fixing tree species (P=0.18). Generally, trends suggested decreases in ANPPtree with biomass stand dominance for 4 of the 5 most abundant tree species (Figure 3). Presence of the soil modifying A. rubra had no significant effect on ANPPtree, NCER, or above-ground C stocks (P>0.05; Figure 4); 3) We find a positive relationship between average growing-season NCER (April-October) and ANPPtree (r2=0.75, P<0.05). Additionally, stands with higher overstory richness typically had higher NCER (r2=0.71, P=0.0015; Figure 5). Other indices of diversity were also predictive of NCER, where more diverse stands typically had higher NCER (Figure 5). 4) Variation in overstory stand dominance was not only mildly predictive of understory plant community composition (r2=0.1073, P<0.001) (Figure 6). Understory plant diversity was unrelated to ANPPtree, above-ground C stocks, and NCER using species richness (P>0.05), Shannon’s (P>0.05) or Simpson’s (P>0.05) diversity measures. These data highlight variability in second-growth forests that may have strong implications for net ecosystem productivity (NEP). We estimate ANPPtree at 7.75 Mg C ha-1 yr-1. This and other plot level measurements imply NEP between ~ 5 and 2 Mg C ha-1 yr-1 at our lowland second growth forest site.
KEY FINDINGS
•Overstory richness ANPPtree and ANPP were positively related (Figure 2), suggesting more diverse forests may take up more carbon
•Biomass-based stand dominance was negatively related to ANPPtree in four of the five major overstory species (Figure 3), which suggests increases in ANPPtree may not be driven by key hyper-abundant tree species.
•ANPPtree, NCER, and above-ground C stocks were not significantly different among stands dominated by N-fixing species, i.e. A. rubra(Figure 4), suggesting N fixation alone is not enough to describe significant variability in ANPPtree
•Both overstory diversity and richness were strongly predictive of NCER(Figure 5)
•Understory diversity was not predictive of any measure of carbon flux or pool included in this study (P > 0.05).
•Biomass-based overstory community profiles were unrelated to understory community profiles (Figure 6)
•Conifer and hardwood dominated plots were not significantly different in terms of estimated ANPPtree (P=0.08), NCER (P>0.05), or total above-ground C stocks (P>0.05). However, conifer dominated plots tended to be higher in estimated ANPPtree, NCER, and above-ground C stocks.
•We estimate over-all average ANPPtree of 7.75 Tons C ha -1 yr-1 from 2006-08, and estimate C storage of ~354 tons ha-1
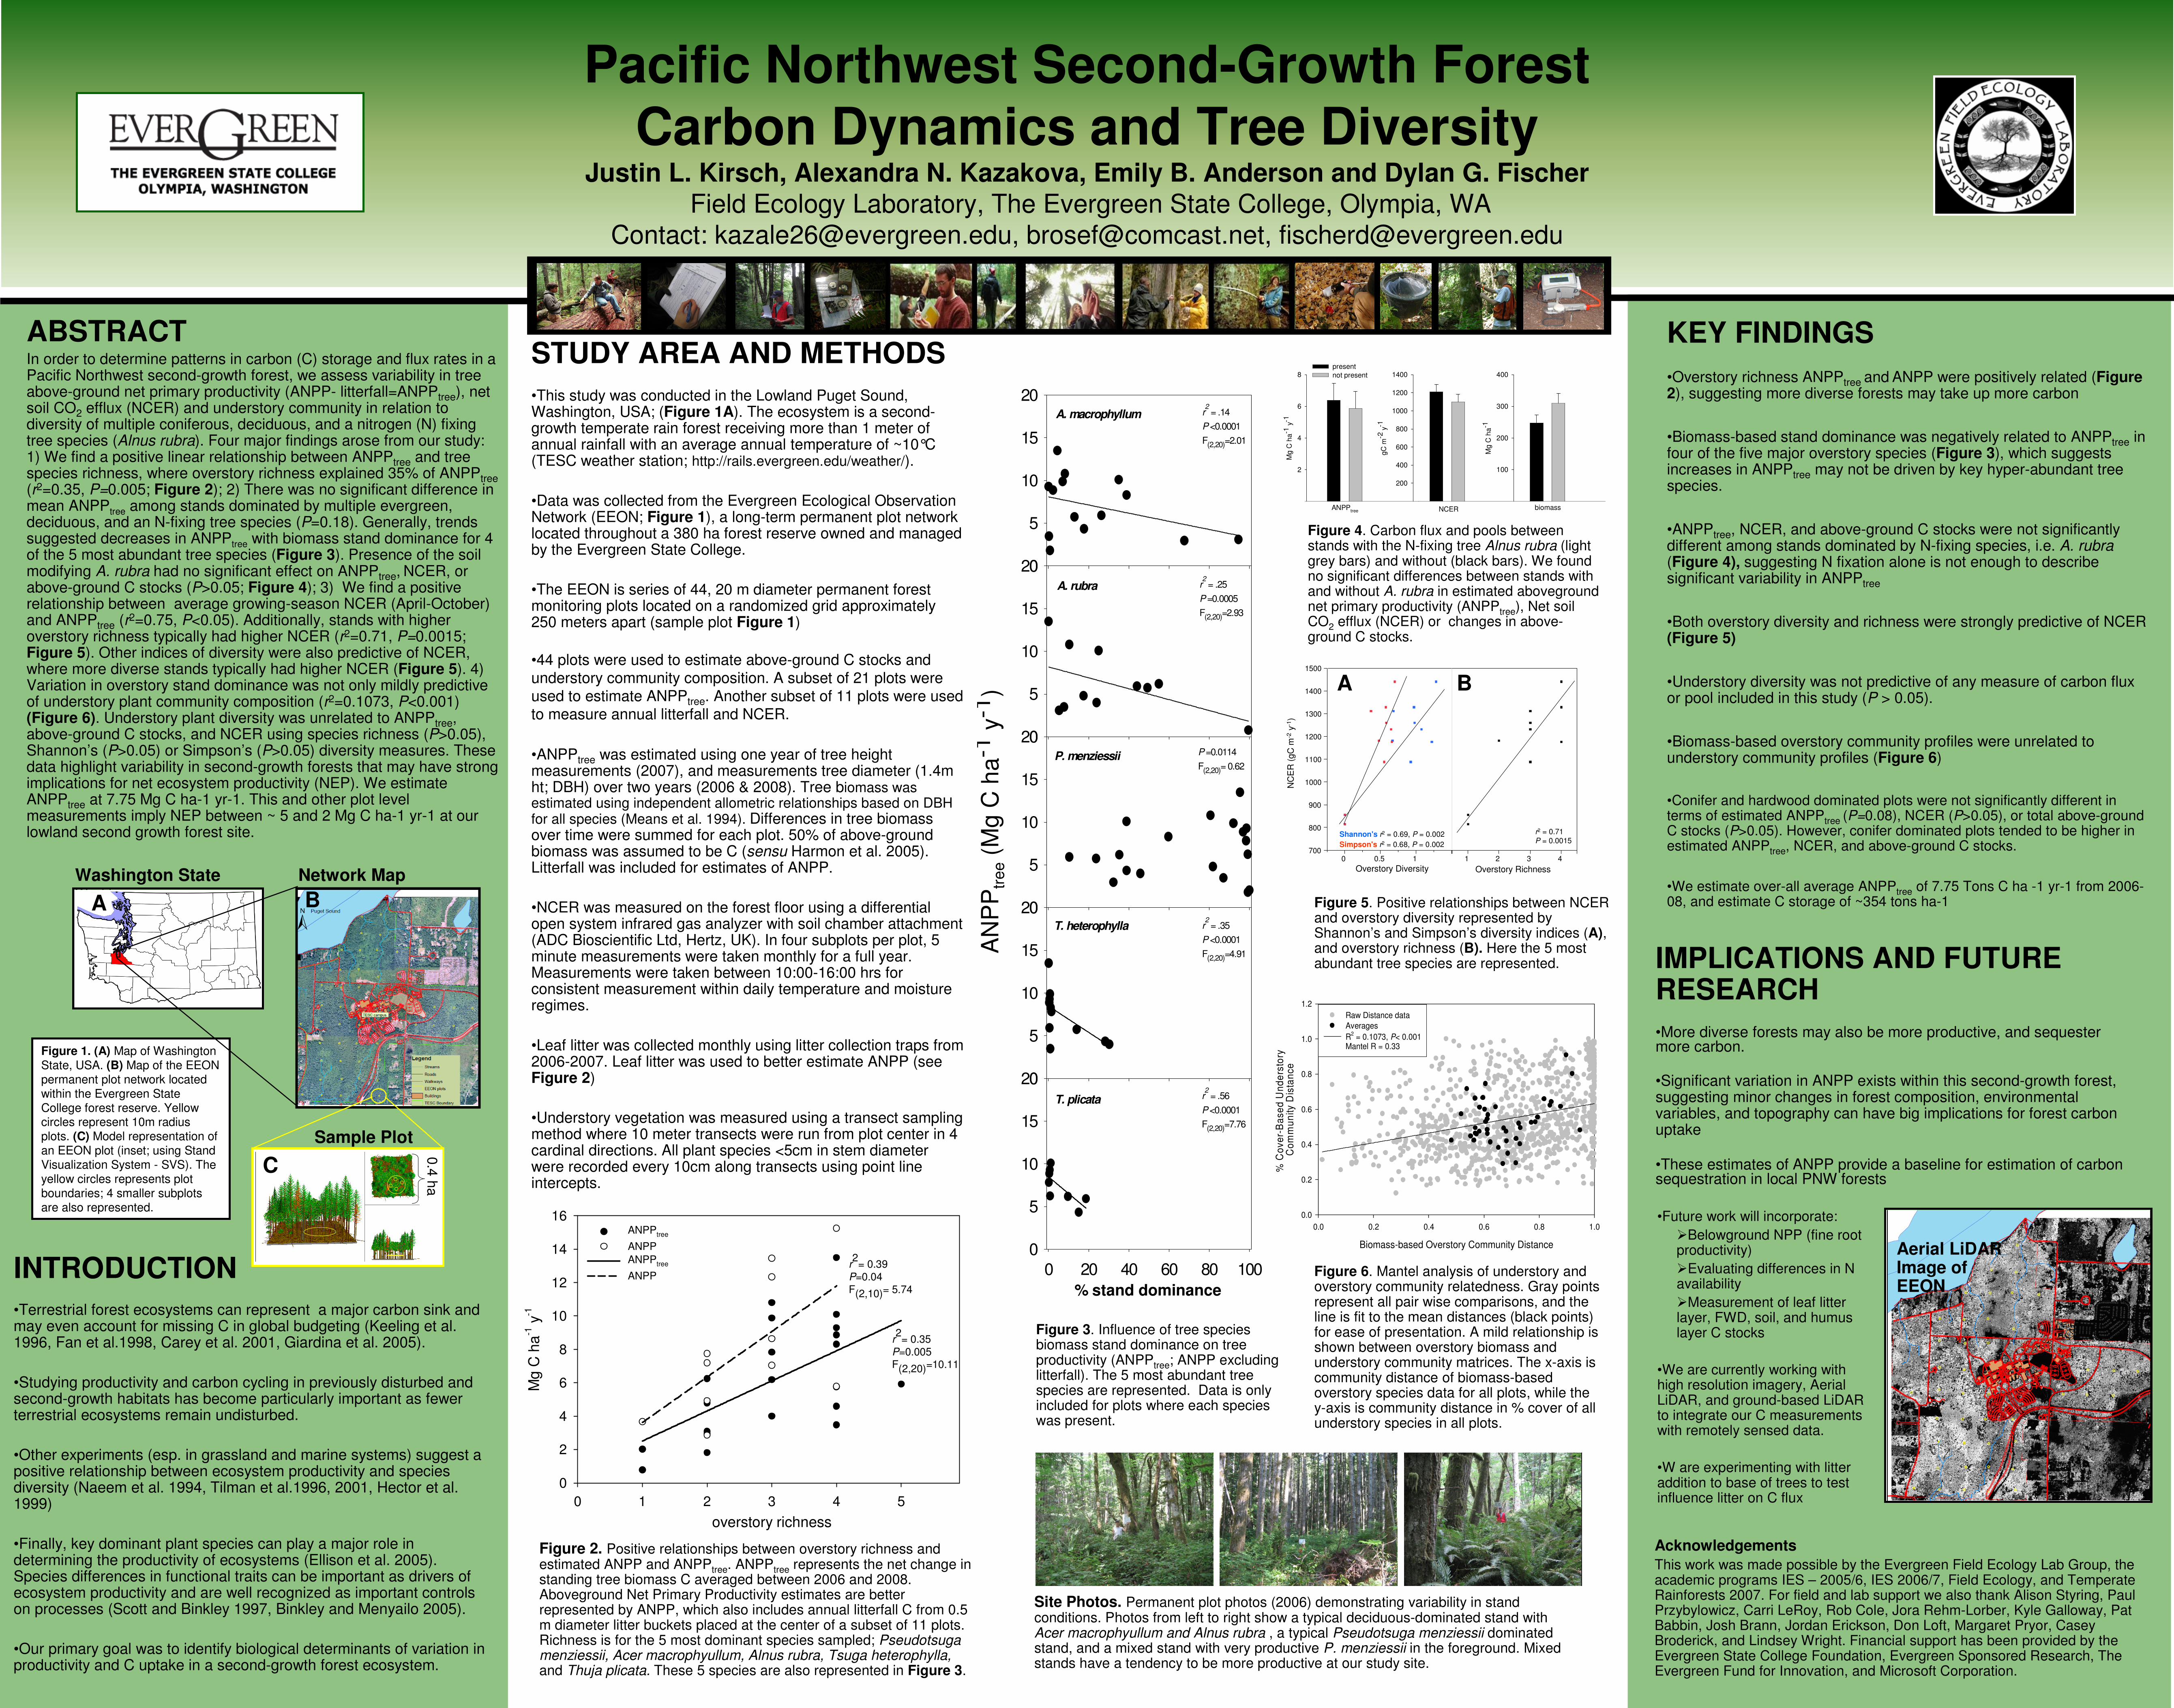
Figure 3. Influence of tree species biomass stand dominance on tree productivity (ANPPtree; ANPP excluding litterfall). The 5 most abundant tree species are represented. Data is only included for plots where each species was present.
Biomass-based Overstory Community Distance
0.0 0.2 0.4 0.6 0.8 1.0
% C
ove
r-B
ase
d U
nd
ers
tory
C
om
mu
nity D
ista
nce
0.0
0.2
0.4
0.6
0.8
1.0
1.2
Raw Distance data
Averages
R2 = 0.1073, P< 0.001
Mantel R = 0.33
Figure 2. Positive relationships between overstory richness and estimated ANPP and ANPPtree. ANPPtree represents the net change in standing tree biomass C averaged between 2006 and 2008. Aboveground Net Primary Productivity estimates are better represented by ANPP, which also includes annual litterfall C from 0.5 m diameter litter buckets placed at the center of a subset of 11 plots. Richness is for the 5 most dominant species sampled; Pseudotsugamenziessii, Acer macrophyullum, Alnus rubra, Tsuga heterophylla, and Thuja plicata. These 5 species are also represented in Figure 3.
Figure 1. (A) Map of Washington State, USA. (B) Map of the EEON permanent plot network located within the Evergreen State College forest reserve. Yellow circles represent 10m radius plots. (C) Model representation of an EEON plot (inset; using Stand Visualization System - SVS). The yellow circles represents plot boundaries; 4 smaller subplots are also represented.
2D Graph 5
0 20 40 60 80 100
0
5
10
15
200
5
10
15
200
5
10
15
20
AN
PP
tre
e (
Mg C
ha-1
y-1
)
0
5
10
15
200
5
10
15
20A. macrophyllum
A. rubra
P. menziessii
T. heterophylla
T. plicata
r2
= .25
P =0.0005
F(2,20)=2.93
r2
= .14
P <0.0001
F(2,20)=2.01
P =0.0114
F(2,20)= 0.62
r2
= .35
P <0.0001
F(2,20)=4.91
r2
= .56
P <0.0001
F(2,20)=7.76
% stand dominanceN
CE
R (
gC
m-2
y-1
)
700
800
900
1000
1100
1200
1300
1400
1500
0 0.5 1 1 2 3 4
Overstory Diversity Overstory Richness
Shannon's r2 = 0.69, P = 0.002
Simpson's r2 = 0.68, P = 0.002
r2 = 0.71
P = 0.0015
Figure 5. Positive relationships between NCER and overstory diversity represented by Shannon’s and Simpson’s diversity indices (A), and overstory richness (B). Here the 5 most abundant tree species are represented.
A B
Washington state
•Future work will incorporate:
�Belowground NPP (fine root productivity)
�Evaluating differences in N availability
�Measurement of leaf litter layer, FWD, soil, and humus layer C stocks
•We are currently working with high resolution imagery, Aerial LiDAR, and ground-based LiDARto integrate our C measurements with remotely sensed data.
•W are experimenting with litter addition to base of trees to test influence litter on C flux
Figure 4. Carbon flux and pools between stands with the N-fixing tree Alnus rubra (light grey bars) and without (black bars). We found no significant differences between stands with and without A. rubra in estimated aboveground net primary productivity (ANPPtree), Net soil CO2 efflux (NCER) or changes in above-ground C stocks.
overstory richness
0 1 2 3 4 5
Mg
C h
a-1
y-1
0
2
4
6
8
10
12
14
16ANPPtree
ANPP
ANPPtree
ANPP
r2= 0.35
P=0.005F(2,20)=10.11
r2
= 0.39P=0.04F(2,10)= 5.74
Site Photos. Permanent plot photos (2006) demonstrating variability in stand conditions. Photos from left to right show a typical deciduous-dominated stand with Acer macrophyullum and Alnus rubra , a typical Pseudotsuga menziessii dominated stand, and a mixed stand with very productive P. menziessii in the foreground. Mixed stands have a tendency to be more productive at our study site.
0.4
ha
Washington State Network Map
Sample Plot
J. Huey
J. Huey J. HueyJ. Huey
A B
C
Figure 6. Mantel analysis of understory and overstory community relatedness. Gray points represent all pair wise comparisons, and the line is fit to the mean distances (black points) for ease of presentation. A mild relationship is shown between overstory biomass and understory community matrices. The x-axis is community distance of biomass-based overstory species data for all plots, while the y-axis is community distance in % cover of all understory species in all plots.
Aerial LiDARImage of EEON
STUDY AREA AND METHODS
•This study was conducted in the Lowland Puget Sound, Washington, USA; (Figure 1A). The ecosystem is a second-growth temperate rain forest receiving more than 1 meter of annual rainfall with an average annual temperature of ~10°C (TESC weather station; http://rails.evergreen.edu/weather/).
•Data was collected from the Evergreen Ecological Observation Network (EEON; Figure 1), a long-term permanent plot network located throughout a 380 ha forest reserve owned and managed by the Evergreen State College.
•The EEON is series of 44, 20 m diameter permanent forest monitoring plots located on a randomized grid approximately 250 meters apart (sample plot Figure 1)
•44 plots were used to estimate above-ground C stocks and understory community composition. A subset of 21 plots were used to estimate ANPPtree. Another subset of 11 plots were used to measure annual litterfall and NCER.
•ANPPtree was estimated using one year of tree height measurements (2007), and measurements tree diameter (1.4m ht; DBH) over two years (2006 & 2008). Tree biomass was estimated using independent allometric relationships based on DBH for all species (Means et al. 1994). Differences in tree biomass over time were summed for each plot. 50% of above-ground biomass was assumed to be C (sensu Harmon et al. 2005). Litterfall was included for estimates of ANPP.
•NCER was measured on the forest floor using a differential open system infrared gas analyzer with soil chamber attachment (ADC Bioscientific Ltd, Hertz, UK). In four subplots per plot, 5 minute measurements were taken monthly for a full year. Measurements were taken between 10:00-16:00 hrs for consistent measurement within daily temperature and moisture regimes.
•Leaf litter was collected monthly using litter collection traps from 2006-2007. Leaf litter was used to better estimate ANPP (see Figure 2)
•Understory vegetation was measured using a transect sampling method where 10 meter transects were run from plot center in 4 cardinal directions. All plant species <5cm in stem diameter were recorded every 10cm along transects using point line intercepts.

J. Huey
J. Huey J. HueyJ. Huey
D. Fischer
D. Fischer
2D Graph 5
0 20 40 60 80 100
0
5
10
15
200
5
10
15
200
5
10
15
20
AN
PP
(M
g C
ha-1
y-1
)
0
5
10
15
200
5
10
15
20A. macrophyllum
A. rubra
P. menziessii
T. heterophylla
T. plicata
r2
= .25
P =0.0005
F(2,20)=2.93
r2
= .14
P <0.0001
F(2,20)=2.01
P =0.0114
F(2,20)= 0.62
r2
= .35
P <0.0001
F(2,20)=4.91
r2
= .56
P <0.0001
F(2,20)=7.76
% stand dominance
2 D G r a p h 5
0 2 0 4 0 6 0 8 0 1 0 00
5
1 0
1 5
2 00
5
1 0
1 5
2 00
5
1 0
1 5
2 0
AN
PP
(M
g C
ha-1
y-1
) 0
5
1 0
1 5
2 00
5
1 0
1 5
2 0
A . m a c r o p h y l l u m
A . r u b r a
P . m e n z i e s s i i
T . h e t e r o p h y l l a
T . p l i c a t aJ
I
H
G
F
R2
= . 2 5
P = 0 . 0 0 0 5
F ( 2 , 2 0 ) = 2 . 9 3
R2
= . 1 4
P < 0 . 0 0 0 1
F ( 2 , 2 0 ) = 2 . 0 1
P = 0 . 0 1 1 4
F ( 2 , 2 0 ) = 0 . 6 2
R2
= . 3 5
P < 0 . 0 0 0 1
F ( 2 , 2 0 ) = 4 . 9 1
% s t a n d d o m i n a n c e
R2
= . 5 6
P < 0 . 0 0 0 1
F ( 2 , 2 0 ) = 7 . 7 6
NC
ER
(g
Cm
-2y-
1)
700
800
900
1000
1100
1200
1300
1400
1500
0 0.5 1 0.51 1.5 2 2.5 3 3.5 4
Shannon's & Simpson's DiversityRichness
Shannon's P = 0.002, r2 = 0.69
Simpson's P = 0.002, r2 = 0.68
P = 0.0015r2 = 0.71
Figure 5. idsghisdfghfighfoighfighdfighdfighdflhglfhlhlkghflkghfdlghdlghlhglfhklfhlkhglkfhglkfhglfkhlhfadlkhklghklfhglhfglkfd
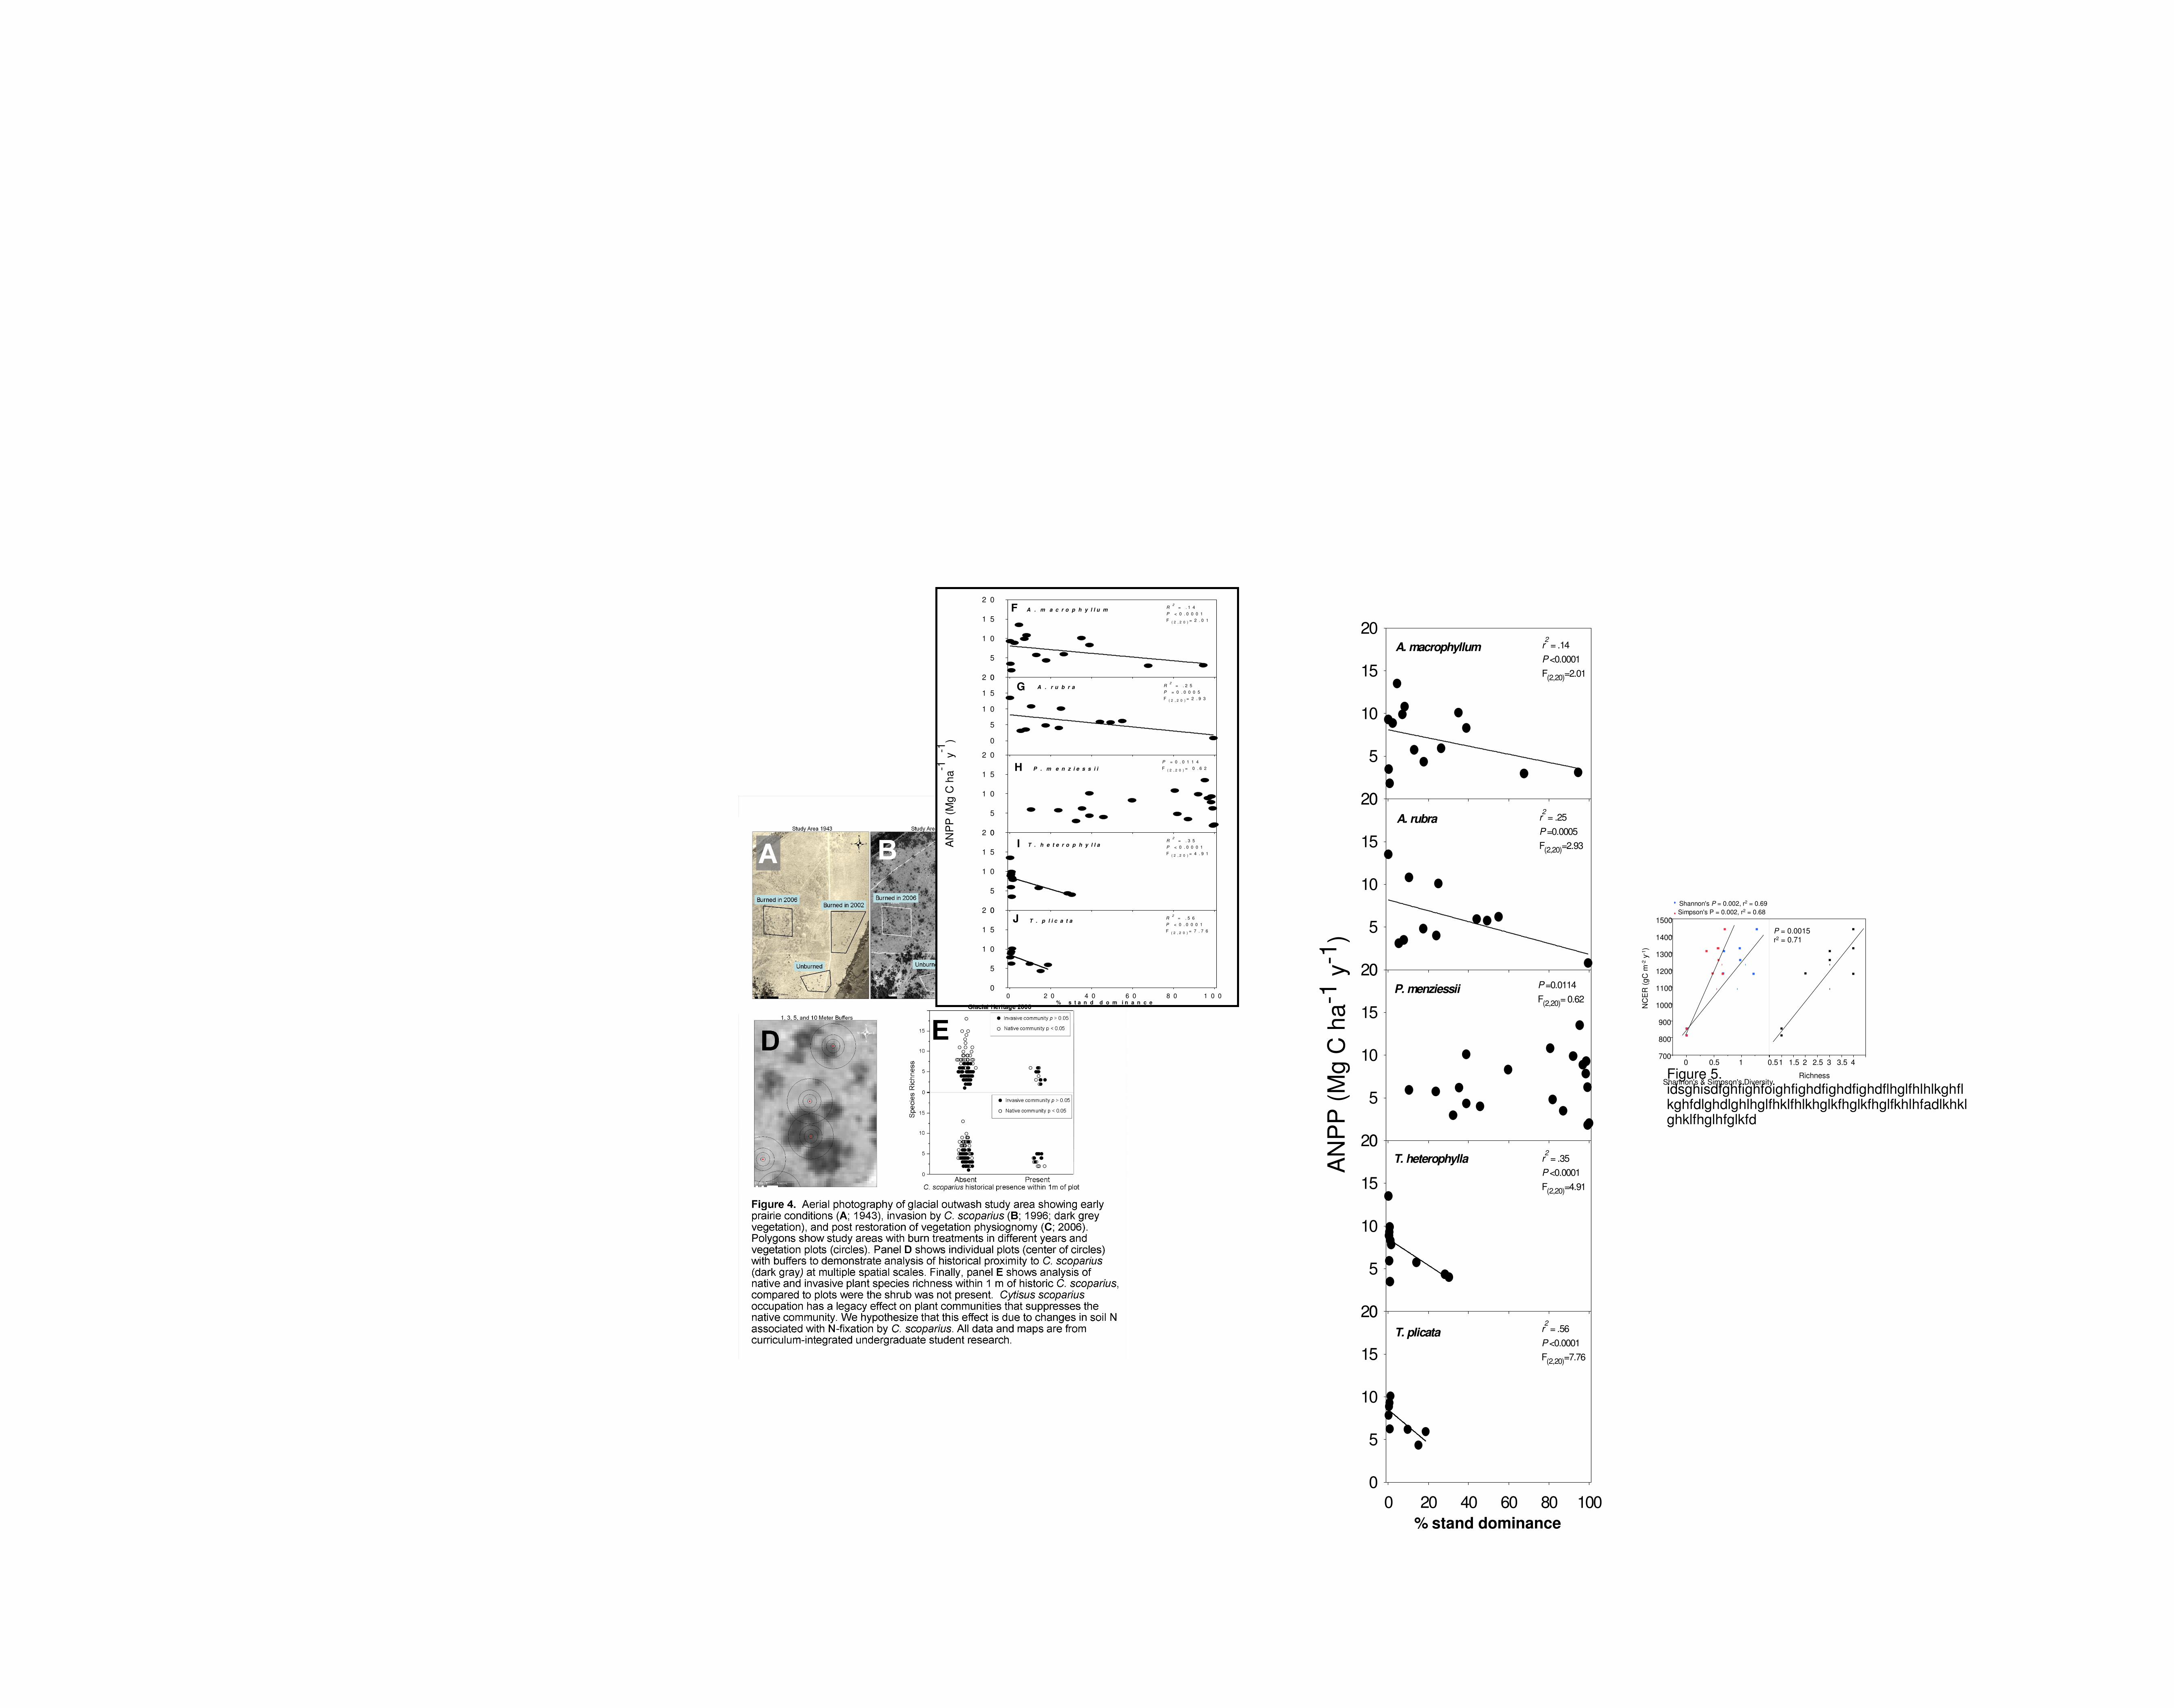
ABSTRACT
In order to determine patterns in carbon (C) storage and flux rates in a Pacific Northwest second-growth forest, we assess variability in 1) Above-ground net primary productivity (ANPP); 2) Net soil CO2 efflux (NCER) in relation to presence of coniferous, deciduous, and nitrogen (N) fixing tree species and understory species.
Four major findings arose from our study: 1) We found a positive linear relationship between ANPP and tree species richness, where overstory richness explained 35% of NPP (r2=0.35, P<0.05; Figure 2). 2) MULTIPANEL. Mean ANPP was ANOVA only mildly different among stands dominated by multiple evergreen, deciduous, and an N-fixing tree species. Trends suggested decreases in ANPP with stand dominance of any single species. 3) We also find a positive relationship between average growing-season (April-October) NCER and productivity (r2=0.75, P<0.05), additionally plots with more tree species generally had higher NCER got a (r2=0.30, P<0.05); 4) Variation in overstory stand dominance was strongly predictive of understory plant community composition (MRPP P<0.05). Relationships between understory plant diversity and NCER were not significant for species richness (P>0.05), Shannon’s (P>0.05) and Simpson’s (P>0.05) diversity indices.
However, ANPP, net changes in C stocks, and understory plant communities were unrelated (P>0.05). These data highlight variability in second-growth forests that may have strong implications for net ecosystem productivity (NEP). We estimate NPP at 7.75 Mg C ha-1 yr-1, and suggest that this and other plot level measurements imply an upper bounds on NEP of ~3.7 Mg C ha-1 yr-1, and a lower bounds of ~2.7 Mg C ha-1 yr-1.
ABSTRACT
In order to determine patterns in carbon (C) storage and flux rates in a Pacific Northwest second-growth forest, we assess variability in 1) Above-ground net primary
productivity (ANPP); 2) Net soil CO2
efflux (NCER) in relation to presence of coniferous, deciduous, and nitrogen (N) fixing tree species and understory species.
Four major findings arose from our study: 1) We found a positive linear
relationship between ANPP and tree species richness, where overstory richness explained 35% of NPP (r2=0.35, P<0.05; Figure 2). 2) MULTIPANEL. Mean ANPP was ANOVA only mildly different among stands dominated by multiple evergreen, deciduous, and an N-fixing tree species. Trends suggested decreases in ANPP with
stand dominance of any single species. 3) We also find a positive relationship between average growing-season (April-October) NCER and productivity (r2=0.75, P<0.05), additionally plots with more tree species generally had higher NCER got a (r2=0.30, P<0.05); 4) Variation in overstory stand dominance was strongly
predictive of understory plant community composition (MRPP P<0.05). Relationships between understory plant diversity and NCER were not significant for species richness (P>0.05), Shannon’s (P>0.05) and Simpson’s
(P>0.05) diversity indices.
However, ANPP, net changes in C stocks, and understory plant communities were unrelated (P>0.05). These data highlight variability in second-growth forests that may have strong implications for net ecosystem productivity (NEP). We estimate NPP at 7.75
Mg C ha-1 yr-1, and suggest that this and other plot level measurements imply an upper bounds on NEP of ~3.7 Mg C ha-1 yr-1, and a lower bounds of ~2.7 Mg C ha-1 yr-1.
10 mSide view
Perspective
view
Overhead
view
63 m
10 m
J. Huey J. Huey J. HueyJ. Huey