Embed Size (px)
Citation preview
1
Understanding and Applying TM-30-15
Michael Royer Pacific Northwest National Laboratory
Kevin Houser Penn State University
DOE+IES Webinar | September 15, 2015
2
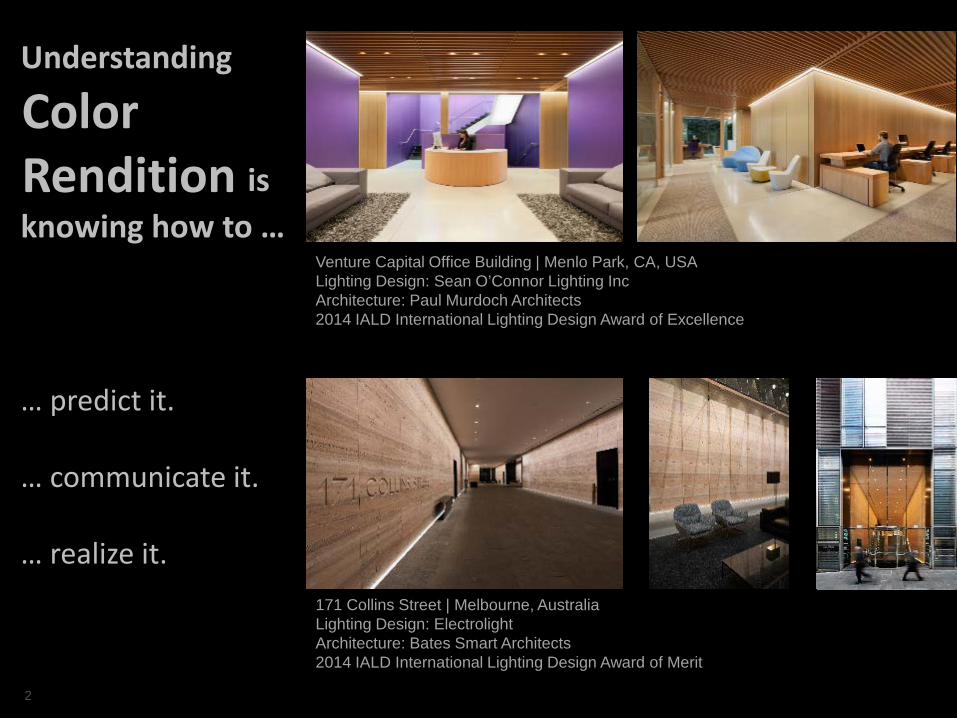
Understanding
Color Rendition is knowing how to …
… predict it. … communicate it. … realize it.
Venture Capital Office Building | Menlo Park, CA, USA Lighting Design: Sean O’Connor Lighting Inc Architecture: Paul Murdoch Architects 2014 IALD International Lighting Design Award of Excellence
171 Collins Street | Melbourne, Australia Lighting Design: Electrolight Architecture: Bates Smart Architects 2014 IALD International Lighting Design Award of Merit
Color Rendition
3
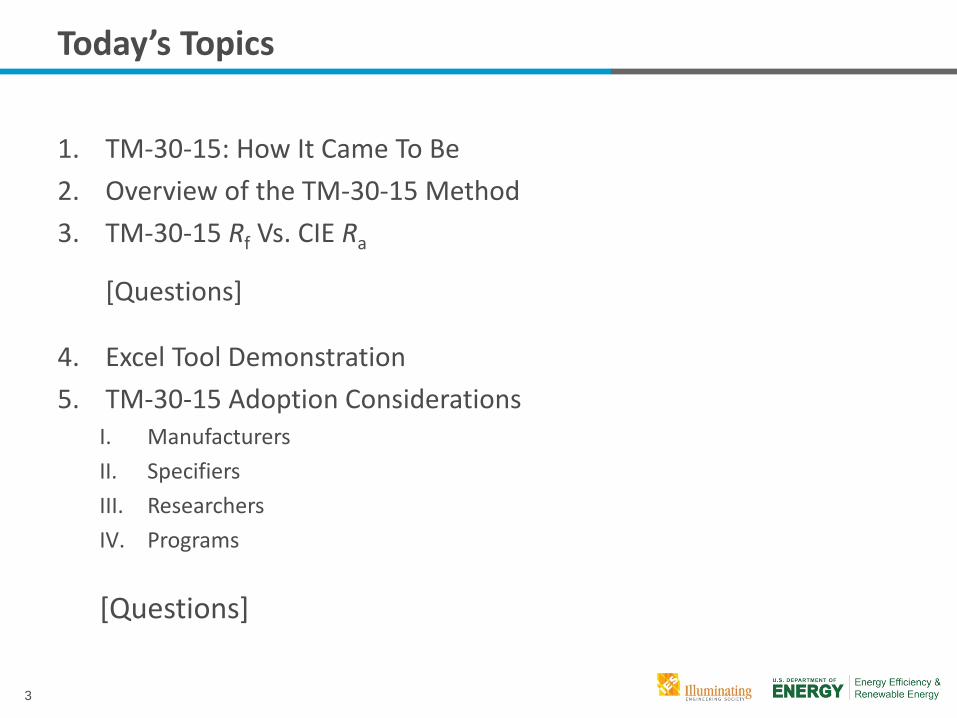
Today’s Topics
1. TM-30-15: How It Came To Be 2. Overview of the TM-30-15 Method 3. TM-30-15 Rf Vs. CIE Ra
[Questions]
4. Excel Tool Demonstration 5. TM-30-15 Adoption Considerations
I. Manufacturers II. Specifiers III. Researchers IV. Programs
[Questions]
4
Part 1: TM-30-15: How It Came To Be
5
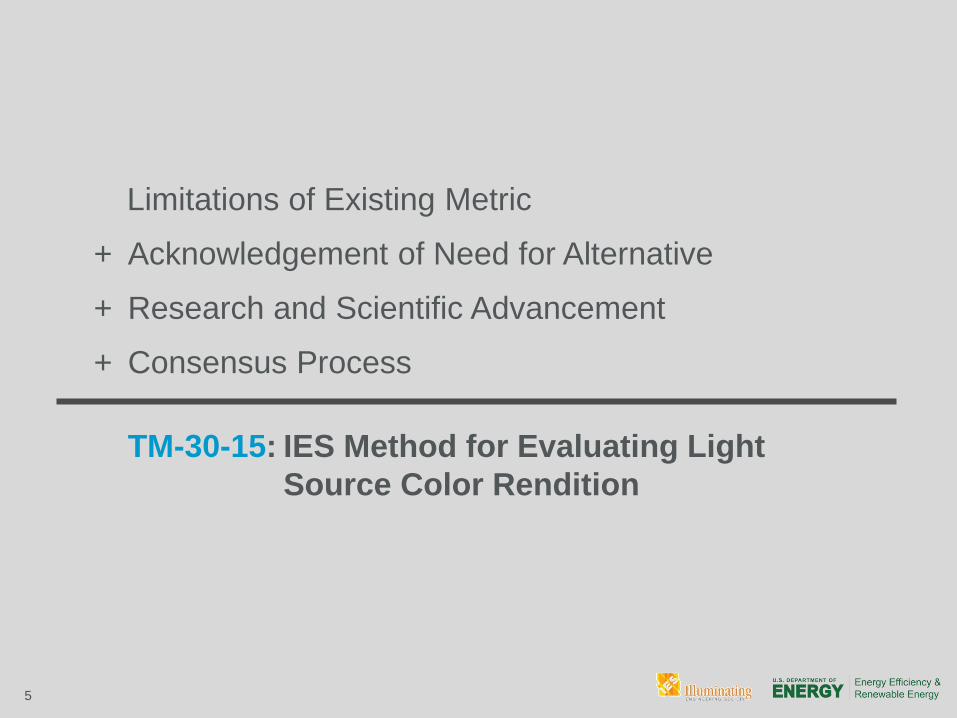
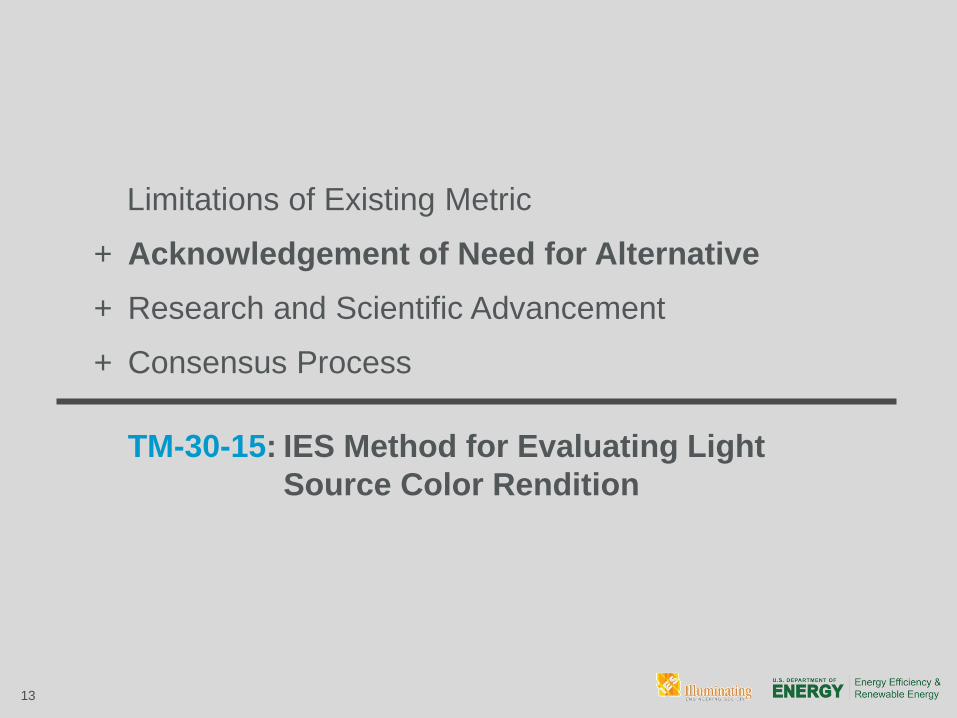
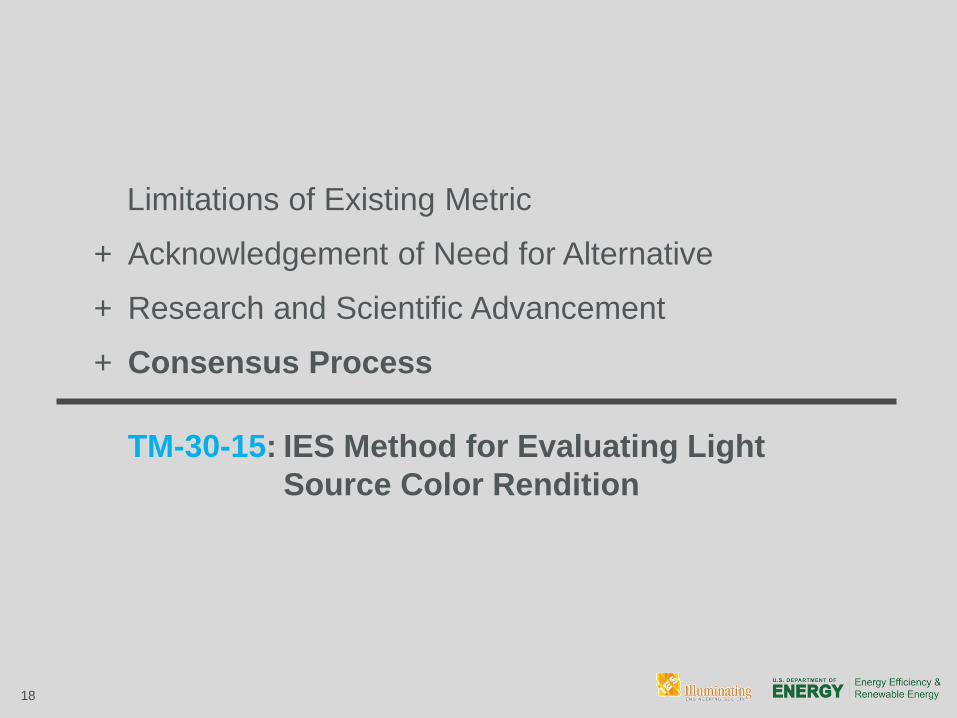
Limitations of Existing Metric
Acknowledgement of Need for Alternative +
Research and Scientific Advancement +
Consensus Process +
TM-30-15: IES Method for Evaluating Light Source Color Rendition
6
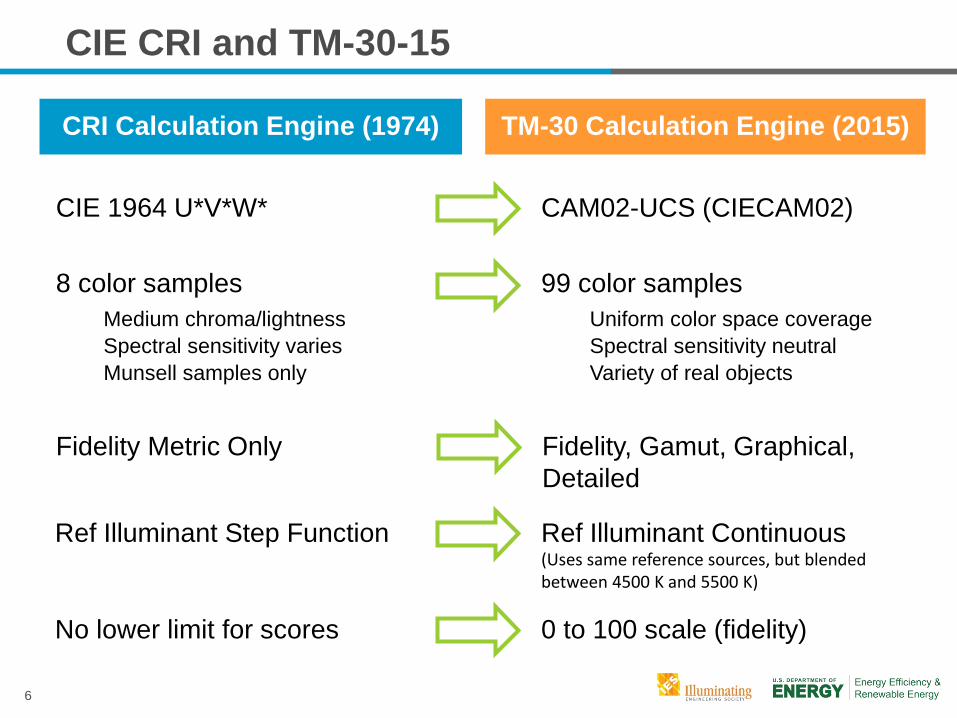
CIE CRI and TM-30-15
CRI Calculation Engine (1974) TM-30 Calculation Engine (2015)
CIE 1964 U*V*W* CAM02-UCS (CIECAM02)
Ref Illuminant Step Function Ref Illuminant Continuous (Uses same reference sources, but blended between 4500 K and 5500 K)
8 color samples 99 color samples Medium chroma/lightness Spectral sensitivity varies
Uniform color space coverage Spectral sensitivity neutral Variety of real objects Munsell samples only
No lower limit for scores 0 to 100 scale (fidelity)
Fidelity Metric Only Fidelity, Gamut, Graphical, Detailed

7
“Original”
Image courtesy of Randy Burkett Lighting Design
8
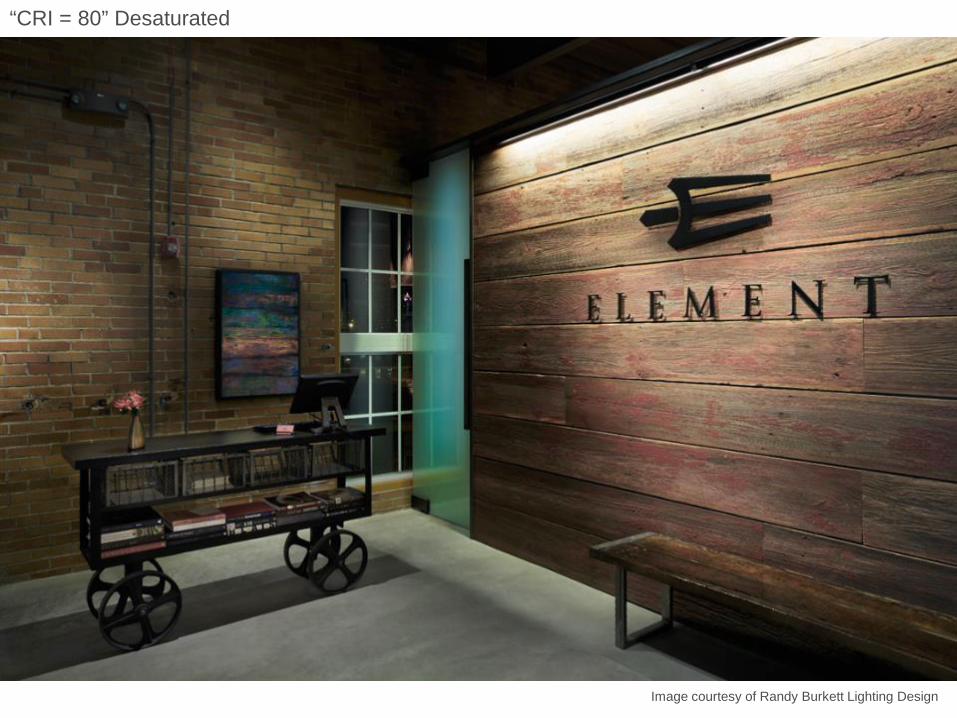
“CRI = 80” Desaturated
Image courtesy of Randy Burkett Lighting Design
9
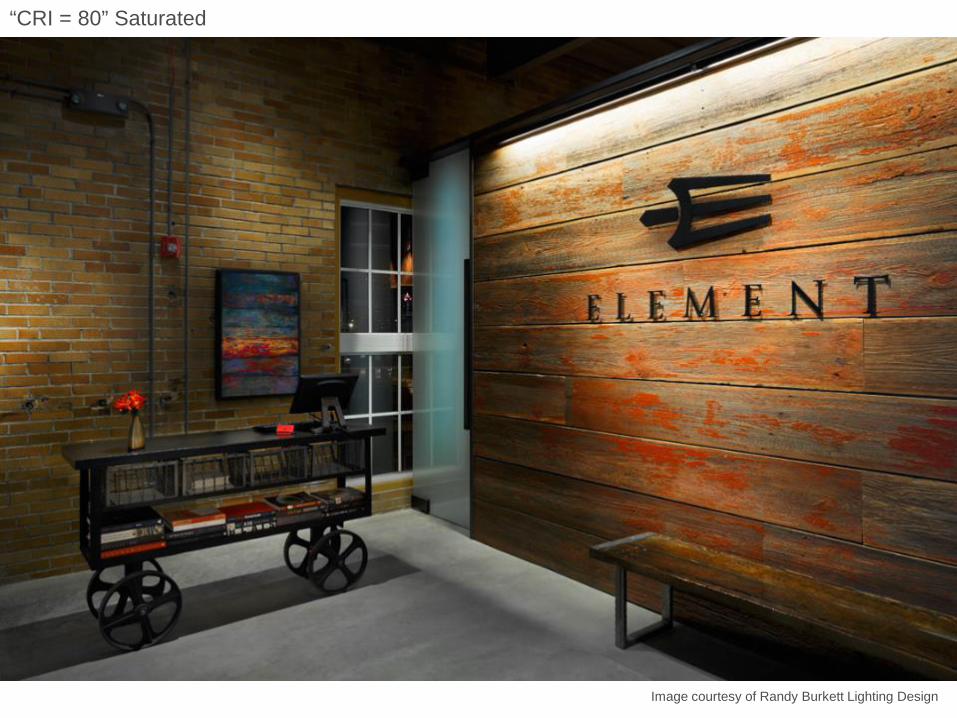
“CRI = 80” Saturated
Image courtesy of Randy Burkett Lighting Design
10
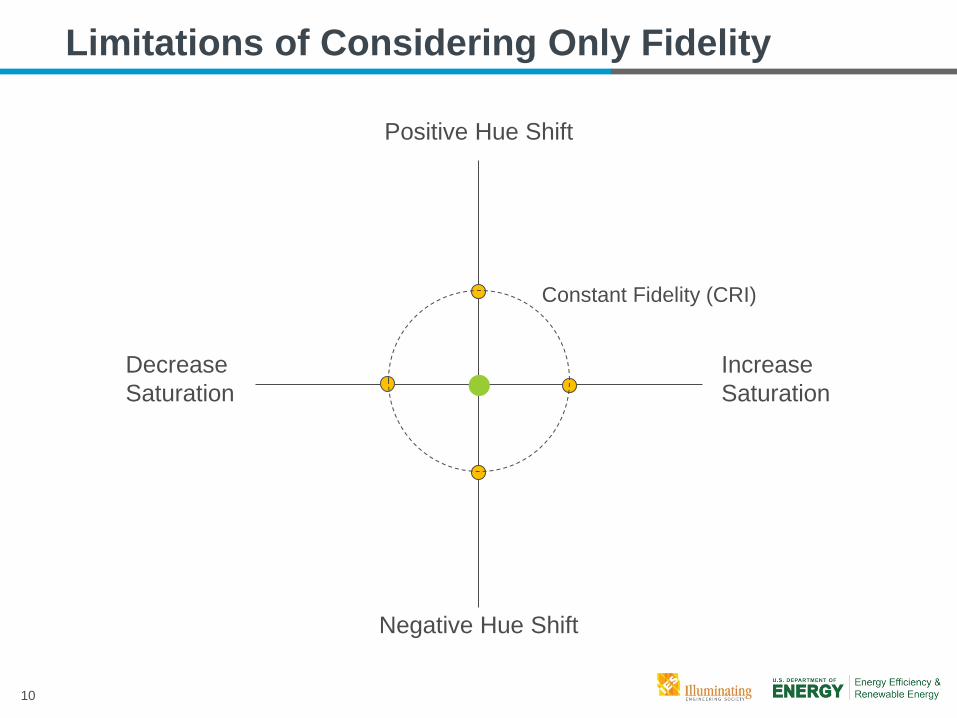
Limitations of Considering Only Fidelity
Perfect Fidelity
Increase Saturation
Decrease Saturation
Positive Hue Shift
Negative Hue Shift
CRI = 80 CRI = 80
Constant Fidelity (CRI)
11
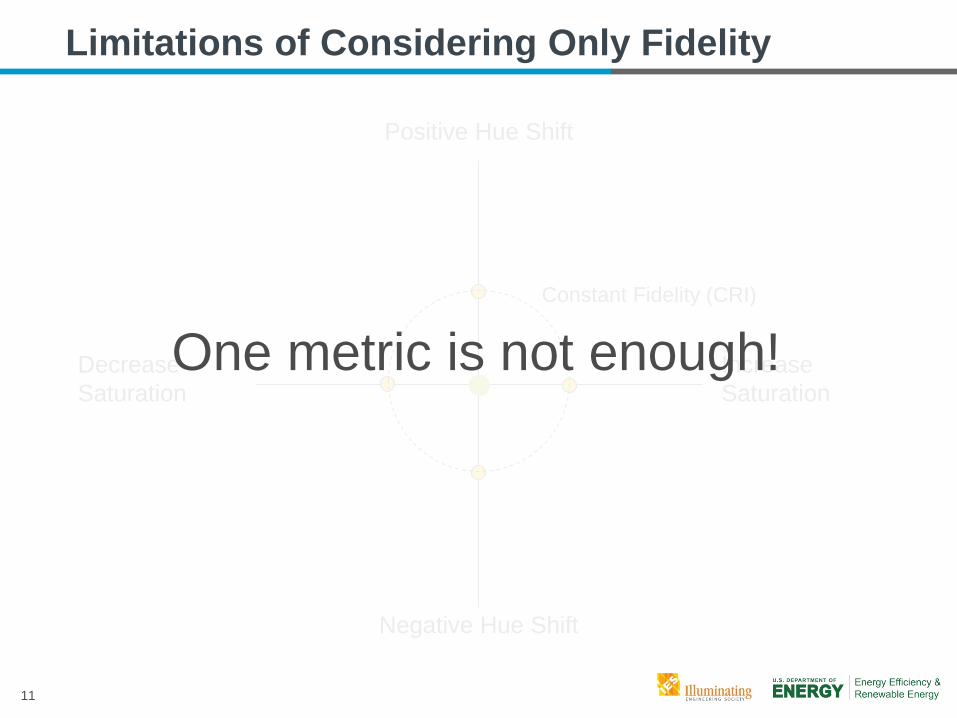
Limitations of Considering Only Fidelity
Perfect Fidelity
Increase Saturation
Decrease Saturation
Positive Hue Shift
Negative Hue Shift
CRI = 80 CRI = 80
Constant Fidelity (CRI)
One metric is not enough!
12
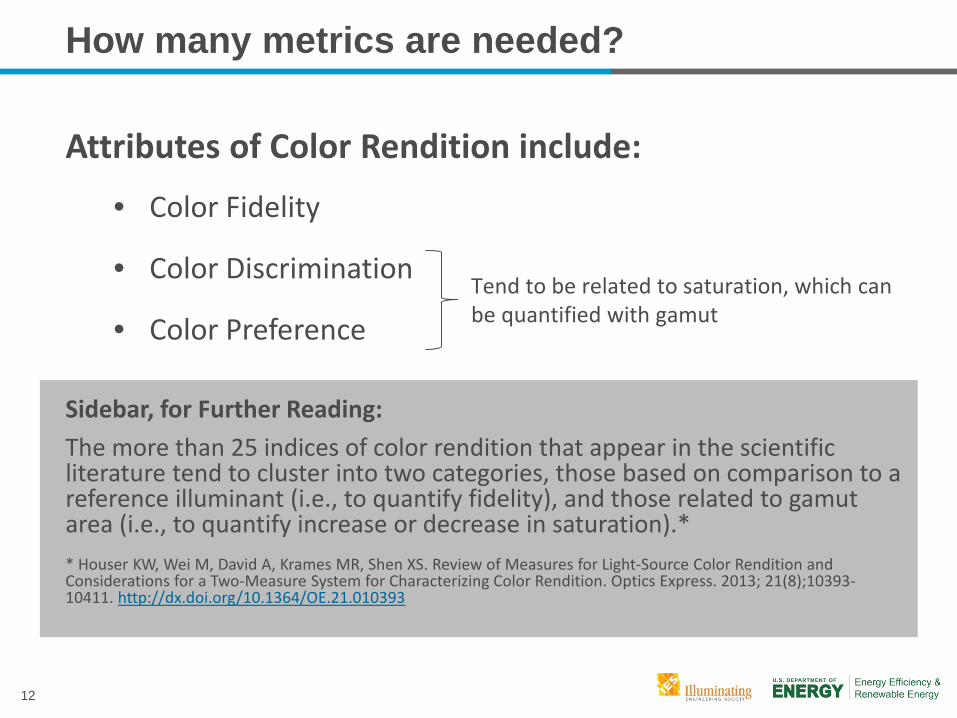
Attributes of Color Rendition include: • Color Fidelity
• Color Discrimination
• Color Preference
Sidebar, for Further Reading:
The more than 25 indices of color rendition that appear in the scientific literature tend to cluster into two categories, those based on comparison to a reference illuminant (i.e., to quantify fidelity), and those related to gamut area (i.e., to quantify increase or decrease in saturation).*
* Houser KW, Wei M, David A, Krames MR, Shen XS. Review of Measures for Light-Source Color Rendition and Considerations for a Two-Measure System for Characterizing Color Rendition. Optics Express. 2013; 21(8);10393-10411. http://dx.doi.org/10.1364/OE.21.010393
How many metrics are needed?
Tend to be related to saturation, which can be quantified with gamut
13
Limitations of Existing Metric
Acknowledgement of Need for Alternative +
Research and Scientific Advancement +
Consensus Process +
TM-30-15: IES Method for Evaluating Light Source Color Rendition
14
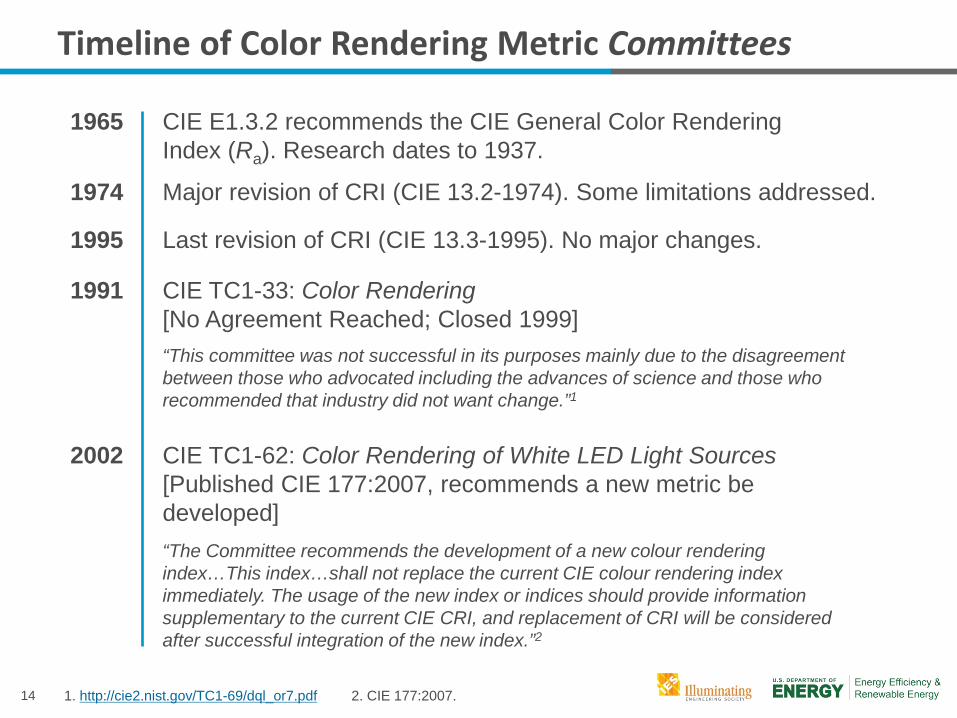
Timeline of Color Rendering Metric Committees
CIE TC1-62: Color Rendering of White LED Light Sources [Published CIE 177:2007, recommends a new metric be developed]
“The Committee recommends the development of a new colour rendering index…This index…shall not replace the current CIE colour rendering index immediately. The usage of the new index or indices should provide information supplementary to the current CIE CRI, and replacement of CRI will be considered after successful integration of the new index.”2
2002
1965 CIE E1.3.2 recommends the CIE General Color Rendering Index (Ra). Research dates to 1937.
CIE TC1-33: Color Rendering [No Agreement Reached; Closed 1999]
“This committee was not successful in its purposes mainly due to the disagreement between those who advocated including the advances of science and those who recommended that industry did not want change.”1
1991
1. http://cie2.nist.gov/TC1-69/dql_or7.pdf 2. CIE 177:2007.
1995 Last revision of CRI (CIE 13.3-1995). No major changes.
1974 Major revision of CRI (CIE 13.2-1974). Some limitations addressed.
15
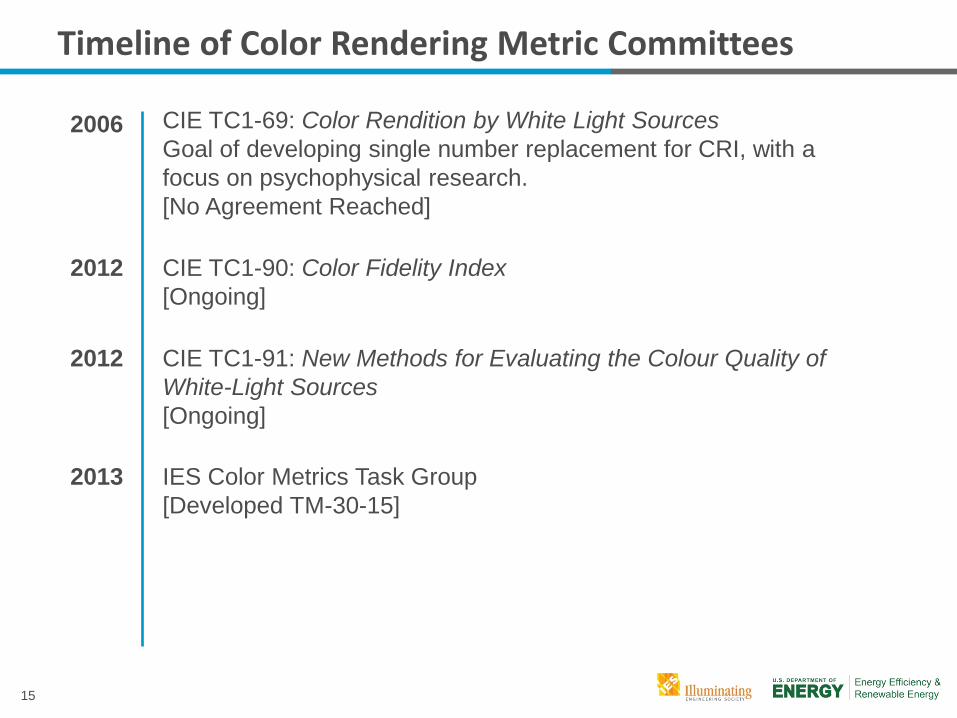
Timeline of Color Rendering Metric Committees
2013
2012 CIE TC1-90: Color Fidelity Index [Ongoing]
2012 CIE TC1-91: New Methods for Evaluating the Colour Quality of White-Light Sources [Ongoing]
2006
IES Color Metrics Task Group [Developed TM-30-15]
CIE TC1-69: Color Rendition by White Light Sources Goal of developing single number replacement for CRI, with a focus on psychophysical research. [No Agreement Reached]
16
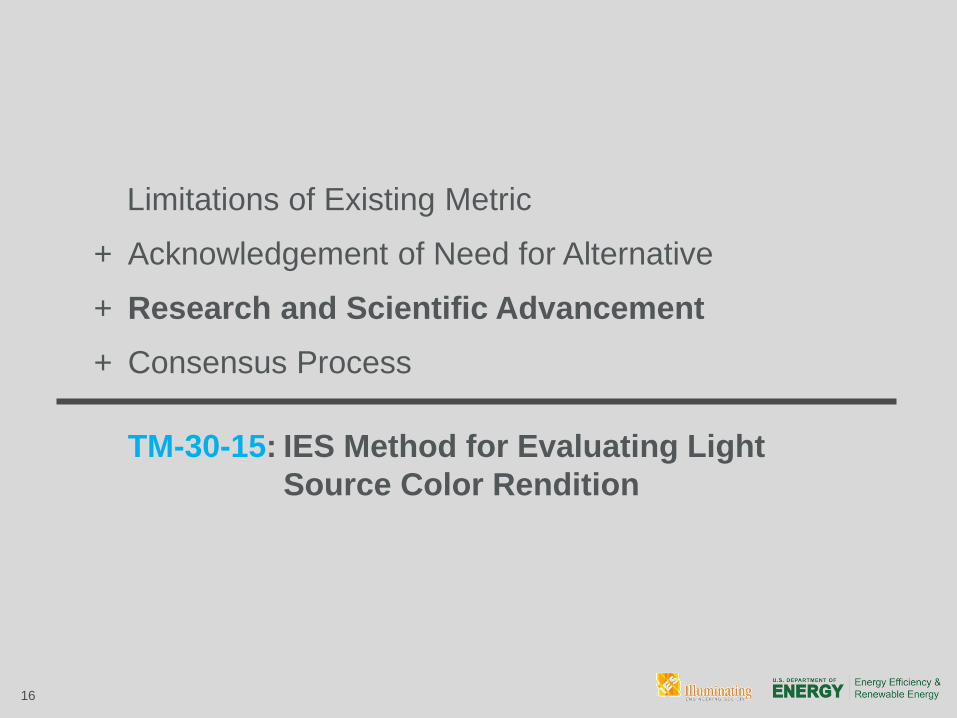
Limitations of Existing Metric
Acknowledgement of Need for Alternative +
Research and Scientific Advancement +
Consensus Process +
TM-30-15: IES Method for Evaluating Light Source Color Rendition
17
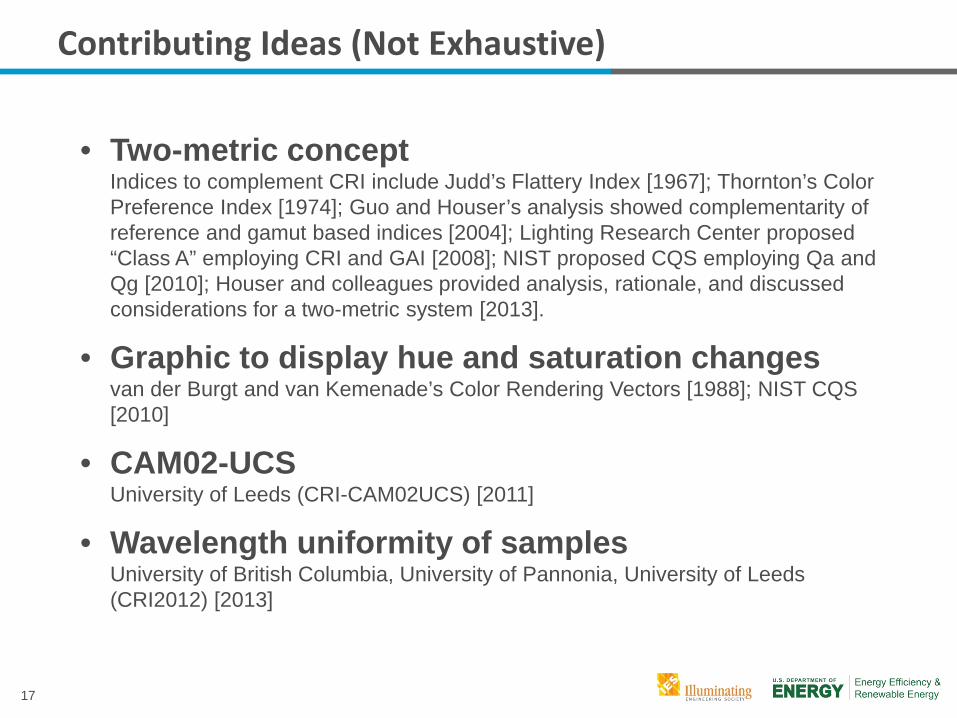
Contributing Ideas (Not Exhaustive)
• Two-metric concept Indices to complement CRI include Judd’s Flattery Index [1967]; Thornton’s Color Preference Index [1974]; Guo and Houser’s analysis showed complementarity of reference and gamut based indices [2004]; Lighting Research Center proposed “Class A” employing CRI and GAI [2008]; NIST proposed CQS employing Qa and Qg [2010]; Houser and colleagues provided analysis, rationale, and discussed considerations for a two-metric system [2013].
• Graphic to display hue and saturation changes van der Burgt and van Kemenade’s Color Rendering Vectors [1988]; NIST CQS [2010]
• CAM02-UCS University of Leeds (CRI-CAM02UCS) [2011]
• Wavelength uniformity of samples University of British Columbia, University of Pannonia, University of Leeds (CRI2012) [2013]
18
Limitations of Existing Metric
Acknowledgement of Need for Alternative +
Research and Scientific Advancement +
Consensus Process +
TM-30-15: IES Method for Evaluating Light Source Color Rendition
19
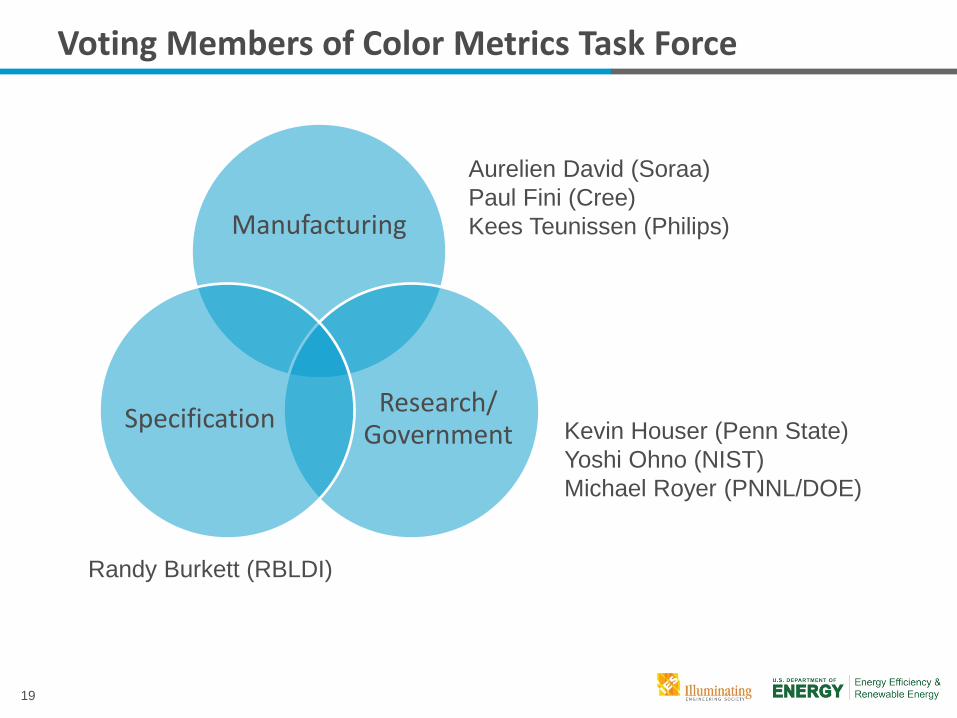
Voting Members of Color Metrics Task Force
Manufacturing
Research/ Government Specification
Aurelien David (Soraa) Paul Fini (Cree) Kees Teunissen (Philips)
Randy Burkett (RBLDI)
Kevin Houser (Penn State) Yoshi Ohno (NIST) Michael Royer (PNNL/DOE)
20
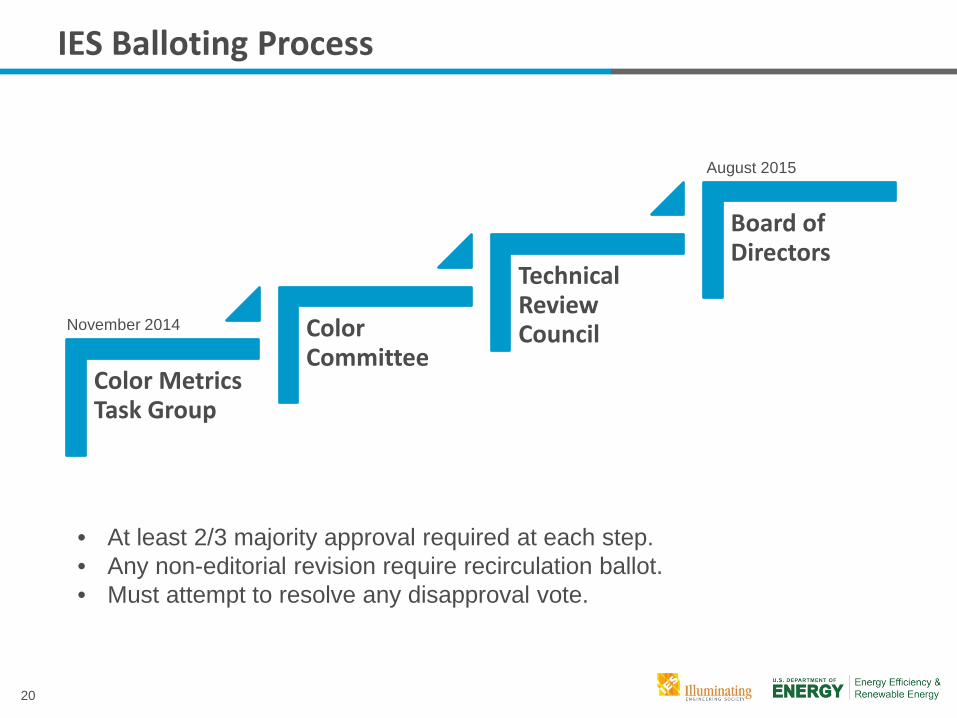
IES Balloting Process
Color Metrics Task Group
Color Committee
Technical Review Council
Board of Directors
November 2014
August 2015
• At least 2/3 majority approval required at each step. • Any non-editorial revision require recirculation ballot. • Must attempt to resolve any disapproval vote.
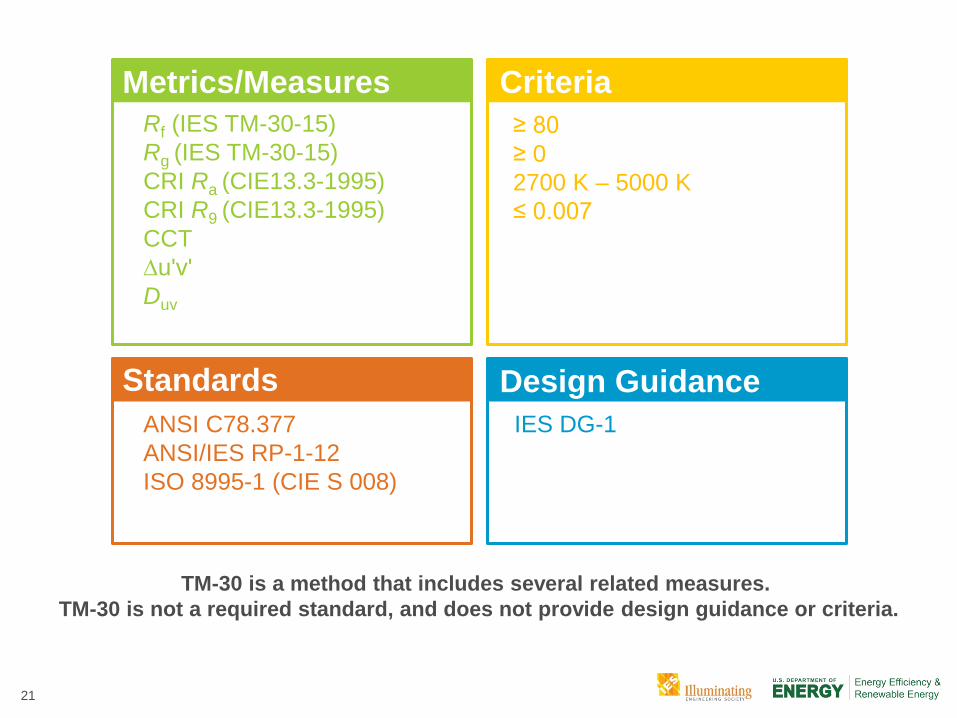
21
TM-30 is a method that includes several related measures. TM-30 is not a required standard, and does not provide design guidance or criteria.
Metrics/Measures Criteria Rf (IES TM-30-15) Rg (IES TM-30-15) CRI Ra (CIE13.3-1995) CRI R9 (CIE13.3-1995) CCT ∆u'v' Duv
≥ 80 ≥ 0 2700 K – 5000 K ≤ 0.007
Standards ANSI C78.377 ANSI/IES RP-1-12 ISO 8995-1 (CIE S 008)
Design Guidance IES DG-1
22
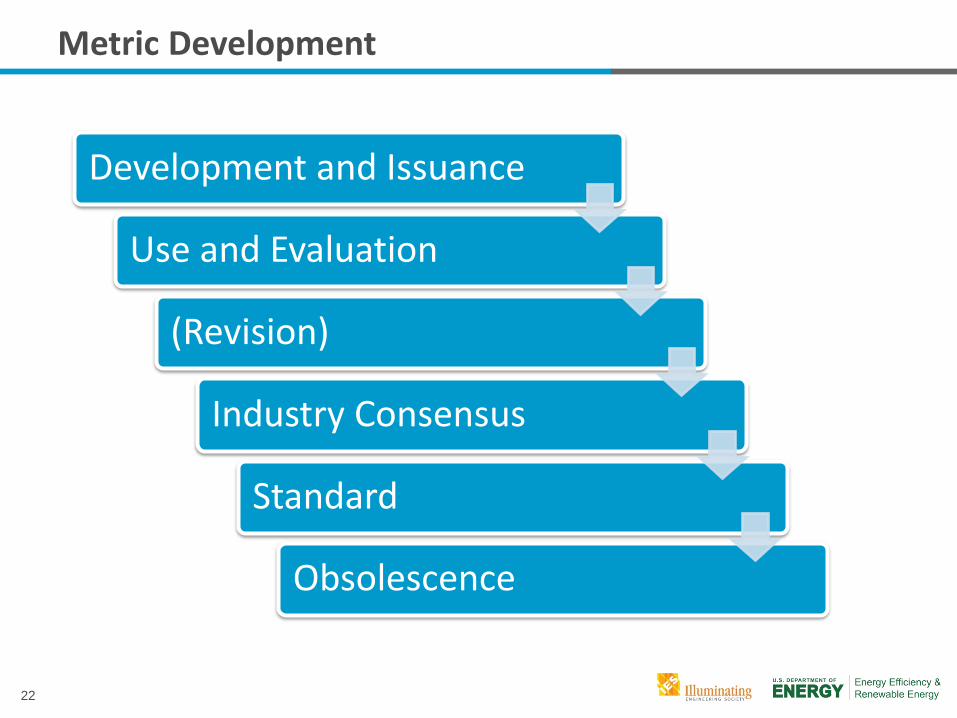
Obsolescence
Metric Development
Development and Issuance
Use and Evaluation
(Revision)
Industry Consensus
Standard
23
Part 2: Overview of the TM-30-15 Method
Kevin Houser
24
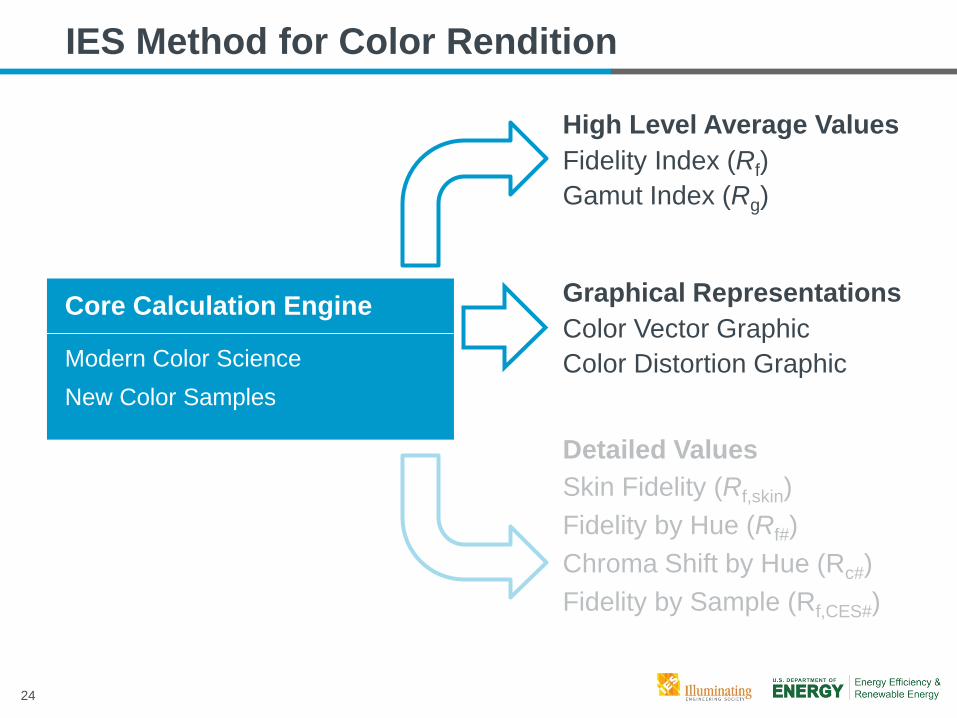
Fidelity Index (Rf)
IES Method for Color Rendition
Gamut Index (Rg)
High Level Average Values
Core Calculation Engine
Modern Color Science New Color Samples
Color Vector Graphic Color Distortion Graphic
Graphical Representations
Skin Fidelity (Rf,skin) Fidelity by Hue (Rf#) Chroma Shift by Hue (Rc#) Fidelity by Sample (Rf,CES#)
Detailed Values
25
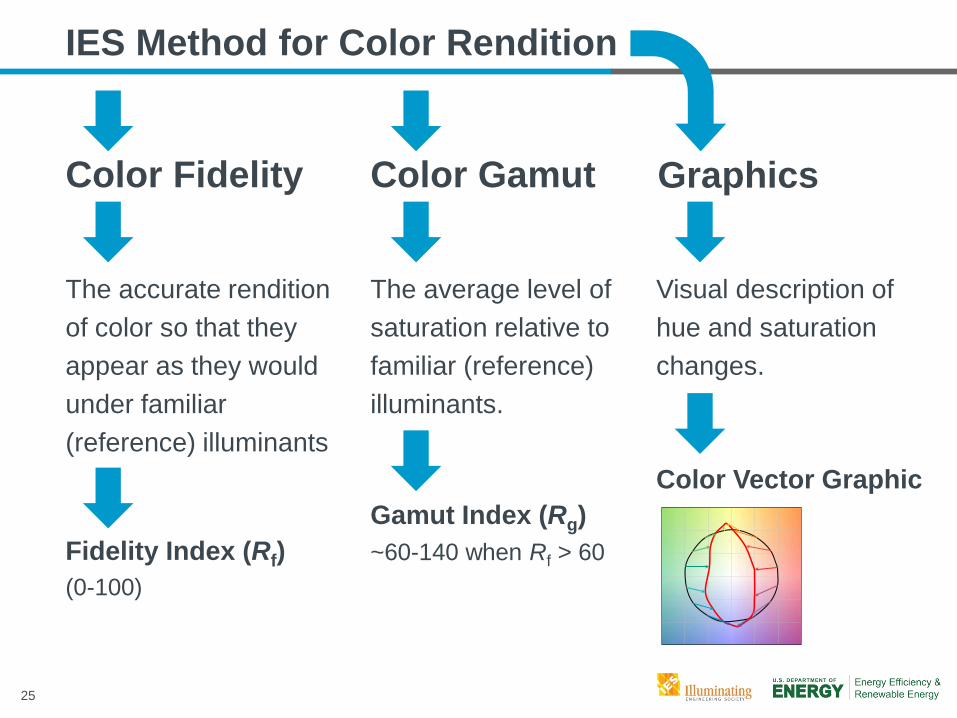
Color Fidelity
Fidelity Index (Rf)
IES Method for Color Rendition
The accurate rendition of color so that they appear as they would under familiar (reference) illuminants
Color Gamut
The average level of saturation relative to familiar (reference) illuminants.
Gamut Index (Rg)
(0-100) ~60-140 when Rf > 60
Graphics
Visual description of hue and saturation changes.
Color Vector Graphic
26
-40
-30
-20
-10
0
10
20
30
40
-40 -30 -20 -10 0 10 20 30 40
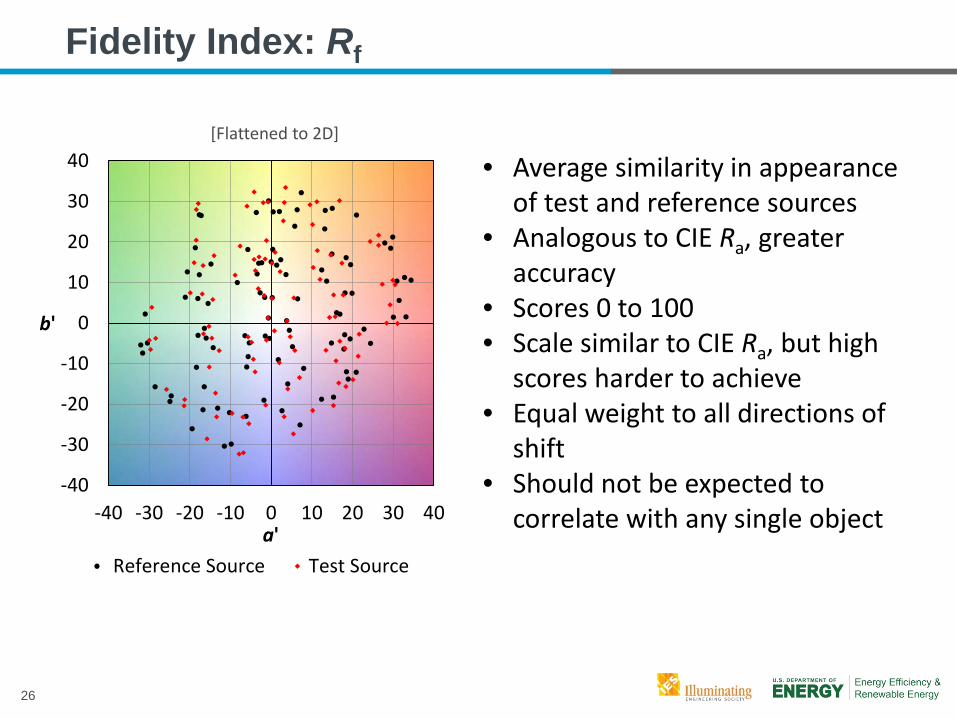
Reference Source Test Source
• Average similarity in appearance of test and reference sources
• Analogous to CIE Ra, greater accuracy
• Scores 0 to 100 • Scale similar to CIE Ra, but high
scores harder to achieve • Equal weight to all directions of
shift • Should not be expected to
correlate with any single object
Fidelity Index: Rf
[Flattened to 2D]
b'
a'
27
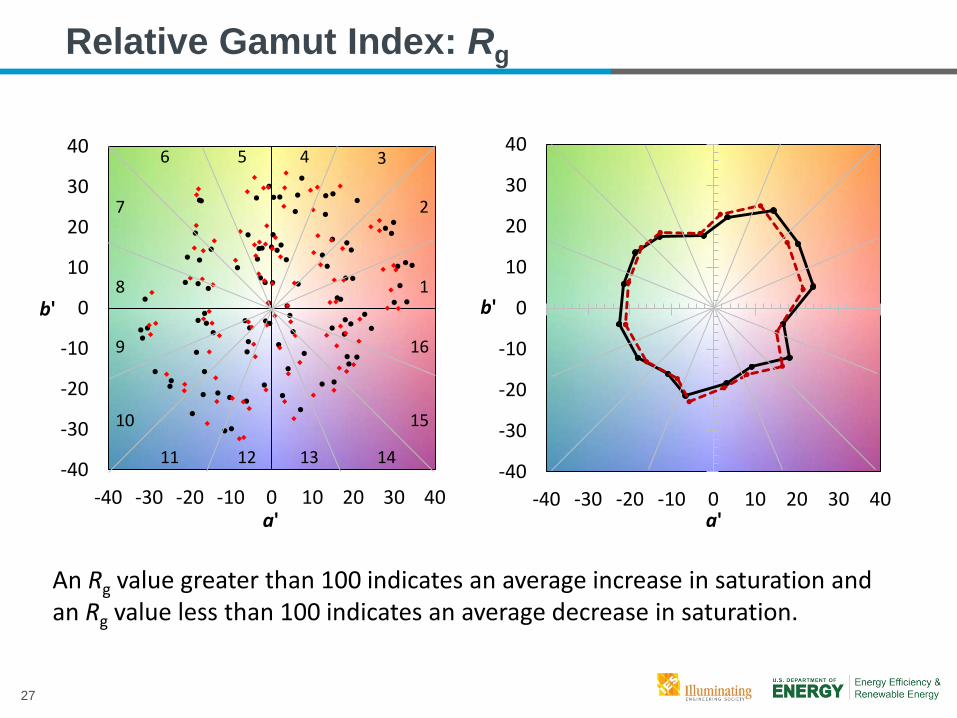
Relative Gamut Index: Rg
An Rg value greater than 100 indicates an average increase in saturation and an Rg value less than 100 indicates an average decrease in saturation.
-40
-30
-20
-10
0
10
20
30
40
-40 -30 -20 -10 0 10 20 30 40
b'
a'
-40
-30
-20
-10
0
10
20
30
40
-40 -30 -20 -10 0 10 20 30 40
1
2
16
15
8
7
9
10
3 4 5 6
14 13 12 11
b'
a'
28
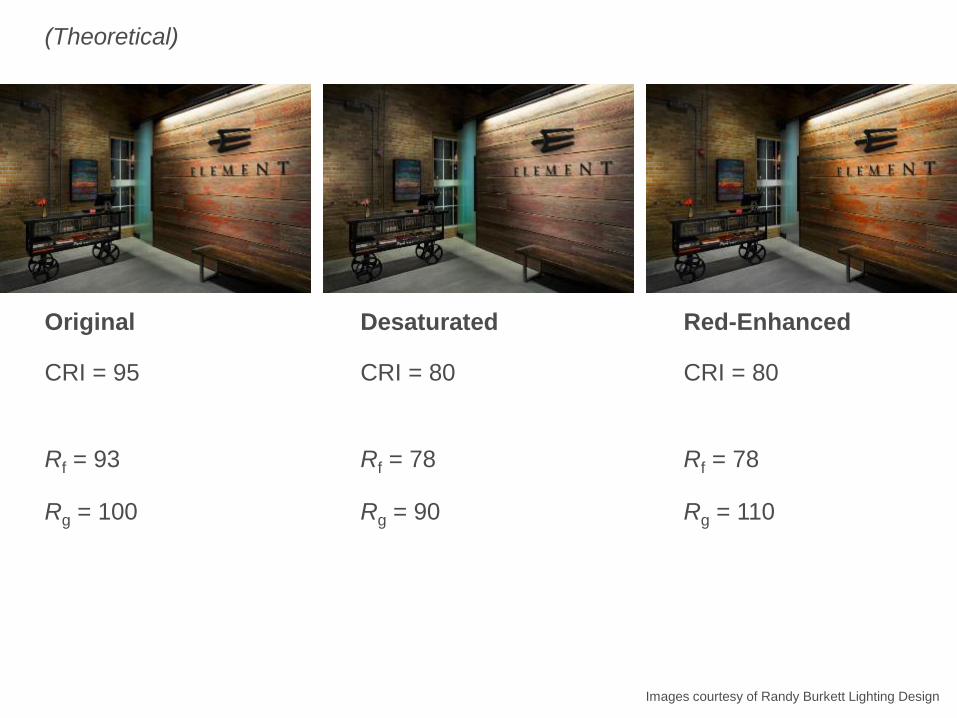
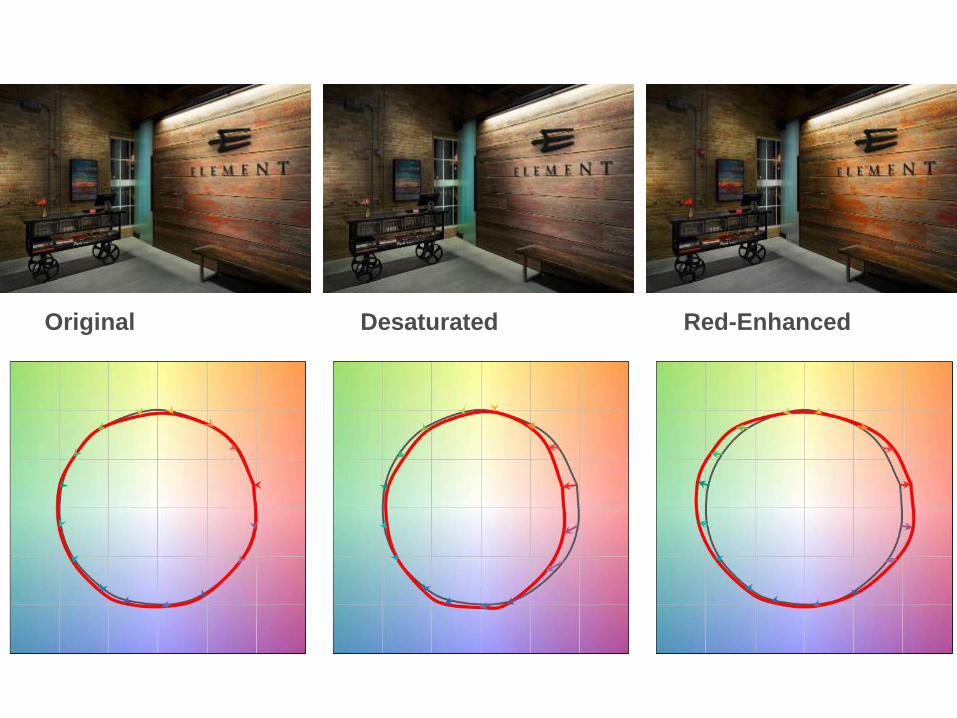
Original Desaturated Red-Enhanced
CRI = 95 CRI = 80 CRI = 80
Rf = 93 Rf = 78 Rf = 78
Rg = 100 Rg = 90 Rg = 110
Images courtesy of Randy Burkett Lighting Design
(Theoretical)
29
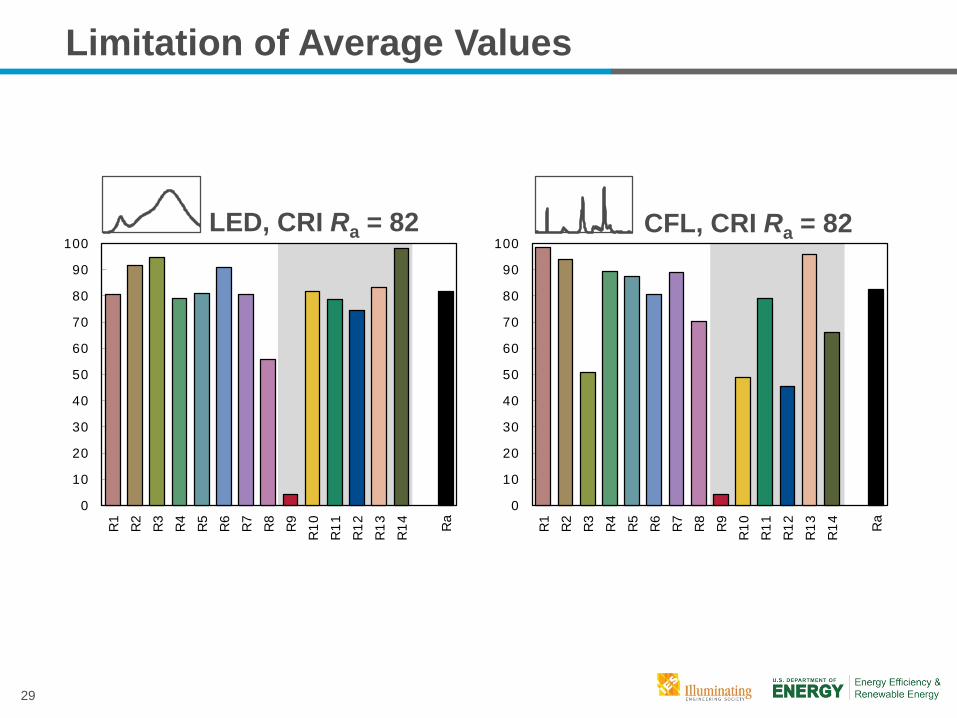
Limitation of Average Values
0
10
20
30
40
50
60
70
80
90
100
R1
R2
R3
R4
R5
R6
R7
R8
R9
R10
R11
R12
R13
R14 Ra
0
10
20
30
40
50
60
70
80
90
100
R1
R2
R3
R4
R5
R6
R7
R8
R9
R10
R11
R12
R13
R14 Ra
LED, CRI Ra = 82 CFL, CRI Ra = 82
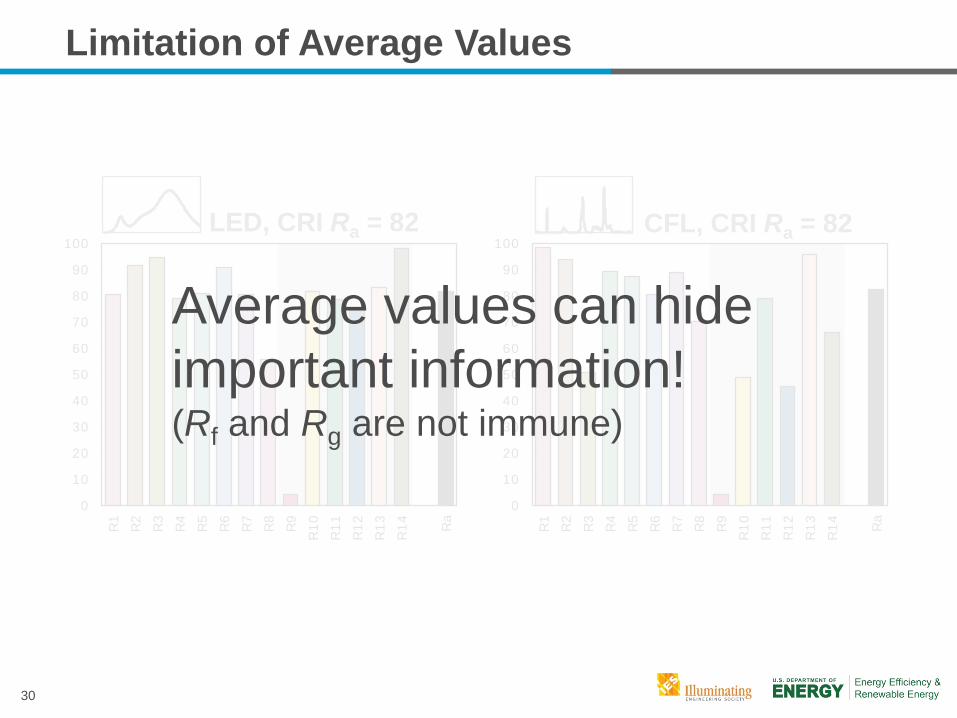
30
0
10
20
30
40
50
60
70
80
90
100
R1
R2
R3
R4
R5
R6
R7
R8
R9
R10
R11
R12
R13
R14 Ra
0
10
20
30
40
50
60
70
80
90
100
R1
R2
R3
R4
R5
R6
R7
R8
R9
R10
R11
R12
R13
R14 Ra
LED, CRI Ra = 82 CFL, CRI Ra = 82
Average values can hide important information! (Rf and Rg are not immune)
Limitation of Average Values
31
380 430 480 530 580 630 680 730 780
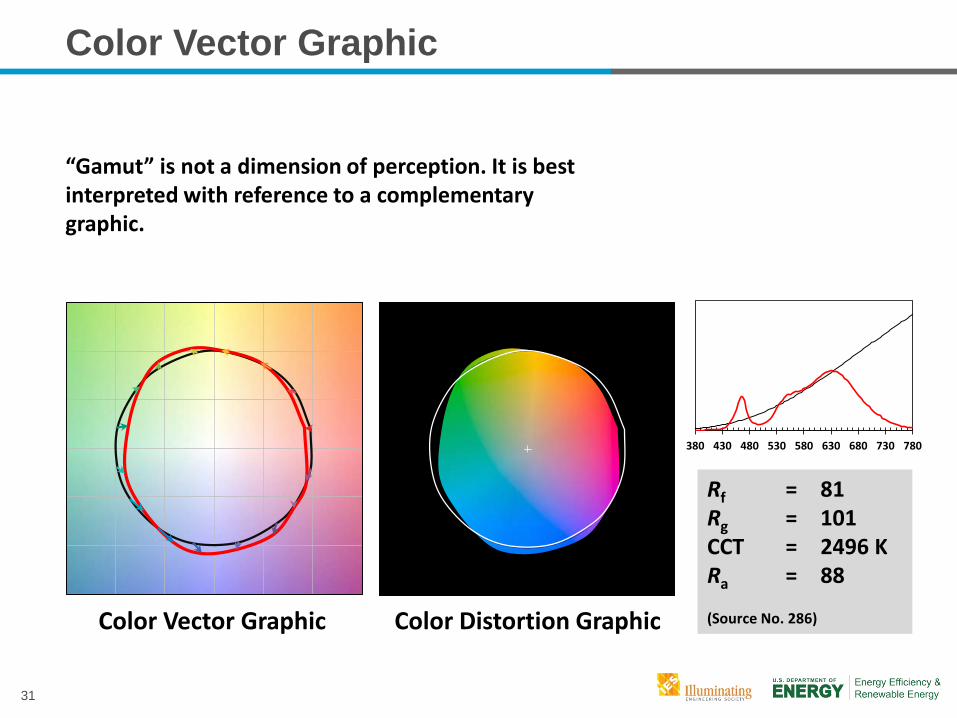
Rf = 81 Rg = 101 CCT = 2496 K Ra = 88 (Source No. 286)
Color Vector Graphic
“Gamut” is not a dimension of perception. It is best interpreted with reference to a complementary graphic.
Color Vector Graphic Color Distortion Graphic
32
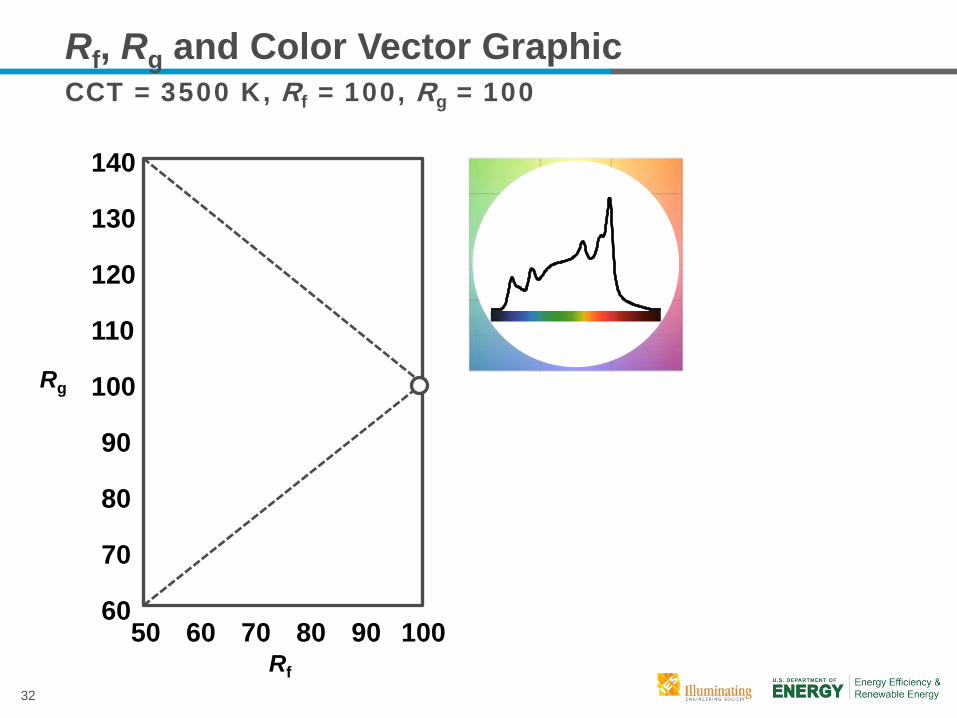
Rf, Rg and Color Vector Graphic CCT = 3500 K, Rf = 100, Rg = 100
Rf
Rg
140
120
130
110
100
90
80
70
60 50 60 70 80 90 100
33
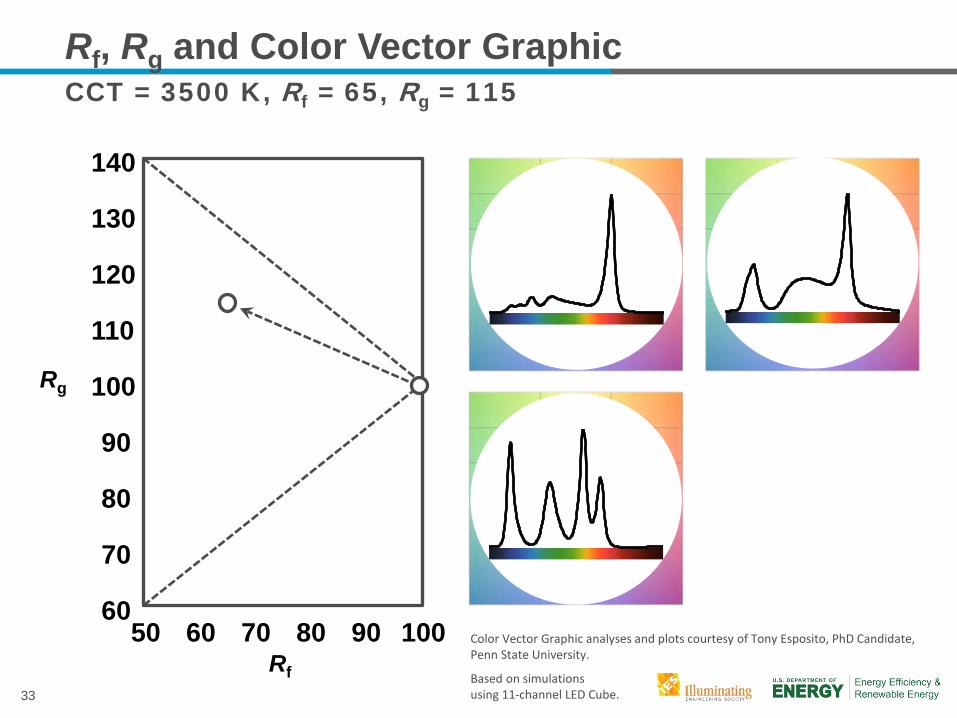
Rf
Rg
140
120
130
110
100
90
80
70
60 50 60 70 80 90 100
Rf, Rg and Color Vector Graphic CCT = 3500 K, Rf = 65, Rg = 115
Color Vector Graphic analyses and plots courtesy of Tony Esposito, PhD Candidate, Penn State University.
Based on simulations using 11-channel LED Cube.
34
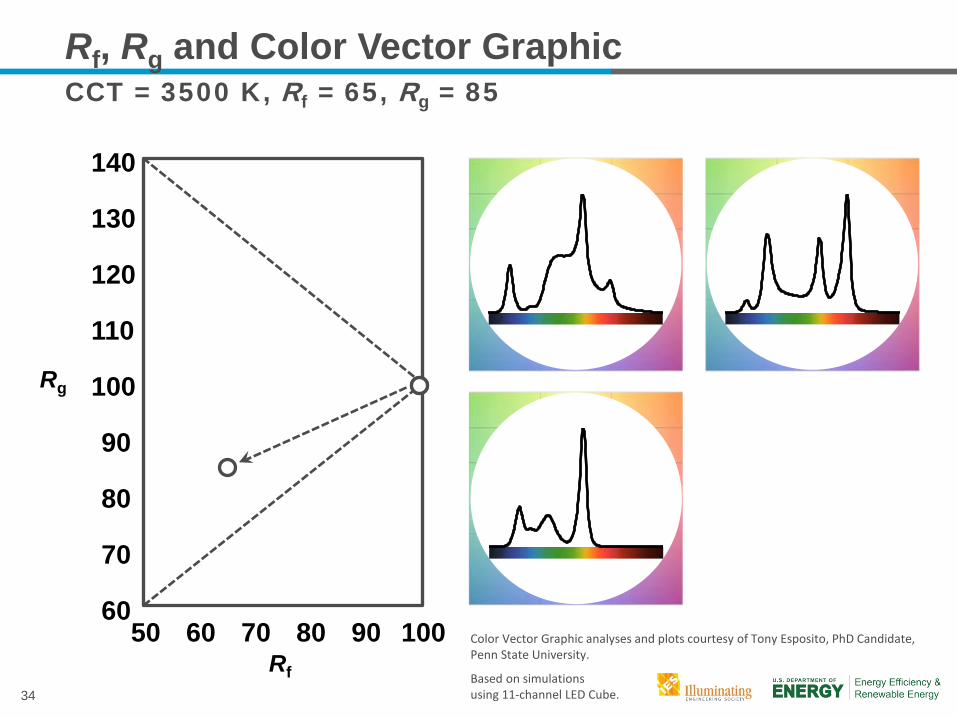
Rf
Rg
140
120
130
110
100
90
80
70
60 50 60 70 80 90 100
Rf, Rg and Color Vector Graphic CCT = 3500 K, Rf = 65, Rg = 85
Color Vector Graphic analyses and plots courtesy of Tony Esposito, PhD Candidate, Penn State University.
Based on simulations using 11-channel LED Cube.
35
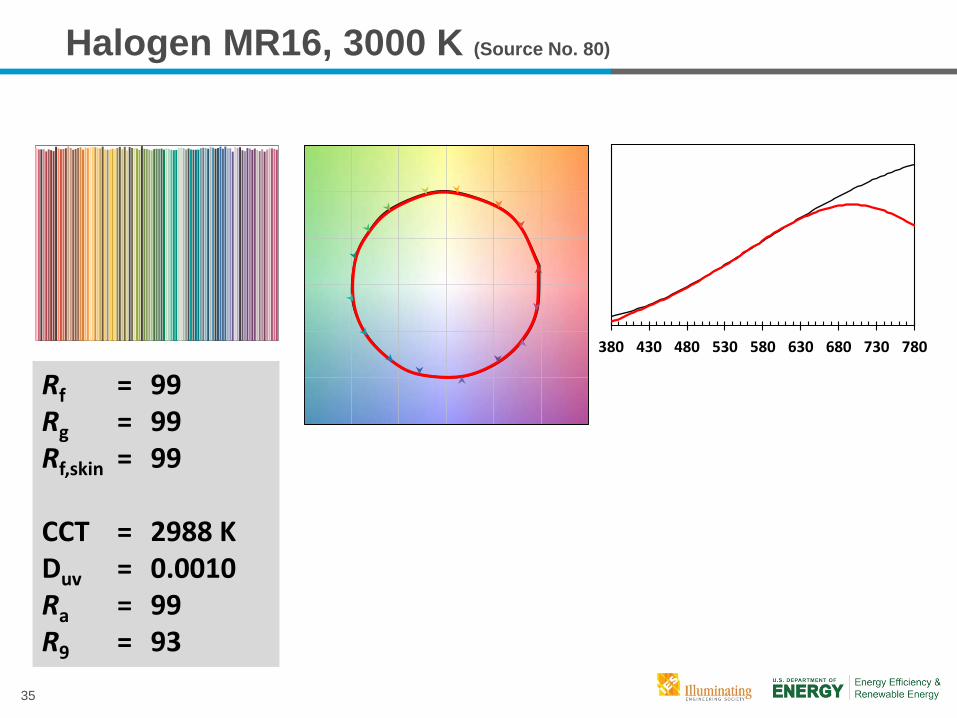
Halogen MR16, 3000 K (Source No. 80)
Rf = 99Rg = 99Rf,skin = 99
CCT = 2988 KDuv = 0.0010Ra = 99R9 = 93
380 430 480 530 580 630 680 730 780
36
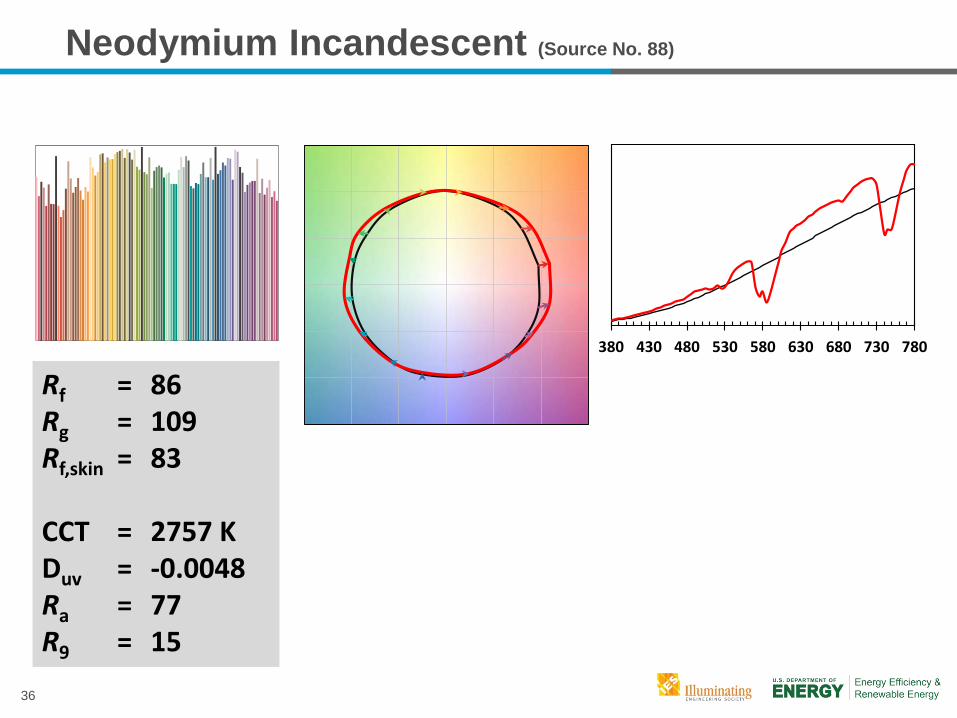
Neodymium Incandescent (Source No. 88)
Rf = 86Rg = 109Rf,skin = 83
CCT = 2757 KDuv = -0.0048Ra = 77R9 = 15
380 430 480 530 580 630 680 730 780
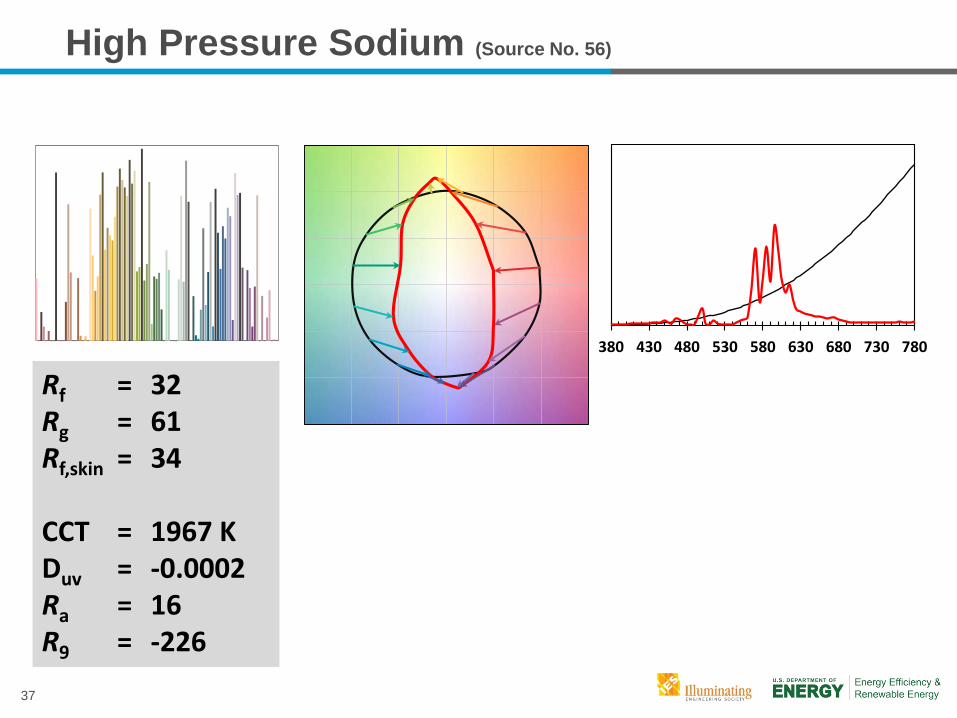
37
High Pressure Sodium (Source No. 56)
Rf = 32Rg = 61Rf,skin = 34
CCT = 1967 KDuv = -0.0002Ra = 16R9 = -226
380 430 480 530 580 630 680 730 780
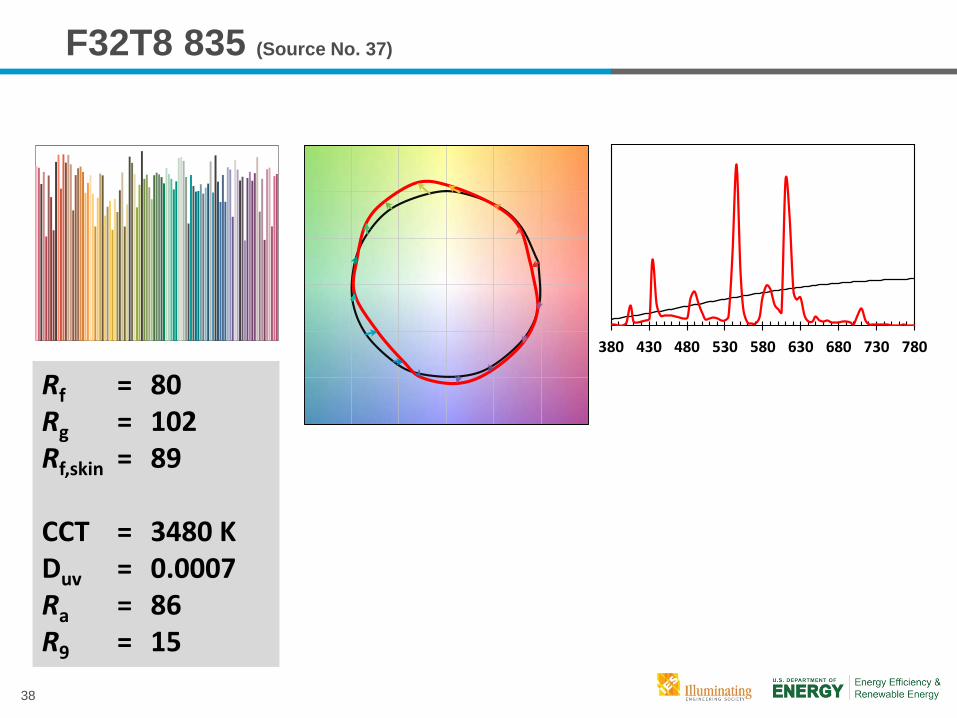
38
F32T8 835 (Source No. 37)
Rf = 80Rg = 102Rf,skin = 89
CCT = 3480 KDuv = 0.0007Ra = 86R9 = 15
380 430 480 530 580 630 680 730 780
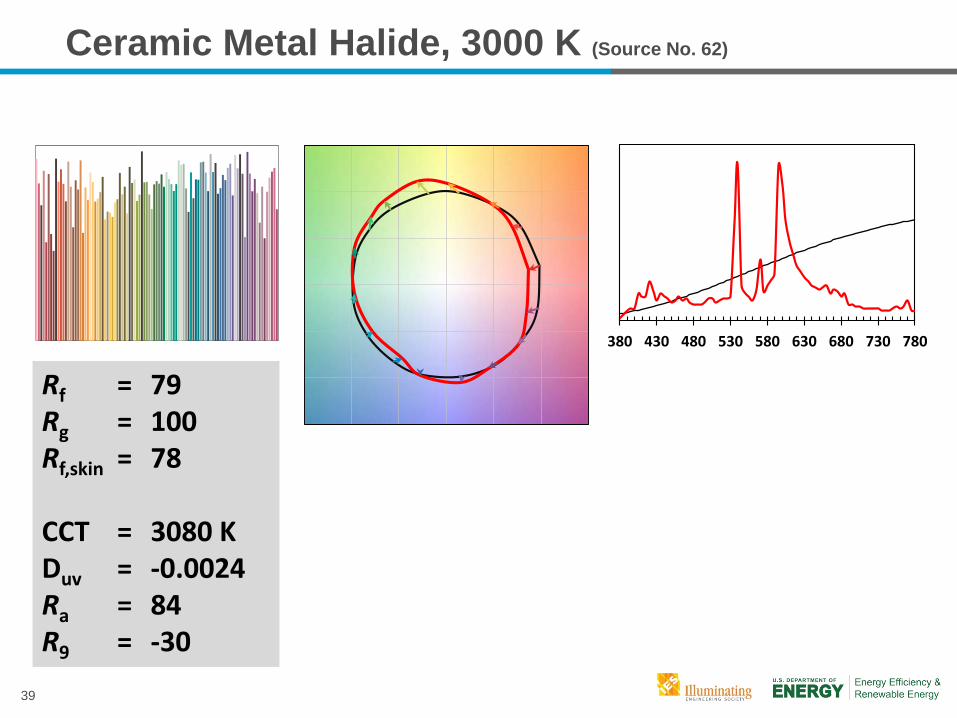
39
Ceramic Metal Halide, 3000 K (Source No. 62)
Rf = 79Rg = 100Rf,skin = 78
CCT = 3080 KDuv = -0.0024Ra = 84R9 = -30
380 430 480 530 580 630 680 730 780
40
CRI = 95 CRI = 80 CRI = 80
Rf = 93 Rf = 78 Rf = 78
Rg = 100 Rg = 90 Rg = 110
Original Desaturated Red-Enhanced
41
Part 3: IES Rf versus CIE Ra
42
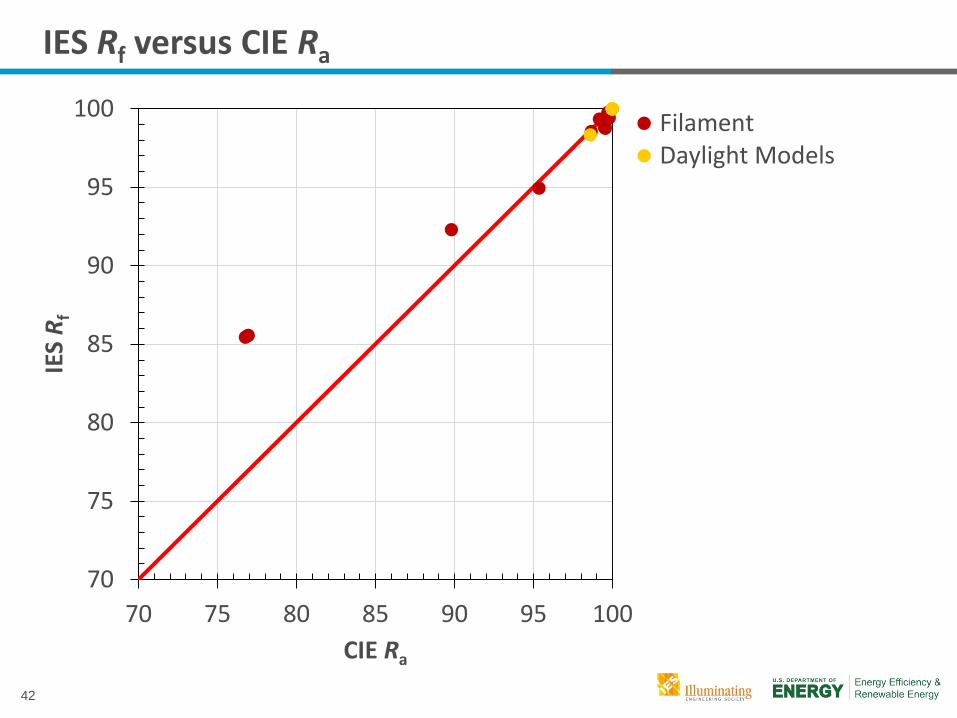
IES Rf versus CIE Ra
70
75
80
85
90
95
100
70 75 80 85 90 95 100
IES
R f
CIE Ra
FilamentDaylight Models
43
70
75
80
85
90
95
100
70 75 80 85 90 95 100
IES
R f
CIE Ra
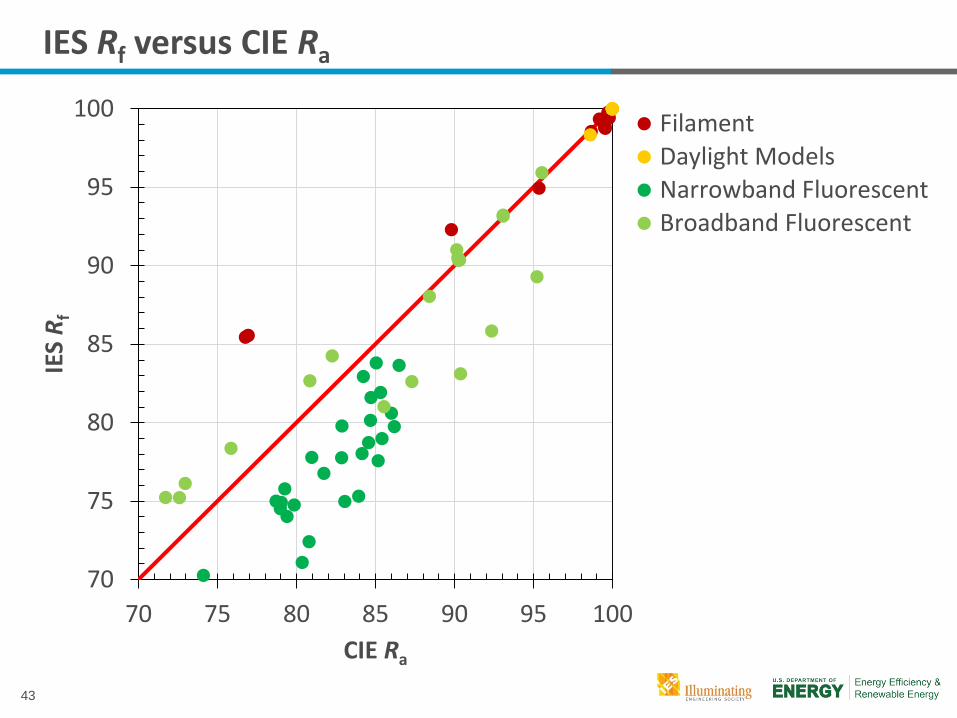
FilamentDaylight ModelsNarrowband FluorescentBroadband Fluorescent
IES Rf versus CIE Ra
44
70
75
80
85
90
95
100
70 75 80 85 90 95 100
IES
R f
CIE Ra
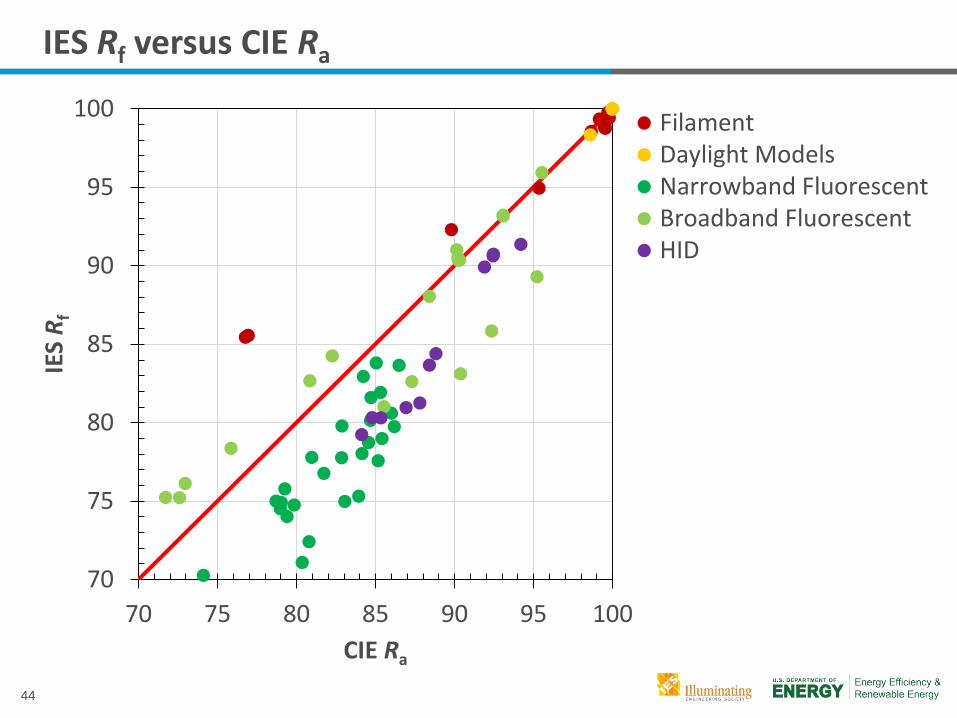
FilamentDaylight ModelsNarrowband FluorescentBroadband FluorescentHID
IES Rf versus CIE Ra
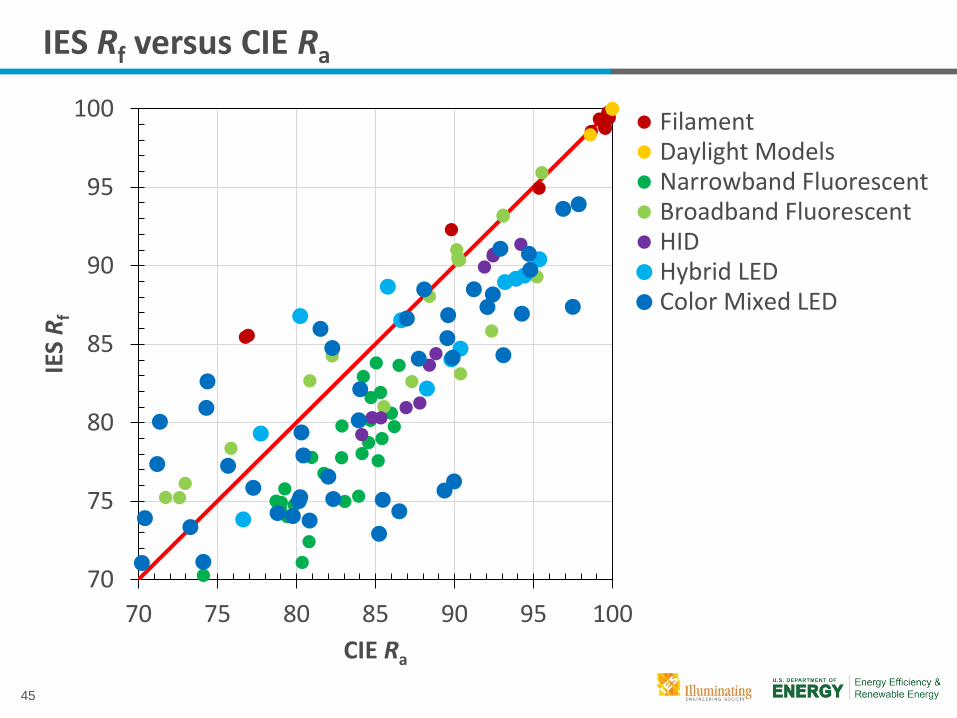
45
70
75
80
85
90
95
100
70 75 80 85 90 95 100
IES
R f
CIE Ra
FilamentDaylight ModelsNarrowband FluorescentBroadband FluorescentHIDHybrid LEDColor Mixed LED
IES Rf versus CIE Ra
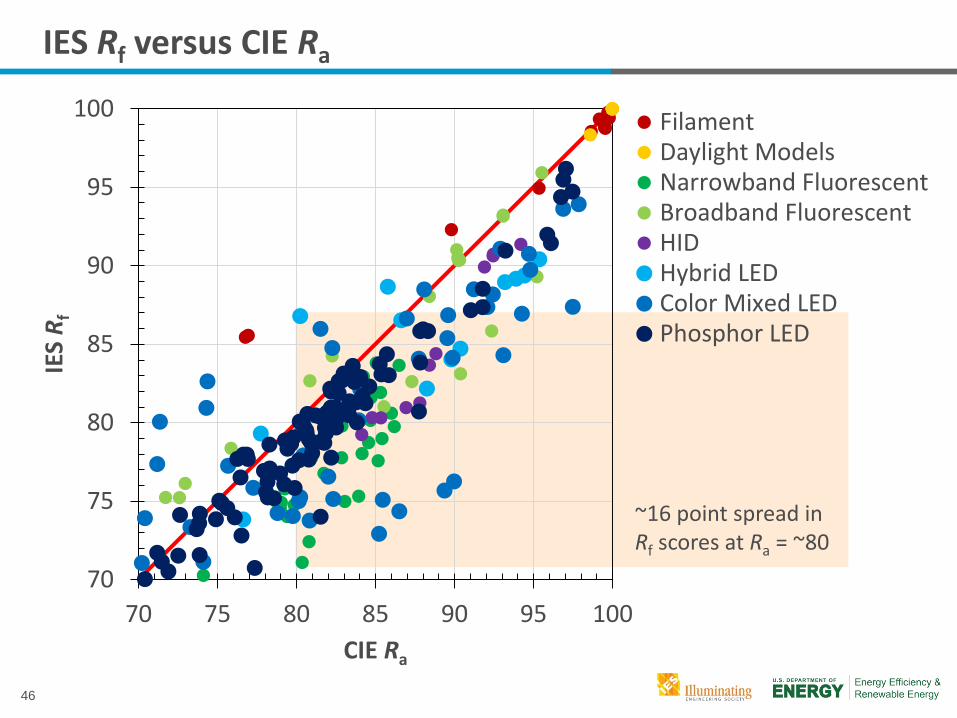
46
~16 point spread in Rf scores at Ra = ~80
70
75
80
85
90
95
100
70 75 80 85 90 95 100
IES
R f
CIE Ra
FilamentDaylight ModelsNarrowband FluorescentBroadband FluorescentHIDHybrid LEDColor Mixed LEDPhosphor LED
IES Rf versus CIE Ra

47
Questions?
48
Part 4: Excel Tool Live Demo
Kevin Houser
49
Part 5: TM-30-15 Adoption Considerations
Michael Royer
50
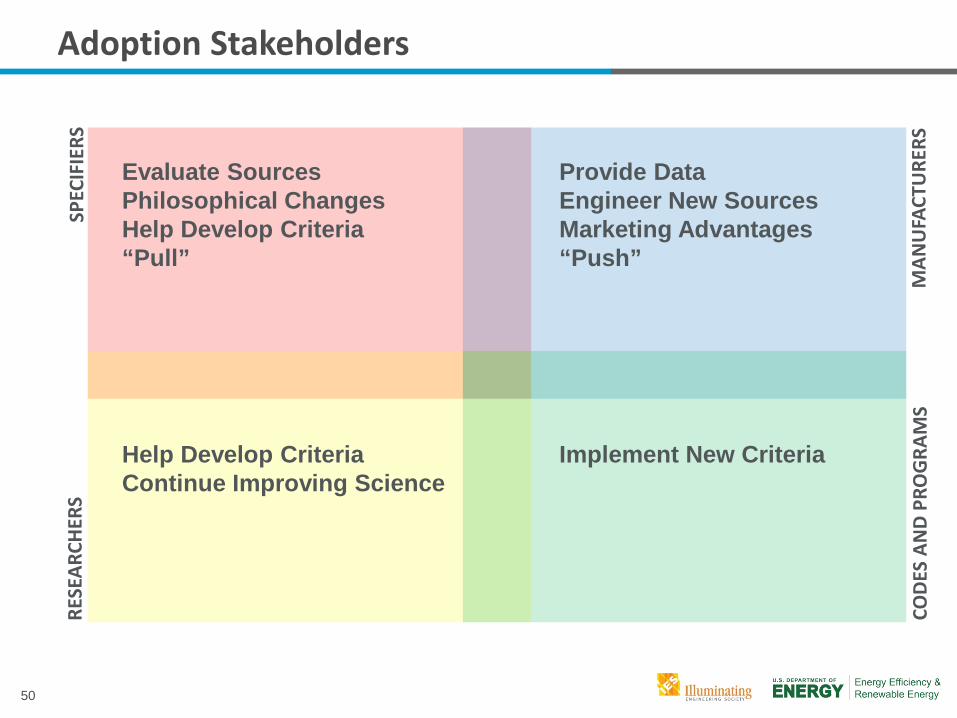
Adoption Stakeholders SP
ECIF
IERS
RE
SEAR
CHER
S
CODE
S AN
D PR
OG
RAM
S M
ANU
FACT
URE
RS
Provide Data Engineer New Sources Marketing Advantages “Push”
Evaluate Sources Philosophical Changes Help Develop Criteria “Pull”
Help Develop Criteria Continue Improving Science
Implement New Criteria
51
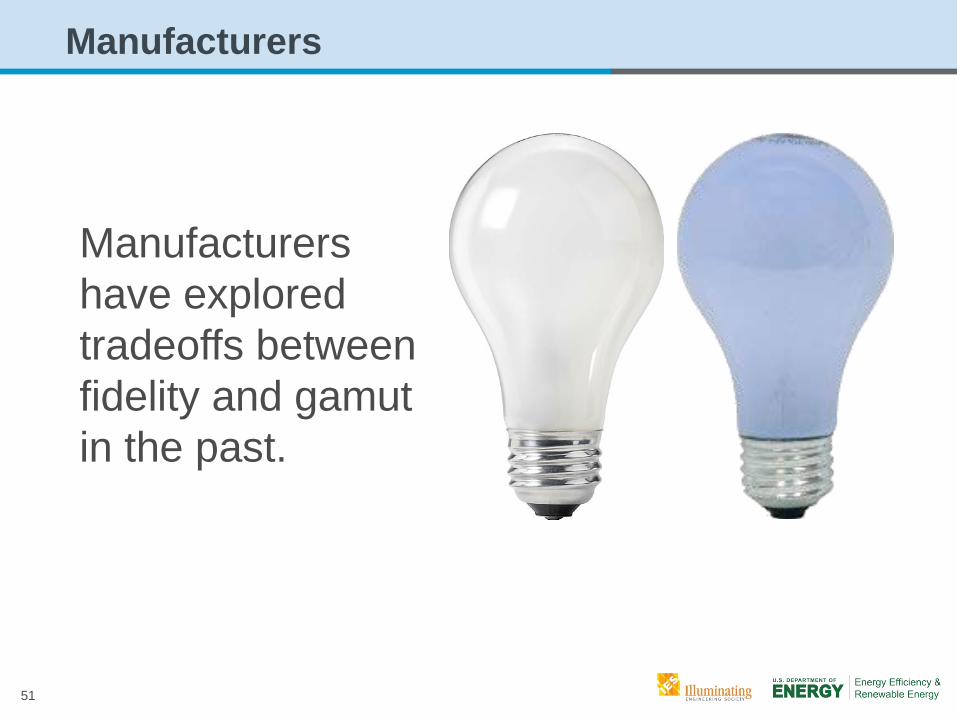
Manufacturers
Manufacturers have explored tradeoffs between fidelity and gamut in the past.
52
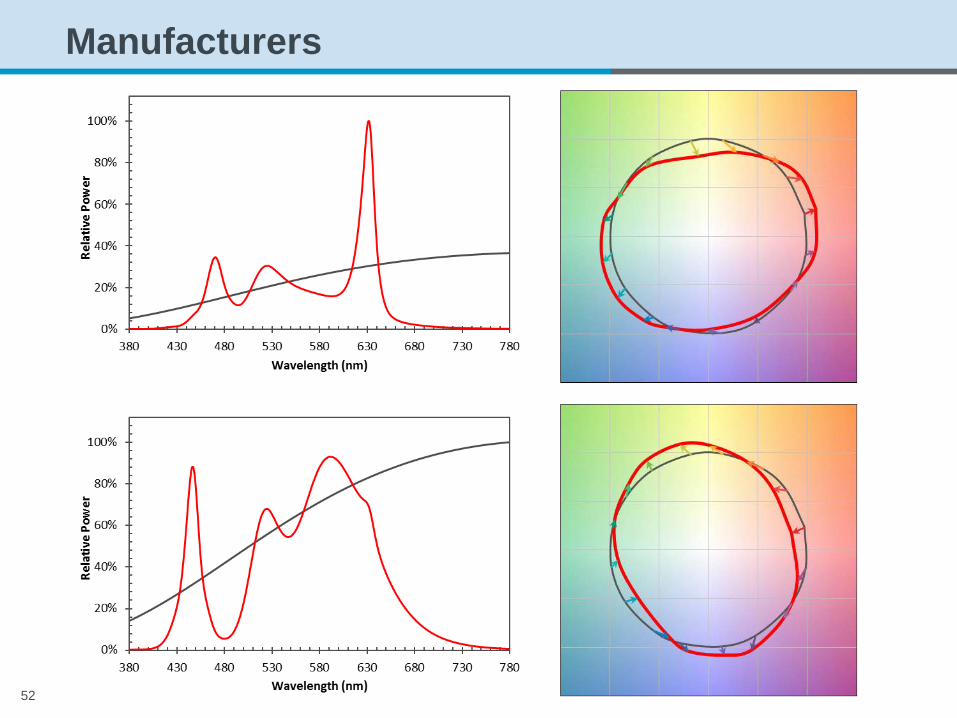
Manufacturers
53
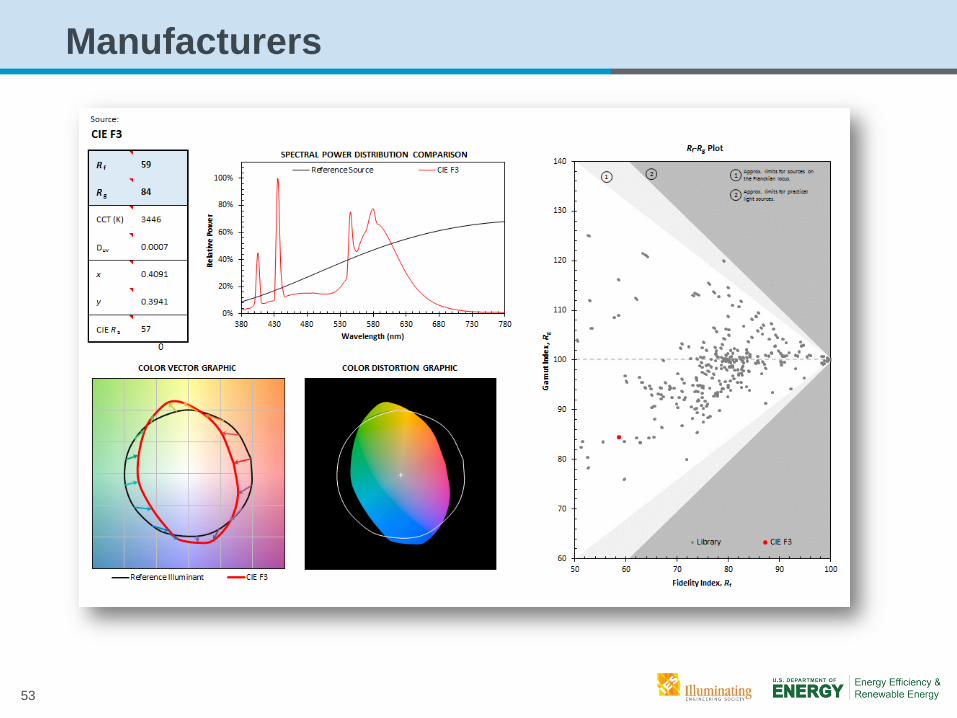
Manufacturers
54
Specifiers
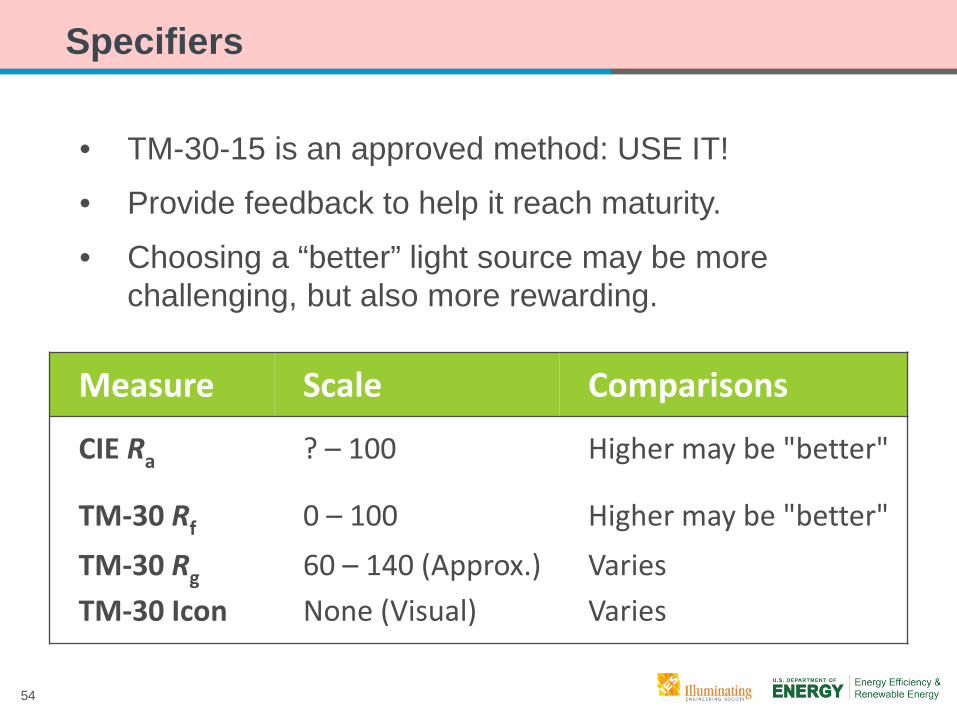
• TM-30-15 is an approved method: USE IT!
• Provide feedback to help it reach maturity.
• Choosing a “better” light source may be more challenging, but also more rewarding.
Measure Scale Comparisons
CIE Ra ? – 100 Higher may be "better"
TM-30 Rf 0 – 100 Higher may be "better" TM-30 Rg 60 – 140 (Approx.) Varies TM-30 Icon None (Visual) Varies
55
56
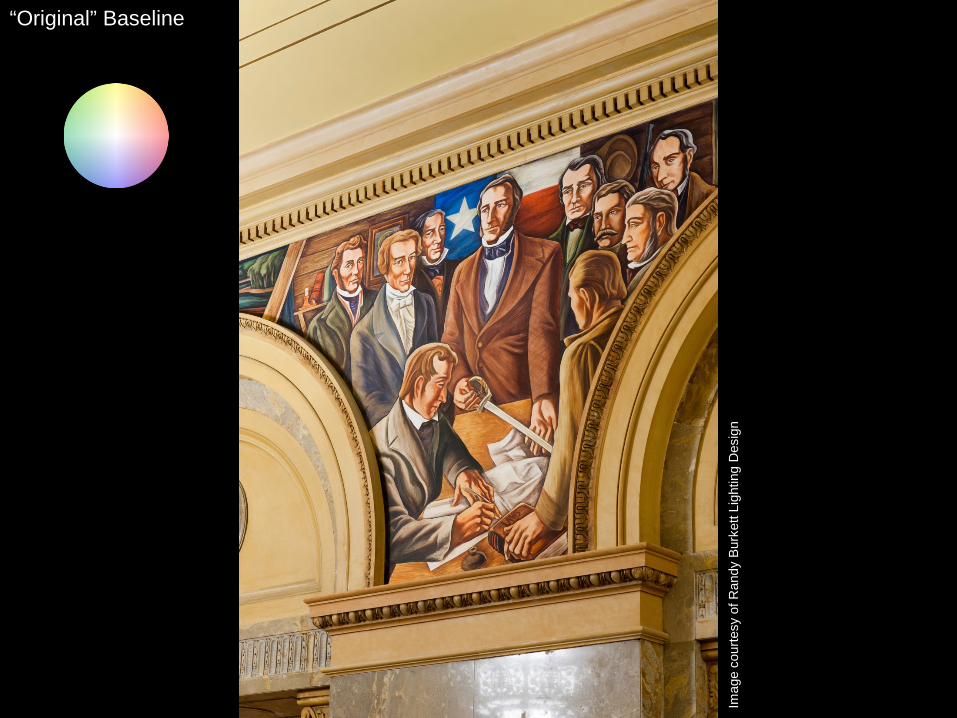
“Original” Baseline
Imag
e co
urte
sy o
f Ran
dy B
urke
tt Li
ghtin
g D
esig
n
57
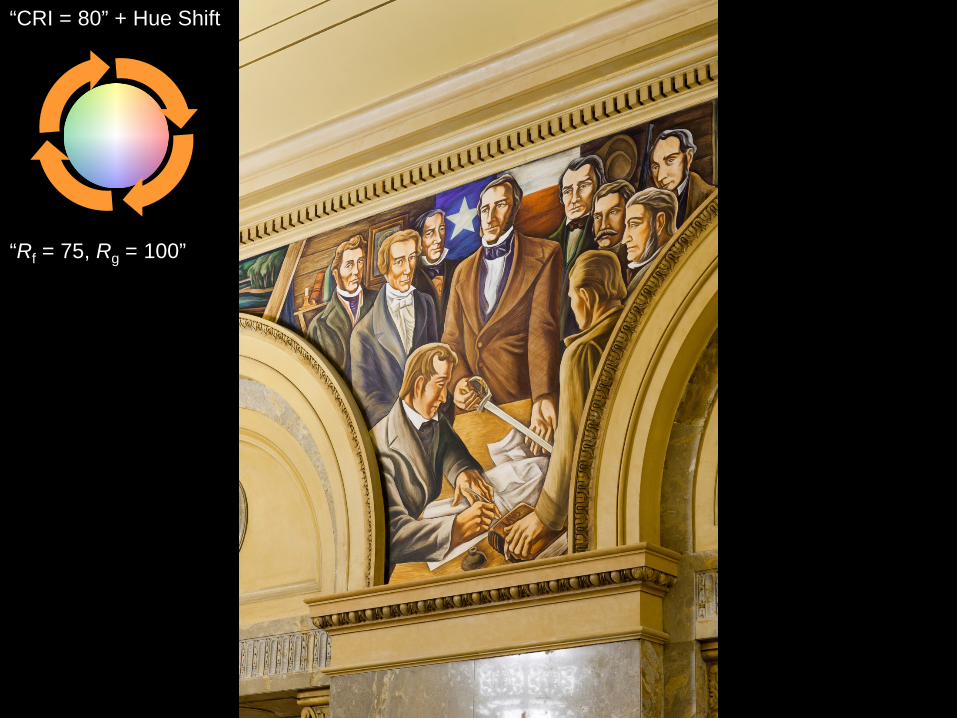
“CRI = 80” + Hue Shift
“Rf = 75, Rg = 100”
58
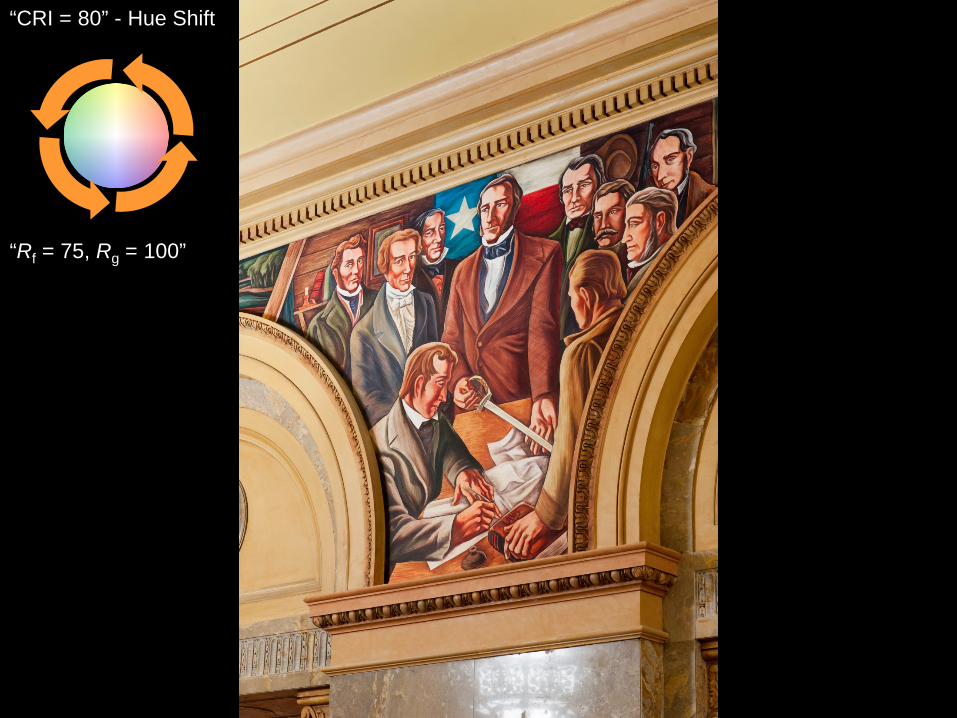
“CRI = 80” - Hue Shift
“Rf = 75, Rg = 100”
59
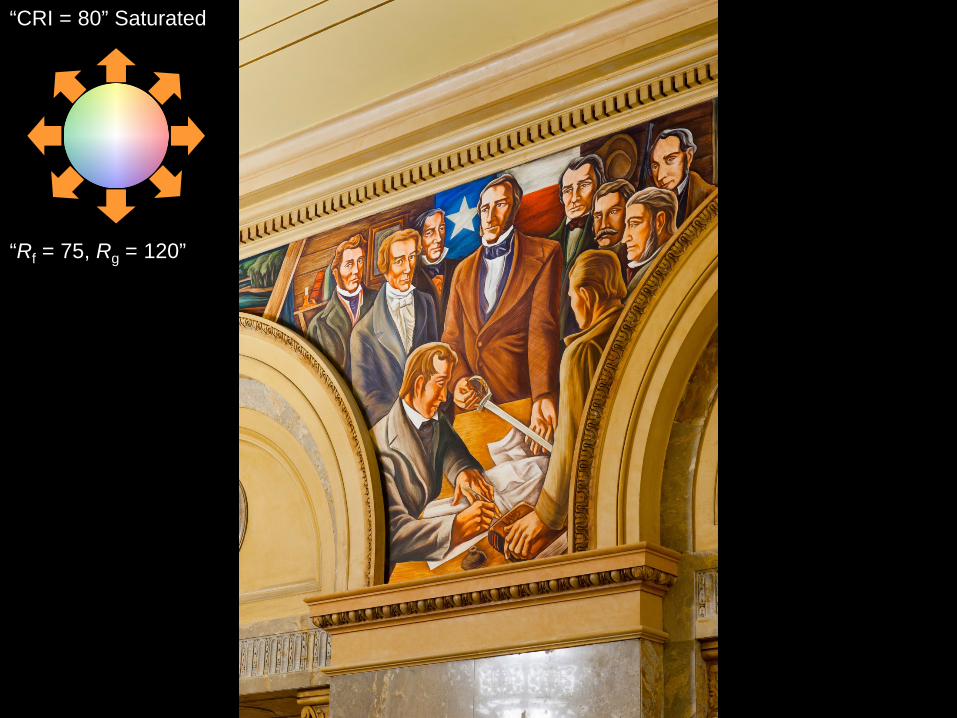
“CRI = 80” Saturated
“Rf = 75, Rg = 120”
60
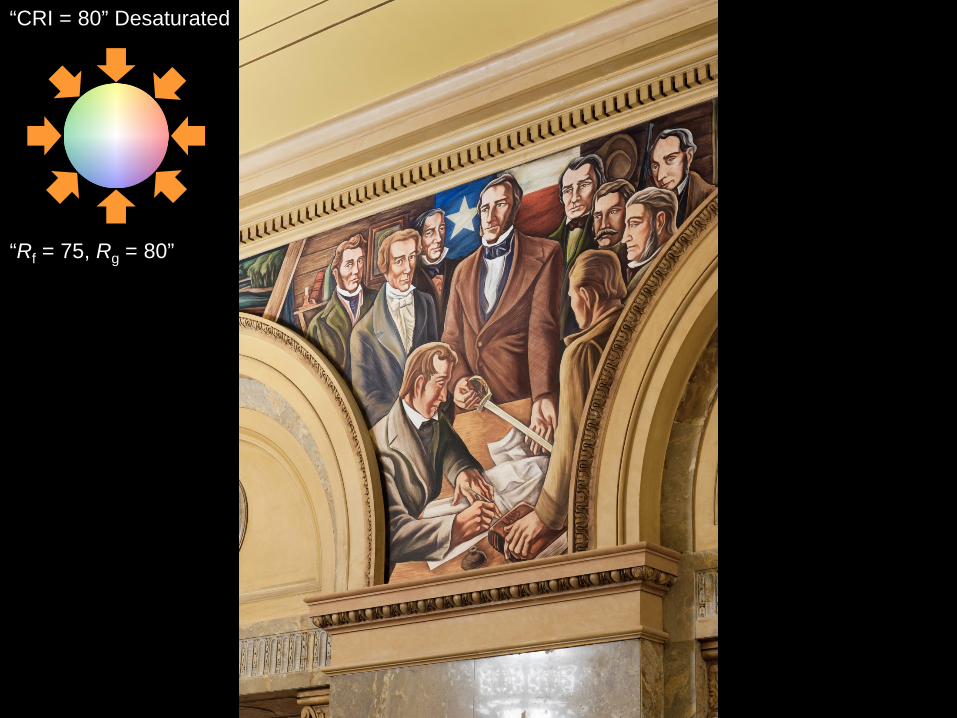
“CRI = 80” Desaturated
“Rf = 75, Rg = 80”
61
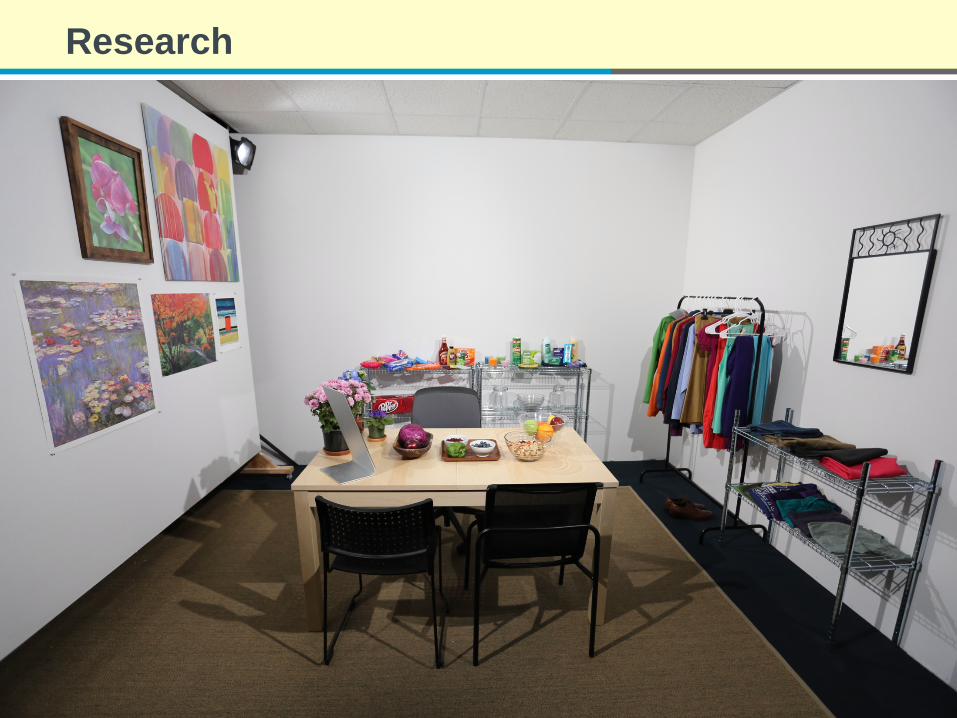
Research
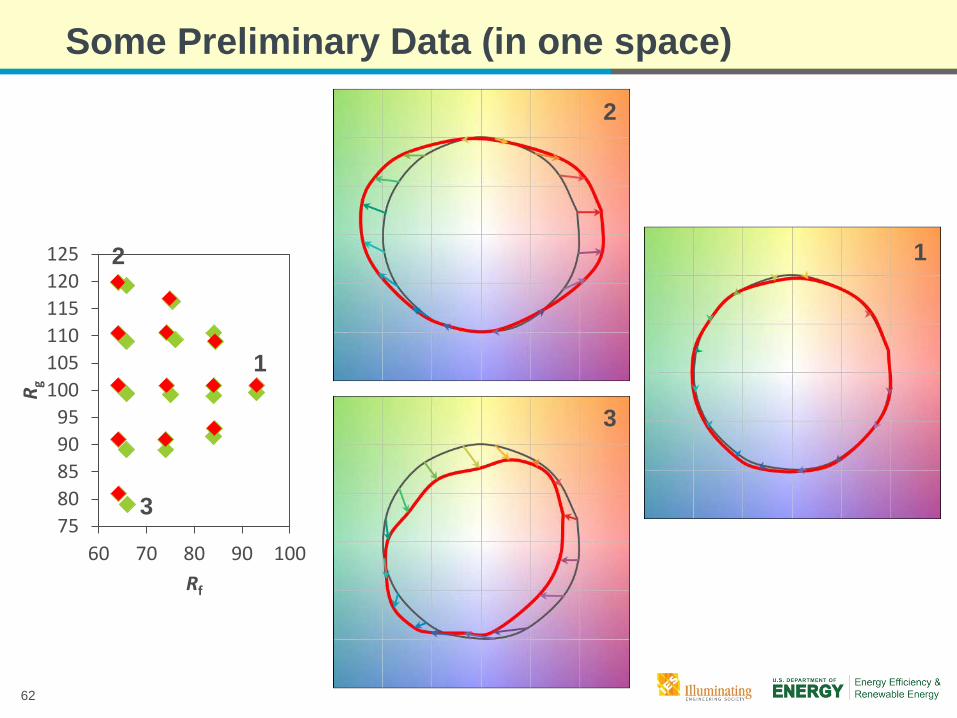
62
7580859095
100105110115120125
60 70 80 90 100
R g
Rf
Some Preliminary Data (in one space)
1
2
3
1
2
3
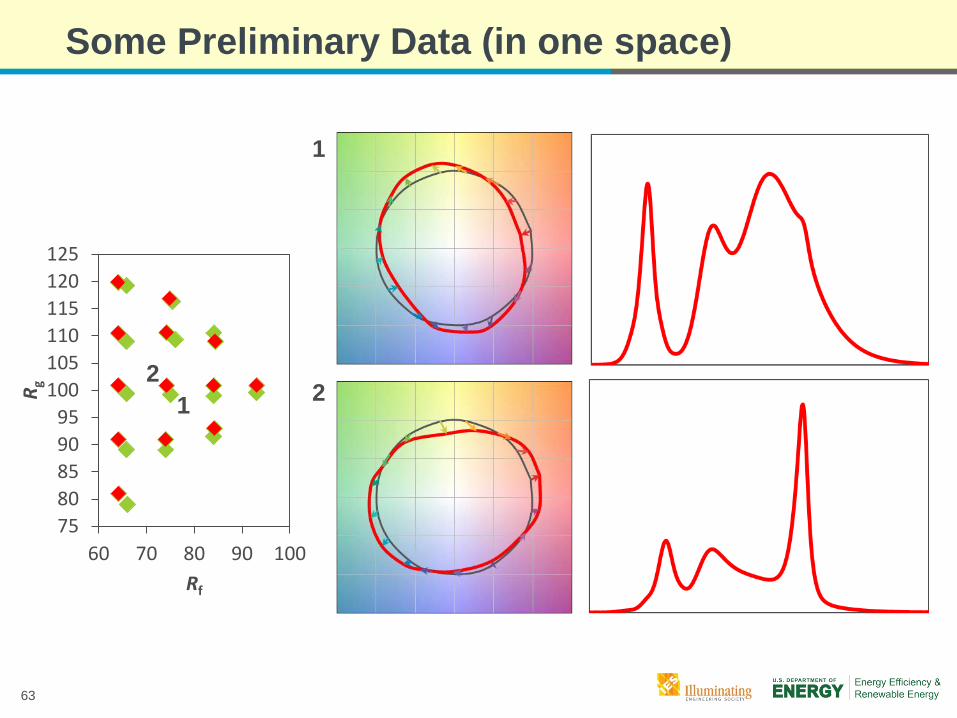
63
7580859095
100105110115120125
60 70 80 90 100
R g
Rf
Some Preliminary Data (in one space)
1 2
1
2
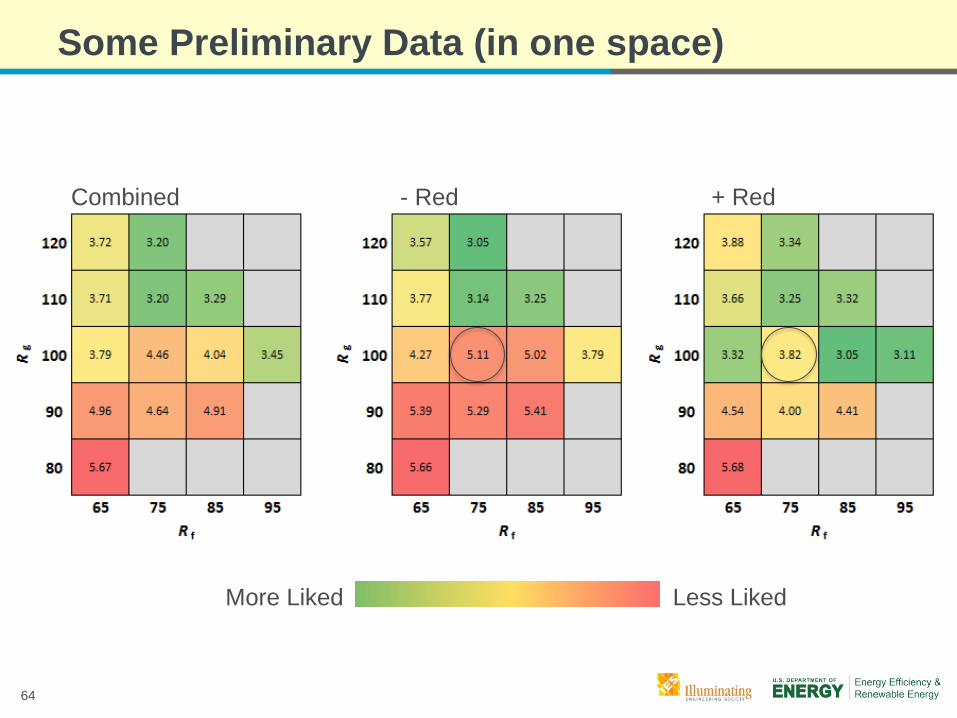
64
Some Preliminary Data (in one space)
Combined + Red
Less Liked More Liked
- Red
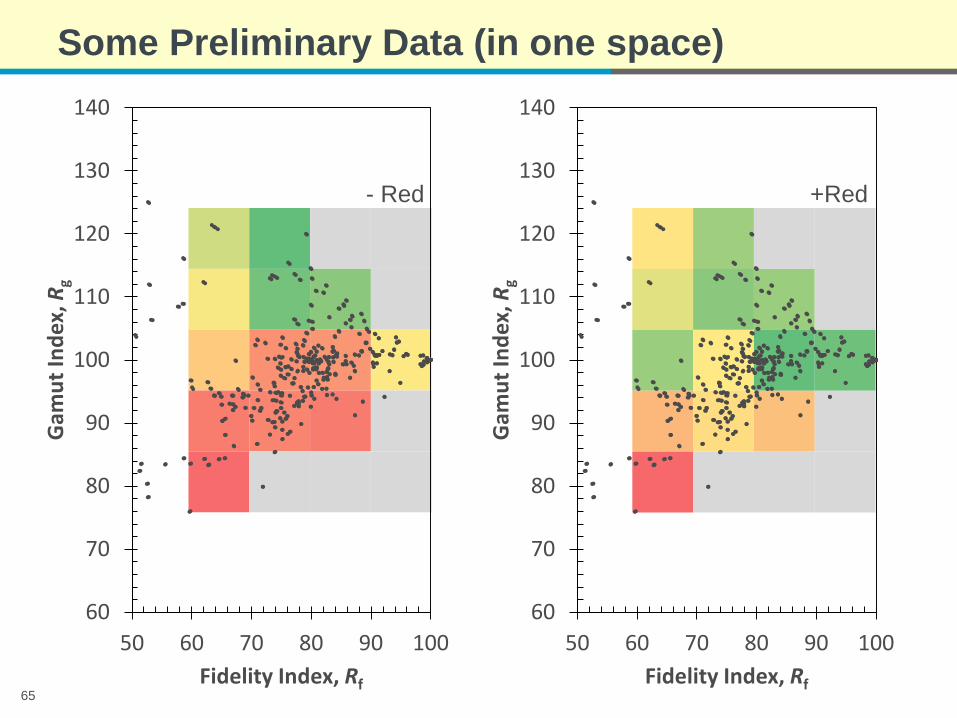
65
Some Preliminary Data (in one space)
60
70
80
90
100
110
120
130
140
50 60 70 80 90 100
Gam
ut In
dex,
Rg
Fidelity Index, Rf
60
70
80
90
100
110
120
130
140
50 60 70 80 90 100
Gam
ut In
dex,
Rg
Fidelity Index, Rf
+Red - Red
66
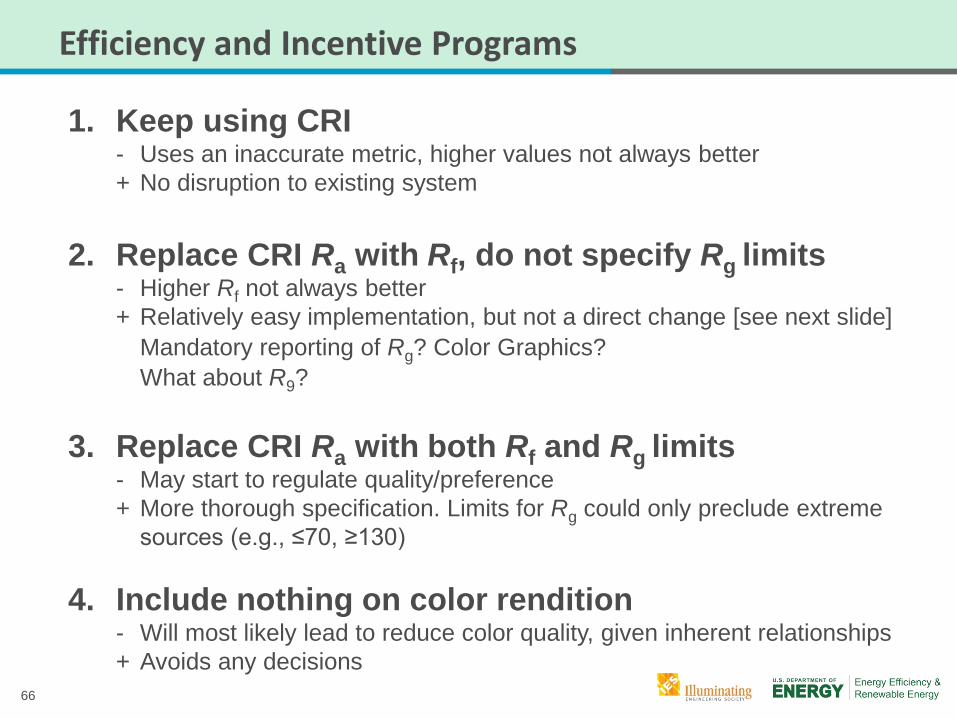
Efficiency and Incentive Programs
1. Keep using CRI - Uses an inaccurate metric, higher values not always better + No disruption to existing system
2. Replace CRI Ra with Rf, do not specify Rg limits - Higher Rf not always better + Relatively easy implementation, but not a direct change [see next slide]
3. Replace CRI Ra with both Rf and Rg limits
- May start to regulate quality/preference + More thorough specification. Limits for Rg could only preclude extreme sources (e.g., ≤70, ≥130)
4. Include nothing on color rendition - Will most likely lead to reduce color quality, given inherent relationships + Avoids any decisions
Mandatory reporting of Rg? Color Graphics? What about R9?
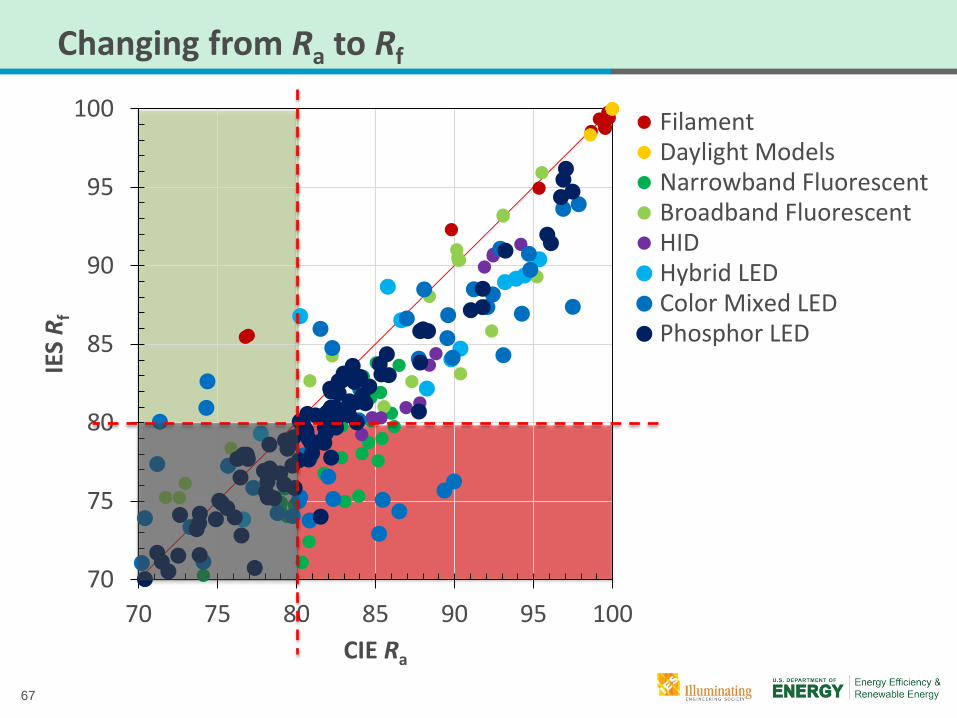
67
Changing from Ra to Rf
70
75
80
85
90
95
100
70 75 80 85 90 95 100
IES
R f
CIE Ra
FilamentDaylight ModelsNarrowband FluorescentBroadband FluorescentHIDHybrid LEDColor Mixed LEDPhosphor LED
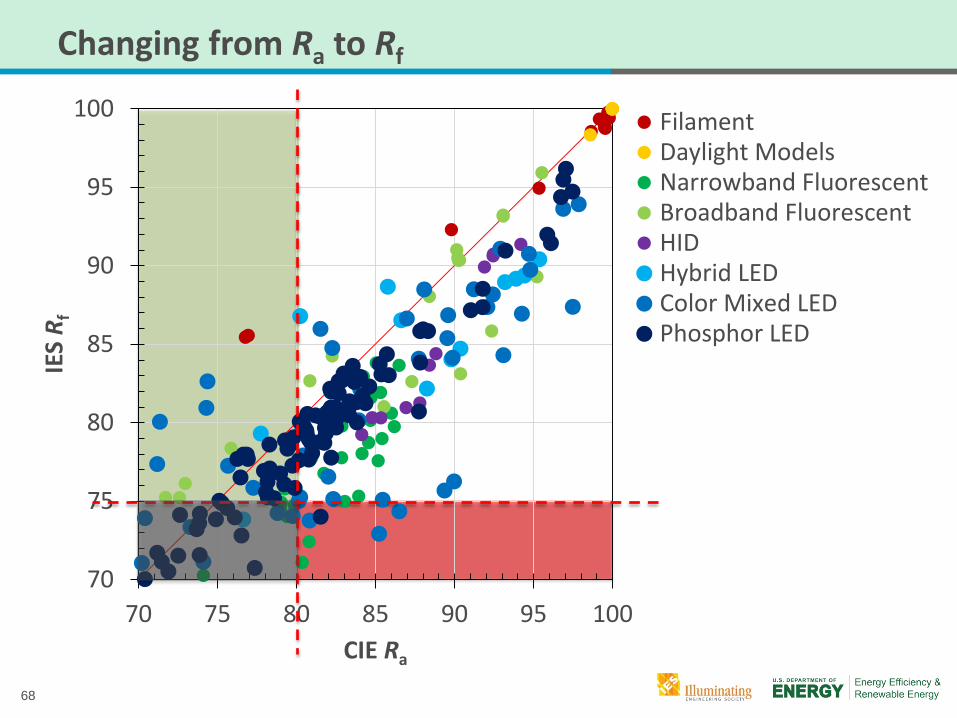
68
Changing from Ra to Rf
70
75
80
85
90
95
100
70 75 80 85 90 95 100
IES
R f
CIE Ra
FilamentDaylight ModelsNarrowband FluorescentBroadband FluorescentHIDHybrid LEDColor Mixed LEDPhosphor LED
69
Additional Resources
IES Technical Memorandum (TM) 30-15: IES Method for Evaluating Light Source Color Rendition http://bit.ly/1IWZxVu LEUKOS editorial about adoption of TM-30-15 and next steps: IES TM-30-15 is Approved—Now What? Available soon at http://www.tandfonline.com/toc/ulks20/current Optics Express journal article that provides overview of the IES method: Development of the IES method for evaluating the color rendition of light sources http://bit.ly/1J32ftZ LEUKOS journal article that describes improved accuracy: Of Why Color Space and Spectral Uniformity Are Essential for Color Rendering Measures Available soon at http://www.tandfonline.com/toc/ulks20/current

70
Questions?