Embed Size (px)
Citation preview

Pacific Hospital Supply Co., Ltd. and Subsidiaries Consolidated Financial Statements for the Nine Months Ended September 30, 2016 and 2015 and Independent Auditors’ Review Report


- 2 -
PACIFIC HOSPITAL SUPPLY CO., LTD. AND SUBSIDIARIES
CONSOLIDATED BALANCE SHEETS
(In Thousands of New Taiwan Dollars)
September 30, 2016
(Reviewed)
December 31, 2015
(Audited)
September 30, 2015
(Reviewed)
ASSETS Amount % Amount % Amount %
CURRENT ASSETS
Cash (Note 6) $ 492,450 16 $ 654,173 25 $ 600,849 25
Notes receivable (Notes 4 and 7) 2,081 - 12,009 1 21,538 1
Accounts receivable (Notes 4, 5 and 7) 160,432 5 167,387 6 177,192 7
Other receivables (Notes 4 and 7) 5,499 - 10,472 - 5,156 -
Inventories (Notes 4 and 8) 279,275 9 249,047 9 245,764 10
Prepayments and other current assets (Notes 13 and 21) 151,767 5 64,684 2 56,107 2
Total current assets 1,091,504 35 1,157,772 43 1,106,606 45
NON-CURRENT ASSETS
Property, plant and equipment (Notes 4, 10, 21, 25 and 26) 1,917,547 61 1,389,372 52 1,237,527 50
Investment properties (Notes 4, 11, 22 and 26) 93,492 3 93,723 4 93,800 4
Other intangible assets (Notes 4 and 12) 8,250 - 11,187 - 13,100 -
Deferred tax assets (Notes 4 and 19) 10,519 - 9,533 - 4,250 -
Refundable deposits (Note 13) 16,431 1 14,613 1 14,682 1
Total non-current assets 2,046,239 65 1,518,428 57 1,363,359 55
TOTAL $ 3,137,743 100 $ 2,676,200 100 $ 2,469,965 100
LIABILITIES AND EQUITY
CURRENT LIABILITIES
Short-term borrowings (Notes 4 and 14) $ 187,000 6 $ - - $ - -
Notes payable 12,137 - 9,879 - 8,091 -
Accounts payable 144,539 5 145,392 5 162,206 7
Other payables (Notes 15 and 21) 196,325 6 179,699 7 104,966 4
Current tax liabilities (Notes 4 and 19) 44,615 2 45,850 2 25,565 1
Current portion of long-term borrowings (Notes 4, 14 and 26) 12,063 - - - - -
Advances and other current liabilities (Note 15) 33,425 1 29,524 1 47,883 2
Total current liabilities 630,104 20 410,344 15 348,711 14
NON-CURRENT LIABILITIES
Long-term borrowings (Notes 4, 14 and 26) 342,637 11 204,700 8 174,700 7
Net defined benefit liabilities - non-current (Notes 4 and 16) 34,676 1 38,344 1 31,360 1
Guarantee deposits (Note 15) 581 - 581 - 581 -
Total non-current liabilities 377,894 12 243,625 9 206,641 8
Total liabilities 1,007,998 32 653,969 24 555,352 22
EQUITY (Note 17)
Share capital
Ordinary shares 660,152 21 660,152 25 660,152 27
Capital surplus from shares issued in excess of par value 410,354 13 410,354 15 410,354 17
Retained earnings
Legal reserve 253,929 8 218,799 8 218,799 9
Unappropriated earnings 805,310 26 732,926 28 625,308 25
Total retained earnings 1,059,239 34 951,725 36 844,107 34
Total equity 2,129,745 68 2,022,231 76 1,914,613 78
TOTAL $ 3,137,743 100 $ 2,676,200 100 $ 2,469,965 100
The accompanying notes are an integral part of the consolidated financial statements.

- 3 -
PACIFIC HOSPITAL SUPPLY CO., LTD. AND SUBSIDIARIES
CONSOLIDATED STATEMENTS OF COMPREHENSIVE INCOME
(In Thousands of New Taiwan Dollars, Except Earnings Per Share)
(Reviewed, Not Audited)
For the Three Months Ended September 30 For the Nine Months Ended September 30
2016 2015 2016 2015
Amount % Amount % Amount % Amount %
OPERATING REVENUE
(Note 4) Sales $ 421,360 100 $ 441,019 100 $ 1,329,114 100 $ 1,161,407 100
Less: Sales returns and
allowances (1,559 ) - (1,517 ) - (4,876 ) - (4,714 ) -
Net operating revenue 419,801 100 439,502 100 1,324,238 100 1,156,693 100
OPERATING COSTS (Notes 4,
8, 16 and 18)
Cost of goods sold 270,271 64 278,825 63 823,290 62 739,257 64
GROSS PROFIT 149,530 36 160,677 37 500,948 38 417,436 36
OPERATING EXPENSES
(Notes 16, 18 and 25)
Selling and marketing expense 13,956 4 16,395 4 48,510 4 50,568 4 General and administrative
expense 25,163 6 23,314 5 81,395 6 70,160 6
Research and development expense 9,335 2 8,339 2 29,884 2 23,682 2
Total operating expenses 48,454 12 48,048 11 159,789 12 144,410 12
OPERATING INCOME 101,076 24 112,629 26 341,159 26 273,026 24
NON-OPERATING INCOME
AND EXPENSES Other income (Notes 18
and 25) 2,178 1 4,055 1 8,144 - 7,914 -
Other gains and losses (Note 18) (8,590 ) (2 ) 24,214 5 (3,989 ) - 10,559 1
Finance costs (Note 18) (326 ) - (249 ) - (1,032 ) - (515 ) -
Total non-operating
income and expenses (6,738 ) (1 ) 28,020 6 3,123 - 17,958 1
PROFIT BEFORE INCOME
TAX 94,338 23 140,649 32 344,282 26 290,984 25
INCOME TAX EXPENSE
(Notes 4 and 19) 16,131 4 19,058 4 71,730 5 54,246 5
NET PROFIT FOR THE
PERIOD 78,207 19 121,591 28 272,552 21 236,738 20
TOTAL COMPREHENSIVE
INCOME FOR THE PERIOD $ 78,207 19 $ 121,591 28 $ 272,552 21 $ 236,738 20
EARNINGS PER SHARE
(Note 20)
Basic $ 1.18 $ 1.84 $ 4.13 $ 3.59 Diluted $ 1.18 $ 1.84 $ 4.11 $ 3.56
The accompanying notes are an integral part of the consolidated financial statements.
- 4 -
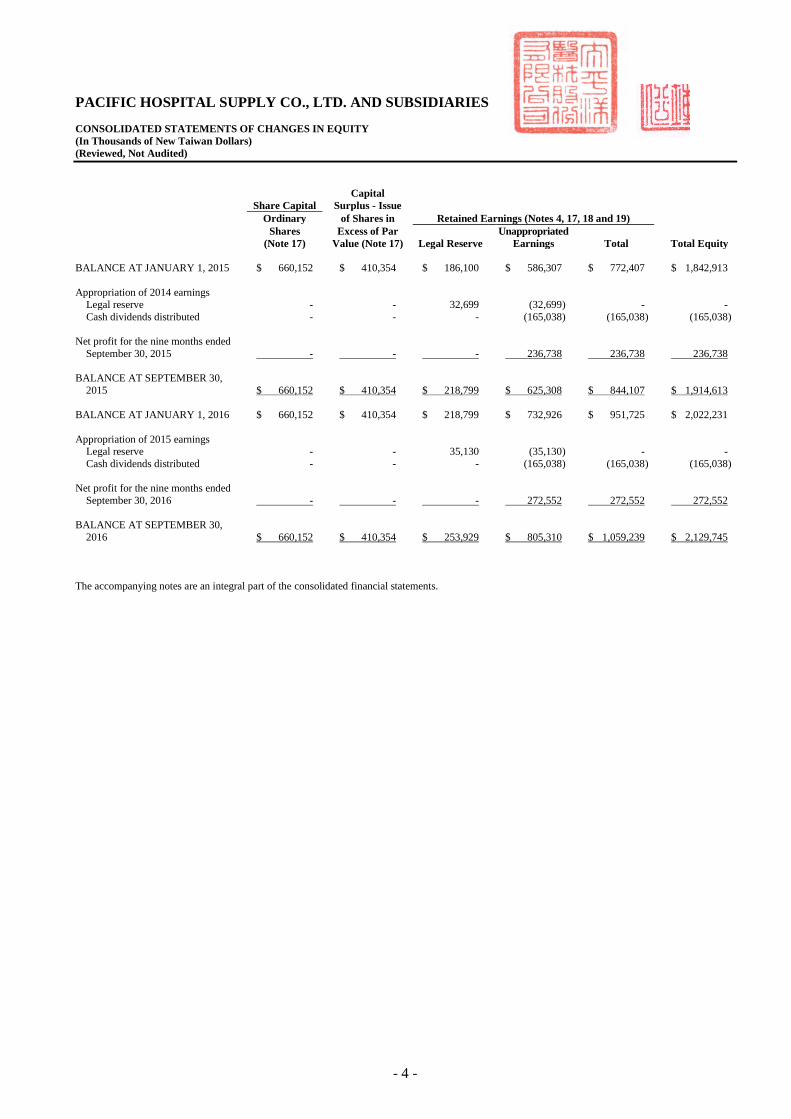
PACIFIC HOSPITAL SUPPLY CO., LTD. AND SUBSIDIARIES
CONSOLIDATED STATEMENTS OF CHANGES IN EQUITY
(In Thousands of New Taiwan Dollars)
(Reviewed, Not Audited)
Capital
Share Capital Surplus - Issue
Ordinary of Shares in Retained Earnings (Notes 4, 17, 18 and 19)
Shares Excess of Par Unappropriated
(Note 17) Value (Note 17) Legal Reserve Earnings Total Total Equity
BALANCE AT JANUARY 1, 2015 $ 660,152 $ 410,354 $ 186,100 $ 586,307 $ 772,407 $ 1,842,913
Appropriation of 2014 earnings Legal reserve - - 32,699 (32,699 ) - -
Cash dividends distributed - - - (165,038 ) (165,038 ) (165,038 )
Net profit for the nine months ended
September 30, 2015 - - - 236,738 236,738 236,738
BALANCE AT SEPTEMBER 30,
2015 $ 660,152 $ 410,354 $ 218,799 $ 625,308 $ 844,107 $ 1,914,613
BALANCE AT JANUARY 1, 2016 $ 660,152 $ 410,354 $ 218,799 $ 732,926 $ 951,725 $ 2,022,231
Appropriation of 2015 earnings Legal reserve - - 35,130 (35,130 ) - -
Cash dividends distributed - - - (165,038 ) (165,038 ) (165,038 )
Net profit for the nine months ended
September 30, 2016 - - - 272,552 272,552 272,552
BALANCE AT SEPTEMBER 30,
2016 $ 660,152 $ 410,354 $ 253,929 $ 805,310 $ 1,059,239 $ 2,129,745
The accompanying notes are an integral part of the consolidated financial statements.
- 5 -
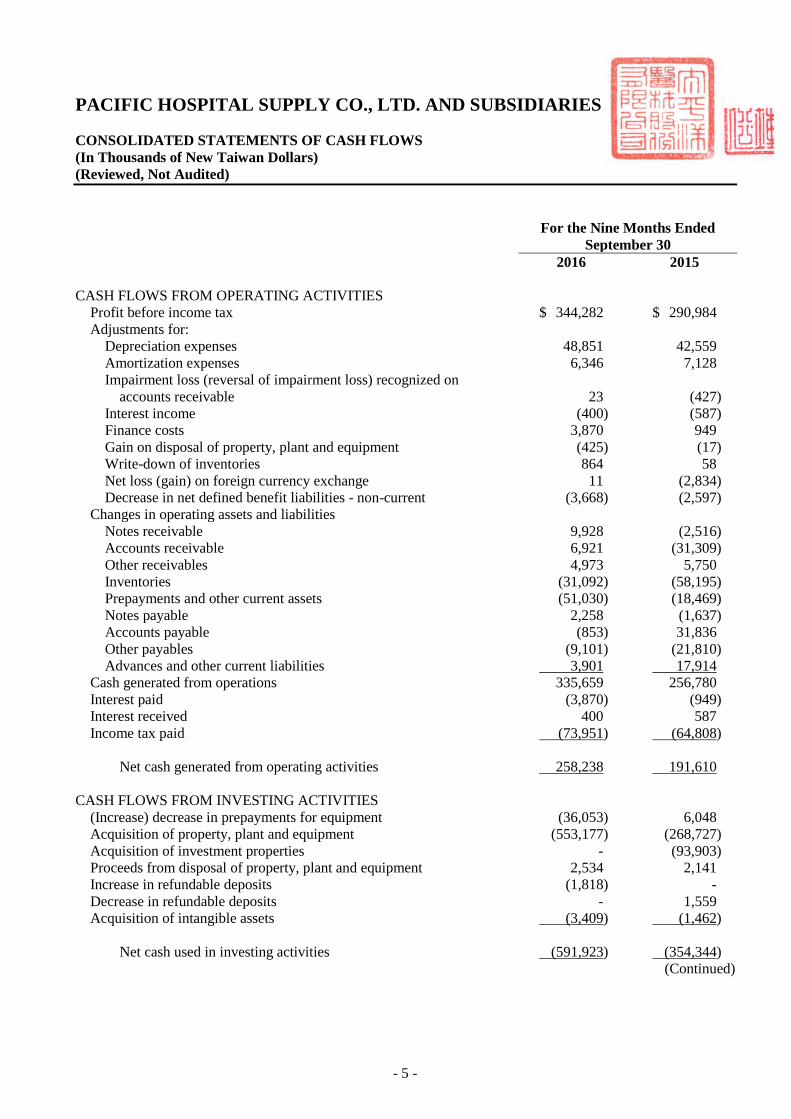
PACIFIC HOSPITAL SUPPLY CO., LTD. AND SUBSIDIARIES
CONSOLIDATED STATEMENTS OF CASH FLOWS
(In Thousands of New Taiwan Dollars)
(Reviewed, Not Audited)
For the Nine Months Ended
September 30
2016 2015
CASH FLOWS FROM OPERATING ACTIVITIES
Profit before income tax $ 344,282 $ 290,984
Adjustments for:
Depreciation expenses 48,851 42,559
Amortization expenses 6,346 7,128
Impairment loss (reversal of impairment loss) recognized on
accounts receivable 23 (427)
Interest income (400) (587)
Finance costs 3,870 949
Gain on disposal of property, plant and equipment (425) (17)
Write-down of inventories 864 58
Net loss (gain) on foreign currency exchange 11 (2,834)
Decrease in net defined benefit liabilities - non-current (3,668) (2,597)
Changes in operating assets and liabilities
Notes receivable 9,928 (2,516)
Accounts receivable 6,921 (31,309)
Other receivables 4,973 5,750
Inventories (31,092) (58,195)
Prepayments and other current assets (51,030) (18,469)
Notes payable 2,258 (1,637)
Accounts payable (853) 31,836
Other payables (9,101) (21,810)
Advances and other current liabilities 3,901 17,914
Cash generated from operations 335,659 256,780
Interest paid (3,870) (949)
Interest received 400 587
Income tax paid (73,951) (64,808)
Net cash generated from operating activities 258,238 191,610
CASH FLOWS FROM INVESTING ACTIVITIES
(Increase) decrease in prepayments for equipment (36,053) 6,048
Acquisition of property, plant and equipment (553,177) (268,727)
Acquisition of investment properties - (93,903)
Proceeds from disposal of property, plant and equipment 2,534 2,141
Increase in refundable deposits (1,818) -
Decrease in refundable deposits - 1,559
Acquisition of intangible assets (3,409) (1,462)
Net cash used in investing activities (591,923) (354,344)
(Continued)

- 6 -
PACIFIC HOSPITAL SUPPLY CO., LTD. AND SUBSIDIARIES
CONSOLIDATED STATEMENTS OF CASH FLOWS
(In Thousands of New Taiwan Dollars)
(Reviewed, Not Audited)
For the Nine Months Ended
September 30
2016 2015
CASH FLOWS FROM FINANCING ACTIVITIES
Proceeds from short-term borrowings $ 187,000 $ -
Repayments of short-term borrowings - (26,989)
Proceeds from long-term borrowings 150,000 174,700
Proceeds from guarantee deposits received - 581
Cash dividends distributed (165,038) (165,038)
Net cash generated from (used in) financing activities 171,962 (16,746)
NET DECREASE IN CASH (161,723) (179,480)
CASH AT THE BEGINNING OF THE PERIOD 654,173 780,329
CASH AT THE END OF THE PERIOD $ 492,450 $ 600,849
The accompanying notes are an integral part of the consolidated financial statements. (Concluded)
- 7 -
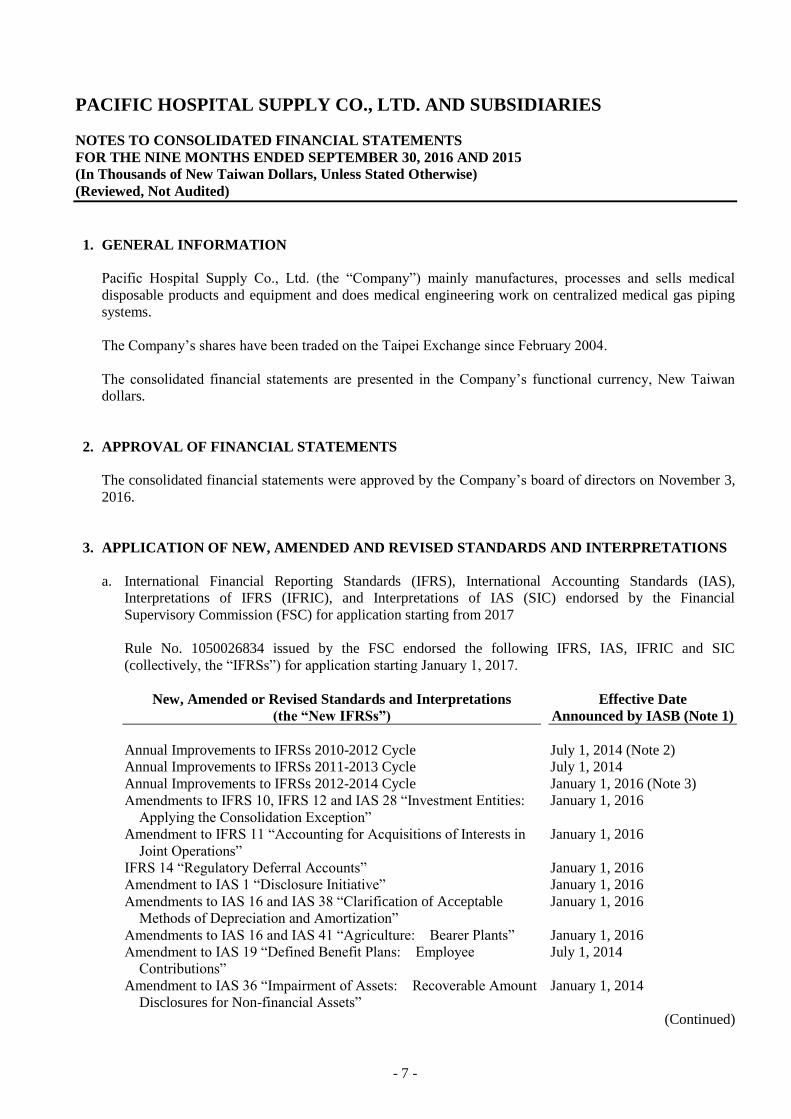
PACIFIC HOSPITAL SUPPLY CO., LTD. AND SUBSIDIARIES
NOTES TO CONSOLIDATED FINANCIAL STATEMENTS
FOR THE NINE MONTHS ENDED SEPTEMBER 30, 2016 AND 2015
(In Thousands of New Taiwan Dollars, Unless Stated Otherwise)
(Reviewed, Not Audited)
1. GENERAL INFORMATION
Pacific Hospital Supply Co., Ltd. (the “Company”) mainly manufactures, processes and sells medical
disposable products and equipment and does medical engineering work on centralized medical gas piping
systems.
The Company’s shares have been traded on the Taipei Exchange since February 2004.
The consolidated financial statements are presented in the Company’s functional currency, New Taiwan
dollars.
2. APPROVAL OF FINANCIAL STATEMENTS
The consolidated financial statements were approved by the Company’s board of directors on November 3,
2016.
3. APPLICATION OF NEW, AMENDED AND REVISED STANDARDS AND INTERPRETATIONS
a. International Financial Reporting Standards (IFRS), International Accounting Standards (IAS),
Interpretations of IFRS (IFRIC), and Interpretations of IAS (SIC) endorsed by the Financial
Supervisory Commission (FSC) for application starting from 2017
Rule No. 1050026834 issued by the FSC endorsed the following IFRS, IAS, IFRIC and SIC
(collectively, the “IFRSs”) for application starting January 1, 2017.
New, Amended or Revised Standards and Interpretations
(the “New IFRSs”)
Effective Date
Announced by IASB (Note 1)
Annual Improvements to IFRSs 2010-2012 Cycle July 1, 2014 (Note 2)
Annual Improvements to IFRSs 2011-2013 Cycle July 1, 2014
Annual Improvements to IFRSs 2012-2014 Cycle January 1, 2016 (Note 3)
Amendments to IFRS 10, IFRS 12 and IAS 28 “Investment Entities:
Applying the Consolidation Exception”
January 1, 2016
Amendment to IFRS 11 “Accounting for Acquisitions of Interests in
Joint Operations”
January 1, 2016
IFRS 14 “Regulatory Deferral Accounts” January 1, 2016
Amendment to IAS 1 “Disclosure Initiative” January 1, 2016
Amendments to IAS 16 and IAS 38 “Clarification of Acceptable
Methods of Depreciation and Amortization”
January 1, 2016
Amendments to IAS 16 and IAS 41 “Agriculture: Bearer Plants” January 1, 2016
Amendment to IAS 19 “Defined Benefit Plans: Employee
Contributions”
July 1, 2014
Amendment to IAS 36 “Impairment of Assets: Recoverable Amount
Disclosures for Non-financial Assets”
January 1, 2014
(Continued)

- 8 -
New, Amended or Revised Standards and Interpretations
(the “New IFRSs”)
Effective Date
Announced by IASB (Note 1)
Amendment to IAS 39 “Novation of Derivatives and Continuation of
Hedge Accounting”
January 1, 2014
IFRIC 21 “Levies” January 1, 2014
(Concluded)
Note 1: Unless stated otherwise, the above New or amended IFRSs are effective for annual periods
beginning on or after their respective effective dates.
Note 2: The amendment to IFRS 2 applies to share-based payment transactions with grant date on or
after July 1, 2014; the amendment to IFRS 3 applies to business combinations with acquisition
date on or after July 1, 2014; the amendment to IFRS 13 is effective immediately; the
remaining amendments are effective for annual periods beginning on or after July 1, 2014.
Note 3: The amendment to IFRS 5 is applied prospectively to changes in a method of disposal that
occur in annual periods beginning on or after January 1, 2016; the remaining amendments are
effective for annual periods beginning on or after January 1, 2016.
Except for the following, the initial application of the above New or amended IFRSs in 2017 would not
have any material impact on the Group’s accounting policies:
Amendments to IAS 16 and IAS 38 “Clarification of
Acceptable Methods of Depreciation and Amortization”
The entity should use appropriate depreciation and amortization method to reflect the pattern in which
the future economic benefits of the property, plant and equipment and intangible asset are expected to
be consumed by the entity.
The amended IAS 16 “Property, Plant and Equipment” stipulates that a depreciation method that is
based on revenue that is generated by an activity that includes the use of an asset is not appropriate.
The amended standard does not provide any exception from this requirement.
The amended IAS 38 “Intangible Assets” clarifies there is a rebuttable presumption that an amortization
method that is based on revenue that is generated by an activity that includes the use of an intangible
asset is not appropriate. This presumption can be overcome only in the following limited
circumstances:
1) In which the intangible asset is expressed as a measure of revenue (for example, the contract that
specifies the entity’s use of the intangible asset will expire upon achievement of a revenue
threshold); or
2) When it can be demonstrated that revenue and the consumption of the economic benefits of the
intangible asset are highly correlated.
Except for the above impacts, as of the date the consolidated financial statements were authorized for
issue, the Group continues assessing other possible impacts that application of the aforementioned
amendments will have on the Group’s financial position and financial performance, and will disclose
these other impacts when the assessment is completed.

- 9 -
b. New IFRSs in issue but not yet endorsed by the FSC
The Group has not applied the following IFRSs issued by the IASB but not yet endorsed by the FSC.
The FSC announced that IFRS 15 will take effect starting January 1, 2018. As of the date the
consolidated financial statements were authorized for issue, the FSC has not announced the effective
dates of other new IFRSs.
New IFRSs
Effective Date
Announced by IASB (Note)
Amendment to IFRS 2 “Classification and Measurement of
Share-based Payment Transactions”
January 1, 2018
Amendments to IFRS 4 “Applying IFRS 9 Financial Instruments with
IFRS 4 Insurance Contracts”
January 1, 2018
IFRS 9 “Financial Instruments” January 1, 2018
Amendments to IFRS 9 and IFRS 7 “Mandatory Effective Date of
IFRS 9 and Transition Disclosures”
January 1, 2018
Amendments to IFRS 10 and IAS 28 “Sale or Contribution of Assets
between an Investor and its Associate or Joint Venture”
To be determined by IASB
IFRS 15 “Revenue from Contracts with Customers” January 1, 2018
Amendments to IFRS 15 “Clarification of IFRS 15” January 1, 2018
IFRS 16 “Leases” January 1, 2019
Amendment to IAS 7 “Disclosure Initiative” January 1, 2017
Amendments to IAS 12 “Recognition of Deferred Tax Assets for
Unrealized Losses”
January 1, 2017
Note: Unless stated otherwise, the above New IFRSs are effective for annual periods beginning on or
after their respective effective dates.
1) IFRS 9 “Financial Instruments”
Recognition and measurement of financial assets
With regards to financial assets, all recognized financial assets that are within the scope of IAS 39
“Financial Instruments: Recognition and Measurement” are subsequently measured at amortized
cost or fair value. Under IFRS 9, the requirement for the classification of financial assets is stated
below.
For the Group’s debt instruments that have contractual cash flows that are solely payments of
principal and interest on the principal amount outstanding, their classification and measurement are
as follows:
a) For debt instruments, if they are held within a business model whose objective is to collect the
contractual cash flows, the financial assets are measured at amortized cost and are assessed for
impairment continuously with impairment loss recognized in profit or loss, if any. Interest
revenue is recognized in profit or loss by using the effective interest method;
b) For debt instruments, if they are held within a business model whose objective is achieved by
both the collecting of contractual cash flows and the selling of financial assets, the financial
assets are measured at fair value through other comprehensive income (FVTOCI) and are
assessed for impairment. Interest revenue is recognized in profit or loss by using the effective
interest method, and other gain or loss shall be recognized in other comprehensive income,
except for impairment gains or losses and foreign exchange gains and losses. When the debt
instruments are derecognized or reclassified, the cumulative gain or loss previously recognized
in other comprehensive income is reclassified from equity to profit or loss.

- 10 -
Except for the above, all other financial assets are measured at fair value through profit or loss.
However, the Group may make an irrevocable election to present subsequent changes in the fair
value of an equity investment (that is not held for trading) in other comprehensive income, with
only dividend income generally recognized in profit or loss. No subsequent impairment
assessment is required, and the cumulative gain or loss previously recognized in other
comprehensive income cannot be reclassified from equity to profit or loss.
Impairment of financial assets
IFRS 9 requires impairment loss on financial assets to be recognized by using the “Expected Credit
Losses Model”. The credit loss allowance is required for financial assets measured at amortized
cost, financial assets mandatorily measured at FVTOCI, lease receivables, contract assets arising
from IFRS 15 “Revenue from Contracts with Customers”, certain written loan commitments and
financial guarantee contracts. A loss allowance for the 12-month expected credit losses is required
for a financial asset if its credit risk has not increased significantly since initial recognition. A loss
allowance for full lifetime expected credit losses is required for a financial asset if its credit risk has
increased significantly since initial recognition and is not low. However, a loss allowance for full
lifetime expected credit losses is required for trade receivables that do not constitute a financing
transaction.
For purchased or originated credit-impaired financial assets, the Group takes into account the
expected credit losses on initial recognition in calculating the credit-adjusted effective interest rate.
Subsequently, any changes in expected losses are recognized as a loss allowance with a
corresponding gain or loss recognized in profit or loss.
2) Amendments to IFRS 10 and IAS 28 “Sale or Contribution of Assets between an Investor and its
Associate or Joint Venture”
The amendments stipulated that, when an entity sells or contributes assets that constitute a business
(as defined in IFRS 3) to an associate or joint venture, the gain or loss resulting from the transaction
is recognized in full. Also, when an entity loses control of a subsidiary that contains a business but
retains significant influence or joint control, the gain or loss resulting from the transaction is
recognized in full.
Conversely, when an entity sells or contributes assets that do not constitute a business to an
associate, the gain or loss resulting from the transaction is recognized only to the extent of the
unrelated investors’ interest in the associate, i.e. the entity’s share of the gain or loss is eliminated.
Also, when an entity loses control of a subsidiary that does not contain a business but retains
significant influence in an associate, the gain or loss resulting from the transaction is recognized
only to the extent of the unrelated investors’ interest in the associate, i.e. the entity’s share of the
gain or loss is eliminated.
3) IFRS 15 “Revenue from Contracts with Customers” and related amendment
IFRS 15 establishes principles for recognizing revenue that apply to all contracts with customers,
and will supersede IAS 18 “Revenue”, IAS 11 “Construction Contracts” and a number of
revenue-related interpretations from January 1, 2018.
When applying IFRS 15, an entity shall recognize revenue by applying the following steps:
Identify the contract with the customer;
Identify the performance obligations in the contract;
Determine the transaction price;
Allocate the transaction price to the performance obligations in the contract; and
Recognize revenue when the entity satisfies a performance obligation.
- 11 -
When IFRS 15 and related amendment are effective, an entity may elect to apply this Standard
either retrospectively to each prior reporting period presented or retrospectively with the cumulative
effect of initially applying this Standard recognized at the date of initial application.
4) IFRS 16 “Leases”
IFRS 16 sets out the accounting standards for leases that will supersede IAS 17 and a number of
related interpretations.
Under IFRS 16, if the Group is a lessee, it shall recognize right-of-use assets and lease liabilities for
all leases on the consolidated balance sheets except for low-value and short-term leases. The
Group may elect to apply the accounting method similar to the accounting for operating lease under
IAS 17 to the low-value and short-term leases. On the consolidated statements of comprehensive
income, the Group should present the depreciation expense charged on the right-of-use asset
separately from interest expense accrued on the lease liability; interest is computed by using
effective interest method. On the consolidated statements of cash flows, cash payments for the
principal portion of the lease liability are classified within financing activities; cash payments for
interest portion are classified within operating activities.
The application of IFRS 16 is not expected to have a material impact on the accounting of the
Group as lessor.
When IFRS 16 becomes effective, the Group may elect to apply this Standard either retrospectively
to each prior reporting period presented or retrospectively with the cumulative effect of the initial
application of this Standard recognized at the date of initial application.
5) Amendments to IAS 12 “Recognition of Deferred Tax Assets for Unrealized Losses”
The amendment clarifies that the difference between the carrying amount of the debt instrument
measured at fair value and its tax base gives rise to a temporary difference, even though there are
unrealized losses on that asset, irrespective of whether the Group expects to recover the carrying
amount of the debt instrument by sale or by holding it and collecting contractual cash flows.
In addition, in determining whether to recognize a deferred tax asset, the Group should assess a
deductible temporary difference in combination with all of its other deductible temporary
differences, unless the tax law restricts the utilization of losses as deduction against income of a
specific type, in which case, a deductible temporary difference is assessed in combination only with
other deductible temporary differences of the appropriate type. The amendment also stipulates
that, when determining whether to recognize a deferred tax asset, the estimate of probable future
taxable profit may include some of the Group’s assets for more than their carrying amount if there is
sufficient evidence that it is probable that the Group will achieve the higher amount, and that the
estimate for future taxable profit should exclude tax deductions resulting from the reversal of
deductible temporary differences.
Except for the above impact, as of the date the consolidated financial statements were authorized for
issue, the Group is continuously assessing the possible impact that the application of other standards
and interpretations will have on the Group’s financial position and financial performance, and will
disclose the relevant impact when the assessment is completed.

- 12 -
4. SUMMARY OF SIGNIFICANT ACCOUNTING POLICIES
Statement of Compliance
These interim consolidated financial statements have been prepared in accordance with the Regulations
Governing the Preparation of Financial Reports by Securities Issuers and IAS 34 “Interim Financial
Reporting” as endorsed by the FSC. Disclosure information included in these interim consolidated
financial statements is less than the disclosure information required in a complete set of annual financial
statements.
Basis of Preparation
These interim consolidated financial statements have been prepared on the historical cost basis except for
financial instruments which are measured at fair values.
The fair value measurements are grouped into Levels 1 to 3 based on the degree to which the fair value
measurement inputs are observable and the significance of the inputs to the fair value measurement in its
entirety, which are described as follows:
a. Level 1 inputs are quoted prices (unadjusted) in active markets for identical assets or liabilities;
b. Level 2 inputs are inputs other than quoted prices included within Level 1 that are observable for the
asset or liability, either directly (i.e. as prices) or indirectly (i.e. derived from prices); and
c. Level 3 inputs are unobservable inputs for the asset or liability.
Classification of Current and Non-current Assets and Liabilities
Current assets include:
a. Assets held primarily for the purpose of trading;
b. Assets expected to be realized within twelve months after the reporting period; and
c. Cash and cash equivalents unless the asset is restricted from being exchanged or used to settle a liability
for at least twelve months after the reporting period.
Current liabilities include:
a. Liabilities held primarily for the purpose of trading;
b. Liabilities due to be settled within twelve months after the reporting period; and
c. Liabilities for which the Group does not have an unconditional right to defer settlement for at least
twelve months after the reporting period.
Assets and liabilities that are not classified as current are classified as non-current.
Basis of Consolidation
The consolidated financial statements incorporate the financial statements of the Company and the entities
controlled by the Company (i.e. its subsidiaries).
When necessary, adjustments are made to the financial statements of subsidiaries to bring their accounting
policies into line with those used by the Company.
- 13 -
All intra-group transactions, balances, income and expenses are eliminated in full upon consolidation.
See Note 9 and Table 3 for the detailed information of subsidiaries (including the percentage of ownership
and main business).
Foreign Currencies
In preparing the financial statements of each individual group entity, transactions in currencies other than
the entity’s functional currency (foreign currencies) are recognized at the rates of exchange prevailing at the
dates of the transactions.
At the end of each reporting period, monetary items denominated in foreign currencies are retranslated at
the rates prevailing at that date. Exchange differences on monetary items arising from settlement or
translation are recognized in profit or loss in the period in which they arise.
Inventories
Inventories consist of raw materials, finished goods and work-in-process and are stated at the lower of cost
or net realizable value. Inventory write-downs are made by item, except where it may be appropriate to
group similar or related items. Net realizable value is the estimated selling price of inventories less all
estimated costs of completion and costs necessary to make the sale. Inventories are recorded at
weighted-average cost on the balance sheet date.
Property, Plant and Equipment
Property, plant and equipment are stated at cost, less subsequent accumulated depreciation.
Properties, plant and equipment in the course of construction are carried at cost. Cost includes
professional fees and borrowing costs eligible for capitalization. Such assets are depreciated and classified
to the appropriate categories of property, plant and equipment when completed and ready for intended use.
Depreciation on property, plant and equipment is recognized using the straight-line method. Each
significant part is depreciated separately. If the lease term is shorter than the useful lives, assets are
depreciated over the lease term. The estimated useful lives, residual values and depreciation method are
reviewed at the end of each reporting period, with the effect of any changes in estimate accounted for on a
prospective basis.
On derecognition of an item of property, plant and equipment, the difference between the sales proceeds
and the carrying amount of the asset is recognized in profit or loss.
Investment Properties
Investment properties are properties held to earn rentals and/or for capital appreciation. Investment
properties also include land held for a currently undetermined future use.
Investment properties are measured initially at cost, including transaction costs. Subsequent to initial
recognition, investment properties are measured at cost less accumulated depreciation. Depreciation is
recognized using the straight-line method.
On derecognition of an investment property, the difference between the net disposal proceeds and the
carrying amount of the asset is included in profit or loss.
- 14 -
Intangible Assets
a. Intangible assets acquired separately
Intangible assets with finite useful lives that are acquired separately are initially measured at cost and
subsequently measured at cost less accumulated amortization. Amortization is recognized on a
straight-line basis. The estimated useful life, residual value, and amortization method are reviewed at
the end of each reporting period, with the effect of any changes in estimate accounted for on a
prospective basis.
b. Derecognition of intangible assets
On derecognition of an intangible asset, the difference between the net disposal proceeds and the
carrying amount of the asset are recognized in profit or loss.
Impairment of Tangible and Intangible Assets
At the end of each reporting period, the Group reviews the carrying amounts of its tangible and intangible
assets to determine whether there is any indication that those assets have suffered an impairment loss. If
any such indication exists, the recoverable amount of the asset is estimated in order to determine the extent
of the impairment loss. When it is not possible to estimate the recoverable amount of an individual asset,
the Group estimates the recoverable amount of the cash-generating unit to which the asset belongs.
Corporate assets are allocated to the individual cash-generating units on a reasonable and consistent basis of
allocation.
Recoverable amount is the higher of fair value less costs to sell and value in use. If the recoverable
amount of an asset or cash-generating unit is estimated to be less than its carrying amount, the carrying
amount of the asset or cash-generating unit is reduced to its recoverable amount, with the resulting
impairment loss recognized in profit or loss.
When an impairment loss is subsequently reversed, the carrying amount of the asset or cash-generating unit
is increased to the revised estimate of its recoverable amount, but only to the extent of the carrying amount
that would have been determined had no impairment loss been recognized for the asset or cash-generating
unit in prior years. A reversal of an impairment loss is recognized in profit or loss.
Financial Instruments
Financial assets and financial liabilities are recognized when a group entity becomes a party to the
contractual provisions of the instruments.
Financial assets and financial liabilities are initially measured at fair value. Transaction costs that are
directly attributable to the acquisition or issue of financial assets and financial liabilities (other than
financial assets and financial liabilities at fair value through profit or loss) are added to or deducted from
the fair value of the financial assets or financial liabilities, as appropriate, on initial recognition.
Transaction costs directly attributable to the acquisition of financial assets or financial liabilities at fair
value through profit or loss are recognized immediately in profit or loss.
a. Financial assets
All regular way purchases or sales of financial assets are recognized and derecognized on a trade date
basis.
1) Measurement category
Financial assets are classified into the following categories: Loans and receivables.
- 15 -
Loans and receivables (including accounts receivable, cash and cash equivalents) are measured at
amortized cost using the effective interest method, less any impairment, except for short-term
receivables when the effect of discounting is immaterial.
Cash equivalents include time deposits that are highly liquid, are readily convertible to a known
amount of cash and are subject to an insignificant risk of changes in value.
2) Impairment of financial assets
Financial assets, other than those at fair value through profit or loss, are assessed for indicators of
impairment at the end of each reporting period. Financial assets are considered to be impaired
when there is objective evidence that, as a result of one or more events that occurred after the initial
recognition of the financial asset, the estimated future cash flows of the investment have been
affected.
For financial assets carried at amortized cost, such as accounts receivable, assets are assessed for
impairment on a collective basis even if they were assessed not to be impaired individually.
Objective evidence of impairment for a portfolio of receivables could include the Group’s past
experience of collecting payments, an increase in the number of delayed payments in the portfolio
past the average credit period, as well as observable changes in national or local economic
conditions that correlate with default on receivables.
For financial assets carried at amortized cost, the amount of the impairment loss recognized is the
difference between the asset’s carrying amount and the present value of estimated future cash flows,
discounted at the financial asset’s original effective interest rate.
For financial assets measured at amortized cost, if, in a subsequent period, the amount of the
impairment loss decreases and the decrease can be related objectively to an event occurring after the
impairment was recognized, the previously recognized impairment loss is reversed through profit or
loss to the extent that the carrying amount of the investment at the date the impairment is reversed
does not exceed what the amortized cost would have been had the impairment not been recognized.
The carrying amount of the financial asset is reduced by the impairment loss directly for all
financial assets with the exception of accounts receivable, where the carrying amount is reduced
through the use of an allowance account. When accounts receivable are considered uncollectible,
it is written off against the allowance account. Subsequent recoveries of amounts previously
written off are credited against the allowance account. Changes in the carrying amount of the
allowance account are recognized in profit or loss.
3) Derecognition of financial assets
The Group derecognizes a financial asset only when the contractual rights to the cash flows from
the asset expire, or when it transfers the financial asset and substantially all the risks and rewards of
ownership of the asset to another party.
On derecognition of a financial asset in its entirety, the difference between the asset’s carrying
amount and the sum of the consideration received and receivable and the cumulative gain or loss
that had been recognized in other comprehensive income is recognized in profit or loss.
b. Financial liabilities
1) Subsequent measurement
Financial liabilities are measured at amortized cost using the effective interest method.

- 16 -
2) Derecognition of financial liabilities
The difference between the carrying amount of the financial liability derecognized and the
consideration paid, including any non-cash assets transferred or liabilities assumed, is recognized in
profit or loss.
Revenue Recognition
Revenue is measured at the fair value of the consideration received or receivable. Revenue is reduced for
estimated customer returns, rebates and other similar allowances. Sales returns and allowances are
subtracted from gross sales, and the related costs of goods returned are reversed.
a. Sale of goods
Revenue from the sale of goods is recognized when all the following conditions are satisfied:
1) The Group has transferred to the buyer the significant risks and rewards of ownership of the goods;
2) The Group retains neither continuing managerial involvement to the degree usually associated with
ownership nor effective control over the goods sold;
3) The amount of revenue can be measured reliably;
4) It is probable that the economic benefits associated with the transaction will flow to the Group; and
5) The costs incurred or to be incurred in respect of the transaction can be measured reliably.
The Group does not recognize sales revenue on materials delivered to subcontractors because this
delivery does not involve a transfer of risks and rewards of materials ownership.
Specifically, sales of goods are recognized when goods are delivered and title has passed.
b. Interest income
Interest income from a financial asset is recognized when it is probable that the economic benefits will
flow to the Group and the amount of income can be measured reliably. Interest income is accrued on a
time basis, by reference to the principal outstanding and at the effective interest rate applicable.
Leasing
Leases are classified as finance leases whenever the terms of the lease transfer substantially all the risks and
rewards of ownership to the lessee. All other leases are classified as operating leases.
a. The Group as lessor
Rental income from operating leases is recognized on a straight-line basis over the term of the relevant
lease.
b. The Group as lessee
Operating lease payments are recognized as an expense on a straight-line basis over the lease term.

- 17 -
Borrowing Costs
Borrowing costs directly attributable to the acquisition, construction or production of qualifying assets are
added to the cost of those assets, until such time as the assets are substantially ready for their intended use
or sale.
Investment income earned on the temporary investment of specific borrowings pending their expenditure on
qualifying assets is deducted from the borrowing costs eligible for capitalization.
Other than stated above, all other borrowing costs are recognized in profit or loss in the period in which
they are incurred.
Employee Benefits
a. Short-term employee benefits
Liabilities recognized in respect of short-term employee benefits are measured at the undiscounted
amount of the benefits expected to be paid in exchange for the related service.
b. Retirement benefits
Payments to defined contribution retirement benefit plans are recognized as an expense when
employees have rendered service entitling them to the contributions.
Defined benefit costs (including service cost, net interest and remeasurement) under the defined benefit
retirement benefit plans are determined using the projected unit credit method. Service cost (including
current service cost, past service cost), and net interest on the net defined benefit liability are recognized
as employee benefits expense in the period they occur. Remeasurement, comprising actuarial gains
and losses and the return on plan assets (excluding interest), is recognized in other comprehensive
income in the period in which they occur. Remeasurement recognized in other comprehensive income
is reflected immediately in retained earnings and will not be reclassified to profit or loss.
Net defined benefit liability represents the actual deficit in the Group’s defined benefit plan. Any
surplus resulting from this calculation is limited to the present value of any refunds from the plans or
reductions in future contributions to the plans.
Pension cost for an interim period is calculated on a year-to-date basis by using the actuarially
determined pension cost rate at the end of the prior financial year, adjusted for significant market
fluctuations since that time and for significant plan amendments, settlements, or other significant
one-off events.
Taxation
Income tax expense represents the sum of the tax currently payable and deferred tax. Interim period
income taxes are assessed on an annual basis and calculated by applying to an interim period's pre-tax
income the tax rate that would be applicable to expected total annual earnings.
a. Current tax
According to the Income Tax Law, an additional tax at 10% of unappropriated earnings is provided for
as income tax in the year the shareholders approve to retain the earnings.
Adjustments of prior years’ tax liabilities are added to or deducted from the current year’s tax provision.
- 18 -
b. Deferred tax
Deferred tax is recognized on temporary differences between the carrying amounts of assets and
liabilities and the corresponding tax bases used in the computation of taxable profit.
Deferred tax liabilities are generally recognized for all taxable temporary differences. Deferred tax
assets are generally recognized for all deductible temporary differences, unused tax credits for
purchases of machinery, equipment and technology, research and development expenditures, and
personnel training expenditures to the extent that it is probable that taxable profits will be available
against which those deductible temporary differences can be utilized.
Deferred tax liabilities are recognized for taxable temporary differences associated with investments in
subsidiaries, except where the Group is able to control the reversal of the temporary difference and it is
probable that the temporary difference will not reverse in the foreseeable future. Deferred tax assets
arising from deductible temporary differences associated with such investments are only recognized to
the extent that it is probable that there will be sufficient taxable profits against which to utilize the
benefits of the temporary differences and they are expected to reverse in the foreseeable future.
The carrying amount of deferred tax assets is reviewed at the end of each reporting period and reduced
to the extent that it is no longer probable that sufficient taxable profits will be available to allow all or
part of the asset to be recovered. A previously unrecognized deferred tax asset is also reviewed at the
end of each reporting period and recognized to the to the extent that it has become probable that future
taxable profit will allow the deferred tax asset to be recovered.
Deferred tax liabilities and assets are measured at the tax rates that are expected to apply in the period in
which the liability is settled or the asset realized, based on tax rates (and tax laws) that have been
enacted or substantively enacted by the end of the reporting period. The measurement of deferred tax
liabilities and assets reflects the tax consequences that would follow from the manner in which the
Group expects, at the end of the reporting period, to recover or settle the carrying amount of its assets
and liabilities.
c. Current and deferred tax for the period
Current and deferred tax are recognized in profit or loss, except when they relate to items that are
recognized in other comprehensive income or directly in equity, in which case, the current and deferred
tax are also recognized in other comprehensive income or directly in equity respectively.
5. CRITICAL ACCOUNTING JUDGMENTS AND KEY SOURCES OF ESTIMATION
UNCERTAINTY
In the application of the Group’s accounting policies, management is required to make judgments, estimates
and assumptions about the carrying amounts of assets and liabilities that are not readily apparent from other
sources. The estimates and associated assumptions are based on historical experience and other factors
that are considered to be relevant. Actual results may differ from these estimates.
The estimates and underlying assumptions are reviewed on an ongoing basis. Revisions to accounting
estimates are recognized in the period in which the estimate is revised if the revision affects only that period
or in the period of the revision and future periods if the revision affects both current and future periods.
- 19 -
a. Estimated impairment of accounts receivable
When there is objective evidence of impairment loss, the Group takes into consideration the estimation
of future cash flows. The amount of the impairment loss is measured as the difference between the
asset’s carrying amount and the present value of estimated future cash flows (excluding future credit
losses that have not been incurred) discounted at the financial asset’s original effective interest rate.
Where the actual future cash flows are less than expected, a material impairment loss may arise.
b. Recognition and measurement of defined benefit plans
Net defined benefit liabilities and the resulting defined benefit costs under defined benefit pension plans
are calculated using the projected unit credit method. Actuarial assumptions comprise the discount
rate, rate of employee turnover, and future salary increase, etc. Changes in economic circumstances
and market conditions will affect these assumptions and may have a material impact on the amount of
the expense and the liability.
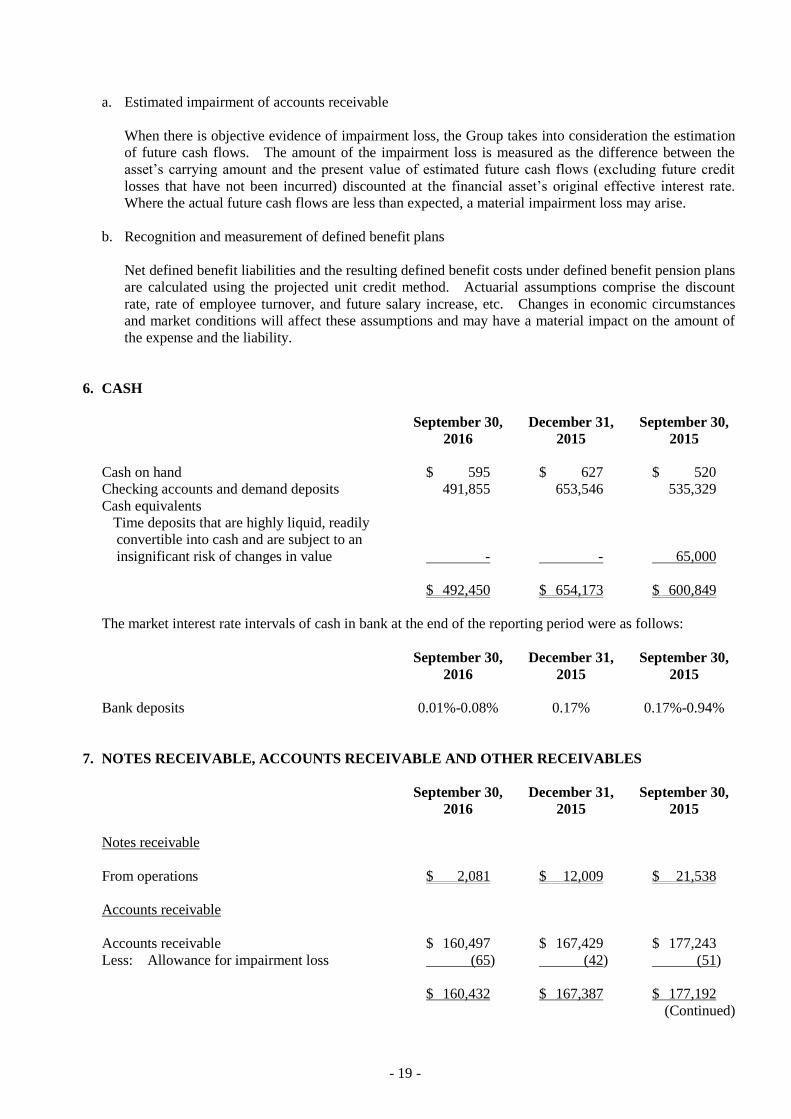
6. CASH
September 30,
2016
December 31,
2015
September 30,
2015
Cash on hand $ 595 $ 627 $ 520
Checking accounts and demand deposits 491,855 653,546 535,329
Cash equivalents
Time deposits that are highly liquid, readily
convertible into cash and are subject to an
insignificant risk of changes in value - - 65,000
$ 492,450 $ 654,173 $ 600,849
The market interest rate intervals of cash in bank at the end of the reporting period were as follows:
September 30,
2016
December 31,
2015
September 30,
2015
Bank deposits 0.01%-0.08% 0.17% 0.17%-0.94%
7. NOTES RECEIVABLE, ACCOUNTS RECEIVABLE AND OTHER RECEIVABLES
September 30,
2016
December 31,
2015
September 30,
2015
Notes receivable
From operations $ 2,081 $ 12,009 $ 21,538
Accounts receivable
Accounts receivable $ 160,497 $ 167,429 $ 177,243
Less: Allowance for impairment loss (65) (42) (51)
$ 160,432 $ 167,387 $ 177,192
(Continued)
- 20 -
September 30,
2016
December 31,
2015
September 30,
2015
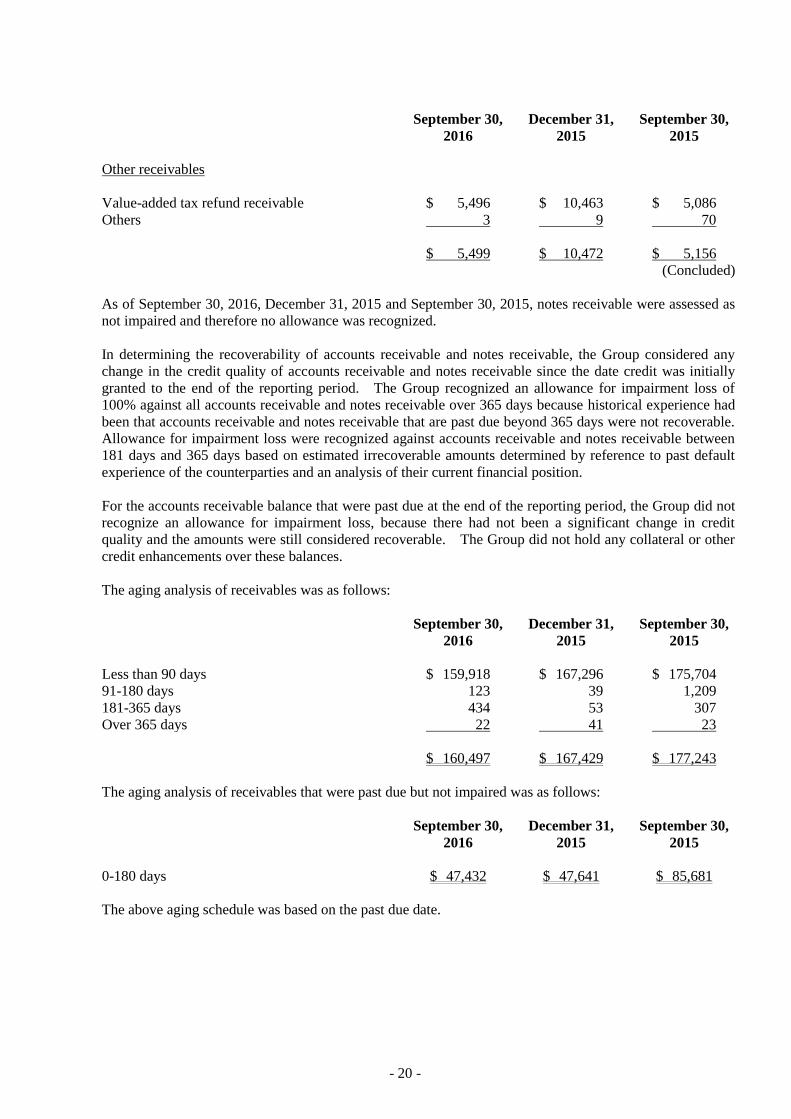
Other receivables
Value-added tax refund receivable $ 5,496 $ 10,463 $ 5,086
Others 3 9 70
$ 5,499 $ 10,472 $ 5,156
(Concluded)
As of September 30, 2016, December 31, 2015 and September 30, 2015, notes receivable were assessed as
not impaired and therefore no allowance was recognized.
In determining the recoverability of accounts receivable and notes receivable, the Group considered any
change in the credit quality of accounts receivable and notes receivable since the date credit was initially
granted to the end of the reporting period. The Group recognized an allowance for impairment loss of
100% against all accounts receivable and notes receivable over 365 days because historical experience had
been that accounts receivable and notes receivable that are past due beyond 365 days were not recoverable.
Allowance for impairment loss were recognized against accounts receivable and notes receivable between
181 days and 365 days based on estimated irrecoverable amounts determined by reference to past default
experience of the counterparties and an analysis of their current financial position.
For the accounts receivable balance that were past due at the end of the reporting period, the Group did not
recognize an allowance for impairment loss, because there had not been a significant change in credit
quality and the amounts were still considered recoverable. The Group did not hold any collateral or other
credit enhancements over these balances.
The aging analysis of receivables was as follows:
September 30,
2016
December 31,
2015
September 30,
2015
Less than 90 days $ 159,918 $ 167,296 $ 175,704
91-180 days 123 39 1,209
181-365 days 434 53 307
Over 365 days 22 41 23
$ 160,497 $ 167,429 $ 177,243
The aging analysis of receivables that were past due but not impaired was as follows:
September 30,
2016
December 31,
2015
September 30,
2015
0-180 days $ 47,432 $ 47,641 $ 85,681
The above aging schedule was based on the past due date.
- 21 -
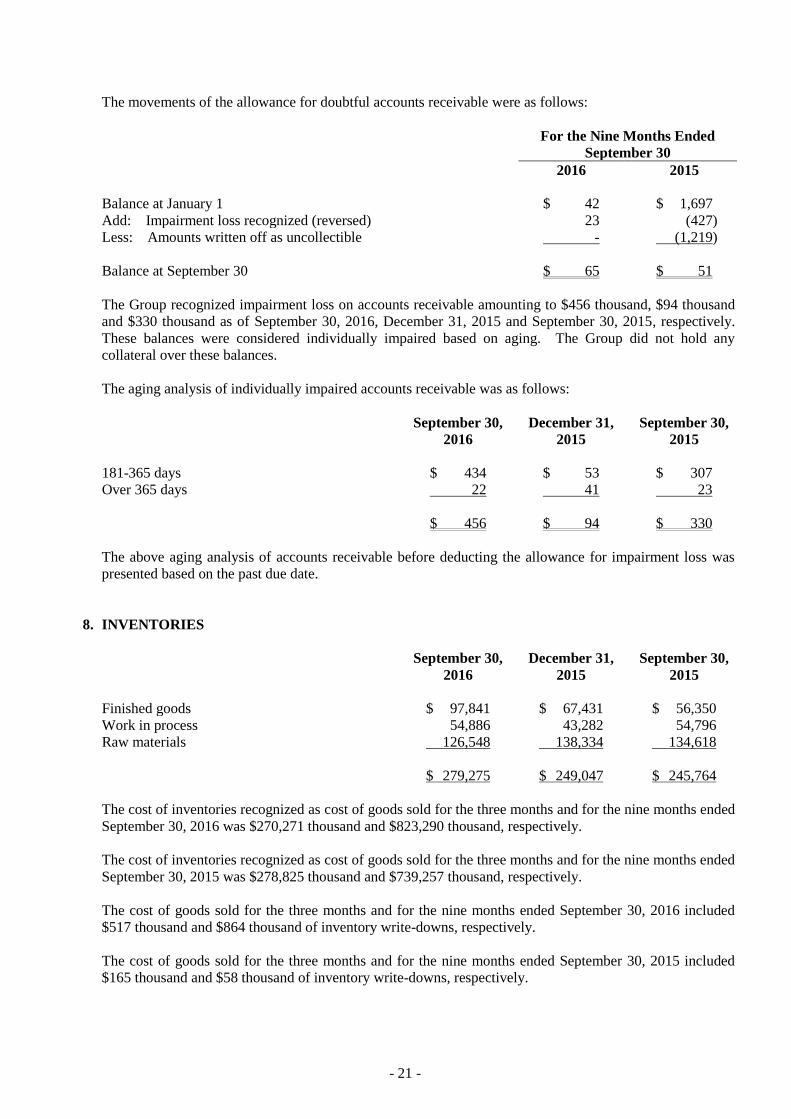
The movements of the allowance for doubtful accounts receivable were as follows:
For the Nine Months Ended
September 30
2016 2015
Balance at January 1 $ 42 $ 1,697
Add: Impairment loss recognized (reversed) 23 (427)
Less: Amounts written off as uncollectible - (1,219)
Balance at September 30 $ 65 $ 51
The Group recognized impairment loss on accounts receivable amounting to $456 thousand, $94 thousand
and $330 thousand as of September 30, 2016, December 31, 2015 and September 30, 2015, respectively.
These balances were considered individually impaired based on aging. The Group did not hold any
collateral over these balances.
The aging analysis of individually impaired accounts receivable was as follows:
September 30,
2016
December 31,
2015
September 30,
2015
181-365 days $ 434 $ 53 $ 307
Over 365 days 22 41 23
$ 456 $ 94 $ 330
The above aging analysis of accounts receivable before deducting the allowance for impairment loss was
presented based on the past due date.
8. INVENTORIES
September 30,
2016
December 31,
2015
September 30,
2015
Finished goods $ 97,841 $ 67,431 $ 56,350
Work in process 54,886 43,282 54,796
Raw materials 126,548 138,334 134,618
$ 279,275 $ 249,047 $ 245,764
The cost of inventories recognized as cost of goods sold for the three months and for the nine months ended
September 30, 2016 was $270,271 thousand and $823,290 thousand, respectively.
The cost of inventories recognized as cost of goods sold for the three months and for the nine months ended
September 30, 2015 was $278,825 thousand and $739,257 thousand, respectively.
The cost of goods sold for the three months and for the nine months ended September 30, 2016 included
$517 thousand and $864 thousand of inventory write-downs, respectively.
The cost of goods sold for the three months and for the nine months ended September 30, 2015 included
$165 thousand and $58 thousand of inventory write-downs, respectively.
- 22 -
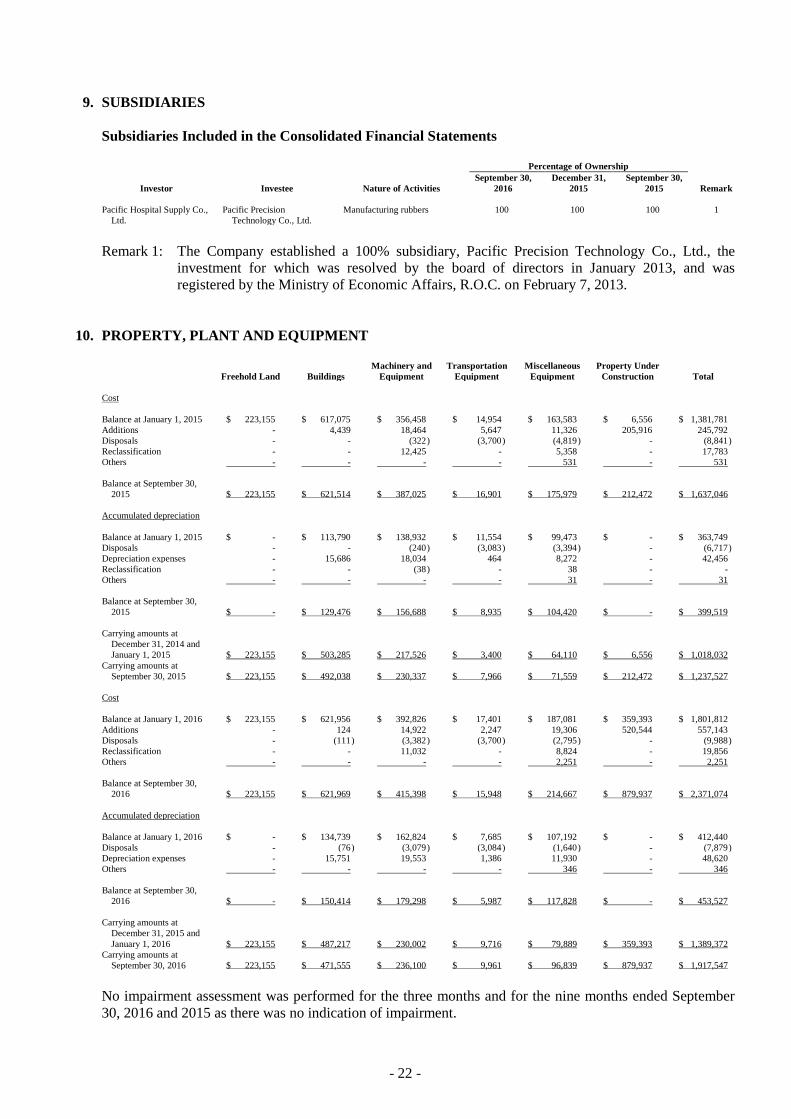
9. SUBSIDIARIES
Subsidiaries Included in the Consolidated Financial Statements
Percentage of Ownership
Investor Investee Nature of Activities
September 30,
2016
December 31,
2015
September 30,
2015 Remark
Pacific Hospital Supply Co.,
Ltd.
Pacific Precision
Technology Co., Ltd.
Manufacturing rubbers 100 100 100 1
Remark 1: The Company established a 100% subsidiary, Pacific Precision Technology Co., Ltd., the
investment for which was resolved by the board of directors in January 2013, and was
registered by the Ministry of Economic Affairs, R.O.C. on February 7, 2013.
10. PROPERTY, PLANT AND EQUIPMENT
Freehold Land Buildings
Machinery and
Equipment
Transportation
Equipment
Miscellaneous
Equipment
Property Under
Construction Total
Cost
Balance at January 1, 2015 $ 223,155 $ 617,075 $ 356,458 $ 14,954 $ 163,583 $ 6,556 $ 1,381,781
Additions - 4,439 18,464 5,647 11,326 205,916 245,792
Disposals - - (322 ) (3,700 ) (4,819 ) - (8,841 )
Reclassification - - 12,425 - 5,358 - 17,783
Others - - - - 531 - 531
Balance at September 30,
2015 $ 223,155 $ 621,514 $ 387,025 $ 16,901 $ 175,979 $ 212,472 $ 1,637,046
Accumulated depreciation
Balance at January 1, 2015 $ - $ 113,790 $ 138,932 $ 11,554 $ 99,473 $ - $ 363,749
Disposals - - (240 ) (3,083 ) (3,394 ) - (6,717 )
Depreciation expenses - 15,686 18,034 464 8,272 - 42,456
Reclassification - - (38 ) - 38 - -
Others - - - - 31 - 31
Balance at September 30,
2015 $ - $ 129,476 $ 156,688 $ 8,935 $ 104,420 $ - $ 399,519
Carrying amounts at
December 31, 2014 and
January 1, 2015 $ 223,155 $ 503,285 $ 217,526 $ 3,400 $ 64,110 $ 6,556 $ 1,018,032
Carrying amounts at
September 30, 2015 $ 223,155 $ 492,038 $ 230,337 $ 7,966 $ 71,559 $ 212,472 $ 1,237,527
Cost
Balance at January 1, 2016 $ 223,155 $ 621,956 $ 392,826 $ 17,401 $ 187,081 $ 359,393 $ 1,801,812
Additions - 124 14,922 2,247 19,306 520,544 557,143
Disposals - (111 ) (3,382 ) (3,700 ) (2,795 ) - (9,988 )
Reclassification - - 11,032 - 8,824 - 19,856
Others - - - - 2,251 - 2,251
Balance at September 30,
2016 $ 223,155 $ 621,969 $ 415,398 $ 15,948 $ 214,667 $ 879,937 $ 2,371,074
Accumulated depreciation
Balance at January 1, 2016 $ - $ 134,739 $ 162,824 $ 7,685 $ 107,192 $ - $ 412,440
Disposals - (76 ) (3,079 ) (3,084 ) (1,640 ) - (7,879 )
Depreciation expenses - 15,751 19,553 1,386 11,930 - 48,620
Others - - - - 346 - 346
Balance at September 30,
2016 $ - $ 150,414 $ 179,298 $ 5,987 $ 117,828 $ - $ 453,527
Carrying amounts at
December 31, 2015 and
January 1, 2016 $ 223,155 $ 487,217 $ 230,002 $ 9,716 $ 79,889 $ 359,393 $ 1,389,372
Carrying amounts at
September 30, 2016 $ 223,155 $ 471,555 $ 236,100 $ 9,961 $ 96,839 $ 879,937 $ 1,917,547
No impairment assessment was performed for the three months and for the nine months ended September
30, 2016 and 2015 as there was no indication of impairment.

- 23 -
The above items of property, plant and equipment were depreciated on a straight-line basis over the
estimated useful lives as follows:
Buildings
Plant 30-51 years
Electrical power equipment 15-30 years
Others 2-50 years
Machinery and equipment 2-26 years
Transportation equipment 5-11 years
Miscellaneous equipment 2-15 years
Property, plant and equipment pledged as collateral for bank borrowings were set out in Note 26.
11. INVESTMENT PROPERTIES
Freehold Land Buildings Total
Cost
Balance at January 1, 2015 $ - $ - $ -
Additions 78,179 15,724 93,903
Balance at September 30, 2015 $ 78,179 $ 15,724 $ 93,903
Accumulated depreciation
Balance at January 1, 2015 $ - $ - $ -
Depreciation expenses - 103 103
Balance at September 30, 2015 $ - $ 103 $ 103
Carrying amounts at September 30, 2015 $ 78,179 $ 15,621 $ 93,800
Cost
Balance at January 1, 2016 and September 30,
2016 $ 78,179 $ 15,724 $ 93,903
Accumulated depreciation
Balance at January 1, 2016 $ - $ 180 $ 180
Depreciation expenses - 231 231
Balance at September 30, 2016 $ - $ 411 $ 411
Carrying amounts at December 31, 2015 and
January 1, 2016 $ 78,179 $ 15,544 $ 93,723
Carrying amounts at September 30, 2016 $ 78,179 $ 15,313 $ 93,492
Buildings under the investment properties were depreciated on a straight-line basis over the estimated
useful lives of 51 years.
- 24 -
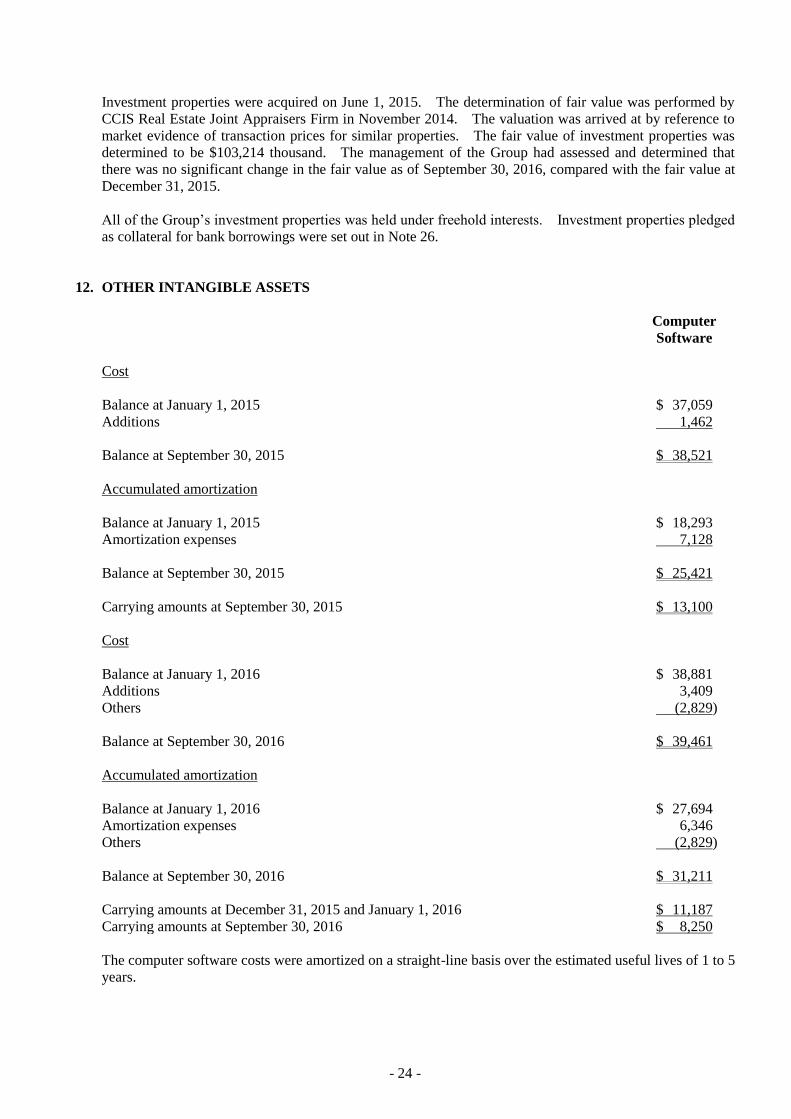
Investment properties were acquired on June 1, 2015. The determination of fair value was performed by
CCIS Real Estate Joint Appraisers Firm in November 2014. The valuation was arrived at by reference to
market evidence of transaction prices for similar properties. The fair value of investment properties was
determined to be $103,214 thousand. The management of the Group had assessed and determined that
there was no significant change in the fair value as of September 30, 2016, compared with the fair value at
December 31, 2015.
All of the Group’s investment properties was held under freehold interests. Investment properties pledged
as collateral for bank borrowings were set out in Note 26.
12. OTHER INTANGIBLE ASSETS
Computer
Software
Cost
Balance at January 1, 2015 $ 37,059
Additions 1,462
Balance at September 30, 2015 $ 38,521
Accumulated amortization
Balance at January 1, 2015 $ 18,293
Amortization expenses 7,128
Balance at September 30, 2015 $ 25,421
Carrying amounts at September 30, 2015 $ 13,100
Cost
Balance at January 1, 2016 $ 38,881
Additions 3,409
Others (2,829)
Balance at September 30, 2016 $ 39,461
Accumulated amortization
Balance at January 1, 2016 $ 27,694
Amortization expenses 6,346
Others (2,829)
Balance at September 30, 2016 $ 31,211
Carrying amounts at December 31, 2015 and January 1, 2016 $ 11,187
Carrying amounts at September 30, 2016 $ 8,250
The computer software costs were amortized on a straight-line basis over the estimated useful lives of 1 to 5
years.

- 25 -
13. OTHER ASSETS
September 30,
2016
December 31,
2015
September 30,
2015
Current
Prepayments for equipment $ 66,516 $ 30,463 $ 21,850
Prepaid expenses 20,651 12,844 11,578
Prepayments for purchases 12,736 2,615 5,852
Input tax 49,829 16,951 15,229
Others 2,035 1,811 1,598
$ 151,767 $ 64,684 $ 56,107
Non-current
Refundable deposits $ 16,431 $ 14,613 $ 14,682
14. BORROWINGS
a. Short-term borrowings
September 30,
2016
December 31,
2015
September 30,
2015
Unsecured borrowings
Line of credit borrowings $ 187,000 $ - $ -
The weighted average effective interest rate on bank loans was 1.20%-1.60% as of September 30, 2016.
b. Long-term borrowings
September 30,
2016
December 31,
2015
September 30,
2015
Secured borrowings (Note 26)
Bank loans (1) $ 100,000 $ 100,000 $ 100,000
Bank loans (2) 100,000 - -
Bank loans (3) 74,700 74,700 74,700
Bank loans (4) 50,000 - -
Bank loans (5) 30,000 30,000 -
354,700 204,700 174,700
Less: Current portion (12,063) - -
Long-term borrowings $ 342,637 $ 204,700 $ 174,700
1) On June 29, 2015, the Group acquired new bank borrowing facilities in the amount of $100,000
thousand secured by the Group’s freehold land and buildings (refer to Note 26), with an interest rate
of 1.42% and will be repayable in the next 15 years (term: June 2015 - June 2030, repayable
monthly with a grace period for the first 24 months). The purpose of this bank borrowing was for
acquisition of plant and equipment.
- 26 -
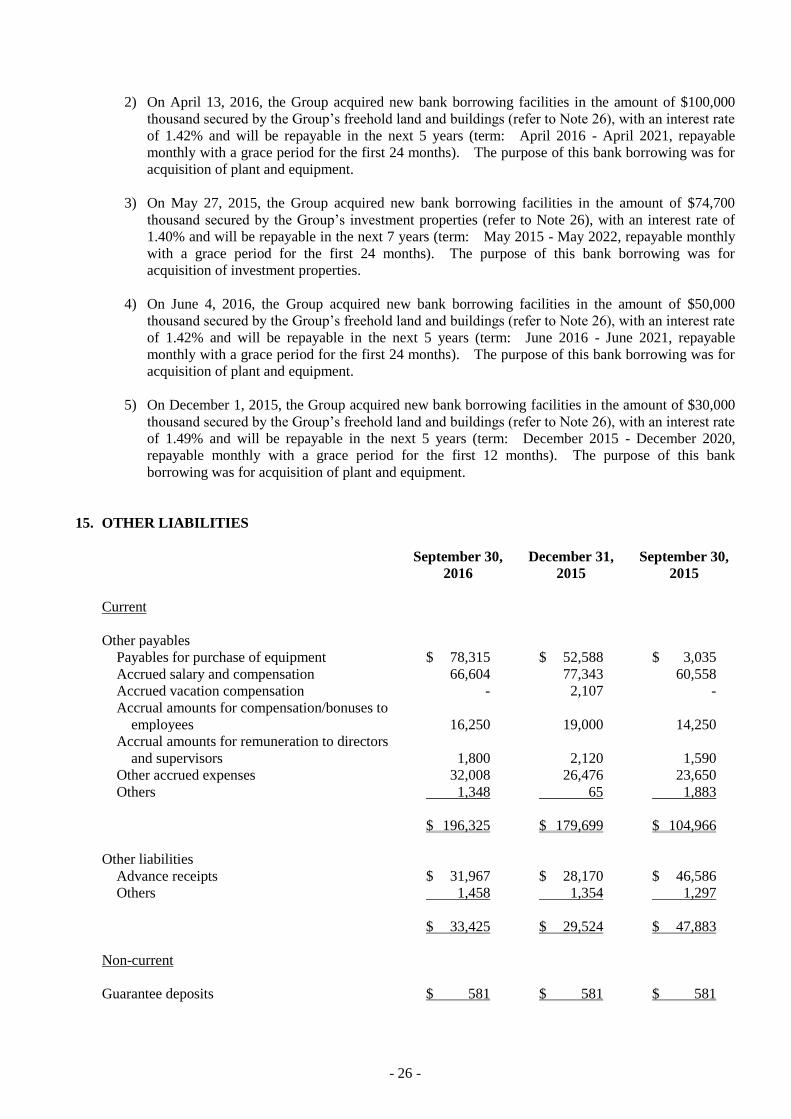
2) On April 13, 2016, the Group acquired new bank borrowing facilities in the amount of $100,000
thousand secured by the Group’s freehold land and buildings (refer to Note 26), with an interest rate
of 1.42% and will be repayable in the next 5 years (term: April 2016 - April 2021, repayable
monthly with a grace period for the first 24 months). The purpose of this bank borrowing was for
acquisition of plant and equipment.
3) On May 27, 2015, the Group acquired new bank borrowing facilities in the amount of $74,700
thousand secured by the Group’s investment properties (refer to Note 26), with an interest rate of
1.40% and will be repayable in the next 7 years (term: May 2015 - May 2022, repayable monthly
with a grace period for the first 24 months). The purpose of this bank borrowing was for
acquisition of investment properties.
4) On June 4, 2016, the Group acquired new bank borrowing facilities in the amount of $50,000
thousand secured by the Group’s freehold land and buildings (refer to Note 26), with an interest rate
of 1.42% and will be repayable in the next 5 years (term: June 2016 - June 2021, repayable
monthly with a grace period for the first 24 months). The purpose of this bank borrowing was for
acquisition of plant and equipment.
5) On December 1, 2015, the Group acquired new bank borrowing facilities in the amount of $30,000
thousand secured by the Group’s freehold land and buildings (refer to Note 26), with an interest rate
of 1.49% and will be repayable in the next 5 years (term: December 2015 - December 2020,
repayable monthly with a grace period for the first 12 months). The purpose of this bank
borrowing was for acquisition of plant and equipment.
15. OTHER LIABILITIES
September 30,
2016
December 31,
2015
September 30,
2015
Current
Other payables
Payables for purchase of equipment $ 78,315 $ 52,588 $ 3,035
Accrued salary and compensation 66,604 77,343 60,558
Accrued vacation compensation - 2,107 -
Accrual amounts for compensation/bonuses to
employees 16,250 19,000 14,250
Accrual amounts for remuneration to directors
and supervisors 1,800 2,120 1,590
Other accrued expenses 32,008 26,476 23,650
Others 1,348 65 1,883
$ 196,325 $ 179,699 $ 104,966
Other liabilities
Advance receipts $ 31,967 $ 28,170 $ 46,586
Others 1,458 1,354 1,297
$ 33,425 $ 29,524 $ 47,883
Non-current
Guarantee deposits $ 581 $ 581 $ 581
- 27 -
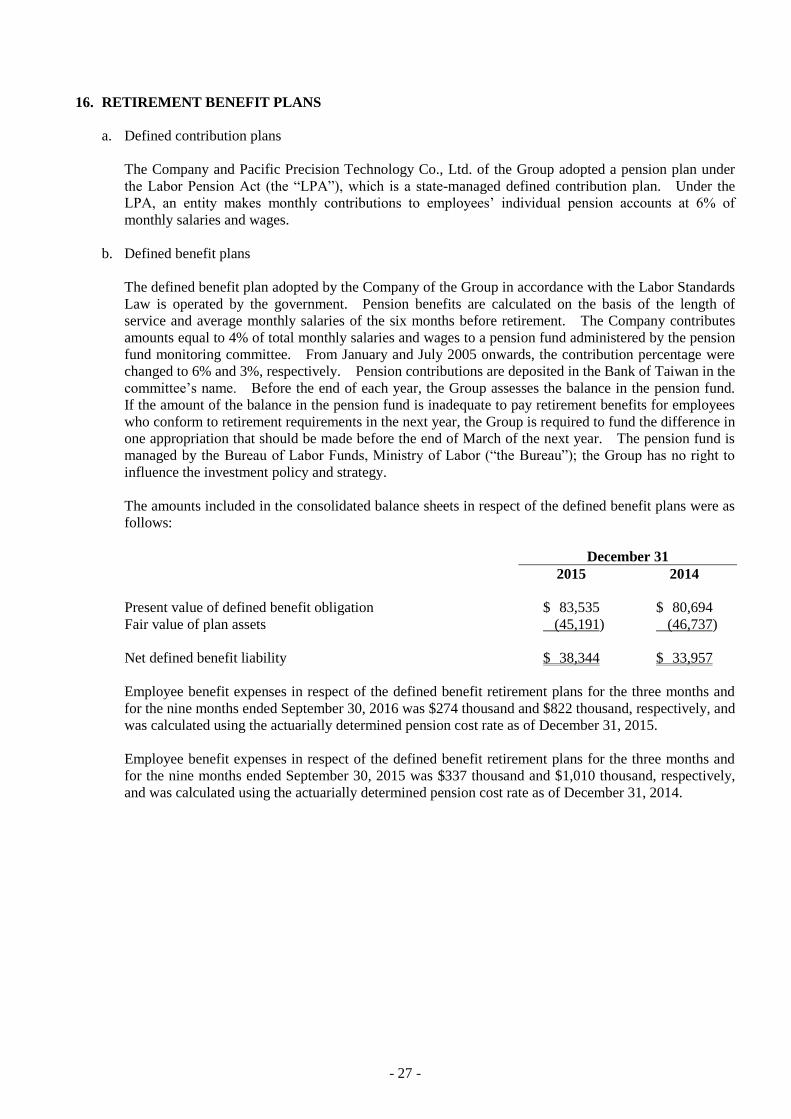
16. RETIREMENT BENEFIT PLANS
a. Defined contribution plans
The Company and Pacific Precision Technology Co., Ltd. of the Group adopted a pension plan under
the Labor Pension Act (the “LPA”), which is a state-managed defined contribution plan. Under the
LPA, an entity makes monthly contributions to employees’ individual pension accounts at 6% of
monthly salaries and wages.
b. Defined benefit plans
The defined benefit plan adopted by the Company of the Group in accordance with the Labor Standards
Law is operated by the government. Pension benefits are calculated on the basis of the length of
service and average monthly salaries of the six months before retirement. The Company contributes
amounts equal to 4% of total monthly salaries and wages to a pension fund administered by the pension
fund monitoring committee. From January and July 2005 onwards, the contribution percentage were
changed to 6% and 3%, respectively. Pension contributions are deposited in the Bank of Taiwan in the
committee’s name. Before the end of each year, the Group assesses the balance in the pension fund.
If the amount of the balance in the pension fund is inadequate to pay retirement benefits for employees
who conform to retirement requirements in the next year, the Group is required to fund the difference in
one appropriation that should be made before the end of March of the next year. The pension fund is
managed by the Bureau of Labor Funds, Ministry of Labor (“the Bureau”); the Group has no right to
influence the investment policy and strategy.
The amounts included in the consolidated balance sheets in respect of the defined benefit plans were as
follows:
December 31
2015 2014
Present value of defined benefit obligation $ 83,535 $ 80,694
Fair value of plan assets (45,191) (46,737)
Net defined benefit liability $ 38,344 $ 33,957
Employee benefit expenses in respect of the defined benefit retirement plans for the three months and
for the nine months ended September 30, 2016 was $274 thousand and $822 thousand, respectively, and
was calculated using the actuarially determined pension cost rate as of December 31, 2015.
Employee benefit expenses in respect of the defined benefit retirement plans for the three months and
for the nine months ended September 30, 2015 was $337 thousand and $1,010 thousand, respectively,
and was calculated using the actuarially determined pension cost rate as of December 31, 2014.

- 28 -
An analysis by function of the amounts recognized in profit or loss in respect of the defined benefit
plans is as follows:
For the Three Months Ended
September 30
For the Nine Months Ended
September 30
2016 2015 2016 2015
Operating costs $ 198 $ 250 $ 595 $ 727
Selling and marketing expenses 18 24 52 81
General and administrative
expenses 37 45 112 148
Research and development
expenses 21 18 63 54
$ 274 $ 337 $ 822 $ 1,010
Through the defined benefit plans under the Labor Standards Law, the Group is exposed to the
following risks:
1) Investment risk: The plan assets are invested in domestic/and foreign/equity and debt securities,
bank deposits, etc. The investment is conducted at the discretion of the Bureau or under the
mandated management. However, in accordance with relevant regulations, the return generated by
plan assets should not be below the interest rate for a 2-year time deposit with local banks.
2) Interest risk: A decrease in the government bond interest rate will increase the present value of the
defined benefit obligation; however, this will be partially offset by an increase in the return on the
plan’s debt investments.
3) Salary risk: The present value of the defined benefit obligation is calculated by reference to the
future salaries of plan participants. Therefore, an increase in the salary of the plan participants will
increase the present value of the defined benefit obligation.
The actuarial valuations of the present value of the defined benefit obligation were carried out by
qualified actuaries. The principal assumptions used for the purposes of the actuarial valuations were
as follows:
December 31
2015 2014
Discount rate 1.25% 2.00%
Expected rate of salary increase 2.00% 2.00%
Turnover rate 1.24% 1.35%
- 29 -
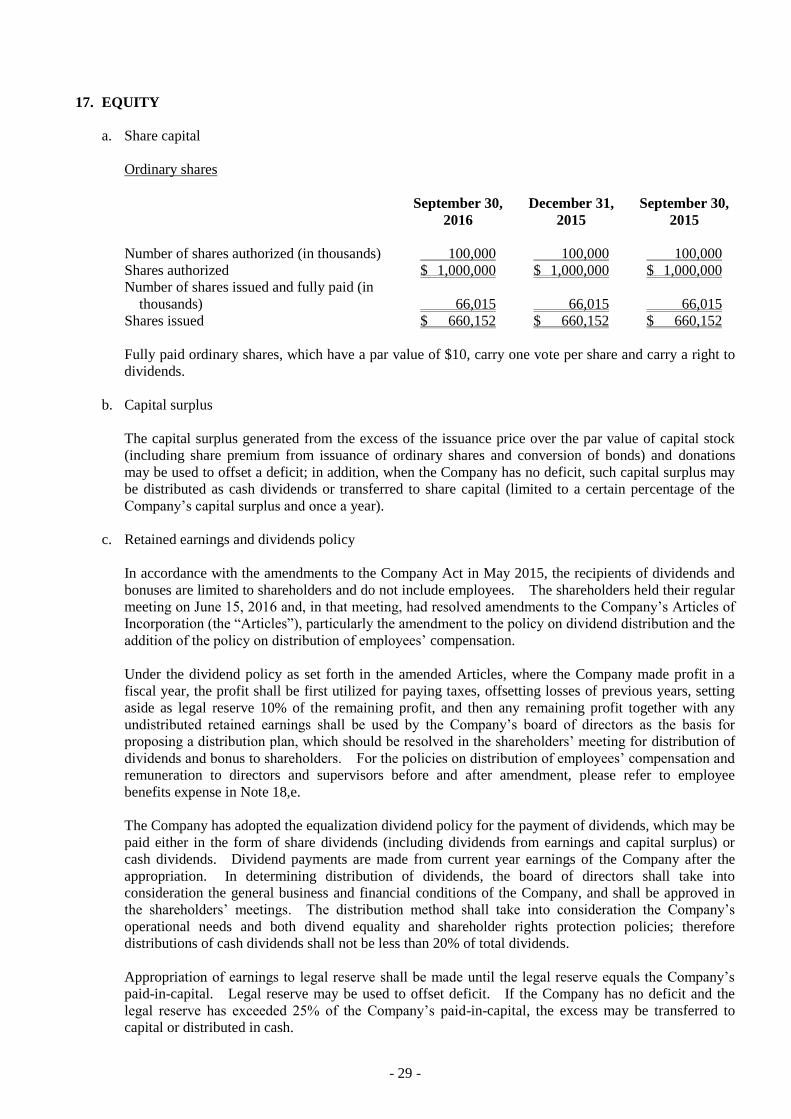
17. EQUITY
a. Share capital
Ordinary shares
September 30,
2016
December 31,
2015
September 30,
2015
Number of shares authorized (in thousands) 100,000 100,000 100,000
Shares authorized $ 1,000,000 $ 1,000,000 $ 1,000,000
Number of shares issued and fully paid (in
thousands) 66,015 66,015 66,015
Shares issued $ 660,152 $ 660,152 $ 660,152
Fully paid ordinary shares, which have a par value of $10, carry one vote per share and carry a right to
dividends.
b. Capital surplus
The capital surplus generated from the excess of the issuance price over the par value of capital stock
(including share premium from issuance of ordinary shares and conversion of bonds) and donations
may be used to offset a deficit; in addition, when the Company has no deficit, such capital surplus may
be distributed as cash dividends or transferred to share capital (limited to a certain percentage of the
Company’s capital surplus and once a year).
c. Retained earnings and dividends policy
In accordance with the amendments to the Company Act in May 2015, the recipients of dividends and
bonuses are limited to shareholders and do not include employees. The shareholders held their regular
meeting on June 15, 2016 and, in that meeting, had resolved amendments to the Company’s Articles of
Incorporation (the “Articles”), particularly the amendment to the policy on dividend distribution and the
addition of the policy on distribution of employees’ compensation.
Under the dividend policy as set forth in the amended Articles, where the Company made profit in a
fiscal year, the profit shall be first utilized for paying taxes, offsetting losses of previous years, setting
aside as legal reserve 10% of the remaining profit, and then any remaining profit together with any
undistributed retained earnings shall be used by the Company’s board of directors as the basis for
proposing a distribution plan, which should be resolved in the shareholders’ meeting for distribution of
dividends and bonus to shareholders. For the policies on distribution of employees’ compensation and
remuneration to directors and supervisors before and after amendment, please refer to employee
benefits expense in Note 18,e.
The Company has adopted the equalization dividend policy for the payment of dividends, which may be
paid either in the form of share dividends (including dividends from earnings and capital surplus) or
cash dividends. Dividend payments are made from current year earnings of the Company after the
appropriation. In determining distribution of dividends, the board of directors shall take into
consideration the general business and financial conditions of the Company, and shall be approved in
the shareholders’ meetings. The distribution method shall take into consideration the Company’s
operational needs and both divend equality and shareholder rights protection policies; therefore
distributions of cash dividends shall not be less than 20% of total dividends.
Appropriation of earnings to legal reserve shall be made until the legal reserve equals the Company’s
paid-in-capital. Legal reserve may be used to offset deficit. If the Company has no deficit and the
legal reserve has exceeded 25% of the Company’s paid-in-capital, the excess may be transferred to
capital or distributed in cash.

- 30 -
Under Rule No. 1010012865, Rule No. 1010047490 and Rule No. 1030006415 issued by the FSC and
the directive titled “Questions and Answers on Special Reserves Appropriated Following Adoption of
IFRSs”, the Company should appropriate or reverse to a special reserve.
Except for non-ROC resident shareholders, all shareholders receiving the dividends are allowed a tax
credit equal to their proportionate share of the income tax paid by the Company.
The appropriations of earnings for 2015 and 2014 having been approved in the shareholders’ meeting
on June 15, 2016 and June 10, 2015, respectively, were as follows:
Dividends Per Share
Appropriation of Earnings (NT$)
For the Year Ended
December 31
For the Year Ended
December 31
2015 2014 2015 2014
Legal reserve $ 35,130 $ 32,699
Cash dividends 165,038 165,038 $ 2.5 $ 2.5
18. PROFIT BEFORE INCOME TAX
a. Other income
For the Three Months Ended
September 30
For the Nine Months Ended
September 30
2016 2015 2016 2015
Operating lease rental income
Investment properties $ 831 $ 829 $ 2,498 $ 1,106
Others 210 207 639 638
1,041 1,036 3,137 1,744
Interest income - bank deposits 11 128 400 587
Others 1,126 2,891 4,607 5,583
$ 2,178 $ 4,055 $ 8,144 $ 7,914
b. Other gains and losses
For the Three Months Ended
September 30
For the Nine Months Ended
September 30
2016 2015 2016 2015
Gains (losses) on disposal of
property, plant and
equipment $ (258) $ (210) $ 425 $ 17
Net foreign currency exchange
gains (losses) (8,332) 24,424 (4,414) 10,542
$ (8,590) $ 24,214 $ (3,989) $ 10,559
- 31 -
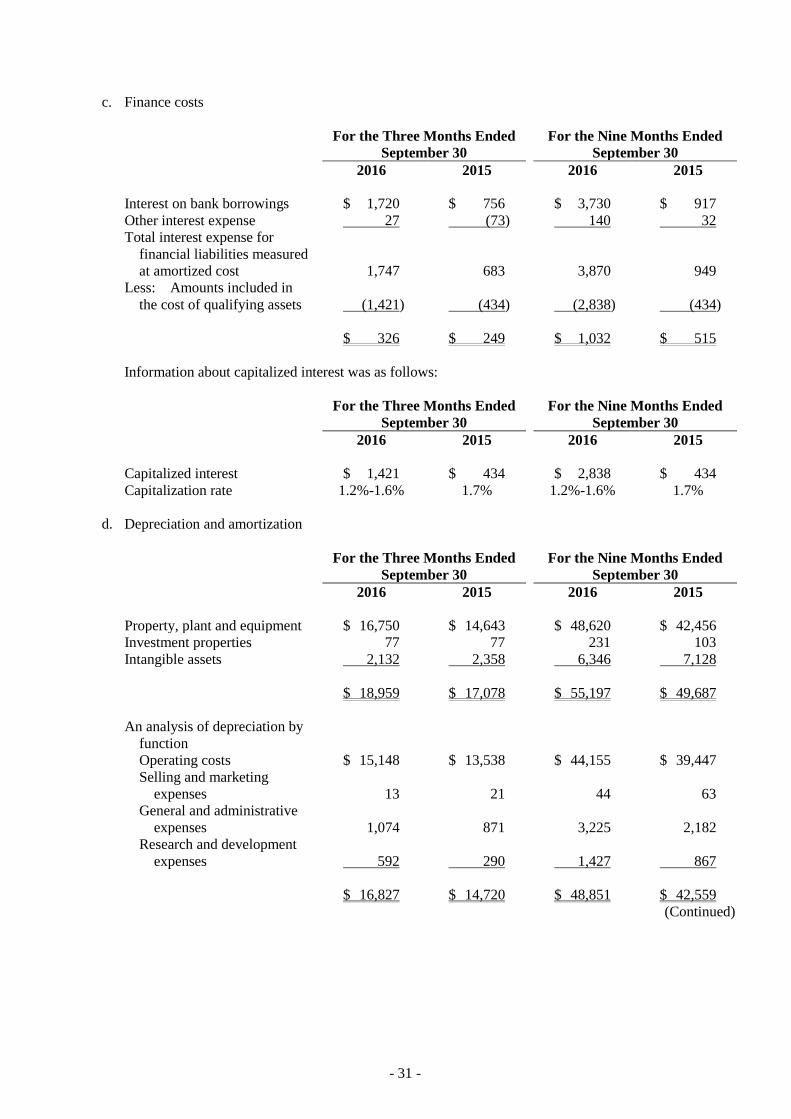
c. Finance costs
For the Three Months Ended
September 30
For the Nine Months Ended
September 30
2016 2015 2016 2015
Interest on bank borrowings $ 1,720 $ 756 $ 3,730 $ 917
Other interest expense 27 (73) 140 32
Total interest expense for
financial liabilities measured
at amortized cost 1,747 683 3,870 949
Less: Amounts included in
the cost of qualifying assets (1,421) (434) (2,838) (434)
$ 326 $ 249 $ 1,032 $ 515
Information about capitalized interest was as follows:
For the Three Months Ended
September 30
For the Nine Months Ended
September 30
2016 2015 2016 2015
Capitalized interest $ 1,421 $ 434 $ 2,838 $ 434
Capitalization rate 1.2%-1.6% 1.7% 1.2%-1.6% 1.7%
d. Depreciation and amortization
For the Three Months Ended
September 30
For the Nine Months Ended
September 30
2016 2015 2016 2015
Property, plant and equipment $ 16,750 $ 14,643 $ 48,620 $ 42,456
Investment properties 77 77 231 103
Intangible assets 2,132 2,358 6,346 7,128
$ 18,959 $ 17,078 $ 55,197 $ 49,687
An analysis of depreciation by
function
Operating costs $ 15,148 $ 13,538 $ 44,155 $ 39,447
Selling and marketing
expenses 13 21 44 63
General and administrative
expenses 1,074 871 3,225 2,182
Research and development
expenses 592 290 1,427 867
$ 16,827 $ 14,720 $ 48,851 $ 42,559
(Continued)
- 32 -
For the Three Months Ended
September 30
For the Nine Months Ended
September 30
2016 2015 2016 2015
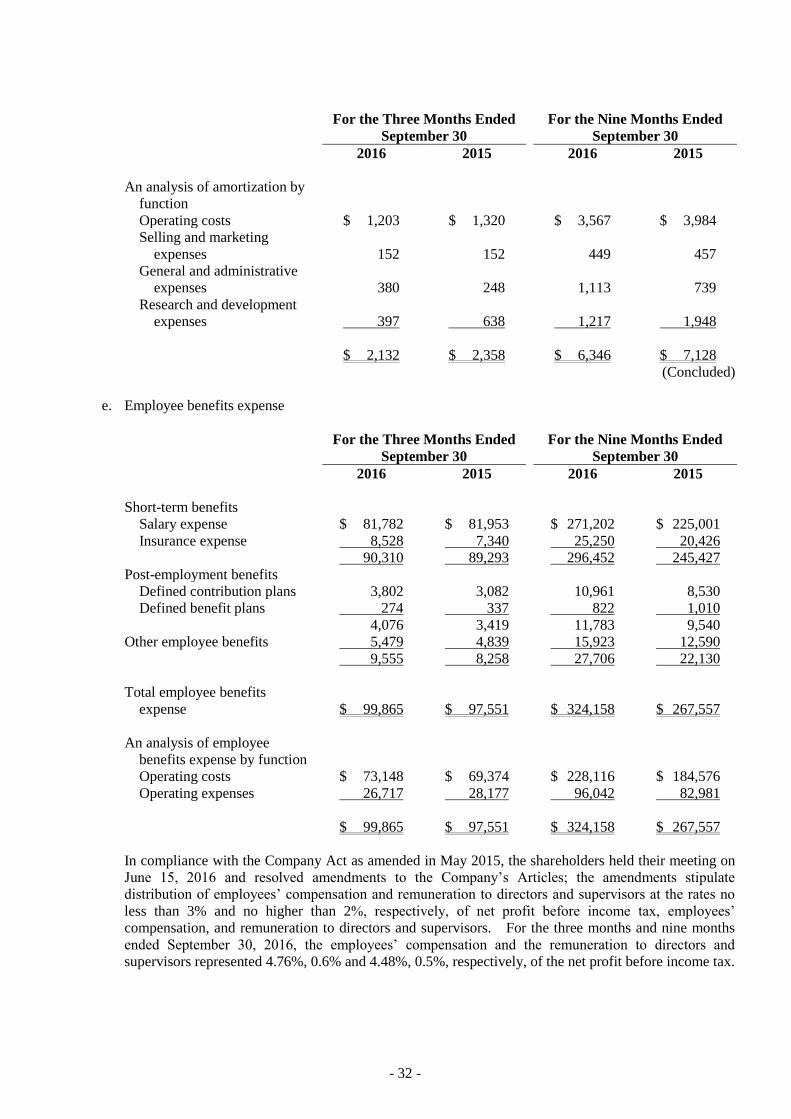
An analysis of amortization by
function
Operating costs $ 1,203 $ 1,320 $ 3,567 $ 3,984
Selling and marketing
expenses 152 152 449 457
General and administrative
expenses 380 248 1,113 739
Research and development
expenses 397 638 1,217 1,948
$ 2,132 $ 2,358 $ 6,346 $ 7,128
(Concluded)
e. Employee benefits expense
For the Three Months Ended
September 30
For the Nine Months Ended
September 30
2016 2015 2016 2015
Short-term benefits
Salary expense $ 81,782 $ 81,953 $ 271,202 $ 225,001
Insurance expense 8,528 7,340 25,250 20,426
90,310 89,293 296,452 245,427
Post-employment benefits
Defined contribution plans 3,802 3,082 10,961 8,530
Defined benefit plans 274 337 822 1,010
4,076 3,419 11,783 9,540
Other employee benefits 5,479 4,839 15,923 12,590
9,555 8,258 27,706 22,130
Total employee benefits
expense $ 99,865 $ 97,551 $ 324,158 $ 267,557
An analysis of employee
benefits expense by function
Operating costs $ 73,148 $ 69,374 $ 228,116 $ 184,576
Operating expenses 26,717 28,177 96,042 82,981
$ 99,865 $ 97,551 $ 324,158 $ 267,557
In compliance with the Company Act as amended in May 2015, the shareholders held their meeting on
June 15, 2016 and resolved amendments to the Company’s Articles; the amendments stipulate
distribution of employees’ compensation and remuneration to directors and supervisors at the rates no
less than 3% and no higher than 2%, respectively, of net profit before income tax, employees’
compensation, and remuneration to directors and supervisors. For the three months and nine months
ended September 30, 2016, the employees’ compensation and the remuneration to directors and
supervisors represented 4.76%, 0.6% and 4.48%, 0.5%, respectively, of the net profit before income tax.
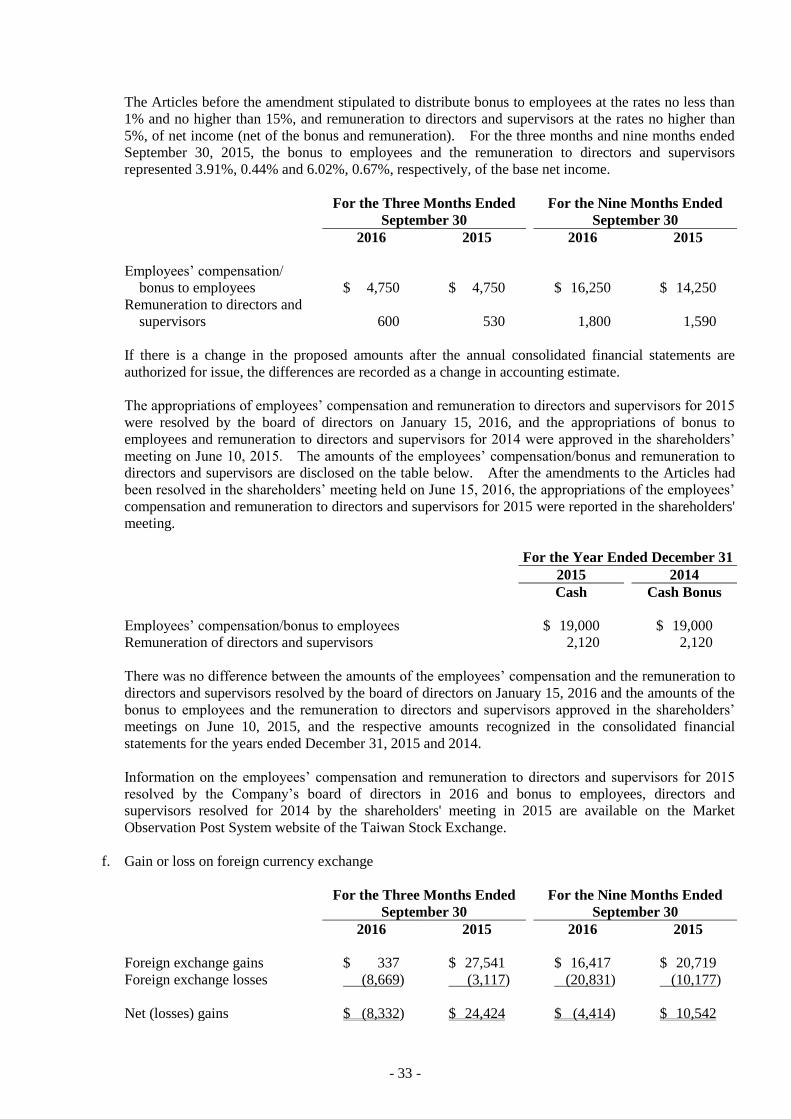
- 33 -
The Articles before the amendment stipulated to distribute bonus to employees at the rates no less than
1% and no higher than 15%, and remuneration to directors and supervisors at the rates no higher than
5%, of net income (net of the bonus and remuneration). For the three months and nine months ended
September 30, 2015, the bonus to employees and the remuneration to directors and supervisors
represented 3.91%, 0.44% and 6.02%, 0.67%, respectively, of the base net income.
For the Three Months Ended
September 30
For the Nine Months Ended
September 30
2016 2015 2016 2015
Employees’ compensation/
bonus to employees $ 4,750 $ 4,750 $ 16,250 $ 14,250
Remuneration to directors and
supervisors 600 530 1,800 1,590
If there is a change in the proposed amounts after the annual consolidated financial statements are
authorized for issue, the differences are recorded as a change in accounting estimate.
The appropriations of employees’ compensation and remuneration to directors and supervisors for 2015
were resolved by the board of directors on January 15, 2016, and the appropriations of bonus to
employees and remuneration to directors and supervisors for 2014 were approved in the shareholders’
meeting on June 10, 2015. The amounts of the employees’ compensation/bonus and remuneration to
directors and supervisors are disclosed on the table below. After the amendments to the Articles had
been resolved in the shareholders’ meeting held on June 15, 2016, the appropriations of the employees’
compensation and remuneration to directors and supervisors for 2015 were reported in the shareholders'
meeting.
For the Year Ended December 31
2015 2014
Cash Cash Bonus
Employees’ compensation/bonus to employees $ 19,000 $ 19,000
Remuneration of directors and supervisors 2,120 2,120
There was no difference between the amounts of the employees’ compensation and the remuneration to
directors and supervisors resolved by the board of directors on January 15, 2016 and the amounts of the
bonus to employees and the remuneration to directors and supervisors approved in the shareholders’
meetings on June 10, 2015, and the respective amounts recognized in the consolidated financial
statements for the years ended December 31, 2015 and 2014.
Information on the employees’ compensation and remuneration to directors and supervisors for 2015
resolved by the Company’s board of directors in 2016 and bonus to employees, directors and
supervisors resolved for 2014 by the shareholders' meeting in 2015 are available on the Market
Observation Post System website of the Taiwan Stock Exchange.
f. Gain or loss on foreign currency exchange
For the Three Months Ended
September 30
For the Nine Months Ended
September 30
2016 2015 2016 2015
Foreign exchange gains $ 337 $ 27,541 $ 16,417 $ 20,719
Foreign exchange losses (8,669) (3,117) (20,831) (10,177)
Net (losses) gains $ (8,332) $ 24,424 $ (4,414) $ 10,542
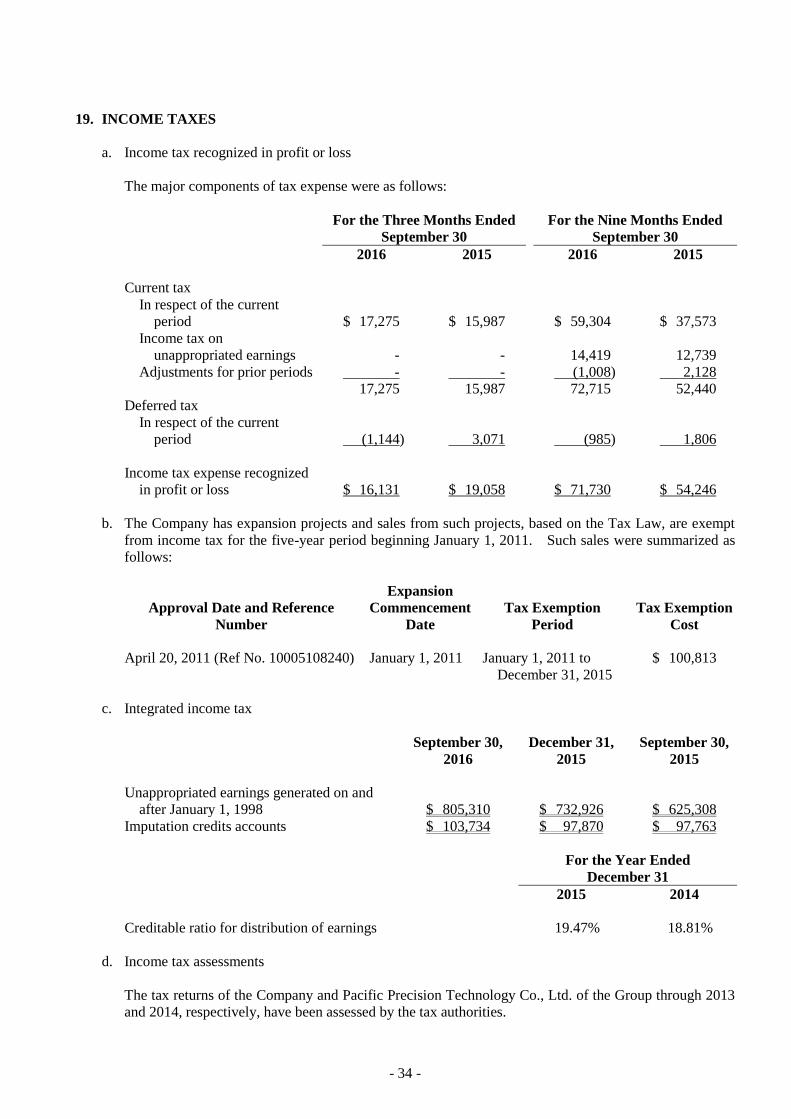
- 34 -
19. INCOME TAXES
a. Income tax recognized in profit or loss
The major components of tax expense were as follows:
For the Three Months Ended
September 30
For the Nine Months Ended
September 30
2016 2015 2016 2015
Current tax
In respect of the current
period $ 17,275 $ 15,987 $ 59,304 $ 37,573
Income tax on
unappropriated earnings - - 14,419 12,739
Adjustments for prior periods - - (1,008) 2,128
17,275 15,987 72,715 52,440
Deferred tax
In respect of the current
period (1,144) 3,071 (985) 1,806
Income tax expense recognized
in profit or loss $ 16,131 $ 19,058 $ 71,730 $ 54,246
b. The Company has expansion projects and sales from such projects, based on the Tax Law, are exempt
from income tax for the five-year period beginning January 1, 2011. Such sales were summarized as
follows:
Approval Date and Reference
Number
Expansion
Commencement
Date
Tax Exemption
Period
Tax Exemption
Cost
April 20, 2011 (Ref No. 10005108240) January 1, 2011 January 1, 2011 to
December 31, 2015
$ 100,813
c. Integrated income tax
September 30,
2016
December 31,
2015
September 30,
2015
Unappropriated earnings generated on and
after January 1, 1998 $ 805,310 $ 732,926 $ 625,308
Imputation credits accounts $ 103,734 $ 97,870 $ 97,763
For the Year Ended
December 31
2015 2014
Creditable ratio for distribution of earnings 19.47% 18.81%
d. Income tax assessments
The tax returns of the Company and Pacific Precision Technology Co., Ltd. of the Group through 2013
and 2014, respectively, have been assessed by the tax authorities.
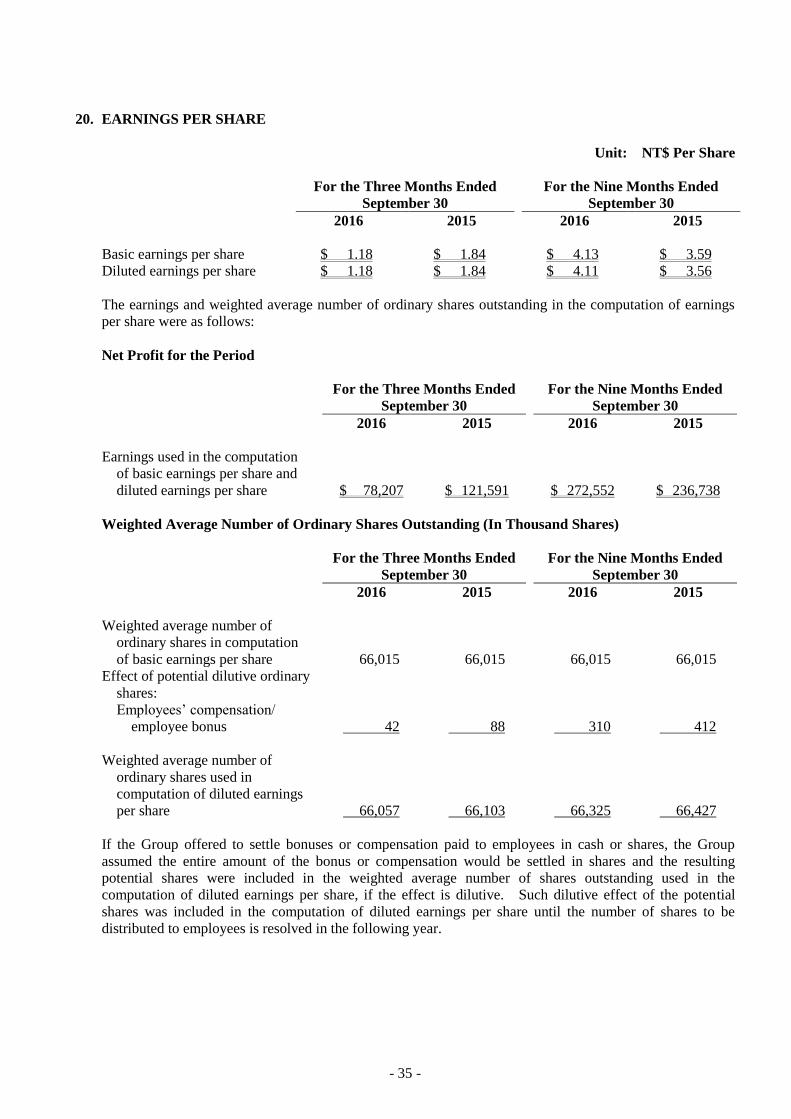
- 35 -
20. EARNINGS PER SHARE
Unit: NT$ Per Share
For the Three Months Ended
September 30
For the Nine Months Ended
September 30
2016 2015 2016 2015
Basic earnings per share $ 1.18 $ 1.84 $ 4.13 $ 3.59
Diluted earnings per share $ 1.18 $ 1.84 $ 4.11 $ 3.56
The earnings and weighted average number of ordinary shares outstanding in the computation of earnings
per share were as follows:
Net Profit for the Period
For the Three Months Ended
September 30
For the Nine Months Ended
September 30
2016 2015 2016 2015
Earnings used in the computation
of basic earnings per share and
diluted earnings per share $ 78,207 $ 121,591 $ 272,552 $ 236,738
Weighted Average Number of Ordinary Shares Outstanding (In Thousand Shares)
For the Three Months Ended
September 30
For the Nine Months Ended
September 30
2016 2015 2016 2015
Weighted average number of
ordinary shares in computation
of basic earnings per share 66,015 66,015 66,015 66,015
Effect of potential dilutive ordinary
shares:
Employees’ compensation/
employee bonus 42 88 310 412
Weighted average number of
ordinary shares used in
computation of diluted earnings
per share 66,057 66,103 66,325 66,427
If the Group offered to settle bonuses or compensation paid to employees in cash or shares, the Group
assumed the entire amount of the bonus or compensation would be settled in shares and the resulting
potential shares were included in the weighted average number of shares outstanding used in the
computation of diluted earnings per share, if the effect is dilutive. Such dilutive effect of the potential
shares was included in the computation of diluted earnings per share until the number of shares to be
distributed to employees is resolved in the following year.

- 36 -
21. NON-CASH TRANSACTIONS
During the nine months ended September 30, 2016 and 2015, the Group entered into the following
non-cash investing activities which were not reflected in the consolidated statement of cash flows:
a. The Group reclassified prepayments for equipment (included in prepayments and other current assets)
of $19,856 thousand and $17,783 thousand to property, plant and equipment during the nine months
ended September 30, 2016 and 2015, respectively.
b. The amount of cash paid for acquisition of property, plant and equipment included increase of $25,727
thousand and decrease of $4,652 thousand of payable for equipment purchased (included in other
payables) during the nine months ended September 30, 2016 and 2015, respectively.
22. OPERATING LEASE ARRANGEMENTS
a. The Group as lessee
Operating leases relate to leases of office parking lot and land with lease terms between 1 and 20 years.
The Group does not have a bargain purchase option to acquire the leased land at the expiration of the
lease periods.
The future minimum lease payments of non-cancellable operating lease commitments were as follows:
September 30,
2016
December 31,
2015
September 30,
2015
Not later than 1 year $ 10,377 $ 7,607 $ 7,636
Later than 1 year and not later than 5 years 41,408 30,429 30,153
Later than 5 years 126,813 105,471 107,355
$ 178,598 $ 143,507 $ 145,144
b. The Group as lessor
Operating leases relate to leases of investment properties with lease terms from June 1, 2015 to May 31,
2020. The lessee does not have a bargain purchase option to acquire the property at the expiry of the
lease period.
The future minimum lease payments of non-cancellable operating lease were as follows:
September 30,
2016
December 31,
2015
September 30,
2015
Not later than 1 year $ 3,319 $ 3,319 $ 3,319
Later than 1 year and not later than 5 years 8,850 11,339 12,169
$ 12,169 $ 14,658 $ 15,488

- 37 -
23. CAPITAL MANAGEMENT
The Group manages its capital to ensure that entities in the Group will be able to continue as a going
concern while maximizing the return to stockholders through the optimization of the debt and equity
balance.
The capital structure of the Group consists of net debt (borrowings offset by cash) and equity of the Group
(comprising issued capital, capital surplus, and retained earnings).
The Group is not subject to any externally imposed capital requirements.
24. FINANCIAL INSTRUMENTS
a. Fair value of financial instruments that are not measured at fair value
Management believes the carrying amounts of financial assets and financial liabilities recognized in the
consolidated financial statements approximate their fair values or cannot be reliably measured.
b. Fair value of financial instruments that are measured at fair value on a recurring basis
The Group did not have financial assets and financial liabilities that are measured at fair value as of
September 30, 2016, December 31, 2015 and September 30, 2015.
c. Categories of financial instruments
September 30,
2016
December 31,
2015
September 30,
2015
Financial assets
Loans and receivables (Note a) $ 660,462 $ 844,041 $ 804,735
Financial liabilities
Measured at amortized cost (Note b) $ 894,701 $ 539,670 $ 449,963
Note a: The balances included loans and receivables measured at amortized cost, which comprise cash,
notes and accounts receivable and other receivables.
Note b: The balances included financial liabilities measured at amortized cost, which comprise
short-term borrowings, notes and accounts payable, other payables and long-term borrowings
including current portion.
d. Financial risk management objectives and policies
The Group’s major financial instruments include accounts receivable, accounts payable and borrowings.
The Group’s Finance Department provides services to the business, coordinates access to domestic and
international financial markets, monitors and manages the financial risks relating to the operations of
the Group through internal risk reports which analyze exposures by degree and magnitude of risks.
These risks include market risk (including currency risk and interest rate risk), credit risk and liquidity
risk.

- 38 -
1) Market risk
The Group’s activities exposed it primarily to the financial risks of changes in foreign currency
exchange rates (see (a) below) and interest rates (see (b) below).
a) Foreign currency risk
Refer to Note 28 for the carrying amounts of the Group’s foreign currency denominated
monetary assets and monetary liabilities at the end of the reporting period.
Sensitivity analysis
The Group was mainly exposed to the fluctuation of U.S. dollars, Japanese yen, Euros, Chinese
yuan, Australian dollars and Swiss Franc.
The sensitivity analysis details the Group’s sensitivity to a 1% increase and decrease in New
Taiwan dollars (the functional currency) against the relevant foreign currencies. 1% is the
sensitivity rate used when reporting foreign currency risk internally to key management
personnel and represents management’s assessment of the reasonably possible change in foreign
exchange rates.
The sensitivity analysis included only outstanding foreign currency denominated monetary
items and adjusts their translation at the end of the reporting period for a 1% change in foreign
currency rates.
For 1% appreciation of New Taiwan dollars against the relevant currency, post-tax profit for the
nine months ended September 30, 2016 and 2015 would have decreased by $3,684 thousand
and $2,164 thousand, respectively. For a 1% depreciation of New Taiwan dollars against the
relevant currency, there would be an equal and opposite impact on post-tax profit.
b) Interest rate risk
The Group was exposed to interest rate risk because entities in the Group borrowed funds at
floating interest rates.
Sensitivity analysis
The sensitivity analyses were determined based on the Group’s exposure to interest rates for
both derivatives and non-derivative instruments at the end of the reporting period. For floating
rate liabilities, the analysis was prepared assuming the amount of the liability outstanding at the
end of the reporting period was outstanding for the whole year. A 10 basis point (0.1%)
increase or decrease was used when reporting interest rate risk internally to key management
personnel and represents management’s assessment of the reasonably possible change in interest
rates.
If interest rates had been 10 basis points higher/lower and all other variables were held constant,
the Group’s post-tax profit for the nine months ended September 30, 2016 and 2015 would
decrease/increase by $216 thousand and $48 thousand, respectively, which was mainly
attributable to the Group’s exposure to interest rates on its variable-rate bank borrowings.

- 39 -
2) Credit risk
Credit risk refers to the risk that a counterparty will default on its contractual obligations resulting
in financial loss to the Group. The Group adopted a policy of only dealing with creditworthy
counterparties, however, in order to minimize credit risk, management of the Group has delegated a
team responsible for determining credit limits, credit approvals and other monitoring procedures to
ensure that follow-up action is taken to recover overdue debts. In addition, the Group reviews the
recoverable amount of each individual trade debt at the end of the reporting period to ensure that
adequate allowances are made for irrecoverable amounts. In this regard, management believes the
Group’s credit risk was significantly reduced.
3) Liquidity risk
The Group manages liquidity risk by monitoring and maintaining a level of cash and cash
equivalents deemed adequate to finance the Group’s operations and mitigate the effects of
fluctuations in cash flows. In addition, management monitors the utilization of bank borrowings
and ensures compliance with loan covenants.
The Group relies on bank borrowings as a significant source of liquidity. As of September 30,
2016, December 31, 2015 and September 30, 2015, the Group had available unutilized short-term
bank loan facilities set out in (b) below.
a) Liquidity and interest rate risk tables for non-derivative financial liabilities
The following table details the Group’s remaining contractual maturity for its non-derivative
financial liabilities with agreed repayment periods, and is based on the undiscounted cash flows
of financial liabilities.
September 30, 2016
1-3 Months
3 Months to
1 Year 1-3 Years 3+ Years
Non-derivative
financial liabilities
Non-interest bearing $ 270,234 $ 82,767 $ - $ -
Variable interest rate
liabilities 55,000 144,063 125,861 216,776
$ 325,235 $ 226,830 $ 125,861 $ 216,776
December 31, 2015
1-3 Months
3 Months to
1 Year 1-3 Years 3+ Years
Non-derivative
financial liabilities
Non-interest bearing $ 303,293 $ 31,677 $ - $ -
Variable interest rate
liabilities - - 47,934 156,766
$ 303,293 $ 31,677 $ 47,934 $ 156,766
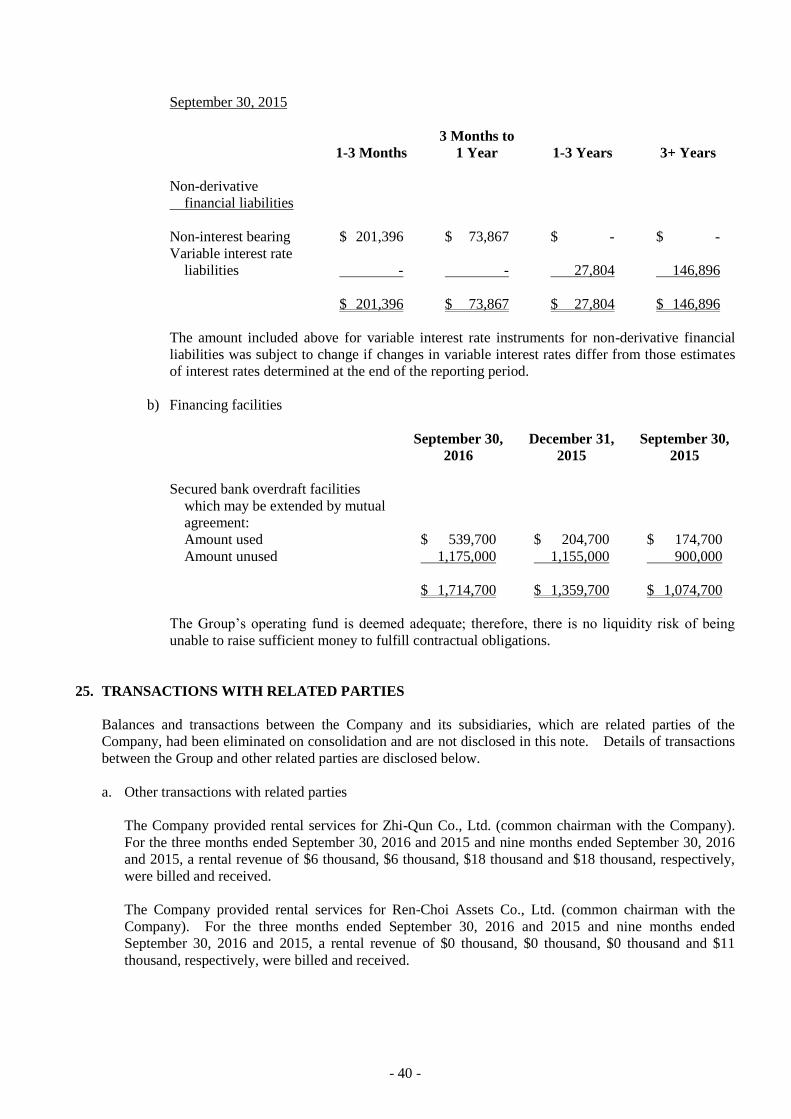
- 40 -
September 30, 2015
1-3 Months
3 Months to
1 Year 1-3 Years 3+ Years
Non-derivative
financial liabilities
Non-interest bearing $ 201,396 $ 73,867 $ - $ -
Variable interest rate
liabilities - - 27,804 146,896
$ 201,396 $ 73,867 $ 27,804 $ 146,896
The amount included above for variable interest rate instruments for non-derivative financial
liabilities was subject to change if changes in variable interest rates differ from those estimates
of interest rates determined at the end of the reporting period.
b) Financing facilities
September 30,
2016
December 31,
2015
September 30,
2015
Secured bank overdraft facilities
which may be extended by mutual
agreement:
Amount used $ 539,700 $ 204,700 $ 174,700
Amount unused 1,175,000 1,155,000 900,000
$ 1,714,700 $ 1,359,700 $ 1,074,700
The Group’s operating fund is deemed adequate; therefore, there is no liquidity risk of being
unable to raise sufficient money to fulfill contractual obligations.
25. TRANSACTIONS WITH RELATED PARTIES
Balances and transactions between the Company and its subsidiaries, which are related parties of the
Company, had been eliminated on consolidation and are not disclosed in this note. Details of transactions
between the Group and other related parties are disclosed below.
a. Other transactions with related parties
The Company provided rental services for Zhi-Qun Co., Ltd. (common chairman with the Company).
For the three months ended September 30, 2016 and 2015 and nine months ended September 30, 2016
and 2015, a rental revenue of $6 thousand, $6 thousand, $18 thousand and $18 thousand, respectively,
were billed and received.
The Company provided rental services for Ren-Choi Assets Co., Ltd. (common chairman with the
Company). For the three months ended September 30, 2016 and 2015 and nine months ended
September 30, 2016 and 2015, a rental revenue of $0 thousand, $0 thousand, $0 thousand and $11
thousand, respectively, were billed and received.

- 41 -
The Company provided rental services for Berkeway Assets Co., Ltd. (chairman of which is the
Company’s executive vice president). For the three months ended September 30, 2016 and 2015 and
nine months ended September 30, 2016 and 2015, a rental revenue of $0 thousand, $0 thousand, $0
thousand and $11 thousand, respectively, were billed and received.
Ren Chung (chairman of the Company) provided certain rental services for the Company. For the
three months ended September 30, 2016 and 2015 and nine months ended September 30, 2016 and
2015, a rental fee of $19 thousand, $19 thousand, $55 thousand and $55 thousand, respectively, were
charged and paid.
b. Compensation of key management personnel
For the Three Months Ended
September 30
For the Nine Months Ended
September 30
2016 2015 2016 2015
Short-term employee benefits $ 9,775 $ 9,775 $ 25,081 $ 25,086
The remuneration of directors and key executives is determined by the remuneration committee having
regard to the performance of individuals and market trends.
26. ASSETS PLEDGED AS COLLATERAL OR FOR SECURITY
The following assets have been provided as collaterals for short-term and long-term bank loan facilities.
September 30,
2016
December 31,
2015
September 30,
2015
Land and building, net $ 614,919 $ 625,597 $ 510,548
Investment properties 93,492 93,723 93,800
$ 708,411 $ 719,320 $ 604,348
27. SIGNIFICANT CONTINGENT LIABILITIES AND UNRECOGNIZED COMMITMENTS
In addition to those disclosed in other notes, significant commitments and contingencies of the Group as of
September 30, 2016, December 31, 2015 and September 30, 2015 were as follows:
Significant Commitments
Unrecognized commitments are as follows:
September 30,
2016
December 31,
2015
September 30,
2015
Acquisition of property, plant and equipment $ 478,260 $ 977,289 $ 991,556
As of September 30, 2016, the Company has signed construction contracts with contractors on new factory,
electrical engineering, air conditioning and warehousing, etc. in Tongluo Science Park for a total amount of
$1,341,314 thousand (tax excluded). As of September 30, 2016, the Company has paid $794,507
thousand (included in property under construction), and the construction is expected to be completed by the
end of December 2016.
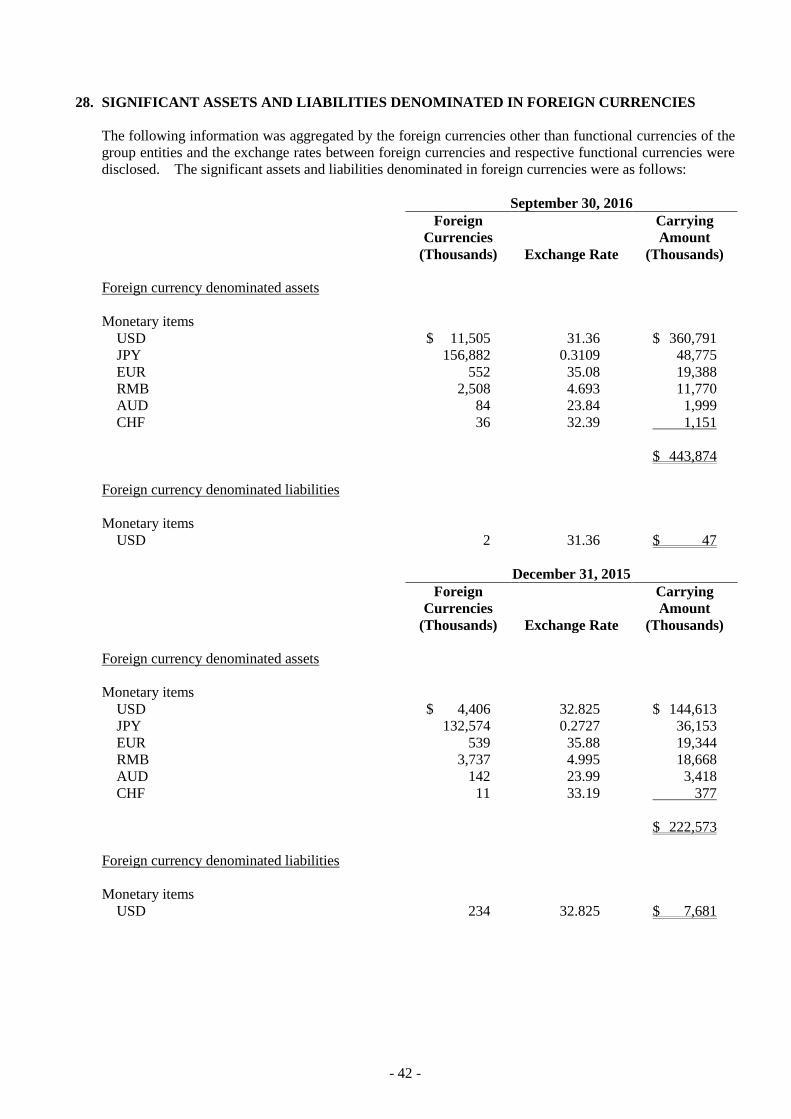
- 42 -
28. SIGNIFICANT ASSETS AND LIABILITIES DENOMINATED IN FOREIGN CURRENCIES
The following information was aggregated by the foreign currencies other than functional currencies of the
group entities and the exchange rates between foreign currencies and respective functional currencies were
disclosed. The significant assets and liabilities denominated in foreign currencies were as follows:
September 30, 2016
Foreign
Currencies
(Thousands) Exchange Rate
Carrying
Amount
(Thousands)
Foreign currency denominated assets
Monetary items
USD $ 11,505 31.36 $ 360,791
JPY 156,882 0.3109 48,775
EUR 552 35.08 19,388
RMB 2,508 4.693 11,770
AUD 84 23.84 1,999
CHF 36 32.39 1,151
$ 443,874
Foreign currency denominated liabilities
Monetary items
USD 2 31.36 $ 47
December 31, 2015
Foreign
Currencies
(Thousands) Exchange Rate
Carrying
Amount
(Thousands)
Foreign currency denominated assets
Monetary items
USD $ 4,406 32.825 $ 144,613
JPY 132,574 0.2727 36,153
EUR 539 35.88 19,344
RMB 3,737 4.995 18,668
AUD 142 23.99 3,418
CHF 11 33.19 377
$ 222,573
Foreign currency denominated liabilities
Monetary items
USD 234 32.825 $ 7,681

- 43 -
September 30, 2015
Foreign
Currencies
(Thousands) Exchange Rate
Carrying
Amount
(Thousands)
Foreign currency denominated assets
Monetary items
USD $ 6,390 32.87 $ 210,040
JPY 79,818 0.2739 21,862
EUR 511 36.92 18,869
RMB 2,007 5.176 10,386
AUD 81 23.03 1,867
CHF 11 33.71 383
$ 263,407
Foreign currency denominated liabilities
Monetary items
USD 81 32.87 $ 2,674
For the three months ended September 30, 2016 and 2015 and nine months ended September 30, 2016 and
2015, realized net foreign exchange gains (losses) were $(1,266) thousand, $6,736 thousand, $1,465
thousand and $4,624 thousand, respectively, and unrealized net foreign exchange gains (losses) were
$(7,066) thousand, $17,688 thousand, $(5,879) thousand and $5,918 thousand, respectively. It is
impractical to disclose net foreign exchange gains (losses) by each significant foreign currency due to the
variety of the foreign currency transactions of the group entities.
29. SEPARATELY DISCLOSED ITEMS
Information on significant transactions and investees:
a. Financing provided to others: None.
b. Endorsements or guarantees provided for others: None.
c. Marketable securities held at the end of the period (excluding investments in subsidiaries): None.
d. Acquisition or disposal of the same marketable securities amounting to at least NT$300 million or 20%
of paid-in capital: None.
e. Acquisition of individual real estate at cost of at least NT$300 million or 20% of paid-in capital:
Table 1.
f. Disposal of individual real estate at prices of at least NT$300 million or 20% of paid-in capital: None.
g. Total purchases from or sales to related parties amounting to at least NT$100 million or 20% of paid-in
capital: None.
h. Receivables from related parties amounting to at least NT$100 million or 20% of paid-in capital:
None.
i. Transactions of derivative instruments: None.

- 44 -
j. Others: Intercompany relationships and significant intercompany transactions: Table 2.
k. Information for investees: Table 3.
Information on investments in mainland China: None.
30. SEGMENT INFORMATION
Information reported to the chief operating decision maker for the purposes of resource allocation and
assessment of segment performance focuses on the types of goods or services delivered or provided.
In accordance with the provisions under IFRS 8, “Operating Segments,” the Group’s operating decision
was mainly based on the Group’s overall operating performance and economic resource; therefore, it was
determined that the Group had only one reportable segment.

- 45 -
TABLE 1
PACIFIC HOSPITAL SUPPLY CO., LTD. AND SUBSIDIARIES
ACQUISITION OF INDIVIDUAL REAL ESTATE AT COSTS OF AT LEAST $300 MILLION OR 20% OF PAID-IN CAPITAL
FOR THE NINE MONTHS ENDED SEPTEMBER 30, 2016
(In Thousands of New Taiwan Dollars, Unless Stated Otherwise)
Buyer Property
Transaction
Date or
Event Date
Transaction
Amount
(Tax
Excluded)
Payment
Status
(Note)
Counterparty Relationship
Information on Previous Title Transfer If Counterparty Is a
Related Party Pricing
Reference
Purpose of
Acquisition
Other
Terms Property
Owner Relationship
Transaction
Date Amount
Pacific Hospital
Supply Co., Ltd.
Building and ancillary
equipments
2015.1.7-
2016.8.1
$ 182,200 $ 95,430 GNPACK Corp. Ltd. None - - - $ - Price inquiry,
comparison,
and negotiation
Manufacture (in
progress)
None
Building and ancillary
equipments
2015.2.11-
2016.9.12
751,049 492,751 Reiju Construction
Co., Ltd.
None - - - - Price inquiry,
comparison,
and negotiation
Manufacture and
employee dorm
(in progress)
None
Building and ancillary
equipments
2015.2.21-
2016.8.10
240,156 100,729 Ingenious Engineering
Corp.
None - - - - Price inquiry,
comparison,
and negotiation
Manufacture and
employee dorm
(in progress)
None
Building and ancillary
equipments
2015.3.24-
2016.9.22
120,339 77,485 Chu Yang Technology
Engineering Co.,
Ltd.
None - - - - Price inquiry,
comparison,
and negotiation
Manufacture and
employee dorm
(in progress)
None
Building and ancillary
equipments
2015.9.25-
2016.9.29
28,900 11,188 MOMA Interior
Design Co., Ltd.
None - - - - Price inquiry,
comparison,
and negotiation
Manufacture and
employee dorm
(in progress)
None
Note: Included in property, plant and equipment-property under construction.

- 46 -
TABLE 2
PACIFIC HOSPITAL SUPPLY CO., LTD. AND SUBSIDIARIES
INTERCOMPANY RELATIONSHIPS AND SIGNIFICANT TRANSACTIONS
FOR THE NINE MONTHS ENDED SEPTEMBER 30, 2016
(In Thousands of New Taiwan Dollars, Unless Stated Otherwise)
No.
(Note 1) Company Name Counterparty
Relationship
(Note 2)
Transaction Details
Financial Statement Account Amount Payment Terms
% to Total
Sales or Assets
(Note 3)
0 Pacific Hospital Supply Co., Ltd. Pacific Precision Technology Co., Ltd. a Purchase $ 31,316 Transaction terms are same as third parties 2.36
Pacific Precision Technology Co., Ltd. a Miscellaneous equipment 5,319 Transaction terms are same as third parties 0.17
Pacific Precision Technology Co., Ltd. a Rental income 949 Transaction terms are same as third parties 0.07
Pacific Precision Technology Co., Ltd. a Accounts payable 7,690 Transaction terms are same as third parties 0.25
Pacific Precision Technology Co., Ltd. a Prepayments for equipment 4,953 Transaction terms are same as third parties 0.16
Note 1: Significant transactions between the parent company and its subsidiaries or among subsidiaries are numbered as follows:
a. “0” for the parent company.
b. Subsidiaries are numbered from “1”.
Note 2: Related party transactions are divided into two categories as follows:
a. The parent company to subsidiaries.
b. Subsidiaries to the parent company.
Note 3: Balance sheet items are shown as a percentage to consolidated total assets as of September 30, 2016, while income statement items are shown as a percentage to consolidated total operating revenue for the nine months ended September
30, 2016.
Note 4: The above transaction amounts were eliminated upon consolidation.

- 47 -
TABLE 3
PACIFIC HOSPITAL SUPPLY CO., LTD. AND SUBSIDIARIES
INFORMATION ON INVESTEES
FOR THE NINE MONTHS ENDED SEPTEMBER 30, 2016
(In Thousands of New Taiwan Dollars, Unless Stated Otherwise)
Investor Company Investee Company Location Main Businesses and
Products
Original Investment Amount As of September 30, 2016 Net Income
(Loss) of the
Investee
Share of
Profits (Loss) Note September 30,
2016
December 31,
2015 Shares %
Carrying
Amount
Pacific Hospital Supply Co., Ltd. Pacific Precision Technology Co., Ltd. Taiwan Manufacturing rubbers $ 100,000 $ 100,000 10,000,000 100 $ 96,474 $ (1,394) $ 1,076 Notes 1 and 2
Note 1: Investment income (loss) was recognized based on the investee’s financial statements for the same period, which were reviewed by auditors.
Note 2: The difference between investee company’s net profit (loss) and recognized loss was due to deferral of unrealized gains/losses from upstream transaction.
Note 3: In preparing the consolidated financial statements, gains and losses between the investor and investee, investor’s long-term equity investment account, and investee’s equity were eliminated in full.