Embed Size (px)
Citation preview
Pacific Gas & Electric Company
2007 Auto-DR Program
Task 13 Deliverable
Auto-DR Assessment Study
Issued: December 19, 2007 (REVISED February 11, 2008)
Project Manager: Albert Chiu
Pacific Gas and Electric Company
Prepared By: Greg Wikler Ingrid Bran Joe Prijyanonda Sharon Yoshida Kelly Smith Global Energy Partners, LLC Lafayette, California
Mary Ann Piette
Sila Kiliccote Girish Ghatikar Lawrence Berkeley National Laboratory Berkeley, California
Dan Hennage
Akuacom, Inc. San Rafael, California
Chuck Thomas
Electric Power Research Institute Knoxville, Tennessee (Subcontractor)

Global Energy Partners, LLC iii
EXECUTIVE SUMMARY
Auto-DR is an automation-based communications infrastructure that provides demand response (DR) program participants electronic, internet-based price and reliability signals that are linked to the facility energy management control systems (EMCS) or related building and automated process control systems. Auto-DR price and reliability signals trigger pre-programmed energy management and curtailment strategies developed by the customers in an automated manner. The Auto-DR price and reliability signals can be used to automate the response to dynamic pricing as well as conventional interruptible and demand bid options.
Auto-DR was developed by the Lawrence Berkeley National Laboratory (LBNL) through their Demand Response Research Center, funded by the California Energy Commission’s Public Interest Energy Research (PIER) program. LBNL has been operating Auto-DR pilot research programs since 2003 in a number of facilities throughout California. Results from the pilot efforts demonstrate that Auto-DR can deliver low-cost, reliable, consistently repeatable electric demand response in different types of facilities (mainly commercial buildings).
Drawing from the successful results of LBNL’s pilot efforts, the California Public Utilities Commission (CPUC) required all California IOUs to deploy larger-scale Auto-DR efforts in their service territories as a way to enhance their overall demand response program portfolios and be better prepared to respond to severe heat storms that typically hit the state during the summer months.
Overview
The PG&E Auto-DR goal for 2007 was to achieve 15 MW peak load reduction. The DR events were to be initiated through PG&E’s existing price-based demand response programs including Critical Peak Pricing (CPP) and Demand Bid Program (DBP). Global Energy Partners (GEP) was retained by PG&E to work with LBNL to commercialize the Auto-DR pilot efforts from previous years into 2007 and beyond. Working with LBNL, GEP established a team of industry experts to perform the tasks necessary to successfully implement the project. GEP retained a variety of subcontractors who played key roles in the project, including the Electric Power Research Institute (EPRI), and C&C Building Automation, Inc. PG&E directly retained Akuacom, Inc. to further expand the Demand Response Automation Server (DRAS) for the DBP program.
Auto-DR was implemented in a structured manner by the project team. Below is a summary of the tasks that were directed by PG&E to GEP, LBNL and Akuacom:
• Develop Auto-DR marketing collateral • Expand the DRAS capability for DBP • Qualify and train Auto-DR technical service providers • Screen and recruit customers for Auto-DR • Conduct Auto-DR technical assessments and formalize customer participation • Install Auto-DR systems, coordinate installations and process customer incentives • Validate and test Auto-DR system installations • Operate the Auto-DR during DR events • Assess the results and make recommendations for future improvements
Auto-DR technical capabilities were delivered to customers using a variety of delivery strategies. First, a website was established (www.auto-dr.com) to serve as a repository of information and resources that could be accessed by customer and technical providers. Second, a testimonial video was developed by Tech Closeup TV to highlight the Auto-DR technology and its effects on the building operations. Third, GEP

Executive Summary
iv www.gepllc.com
worked extensively with PG&E’s sales representatives to identify and meet with prospective customers about Auto-DR.
Incentives were provided to customers using the PG&E Technical Assistance/Technology Incentives (TA/TI) program. Specifically, the TI program element provides for a total incentive of $300/kW for Auto-DR customers. The TI incentive was designed into the following categories:
• Recruitment: Outside vendors were paid up to $40/kW to recruit viable Auto-DR customers. Customers were typically existing clients of the recruitment vendors.
• Technical Coordinators (TC): Trained energy management control system vendors were paid up to $70/kW for their services in conjunction with: (a) assisting the customer in understanding the selected Auto-DR control strategies for their facilities; (b) assisting the customer in selecting the equipment vendors; (c) participating in the verification of the installed Auto-DR equipment; and (d) maintaining contact with the customer during the DR season to ensure that the Auto-DR equipment is properly operating and that estimated load reductions are being realized.
• Equipment: Customers were reimbursed up to $140/kW for the costs associated with the design, procurement, and installation of the Auto-DR supportive technologies and measures. In nearly all cases, this incentive covered 100% of the customer’s Auto-DR project costs.
• Participation and Performance: Customers were qualified for a participation incentive of up to $50/kW for their participation and validated performance during the DR-event period (May 1, 2007 through October 31, 2007).
Program Participant Makeup
Over the course of the 2007 Auto-DR implementation, the GEP team recruited a total of 20 commercial, industrial and government customers. Participants included legacy customers (i.e., those who had continued their participation from the 2006 pilot program efforts) and new customers. The following companies and organizations participated in the 2007 Auto-DR program:
• Alameda County Water District • Bank of America, Concord Technology Center • Bank of America, San Francisco Data Center • Chabot Space and Science Center, Oakland • Contra Costa County • Flextronics • Fremont Unified School District • Gilead Sciences, Foster City • Ikea Corporation • Kaiser Permanente • Kohl's Department Stores • Network Appliance • Oracle • Praxair • Svenhard's Swedish Bakery, Oakland • Sybase, Dublin • Target Corporation • Wal-Mart Corporation • Anonymous Industrial Customer • State of California, Department of General Services, Site 1 • State of California, Department of General Services, Site 2
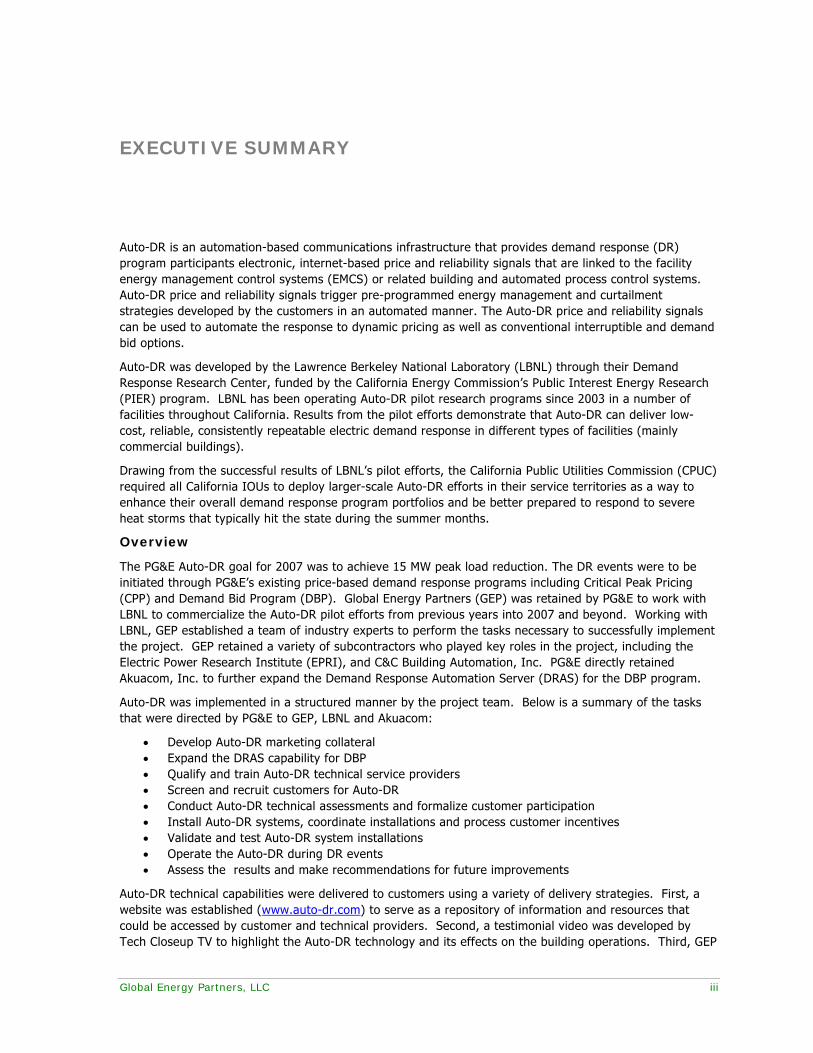
Customers who requested anonymity are not identified by name neither in this list nor anywhere else in this report. A total of 82 PG&E service accounts were represented by these 20 customers. Figure ES-1 identifies the makeup of the 82 participating accounts by facility type. As can be seen from the chart, the largest share of participants was from retail stores. Retail chain stores typically already have advanced
Executive Summary
Global Energy Partners, LLC v
automation systems in place thus enhancing and simplifying their ability to participate in Auto-DR efforts. High tech facilities in the Silicon Valley were also ideal candidates for Auto-DR given their natural inclination toward adopting advanced and cutting-edge automation systems for their building operations. A large number of state and local government facilities also participated in the program.
3.7%
24.4%
4.9%
19.5%1.2%
2.4%2.4%
39.0%
2.4%
Biotechnology
Data Center
Healthcare
High Tech
Industrial Process
Government (state, local)
Museum
Retail
School District
Figure ES-1 PG&E Auto-DR Participant by Industry Type
Nearly two-thirds of the 82 participants signed up for the Demand Bid Program (DBP) option. PG&E’s Critical Peak Pricing (CPP) tariff design,1 which includes a potential of six hour critical peak period, tended to attract customers with the flexibility in their operations to sustain DR control strategies for the full six hour timeframe. Other customers were more inclined to sign up for the DBP option since event participation is voluntary and customers can bid in as few as two consecutive hours for any DR event. The Auto-DR element to DBP was that much more attractive for customers since they only had to define their default kW reduction and the hours that they would enable those reductions at the outset of their enablement process. After that point, their participation in DBP events was automatic. All of the CPP and DBP customers had the ability to opt out of DR events if their situations were not conducive to shedding loads on any particular event day.
Technology Architecture
The Auto-DR technology architecture for the PG&E effort is illustrated in Figure ES-2. The architecture consists of two major elements built on an open-interface standards model. First, the DRAS provides signals that notify participating customers of DR events. Second, a DRAS client for each customer’s site listens to automation signals and is linked to existing pre-programmed DR strategies independent of control network protocols such as BACnet, Modbus, etc. There are two types of DRAS clients:
• Client and Logic with Integrated Relay (CLIR) for legacy control systems that need hardware and software for their internet connectivity.
• Web Services (WS) software for control systems that are already linked to the Internet and has the capability to react on the signals sent by DRAS.
As shown in Figure ES-2, the steps involved in the Auto-DR process during a DR event include:
1 The PG&E CPP tariff includes a six hour event period from Noon to 6PM, where in the first three hours the price is elevated to three-times the peak price and in the second three hours the price jumps to five-times the peak price.

Executive Summary
vi www.gepllc.com
• PG&E’s DR event notification system calls for a DR event (typically triggered based on forecasted high temperatures or ISO grid reliability constraints)
• PG&E’s InterAct Curtailment system sends these signals to the DRAS.
• DR event and price information are published on the DRAS.
• DRAS clients (CLIR or WS) request real-time event data from the DRAS every minute.
• Customized pre-programmed DR strategies determine load shed actions in customer’s facility based on event price/mode.
• Facility Energy Management Control Systems (EMCS) or related controls carry out load reductions based on DR event signals and strategies.
Figure ES-2 PG&E Auto-DR Technology Architecture
Auto-DR systems are built using XML and SOAP based secure Web Service Oriented Architecture (SOA) for platform-independent, interoperable systems and use low-bandwidth TCP/IP connections. Auto-DR has been used for PG&E CPP participants during the past three years. The PG&E’s DBP program element was added to the DRAS in 2007. The DBP component of DRAS automates the bid and acceptance elements that are typical in demand bidding programs.
Representative Control Strategies
The DR control strategies adopted by the majority of participants primarily affected HVAC and lighting loads. Industrial customers adjusted their process loads to accommodate the DR events. The types of control strategies that were adopted included the following:

Executive Summary
Global Energy Partners, LLC vii
• Global temperature adjustment: Existing energy management control systems (EMCS) were adjusted to receive the DR event signal from the DRAS. Once that signal was received, the EMCS would raise the setpoint temperature established by a customer (usually in the range of 2 to 8 degrees) for a period of time.
• HVAC equipment cycling: For buildings that had multiple packaged HVAC systems, select units were configured to receive the DR event signal from the DRAS. Once that signal was received, compressor units were shut off for a subset of the building’s systems during an acceptable period of time. Additional signals were then sent to restart those units and shut off other units.
• Other HVAC adjustments: Other shed strategies that were employed included decrease in duct pressures, auxiliary fan shutoff, pre-cooling, valve limits and boiler lockouts.
• Light shutoff: Various lighting circuits were wired to receive the DR event signal from the DRAS. When signaled, these loads would be tripped for the entire duration of the DR event. Typically these were for lighting applications in common areas with sufficient natural light or for task applications that could accommodate full shutoff given the proximity of other lighting in the area.
• Other lighting and miscellaneous adjustments: Other shed strategies that were employed included bi-level lighting switches and motor/pump shutoff.
• Process adjustments: Given the varying nature of industrial processes, the strategy for each customer was tailored to their particular process. The most common Auto-DR strategy employed was modifying ancillary processes where there is sufficient storage capability such that the customer can accommodate complete equipment shutdowns during DR events and catch up production later in the day or the following day.
While a few data centers participated in the program, cooling loads associated with the data center function were not addressed in the 2007 program.
Estimated Load Reductions
PG&E’s Auto-DR implementation was successful in recruiting more customers than necessary to meet its 15 MW load reduction goal for 2007. Table ES-2 summarizes the estimated load reductions by facility type. The 82 service accounts that were recruited and enabled for Auto-DR represented a total load reduction potential of 22.8 megawatts, or almost 52% more than PG&E intended to achieve. About two-thirds of the load reductions are attributable to four industrial process facilities.
Table ES-2 Estimated Load Reduction by Type of Facility
Facility Type
Number of Service
Accounts
Estimated Load Reduction
(kW) kW Percent
of Total Biotechnology 3 172 0.8% Commercial Office 2 842 3.7% Healthcare 2 276 1.2% High Tech 20 1,670 7.3% Industrial Process 4 15,275 66.9% Government Office 16 934 4.1% Museum 1 24 0.1% Retail 32 3,608 15.8% School District 2 34 0.1% Total 82 22,835
Table ES-3 shows the breakout of the estimated loads for the PG&E Auto-DR implementation. Over two-thirds of the service accounts and nearly 90% of the estimated load reduction is attributable to the DBP

Executive Summary
viii www.gepllc.com
program. Table ES-4 shows the breakout of the estimated loads according to DR control strategy. Aside from the process system adjustments, the strategy that yields the next largest load reduction comes from the combined effects of HVAC adjustments and lighting reductions.
Table ES-3 Estimated Load Reduction by DR Option
DR OptionNumber of
Service Accounts
Estimated Load Reduction
(kW)
kW Percent of Total
Critical Peak Pricing (CPP) 21 2,559 11.2%Demand Bidding (DBP) 60 20,164 88.3%CPP/DBP Combined 1 112 0.5%Total 82 22,835
Table ES-4 Estimated Load Reduction by DR Control Strategy
DR Shed StrategyNumber of
Service Accounts
Estimated Load Reduction
(kW)
kW Percent of Total
HVAC Adustments 40 3,365 14.7%HVAC Adjustments and Lighting Reductions 38 4,195 18.4%
Process System Adjustments 4 15,275 66.9%
Total 82 22,835
Participant Enablement Process and Cost
An important objective of the 2007 PG&E Auto-DR effort was to expand the role of technical providers who could cost-effectively deliver Auto-DR to customers. GEP held a number of TC training sessions during the early stages of the 2007 implementation, and ultimately brought under contract a total of eight companies to support the program as TCs.
The participants’ load reducing capabilities were enabled through a variety of equipment and technology solutions that primarily adapted existing automation systems through programming code changes to accommodate the receipt of signals from the DRAS. As of February 2008, 100% of the estimated load reduction capability (22.8 MW) has been enabled for Auto-DR. Enablement requires that the equipment was installed, verification procedures implemented, load reducing capabilities tested under DR program conditions, and site certified for participation in the CPP and/or DBP programs. Participants were oftentimes enabled for Auto-DR through the use of their own control system providers and vendors.
The cost of the Auto-DR equipment enablement for the 82 service accounts is estimated to be $1.8 million. This yielded an enablement cost of nearly $80/kW, and was fully covered through the TI incentive offered by PG&E. The full TI cost for the 2007 Auto-DR efforts, when including the costs associated with the recruitment, technical coordination, equipment and participation was $3.5 million or $153/kW.
DR Events and Shed Results
PG&E called the maximum 12 CPP events during the period from June 13th to August 31st. One DBP test event was called on August 30th. The unusually small number of called DBP events had much to do with the fact that 2007 was a cooler than normal summer in Northern California and wholesale prices remained significantly below the DBP incentive level of $0.50/kWh.
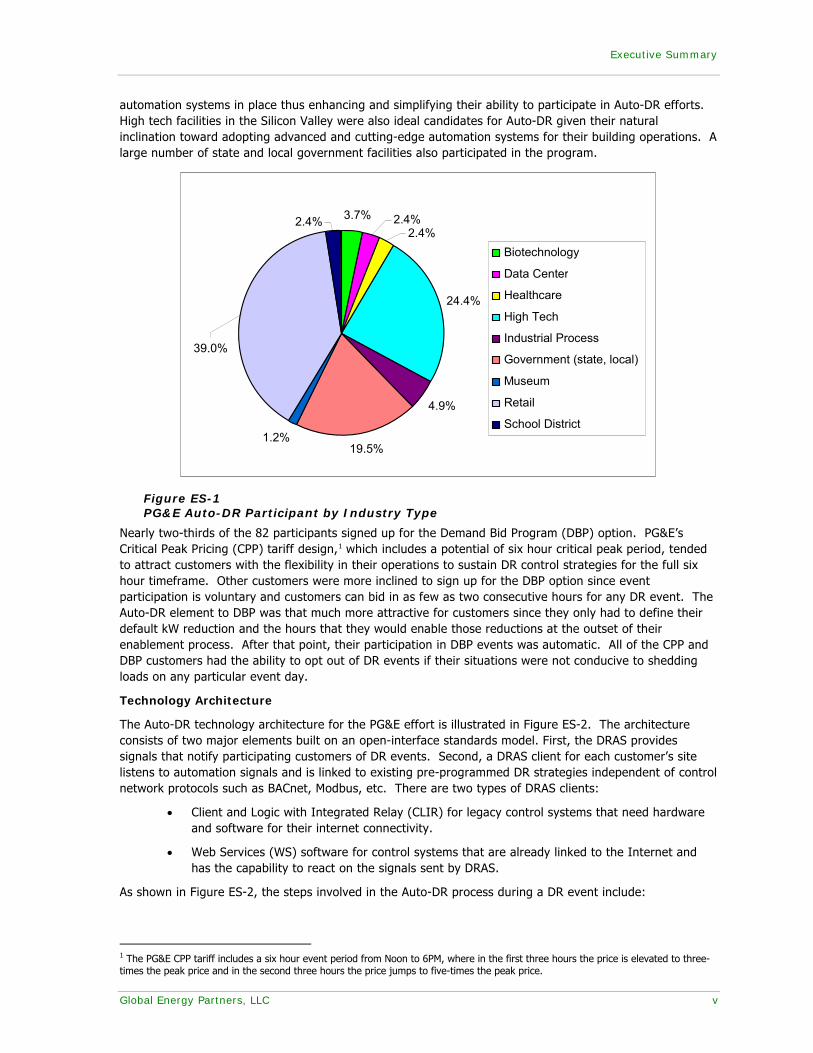
CPP Results. The results of the 12 CPP events are summarized in Table ES-5. A total of 17 enabled sites were able to participate in all 12 events over the course of the summer. During the 3-6PM timeframe on
Executive Summary
Global Energy Partners, LLC ix
the 12 days, when the CPP price level jumped to five-times the peak price, all participating customers were able to drop 67% of their estimated loads. Note that on some days (7/9 and 8/1 in particular), the customers were able to meet or exceed their estimates. Figure 4 provides the 24-hour load shape aggregated for all 17 customers during the first CPP event day (June 13th). The load drop during the DR event is illustrated by the clear area between the top colored line and the three lines above.
Table ES-5 Auto-DR CPP Performance Summary
12pm-3pm 3pm-6pm 12pm-6pm CPP Baseline
6/13/07 17 1,568 -361.08 154.08 -103.50 10%7/3/07 17 1,568 1,232.92 1,413.12 1,323.02 90%7/5/07 17 1,568 545.00 680.66 612.83 43%7/6/07 17 1,568 1,150.81 1,552.00 1,351.40 99%7/9/07 17 1,568 1,770.77 1,879.22 1,825.00 120%8/1/07 17 1,568 1,849.30 2,117.08 1,983.19 135%8/21/07 17 1,568 485.99 881.49 683.74 56%8/22/07 17 1,568 361.84 755.94 558.89 48%8/28/07 17 1,568 844.72 1,157.01 1,000.87 74%8/29/07 17 1,568 189.39 497.18 343.29 32%8/30/07 17 1,568 137.21 564.35 350.78 36%8/31/07 17 1,568 471.90 1,017.88 744.89 65%
Average 17 1,568 723.23 1,055.83 889.53 67%
Date of CPP EventEstimated Load Shed
(kW)
Number of Participating Sites
Actual as Percent of
Actual Load Shed (kW)CPP Baseline
Note: Lower shed value for 6/13/07 likely due to the lower temperatures of the days prior to the event.
6/13/2007
0
2000
4000
6000
8000
10000
12000
14000
12:0
0 AM
1:00
AM
2:00
AM
3:00
AM
4:00
AM
5:00
AM
6:00
AM
7:00
AM
8:00
AM
9:00
AM
10:0
0 AM
11:0
0 AM
12:0
0 PM
1:00
PM
2:00
PM
3:00
PM
4:00
PM
5:00
PM
6:00
PM
7:00
PM
8:00
PM
9:00
PM
10:0
0 PM
11:0
0 PM
Who
le B
uild
ing
Pow
er (k
W)
OAT BaselineCPP MA BaselineCPP Baseline
Figure ES-3 Auto-DR CPP Event June 13, 2007

Executive Summary
x www.gepllc.com
Each of the top three lines in the figure represents the various baselines from which load reductions are measured. The figure illustrates that the amount of load shed will vary depending on the baseline methodology used. The CPP baseline (using the highest three in the past ten days methodology) clearly yielded lower load drops than the other two baseline methods (morning adjustment [MA] and outside air temperature [OAT]) indicated for this particular day.
DBP Results. The results of the one DBP test event on August 30th are summarized in Table ES-6. A total of 11 enabled sites were able to participate during this event. During the 2-6PM timeframe on the 8/30 test day, all participating customers were able to drop 98% of their DBP baseline. Figure ES-4 provides the 24-hour load shape aggregated for all 11 customers during the first CPP event day (June 13th). The load drop during the DR event is illustrated by the clear area between the top colored line and the three lines above. The large industrial load was not restored until the morning following the DR event.
Table ES-6 Auto-DR DBP Performance Summary
Max 2 Hour2pm-6pm
Avg8/30/2007 11 10,850 10,674.57 10,416.02 98%
Average 11 10,850 10,674.57 10,416.02 98%
Actual as Percent of
DBP Baseline
Date of DBP Event
Actual Load Shed (kW)DBP Baseline
Number of Participating
Sites
Estimated Load Shed
(kW)
8/30/2007
0
5000
10000
15000
20000
25000
30000
35000
12:0
0 AM
1:00
AM
2:00
AM
3:00
AM
4:00
AM
5:00
AM
6:00
AM
7:00
AM
8:00
AM
9:00
AM
10:0
0 AM
11:0
0 AM
12:0
0 PM
1:00
PM
2:00
PM
3:00
PM
4:00
PM
5:00
PM
6:00
PM
7:00
PM
8:00
PM
9:00
PM
10:0
0 PM
11:0
0 PM
Who
le B
uild
ing
Pow
er (k
W)
DBP MA Baseline
DBP BaselineOAT Baseline
Figure ES-4 Auto-DR DBP Event August 30, 2007
Effectiveness of Automation

Executive Summary
Global Energy Partners, LLC xi
While PG&E’s 2007 Auto-DR effort was very successful, one outstanding question is how well the Auto-DR sites performed during event days relative to non-automated sites. To address this question, the project team reviewed the results of the load sheds for a sample of non-automated CPP customers. The results are graphically conveyed in Figure ES-5.
-20%
-10%
0%
10%
20%
30%
40%
Retail-I
nland
Retail-V
alley
Retail-C
oast
Office-I
nland
Biotec
h-Coas
t
Public-I
nland
Indus
-Inlan
d
School-
Inlan
d
Ave
rage
She
d
Auto CPP Non-Auto CPP
Figure ES-5 Scatter Plot of Automated and Non-Automated CPP Participants
Figure ES-5 is a scatter plot of the average percent load shed for 75 participants in the PG&E CPP rate option during 2007. Of that total, 16 participants were enabled through Auto-DR and 59 were not equipped with any automation equipment. The plot shows that for nearly all building types and climate regions sites that are enabled with Auto-DR equipment tended to yield a higher average load reduction compared to those sites that did not have any automation equipment. The average shed for automated customers was 8.1% while the average shed for non-automated customers was -0.93%. This analysis provides strong evidence to support the theory that automation improves the performance of demand response program participants. It is believed similar patterns will emerge for DBP sites when the data become available once events are called next summer.
Major Observations and Recommendations
The 2007 Auto-DR Program has met and exceeded its goals, providing many lessons about the implementation process. The Project Team has developed several observations and recommendations for future implementations.
The observations and recommendations are arranged in four groups as listed below. Specific key observations and recommendations are highlighted in the tables that follow.
a. Recruitment (Table ES-7)
b. Assessment Process (Table ES-8)
c. Equipment Enablement (Table ES-9)
d. Program Operations (Table ES-10)
Executive Summary
xii www.gepllc.com
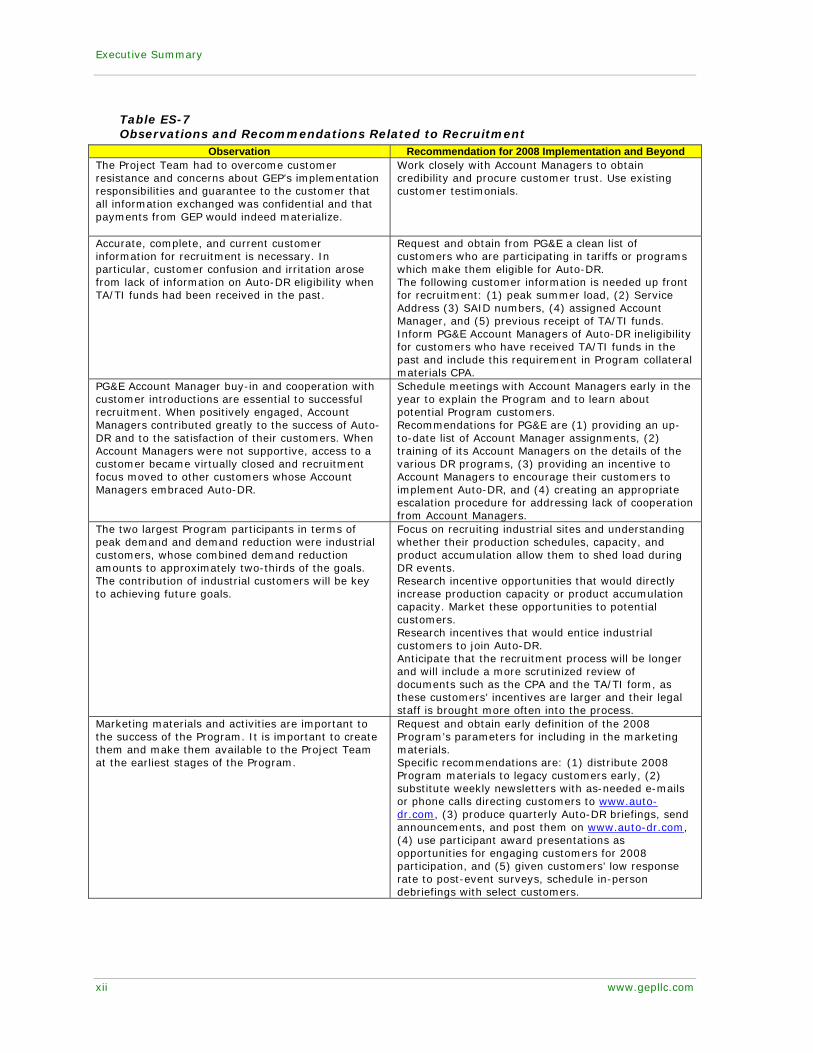
Table ES-7 Observations and Recommendations Related to Recruitment
Observation Recommendation for 2008 Implementation and Beyond The Project Team had to overcome customer resistance and concerns about GEP’s implementation responsibilities and guarantee to the customer that all information exchanged was confidential and that payments from GEP would indeed materialize.
Work closely with Account Managers to obtain credibility and procure customer trust. Use existing customer testimonials.
Accurate, complete, and current customer information for recruitment is necessary. In particular, customer confusion and irritation arose from lack of information on Auto-DR eligibility when TA/TI funds had been received in the past.
Request and obtain from PG&E a clean list of customers who are participating in tariffs or programs which make them eligible for Auto-DR. The following customer information is needed up front for recruitment: (1) peak summer load, (2) Service Address (3) SAID numbers, (4) assigned Account Manager, and (5) previous receipt of TA/TI funds. Inform PG&E Account Managers of Auto-DR ineligibility for customers who have received TA/TI funds in the past and include this requirement in Program collateral materials CPA.
PG&E Account Manager buy-in and cooperation with customer introductions are essential to successful recruitment. When positively engaged, Account Managers contributed greatly to the success of Auto-DR and to the satisfaction of their customers. When Account Managers were not supportive, access to a customer became virtually closed and recruitment focus moved to other customers whose Account Managers embraced Auto-DR.
Schedule meetings with Account Managers early in the year to explain the Program and to learn about potential Program customers. Recommendations for PG&E are (1) providing an up-to-date list of Account Manager assignments, (2) training of its Account Managers on the details of the various DR programs, (3) providing an incentive to Account Managers to encourage their customers to implement Auto-DR, and (4) creating an appropriate escalation procedure for addressing lack of cooperation from Account Managers.
The two largest Program participants in terms of peak demand and demand reduction were industrial customers, whose combined demand reduction amounts to approximately two-thirds of the goals. The contribution of industrial customers will be key to achieving future goals.
Focus on recruiting industrial sites and understanding whether their production schedules, capacity, and product accumulation allow them to shed load during DR events. Research incentive opportunities that would directly increase production capacity or product accumulation capacity. Market these opportunities to potential customers. Research incentives that would entice industrial customers to join Auto-DR. Anticipate that the recruitment process will be longer and will include a more scrutinized review of documents such as the CPA and the TA/TI form, as these customers’ incentives are larger and their legal staff is brought more often into the process.
Marketing materials and activities are important to the success of the Program. It is important to create them and make them available to the Project Team at the earliest stages of the Program.
Request and obtain early definition of the 2008 Program’s parameters for including in the marketing materials. Specific recommendations are: (1) distribute 2008 Program materials to legacy customers early, (2) substitute weekly newsletters with as-needed e-mails or phone calls directing customers to www.auto-dr.com, (3) produce quarterly Auto-DR briefings, send announcements, and post them on www.auto-dr.com, (4) use participant award presentations as opportunities for engaging customers for 2008 participation, and (5) given customers’ low response rate to post-event surveys, schedule in-person debriefings with select customers.
Executive Summary
Global Energy Partners, LLC xiii
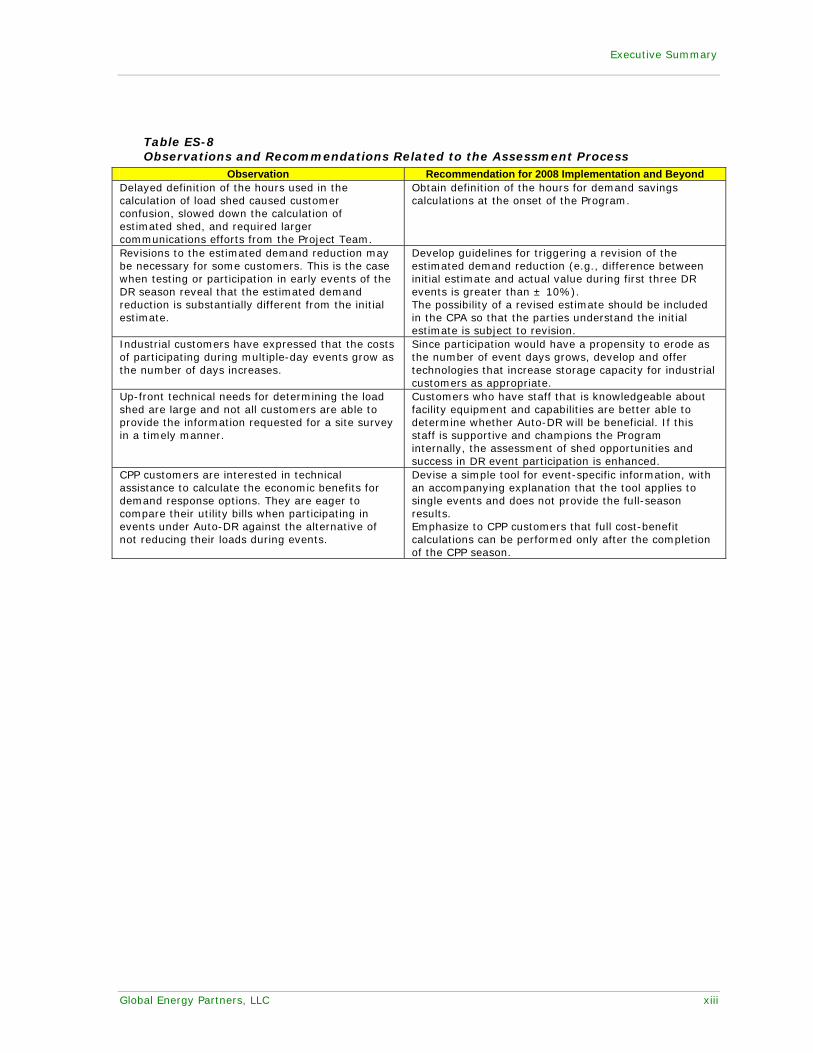
Table ES-8 Observations and Recommendations Related to the Assessment Process
Observation Recommendation for 2008 Implementation and Beyond Delayed definition of the hours used in the calculation of load shed caused customer confusion, slowed down the calculation of estimated shed, and required larger communications efforts from the Project Team.
Obtain definition of the hours for demand savings calculations at the onset of the Program.
Revisions to the estimated demand reduction may be necessary for some customers. This is the case when testing or participation in early events of the DR season reveal that the estimated demand reduction is substantially different from the initial estimate.
Develop guidelines for triggering a revision of the estimated demand reduction (e.g., difference between initial estimate and actual value during first three DR events is greater than ± 10%). The possibility of a revised estimate should be included in the CPA so that the parties understand the initial estimate is subject to revision.
Industrial customers have expressed that the costs of participating during multiple-day events grow as the number of days increases.
Since participation would have a propensity to erode as the number of event days grows, develop and offer technologies that increase storage capacity for industrial customers as appropriate.
Up-front technical needs for determining the load shed are large and not all customers are able to provide the information requested for a site survey in a timely manner.
Customers who have staff that is knowledgeable about facility equipment and capabilities are better able to determine whether Auto-DR will be beneficial. If this staff is supportive and champions the Program internally, the assessment of shed opportunities and success in DR event participation is enhanced.
CPP customers are interested in technical assistance to calculate the economic benefits for demand response options. They are eager to compare their utility bills when participating in events under Auto-DR against the alternative of not reducing their loads during events.
Devise a simple tool for event-specific information, with an accompanying explanation that the tool applies to single events and does not provide the full-season results. Emphasize to CPP customers that full cost-benefit calculations can be performed only after the completion of the CPP season.

Executive Summary
xiv www.gepllc.com
Table ES-9 Observations and Recommendations Related to Equipment Enablement
Observation Recommendation for 2008 Implementation and Beyond The Auto-DR technology worked well—every customer that signed a CPA was able to become Auto-DR enabled—and adapted to a myriad of IT environments while proving broad sector applicability and cost-effectiveness.
Continue with the existing Auto-DR technology and highlight its success to potential new customers.
Development of the DBP system was delayed due to the delayed contract signature, late Auto-DR system integration contracting and execution, and to automation development work that involved numerous organizations and complex customer aggregation requirements and program rules.
An early start is essential for any programs that require creation or modification of a DRAS. Obtain well-articulated Program rules.
The Technical Coordinators played an important role in the success of the Auto-DR Program.
Continue to work with TCs, building on the acquired knowledge of those who participated in 2007 and engaging new TCs. Recognize that the average TC time to enable and support ongoing customers is much lower than for new customers and that the TC time required for a customer is independent of the customer’s load shed performance. Consider modifying the payment structure for TCs.
Since PG&E called only one test DBP event during the 2007 DR season, operators did not get the opportunity to gain full experience with the operator duties related to these events.
Schedule operations reviews on a regular basis to ensure and maintain proficient operator capabilities. Conduct debrief sessions for operators following events to sharpen knowledge.
The number of CLIR boxes used in the 2007 Program was lower than anticipated due to fewer but bigger-shed customers enrolled and the enrollment of Web Services software clients.
CLIR boxes will continue to be needed since they’re a reliable and tested simple client that’s available to customers who don’t’ have smart systems. Create a concise description of the CLIR box that addresses concerns of facilities’ IT departments. Include a description of the CLIR box (basic functional descriptions, example code, polling interval and bandwidth requirements of both the CLIR box and Web Services Clients (XML)). Recognize that some TCs do not have internal resources capable of programming or resolving XML software client problems when making customer assignments.

Executive Summary
Global Energy Partners, LLC xv
Table ES-10 Observations and Recommendations Related to Program Operations
Observation Recommendation for 2008 Implementation and Beyond A Customer Relationship Management (CRM) tool is critical to the work of the Project Team. Lack of a CRM created difficulties for communication and reporting among groups within the Project Team.
A fully enabled CRM tool for 2008 is essential for easier tracking, communication, and reporting. Procure, test, and deploy a CRM tool before beginning future Programs.
Routine monitoring of the DRAS and client status on a daily basis precluded communication problems. Other issues related to the client software/hardware were always identified well in advance of the actual DR events. Therefore, there were no instances when an Auto-DR customer could not participate in a CPP or DBP event due to a problem with the DRAS or client infrastructure.
Continue the active monitoring of the DRAS and take advantage of the system that has been developed to notify operators when a CLIR box has been disconnected.
Feedback and diagnostics capability are not available from DRAS to InterAct™
Consider development of capability in the future.
Follow-through with customers, understood to be a TC responsibility, was lacking.
Emphasize in future TC training and contracts that follow-through after enablement and after DR events is a TC responsibility and emphasize the expectation. Have the Project Team provide TCs with a list of specific follow-through activities and have the Auto-DR Account Manager perform reviews. Provide DR event load shed performance information from InterAct™ to TCs in a quick and automated manner.

Global Energy Partners, LLC xvi
CONTENTS
1 INTRODUCTION.................................................................................... 1-1
2 PROGRAM DESIGN AND IMPLEMENTATION OVERVIEW........................ 2-1 2.1 Program planning......................................................................... 2-1
2.1.1 Customer Screening Questionnaire .................................................. 2-1 2.1.2 Baseline Models ............................................................................ 2-1 2.1.3 Site Survey Form .......................................................................... 2-2 2.1.4 Customer Participation Agreement................................................... 2-3
2.2 Marketing and Outreach Activities................................................... 2-4 2.2.1 Marketing Materials ....................................................................... 2-4 2.2.2 Program Website .......................................................................... 2-5 2.2.3 Process Communication ................................................................. 2-6 2.2.4 Outreach Activities ........................................................................ 2-7
2.3 Automation Technology Description and Development ......................2-12 2.3.1 Background................................................................................ 2-12 2.3.2 PG&E Auto-DR Technology and Infrastructure ................................. 2-13 2.3.3 DRAS Development for version 3.x and 4.x..................................... 2-14 2.3.4 CPP and DBP Development ........................................................... 2-15 2.3.5 CPP and DBP Event Parameters ..................................................... 2-16 2.3.6 ITRON and Envoy™ Integration..................................................... 2-16 2.3.7 CLIR and Web Services DRAS Client Development ........................... 2-16 2.3.8 Upgrade to CLIR Software Version 2.4.2......................................... 2-16 2.3.9 Technical Documentation ............................................................. 2-16
2.4 Participant Recruitment Procedures................................................2-17 2.5 Technical Coordination Recruitment and Training Steps ....................2-24 2.6 Technology Incentive Process........................................................2-27 2.7 Technical Steps toward Customer Enablement .................................2-29 2.8 Testing and Verification Procedures................................................2-40 2.9 Operations during Demand Response Events...................................2-40
3 RECRUITMENT AND PARTICIPATION RESULTS..................................... 3-1 3.1 Auto-DR Technical Assessments ..................................................... 3-1 3.2 Auto-DR System Enablement ......................................................... 3-2
4 SUMMARY OF AUTO-DR TECHNOLOGY AND SOFTWARE........................ 4-1 4.1 CLIR and Web Service Client Performance........................................ 4-1 4.2 DRAS Operations Summary ........................................................... 4-2
5 DEMAND RESPONSE EVENT RESULTS ................................................... 5-1 5.1 Summary of Event Days and Conditions .......................................... 5-1 5.2 Aggregated CPP Results ................................................................ 5-2 5.3 Aggregated DBP Results ................................................................ 5-5 5.4 Aggregated Results by Event ......................................................... 5-6
Contents
Global Energy Partners, LLC xvii
5.4.1 Aggregated Load Shed on June 13, 2007 ......................................... 5-6 5.4.2 Aggregated Load Shed on July 5, 2007 ............................................ 5-8 5.4.3 Aggregated Load Shed on August 1, 2007 ........................................ 5-9 5.4.4 Aggregated Load Shed on August 30, 2007 .....................................5-11
5.5 Validation and Reconciliation of Load Sheds ....................................5-13 5.6 Cost of Auto-DR Program .............................................................5-14 5.7 Comparison Analysis of automation technology................................5-15
6 OBSERVATIONS AND RECOMMENDATIONS FOR FUTURE IMPLEMENTATIONS........................................................................................ 6-1
6.1 Observations and Recommendations Related to Recruitment .............. 6-1
6.2 Observations and Recommendations Related to ............................... 6-3
6.3 Observations and Recommendations Related to ................................ 6-6
6.4 Observations and Recommendations Related to Program Operations.... 6-6
Appendices
A. 2007 Auto-DR Program Plan Report
B. Auto-DR Overview Information
C. Demand Response Automation Server Information
D. Example of Electronic Newsletter
E. Example of Webcast Invitation
F. Technical Documents, Manuals, and Guides
G. CPP and DBP Event Parameters
H. Survey of the Technical Coordinators
I. Customer Demand Response Strategies
J. Summary of Customer Event Participation
K. Screenshots of DRAS Operator Interface
L. Summary of Load Reductions by CPP Customer
M. Summary of Load Reductions by DBP Customer
N. CPP Event Day Summary Results
O. Demand and Load Shed Summaries by Customer
P. Citations


Global Energy Partners, LLC xix
LIST OF FIGURES
Figure 2-1 Auto-DR Home Page ...................................................................... 2-6 Figure 2-2 Generic Automated DR Open-Interface Standard Architecture .............2-13 Figure 2-3 Auto-DR architecture deployed by PG&E...........................................2-14 Figure 2-4 Auto-DR Contract Process ..............................................................2-19 Figure 2-5 Technical Coordinator Procedures for Enabling Auto-DR Sites ..............2-30 Figure 2-6 Day 2 of Technical Coordinator Auto-DR Training Course at PG&E’s San
Ramon Valley Conference Center .....................................................2-32 Figure 5-1 Average High Temperatures and CPP Event Dates ............................. 5-2 Figure 5-2 Average Demand Savings for 3/10, 3/10 MA and OAT Baselines .......... 5-5 Figure 5-3 Aggregated Demand on June 13, 2007 ............................................ 5-7 Figure 5-4 Aggregated Demand on July 5, 2007 ............................................... 5-8 Figure 5-5 Aggregated Demand on August 1, 2007 ........................................... 5-9 Figure 5-6 Aggregate Demand on August 30, 2007- CPP Event..........................5-11 Figure 5-7 Aggregated Demand for CPP/DBP Events on August 30, 2007 ............5-12 Figure 5-8 Comparison of Shed by Individual Building ......................................5-16 Figure 5-9 Comparison of Shed by Building Category Averages..........................5-17

Global Energy Partners, LLC xx
LIST OF TABLES
Table 2-1 Responses to Electronic Survey on July 31, 2007 Webcast..................2-10 Table 2-2 Technical Documents ....................................................................2-17 Table 2-3 TC Training Evaluation Summaries ..................................................2-27 Table 2-4 Summary of Auto-DR Technologies Used by TC to Enable Sites ...........2-35 Table 2-5 Summary of TC Hours to enable and support Auto-DR Sites................2-37 Table 2-6 TC Cost Analysis by Facility Type ....................................................2-37 Table 2-7 TC Cost Analysis ALL Sites (Hours, kW, $/kW) ..................................2-39 Table 3-1 Demand Response Measures by Customer......................................... 3-2 Table 3-2 Auto-DR system Installed and Enabled ............................................. 3-3 Table 3-3 Breakdown of Type of Client Device.................................................. 3-3 Table 5-1 CPP Event Dates............................................................................ 5-2 Table 5-2 Summary of CPP Event Load Sheds.................................................. 5-3 Table 5-3 Average CPP Load Reduction Savings ............................................... 5-4 Table 5-4 Average CPP Load Reduction by Customer Type ................................. 5-5 Table 5-5 Summary of DBP Test Event Load sheds on August 30th ..................... 5-6 Table 5-6 Aggregated Load Shed on June 13, 2007 .......................................... 5-7 Table 5-7 Aggregated Load shed on July 5, 2007 ............................................. 5-9 Table 5-8 Aggregated Load Shed on August 1, 2007........................................5-10 Table 5-9 Aggregated Load Shed on August 30, 2007 – CPP Event.....................5-12 Table 5-10 Aggregated Load Shed on August 30, 2007 – DBP Test Event .............5-13 Table 5-11 Aggregated Load Sheds for 2007 DR Season – CPP Program...............5-13 Table 5-12 Aggregated Load Sheds for 2007 DR Season – DBP Program ..............5-14 Table 5-13 Cost of 2007 Auto-DR Program.......................................................5-15

Global Energy Partners, LLC 1-1
CHAPTER 1
INTRODUCTION
During 2007 Pacific Gas and Electric Company (PG&E) conducted a program to implement Automated Demand Response (Auto-DR), with an initial goal of 15 MW of demand reduction. Due to a high level of customer interest the demand reduction goal was revised to 20 MW once the DR season was underway. This report describes the successful implementation of the PG&E Auto-DR Program, reports surpassing of goals for a demand reduction of over 22 MW, and provides recommendations for the success of future Auto-DR programs.
The Auto-DR technologies and systems used in the 2007 Auto-DR Program were developed by Lawrence Berkeley National Laboratory (LBNL) through the PIER Demand Response Research Center (DRRC) and Akuacom. PIER is the Public Interest Energy Research Program at the California Energy Commission (CEC).
The Auto-DR Program is funded by California utility customers and administered by PG&E under the auspices of the California Public Utilities Commission. Global Energy Partners (GEP) was retained in early March 2007 to implement PG&E’s 2007 Auto-DR Program. The 2007 Auto-DR Program signified a substantial expansion to full-scale implementation of a PG&E Pilot Effort that was managed by LBNL in conjunction with the CEC. While the 2006 Pilot was limited to customers on the Critical Peak Pricing (CPP) tariff, the 2007 Program was expanded to include customers participating in the Demand Bid Program (DBP). Comprehensive information on CPP and DBP can be found in the PG&E website, at http://www.pge.com/biz/demand_response/critical_peak_pricing/ and http://www.pge.com/biz/demand_response/demand_bidding_program/ respectively.
The Project Team for Auto-DR 2007 consisted of staff from GEP, LBNL/DRRC, Akuacom, and the Electric Power Research Institute (EPRI). A Recruitment Team within the Project Team was responsible for customer recruitment.
Chapter 2 of this report presents an overview of the 2007 Auto-DR Program’s design and implementation. Chapter 3 presents the results of the Program’s recruitment and participation. Chapter 4 provides a summary of the Program’s Auto-DR technology and software. Chapter 5 discusses the results of demand response events. Chapter 6 summarizes the lessons learned from the Program and provides recommendations for future implementations.

Global Energy Partners, LLC 2-1
CHAPTER 2
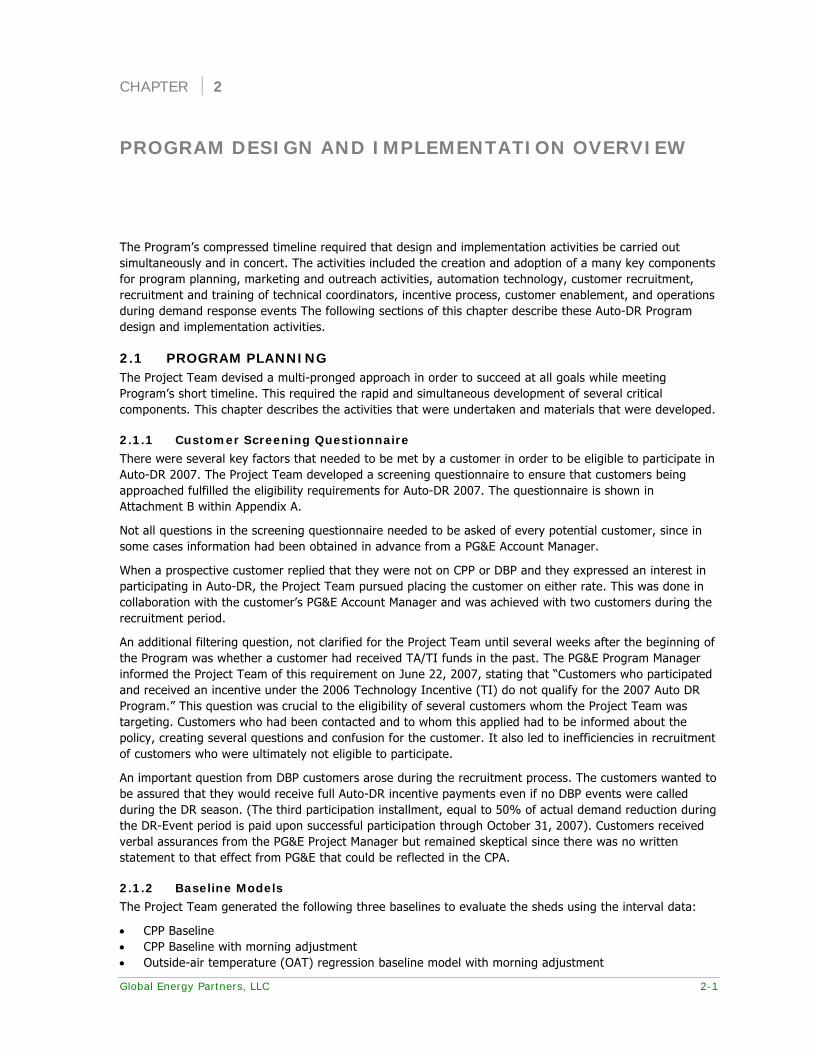
PROGRAM DESIGN AND IMPLEMENTATION OVERVIEW
The Program’s compressed timeline required that design and implementation activities be carried out simultaneously and in concert. The activities included the creation and adoption of a many key components for program planning, marketing and outreach activities, automation technology, customer recruitment, recruitment and training of technical coordinators, incentive process, customer enablement, and operations during demand response events The following sections of this chapter describe these Auto-DR Program design and implementation activities.
2.1 PROGRAM PLANNING The Project Team devised a multi-pronged approach in order to succeed at all goals while meeting Program’s short timeline. This required the rapid and simultaneous development of several critical components. This chapter describes the activities that were undertaken and materials that were developed.
2.1.1 Customer Screening Questionnaire
There were several key factors that needed to be met by a customer in order to be eligible to participate in Auto-DR 2007. The Project Team developed a screening questionnaire to ensure that customers being approached fulfilled the eligibility requirements for Auto-DR 2007. The questionnaire is shown in Attachment B within Appendix A.
Not all questions in the screening questionnaire needed to be asked of every potential customer, since in some cases information had been obtained in advance from a PG&E Account Manager.
When a prospective customer replied that they were not on CPP or DBP and they expressed an interest in participating in Auto-DR, the Project Team pursued placing the customer on either rate. This was done in collaboration with the customer’s PG&E Account Manager and was achieved with two customers during the recruitment period.
An additional filtering question, not clarified for the Project Team until several weeks after the beginning of the Program was whether a customer had received TA/TI funds in the past. The PG&E Program Manager informed the Project Team of this requirement on June 22, 2007, stating that “Customers who participated and received an incentive under the 2006 Technology Incentive (TI) do not qualify for the 2007 Auto DR Program.” This question was crucial to the eligibility of several customers whom the Project Team was targeting. Customers who had been contacted and to whom this applied had to be informed about the policy, creating several questions and confusion for the customer. It also led to inefficiencies in recruitment of customers who were ultimately not eligible to participate.
An important question from DBP customers arose during the recruitment process. The customers wanted to be assured that they would receive full Auto-DR incentive payments even if no DBP events were called during the DR season. (The third participation installment, equal to 50% of actual demand reduction during the DR-Event period is paid upon successful participation through October 31, 2007). Customers received verbal assurances from the PG&E Project Manager but remained skeptical since there was no written statement to that effect from PG&E that could be reflected in the CPA.
2.1.2 Baseline Models
The Project Team generated the following three baselines to evaluate the sheds using the interval data:
• CPP Baseline • CPP Baseline with morning adjustment • Outside-air temperature (OAT) regression baseline model with morning adjustment

Program Design and Implementation Overview
2-2 www.gepllc.com
CPP Baseline. Although CPP is a tariff and does not require a baseline for settlement purposes, a simple average of three days out of the past ten business days with the highest average load during the curtailment period has been used to develop the CPP baseline. This baseline method is commonly used by all the investor-owned utilities in California.
CPP Baseline with morning adjustment. While a simple averaging method tends to work well with buildings that have low load variability, it does not capture load variations that occur in the space due to occupancy patterns and other factors. In addition, it does not accurately predict loads for a heat wave that is preceded by cooler temperatures. Adjusting the CPP baseline, based on the morning loads during the day of the event, better captures the variation for the event day. Therefore, a morning adjustment multiplier calculated for the day of the event using the actual loads between 10 am and noon is used with the CPP baseline to more accurately predict the load for the event day. This multiplication factor can be defined as the ratio of the actual load to the predicted load in the two hours prior to the event period:
MA = [Actual load 11 + Actual load 12] / [CPP load 11 + CPP load 12]
Where,
MA = Morning Adjustment multiplier
Actual load 11 = Actual load for period ending at 11 am (source: interval data)
Actual load 12 = Actual load for period ending at 12 pm (source: interval data)
CPP load 11 = Predicted load for period ending at 11 am (source: baseline calculation)
CPP load 12 = Predicted load for period ending at 12 pm (source: baseline calculation)
Once MA is calculated, the entire baseline is multiplied by the adjustment to generate the CPP baseline with morning adjustment.
Outside-air temperature (OAT) regression baseline model with morning adjustment. This baseline model incorporates weather sensitivity of buildings into the baseline model. Weather sensitivity is a measure of the degree to which building loads are driven directly by local weather. In modeling a baseline, weather dependence is often represented by using regression models relating hourly load to hourly temperature. For the OAT baseline with morning adjustment, a linear regression model incorporating 15-minute weather data is used to calculate the baseline and multiplied with the same morning adjustment multiplier.
2.1.3 Site Survey Form
Of key importance was the availability of a site survey form for capturing customers’ key parameters with which to make load reduction estimates. Since the project’s targeted participants belonged to two separate sectors, commercial and industrial, the Project Team created a site survey for each type of customer.
The commercial site survey form contained sections on customer contact information, site information (e.g., building vintage, description, floor space, and occupancy schedule), energy breakdown during summer peak period (e.g., lighting, HVAC, and appliances), information on HVAC and lighting systems, Energy Management and Control System (EMCS), energy information system, internet connectivity, and load shed plan.
The industrial site survey form contained sections on customer contact information, NAICS code, building size, process type, hours of operation, facility operations (e.g., wastewater treatment, data center), equipment and load shed that participated in previous DR programs, equipment that can be shutdown, length of possible shutdown, hours of advance notice required, and backup power sources.
In a few commercial customer cases, when customers were not able to provide full answers to a site survey, the Project Team was able to obtain a few key parameters with which shed estimates could be made. The key parameters were:
• Type of Heating, Ventilation, and Air Conditioning (HVAC) system (central or packaged) • Air Volume System (constant or variable)
Program Design and Implementation Overview
Global Energy Partners, LLC 2-3
• Thermostat setting for each zone in a building
The Commercial Site and Industrial Site Survey template are shown in Attachment A within Appendix A. They can also be found in www.auto-dr.com.
Not all customers are able to provide the information requested in a site survey in a timely manner. The Project Team needs to be able to make case-specific decisions (generally for smaller load reductions or for aggregation across multiple buildings for which the accuracy of load reduction estimates is less risky) of when estimates based on the reduced number of parameters are appropriate. Since project deadlines are a major factor in this decision, ample recruitment time is necessary for completion of site surveys. When the Recruitment Team members estimate that timelines will not be affected, they contact the customers, discuss what more information is needed, and obtain the missing information
2.1.4 Customer Participation Agreement
A critical step towards the success of the Auto-DR program was to create a Customer Participation Agreement (CPA) to be presented to customers being recruited for the Program. As the CPA is a legally binding document, participants were interested in reviewing and understanding it. In many cases participants needed to have the CPA reviewed and approved by their oftentimes lengthy legal approval process. Hence, fast development and availability of the CPA template held key importance to the success of the project.
The Project Team developed a CPA to be signed by the participant’s authorized employee and by an officer of GEP, the project implementation manager. The PG&E Project Manager reviewed and authorized the use of the CPA. The CPA template is shown in Attachment C of Appendix A.
The CPA contains important information for the participant and GEP as the signing parties, including the following:
• Statement that the automated demand response peak demand reduction is part of PG&E’s Technical Assistance/Technology Incentives (TA/TI) Program for demand response.
• Eligibility requirements, including minimum load and interval meter. • Explanation of the three components of Auto-DR incentives, which are valued at up to $300/kW in
demand reductions:
- Technical Support – for services to ensure the successful implementation of the Auto-DR measures, which are offered free of charge to the customers by GEP and/or its contractors, and which are valued at up to $110/kW of demand reduction.
- Equipment/Installation – for the reimbursement of costs associated with the design, procurement, and installation of the Auto-DR technologies and measures, and which amounts to the smaller of either $140/kW of estimated demand reduction or 100% of the Auto-DR project costs. This incentive is paid upon verification of completed installation of Auto-DR equipment.
- Participation – for the customer’s participation and performance during the DR-Event period (May 1, 2007 through October 31, 2007) and estimated at $50/kW of demand reduction. This Participation incentive is paid in three installments:
a. The first installment, equal to 25% of $50/kW of estimated demand reduction, paid upon inspection and testing of Auto-DR equipment.
b. The second installment, also equal to 25% of $50/kW of estimated demand reduction, paid upon completed participation by the customer in its first Auto-DR event.
c. The third installment, equal to 50% of actual demand reduction during the DR-Event period, paid upon successful participation through October 31, 2007.
Revisions to the estimated demand reduction may be necessary for some customers. This is the case when testing or participation in early events of the DR season reveal that the estimated demand reduction is substantially different from the estimate. The possibility of a revised estimate can be included in the CPA so that the parties understand the first estimate is subject to revision.
• Definition of estimated and actual demand reduction:
Program Design and Implementation Overview
2-4 www.gepllc.com
- Estimated demand reduction is the estimated demand savings, based on engineering calculations or performance during 2006 pilot.
• Actual demand reduction is the average demand savings over all load reduction events that the customer was capable to participate in during the DR-Event period. The average demand savings are calculated according to the following schedule:
o CPP customers: comprised of load reductions for all CPP events that the customer was capable to participate in during the three-hour period of 3 PM to 6 PM on CPP event days.
o DBP customers: comprised of load reductions for all DBP events that the customer was capable to participate in during the maximum two-consecutive-hour period between 12 noon and 8 PM on DBP event days.
Definition of hours for demand savings calculations was not obtained until the Program was well underway. The lack of definition at the onset of the Program caused customer confusion and required larger communications efforts for the Project Team.
• A table listing the demand response measures to be implemented, detailing the Service Agreement IDs involved, estimated demand savings (kW), source of estimated demand savings (e.g., engineering calculation or performance during 2006 Pilot Program), estimated project cost, installation incentive, and participation incentive.
• A statement to the effect that the customer agreed to maintain and operate the installed demand response equipment for a minimum of twelve months.
• PG&E’s TA/TI Incentive Application, for which the following two sections were submitted:
- Incentive Application Form. This contains information on the customer’s address, tax identification, the designation of GEP as the party to receive the incentive check from PG&E.
- Nonresidential Retrofit - Demand Response (NRR-DR) Form. This also contains information on the customer’s address, the property type, and an acknowledgment that GEP is the customer’s Project Sponsor.
Definition of which sections of the TA/TI application were necessary for Auto-DR was not obtained until the Program was well underway. The customer incentive amounts embedded in the form’s formulas yielded incorrect incentive values which could not be presented to the customers. To remedy this, the Project Team entered correct values for customer incentive amounts manually. The Project Team also alerted the PG&E Program Manager about the issue.
• Internal Revenue Service (IRS) Form W-9, based upon which GEP will file and IRS Form 1099 for
payments received by participants.
The Project Team reviewed the CPA with each customer, answering questions and explaining all necessary sections to the satisfaction of customers in order to obtain their signature. In some cases, this involved much communication with the customers and resolution of requested edits.
Some legacy customers expressed surprise at being presented with a formal agreement form as compared with the one-page memorandum of understanding (MOU) which they had signed for the 2006 Pilot Program. The Project Team explained that the expansion to full-scale implementation required that Global Energy Partners, as the party under contract with PG&E to implement the Program, sign an agreement with each participant as part of the Program’s documentation
CPAs were signed in duplicate by the participants and by GEP, with each party retaining an original for its files.
2.2 MARKETING AND OUTREACH ACTIVITIES The Project Team created marketing materials and implemented outreach activities to achieve the 2007 Auto-DR Program’s aggressive goals. These activities are described in this section.
2.2.1 Marketing Materials
A one-page document contained a summary of the Program. It provided an overview of the Program, outlined customer incentives, gave contact information, presented quotes from participants and champions,
Program Design and Implementation Overview
Global Energy Partners, LLC 2-5
and directed readers to the project’s website, www.auto-dr.com, for additional information. This document is shown in Appendix B.
In addition, a one-page document contained a description of the Demand Response Automation Server (DRAS) and a photograph and information of the Client and Logic with Integrated Relay (CLIR). This document is shown in Appendix C.
When visiting a customer for the first time, the Project Team placed the CPA template, the site survey form template, the one-page Program summary, and the DRAS document in a Global Energy Partners folder which also contained the Project Team member’s business card. As many copies of the folder package as requested by each customer were provided.
The development of marketing materials was delayed due to lack of definition for the Program, in particular the incentive amounts (initially presented with asterisks to denote likely revision in the future) and whether the Program’s website could be announced. Having experienced the value of these collateral materials, it is important to create and distribute them to the Project Team at the earliest stages of the Program.
2.2.2 Program Website
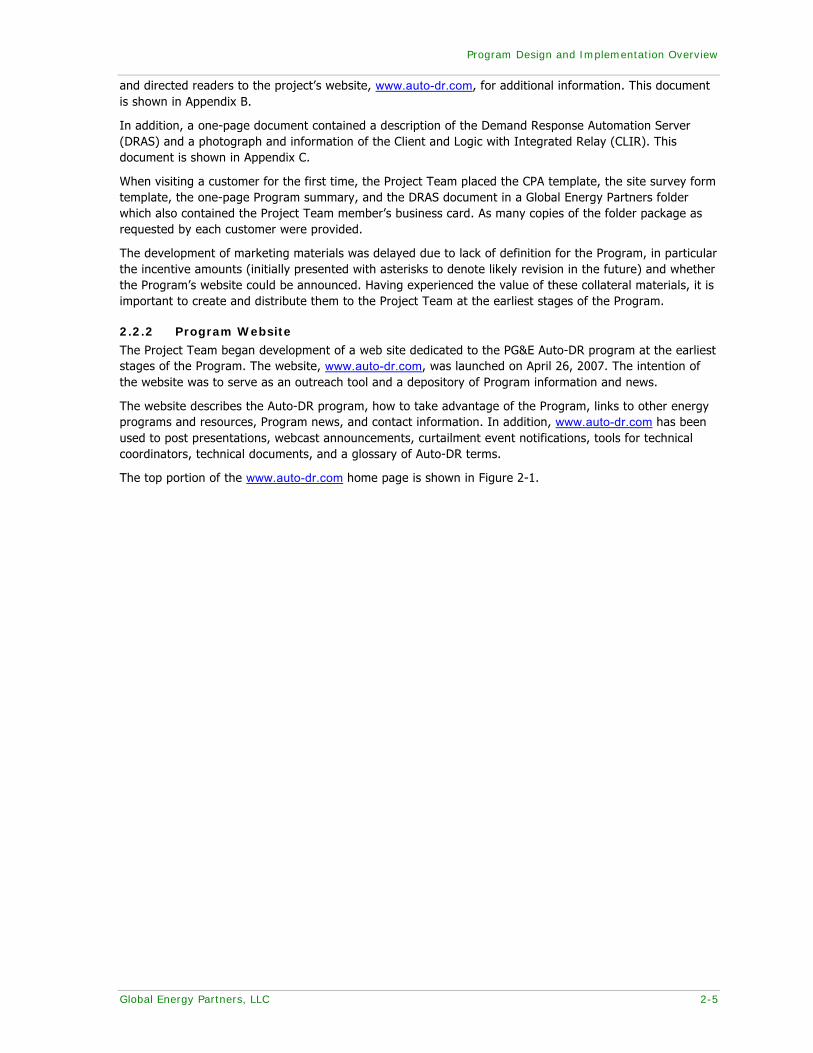
The Project Team began development of a web site dedicated to the PG&E Auto-DR program at the earliest stages of the Program. The website, www.auto-dr.com, was launched on April 26, 2007. The intention of the website was to serve as an outreach tool and a depository of Program information and news.
The website describes the Auto-DR program, how to take advantage of the Program, links to other energy programs and resources, Program news, and contact information. In addition, www.auto-dr.com has been used to post presentations, webcast announcements, curtailment event notifications, tools for technical coordinators, technical documents, and a glossary of Auto-DR terms.
The top portion of the www.auto-dr.com home page is shown in Figure 2-1.
Program Design and Implementation Overview
2-6 www.gepllc.com
Figure 2-1 Auto-DR Home Page
The Program website provided valuable information in a timely manner and lent further presence to Auto-DR. Security enablement with password protection (HTTPS encrypted login accounts (with passwords implied)) is recommended in the future so that customers can retrieve information specific to them (e.g., DRAS information and performance data).
2.2.3 Process Communication
The implementation of Auto-DR also required the definition and communication to customers of key process information and clarification of the role of GEP as contracted to perform implementation. This information included that GEP:
• Had been hired by PG&E to be its 2007 Auto-DR Program implementer. • Was working with the customer’s PG&E Account Manager and keeping the Account Manager informed
of all key steps. • Would prepare the necessary PG&E Auto-DR application documents and present them to the customer
for review and signature. • Would submit the application documents to PG&E. • Would be sending incentive checks to the customer. • Would explain and guide in the steps necessary to participate in the Program and would work with the
customer through the entire process.
The Project Team had to overcome customer resistance and concerns about GEP’s implementation responsibilities and, generally with the cooperation of the PG&E Account Manager, guarantee to the
Program Design and Implementation Overview
Global Energy Partners, LLC 2-7
customer that all information exchanged was confidential and that payments from GEP would indeed materialize.
Communication of the implementation process information by the Project Team to customers was verbal or via e-mail, possibly leading to uneven communication across customers. A written process guide will be helpful for future and larger programs that would require communications with a larger volume of customers. The document could be reviewed with or sent to a customer and could also be posted at www.auto-dr.com.
2.2.4 Outreach Activities
2.2.4.1 Meetings with PG&E Account Managers
The Project Team engaged in a campaign to inform and engage the PG&E Account Manager about Auto-DR 2007. The Project Team sought to meet with Account Manager groups and succeeded in obtaining invitations to two Account Manager group meetings. The first was one was on March 27th to the Silicon Valley Division in San Jose. The second one was on April 17th to the Corporate Account Managers in San Francisco.
These meetings were very helpful in creating awareness and familiarity with Auto-DR 2007 among Account Managers. They provided the opportunity to explain the goals and implementation of Auto-DR to the Account Executives in person and a chance to exchange ideas on the better prospects for the Program among their accounts. The Project Team made presentations and answered questions at each meeting.
The Project Team prepared lists of potential customers for each Account Manager for each meeting and the lists were presented and discussed with the Account Managers who attended.
These meetings yielded several successful leads and recommendations for participants, reinforcing the importance of the relationship with Account Managers. However, while some Account Managers embraced the idea of offering Auto DR to their customers and worked closely with the Project Team to set up customer meetings, others did not. This made it difficult for the Project Team to identify an appropriate customer contact or otherwise pursue some likely Auto-DR customers. For future Auto-DR programs it will be important to schedule meetings and presentations with the Account Managers as early as possible in order to provide updated Program information and to consult on candidate recommendations.
2.2.4.2 Participation in Meetings and Workshops
- PG&E Account Manager Energy Efficiency and Demand Response 2007 Program Workshop. Held in from March 13 through March 15 at the San Ramon Valley Conference Center, this was a training workshop on the 2007 energy efficiency and demand response programs being offered by PG&E to its Account Managers. Mary Ann Piette, Director of the DRRC, was invited to make a presentation and members of the LBNL/DRRC 2006 Pilot Project Implementation Team were available to answer follow-on questions and to provide information on Auto-DR.
- Silicon Valley Leadership Group (SVLG) Demand Response Conference. As 2007 Program Implementer, Global Energy Partners, staffed a booth at this meeting, held on March 16th at Echelon in San Jose. The Project Team took the opportunity to explain the Program to potential participants, to introduce itself to PG&E Account Managers in attendance, and to display the Demand Response Automation Server (DRAS) on a laptop computer.
- PG&E Energy Management Workshop. The Project Team obtained invitations to participate in this very well-attended workshop. The workshop was held on October 2 and was hosted by Sybase, a participant in the 2007 Auto-DR Program. Mary Ann Piette from DRRC made a presentation on Auto-DR during which she introduced the Project Team. The Project Team obtained an attendee list and followed up with a request to the PG&E Auto-DR Program Manager for customer contact information and access to load data through InterAct™ in order to gauge the size and eligibility of the customers on the list.
Several key contacts with PG&E Account Managers and potential participants for future recruitment were made. Including the Project Team in these meetings is extremely valuable in promoting customer participation.
Program Design and Implementation Overview
2-8 www.gepllc.com
2.2.4.3 Customer Communications
The Project Team carried out a communications campaign that included development of a Program website and content, an electronic newsletter, webcasts, post-event surveys, and participant award presentations. • Electronic Newsletters. Following the tradition of the 2006 Pilot Program, electronic newsletters were
prepared and sent weekly to Program participants and prospects from May 1 through July 3, 2007. The newsletters contained general information and updates on Auto-DR, the steps towards enablement and participation, and reminders about upcoming DR events when their scheduling coincided with the newsletter’s mailing. An example of the electronic newsletters is shown in Appendix D
The weekly newsletters were suspended after the issue of July 3 based on customer feedback that time for reading it was scarce and that the information on the steps toward enablement and participation was repetitive. Since the Project Team was communicating regularly with participants, further information was handled on a case-by-case basis and by inviting participants to Program webcasts (discussed later in this section).
Customers could be directed to Program updates by a link to www.auto-dr in an e-mail message that leads them to important and timely information. General Program information may also be better received as a year-round quarterly briefing.
• Post-Event Surveys. The Project Team conducted several web-based post-event surveys, scheduled to be sent on the working day following an event. The purpose of the surveys was to gauge event awareness, success of strategy, occupant feedback, and operational issues. Participants were also asked about additional non-automated measures they may have taken and whether they had any additional comments.
In an effort to reduce impact on customers, the frequency of web-based post-event surveys was controlled. When there were consecutive Demand Response events, web-based surveys were sent on the day following the last of the consecutive event days. When more than one event occurred in a week, web-based surveys were sent on the day following the last event of the week.
Responses were received for three of the five surveys sent, for a total of eleven completed surveys. These responses were provided by eight different participants, representing 13 service accounts and approximately 950 kW of load reduction. The discussion below is based on these responses and, with a single exception noted below, no attempt is made to distinguish across the event dates which the surveys addressed, as the surveys were identical.
o All respondents reported being aware of the Demand Response events. Sources of awareness
were e-mail notification, cell-phone text messages, cell-phone paging, and fax. Some respondents reported receiving numerous e-mails and faxes a few minutes apart and over several hours for the first event of the year, a concern that was reported to PG&E for resolution, as the origin of the repeated e-mails and faxes was found to be InterAct™.
In addition, several respondents mentioned that became aware of an upcoming event through the PG&E orb.
o When survey respondents became aware of a Demand Response event, they in turn notified
their employees, occupants, and customers about the event. Typically this notification was via e-mail. Some customers used verbal communications and posters as a vehicle for notification.
o All but one respondent reported noticing a physical difference in service during the Demand
Response event. They stated noticing a rise in building’s temperature when that was the measure employed. One industrial participant reported a very clear difference, as the site shuts down a very important piece of equipment in order to reach the anticipated demand reduction.

Program Design and Implementation Overview
Global Energy Partners, LLC 2-9
o All but one respondent stated that their employees, occupants, or customers did notice a difference in service during a Demand Response event.
o The respondents generally monitored their Energy Management Controls Systems during an
event or reviewed the load performance data available in InterAct™ on the day following an event to check if the demand response strategies worked as planned.
o The most common complaint from employees, occupants, and customers concerned warmer
temperature. Interestingly, one participant reported that some of its employees welcomed the warmer temperature in the building while others “complain just to complain”.
o When asked about operational issues with the DR strategy itself or with compromised service
resulting from the strategy, the majority of respondents stated that they had experienced no such issues. Three issues were reported by the respondents:
- One participant reported that the PC which runs its Web Service Client program had power issues and was not running at the beginning of an event. The PC was repaired two hours into the event and then everything worked correctly.
- Another participant wrote that its T1 line was down the day prior to and the day of an event. This precluded receipt of the automated shed communication. The customer obtained assistance from the Project Team and was able to manually place the system into shed mode.
- A third participant said that several event days in a row make it very costly to comply with the Program’s shed requirements. This customer was referring to the four continuous days of CPP at the end of August, 2007.
o A majority of respondents stated that they took additional measures to further reduce electrical demand using manual methods. These included manual overrides, shutdowns, and power downs; turning off of non-essential equipment, turning off of lights and light timers, and adjusting the timer for charging the forklift.
The response rate to the post-event surveys was lower than expected. The Project Team maintained ongoing communications with the Program participants in order to better understand the participants’ experience with the Program.
• Webcasts. The purpose of the webcasts was to update customers on Program achievements and to provide a forum for discussion of issues encountered by participants. Participants, prospects, PG&E Account Managers, and Technical Coordinators received invitations via e-mail. The sessions were billed as Brownbag Lunch Webcasts scheduled to last an hour. They were held from noon to 1 PM on July 31 and October 5. An example of the invitation is shown in Appendix E.
Fourteen individuals participated in the July 31 webcast, with four of those being Program participants or prospects. The webcast provided an introduction to the Project Team, a summary of the Program, Program achievements to date, a viewing of the Participant Success Story by Tech Closeup (discussed later in this section), and a participant’s forum.
A post-webcast electronic survey was sent the day after the July 31 webcast. Seven replies were received, one of which was from a participant and two from prospects. The rest of the replies came from PG&E Account Managers and Project Team members. Since the objective of the webcast was to reach and involve participants and prospects, replies from those three respondents are reported below. Table 2-1 shows the survey questions and results.
Program Design and Implementation Overview
2-10 www.gepllc.com
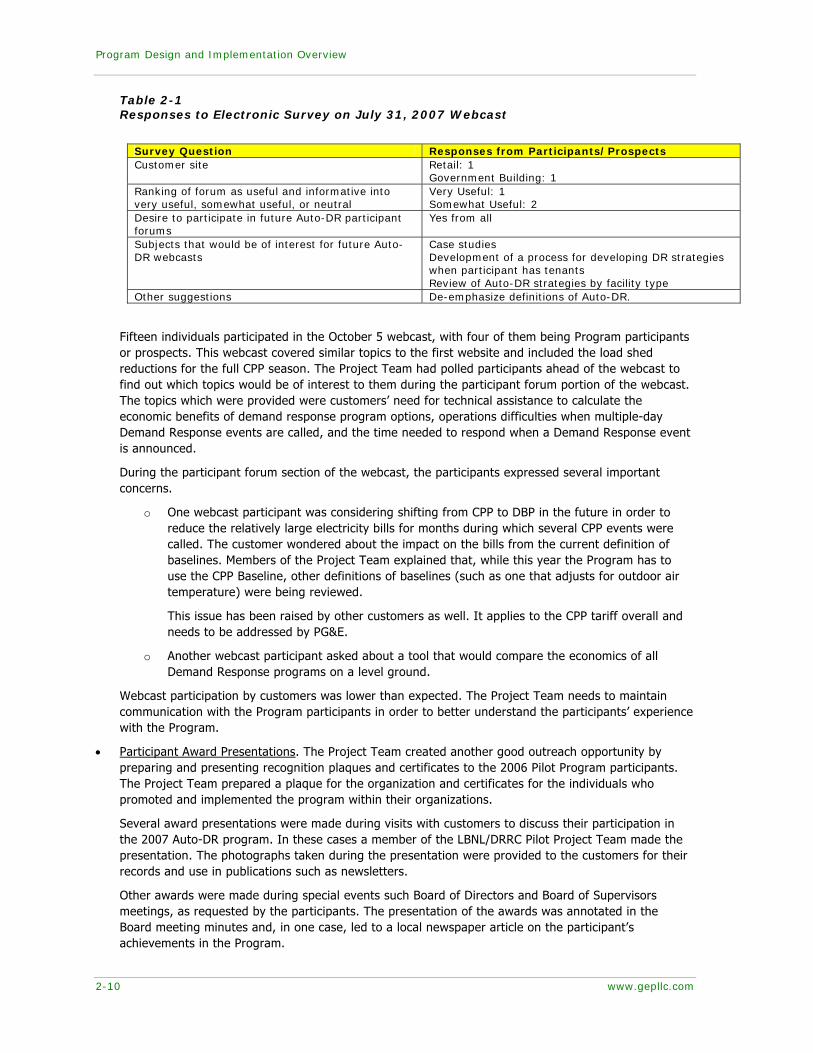
Table 2-1 Responses to Electronic Survey on July 31, 2007 Webcast
Fifteen individuals participated in the October 5 webcast, with four of them being Program participants or prospects. This webcast covered similar topics to the first website and included the load shed reductions for the full CPP season. The Project Team had polled participants ahead of the webcast to find out which topics would be of interest to them during the participant forum portion of the webcast. The topics which were provided were customers’ need for technical assistance to calculate the economic benefits of demand response program options, operations difficulties when multiple-day Demand Response events are called, and the time needed to respond when a Demand Response event is announced.
During the participant forum section of the webcast, the participants expressed several important concerns.
o One webcast participant was considering shifting from CPP to DBP in the future in order to reduce the relatively large electricity bills for months during which several CPP events were called. The customer wondered about the impact on the bills from the current definition of baselines. Members of the Project Team explained that, while this year the Program has to use the CPP Baseline, other definitions of baselines (such as one that adjusts for outdoor air temperature) were being reviewed.
This issue has been raised by other customers as well. It applies to the CPP tariff overall and needs to be addressed by PG&E.
o Another webcast participant asked about a tool that would compare the economics of all Demand Response programs on a level ground.
Webcast participation by customers was lower than expected. The Project Team needs to maintain communication with the Program participants in order to better understand the participants’ experience with the Program.
• Participant Award Presentations. The Project Team created another good outreach opportunity by preparing and presenting recognition plaques and certificates to the 2006 Pilot Program participants. The Project Team prepared a plaque for the organization and certificates for the individuals who promoted and implemented the program within their organizations.
Several award presentations were made during visits with customers to discuss their participation in the 2007 Auto-DR program. In these cases a member of the LBNL/DRRC Pilot Project Team made the presentation. The photographs taken during the presentation were provided to the customers for their records and use in publications such as newsletters.
Other awards were made during special events such Board of Directors and Board of Supervisors meetings, as requested by the participants. The presentation of the awards was annotated in the Board meeting minutes and, in one case, led to a local newspaper article on the participant’s achievements in the Program.
Survey Question Responses from Participants/Prospects Customer site Retail: 1
Government Building: 1 Ranking of forum as useful and informative into very useful, somewhat useful, or neutral
Very Useful: 1 Somewhat Useful: 2
Desire to participate in future Auto-DR participant forums
Yes from all
Subjects that would be of interest for future Auto-DR webcasts
Case studies Development of a process for developing DR strategies when participant has tenants Review of Auto-DR strategies by facility type
Other suggestions De-emphasize definitions of Auto-DR.
Program Design and Implementation Overview
Global Energy Partners, LLC 2-11
Based on the good results in presenting the 2006 Participant awards, the Project Team has created a similar recognition plan for 2007 Program participants. The recognition plan has been prepared and presented to the PG&E Project Manager for review and consideration, and has received approval as of this writing.
• Participant Success Story by Tech Closeup. The Project Team collaborated with Tech Closeup, a TV program that covers high technology. Now broadcast nationally, when aired during the summer of 2007 Tech Closeup was being broadcast on most of the community cable access channels across the San Francisco Bay Area. The viewing audience was over 3 million households. Tech Closeup was also seen on GoogleVideo. It presents a monthly 30-minute program on new trends in technology, technology employees, and community, with a focus on the Silicon Valley.
The GEP Manager of the Auto-DR program procured the opportunity to create a program that focused on Auto-DR. Ikea in East Palo Alto was identified and engaged as the customer to be featured in the program and representatives from the California Energy Commission, PG&E, Ikea, LBNL, and C&C Building Automation, and Global Energy Partners agreed to be filmed. There was no out-of-pocket cost to any of the participants in the show nor to the Auto-DR Program.
The program covered the importance of demand response, the innovation created by automated demand response, the experience of Ikea as a Program participant, and the technology that supports the program. Each person featured in the program spoke about the area to which they contributed.
The Participant Success Story was very well received internally at PG&E, to whom several dozen copies on DVD were provided. It has been shown at conference presentations where it has created a good forum for discussions. It has also proven valuable and provided to potential participants as a tool for explaining the Program.
• Testimonials. Customer testimonials are a recognized tool in the field of marketing and publicity. The Project Team has obtained several testimonials, using them in collateral materials and as examples during recruitment visits.
The following testimonials have been obtained from 2007 Program customer. The participants have authorized the Project Team to use them for promoting Auto-DR.
“The win-win for Ikea is that not only do we avoid having to pay for higher cost kilowatts, we’re also shifting the load so that we are avoiding over-taxing the system.”
Michael O’Rourke
Store Manager, IKEA, Emeryville, California
“Participation in PG&E’s Automated Demand Response Program means that the Fremont Unified School District saves on its utility bill while it helps to prevent rolling blackouts.”
Gene Wheatley
Manager of Maintenance, Operations & Grounds
Fremont Unified School District
“Sybase is pleased to see the results provided by the Automated Demand Response program, which help advance our green initiatives and thus make us a more responsible corporate citizen."
Greg Bush
Real Estate Manager for Common Services, Sybase, Dublin, California
The following authorized testimonials have also been obtained from Auto-DR champions for use in promoting Auto-DR:
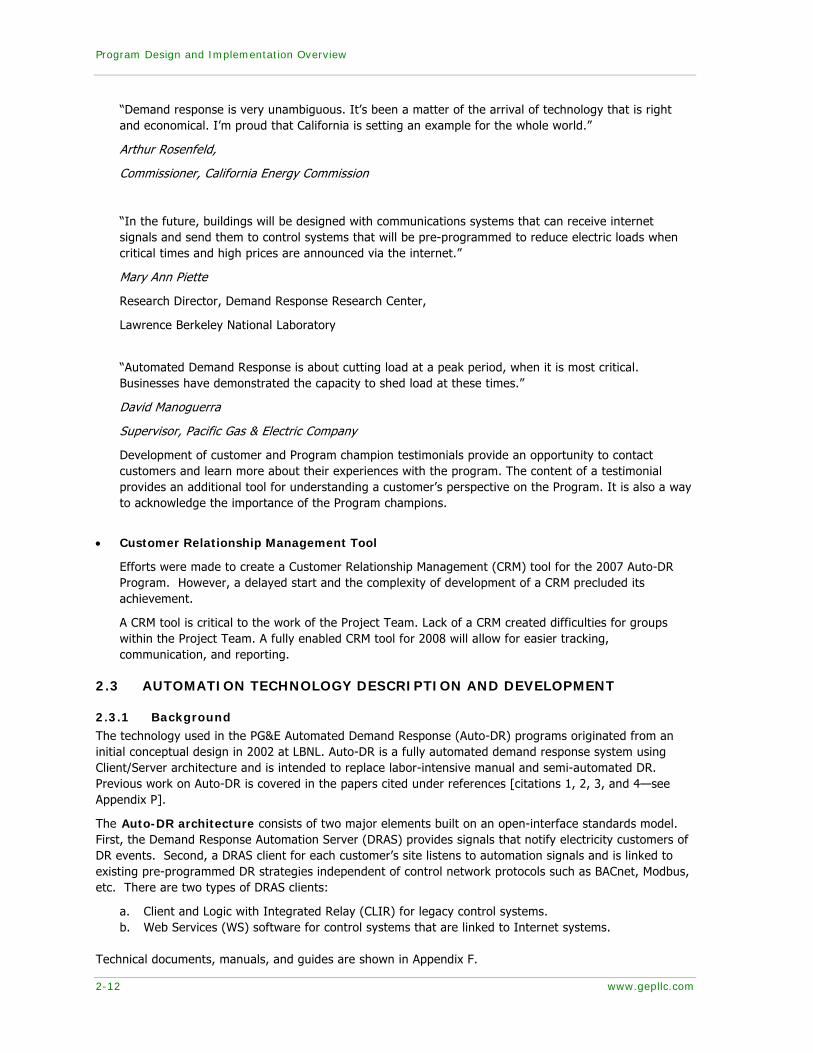
Program Design and Implementation Overview
2-12 www.gepllc.com
“Demand response is very unambiguous. It’s been a matter of the arrival of technology that is right and economical. I’m proud that California is setting an example for the whole world.”
Arthur Rosenfeld,
Commissioner, California Energy Commission
“In the future, buildings will be designed with communications systems that can receive internet signals and send them to control systems that will be pre-programmed to reduce electric loads when critical times and high prices are announced via the internet.”
Mary Ann Piette
Research Director, Demand Response Research Center,
Lawrence Berkeley National Laboratory
“Automated Demand Response is about cutting load at a peak period, when it is most critical. Businesses have demonstrated the capacity to shed load at these times.”
David Manoguerra
Supervisor, Pacific Gas & Electric Company
Development of customer and Program champion testimonials provide an opportunity to contact customers and learn more about their experiences with the program. The content of a testimonial provides an additional tool for understanding a customer’s perspective on the Program. It is also a way to acknowledge the importance of the Program champions.
• Customer Relationship Management Tool
Efforts were made to create a Customer Relationship Management (CRM) tool for the 2007 Auto-DR Program. However, a delayed start and the complexity of development of a CRM precluded its achievement.
A CRM tool is critical to the work of the Project Team. Lack of a CRM created difficulties for groups within the Project Team. A fully enabled CRM tool for 2008 will allow for easier tracking, communication, and reporting.
2.3 AUTOMATION TECHNOLOGY DESCRIPTION AND DEVELOPMENT
2.3.1 Background
The technology used in the PG&E Automated Demand Response (Auto-DR) programs originated from an initial conceptual design in 2002 at LBNL. Auto-DR is a fully automated demand response system using Client/Server architecture and is intended to replace labor-intensive manual and semi-automated DR. Previous work on Auto-DR is covered in the papers cited under references [citations 1, 2, 3, and 4—see Appendix P].
The Auto-DR architecture consists of two major elements built on an open-interface standards model. First, the Demand Response Automation Server (DRAS) provides signals that notify electricity customers of DR events. Second, a DRAS client for each customer’s site listens to automation signals and is linked to existing pre-programmed DR strategies independent of control network protocols such as BACnet, Modbus, etc. There are two types of DRAS clients:
a. Client and Logic with Integrated Relay (CLIR) for legacy control systems. b. Web Services (WS) software for control systems that are linked to Internet systems.
Technical documents, manuals, and guides are shown in Appendix F.

Program Design and Implementation Overview
Global Energy Partners, LLC 2-13
As shown in Figure 2-2, the steps involved in the Auto-DR process during a DR event are:
a. The Utility or ISO defines DR event and price/mode signals are sent to the DRAS. b. DR event and price services published on the DRAS. c. DRAS Clients (CLIR or WS) request real-time event data from the DRAS every minute. d. Customized pre-programmed DR strategies determine action based on event price/mode. e. Facility Energy Management Control Systems (EMCS) or related controls carry out load reduction
based on DR event signals and strategies.
Figure 2-2 Generic Automated DR Open-Interface Standard Architecture
Auto-DR systems are built using eXtensible Markup Language (XML) and Simple Object Access Protocol (SOAP) based secure Web Service Oriented Architecture (SOA) for platform-independent, interoperable systems that use low-bandwidth Transmission Control Protocol and Internet Protocol (TCP/IP) Internet connections. Auto-DR has been used for PG&E CPP programs during the 2005, 2006, and 2007 programs. The PG&E CPP and DBP Auto-DR design builds on previous work. Extensive effort was made to accommodate Auto-DR for demand bidding (DBP) in 2007.
2.3.2 PG&E Auto-DR Technology and Infrastructure
The Auto-DR technology infrastructure development for PG&E was standardized to minimize technology costs and improve DR event participation. It focused on the following areas:
• Demand Response Automation Server (DRAS) development • CPP and DBP program development • DRAS Client development • Technical documentation
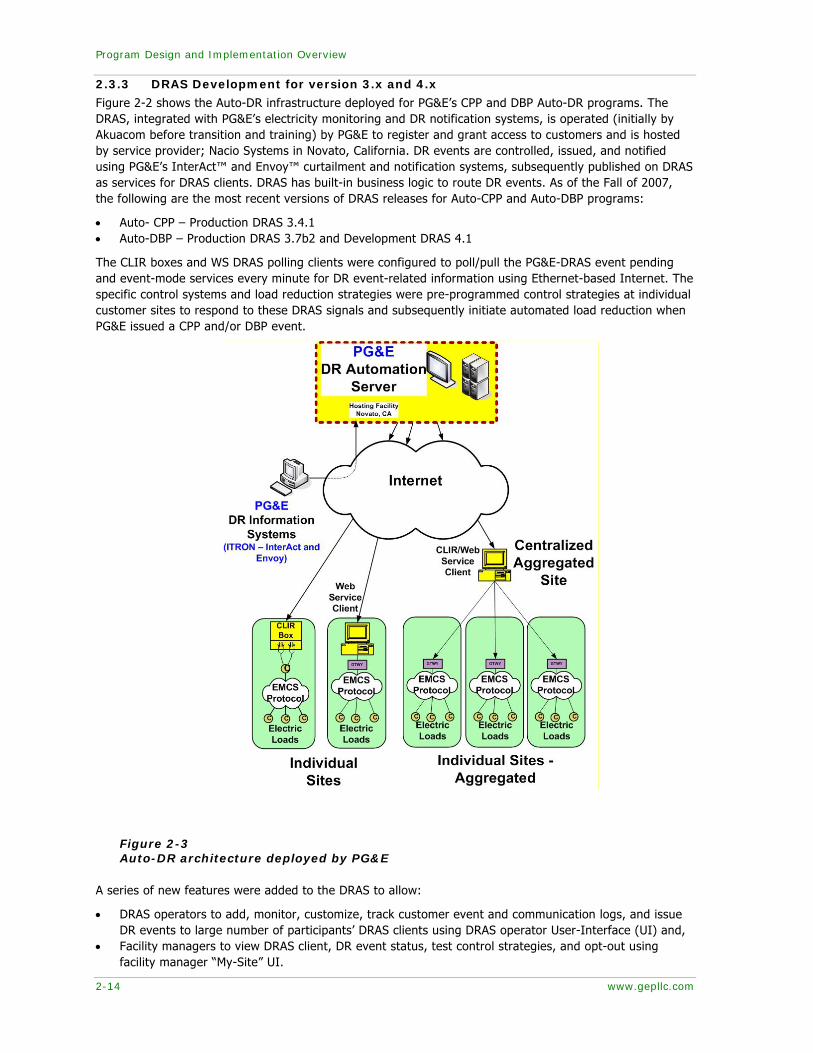
Program Design and Implementation Overview
2-14 www.gepllc.com
2.3.3 DRAS Development for version 3.x and 4.x
Figure 2-2 shows the Auto-DR infrastructure deployed for PG&E’s CPP and DBP Auto-DR programs. The DRAS, integrated with PG&E’s electricity monitoring and DR notification systems, is operated (initially by Akuacom before transition and training) by PG&E to register and grant access to customers and is hosted by service provider; Nacio Systems in Novato, California. DR events are controlled, issued, and notified using PG&E’s InterAct™ and Envoy™ curtailment and notification systems, subsequently published on DRAS as services for DRAS clients. DRAS has built-in business logic to route DR events. As of the Fall of 2007, the following are the most recent versions of DRAS releases for Auto-CPP and Auto-DBP programs:
• Auto- CPP – Production DRAS 3.4.1 • Auto-DBP – Production DRAS 3.7b2 and Development DRAS 4.1
The CLIR boxes and WS DRAS polling clients were configured to poll/pull the PG&E-DRAS event pending and event-mode services every minute for DR event-related information using Ethernet-based Internet. The specific control systems and load reduction strategies were pre-programmed control strategies at individual customer sites to respond to these DRAS signals and subsequently initiate automated load reduction when PG&E issued a CPP and/or DBP event.
Figure 2-3 Auto-DR architecture deployed by PG&E
A series of new features were added to the DRAS to allow:
• DRAS operators to add, monitor, customize, track customer event and communication logs, and issue DR events to large number of participants’ DRAS clients using DRAS operator User-Interface (UI) and,
• Facility managers to view DRAS client, DR event status, test control strategies, and opt-out using facility manager “My-Site” UI.
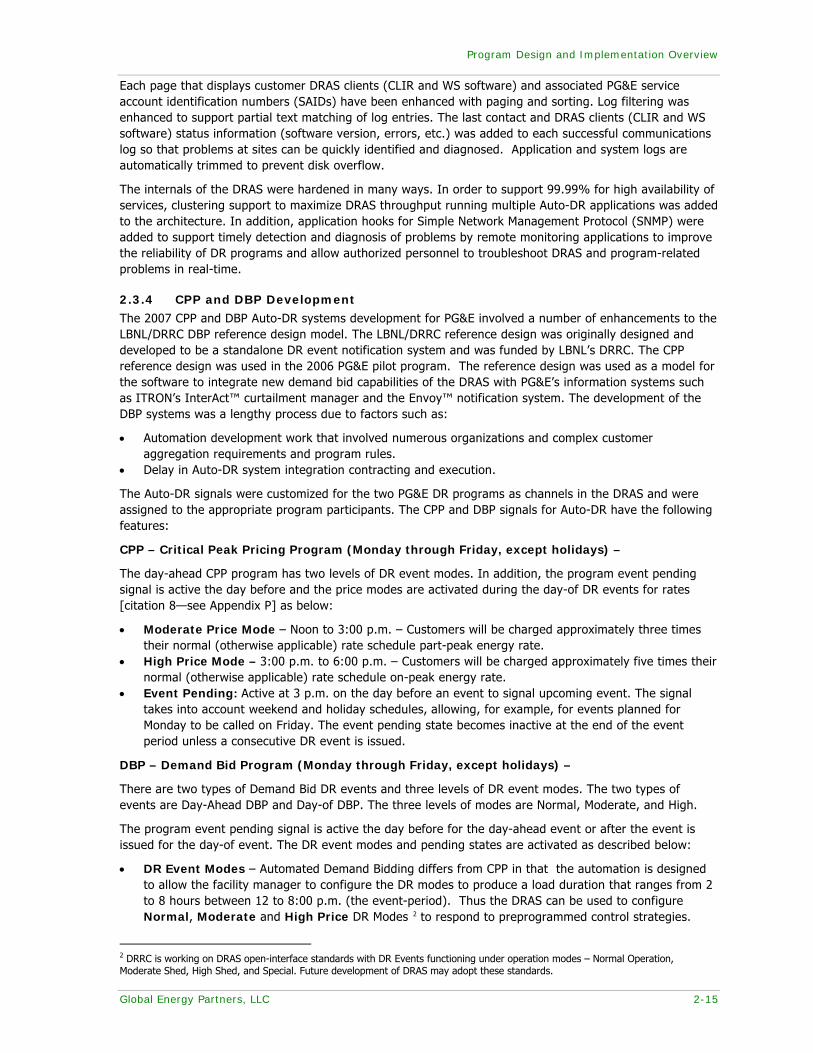
Program Design and Implementation Overview
Global Energy Partners, LLC 2-15
Each page that displays customer DRAS clients (CLIR and WS software) and associated PG&E service account identification numbers (SAIDs) have been enhanced with paging and sorting. Log filtering was enhanced to support partial text matching of log entries. The last contact and DRAS clients (CLIR and WS software) status information (software version, errors, etc.) was added to each successful communications log so that problems at sites can be quickly identified and diagnosed. Application and system logs are automatically trimmed to prevent disk overflow.
The internals of the DRAS were hardened in many ways. In order to support 99.99% for high availability of services, clustering support to maximize DRAS throughput running multiple Auto-DR applications was added to the architecture. In addition, application hooks for Simple Network Management Protocol (SNMP) were added to support timely detection and diagnosis of problems by remote monitoring applications to improve the reliability of DR programs and allow authorized personnel to troubleshoot DRAS and program-related problems in real-time.
2.3.4 CPP and DBP Development
The 2007 CPP and DBP Auto-DR systems development for PG&E involved a number of enhancements to the LBNL/DRRC DBP reference design model. The LBNL/DRRC reference design was originally designed and developed to be a standalone DR event notification system and was funded by LBNL’s DRRC. The CPP reference design was used in the 2006 PG&E pilot program. The reference design was used as a model for the software to integrate new demand bid capabilities of the DRAS with PG&E’s information systems such as ITRON’s InterAct™ curtailment manager and the Envoy™ notification system. The development of the DBP systems was a lengthy process due to factors such as:
• Automation development work that involved numerous organizations and complex customer aggregation requirements and program rules.
• Delay in Auto-DR system integration contracting and execution.
The Auto-DR signals were customized for the two PG&E DR programs as channels in the DRAS and were assigned to the appropriate program participants. The CPP and DBP signals for Auto-DR have the following features:
CPP – Critical Peak Pricing Program (Monday through Friday, except holidays) –
The day-ahead CPP program has two levels of DR event modes. In addition, the program event pending signal is active the day before and the price modes are activated during the day-of DR events for rates [citation 8—see Appendix P] as below:
• Moderate Price Mode – Noon to 3:00 p.m. – Customers will be charged approximately three times their normal (otherwise applicable) rate schedule part-peak energy rate.
• High Price Mode – 3:00 p.m. to 6:00 p.m. – Customers will be charged approximately five times their normal (otherwise applicable) rate schedule on-peak energy rate.
• Event Pending: Active at 3 p.m. on the day before an event to signal upcoming event. The signal takes into account weekend and holiday schedules, allowing, for example, for events planned for Monday to be called on Friday. The event pending state becomes inactive at the end of the event period unless a consecutive DR event is issued.
DBP – Demand Bid Program (Monday through Friday, except holidays) –
There are two types of Demand Bid DR events and three levels of DR event modes. The two types of events are Day-Ahead DBP and Day-of DBP. The three levels of modes are Normal, Moderate, and High.
The program event pending signal is active the day before for the day-ahead event or after the event is issued for the day-of event. The DR event modes and pending states are activated as described below:
• DR Event Modes – Automated Demand Bidding differs from CPP in that the automation is designed to allow the facility manager to configure the DR modes to produce a load duration that ranges from 2 to 8 hours between 12 to 8:00 p.m. (the event-period). Thus the DRAS can be used to configure Normal, Moderate and High Price DR Modes 2 to respond to preprogrammed control strategies.
2 DRRC is working on DRAS open-interface standards with DR Events functioning under operation modes – Normal Operation, Moderate Shed, High Shed, and Special. Future development of DRAS may adopt these standards.

Program Design and Implementation Overview
2-16 www.gepllc.com
DBP customers bid for contiguous minimum two-hour blocks for a minimum of 50 kW reductions during each hour.
• Event Pending: Active at 9:00 p.m. for the day-before event or one hour after the request for bids (RFB) closes for a day-of event. Similar to CPP above, the event pending signal takes into account weekends and holidays. The event pending becomes inactive at the end of an event period.
For the 2007 PG&E Auto-DR program, customers participated in either the CPP or DBP program, or both. To help PG&E disseminate the Auto-DR technology, LBNL/DRRC and Akuacom trained PG&E customers and Technical Coordinators (TCs) to install and operate the Auto-DR systems.
2.3.5 CPP and DBP Event Parameters
The CPP and DBP event parameters defined by PG&E are included in Appendix G These DR event parameters include day-ahead and day-of for DBP and day-ahead for CPP and consist of:
a. Event notification parameters: Used to notify a DRAS client of an upcoming event in the form of an event pending signal.
b. Event mode notification parameters: Used to notify DRAS client of the event modes active during an event period. These modes had one of the three states – NORMAL, MODERATE, or HIGH.
2.3.6 ITRON and Envoy™ Integration
The automation of the DBP was developed to support for both Day-ahead and Day-of DBP. The CPP and DBP programs were integrated through Internet based web services automation with Itron’s new InterAct™ Version 5 and Envoy™ notification system. This automation allows program events to be issued from the InterAct™ scheduling pages and automatic event notifications (pager, fax, phone, e-mail) to be sent directly to the customer’s facility manager from Envoy™ and DRAS clients from DRAS. The DRAS DBP program supports full Auto-Bid/Auto-Shed functionality, with bids being automatically communicated and accepted by InterAct™. In addition, enhancements to the DRAS architecture were made to allow new programs to be added quickly, without disturbing the core DRAS architecture or software.
2.3.7 CLIR and Web Services DRAS Client Development
A number of activities were performed to customize and enhance Auto-DR to suit the requirements and specifications for PG&E’s Auto-DR programs. The CLIR was enhanced beyond its initial prototype stage to support a large scale deployment of many units in the field. The most important feature added was remote software upgradeability to allow new features to be added and bugs to be fixed without replacing the units. Support for Simple Network Management Protocol (SNMP) was added in the new release so that facility IT managers can monitor the CLIRs along with their other IT infrastructure. A new tool was developed to provide installers quick access to the CLIR configuration parameters without having to use the LCD keypad, which is not an efficient human-machine interface for significant configuration changes. Key features of DRAS client development are as follows:
• CLIR was upgraded from software version 2.4 to 2.4.2 with an important update as a “self-healing” device under hostile network conditions as explained in section “Upgrade to CLIR Software Version 2.4.2".
• Web Service DRAS client Release 3.0 is available for use by Internet-based control systems.
2.3.8 Upgrade to CLIR Software Version 2.4.2 During the summer of 2007, a CLIR at an Auto-CPP customer site exhibited behavior that involved loss of communication with the DRAS until a manual reboot was initiated. This CLIR behavior was not observed previously and the hardware and software had not changed. Investigations found that the combination of an unstable customer network (e.g. the network going down in just the right way or power-shutdown) and a software bug caused the CLIR to hang and lose communication to DRAS. While no program-related performance was compromised due to this behavior, and the problem did not affect WS software, the software upgrade to CLIR version 2.4.2 fixed the communications problem. All subsequent CLIR shipments contained this current software version or a higher version.
2.3.9 Technical Documentation
The following technical documentation for PG&E Auto-DR Program Operators, TCs, and Facility Managers is available.

Program Design and Implementation Overview
Global Energy Partners, LLC 2-17
The documents shown in Table 2-2 are available for downloading from www.auto-dr.com and link to “Technical Documents.” Details are noted in Appendix F: Technical Documents [Citations 5, 6 and 7—see Appendix P].
Table 2-2 Technical Documents
Document Bundled with Audience Utility Program Client
Type Version Description
PG&E Application Manual
CLIR/ WS Client
Programmer/TC PG&E CPP/
DBP CLIR/ WS Client 2.0-R4
Introduce and guide Facility Controls Programmer and TC of signaling infrastructure from DRAS for Auto-DR programs’ day-ahead and day-of event notifications using the CLIR and Software Web Service (WS) Client.
CLIR User-Guide
CLIR TC PG&E CPP/ DBP CLIR 6.0-R2
Introduce and guide TC on Auto-DR systems through CLIR pre- and post-site visit installation procedures
Web Service (WS) API
WS Client Programmer PG&E CPP/
DBP WS Client 2.0-R2
Describes the Application Programming Interface (API) to connect and listen and respond to the DRAS Web Service using SOAP to transport messages for Auto-DR.
• The DRAS operator user guides for Auto-DBP and facility manager user guides for both Auto-CPP and Auto-DBP programs were developed by LBNL/DRRC and/or Akuacom to assist DRAS use [citations 9, 10, and 11—see Appendix P]
• The glossary of Auto-DR key terms and acronyms was created by LBNL/DRRC for Auto-DR implementers to better understand the technology and is available for download on the Auto-DR website [citation 12—see Appendix P].
2.4 PARTICIPANT RECRUITMENT PROCEDURES Recruitment Personnel
As was discussed in the Introduction, a Recruitment Team (RT) was established early in the recruitment process. The Recruitment Team consisted of three members, all of whom worked part time on recruitment. Two were GEP employees and one was an outside consultant. All had extensive experience working on energy-related topics and all had previous sales and account management experience. Also, all had prior experience with negotiating complex customer contracts. Two had previous experience as employees of PG&E and one had consulting experience at PG&E. One Technical Coordinator Company (TC) acted both as at TC and as a recruiter.
Training for Recruitment Personnel
The Recruitment Team met several times and reviewed the Auto-DR program and offer. The Team also attended the training for the Technical Coordinators. Although there was no formal training for the Recruitment Team, there was some on-the-job training. One member who was more familiar with the Auto-DR program accompanied less experienced members on their first few customer calls. Also the Team met weekly for the first 8 weeks of the program to review progress and share key lessons. The cross fertilization through sharing of “lessons learned” was very valuable to the long term success and cohesion of the Team.
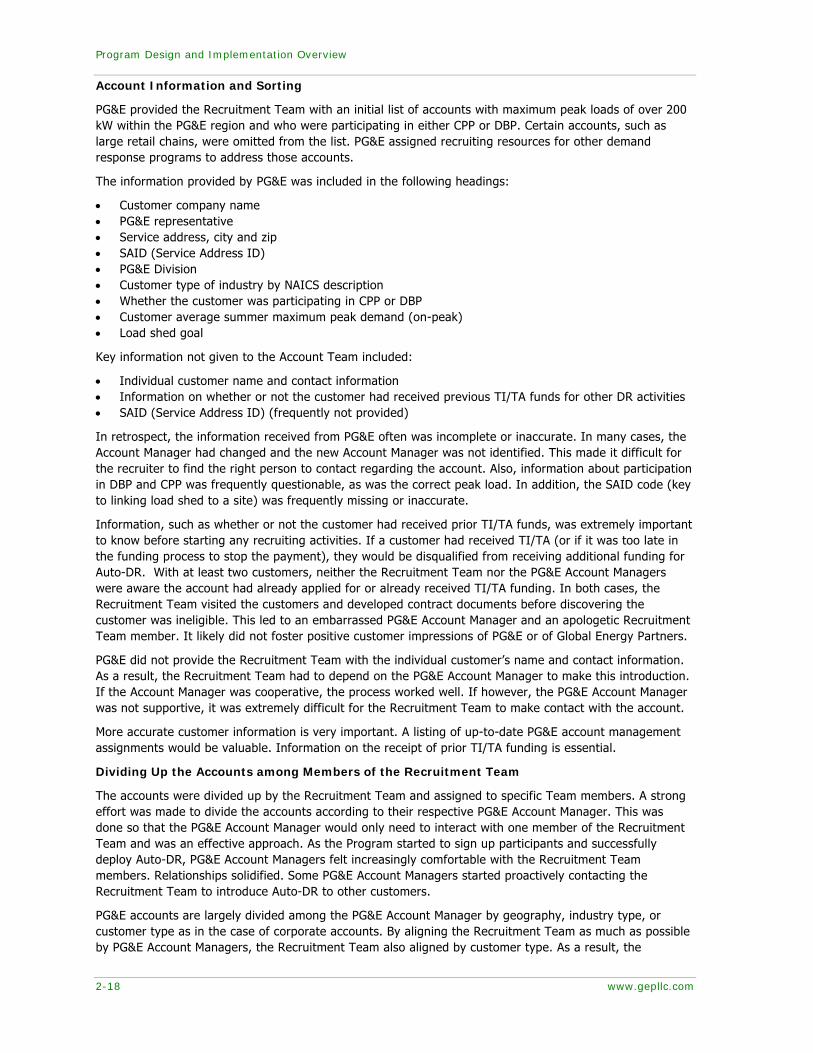
Program Design and Implementation Overview
2-18 www.gepllc.com
Account Information and Sorting
PG&E provided the Recruitment Team with an initial list of accounts with maximum peak loads of over 200 kW within the PG&E region and who were participating in either CPP or DBP. Certain accounts, such as large retail chains, were omitted from the list. PG&E assigned recruiting resources for other demand response programs to address those accounts.
The information provided by PG&E was included in the following headings:
• Customer company name • PG&E representative • Service address, city and zip • SAID (Service Address ID) • PG&E Division • Customer type of industry by NAICS description • Whether the customer was participating in CPP or DBP • Customer average summer maximum peak demand (on-peak) • Load shed goal
Key information not given to the Account Team included:
• Individual customer name and contact information • Information on whether or not the customer had received previous TI/TA funds for other DR activities • SAID (Service Address ID) (frequently not provided)
In retrospect, the information received from PG&E often was incomplete or inaccurate. In many cases, the Account Manager had changed and the new Account Manager was not identified. This made it difficult for the recruiter to find the right person to contact regarding the account. Also, information about participation in DBP and CPP was frequently questionable, as was the correct peak load. In addition, the SAID code (key to linking load shed to a site) was frequently missing or inaccurate.
Information, such as whether or not the customer had received prior TI/TA funds, was extremely important to know before starting any recruiting activities. If a customer had received TI/TA (or if it was too late in the funding process to stop the payment), they would be disqualified from receiving additional funding for Auto-DR. With at least two customers, neither the Recruitment Team nor the PG&E Account Managers were aware the account had already applied for or already received TI/TA funding. In both cases, the Recruitment Team visited the customers and developed contract documents before discovering the customer was ineligible. This led to an embarrassed PG&E Account Manager and an apologetic Recruitment Team member. It likely did not foster positive customer impressions of PG&E or of Global Energy Partners.
PG&E did not provide the Recruitment Team with the individual customer’s name and contact information. As a result, the Recruitment Team had to depend on the PG&E Account Manager to make this introduction. If the Account Manager was cooperative, the process worked well. If however, the PG&E Account Manager was not supportive, it was extremely difficult for the Recruitment Team to make contact with the account.
More accurate customer information is very important. A listing of up-to-date PG&E account management assignments would be valuable. Information on the receipt of prior TI/TA funding is essential.
Dividing Up the Accounts among Members of the Recruitment Team
The accounts were divided up by the Recruitment Team and assigned to specific Team members. A strong effort was made to divide the accounts according to their respective PG&E Account Manager. This was done so that the PG&E Account Manager would only need to interact with one member of the Recruitment Team and was an effective approach. As the Program started to sign up participants and successfully deploy Auto-DR, PG&E Account Managers felt increasingly comfortable with the Recruitment Team members. Relationships solidified. Some PG&E Account Managers started proactively contacting the Recruitment Team to introduce Auto-DR to other customers.
PG&E accounts are largely divided among the PG&E Account Manager by geography, industry type, or customer type as in the case of corporate accounts. By aligning the Recruitment Team as much as possible by PG&E Account Managers, the Recruitment Team also aligned by customer type. As a result, the
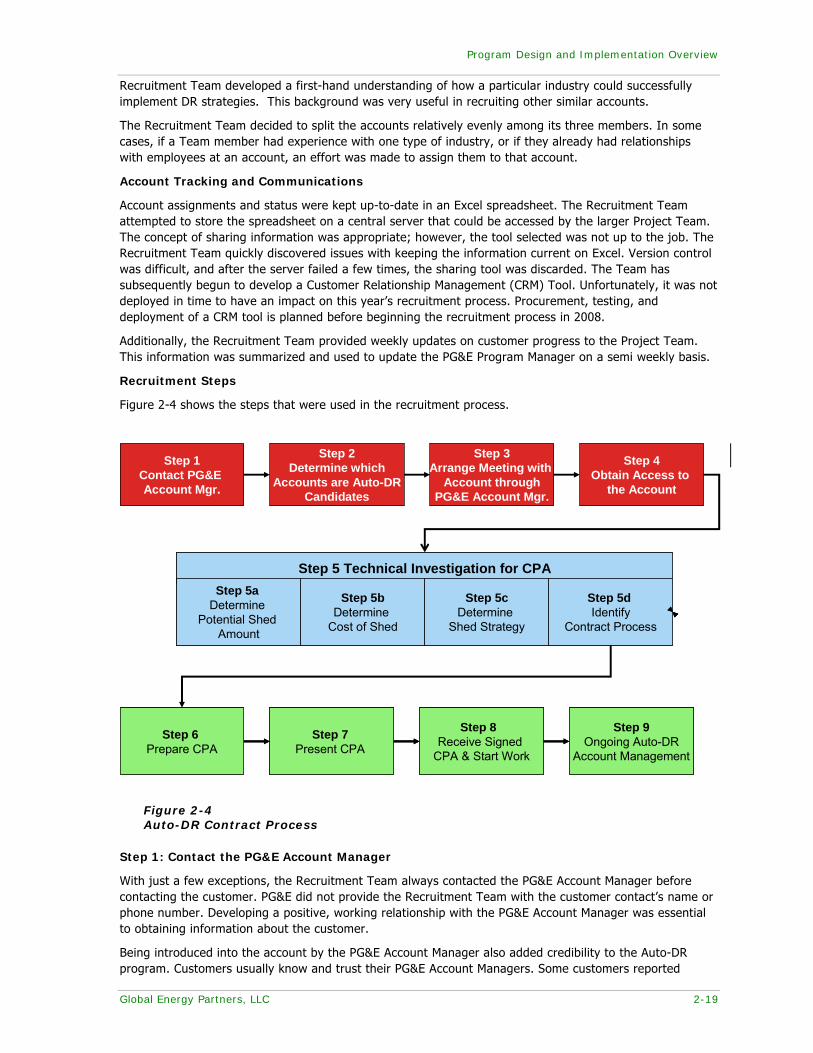
Program Design and Implementation Overview
Global Energy Partners, LLC 2-19
Recruitment Team developed a first-hand understanding of how a particular industry could successfully implement DR strategies. This background was very useful in recruiting other similar accounts.
The Recruitment Team decided to split the accounts relatively evenly among its three members. In some cases, if a Team member had experience with one type of industry, or if they already had relationships with employees at an account, an effort was made to assign them to that account.
Account Tracking and Communications
Account assignments and status were kept up-to-date in an Excel spreadsheet. The Recruitment Team attempted to store the spreadsheet on a central server that could be accessed by the larger Project Team. The concept of sharing information was appropriate; however, the tool selected was not up to the job. The Recruitment Team quickly discovered issues with keeping the information current on Excel. Version control was difficult, and after the server failed a few times, the sharing tool was discarded. The Team has subsequently begun to develop a Customer Relationship Management (CRM) Tool. Unfortunately, it was not deployed in time to have an impact on this year’s recruitment process. Procurement, testing, and deployment of a CRM tool is planned before beginning the recruitment process in 2008.
Additionally, the Recruitment Team provided weekly updates on customer progress to the Project Team. This information was summarized and used to update the PG&E Program Manager on a semi weekly basis.
Recruitment Steps
Figure 2-4 shows the steps that were used in the recruitment process.
Figure 2-4 Auto-DR Contract Process
Step 1: Contact the PG&E Account Manager
With just a few exceptions, the Recruitment Team always contacted the PG&E Account Manager before contacting the customer. PG&E did not provide the Recruitment Team with the customer contact’s name or phone number. Developing a positive, working relationship with the PG&E Account Manager was essential to obtaining information about the customer.
Being introduced into the account by the PG&E Account Manager also added credibility to the Auto-DR program. Customers usually know and trust their PG&E Account Managers. Some customers reported
Step 1Contact PG&E Account Mgr.
Step 2Determine which
Accounts are Auto-DRCandidates
Step 3Arrange Meeting with
Account throughPG&E Account Mgr.
Step 4Obtain Access to
the Account
Step 6Prepare CPA
Step 7Present CPA
Step 8Receive Signed
CPA & Start Work
Step 9Ongoing Auto-DR
Account Management
Step 6Prepare CPA
Step 7Present CPA
Step 8Receive Signed
CPA & Start Work
Step 9Ongoing Auto-DR
Account Management
Step 5 Technical Investigation for CPAStep 5a
Determine Potential Shed
Amount
Step 5bDetermine
Cost of Shed
Step 5cDetermine
Shed Strategy
Step 5dIdentify
Contract Process
Step 5 Technical Investigation for CPAStep 5a
Determine Potential Shed
Amount
Step 5bDetermine
Cost of Shed
Step 5cDetermine
Shed Strategy
Step 5dIdentify
Contract Process
Program Design and Implementation Overview
2-20 www.gepllc.com
constantly being contacted by companies claiming to represent PG&E, and some reported negative experiences from those contacts. Having the PG&E Account Manager set up the first meeting with the customer helped significantly to foster a future positive working relationship.
During meetings with the customer and the PG&E Account Manager, the Recruitment Team described the program benefits and discussed the listed accounts to determine jointly which would yield the best possible leads.
Step 2: Determine Which Accounts Are Potential Auto-DR Candidates
Many accounts that appeared at first blush as possible Auto-DR prospects were disqualified. Questions discussed with the PG&E Account Manager included: (The full set of qualifying questions is shown in Attachment B within Appendix A)
1. Was the customer signed up for DBP or CPP?
2. If not, was this planned for the near future?
Positive replies to these questions were necessary before any type of Auto-DR could be considered.
3. Did the customer have an energy management control system (EMCS), or if an industrial customer, some type of process control system capable of receiving an electronic signal and automatically shedding load?
Many accounts were disqualified from participating because they did not have an EMCS. Due to the extreme time constraints of the Program, if a prospect did not already have such equipment in operation, it was unlikely they would be able to participate in the 2007 Auto-DR season. At least one customer subsequently installed an EMCS specifically so they would be able to participate in the following season Auto-DR Program.
4. Did the customer have an energy manager that could understand and focus on implementing Auto-DR strategies?
Implementing Auto-DR takes a high degree of customer cooperation and understanding of its energy use. It also requires sustained customer focus and project management attention. Customers who are knowledgeable of their facilities’ equipment are able to quickly determine if Auto-DR will be advantageous and are more likely to champion its implementation. If the customer had no one on its staff with this job responsibility, no one for whom it was a high priority, or no one providing outsourced facilities management capability, it proved very difficult to successfully implement Auto-DR.
Step 3: Obtain Access to the Account
The Recruitment Team was dependent on the PG&E Account Manager for assistance in setting up a meeting with the customer. In most cases where the PG&E Account Manager was willing to help with introductions, the Auto-DR recruitment campaign was successful. In roughly half of the accounts, however, the PG&E Account Manager was not willing to have his/her customer approached. The Recruitment Team respected the Account Managers’ need for account control, and if the Account Manager did not support moving forward with the program, the Recruitment Team did not attempt to contact the customer and focused recruitment on other accounts.
Some of the identified reasons for the PG&E Account Manager not being willing to make introductions included:
• He/she did not believe Auto-DR would work. • He/she had other proposals in front of the customer and did not want them distracted by Auto-DR. • He/she fundamentally did not support PG&E’s corporate strategy of using other firms, such as Global
Energy Partners, to administer and implement PG&E programs. • There was no incentive for PG&E Account Managers to support the implementation of Auto-DR. • PG&E had no goals that related to the deployment of Auto-DR for the Account Managers.
In most cases, however, no reason for lack of cooperation was given.
Cooperation between the Recruitment Team and the PG&E Account Managers was essential for a successful customer outcome. Unfortunately, as a result of an effort to offer customers “choice,” PG&E Account

Program Design and Implementation Overview
Global Energy Partners, LLC 2-21
Managers have been forced to cooperate with many competing outside entities. Customers commonly complained that they were “besieged” with calls from firms claiming to be PG&E “partners” and offering complicated programs. Many described low levels of satisfaction with the service they received from these firms. Inevitably, this ultimately reflected badly on PG&E. Given this background, it is understandable why some Account Managers were reluctant to introduce the Auto-DR Recruitment Team to their customers.
Some PG&E Account Managers chose to not introduce Auto-DR in any of their accounts and refused to participate in any way with the Program. If the PG&E Account Manager took this stance, there was not much recourse available to the Recruitment Team. This eliminated a significant number of accounts and focused the recruitment effort on accounts whose Account Managers were cooperative.
There was also no obvious benefit or incentive to the PG&E Account Manager to encourage his customer to participate. As a result, other than through good will and emphasizing that Auto-DR was “doing the right thing for California” there was not much a Recruitment Manager could do to encourage a reluctant PG&E Account Manager to cooperate.
The Program would benefit greatly from providing an incentive for PG&E Account Managers to encourage their customers to implement Auto-DR. This is a very important recommendation for any Auto-DR program redesign. Also helpful would be an appropriate escalation procedure for how to address the issue of non helpful PG&E Account Managers with PG&E management.
Step 4: The First Customer Meeting
The purpose of the first meeting was to explain the Auto-DR program to the customer, and determine if there was sufficient interest, load, energy management capability and possible shed to justify future steps.
Once a customer had been contacted, usually with the assistance of the PG&E Account Manager, a meeting was set up. It was helpful if the customer included his/her technical facilities manager at the meeting. Depending on the complexity of the customer, the Recruiting Team member could also invite a Technical Coordinator, or a technical representative from LBNL to accompany them on the call. In about half the cases, the PG&E Account Manager also chose to attend the first meeting.
First meetings were usually 1-2 hours in length. By the end of the first meeting, the Recruitment Team member was able to reach a conclusion as to whether or not follow-up steps would be pursued. If the customer had sufficient load to merit participation in the program, appeared to meet the technical requirements, and had interest in pursuing participation, the next steps would be followed.
Throughout the rest of the process, it was very important that the Recruitment Team member and the Technical Coordinator work very closely together and maintain frequent and open communications.
Step 5: Technical Investigation
The purpose of Step 5 of the recruitment process was to do the following:
a. Establish how much shed would be possible. This information is needed to prepare the Customer Participation Agreement (CPA).
As part of presales activities, the customer was asked to fill out a site questionnaire (see Attachments A and B within Appendix A) that asked specifics about the HVAC system, lighting, processes, etc. If required, the Technical Coordinator could meet with the customer and explore the specifics of their system. The Technical Coordinator, or Global Energy Partners’ technical staff, sometimes would also need to visit several customer facilities and perform measurements to develop the information needed to estimate load shed. In total, depending on the complexity and availability of the needed information, this process could take days to months to complete.
GEP then used the collected data as input for the computer model developed for the Program. The output result would be the load shed number used for the CPA agreement.
The load shed number was significant for a few reasons. First, the size of the first two customer participation incentive payments was determined by the amount of the official estimated shed. If the forecasted shed was lower than the actual shed, the customer could not make up the difference for these two payments unless an amendment to the CPA was drafted. If it was higher, an amendment to the CPA

Program Design and Implementation Overview
2-22 www.gepllc.com
was also required. Second, GEP had a shed goal for the season. The “official” shed amount was used to determine if GEP accomplished its goal.
b. Determine how much material and labor would be needed to implement the shed. (Also required for the CPA).
The Technical Coordinator or Recruitment Team also worked with the customer’s control company to determine a fair price for labor and material to enable the shed. The TC was responsible for determining the proposed amount was fair and justifiable.
c. Determine the shed strategy.
The Technical Coordinator, the Recruitment Team, or both in concert worked with the customer’s facilities staff and the controls contractor to determine a productive, agreed upon shed strategy. Examples of shed strategy considerations were whether the shed would be based on a Global Temperature Adjustment in certain areas, and what floors and buildings could and could not participate.
The customer could identify areas of a building, such as those containing lab animals, or a data center, where it was impossible to shed load. The Technical Coordinator, with input from the customer, needed to determine a shed strategy that both addressed the need for a demonstrable shed, and did not jeopardize the customer’s operations or ongoing business.
d. Identify the contract process
The Recruitment Team worked with the customer to determine the contract process. Questions which needed to be answered included:
• Who has the authority to sign the CPA? • What is the review process for the CPA? (Does it need to be reviewed by the legal department?) • To whom should the payments be made? (In some cases, the customer wanted GEP to make the
Installation Incentive payment directly to a third-party contractor.)
Step 6: Prepare the CPA
The Recruitment Team was responsible for preparing the documentation for the CPA. For more information on the CPA and the TI/TA, see Section 2.1.
Step 7: Present the CPA to the customer and modify contract as needed.
The CPA and other required documentation was either hand delivered to the customer, emailed as a PDF file, or sent by overnight carrier. After the CPA had been received, the Recruitment Team was responsible for explaining the CPA to the customer and for addressing any required changes or modifications to the contract. In most cases, customers required relatively minor modifications.
Step 8: Receive the signed CPA agreement and start contracted work
Once the customer returned a signed CPA, account responsibility shifted from the Recruitment Team to the Technical Coordinator. The Technical Coordinator was then tasked with ensuring that the controls work proceeded smoothly, the shed strategy was deployed, and that the customer successfully implemented Auto-DR. Originally, it was envisioned that the Recruitment Team would be engaged with the account through the time of contract signing. After the contract was signed, the TC would take over account responsibility and the Recruitment Team would go on to recruit the next customer. It became clear to the Project Team that this vision created gaps in the management of accounts.
Step 9: Ongoing Auto-DR Account Management
Ongoing customer account management was needed to ensure that Auto-DR was successfully deployed and supported. The Recruitment Team found that on-going account management is required throughout the life of the contract. Inevitably, despite the best of intentions and efforts, there are bumps along the Auto-DR road. Systems do not shed as intended, controls vendors do not perform as expected, schedules need to be adjusted, etc. The Recruitment Team had frequently developed a rapport with the customer, both at the working and at the executive level and was often needed to work with both the customer and Technical Coordinator through the Auto-DR testing process. The Technical Coordinator is typically a technical person who has the skills to address the technical challenges of the account.
Program Design and Implementation Overview
Global Energy Partners, LLC 2-23
Auto-DR is not a trivial technology to install. It frequently requires a trial and error methodology to find the right balance between what is comfortable for the customer and energy savings. This requires ongoing customer communications, at both the technical and the executive level. To make the project a success, and to ensure customer satisfaction, it became imperative for the Recruitment Team member to stay involved with the account on an ongoing basis. In situations where this did not occur, problems with customer expectations and performance frequently developed. When ongoing account management is not available there is increased risk that customers will became frustrated and disenchanted with the Program.
Transitioning the Recruitment Team into an ongoing Auto-DR Account Management role once the CPA has been signed, would ensure high levels of Auto-DR participation and customer satisfaction.
The Selection Process: Determining which Account to Pursue
Based on the experience gained through the Pilot Phase it was understood that some industry types would be better able to shed load than others. In general, the Recruitment Team focused on the following types of accounts:
Legacy Accounts – Most had had prior success with Auto-DR and were delighted to join the formal program and qualify for incentives. Initially, the Recruitment Team believed it would be quite easy to convert the Legacy Accounts to the current program. In fact, for a variety of reasons, it turned out to be more labor intensive and time consuming than initially believed.
Retail – Retail businesses, especially those in buildings built in the last ten years, were excellent candidates for Auto-DR. These companies were keenly aware of the energy costs and very focused on reducing their energy needs. Also, they usually had staff who intimately understood the energy use of the operations. In particular, the large chain stores proved to be excellent candidates.
Industrial – Due to their potentially immense loads, industrial customers were excellent candidates. A small DR reduction could yield a high potential payoff. In particular, process manufacturers of steel recycling and chemicals turned out to be great candidates since shutting down and restarting did not involve high costs.
Office Buildings – DR for large office buildings is well understood and proven. In general, small upward global temperature adjustments of a few degrees yielded positive Auto-DR results. These are relatively low risk environments to implement Auto-DR.
City and State Agencies – Public agencies are strongly motivated to participate in Auto-DR to be good citizens and neighbors. The Recruitment Team had good results marketing to this segment.
Types of Customers that Showed Less Benefit
Small loads – Customers with loads under 500 kW frequently could not shed enough to justify the expense of installing the required Auto-DR equipment. In general, the Recruitment Team focused on customers with higher peak loads.
High Technology Manufacturing (Especially Clean Room Environments) – High tech manufacturing, and in particular, semiconductor fabricators posed special challenges for Auto-DR. There was no experience with Clean Room environments in the pilot studies. As a result, the Recruitment Team did not focus their efforts on these customers.
Areas of Biotech Companies Housing Lab Animals – Customers seemed unwilling to attempt any Auto-DR in environments housing lab animals. The potential energy savings and resulting PG&E incentive did not outweigh the perceived potential downside of negatively affecting clinical drug trials. The Recruitment Team was unable to convince any companies to deploy Auto-DR in areas with lab animals.
Data Centers – Although buildings that housed data centers successfully participated in the program, the areas that actually shed were not supporting servers. They typically were used to house offices and other work areas. Data center servers are significant energy users and should be considered potential candidates for Auto-DR once more case studies have been published.
Hotels – Hotels also proved to not be fruitful ground for Auto-DR. Hotel management seemed unwilling to implement any Auto-DR activities in guest rooms due to concerns with guest comfort. Auto-DR benefits in common areas were not shown to be sufficient to offset the expense of implementation.

Program Design and Implementation Overview
2-24 www.gepllc.com
Hospitals –The Recruitment Team did pursue some opportunities at hospitals. However, the PG&E Account Managers had little success with gaining interest in DR programs in general, so they were not aggressively pursued.
The Project Team expects that increased experience with wider breath of industry types will likely raise the universe of potential customers.
Why Some Auto-DR Candidates Do Not Sign Up
In addition to the issues described above, some customers fail get to the point of an executed CPA for other reasons:
Amount of proposed shed is not sufficient to merit further resources – In several cases customers appeared to have significant opportunity to shed load. In fact, however, after a more detailed analysis was performed, they were shown to have far less shed potential than originally believed. Facility managers are often reluctant to consider shedding in areas that may result in employee or customer complaints. As a result, a hotel that was willing to shed in public areas was unwilling and unable to consider any shed amount in guest rooms. A similar situation occurred in a biotech company that decided that most of its buildings would not be able to participate due to concerns about affecting ongoing clinical trials.
Expense of shed cannot be justified given expense of Auto DR equipment and labor – Several customers were able to produce sheds; however, the expense required to install their Auto-DR equipment could not be covered by the Program. It is difficult to estimate these costs before an in-depth analysis has been performed.
Competitive offers from other PG&E “agents” – In a few cases, customers were approached by other PG&E entities including aggregators and vendors offering other flavors of DR programs. Several customers chose to pursue other offers that were perceived as more lucrative.
Facilities manager too busy with other more pressing issues to focus on Auto-DR – This was a relatively common reason given as to why a customer did not want to pursue Auto-DR. Many companies have cut their facilities departments down to the bone; other have outsourced to organizations such as Jones, Lang, LaSalle. Implementing Auto-DR takes time and attention, especially from the facilities management team. If the team is stretched in too many conflicting directions, Auto-DR may be seen as too time intensive to pursue.
Receipt of TA/TI funds prior to 2007 – Several candidates were willing to sign up for Auto-DR but were ineligible due to receipt of TA/TI funds in the past. Their ineligibility was uncovered during the recruitment process, creating irritation for the customers..
2.5 TECHNICAL COORDINATION RECRUITMENT AND TRAINING STEPS One important step in the overall success of the Automated Demand Response project was identifying and training firms to fulfill the task of “Technical Coordinator” (TC) for the project. The primary energy management goal of the project was to automate the initial load shed of 15MW (later revised to 20 MW). Originally, the Auto-DR team estimated that approximately 200 sites would need to participate in the program in order to meet the initial 15MW objective. Enabling and supporting the 200 sites would involve the Project Team, including the TCs. In order to identify, hire and train TCs, the Project Team defined and followed a set of steps targeted at developing this resource.
Step 1 – Identify Technical Support Requirements of Auto-DR Program
The Project Team determined that the program needed a technical resource, available to both the Project Team and PG&E customers to coordinate the technical activities required to automate the load shed of each site. At the beginning of the program, the project team identified a list of tasks that TCs would be responsible for performing.
• Communicate with facilities manager(s) The TC was responsible for explaining its involvement in the 2007 Auto-DR program and explaining the steps required to enable each site. If the customer was not currently enrolled in a DR program, the TC is responsible for helping the customer determine which PG&E DR program (CPP and/or DBP) was best suited for the site. The TC was responsible for meeting with PG&E Account Manager and assist
Program Design and Implementation Overview
Global Energy Partners, LLC 2-25
customer with incentive paperwork. In practice, as an Appendix to the CPA, the incentive paperwork was prepared by the Recruitment Team.
• Conduct Auto-DR assessment The TC was responsible for identifying the Auto-DR load shed strategies suitable for the site and assist customer with understanding said strategies. The TC was also responsible for estimating the potential kW reduction based on the recommended load shed strategies
• Assess EMCS connectivity and interface The TC was responsible for determining the best way of connecting to the DRAS, either via a CLIR box or Web Services Client communications. The TC was responsible for assessing the customer’s metering technology, EMCS (Energy Management Control System) and internet infrastructure like firewalls/proxy considerations.
• Design Sequence of Operations (SOO) The TC was responsible for working with the facility manager to design the automated sequence suitable for programming into the site’s EMCS in order to implement the recommended load shed strategies.
• Facilitate programming of EMCS to implement the automated sequence of operations The TC was responsible for assisting the customer with contracting a programming contractor. If a programming contractor was involved, then the TC would obtain quotes, manage the contractor by reviewing the sequence of operations, explain interconnectivity requirement of the DRAS to the EMCS and verifying that all programming is accurately implemented.
• Facilitate installation of the CLIR box (if necessary) The TC was responsible for the interconnectivity between the EMCS and the DRAS, either via a CLIR box or Web Services Client communications (Software Client). The TC was to perform the installation itself, subcontract with an electrician, or assist the customer install the technology with their own electrician.
• Perform complete Auto-DR system test to ensure all components of the system are functioning properly The TC would confirm that the automated sequence of operations was properly implemented and could deliver a load reduction that was in line with estimates. The TC would coordinate all tests and if the building did not perform as designed, the TC would resolve any problems. The TC was also responsible for remaining in contact with the customer and provide any necessary technical support as needed during the DR season (May 1 to October 31).
• Report impacts due to each DR event The TC would develop a baseline demand for each facility and after each event, evaluate the load shed to determine if the DRAS-EMCS interconnect and shed strategies were functioning properly.
Step 2 - Develop Qualification Criteria for Technical Coordinators
After the TC responsibilities were identified, the Auto-DR team developed minimum qualifications for personnel and firms. As a result, the Minimum Qualification list was generated to identify firms or personnel capable of fulfilling the TC role.
Minimum Qualifications:
• Ability to support customers in PG&E service territory through local personnel; • Experience with building energy systems including, but are not limited to, lighting, HVAC equipment
and systems, hot water systems, energy management and control systems; • Experience related to Engineering / Service / Integration or Design of Building Automation Systems
(BAS) and/or Energy Management Control Systems (EMCS); • Understanding of facility power distribution schemes for lighting and building controls; • Information Technology (IT) – (Basic Knowledge to coordinate with site IT manager, IP Addresses,
Proxy servers, etc); • Project Management Skills related to Building Automation System design, commissioning, maintenance,
and service; • Experience with power metering and instrumentation; • On-site and phone support to resolve any associated service requirements for the installed Auto-DR
sites. • Additional Qualifications Considered an Asset
Program Design and Implementation Overview
2-26 www.gepllc.com
• Familiarity with ASHRAE 90.2, ASHRAE 62, Title 24 and other related energy efficiency standards; • Previous experience with demand response applications; • Previous experience in estimating energy profiles for facilities and loads; • Previous experience servicing BAS and/or EMCS systems; • Area (Northern California) distributor of BAS and/or EMCS a plus, but not necessary; • Successful management of 10 energy management-related projects over the last 5 years.
Step 3 – Research Potential TC Firms
The third step was to identify the type of firms that best fit the qualifications. As a result the project team focused their efforts on contacting the following types of companies:
a. California Energy Commission (CEC) Demand Response Auditors (19 firms) b. PG&E Technical Assistance (TA) Auditors (12 firms) c. Energy Management Control System (EMCS) Integrators (54 firms) d. DR Aggregator Firms (2 firms)
Besides hiring and educating any type of company to perform the role of TC, the Project Team targeted EMCS integrators with existing customer base in hopes that they would offer the Auto-DR program to those customers. The incentive to do so was an additional $40/kW for recruitment. Even though some TCs offered CPP or DBP to their customers, only one TC brought customers into the program in this manner.
In this step, the Project Team was able to identify approximately 70 firms that matched most of the qualifications set forth in Step 2.
Step 4 – Develop Request for Qualifications (RFQ), TC Application, and Presentation
Since the goal of this task was to hire firms for the role of Technical Coordinator, the Auto-DR team developed documents to promote the project and to contractually obligate firms. The result of this task was the creation of a TC presentation, TC application, and TC contract.
Step 5 – Technical Coordinator Webcast
After potential TC firms were identified and contacted by the Auto-DR team, a notification was created by PG&E and sent to all potential TC firms. The objective of the webcast was to provide interested firms information on the Auto-DR program and how they could become a Technical Coordinator. A one and a half hour webcast was held on March 13, 2007. It was attended by 23 firms. The following topics were covered during the webcast:
a. Overall Auto-DR program description/background b. Auto-DR incentive structure and opportunities c. Description of technical coordinator responsibilities d. Steps for becoming a qualified technical coordinator
As a result of the webcast, the Auto-DR Project Team received four applications.
Step 6 – Interview Applicants
After all the applications were received, the Project team reviewed applications and held interviews. As a result eight companies put under contract to fulfill the role of the TC. Four of the eight companies participated in the Auto-DR program.
Step 7 – Technical Coordinator Training
In an effort to train the newly hired TCs, the project team developed and held a 1.5-day training course on May 1 and 2, 2007 at PG&E’s San Ramon Valley Conference Center. The goal of the TC training course was to teach the TCs the intricacies of the Auto-DR technologies, PG&E DR programs, baseline calculations, program tools (like InterAct™) and other topics listed in the course outline below. All TC firms were required to attend the course. Companies involved with preparing and presenting the training material were; GEP, LBNL/DRRC, EPRI, Akuacom, and C&C Automation.
TC Training Course Outline
a. Overall Program Description/Background

Program Design and Implementation Overview
Global Energy Partners, LLC 2-27
b. Auto-DR Incentive Structure and customer recruitment opportunities c. Overview of Auto-DR Site Requirements - CPP Rate - Demand Bidding Program - EMCS d. Step-by-step description of TCs responsibilities (review of Procedures for 2007 Auto-DR Technical
Coordinator) e. Demand baseline issues f. Load shed strategies and estimation methodology a. Discuss load-shed identified in LBNL/DRRC 2006 Final Report b. Estimation of Load Shed c. DR automation systems a. DRAS (with DEMO) b. CLIR c. EMCS d. Case studies from previous sites
- HVAC - Lighting e. Guidelines for program paperwork and incentive applications
- Terms and Conditions - Incentive application and payment process
Course Feedback
Eight TC firms attended and provided feedback to the training. Feedback is summarized in Table 2-3.
Table 2-3 TC Training Evaluation Summaries
Feedback from the TCs regarding overall effectiveness of the training course Criteria Excellent Very good Good Fair Poor N/A Feedback Summation
11 36 19 6 2 1
Feedback from the TC regarding the relevance of the presentation’s content
Criteria Strongly Agree
Agree Neutral Disagree Strongly Disagree
N/A
Feedback Summation
11 17 4
Course Evaluations
The following comments were made in the evaluation survey by TC attendees.
• “Need more time on the case-study economics section.” • “Examples of a TC role from start to finish, including typical time required by the TC would be helpful
in understanding time requirements.”
2.6 TECHNOLOGY INCENTIVE PROCESS The TA/TI program consists of a Technology Incentive (TI) component that reimburses the customer for their costs to install and enable the demand response equipment. In the context of the Auto-DR program, the TI incentives are comprised of four components:
a. Recruitment: This TI component compensates qualified outside vendors who have existing business relationships with customers that are able to bring the customer far enough along such that they agree to participate in the Auto-DR program. The Recruitment incentive amount is $40 per estimated kW demand reduction.
b. Technical Coordination (TC): This TI component compensates qualified outside vendors who perform the technical tasks necessary to ensure that the Auto-DR systems are properly installed,

Program Design and Implementation Overview
2-28 www.gepllc.com
enabled, validated, and tested. Further, the TC has the responsibility for maintaining contact with the customer throughout the DR season to ensure that the load reductions are continuing to be realized. The TC must meet three milestones to receive the payment including validation and testing, first successful DR event, and end of DR season. The TC incentive amount is capped at $70 per kW demand reduction.
c. Equipment: This TI component reimburses customers for the costs associated with the installation of the Auto-DR enablement equipment. The Equipment incentive amount is capped at $140 per estimated kW demand reduction.
d. Participation: This TI component compensates the customer for their participation in the Auto-DR program. The customer must meet three milestones to receive the payment, including validation and testing, first successful DR event, and end of DR season. The Participation incentive amount is $50 per kW demand reduction.
A customer is comprised of one or more PG&E service accounts. In its contract with GEP, PG&E earmarked TI funds that were to be disbursed according to a series of triggers as defined by PG&E. The four triggers are defined below, in the sequence in which they are processed by PG&E:
• TI Application (TIA): When GEP submits a completed TI application and it is approved by PG&E, this trigger is pulled and the payment is made to GEP by the PG&E Integrated Processing Center (IPC). The element that is included for the TIA payment is the recruitment costs, if any. The cap for TIA is $40/kW. GEP in turn pays the recruitment vendor the full amount. The kW amount is based on the estimate load reduction provided during the TIA. If there are no recruitment costs, then the TIA is zero.
• Equipment Installation (EQI): When GEP submits a report that documents that the Auto-DR equipment is installed and the validation/testing of that equipment performance, this trigger is pulled and the payment is made to GEP by the IPC. The elements that are included for the EQI payment are first part of the TC costs (subject to a $30/kW cap), the full equipment costs (subject to a $140/kW cap), and the first part of the customer’s participation incentive (subject to a $12.50/kW cap). GEP in turn pays the TC, the customer and a third-party vendor (as directed by the customer). The kW amount is based on the estimated load reduction provided during the TIA.
• First DR Event (1DR): When GEP submits a report that documents that the customer has successfully participated in its first DR event of the season, this trigger is pulled and the payments are made to GEP by the IPC. The elements that are included for the 1DR payment are the second part of the TC costs (subject to a $20/kW cap) and the second part of the customer’s participation incentive (subject to a $12.50/kW cap). GEP in turn pays the TC and the customer. The kW amount is based on the estimated load reduction provided during the TIA. If a customer was enabled after the DR season concluded, then the 1DR is made based on the validation of the successful system test conducted during the enablement stages.
• End of DR Season (EOY): When GEP submits a report that documents that the customer participated in a full DR season, this trigger is pulled and the payments are made to GEP by the IPC. The elements that are included for EOY payment are the third part of the TC costs (subject to a $20/kW cap) and the third part of the customer’s participation incentive (subject to a $30/kW cap). GEP in turn pays the TC and the customer. The kW amount is based on the actual average load reduction as experienced during the DR season. If a customer was enabled after the DR season concluded, then the EOY is made based on the validation of the successful system test conducted during the enablement stages. If the customer achieved a load reduction during the DR season that was greater than their estimated reduction amount, the customer would receive a higher EOY payment. Conversely, if the load reduction was less than the estimate, the customer would receive a lower EOY payment. All EOY payments are capped such that the full TI costs cannot exceed the $300/kW maximum TI payment for Auto-DR. The TC costs cannot exceed the $20/kW cap, however if the customer’s achieved load reduction was less than the estimated reduction amount, then the TC would be subject to a lower EOY payment cap.

Program Design and Implementation Overview
Global Energy Partners, LLC 2-29
2.7 TECHNICAL STEPS TOWARD CUSTOMER ENABLEMENT The first step in enabling Auto-DR customers was to define activities for enabling automated demand response at PG&E customer facilities, referred to as “site(s)” in this section. The TC procedures developed by the Auto-DR team are illustrated as a flowchart in Figure 2-5.

Program Design and Implementation Overview
2-30 www.gepllc.com
Figure 2-5 Technical Coordinator Procedures for Enabling Auto-DR Sites
Program Design and Implementation Overview
Global Energy Partners, LLC 2-31
The activities defined by the Auto-DR team and followed by the Technical Coordinators illustrated above are listed below and detailed in the following sections. Activities may occur simultaneously, may overlap, or may be carried out in a different order than shown below.
• Activity 1 - Automated Demand Response Technical Coordinator
• Activity 2 - Contact customer
• Activity 3 - Conduct Auto-DR Facility Assessment
• Activity 4 - Assess Building Automation System (BAS) and/or Energy Management Control System (EMCS) connectivity and interface to the Demand Response Automation server
• Activity 5 - Assist the customer to complete Technical Incentives (TI) paperwork
• Activity 6 - Facilitate the design of the automated sequence of operations
• Activity 7 - Facilitate programming of the BAS or EMCS to implement the automated sequence of operations
• Activity 8 - Facilitate installation of the CLIR box (Auto-DR program hardware)
• Activity 9 - Assist the Project Team to perform complete Auto-DR system test to ensure all components of the system are functioning properly
• Activity 10 - Assist the Project Team to track and evaluate the performance of the Auto-DR systems
It was anticipated that a TC could also qualify as a recruiter for the Auto-DR Program by facilitating customers’ signing a Customer Participation Agreement with GEP. In these cases, the TC had to establish a separate agreement with GEP for the recruitment portion of the work.
A survey of the TCs regarding their experiences with the steps for enabling Auto-DR customers was fielded at the end of the 2007 Auto-DR Program. Survey responses received from the TCs, from which the reported observations and lessons learned are derived, are shown in Appendix H.
Activity 1 - Automated Demand Response Technical Coordinator
The first activity, TC Training is detailed in section 2.5. TC Training was designed to introduce the TCs to the Auto-DR team (GEP, LBNL/DRRC, Akuacom, EPRI, and C&C Automation), technologies and steps to work with the team to apply the technologies. Figure 2-6 is a picture taken during the second day of the TC training at San Ramon Valley Conference Center.
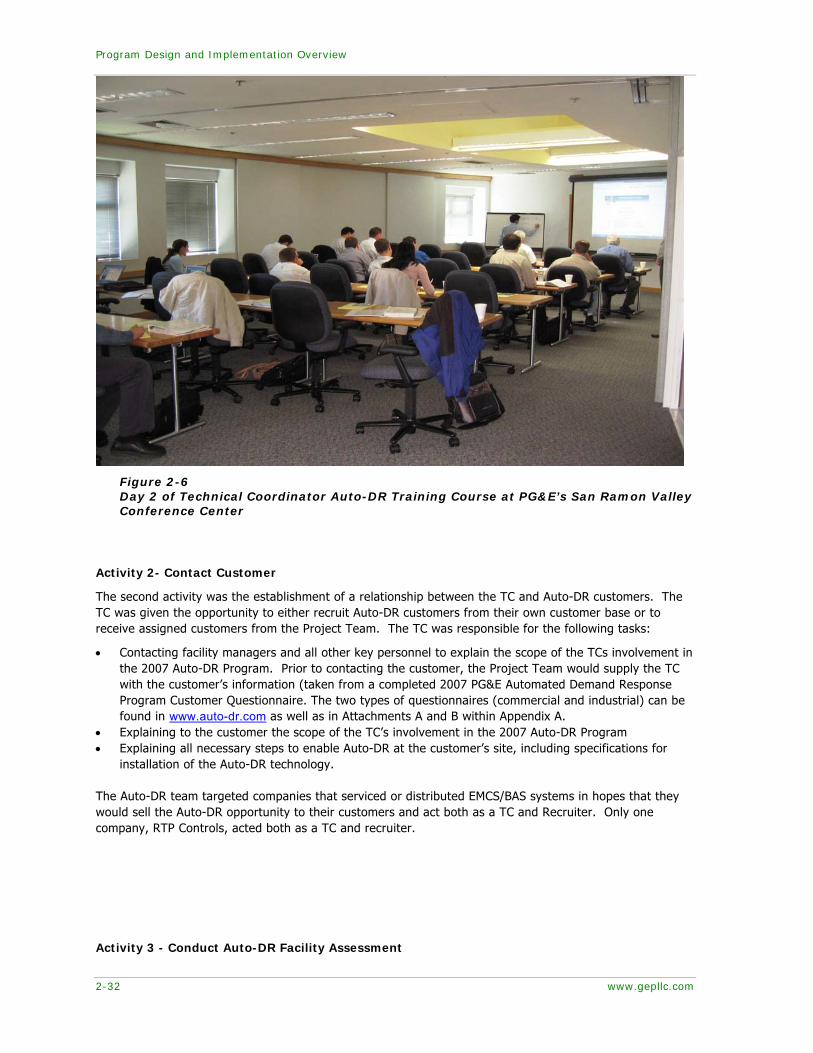
Program Design and Implementation Overview
2-32 www.gepllc.com
Figure 2-6 Day 2 of Technical Coordinator Auto-DR Training Course at PG&E’s San Ramon Valley Conference Center
Activity 2- Contact Customer
The second activity was the establishment of a relationship between the TC and Auto-DR customers. The TC was given the opportunity to either recruit Auto-DR customers from their own customer base or to receive assigned customers from the Project Team. The TC was responsible for the following tasks:
• Contacting facility managers and all other key personnel to explain the scope of the TCs involvement in the 2007 Auto-DR Program. Prior to contacting the customer, the Project Team would supply the TC with the customer’s information (taken from a completed 2007 PG&E Automated Demand Response Program Customer Questionnaire. The two types of questionnaires (commercial and industrial) can be found in www.auto-dr.com as well as in Attachments A and B within Appendix A.
• Explaining to the customer the scope of the TC’s involvement in the 2007 Auto-DR Program • Explaining all necessary steps to enable Auto-DR at the customer’s site, including specifications for
installation of the Auto-DR technology. The Auto-DR team targeted companies that serviced or distributed EMCS/BAS systems in hopes that they would sell the Auto-DR opportunity to their customers and act both as a TC and Recruiter. Only one company, RTP Controls, acted both as a TC and recruiter.
Activity 3 - Conduct Auto-DR Facility Assessment

Program Design and Implementation Overview
Global Energy Partners, LLC 2-33
The third activity was to perform an Auto-DR assessment for each facility. The goal of this assessment was to verify that the load shed strategies recommended by GEP during the customer recruitment stage would optimize the kW potential of each site. Tasks for Activity 3 are defined below.
• GEP providing the TC with a list of recommended load shed strategies and estimated potential kW reduction that were developed during the customer recruitment stage. The shed strategies were part of the Customer Participation Agreement and mostly completed by the Recruiter of each site.
• Performing an assessment of the load-shed strategies suitable for each Auto-DR site. The TC addressed the following questions: a. Are the strategies recommended by GEP for the customer feasible? b. Do the shed strategies have the potential to meet the load shed objectives? c. Are any other strategies suited for the site?
• Verifying the potential kW reduction based on the load-shed strategies provided by GEP (This may require the TC to come up with its own demand reduction estimates.)
• Providing GEP with a report of findings based on the assessment and verification of Auto-DR load-shed strategies (called the “Auto-DR Assessment Report”)
• Being responsible to help the customer understand the recommended load shed strategies. Most of the sites that participated in the Auto-DR program had participated in previous Demand Response programs. This meant that for most Auto-DR customers, loads and their associated kW were already part of a manual DR shed procedure and the task for the new Auto-Dr program was to assess the ability of these loads to be shed automatically.
The approach that GEP generally took in defining load-shed strategies was that GEP researched what DR strategies the sites implemented manually in the past. Then GEP would recommend that the same manual DR strategies be automated. If a customer had never implemented DR strategies, then GEP would help sites develop Auto-DR strategies by obtaining each site’s input on what could or couldn’t be shed.
In the end, the Auto-DR strategies that GEP recommended were analyzed for kW shed potential, and then the strategies and shed estimates were defined in the Customer Participation Agreement (CPA). When GEP assigned a TC to the Auto-DR site, the only documentation that was given to the TC was the CPA.
To better assist the TCs, more information should be provided to help the TC better understand the site’s requirements. Additional information that TCs should receive includes:
a. Type of Auto-DR program, (i.e. Auto-CPP or Auto-DBP) b. Detailed Sequence of operations that detail all load shed strategies as well as the time of day that
each strategy will be implemented. c. The load shed estimate for each time period (e.g. 12-3 pm and 3-6 pm for CPP; and for each 1-
hour block that the customer is planning to bid in DBP).
Activity 4 - Assess Building Automation System (BAS) and/or Energy Management Control System (EMCS) connectivity and interface to the Demand Response Automation server
The fourth activity assigned to the TC was to assess the connectivity and interface requirements for each of their assigned sites. The TC was responsible for the following tasks.
- Assess the facilities power metering equipment and metering communication capability; - Assess the facilities internet access for DRAS connectivity; - Determine how the DRAS will connect to the EMCS (via CLIR box in most cases); - If the CLIR box is used, determine if the EMCS has available digital inputs available (three
minimum); - Determine if firewall/proxy considerations need to be made. If necessary TC worked with the
facility’s personnel to assure connectivity; - Work with the facility’s personnel and/or building controls service provider to identify the best
location to install the CLIR box (if a CLIR box is to be used). The CLIR box should be located close to both the building controller’s input module and the internet;
Program Design and Implementation Overview
2-34 www.gepllc.com
- Determine the requirements for installing the CLIR box. If necessary, including facilitating the customer’s contracting of an electrician and/or the facility’s personnel to perform the installation;
The TCs recommend that a one page description of the CLIR box be available to address concerns of the facility’s IT department. The one page description of the CLIR box should include basic functional descriptions, example code, polling interval and bandwidth requirements of both the CLIR box and Web Services Client.
Activity 5 - Assist the customer to complete Technical Incentives (TI) paperwork
The fifth activity involved assisting the customer to complete and submit all required Auto-DR incentives paperwork. The installation of Auto-DR equipment cannot proceed before the incentive applications are processed by GEP. This required the TC to follow up on the status of the incentive applications.
The completion and submittal of the TI paperwork was performed by the Recruitment Team, since it was an Appendix to the Customer Participation Agreement (CPA). The role of the TC in the activity became one of checking on the status of the paperwork.
Activity 6 - Facilitate the design of the automated sequence of operations
The sixth activity involved designing an automated sequence that is suitable for programming into the facility’s control system in order to implement the recommended load-shed strategies. The TC was responsible for:
- Facilitating the conversion of the load-shed strategies into a sequence of operations for each site. The sequence of operations is a site-specific detailed plan of action to automate the load-shed strategies via the facility’s building automation system (BAS) or energy management control system (EMCS). If necessary, the customer would subcontract an EMCS contractor to assist the TC in the design of the sequence of operation;
- Testing the system operation and response based on designed sequence of operations (with assistance from the building controls contractor if necessary);
- Assessing requirements for programming the sequence into the EMCS, including needs for contracting an EMCS programming contractor.
Activity 7 - Facilitate programming of the BAS or EMCS to implement the automated sequence of operations
The seventh activity involved designing the sequence of operations (load shed strategy procedure) and facilitating their programming. The TC was responsible for the following tasks:
1. If customer did not have in-house expertise, the customer may have needed to subcontract with a programming contractor based on the sequence of operations requirements. The TC would facilitate and assist the customer in this process.
2. If a building controls programming contractor was involved, then the TC would: a. Review required sequence of operations with contractor; b. Explain the connectivity requirements to interface with the Auto-DR Program hardware
(typically via a CLIR box); c. Prepare a report that documents the sequence of operations, and required programming and
hardware changes to the control system to automate the load-shed strategies; d. Obtain proposal from contractor; check for completeness; e. Verify that the contractor adequately completed the programming task.
If data trending is available through the control system, confirm that data trending is set up. Variables used in the sequence of operations would be trended, such as:
1. CLIR Input;
2. Key process variables, such as temperature, that would be used for troubleshooting and historical verification.

Program Design and Implementation Overview
Global Energy Partners, LLC 2-35
It was anticipated that a TC could also qualify as an Auto-DR system installer and/or EMCS programming contractor. In these cases, the TC had to seek a separate contract directly with the customer for the installation/programming portion of the work.
Activity 8 - Facilitate installation of the CLIR box (Auto-DR program hardware)
The eighth activity involved the installation of the Auto-DR hardware at each site. When facilities had a control system that could interface with DRAS directly they may not have required a CLIR box. The TC was responsible for facilitating the installation of the Auto-DR communication hardware and integration into each facility’s building control system. TC Tasks for Activity 8 are listed below:
a. The Project Team provided a CLIR box for each site the needed one. The TC was responsible for ensuring delivery of CLIR box to the customer;
b. Programming the CLIR box by confirming box ID, location, username, and password with DRAS manager;
c. Facilitate and assist the customer with the installation of the CLIR box (via subcontractor or the facility’s in-house staff). If a subcontractor was involved, the TC would verify that the contractor adequately completes the task;
d. Set up the CLIR box; e. Confirmed that the CLIR box and DRAS were communicating properly.
Three out of four TCs had two options of Auto-DR enabling technologies, the CLIR box or Web Services Client. One of the TCs had three options, the CLIR box, Web Services Client, plus a second device similar to the functions of the CLIR box but with more options. The decision to use one Auto-DR technology over another is based on:
a. Site’s (Facility Manager, IT Department, Electricians, Technicians) understanding of Auto-DR technology options
b. Site requirement (number of loads and shed levels, annunciation options, time of day or day of week over-ride options, etc)
c. TC’s ability to explain, program, troubleshoot and support Auto-DR technologies d. Building/Process controller options (available I/O, modules to support Web Services Client)
Only 9% of the sites selected the Web Services Client to receive automated DR events from the DRAS. One TC indicated that they do not have internal resources capable of programming or resolving Web Services Client problems. This year, Akuacom and LBNL/DRRC helped support Web Services Clients on the DRAS side, while Auto-DR sites used controller technicians or internal personnel. A resource dedicated to support Web Services Clients should be considered for 2008.
The breakdown of sites, their Auto-DR technologies, DR Program, Technical Coordinator, and Client enabled with 2007 TA/TI funds are listed in Table 2-4.
Table 2-4 Summary of Auto-DR Technologies Used by TC to Enable Sites
CPP DBPCPP & DBP CLIR
WS Client
C&C 2982 87,798.72$ 29 41 17 22 1 15 2EPS 15175 67,020.86$ 4 3 3 3ACCO 1568 65,244.66$ 42 13 12 3 1RTP 2874 201,030.00$ 70 25 25 1Total 22599 421,094$ 19 82 17 62 1 21 4
TC FirmkW
enabled Payments ($) $/kWNumber of Sites
DR Program Client
In addition to evaluating the use of Web Services Client and CLIR boxes, the TCs provided information as to how the CLIR boxes were installed. At most facilities, electricians installed power, the IT department installed network cabling and provided IP information, while the TC configured the units.

Program Design and Implementation Overview
2-36 www.gepllc.com
Activity 9 - Assist the Project Team to perform complete Auto-DR system test to ensure all components of the system are functioning properly
The ninth activity involved assisting the Project Team with testing and verifying that the actual load-shed (kW) met or exceeded the estimated load-shed. The objective of these tests was to confirm that the automated sequence of operations was properly implemented and could deliver a load reduction in-line with estimates provided by the Project Team. The TCs were responsible for:
a. Notifying the Project Team and the site Facilities Manager that the site was ready for testing (any testing would need to be coordinated with the Facilities Manager to minimize building occupant disruptions);
b. Conducting this test remotely and on-site by the Project Team and the TC. Tests were performed to validate the Auto-DR system by verifying that load shed strategies functioned as designed.
c. Discussing the results of the test and load reduction findings with the Project Team. (Note that the test results would most likely be different from an actual DR event day, since the outside air temperature would likely be different).
d. Resolving technical problems identified by these tests through return visits to the customer site.
The TCs and the Project Team performed an on-site verification test for all customers. All sites were required to demonstrate their load-shed capability.
Activity 10 - Assist the Project Team to track and evaluate the performance of the Auto-DR systems
The tenth activity involved supporting all sites during the DR season. The TCs were responsible for supporting their customers throughout the demand response season (May 1 through October 31, 2007). The TCs were responsible for:
a. Remaining in contact with customer and provide any necessary technical support as needed during the DR season;
b. Managing technical problems that arise during the DR season and which may require the TC to make return visits to the customer site;
c. Submitting to GEP weekly summary reports detailing the progress and status of each customer. d. Submitting to GEP a report that documents any and all changes made to each facility (called the
“Auto-DR Post-Installation Report”). The report needed to include a description of the Auto-DR strategies that would be implemented at the facility, as well as a documentation of any programming and/or modifications to the facility’s control system. The report needed to be submitted within 30 days of the completed Auto-DR hardware installation and/or programming of the facility’s control system.
In the questionnaire presented to all TCs, all stated that they followed up after each event to make sure that the sites were shedding their targeted loads. However, the TCs also claimed that they did not have access to Itron’s InterAct™ where the load shed data was stored. The TCs also stated that when their sites requested performance data after DR events, they could not provide this data because they didn’t have access to InterAct™. Most TCs suggested that sites be notified after each event with an automated email from InterAct™ that contains a statistical analysis of their site’s load shed performance.
General Observations
The TCs played an important role in the 2007 Auto-DR program. All TCs that participated in PG&E’s Auto-DR project reported that they enjoyed being part of this historical project and that they would like to participate in the 2008 program. The knowledge gained by the TCs in 2007 will benefit future Auto-DR programs and future customers.
Project documentation showed that Auto-DR Technical Coordinator hours required for customer enablement and support varied from a low of two hours to a high of 1,136 hours (with this customer consisting of 25 sites for an average of 45 hours per site). Across all sites, the average TC time was 46 hours.
Customers whose TC is a value of zero are legacy customers.
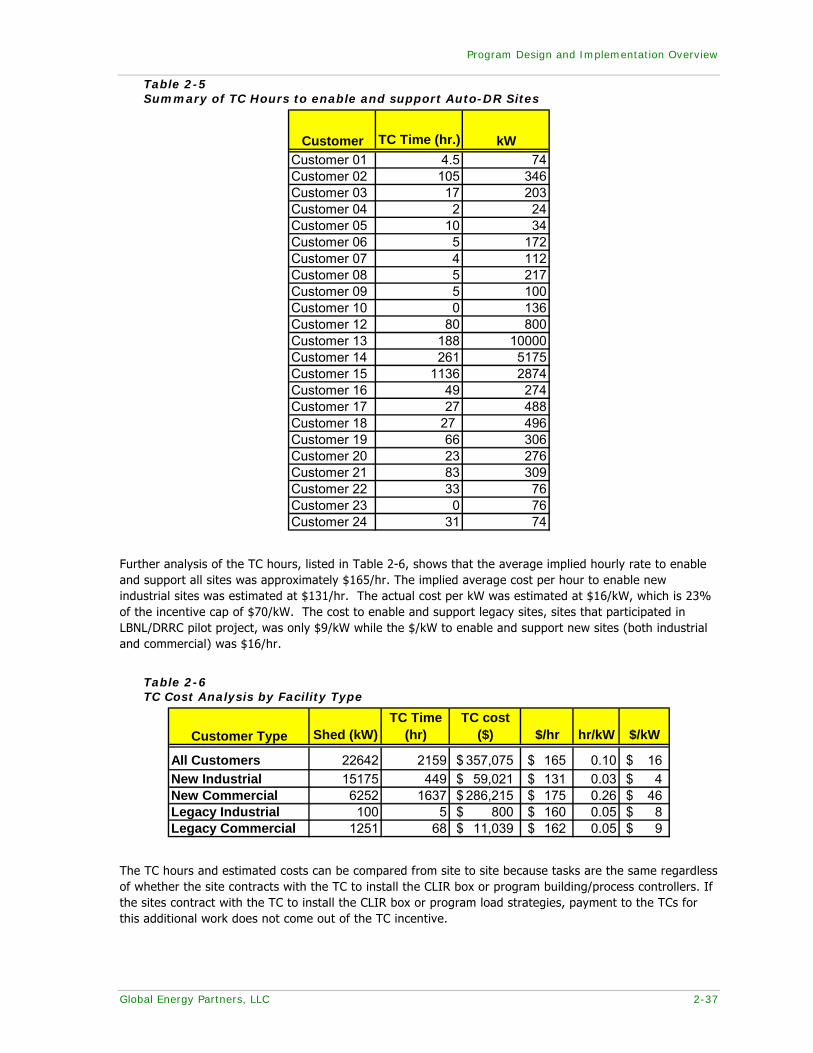
Program Design and Implementation Overview
Global Energy Partners, LLC 2-37
Table 2-5 Summary of TC Hours to enable and support Auto-DR Sites
Customer TC Time (hr.) kWCustomer 01 4.5 74Customer 02 105 346Customer 03 17 203Customer 04 2 24Customer 05 10 34Customer 06 5 172Customer 07 4 112Customer 08 5 217Customer 09 5 100Customer 10 0 136Customer 12 80 800Customer 13 188 10000Customer 14 261 5175Customer 15 1136 2874Customer 16 49 274Customer 17 27 488Customer 18 27 496Customer 19 66 306Customer 20 23 276Customer 21 83 309Customer 22 33 76Customer 23 0 76Customer 24 31 74
Further analysis of the TC hours, listed in Table 2-6, shows that the average implied hourly rate to enable and support all sites was approximately $165/hr. The implied average cost per hour to enable new industrial sites was estimated at $131/hr. The actual cost per kW was estimated at $16/kW, which is 23% of the incentive cap of $70/kW. The cost to enable and support legacy sites, sites that participated in LBNL/DRRC pilot project, was only $9/kW while the $/kW to enable and support new sites (both industrial and commercial) was $16/hr.
Table 2-6 TC Cost Analysis by Facility Type
Customer Type Shed (kW)TC Time
(hr)TC cost
($) $/hr hr/kW $/kW
All Customers 22642 2159 357,075$ 165$ 0.10 16$ New Industrial 15175 449 59,021$ 131$ 0.03 4$ New Commercial 6252 1637 286,215$ 175$ 0.26 46$ Legacy Industrial 100 5 800$ 160$ 0.05 8$ Legacy Commercial 1251 68 11,039$ 162$ 0.05 9$
The TC hours and estimated costs can be compared from site to site because tasks are the same regardless of whether the site contracts with the TC to install the CLIR box or program building/process controllers. If the sites contract with the TC to install the CLIR box or program load strategies, payment to the TCs for this additional work does not come out of the TC incentive.
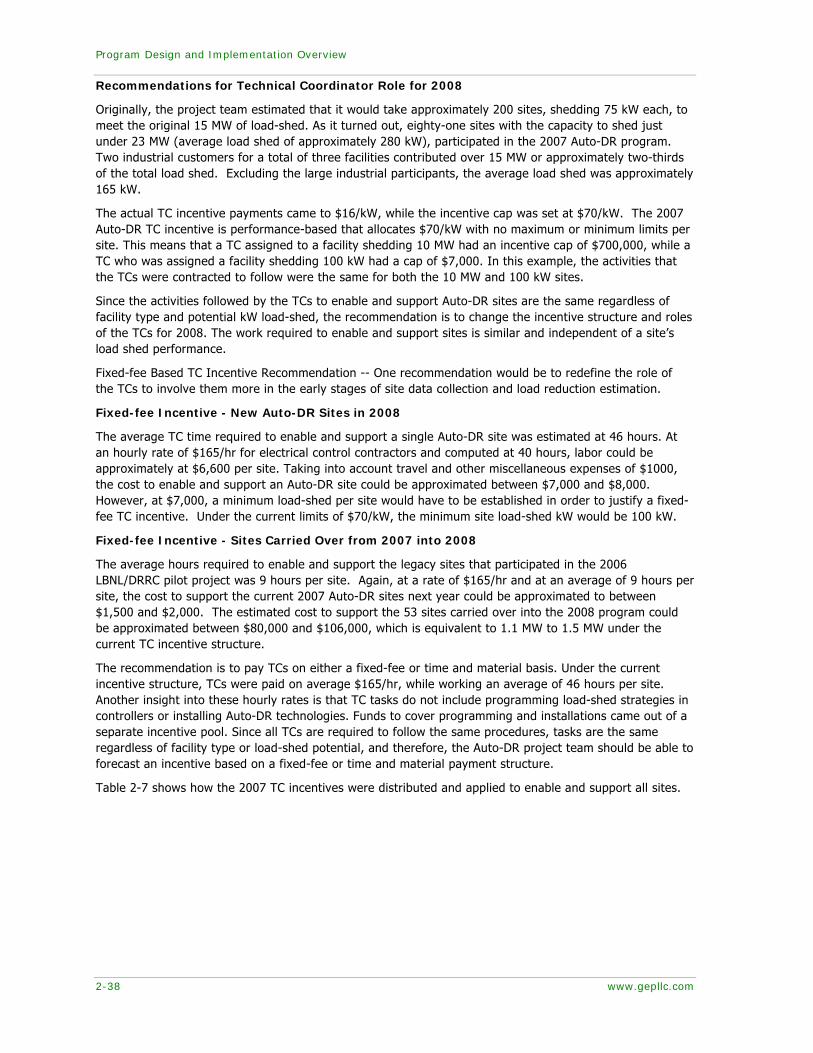
Program Design and Implementation Overview
2-38 www.gepllc.com
Recommendations for Technical Coordinator Role for 2008
Originally, the project team estimated that it would take approximately 200 sites, shedding 75 kW each, to meet the original 15 MW of load-shed. As it turned out, eighty-one sites with the capacity to shed just under 23 MW (average load shed of approximately 280 kW), participated in the 2007 Auto-DR program. Two industrial customers for a total of three facilities contributed over 15 MW or approximately two-thirds of the total load shed. Excluding the large industrial participants, the average load shed was approximately 165 kW.
The actual TC incentive payments came to $16/kW, while the incentive cap was set at $70/kW. The 2007 Auto-DR TC incentive is performance-based that allocates $70/kW with no maximum or minimum limits per site. This means that a TC assigned to a facility shedding 10 MW had an incentive cap of $700,000, while a TC who was assigned a facility shedding 100 kW had a cap of $7,000. In this example, the activities that the TCs were contracted to follow were the same for both the 10 MW and 100 kW sites.
Since the activities followed by the TCs to enable and support Auto-DR sites are the same regardless of facility type and potential kW load-shed, the recommendation is to change the incentive structure and roles of the TCs for 2008. The work required to enable and support sites is similar and independent of a site’s load shed performance.
Fixed-fee Based TC Incentive Recommendation -- One recommendation would be to redefine the role of the TCs to involve them more in the early stages of site data collection and load reduction estimation.
Fixed-fee Incentive - New Auto-DR Sites in 2008
The average TC time required to enable and support a single Auto-DR site was estimated at 46 hours. At an hourly rate of $165/hr for electrical control contractors and computed at 40 hours, labor could be approximately at $6,600 per site. Taking into account travel and other miscellaneous expenses of $1000, the cost to enable and support an Auto-DR site could be approximated between $7,000 and $8,000. However, at $7,000, a minimum load-shed per site would have to be established in order to justify a fixed-fee TC incentive. Under the current limits of $70/kW, the minimum site load-shed kW would be 100 kW.
Fixed-fee Incentive - Sites Carried Over from 2007 into 2008
The average hours required to enable and support the legacy sites that participated in the 2006 LBNL/DRRC pilot project was 9 hours per site. Again, at a rate of $165/hr and at an average of 9 hours per site, the cost to support the current 2007 Auto-DR sites next year could be approximated to between $1,500 and $2,000. The estimated cost to support the 53 sites carried over into the 2008 program could be approximated between $80,000 and $106,000, which is equivalent to 1.1 MW to 1.5 MW under the current TC incentive structure.
The recommendation is to pay TCs on either a fixed-fee or time and material basis. Under the current incentive structure, TCs were paid on average $165/hr, while working an average of 46 hours per site. Another insight into these hourly rates is that TC tasks do not include programming load-shed strategies in controllers or installing Auto-DR technologies. Funds to cover programming and installations came out of a separate incentive pool. Since all TCs are required to follow the same procedures, tasks are the same regardless of facility type or load-shed potential, and therefore, the Auto-DR project team should be able to forecast an incentive based on a fixed-fee or time and material payment structure.
Table 2-7 shows how the 2007 TC incentives were distributed and applied to enable and support all sites.
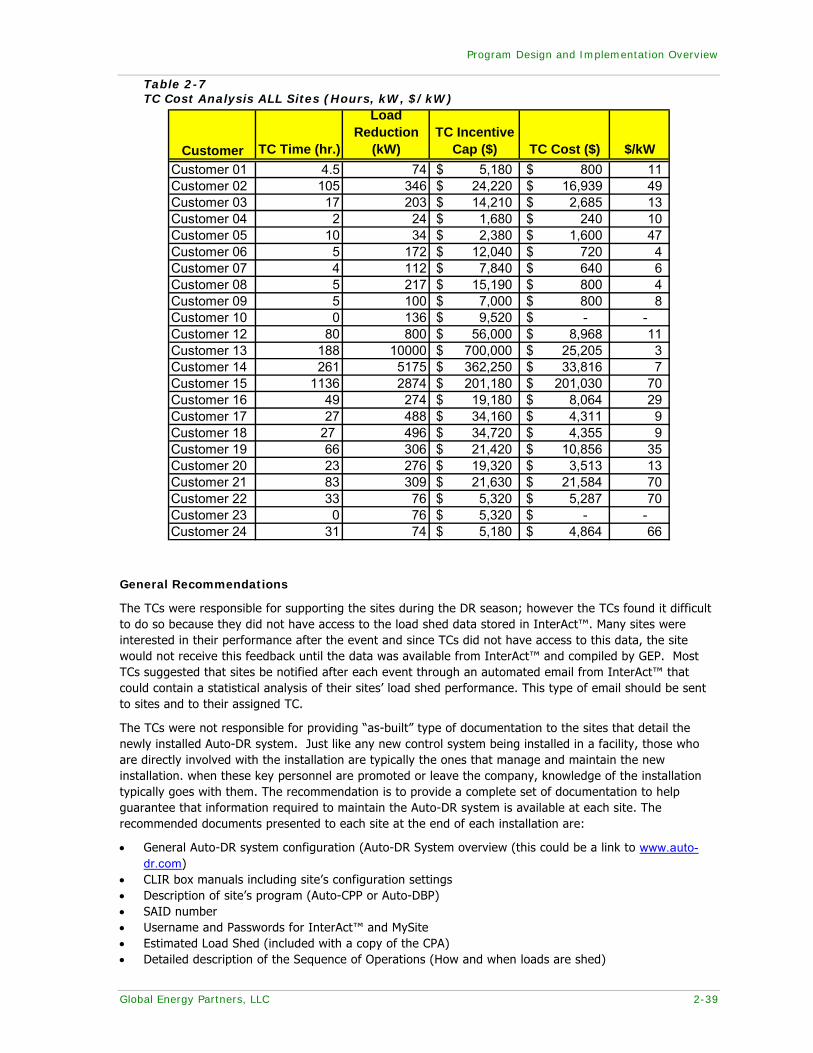
Program Design and Implementation Overview
Global Energy Partners, LLC 2-39
Table 2-7 TC Cost Analysis ALL Sites (Hours, kW, $/kW)
Customer TC Time (hr.)
Load Reduction
(kW)TC Incentive
Cap ($) TC Cost ($) $/kWCustomer 01 4.5 74 5,180$ 800$ 11 Customer 02 105 346 24,220$ 16,939$ 49 Customer 03 17 203 14,210$ 2,685$ 13 Customer 04 2 24 1,680$ 240$ 10 Customer 05 10 34 2,380$ 1,600$ 47 Customer 06 5 172 12,040$ 720$ 4 Customer 07 4 112 7,840$ 640$ 6 Customer 08 5 217 15,190$ 800$ 4 Customer 09 5 100 7,000$ 800$ 8 Customer 10 0 136 9,520$ -$ - Customer 12 80 800 56,000$ 8,968$ 11 Customer 13 188 10000 700,000$ 25,205$ 3 Customer 14 261 5175 362,250$ 33,816$ 7 Customer 15 1136 2874 201,180$ 201,030$ 70 Customer 16 49 274 19,180$ 8,064$ 29 Customer 17 27 488 34,160$ 4,311$ 9 Customer 18 27 496 34,720$ 4,355$ 9 Customer 19 66 306 21,420$ 10,856$ 35 Customer 20 23 276 19,320$ 3,513$ 13 Customer 21 83 309 21,630$ 21,584$ 70 Customer 22 33 76 5,320$ 5,287$ 70 Customer 23 0 76 5,320$ -$ - Customer 24 31 74 5,180$ 4,864$ 66
General Recommendations
The TCs were responsible for supporting the sites during the DR season; however the TCs found it difficult to do so because they did not have access to the load shed data stored in InterAct™. Many sites were interested in their performance after the event and since TCs did not have access to this data, the site would not receive this feedback until the data was available from InterAct™ and compiled by GEP. Most TCs suggested that sites be notified after each event through an automated email from InterAct™ that could contain a statistical analysis of their sites’ load shed performance. This type of email should be sent to sites and to their assigned TC.
The TCs were not responsible for providing “as-built” type of documentation to the sites that detail the newly installed Auto-DR system. Just like any new control system being installed in a facility, those who are directly involved with the installation are typically the ones that manage and maintain the new installation. when these key personnel are promoted or leave the company, knowledge of the installation typically goes with them. The recommendation is to provide a complete set of documentation to help guarantee that information required to maintain the Auto-DR system is available at each site. The recommended documents presented to each site at the end of each installation are:
• General Auto-DR system configuration (Auto-DR System overview (this could be a link to www.auto-dr.com)
• CLIR box manuals including site’s configuration settings • Description of site’s program (Auto-CPP or Auto-DBP) • SAID number • Username and Passwords for InterAct™ and MySite • Estimated Load Shed (included with a copy of the CPA) • Detailed description of the Sequence of Operations (How and when loads are shed)
Program Design and Implementation Overview
2-40 www.gepllc.com
Importance of Industrial Sites
Since industrial facilities contributed the majority of load shed to the 2007 Auto-DR program, focus should be applied to incentives designed to entice and enable industrial facilities to join the Auto-DR program. Industrial facilities are unlike commercial facilities in that industrial loads are typically customized to a particular process with a demand profile that follows a production schedule, whereas commercial building loads are common and their demand profile is predictable from site to site. Industrial sites that participated in the Auto-DR program did so because they either had production capacity, a product accumulator, or both. With these enabling articles, industrial facilities were able to shed load by either reducing throughput or stopping production altogether. The recommendation is to bring more industrial facilities into the Auto-DR program by:
a. Researching incentive opportunities that would directly increase production capacity or product accumulation capacity.
b. Market to and inform industrial facilities of how they can use their capacity and/or product accumulators to participate in DR programs
2.8 TESTING AND VERIFICATION PROCEDURES The materials and discussion for this section are contained in Chapter 10 and Attachment D of Appendix A. They present the Auto-DR procedures for site setup, test, and operation as well as the detailed verification procedure for CPP and DBP customers. A clear and understandable set of procedures was key to streamlining the implementation and management of the Auto-DR Program.
2.9 OPERATIONS DURING DEMAND RESPONSE EVENTS LBNL and Akuacom trained GEP personnel to function as the DRAS operator during the 2007 Auto-DR season. This involved managing the DRAS, issuing Auto-DR test events to CPP and DBP customers, and monitoring the customers’ participation and performance during Auto-DR events. In addition to the fulfillment of its operator duties, GEP was also responsible for other activities that were required in its role as the Auto-DR program implementer.
GEP followed procedures that can be described separately for the following:
a. Pre-DR event activities; b. Operations during DR events; c. Post-DR event process.
Pre-DR Event Activities
GEP was responsible for conducting everyday monitoring of the DRAS and clients in its role as the DRAS operator. Specifically, GEP monitored the status of each of the CPP and DBP customers to make sure that they were online and that DRAS was able to communicate with the clients should there be a CPP or DBP event. Whenever a client was found to be offline, GEP notified the technical coordinator (TC) assigned to that customer and asked the TC to investigate the problem.
GEP assigned a total of five persons in the operator role so that there would always be one person available to serve as the operator and monitor the DRAS and clients on any given day. The operators regularly checked the status of all the DRAS clients at the following times during each weekday: 9 AM, 12 PM, 2 PM, and 5 PM.
PG&E called a total of twelve (12) CPP event days and only one DBP test event during the summer of 20073. For all of these events, PG&E issued an event notification during the morning of the day before the actual event and the Project Team always had at least 24 hours to make any necessary preparations for the actual event.
Due to GEP’s routine checking of the DRAS and client status on a daily basis, communication problems between the DRAS and clients or other issues related to the client software/hardware were always
3 The one DBP event called by PG&E occurred on August 30, 2007. This was a test event because PG&E only requested bids during the 2 PM to 6 PM timeframe instead of the normal eight-hour period between 12 PM and 8 PM.

Program Design and Implementation Overview
Global Energy Partners, LLC 2-41
identified well in advance of the actual events. When there were problems, GEP notified the appropriate TC and the TC and/or the Project Team were able to resolve the problem in all cases.4 There were no instances where an Auto-DR customer could not participate in a CPP or DBP event due to a problem with the DRAS or client infrastructure.
Operations during DR Events
During an actual CPP or DBP event, GEP always ensured that there was at least one person on duty as the DRAS operator throughout the entire day. The operator(s) on duty was responsible for monitoring the DRAS and status of all the clients at frequent intervals throughout the day (approximately every half hour) in order to verify that:
a. there were no issues related to loss of communications between the DRAS and its clients; b. if the client went offline, then the TC and customer would be notified immediately so that the
problem was resolved as soon as possible; and c. DRAS sent out the appropriate event pending and shed signals (moderate or high shed levels) at
the appropriate time.
At the end of the CPP and DBP events, the operator verified that the DRAS returned the status of each DRAS client to “normal” (no load shed) mode.
In actuality, the Project Team did not encounter an instance where the DRAS and client infrastructure was problematic during an actual CPP and DBP event day in 2007.
Post-DR Event Process
GEP was responsible for tracking the load shed performance of each Auto-DR customer. To accomplish this task, GEP employed the following process after each CPP and DBP event during 2007:
a. For each customer, GEP downloaded the 15-minute interval meter (kW) data for the event day from the PG&E InterAct™ system. GEP also downloaded the CPP or DBP baseline data for the event day from the PG&E InterAct™ system.
b. GEP used the InterAct™ event day load data and CPP/DBP baseline load data to compute the customer’s load shed. This is the load shed relative to the CPP/DBP baseline.
c. GEP used the InterAct™ event day load data and CPP/DBP baseline load data to develop a CPP or DBP baseline with morning adjustment.5 GEP then computed the customer’s load shed relative to the CPP/DBP baseline with morning adjustment.
d. Using the customer’s historical load data and event day data from InterAct™, and outside air temperature data from the National Oceanic & Atmospheric Administration (NOAA), GEP developed a third baseline called the outside air temperature baseline with morning adjustment.6 GEP then computed the customer’s load shed relative to the air temperature baseline with morning adjustment.
e. GEP prepared a load shed summary report for each customer that tracks the load shed relative to each of the three baseline methodologies for all of the CPP and DBP events in 2007.
GEP was also responsible for soliciting feedback from all of the Auto-DR customers after each CPP and DBP event. This post-event activity is described in Section 2.2.
4 See Section 4.2 for more discussion of the issues encountered during the 2007 implementation related to the DRAS and client infrastructure. 5 See Section 2.1 for more details of the CPP/DBP baseline with morning adjustment. 6 See Section 2.1 for more details of the outside air temperature baseline with morning adjustment.

Global Energy Partners, LLC 3-1
CHAPTER 3
RECRUITMENT AND PARTICIPATION RESULTS
In order to meet the Program’s demand reduction goals, the 2007 Auto-DR Program re-engaged customers who participated in the 2006 Pilot managed by LBNL/DRRC and also recruited new participants.
The 2006 Pilot Program’s 11 participants, representing 17 sites, were targeted for ongoing participation, as they had installed communication equipment, were known to be familiar with Auto-DR, and had expressed satisfaction with their participation in Auto-DR. All but one of the 2006 Pilot Program customers participated in the 2007 Program. The one customer who did not continue with Auto-DR decided to join an Aggregator program with a company that is also its customer.
3.1 AUTO-DR TECHNICAL ASSESSMENTS
Auto-DR customers undertook three general types of DR measures in order to reduce their load. These measures were temperature adjustments, lighting reductions, and process system adjustments. All non-industrial customers undertook HVAC measures for DR, with about one-third of these undertaking lighting measures. Table 3-1 summarizes the various measures undertaken by customers.
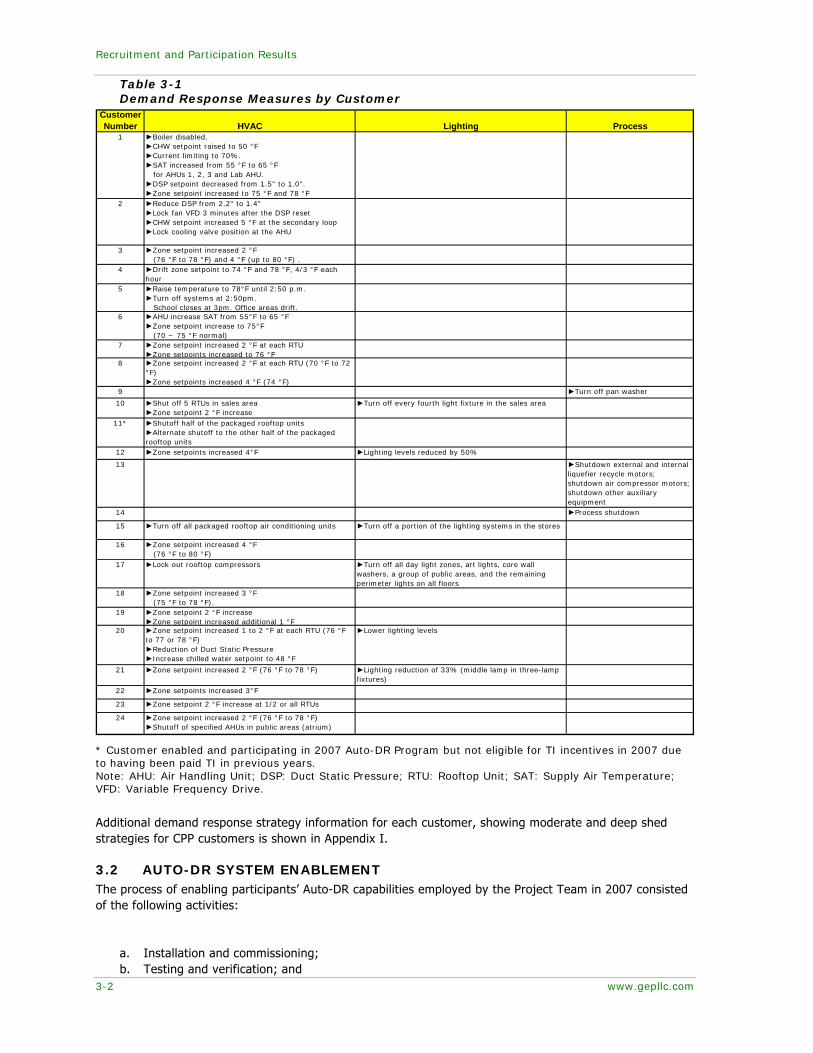
Recruitment and Participation Results
3-2 www.gepllc.com
Table 3-1 Demand Response Measures by Customer
Customer Number HVAC Lighting Process
1 ►Boiler disabled.►CHW setpoint raised to 50 °F►Current limiting to 70%. ►SAT increased from 55 °F to 65 °F for AHUs 1, 2, 3 and Lab AHU.►DSP setpoint decreased from 1.5" to 1.0".►Zone setpoint increased to 75 °F and 78 °F
2 ►Reduce DSP from 2.2" to 1.4"►Lock fan VFD 3 minutes after the DSP reset►CHW setpoint increased 5 °F at the secondary loop►Lock cooling valve position at the AHU
3 ►Zone setpoint increased 2 °F (76 °F to 78 °F) and 4 °F (up to 80 °F) .
4 ►Drift zone setpoint to 74 °F and 78 °F, 4/3 °F each hour
5 ►Raise temperature to 78°F until 2:50 p.m.►Turn off systems at 2:50pm. School closes at 3pm. Office areas drift.
6 ►AHU increase SAT from 55°F to 65 °F►Zone setpoint increase to 75°F (70 ~ 75 °F normal)
7 ►Zone setpoint increased 2 °F at each RTU►Zone setpoints increased to 76 °F
8 ►Zone setpoint increased 2 °F at each RTU (70 °F to 72 °F)►Zone setpoints increased 4 °F (74 °F)
9 ►Turn off pan washer
10 ►Shut off 5 RTUs in sales area►Zone setpoint 2 °F increase
►Turn off every fourth light fixture in the sales area
11* ►Shutoff half of the packaged rooftop units►Alternate shutoff to the other half of the packaged rooftop units
12 ►Zone setpoints increased 4°F ►Lighting levels reduced by 50%
13 ►Shutdown external and internal liquefier recycle motors; shutdown air compressor motors; shutdown other auxiliary equipment
14 ►Process shutdown
15 ►Turn off all packaged rooftop air conditioning units ►Turn off a portion of the lighting systems in the stores
16 ►Zone setpoint increased 4 °F (76 °F to 80 °F)
17 ►Lock out rooftop compressors ►Turn off all day light zones, art lights, core wall washers, a group of public areas, and the remaining perimeter lights on all floors
18 ►Zone setpoint increased 3 °F (75 °F to 78 °F).
19 ►Zone setpoint 2 °F increase►Zone setpoint increased additional 1 °F
20 ►Zone setpoint increased 1 to 2 °F at each RTU (76 °F to 77 or 78 °F)►Reduction of Duct Static Pressure►Increase chilled water setpoint to 48 °F
►Lower lighting levels
21 ►Zone setpoint increased 2 °F (76 °F to 78 °F) ►Lighting reduction of 33% (middle lamp in three-lamp fixtures)
22 ►Zone setpoints increased 3°F
23 ►Zone setpoint 2 °F increase at 1/2 or all RTUs
24 ►Zone setpoint increased 2 °F (76 °F to 78 °F)►Shutoff of specified AHUs in public areas (atrium)
* Customer enabled and participating in 2007 Auto-DR Program but not eligible for TI incentives in 2007 due to having been paid TI in previous years. Note: AHU: Air Handling Unit; DSP: Duct Static Pressure; RTU: Rooftop Unit; SAT: Supply Air Temperature; VFD: Variable Frequency Drive.
Additional demand response strategy information for each customer, showing moderate and deep shed strategies for CPP customers is shown in Appendix I.
3.2 AUTO-DR SYSTEM ENABLEMENT The process of enabling participants’ Auto-DR capabilities employed by the Project Team in 2007 consisted of the following activities:
a. Installation and commissioning; b. Testing and verification; and

Recruitment and Participation Results
Global Energy Partners, LLC 3-3
c. Trouble-shooting and corrective actions.
The results of each of these Auto-DR system enablement activities are discussed in the following sections.
Installation and Commissioning
Once a customer signed a Customer Participation Agreement, GEP assigned a technical coordinator (TC) to the customer. Legacy customers already had their Auto-DR system installed and enabled in 2006, which limited the TC to ensuring that the previously enabled Auto-DR systems still functioned and responded appropriately to the signals from DRAS.7 For new customers in 2007, it was the TC’s responsibility to ensure that the Auto-DR system was installed and enabled at the customer’s site(s). Table 3-2 provides a summary of the Auto-DR system installed and enabled by the end of the 2007 project. It shows that a total of 23 customers (11 legacy and 12 new) comprising 81 separate customer accounts (17 legacy and 64 new), were Auto-DR enabled.
Table 3-2 Auto-DR system Installed and Enabled
Customer Category Number of Customers Number of Customer Accounts
Legacy from 2006 11 17 New in 2007 12 64 Total 23 81
Table 3-3 shows the breakdown of customers that enabled communications between DRAS and their controls system by using a software client or CLIR.
Table 3-3 Breakdown of Type of Client Device
Customer Category Type of Client Device Number of Customers Software Client 2
Legacy from 2006 CLIR 9 Software Client 2
New in 2007 CLIR 10
Total 23
Most of the new customers in 2007 contracted third-party controls contractors to complete the work required for Auto-DR system enablement, with the TC providing the coordination. The controls contractors were responsible for making any necessary upgrades to the controls system, programming the controls system to implement the sequence of operations during an Auto-DR event, and installing the software client or CLIR. However, two of the new customers (Customer 14 and Customer 15) contracted the TC to perform the installation and enablement work. Also, two of the new customers (Industrial Plant 1 and Government Building 4) actually performed the work using their in-house staff.
Commissioning of the Auto-DR system was performed by the party that completed the installation and programming of the system. The TC assigned to the customer was responsible for ensuring that proper commissioning of the Auto-DR system was completed such that the system responded appropriately to the load shed signals from DRAS and the programmed sequence of operations executed as expected should there be a demand response event. In 2007, there was one instance during which the TC observed some problems with the customer’s Auto-DR system (Customer 18) during testing, and requested that the customer’s controls contractor perform additional commissioning of the system.
Testing and Verification
7 Some of the legacy customers employed a previous-generation relay device that had to be upgraded to a CLIR. In these cases, the TC swapped out the old device and replaced it with a CLIR in 2007 as part of the services provided to the customers.

Recruitment and Participation Results
3-4 www.gepllc.com
Legacy customers that participated in Auto-DR in 2006 were required to participate in a two-hour test at the beginning of the Auto-DR season in 2007. Most of the legacy customers were tested on May 7, 2007. However, a few legacy customers needed an upgrade to the CLIR (from the previous-generation relay device), and this group of legacy customers was tested on May 23, 2007 (after the TC completed the upgrades). DRAS sent the event pending signal to the legacy customers’ client devices on the day ahead of the test, the moderate shed signal during the first hour (Noon to 1PM) of the test, and the high shed signal during the second hour (1PM to 2PM) of the test.
After a new customer’s Auto-DR system has been installed and commissioned, the TC notified GEP that the customer was ready for the two-hour test. The TC also informed GEP of the test date that all relevant parties (the customer, the controls contractor, and the TC) could attend onsite. In its role as the DRAS operator, GEP then scheduled the test on DRAS. Regardless of whether the customer is on CPP or DBP, GEP always scheduled the test during the two hours between Noon and 2PM. DRAS then sent the event pending signal to the customer’s client device on the day ahead of the test, the moderate shed signal during the first hour of the test, and the high shed signal during the second hour of the test. However, there was one instance where the customer (Data Center 2/ Com. Off. 2) requested that the test be conducted during the period from 5PM to 8PM, and the Project Team was able to accommodate this request. GEP personnel also attended the two-hour tests at the new customers’ sites.
Some customers have multiple facilities (and service accounts) that are controlled centrally from a central system. In these cases, it was not possible for the TC and GEP personnel to visit all of the sites during the two-hour test. As such, the TC and GEP remotely verified the performance of the sites that could not be visited by observation at the central controls and confirmation of the load shed using InterAct™ data from the test day whenever possible.
The TC and GEP personnel have the following verification objectives during a two-hour test:
a. Verify that the controls contractor completed installation of the CLIR or software client and programming of the control system as stated in their work order;
b. Verify that the CLIR or software client properly received the signals from DRAS; c. Verify that the customer’s control system responded appropriately to the DRAS signals and
executed the sequence of operations as expected.
Trouble-Shooting and Corrective Actions
In general, customers did not encounter major problems in the Auto-DR system installation and enablement process. Every customer that signed a Customer Participation Agreement was able to become Auto-DR enabled. However, there were a few issues that the Project Team encountered during the testing and verification stage for several customers that should be noted:
• On the day of the two-hour test at Customer 24’s site, the TC and GEP discovered that the third-party controls contractor had incorrectly connected the CLIR relays to the controls system. The sequence of operations only called for utilization of the moderate shed signal (Relay #1 on the CLIR), but the contractor had the wires connected to Relay #3. This mistake was discovered by the TC and GEP, and was corrected in time to proceed normally with the test when it started at noon.
• The CLIR’s relays failed to close during the two-hour test at Customer 16. As such, the facilities’ controls system was not able to respond to the signals sent by DRAS. In order to proceed with the test, the TC implemented a temporary solution that involved “jumping” the wires to simulate the relay closure. This temporary solution allowed the customer to proceed with the test. The TC later replaced the CLIR with a new unit.
• The TC and GEP were not able to verify the execution of the sequence of operations at Customer 18’s facility during the two-hour test. The controls system installed at the facility did not allow easy observation and confirmation that the system was responding appropriately to the signals from DRAS and CLIR. Given this, GEP requested the third-party controls contractor to perform additional programming of the controls system’s user interface to allow confirmation of the implementation of the sequence of operations. After the contractor completed this work, the TC and GEP scheduled a second test. During the second test, the TC and GEP performed spot checks of some of the controllers and air-handling boxes in the building, and discovered that some of the controllers did not respond correctly to the load shed signals. GEP then requested that the controls contractor perform a thorough

Recruitment and Participation Results
Global Energy Partners, LLC 3-5
commissioning of the Auto-DR system to make sure that the problems were eliminated and would not occur in future demand response events. GEP asked the TC to perform a third test after the commissioning was completed by the controls contractor.

Global Energy Partners, LLC 4-1
CHAPTER 4
SUMMARY OF AUTO-DR TECHNOLOGY AND SOFTWARE
The Auto-DR technology performed well and was successful during the 2007 DR season, resulting in improved participant efficiency in response to DR events. An initial number of technology-related configuration and installation problems were due to the newness and ongoing development of some of the technology through the summer of 2007 and to the lack of basic Information Technology (IT) knowledge at some customers’ sites. All of these problems were resolved by targeted education, training, troubleshooting, and expansion of trained Auto-DR workforce by LBNL/DRRC, Akuacom, and GEP. In general, the technology worked well and adapted to a myriad of IT environments while proving to broad sector applicability and cost-effectiveness.
4.1 CLIR AND WEB SERVICE CLIENT PERFORMANCE At the time of this writing, 19 Auto-DR customers were using the CLIR and 4 customers were using the WS client interface. The use of total number of CLIRs was lower than originally estimated due to higher adoption by WS software clients and the original 15 MW goal met by fewer than anticipated number of customers contributing higher kW reduction. The following is a summary of key findings on the DRAS client features (CLIR and WS software DRAS client technical details are described in Appendix F):
• Both CLIR and WS software DRAS clients were used by several categories of customers including commercial, retailers, and industries.
• Test CLIRs were deployed at LBNL/DRRC, Akuacom, and GEP facilities to evaluate the infrastructure performance directly.
• The uptime for PG&E CLIRs with version 2.4.2 upgrade has exceeded 99.99% with high availability. The exceptions were network problems consisting of unreliable Internet; hostile networking environments; network security with firewalls, proxies, port-blocking, etc.; wrong networking information within enterprise network/Intranet, etc.
• The causes of a few CLIR communications dropouts were not fully known and not related to DRAS or CLIR. These problems are likely caused by poor Internet communications environments.
• Customers’ Auto-DR performance was not impacted negatively by any CLIR-related issues. • The WS Software client was customized and successfully installed by several customers.
For a summary of customers and associated programs, see the following:
• Customers and service accounts using CLIR or WS software DRAS clients (Table 2-4). • Customers and Auto-DR Technology Performance (Appendix J).
Automated Critical Peak Pricing (Auto-CPP) Customers:
For 2007, 12 Customers signed Customer Participation Agreement (CPA) with 20 service accounts to participate in the Auto-CPP program.
The DRAS clients within Auto-CPP customer networks performed reliably. Albeit there were issues with CLIRs in some customers, no program-related performance was compromised and performance with technology and in response to events was significantly good.
Automated Demand Bid Program (Auto-DBP) Customers
For 2007, 11 PG&E customers signed Customer Participation Agreement (CPA) representing 61 service accounts to participate in Auto-DBP.
Summary of Auto-DR Technology and Software
4-2 www.gepllc.com
All DBP customers successfully enabled control systems for Auto-DR. Originally the DBP day-ahead event pending signal was activated around noon. Due to the need to automate load reduction preparation by some industrial customers and the lack of features available within signaling infrastructure to distinguish consecutive day-ahead DR event notifications, the event pending signal has been programmed to be active at 9 p.m. for consecutive day-ahead events. This will enable the DR mode to return to NORMAL and event pending to be inactive after the end of a DBP event at 8 p.m. before possibly becoming active at 9 p.m.
The following requests were made by a large DBP customer and several TCs to automate notification when CLIR loses communication to DRAS. These features are presently unavailable within Auto-DR infrastructure and have been be considered or put into development:
• Customized CLIR software request from a customer to provide client-side exception signaling to map to unused relay (#7 or #8). When this feature is available, the customer would like to use it for automated “alarms” within the facility for personnel to respond.
• Automated DRAS notification, request from TCs to provide server-side exception signaling using e-mail, pager, “My-Site” warning, etc. to the operator and/or facility manager.
The DRAS clients for the Auto-DBP customers performed reliably although the program was only called once as a test event.
Program Events, Communication Logs, and Monitoring
The program event, communication logs, and monitoring features are used by the DRAS operators to track CPP and DBP programs, monitor communication devices within customer facilities, associated time stamps, and any issues with DRAS client communications. The DRAS keeps track of all CPP or DBP events issued and logs all communications between each client. Screenshots of the interface available to the operator are shown in Appendix K.
4.2 DRAS OPERATIONS SUMMARY As mentioned in Section The DRAS was operated and controlled mainly by GEP personnel and coordinated with Akuacom and LBNL/DRRC. The DRAS operations can be summarized as:
• LBNL/DRRC and Akuacom trained GEP personnel to manage DRAS, issue Auto-DR test events to CPP and DBP customers, and monitor the customers’ participation and performance during Auto-DR events. In short, GEP personnel were trained to function as the DRAS operator.
• Screenshots of DRAS for both CPP and DBP program operation are shown in Appendix K. • PG&E managed and controlled the DRAS as the primary operator with assistance from GEP. • PG&E issued twelve CPP events between May and August 2007 and one DBP test event coincident with
a CPP event day in August 2007. During this period the DRAS uptime was 100% and performed reliably.
• GEP assigned the DRAS communication (COMM) devices or hardware and software DRAS clients and access controls, including monitoring the testing of DRAS and DRAS-client connectivity.
• GEP, LBNL/DRRC, and Akuacom trained technical coordinators (TCs) on how to access the individual COMM devices on DRAS via the “My Site” webpage. This training was necessary because TCs, in turn, were required to train customers on how to opt out of events, place standing bids (for DBP customers), and change their DRAS-client passwords.
As the DRAS operator, GEP was responsible or conducting everyday monitoring of the DRAS. Specifically, GEP monitored the status of each of the CPP and DBP clients to make sure that they were online and that DRAS was able to communicate with the clients should there have been a CPP or DBP event. In the case when a client was found to be offline, GEP would notify the TC assigned to that customer and ask the TC to investigate the problem.
GEP assigned a total of five persons in the operator role so that there would always be one person available to serve as the operator and monitor the DRAS and clients on any given day. The operators regularly checked the status of all the clients at the following times during each weekday: 9 AM, 12 PM, 2 PM, and 5 PM.
Transition of DRAS Operator Functions:
Summary of Auto-DR Technology and Software
Global Energy Partners, LLC 4-3
As mentioned in Section 2.9, Akuacom and LBNL/DRRC transitioned the DRAS operator functions to GEP once appropriate training was completed. The training included topics such as:
• Creating new COMM devices on DRAS; • Assigning and changing client passwords; • Monitoring the status of the clients; • Monitoring the DRAS-client communications logs; • Issuing the communications tests and other test events; • Recognizing the DRAS-client signaling infrastructure; and • Setting up standing bids (for DBP customers).
The training of GEP personnel was conducted via webcasts by Akuacom and LBNL/DRRC. During the transition, Akuacom and LBNL/DRRC provided guidance to GEP personnel as necessary.
DRAS Operations Issues
Overall, the transition of the DRAS operator function to GEP was successful and GEP successfully served as the DRAS operator during much of the 2007 Auto-DR season. The DRAS operator duties are straightforward, and GEP did not encounter any major issues.
Some minor but noteworthy issues related to DRAS operation are:
• When assigning new COMM device names, it was necessary to select a name that would allow easy recognition of the customer and location. For example, one of the participants in 2007 was a government agency that owns two buildings that are located in two different cities. The two buildings are not connected by a common energy management control system, and thus it was necessary to assign a COMM device to each building. In this case, it was necessary to create and assign two COMM device names that would allow the DRAS operator to easily identify each client’s location.
• Related to the point mentioned above, it was necessary for GEP to keep an updated list of Auto-DR customers and their corresponding client name(s). The list also provides a mapping of each client to the assigned TC so that the operator would know which TC to notify in the case that a client went offline. In the future, a Customer Relationship Management (CRM) software tool will be available to provide easy access to this information.
• The GEP operators gained experience and performed well during the one test DBP event during the 2007 season. Additional experience will create a fuller picture of operator duties during DBP events..
• One particular DBP customer utilizes a software client that receives signals from DRAS and responds appropriately to DBP events. However, the software client was not programmed to acknowledge the DRAS polling signals. As such DRAS reports the client as being offline when in fact the client is live and available to respond to DBP event signals. In this case it is necessary for the operator to go into the DRAS communication logs to confirm that DRAS is successfully polling this client.

Global Energy Partners, LLC 5-1
CHAPTER 5
DEMAND RESPONSE EVENT RESULTS
This chapter provides the results of the demand reduction achieved in the 2007 Auto-Demand Response Program. During the demand response event period which started in May and ended in October, PG&E issued twelve CPP event days and one DBP test event day. The load sheds are reported for the ten CPP customers that participated in all twelve CPP event days and the three DBP customers that participated in the one DBP test event day.
The section begins with a discussion of the weather conditions during the demand response period and is followed by the summary results for each of the three baselines (3/10, 3/10 MA and OAT) for all of the events. In addition, the customer results for four individual event days are highlighted and discussed. Hourly demand and load shed results for each participating customer are provided in the appendices.
The chapter also includes the validation and reconciliation of the load shed that is used for the final incentive payment for each customer. Finally, the chapter concludes with the results of a comparison analysis between non-Auto-DR CPP participants and Auto-DR CPP participants.
5.1 SUMMARY OF EVENT DAYS AND CONDITIONS The Demand Response event period started on May1st and continued until October 31st. During that period, temperatures for the warmer months of June through August averaged around 90 degrees. Higher temperatures of 100 degrees and above were reached in July and August. June had one occurrence of over 100 degrees temperature.
Demand Response events are generally triggered by temperature or special alerts issued by the California Independent System Operator (ISO). On July 5th, the California ISO issued the first Flex Alert day of the summer, urging Californians to conserve energy and reduce demand on the system during the peak afternoon hours. PG&E tracks the temperatures of five California cities – Redding, Fresno, Concord, San Jose and Sacramento – for determination of demand response events. The average maximum temperature for the cities that day was 104 degrees, which triggered a CPP activation.
The ISO declared two additional Flex Alert days on August 29th and August 30th. The average temperature for the five cities was 101 degrees on August 29th and 99 degrees on August 30th. CPP events were issued on both days. One four-hour DBP test event was held on August 30th. PG&E requested bids for the 2 pm to 6 pm timeframe rather than the eight-hour period between 12 pm and 8 pm.
Table 5-1 lists the CPP event dates and the average high temperature for that day. Figure 5-1 displays the average temperatures for the five cities from June through August. The CPP event days, as identified by the boxes, are also shown on the graph. August was the hottest month, with an average temperature of 91 degrees. PG&E issued twelve CPP events during the summer, half of which occurred towards the end of August. Four consecutive CPP events were called during the last week in that month.

Demand Response Event Results
5-2 www.gepllc.com
Table 5-1 CPP Event Dates
Event No. Date
Average High Temp
(deg F)
1 13-Jun-07 99
2 3-Jul-07 94
3 5-Jul-07 104*
4 6-Jul-07 99
5 9-Jul-07 91
6 1-Aug-07 94
7 21-Aug-07 97
8 22-Aug-07 98
9 28-Aug-07 99
10 29-Aug-07 101*
11 30-Aug-07 99*
12 31-Aug-07 99
* Flex Alert Day Note: Average High Temperature is derived from five cities - Redding, Fresno, Concord, San Jose and Sacramento.
High Temperatures (Avg of 5 Cities) and CPP Event Dates
70
75
80
85
90
95
100
105
110
6/1 6/6 6/11 6/16 6/21 6/26 7/1 7/6 7/11 7/16 7/21 7/26 7/31 8/5 8/10 8/15 8/20 8/25 8/30
Deg
rees
F
1
22
3
4
5
6 7
89
10 11
12
Figure 5-1 Average High Temperatures and CPP Event Dates
5.2 AGGREGATED CPP RESULTS Ten customers, comprised of seventeen facilities, participated in all twelve CPP events during the event period. As shown in Table 5-2, the average load shed during the high price period of 3 pm to 6 pm was 1.1 MW using the 3/10 and OAT baseline and 1.3 MW using the 3/10 MA baseline. The 1.1 MW represented approximately 67% of the projected load shed of 1.6 MW (1,568 kW) determined through engineering analysis. The 1.3 MW load reduction with the 3/10 MA baseline methodology represented approximately 84% of the estimated load shed. During the moderate price period of 12 pm to 3 pm, the average load
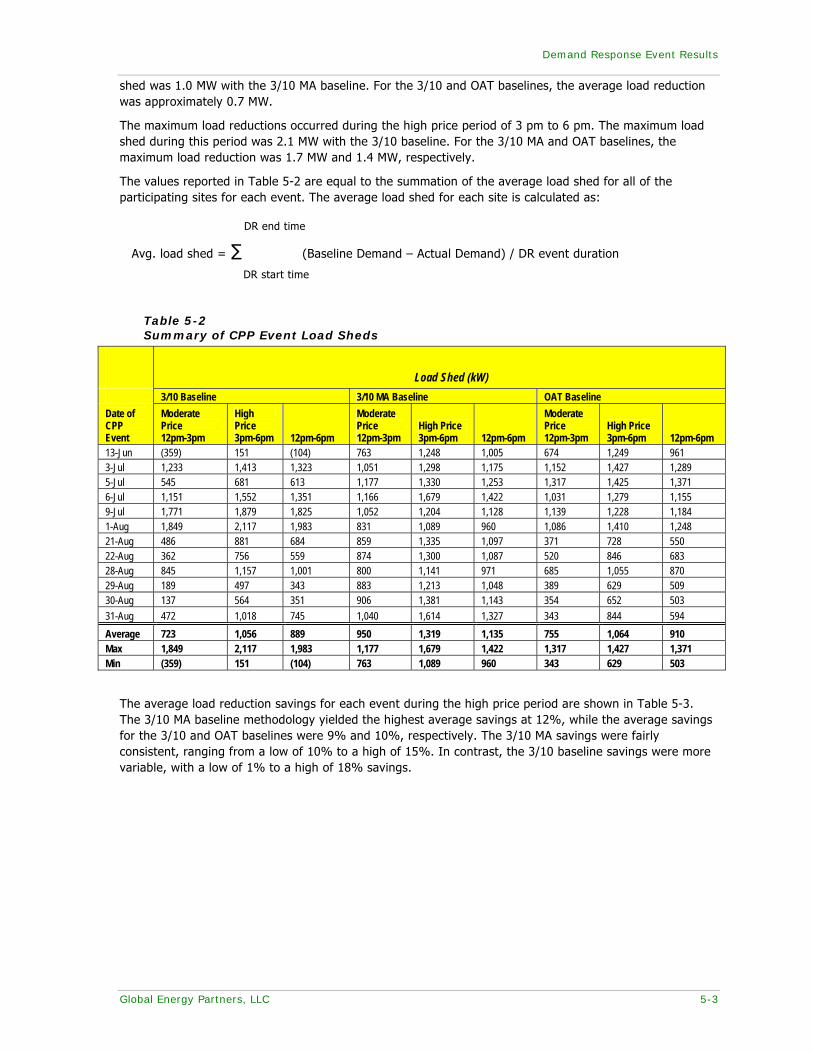
Demand Response Event Results
Global Energy Partners, LLC 5-3
shed was 1.0 MW with the 3/10 MA baseline. For the 3/10 and OAT baselines, the average load reduction was approximately 0.7 MW.
The maximum load reductions occurred during the high price period of 3 pm to 6 pm. The maximum load shed during this period was 2.1 MW with the 3/10 baseline. For the 3/10 MA and OAT baselines, the maximum load reduction was 1.7 MW and 1.4 MW, respectively.
The values reported in Table 5-2 are equal to the summation of the average load shed for all of the participating sites for each event. The average load shed for each site is calculated as:
DR end time
Avg. load shed = ∑ (Baseline Demand – Actual Demand) / DR event duration
DR start time
Table 5-2 Summary of CPP Event Load Sheds
Load Shed (kW) 3/10 Baseline 3/10 MA Baseline OAT Baseline Date of CPP Event
Moderate Price 12pm-3pm
High Price 3pm-6pm 12pm-6pm
Moderate Price 12pm-3pm
High Price 3pm-6pm 12pm-6pm
Moderate Price 12pm-3pm
High Price 3pm-6pm 12pm-6pm
13-Jun (359) 151 (104) 763 1,248 1,005 674 1,249 961 3-Jul 1,233 1,413 1,323 1,051 1,298 1,175 1,152 1,427 1,289 5-Jul 545 681 613 1,177 1,330 1,253 1,317 1,425 1,371 6-Jul 1,151 1,552 1,351 1,166 1,679 1,422 1,031 1,279 1,155 9-Jul 1,771 1,879 1,825 1,052 1,204 1,128 1,139 1,228 1,184 1-Aug 1,849 2,117 1,983 831 1,089 960 1,086 1,410 1,248 21-Aug 486 881 684 859 1,335 1,097 371 728 550 22-Aug 362 756 559 874 1,300 1,087 520 846 683 28-Aug 845 1,157 1,001 800 1,141 971 685 1,055 870 29-Aug 189 497 343 883 1,213 1,048 389 629 509 30-Aug 137 564 351 906 1,381 1,143 354 652 503 31-Aug 472 1,018 745 1,040 1,614 1,327 343 844 594 Average 723 1,056 889 950 1,319 1,135 755 1,064 910 Max 1,849 2,117 1,983 1,177 1,679 1,422 1,317 1,427 1,371 Min (359) 151 (104) 763 1,089 960 343 629 503
The average load reduction savings for each event during the high price period are shown in Table 5-3. The 3/10 MA baseline methodology yielded the highest average savings at 12%, while the average savings for the 3/10 and OAT baselines were 9% and 10%, respectively. The 3/10 MA savings were fairly consistent, ranging from a low of 10% to a high of 15%. In contrast, the 3/10 baseline savings were more variable, with a low of 1% to a high of 18% savings.

Demand Response Event Results
5-4 www.gepllc.com
Table 5-3 Average CPP Load Reduction Savings
High Price Period 3pm-6pm Load Shed (kW) % Savings Date of CPP Event
3/10 Baseline
3/10 MA Baseline
OAT Baseline
3/10 Baseline
3/10 MA Baseline
OAT Baseline
13-Jun 151 1,248 1,249 1% 11% 11% 3-Jul 1,413 1,298 1,427 13% 12% 13% 5-Jul 681 1,330 1,425 6% 11% 12% 6-Jul 1,552 1,679 1,279 14% 15% 12% 9-Jul 1,879 1,204 1,228 17% 12% 12% 1-Aug 2,117 1,089 1,410 18% 10% 13% 21-Aug 881 1,335 728 8% 12% 7% 22-Aug 756 1,300 846 7% 11% 8% 28-Aug 1,157 1,141 1,055 10% 10% 9% 29-Aug 497 1,213 629 4% 10% 5% 30-Aug 564 1,381 652 5% 11% 6%
31-Aug 1,018 1,614 844 9% 14% 8%
Average 1,056 1,319 1,064 9% 12% 10% Max 2,117 1,679 1,427 18% 15% 13% Min 151 1,089 629 1% 10% 5%
Table 5-4 shows the average load reductions by customer type in comparison to their estimated load shed for the CPP event period during the high price period. Across all baselines, customers 3, 7, 8, 9 and 10 were the most consistent performers, achieving over 90% of their estimated load shed. Three customers (2,5 and 6) fell short of their estimated load reduction, shedding on average, less than 50% of the expected reductions.
Likely attributable to baseline problems, there was quite a variation in each participant’s load shed per event, with the standard deviation more than 30% from the mean for the majority of the sites. However, if all of the participants had provided their maximum load reduction during the high price three-hour period on the same day, a total savings of approximately 2.3 MW could have been achieved. Appendix L contains the summary of the load reductions for each CPP participant by price period and event day for each of the three baselines.

Demand Response Event Results
Global Energy Partners, LLC 5-5
Table 5-4 Average CPP Load Reduction by Customer Type
CustCustomer
Type 3/103/10 MA OAT Avg 3/10
3/10 MA OAT Avg 3/10
3/10 MA OAT
1 Govt Building 74 63 63 61 62 86% 85% 82% 84% 102 127 104
2 Comm Office 496 240 275 248 254 48% 55% 50% 51% 541 423 551
3 Govt Building 203 132 224 206 187 65% 110% 102% 92% 380 372 288
4 Museum 24 23 87 (14) 32 96% 364% -57% 134% 78 194 37
5 School District 34 2 13 0.5 5 5% 38% 1% 15% 92 99 154
6 Biotechnology 172 111 39 42 64 64% 23% 25% 37% 291 153 312
7 Retail 112 108 113 105 109 96% 101% 94% 97% 166 164 149
8 Retail 217 192 229 182 201 88% 106% 84% 93% 258 302 286
9 Industrial Plant 100 102 99 81 94 102% 99% 81% 94% 146 183 133
10 Retail 136 83 178 153 138 61% 131% 112% 101% 312 287 240
Total 1,568 1,056 1,319 1,064 1,146 67% 84% 68% 73% 2,365 2,304 2,252
Estimated Load Shed
(kW)
High Price Period 3pm-6pm
Avg Load Shed (kW) per Event % of Estimated Load Shed Max Load Shed (kW)
Figure 5-2 displays the average demand savings during the high price period for each customer using the three different baseline methodologies. The estimated load shed is included for comparison purposes. For most customers, the 3/10 MA baseline provided the largest demand savings. The average load reduction per site with the 3/10 MA baseline was 78 kW. For the 3/10 and OAT baselines, the average load shed was under 65 kW per site.
Average Load Shed (kW)
(100)
0
100
200
300
400
500
1 2 3 4 5 6 7 8 9 10
Customer No.
Load
She
d (k
W)
3/10 Baseline 3/10 MA Baseline OAT Baseline Estimated Load Shed
Figure 5-2 Average Demand Savings for 3/10, 3/10 MA and OAT Baselines
5.3 AGGREGATED DBP RESULTS Three customers, comprised of eleven facilities, participated in the DBP test event on August 30th. The 3/10 baseline results are presented in Table 5-5. In total, approximately 10.7 MW was shed at various two-hour intervals during the 2 pm to 6 pm test period. The reduction represented 98% of the bid amount of 10.9 MW. Most of the load reduction, 9.1 MW, occurred during the 2 pm to 4 pm timeframe. 95% of the load
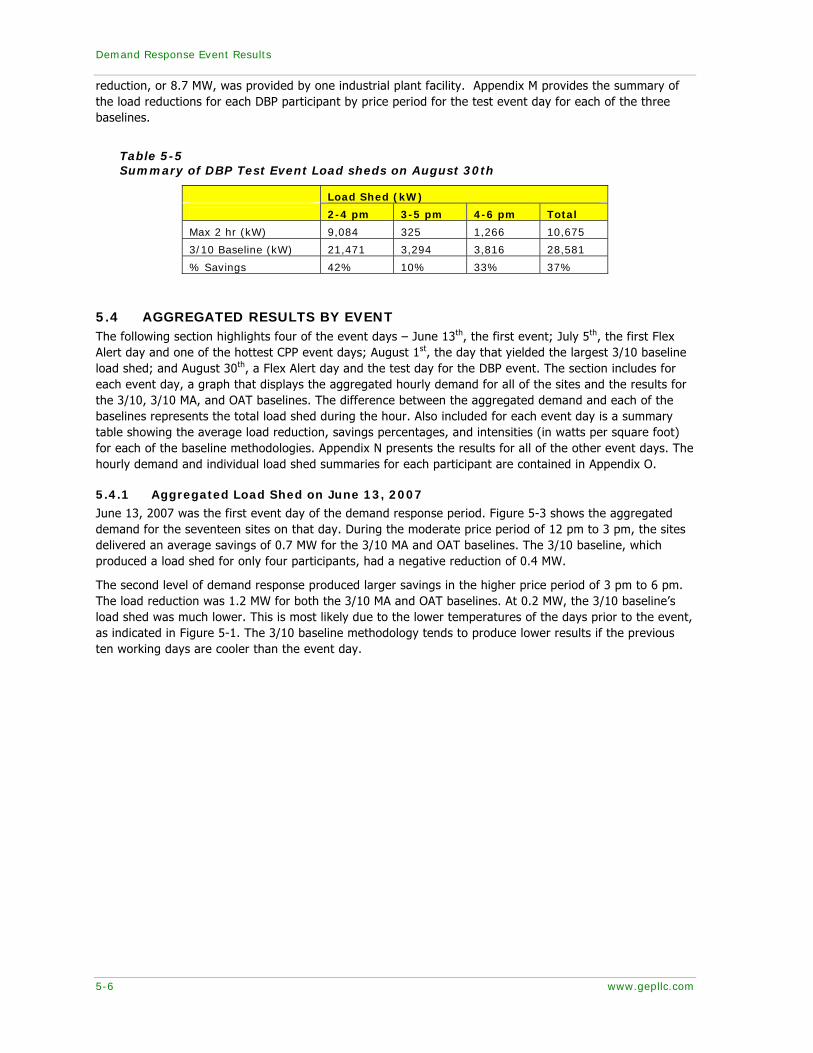
Demand Response Event Results
5-6 www.gepllc.com
reduction, or 8.7 MW, was provided by one industrial plant facility. Appendix M provides the summary of the load reductions for each DBP participant by price period for the test event day for each of the three baselines.
Table 5-5 Summary of DBP Test Event Load sheds on August 30th
Load Shed (kW)
2-4 pm 3-5 pm 4-6 pm Total
Max 2 hr (kW) 9,084 325 1,266 10,675
3/10 Baseline (kW) 21,471 3,294 3,816 28,581
% Savings 42% 10% 33% 37%
5.4 AGGREGATED RESULTS BY EVENT The following section highlights four of the event days – June 13th, the first event; July 5th, the first Flex Alert day and one of the hottest CPP event days; August 1st, the day that yielded the largest 3/10 baseline load shed; and August 30th, a Flex Alert day and the test day for the DBP event. The section includes for each event day, a graph that displays the aggregated hourly demand for all of the sites and the results for the 3/10, 3/10 MA, and OAT baselines. The difference between the aggregated demand and each of the baselines represents the total load shed during the hour. Also included for each event day is a summary table showing the average load reduction, savings percentages, and intensities (in watts per square foot) for each of the baseline methodologies. Appendix N presents the results for all of the other event days. The hourly demand and individual load shed summaries for each participant are contained in Appendix O.
5.4.1 Aggregated Load Shed on June 13, 2007
June 13, 2007 was the first event day of the demand response period. Figure 5-3 shows the aggregated demand for the seventeen sites on that day. During the moderate price period of 12 pm to 3 pm, the sites delivered an average savings of 0.7 MW for the 3/10 MA and OAT baselines. The 3/10 baseline, which produced a load shed for only four participants, had a negative reduction of 0.4 MW.
The second level of demand response produced larger savings in the higher price period of 3 pm to 6 pm. The load reduction was 1.2 MW for both the 3/10 MA and OAT baselines. At 0.2 MW, the 3/10 baseline’s load shed was much lower. This is most likely due to the lower temperatures of the days prior to the event, as indicated in Figure 5-1. The 3/10 baseline methodology tends to produce lower results if the previous ten working days are cooler than the event day.

Demand Response Event Results
Global Energy Partners, LLC 5-7
6/13/2007 (High Temp - 99 Deg F)
0
2,000
4,000
6,000
8,000
10,000
12,000
14,000
12:0
0 A
M
1:00
AM
2:00
AM
3:00
AM
4:00
AM
5:00
AM
6:00
AM
7:00
AM
8:00
AM
9:00
AM
10:0
0 A
M
11:0
0 A
M
12:0
0 PM
1:00
PM
2:00
PM
3:00
PM
4:00
PM
5:00
PM
6:00
PM
7:00
PM
8:00
PM
9:00
PM
10:0
0 PM
11:0
0 PM
Who
le B
uild
ing
Pow
er (k
W)
Cust 1 Cust 2 Cust 3 (site 1) Cust 3 (site 2) Cust 3 (site 3)Cust 4 Cust 5 (site 1) Cust 5 (site 2) Cust 6 (site 1) Cust 6 (site 2)Cust 6 (site 3) Cust 7 Cust 8 Cust 9 Cust 10 (site 1)Cust 10 (site 2) Cust 10 (site 3) CPP Baseline CPP MA Baseline OAT Baseline
OAT Baseline3/10 MA Baseline3/10 Baseline
Figure 5-3 Aggregated Demand on June 13, 2007
Table 5-6 shows the demand savings for each customer on that day. For customers with multiple sites, the values in the table represent the summation of the load sheds for all of the customer’s sites. In total, the 3/10 MA and OAT baselines delivered the greatest savings at 11%. Across all baselines, Customers No. 5 and 8 achieved the highest average savings for the day. Customer No. 6 was not able to shed loads that day despite receiving shed signals and activating its shed strategy via Auto-DR.
Table 5-6 Aggregated Load Shed on June 13, 2007
Load Shed (kW)
Avg Savings% (High Price)
Avg W/ft2 (High Price)
3/10 Baseline 3/10 MA Baseline OAT Baseline Cust No. Moderate
12pm-3pm
High 3pm-6pm
Moderate 12pm-
3pm
High 3pm-6pm
Moderate 12pm-
3pm
High 3pm-6pm 3/10
3/10 MA OAT 3/10
3/10 MA OAT
1 9 10 56 55 65 104 4% 20% 32% 0.19 1.08 2.03 2 2 93 336 423 436 551 2% 9% 11% 0.13 0.60 0.78 3 (38) (43) 137 129 134 139 -4% 11% 11% (0.11) 0.33 0.35 4 (58) (11) 25 60 (64) (19) -7% 27% -13% (0.12) 0.69 (0.22) 5 25 38 72 53 67 59 16% 21% 22% 0.14 0.19 0.22 6 (99) (26) (61) 10 (195) (152) -3% 1% -17% (0.17) 0.07 (1.03) 7 (93) (92) 4 3 (5) 76 -10% 0% 7% (0.31) 0.01 0.25 8 44 148 133 237 216 286 16% 24% 27% 0.54 0.86 1.04 9 (80) 3 (19) 54 (39) 35 1% 10% 7% 0.03 0.53 0.34
10 (72) 31 80 225 59 171 3% 18% 14% 0.07 0.54 0.41
(359) 151 763 1,248 674 1,249 1% 11% 11% 0.05 0.45 0.45

Demand Response Event Results
5-8 www.gepllc.com
5.4.2 Aggregated Load Shed on July 5, 2007
July 5, 2007, with an average high temperature of 104 degrees, was the first Flex Alert day declared by the ISO. As shown in Figure 5-4, the two levels of demand response are clearly identified among the seventeen sites during this event day, with all three baselines providing load reductions. Total demand savings during the high price period was 1.3 MW and 1.4 MW for the 3/10 MA and OAT baselines, respectively. The 3/10 baseline, which was below the actual load at the start of the demand response period, was lower than the other two baselines. As a result, the 3/10 baseline yielded a smaller total reduction, at 0.7 MW.
7/5/2007 (High Temp - 104 Deg F)
0
2,000
4,000
6,000
8,000
10,000
12,000
14,000
12:0
0 A
M
1:00
AM
2:00
AM
3:00
AM
4:00
AM
5:00
AM
6:00
AM
7:00
AM
8:00
AM
9:00
AM
10:0
0 A
M
11:0
0 A
M
12:0
0 PM
1:00
PM
2:00
PM
3:00
PM
4:00
PM
5:00
PM
6:00
PM
7:00
PM
8:00
PM
9:00
PM
10:0
0 PM
11:0
0 PM
Who
le B
uild
ing
Pow
er (k
W)
Cust 1 Cust 2 Cust 3 (site 1) Cust 3 (site 2) Cust 3 (site 3) Cust 4 Cust 5 (site 1)Cust 5 (site 2) Cust 6 (site 1) Cust 6 (site 2) Cust 6 (site 3) Cust 7 Cust 8 Cust 9Cust 10 (site 1) Cust 10 (site 2) Cust 10 (site 3) CPP Baseline CPP MA Baseline OAT Baseline
3/10 MA Baseline OAT Baseline3/10 Baseline
Figure 5-4 Aggregated Demand on July 5, 2007
Table 5-7 shows the average demand savings for this day. Five customers (1, 6, 7, 8 and 9) obtained greater than 8% savings with each of the baseline methodologies. Aggregated savings was over 10% for the 3/10 MA and OAT baselines. The intensity for the two baselines averaged 0.5 W/ft2. The 3/10 baseline yielded 6% savings and 0.3 W/ft2 during this price period.

Demand Response Event Results
Global Energy Partners, LLC 5-9
Table 5-7 Aggregated Load shed on July 5, 2007
Load Shed (kW) Avg Savings %
(High Price) Avg W/ft2
(High Price) 3/10 Baseline 3/10 MA Baseline OAT Baseline Cust
No. Moderate 12pm-3pm
High 3pm-6pm
Moderate 12pm-3pm
High 3pm-6pm
Moderate 12pm-3pm
High 3pm-6pm 3/10
3/10 MA OAT 3/10
3/10 MA OAT
1 32 21 60 48 92 99 8% 17% 29% 0.42 0.94 1.94 2 11 63 248 296 366 293 1% 6% 6% 0.09 0.42 0.41 3 (26) 10 156 193 158 210 1% 15% 16% 0.03 0.49 0.53 4 (57) (16) 101 112 (102) (25) -8% 35% -14% (0.18) 1.30 (0.29) 5 62 4 46 (2) 43 (8) 3% -1% -7% 0.01 (0.01) (0.03) 6 260 277 60 77 340 312 26% 9% 28% 1.87 0.52 2.11 7 62 83 73 94 103 139 8% 9% 13% 0.28 0.31 0.46 8 136 214 159 237 151 247 22% 23% 24% 0.78 0.86 0.90 9 8 95 2 89 (35) 68 18% 17% 14% 0.94 0.88 0.67 10 57 (71) 273 184 201 91 -6% 14% 7% (0.17) 0.44 0.22
545 681 1,177 1,330 1,317 1,425 6% 11% 12% 0.25 0.48 0.52
5.4.3 Aggregated Load Shed on August 1, 2007
On August 1, 2007, the 3/10 baseline was well above the 3/10 MA and OAT baselines. During this day, the average high temperature was 94 degrees. Temperatures hovered around the low 90s in the days prior to the event. The seventeen sites delivered a reduction of 2.1 MW during the high price period and 1.8 MW during the moderate price period with the 3/10 baseline. These results provided the highest 3/10 baseline reductions for the entire 2007 demand response period. The 3/10 MA and OAT baselines yielded 1.1 MW and 1.4 MW, respectively during the high price period. Figure 5-5 shows the aggregated demand profile of the seventeen sites.
8/1/2007 (High Temp - 94 Deg F)
0
2,000
4,000
6,000
8,000
10,000
12,000
14,000
12:0
0 A
M
1:00
AM
2:00
AM
3:00
AM
4:00
AM
5:00
AM
6:00
AM
7:00
AM
8:00
AM
9:00
AM
10:0
0 A
M
11:0
0 A
M
12:0
0 PM
1:00
PM
2:00
PM
3:00
PM
4:00
PM
5:00
PM
6:00
PM
7:00
PM
8:00
PM
9:00
PM
10:0
0 PM
11:0
0 PM
Who
le B
uild
ing
Pow
er (k
W)
Cust 1 Cust 2 Cust 3 (site 1) Cust 3 (site 2) Cust 3 (site 3) Cust 4 Cust 5 (site 1)Cust 5 (site 2) Cust 6 (site 1) Cust 6 (site 2) Cust 6 (site 3) Cust 7 Cust 8 Cust 9Cust 10 (site 1) Cust 10 (site 2) Cust 10 (site 3) CPP MA Baseline OAT Baseline CPP Baseline
3/10 Baseline
OAT Baseline3/10 MA Baseline
Figure 5-5 Aggregated Demand on August 1, 2007

Demand Response Event Results
5-10 www.gepllc.com
As shown in Table 5-8, the average savings across the three baselines were fairly high and consistent for most customers. Three customers (1,3, and 9) achieved over 22% savings for all three baselines. Total average savings for the 3/10 baseline was 18%. The average savings for the 3/10 MA and OAT baselines were 10% and 13%, respectively. The 3/10 baseline yielded the highest average intensity at 0.8 W/ft2
Table 5-8 Aggregated Load Shed on August 1, 2007
Load Shed (kW) Avg Savings %
(High Price) Avg W/ft2
(High Price) 3/10 Baseline 3/10 MA Baseline OAT Baseline Cust
No. Moderate 12pm-3pm
High 3pm-6pm
Moderate 12pm-3pm
High 3pm-6pm
Moderate 12pm-3pm
High 3pm-6pm 3/10
3/10 MA OAT 3/10
3/10 MA OAT
1 65 78 67 80 54 59 28% 28% 22% 1.53 1.56 1.15 2 414 541 202 332 331 492 11% 7% 10% 0.76 0.47 0.69 3 322 380 197 253 150 247 31% 23% 22% 0.97 0.64 0.63
4 1 19 1 19 (38) (24) 9% 9% -15% 0.22 0.22 (0.28) 5 20 (6) 17 (4) 31 27 -5% -3% 18% (0.02) (0.01) 0.10 6 221 259 (60) (13) 176 193 25% -2% 20% 1.75 (0.09) 1.30 7 158 149 150 140 155 125 14% 13% 12% 0.50 0.47 0.42 8 182 239 93 150 101 152 24% 17% 17% 0.87 0.55 0.55 9 (6) 146 30 183 (2) 118 25% 30% 22% 1.45 1.81 1.17 10 472 312 135 (49) 129 20 26% -6% 2% 0.75 (0.12) 0.05
1,849 2,117 831 1,089 1,085 1,410 18% 10% 13% 0.77 0.40 0.51

Global Energy Partners, LLC 5-11
5.4.4 Aggregated Load Shed on August 30, 2007
August 30, 2007 was a Flex Alert day and a test event day for DBP. The average high temperature on this day was 99 degrees. As shown in Figure 5-6, the 3/10 baseline and OAT baselines were both below the actual load prior to the activation of the event. The 3/10 and OAT baselines produced load reductions of 0.6 MW and 0.7 MW, respectively, during the high price period. The 3/10 MA baseline produced a higher demand savings of 1.4 MW. The baseline’s load reduction was 1.0 MW during the moderate price period.
8/30/2007 (High Temp - 99 Deg F)
0
2,000
4,000
6,000
8,000
10,000
12,000
14,000
12:0
0 A
M
1:00
AM
2:00
AM
3:00
AM
4:00
AM
5:00
AM
6:00
AM
7:00
AM
8:00
AM
9:00
AM
10:0
0 A
M
11:0
0 A
M
12:0
0 PM
1:00
PM
2:00
PM
3:00
PM
4:00
PM
5:00
PM
6:00
PM
7:00
PM
8:00
PM
9:00
PM
10:0
0 PM
11:0
0 PM
Who
le B
uild
ing
Pow
er (k
W)
Cust 1 Cust 2 Cust 3 (site 1) Cust 3 (site 2) Cust 3 (site 3) Cust 4 Cust 5 (site 1)Cust 5 (site 2) Cust 6 (site 1) Cust 6 (site 2) Cust 6 (site 3) Cust 7 Cust 8 Cust 9Cust 10 (site 1) Cust 10 (site 2) Cust 10 (site 3) CPP Baseline OAT Baseline CPP MA Baseline
3/10 Baseline OAT Baseline 3/10 MA Baseline
Figure 5-6 Aggregate Demand on August 30, 2007- CPP Event
Table 5-9 presents the demand savings for the event day. The three retail customers (Customers No. 7, 8, and 10) provided almost 50% (0.7 MW) of the total load shed for the 3/10 MA baseline and over 90% (0.6 MW) of the total load shed for the OAT baseline. Customer No. 9 achieved a 20% load reduction with all three baselines. Four other customers (1, 3, 7, and 8) reduced their demand by at least 8% against all three baselines. The 3/10 MA baseline provided the highest aggregated savings (11%) and demand savings intensity (0.5 W/ft2) for that day.

Demand Response Event Results
5-12 www.gepllc.com
Table 5-9 Aggregated Load Shed on August 30, 2007 – CPP Event
Actual Load Shed (kW) Avg Savings %
(High Price) Avg W/ft2
(High Price) 3/10 Baseline 3/10 MA Baseline OAT Baseline Cust
No. Moderate 12pm-3pm
High 3pm-6pm
Moderate 12pm-3pm
High 3pm-6pm
Moderate 12pm-3pm
High 3pm-6pm 3/10
3/10 MA OAT 3/10
3/10 MA OAT
1 49 53 27 32 10 24 20% 13% 10% 1.04 0.63 0.46 2 (8) 15 104 124 (107) (188) 0% 3% -4% 0.02 0.18 (0.27) 3 98 103 127 128 116 150 8% 10% 12% 0.26 0.33 0.38 4 (62) 25 102 194 (70) (6) 11% 48% -3% 0.29 2.26 (0.07) 5 (135) (53) (6) 26 (56) 24 -44% 13% 12% (0.19) 0.10 0.09 6 (39) (3) 46 79 (68) (66) 0% 7% -7% (0.02) 0.54 (0.44) 7 90 117 138 164 89 114 11% 14% 11% 0.39 0.55 0.38 8 77 150 183 256 200 237 15% 23% 21% 0.55 0.94 0.87
9 8 112 3 107 22 124 20% 20% 22% 1.11 1.06 1.22 10 59 44 180 268 217 240 4% 21% 20% 0.11 0.65 0.58
137 564 906 1,381 354 652 5% 11% 6% 0.21 0.50 0.24
The DBP test event also took place on this day. Figure 5-7 displays the aggregated demand of all sites for both the CPP and DBP events. In the 12 pm to 3 pm time period, the demand steadily dropped, and then remained below the 3 pm baseline demand during the high price period. The three-hour demand savings during this response period averaged over 10 MW.
ALL SITES - 8/30/2007 (High Temp - 99 Deg F)
0
5,000
10,000
15,000
20,000
25,000
30,000
35,000
40,000
45,000
12:0
0 A
M
1:00
AM
2:00
AM
3:00
AM
4:00
AM
5:00
AM
6:00
AM
7:00
AM
8:00
AM
9:00
AM
10:0
0 A
M
11:0
0 A
M
12:0
0 PM
1:00
PM
2:00
PM
3:00
PM
4:00
PM
5:00
PM
6:00
PM
7:00
PM
8:00
PM
9:00
PM
10:0
0 PM
11:0
0 PM
Who
le B
uild
ing
Pow
er (k
W)
CPP Cust 1 CPP Cust 2 CPP Cust 3 (site 1) CPP Cust 3 (site 2) CPP Cust 3 (site 3) CPP Cust 4 CPP Cust 5 (site 1) CPP Cust 5 (site 2)CPP Cust 6 (site 1) CPP Cust 6 (site 2) CPP Cust 6 (site 3) CPP Cust 7 CPP Cust 8 CPP Cust 9 CPP Cust 10 (site 1) CPP Cust 10 (site 2)CPP Cust 10 (site 3) DBP Cust 1 DBP Cust 2 (site 1) DBP Cust 2 (site 2) DBP Cust 2 (site 3) DBP Cust 2 (site 4) DBP Cust 2 (site 5) DBP Cust 2 (site 6)DBP Cust 2 (site 7) DBP Cust 2 (site 8) DBP Cust 3 (site 1) DBP Cust 3 (site 2) 3-10 Baseline 3-10 MA Baseline OAT Baseline
3/10 Baseline
3/10 MA BaselineOAT Baseline
Figure 5-7 Aggregated Demand for CPP/DBP Events on August 30, 2007
Table 5-10 presents the average demand savings (using the 3/10 baseline) for each site for the DBP event. The industrial plant facility (DRP Customer No. 3), which shed over 95% of the total aggregated load, delivered approximately 8.7 MW in the 2 pm to 4 pm timeframe.
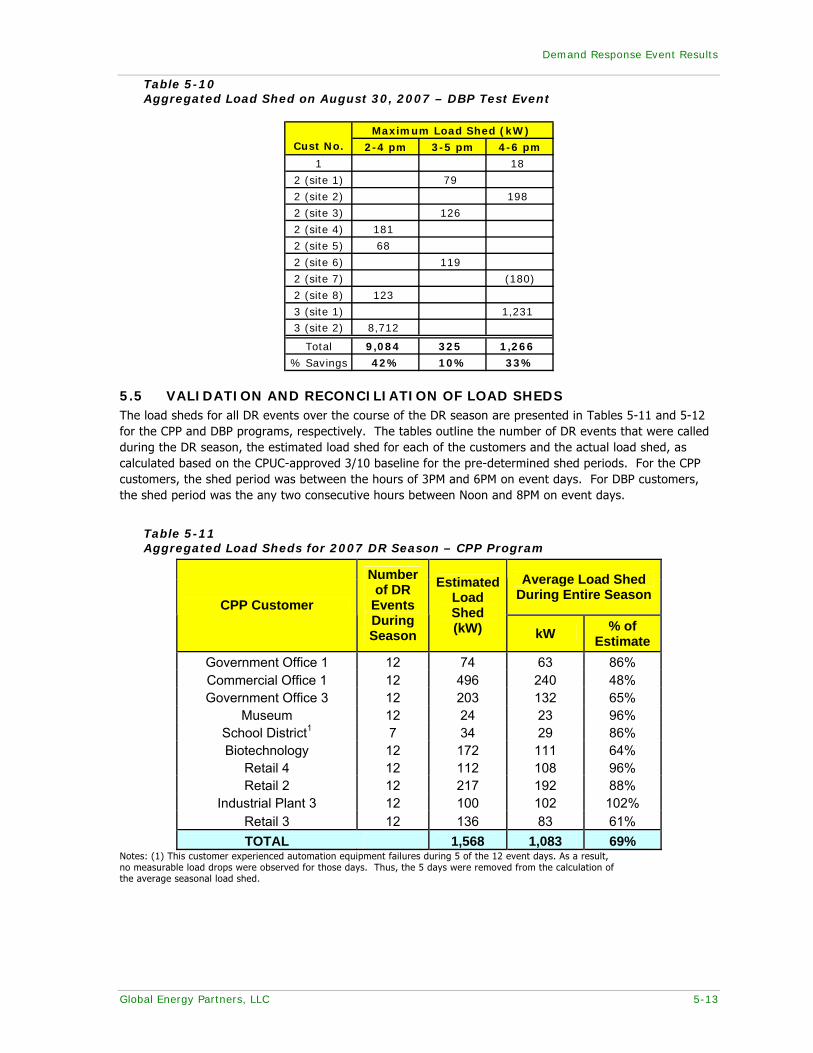
Demand Response Event Results
Global Energy Partners, LLC 5-13
Table 5-10 Aggregated Load Shed on August 30, 2007 – DBP Test Event
Cust No. 2-4 pm 3-5 pm 4-6 pm
1 18
2 (site 1) 79
2 (site 2) 198
2 (site 3) 126
2 (site 4) 181
2 (site 5) 68
2 (site 6) 119
2 (site 7) (180)
2 (site 8) 123
3 (site 1) 1,2313 (site 2) 8,712
Total 9,084 325 1,266
% Savings 42% 10% 33%
Maximum Load Shed (kW)
5.5 VALIDATION AND RECONCILIATION OF LOAD SHEDS The load sheds for all DR events over the course of the DR season are presented in Tables 5-11 and 5-12 for the CPP and DBP programs, respectively. The tables outline the number of DR events that were called during the DR season, the estimated load shed for each of the customers and the actual load shed, as calculated based on the CPUC-approved 3/10 baseline for the pre-determined shed periods. For the CPP customers, the shed period was between the hours of 3PM and 6PM on event days. For DBP customers, the shed period was the any two consecutive hours between Noon and 8PM on event days.
Table 5-11 Aggregated Load Sheds for 2007 DR Season – CPP Program
Average Load Shed During Entire Season
CPP Customer
Number of DR
Events During Season
Estimated Load Shed (kW) kW % of
Estimate Government Office 1 12 74 63 86% Commercial Office 1 12 496 240 48% Government Office 3 12 203 132 65%
Museum 12 24 23 96% School District1 7 34 29 86% Biotechnology 12 172 111 64%
Retail 4 12 112 108 96% Retail 2 12 217 192 88%
Industrial Plant 3 12 100 102 102% Retail 3 12 136 83 61% TOTAL 1,568 1,083 69%
Notes: (1) This customer experienced automation equipment failures during 5 of the 12 event days. As a result, no measurable load drops were observed for those days. Thus, the 5 days were removed from the calculation of the average seasonal load shed.

Demand Response Event Results
5-14 www.gepllc.com
Table 5-12 Aggregated Load Sheds for 2007 DR Season – DBP Program
Average Load Shed During Entire Season
DBP Customer
Number of DR
Events During Season
Estimated Load Shed (kW) kW % of
Estimate Retail 6 1 50 18 35%
Industrial Plant 1 1 10,000 9,943 98% High Tech 1 1 800 714 89%
TOTAL 10,850 10,675 98%
As can be seen from the tables, the CPP customers realized a total of 1,083 kW of load shed during the 12 summer days when CPP events were called. This represents approximately 69% of the shed amounts that were estimated at the outset of the program. The DBP customers realized a total of 10,675 kW of load shed during the one day when a DBP event was called. This represents approximately 98% of the shed amounts that were estimated at the outset of the program.
The shed data reveal important insights about the estimated versus actual load sheds. Much of the variation between estimated and actual is likely attributed to baseline problems. When the other baseline methodologies were employed (either the MA or OAT), the shed results improved significantly.
5.6 COST OF AUTO-DR PROGRAM The total cost of the Auto-DR program is outlined in Table 5-13. The costs are represented for all of the parties (outside of PG&E) that are involved in the implementation of the program. This includes Global Energy Partners (including its program development and operations subcontractors), the Lawrence Berkeley National Laboratory, Akuacom, four technical coordinator firms, equipment vendors and the participating customers. There are a number of cost components outlined in the table. These components are roughly split into two categories:
a. Program Development and Operations: This relates to the development of the project including program planning, systems development, qualification and training of the technical coordinators, marketing and recruitment for the customers, enablement of the Auto-DR systems, testing and validation of the installed systems, and operations of the Auto-DR program including tracking and monitoring and DRAS operations.
b. Technology Incentive (TI) Elements: This relates to the TI incentives that were paid out to recruitment coordinators, technical coordinators, equipment vendors, and the participating customers.

Demand Response Event Results
Global Energy Partners, LLC 5-15
Table 5-13 Cost of 2007 Auto-DR Program
Cost Category Total ($000)
Percent of Total
Planning and Design $103 2%
Qualification and Training $233 4% Marketing and Recruitment
$382 7%
Enablement $427 8%
Testing and Validation $210 4% Pr
ogra
m D
evel
opm
ent
and
Ope
ratio
ns
Operations $590 11%
Recruitment Incentives $115 2%
Technical Coordination $421 8%
Equipment $1,788 33%
Tech
nolo
gy
Ince
ntiv
e
(TI)
Elem
ents
Participation Incentives $1,132 21%
Total $5,401 Load Reduction Estimate (MW) 22.6 Cost per kW $239
In total, the program expenditures were $5.4 million. Roughly one-third of the program costs were for program development and operations. The other two-thirds were for the TI incentive elements. With a total load reduction estimate of 22.6 megawatts, the unit program cost was $238 per kW.
5.7 COMPARISON ANALYSIS OF AUTOMATION TECHNOLOGY One of the objectives of the 2007 Automated Demand Response Pilot Program is to analyze the effects of automation technology in the context of traditional demand response programs. With this objective in mind, a study was conducted to compare participation between automated and non-automated sites. The sample group for this study is a collection of 75 electric accounts enrolled in PG&E’s Critical Peak Pricing (CPP) program in 2007. Of these sites, 16 were participating in the Auto-DR Pilot Program, while the remaining 59 had not installed automation capability.
The control group of non-automated facilities was derived from a master list of 730 PG&E accounts enrolled in Critical Peak Pricing. To ensure a reliable comparison, this list was filtered by NAICS classification and region to obtain control sites similar to the automated sites. These criteria account for demand variations that depend on building function and weather, two important elements of a site’s ability to shed load in response to a DR event. The objective is a “ceteris paribus” (all other things remaining equal) examination of the effects of automating demand response.
As an example of the control group selection process, three automated sites fall into the category of “East Bay Retail.” The master list was then filtered to reveal eight non-automated sites that were enrolled in CPP, located in the East Bay region of San Francisco, and classified as Retail. Access to the historical load metered data through the PG&E InterAct™ application was then obtained through a permission request process. Several of the chosen accounts were eliminated from the control group during this stage due to limited availability of load data.
After obtaining access to time-resolved electric meter data for both the sample and control groups, a standard analysis was performed to compare performance during CPP events. Shed values were calculated by the same methodology used throughout this report, in which the “3-in-10” baseline was applied and the average shed over the high price period (3-6 pm) was recorded. To enable comparison between facilities of different size and characteristic peak demand, the appropriate choice of metric is a percentage of total demand. For each site in the sample, a single value was obtained by averaging over the twelve CPP events called in 2007. Figure 5-8 displays the average shed for each site, demarcating the automated and non-
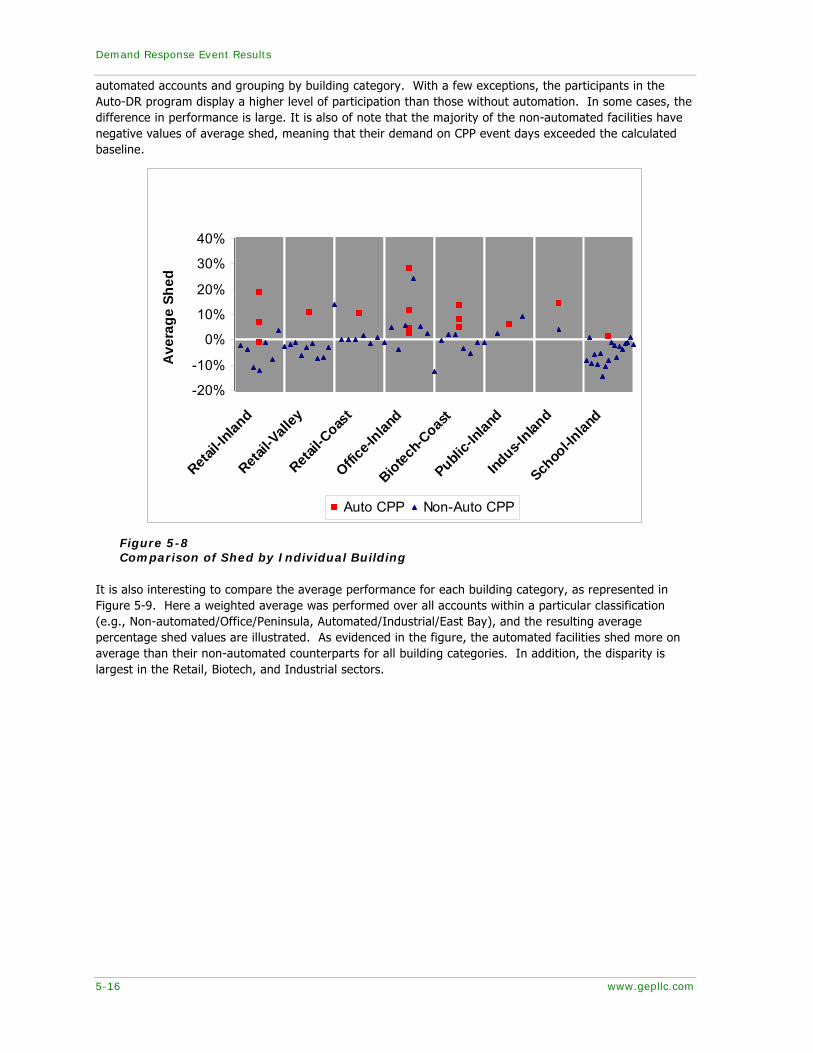
Demand Response Event Results
5-16 www.gepllc.com
automated accounts and grouping by building category. With a few exceptions, the participants in the Auto-DR program display a higher level of participation than those without automation. In some cases, the difference in performance is large. It is also of note that the majority of the non-automated facilities have negative values of average shed, meaning that their demand on CPP event days exceeded the calculated baseline.
-20%
-10%
0%
10%
20%
30%
40%
Retail-I
nland
Retail-V
alley
Retail-C
oast
Office-I
nland
Biotech-C
oast
Public-I
nland
Indus-I
nland
Schoo
l-Inlan
d
Ave
rage
She
d
Auto CPP Non-Auto CPP
Figure 5-8 Comparison of Shed by Individual Building
It is also interesting to compare the average performance for each building category, as represented in Figure 5-9. Here a weighted average was performed over all accounts within a particular classification (e.g., Non-automated/Office/Peninsula, Automated/Industrial/East Bay), and the resulting average percentage shed values are illustrated. As evidenced in the figure, the automated facilities shed more on average than their non-automated counterparts for all building categories. In addition, the disparity is largest in the Retail, Biotech, and Industrial sectors.

Demand Response Event Results
Global Energy Partners, LLC 5-17
-10.0%
-5.0%
0.0%
5.0%
10.0%
15.0%
20.0%
Retail-I
nland
Retail-V
alley
Retail-C
oast
Office-I
nland
Biotech-C
oast
Public-I
nland
Indus-I
nland
Schoo
l-Inlan
d
Ave
rage
She
d
Auto CPP Non-Auto CPP
Figure 5-9 Comparison of Shed by Building Category Averages


Global Energy Partners, LLC 6-1
CHAPTER 6
OBSERVATIONS AND RECOMMENDATIONS FOR FUTURE IMPLEMENTATIONS
The 2007 Auto-DR Program has met and exceeded its goals, providing many lessons about the implementation process. The Project Team has developed several observations and recommendations for future implementations. They are presented in this chapter.
The observations and recommendations are arranged in four groups as related to:
a. Recruitment
b. Assessment Process
c. Equipment Enablement
d. Program Operations
6.1 OBSERVATIONS AND RECOMMENDATIONS RELATED TO RECRUITMENT
Observation Recommendation for 2008 Implementation and
Beyond Delayed finalization of Customer Participation Agreement (CPA) created challenges in getting customer commitment.
Use the 2007 CPA as starting model, amending it for 2008 to extend dates, update kW values, and other customer information. Finalize CPA templates by first quarter of 2008 (three to four months prior to the DR season).
Delayed decision on which sections of the TA/TI application needed to be signed by customers and how they need to be completed created confusion.
The necessary TA/TI forms are now well understood and have been used successfully in the incentive process. TA/TI forms that need to be submitted in the future should remain the same.
The CPA needs flexibility for some customers’ requirements such as the State of California not accepting an indemnification clause (also a factor in the InterAct™ agreement), payment of incentives by GEP to customer-authorized third parties, and requirements for sequencing of payments.
Edit future CPA templates to include flexibility with respect to deal-relevant clauses and to explain the sequencing of payments.
DBP customers wanted to be assured that they would receive full Auto-DR incentive payments even if no DBP events were called during the DR season. (The third participation installment, equal to 50% of actual demand reduction during the DR-Event period is paid upon successful participation through October 31, 2007).
Customers received verbal assurances from the PG&E Project Manager but remained skeptical since there was no written statement to that effect from PG&E that could be reflected in the CPA. Future CPAs need to include the payment guarantee.
The Project Team had to overcome customer resistance and concerns about GEP’s implementation responsibilities and guarantee to the customer that all information exchanged was confidential and that payments from GEP would indeed materialize.
Work closely with Account Managers to obtain credibility and procure customer trust. Use existing customer testimonials.
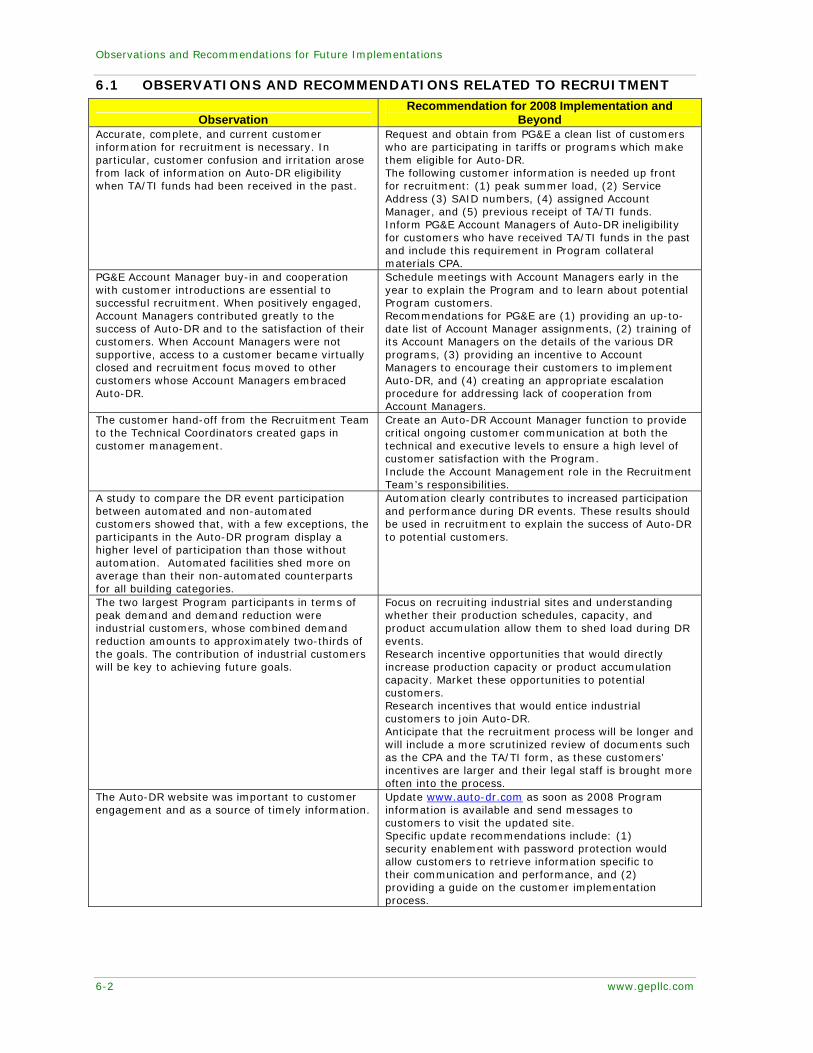
Observations and Recommendations for Future Implementations
6-2 www.gepllc.com
6.1 OBSERVATIONS AND RECOMMENDATIONS RELATED TO RECRUITMENT
Observation Recommendation for 2008 Implementation and
Beyond Accurate, complete, and current customer information for recruitment is necessary. In particular, customer confusion and irritation arose from lack of information on Auto-DR eligibility when TA/TI funds had been received in the past.
Request and obtain from PG&E a clean list of customers who are participating in tariffs or programs which make them eligible for Auto-DR. The following customer information is needed up front for recruitment: (1) peak summer load, (2) Service Address (3) SAID numbers, (4) assigned Account Manager, and (5) previous receipt of TA/TI funds. Inform PG&E Account Managers of Auto-DR ineligibility for customers who have received TA/TI funds in the past and include this requirement in Program collateral materials CPA.
PG&E Account Manager buy-in and cooperation with customer introductions are essential to successful recruitment. When positively engaged, Account Managers contributed greatly to the success of Auto-DR and to the satisfaction of their customers. When Account Managers were not supportive, access to a customer became virtually closed and recruitment focus moved to other customers whose Account Managers embraced Auto-DR.
Schedule meetings with Account Managers early in the year to explain the Program and to learn about potential Program customers. Recommendations for PG&E are (1) providing an up-to-date list of Account Manager assignments, (2) training of its Account Managers on the details of the various DR programs, (3) providing an incentive to Account Managers to encourage their customers to implement Auto-DR, and (4) creating an appropriate escalation procedure for addressing lack of cooperation from Account Managers.
The customer hand-off from the Recruitment Team to the Technical Coordinators created gaps in customer management.
Create an Auto-DR Account Manager function to provide critical ongoing customer communication at both the technical and executive levels to ensure a high level of customer satisfaction with the Program. Include the Account Management role in the Recruitment Team’s responsibilities.
A study to compare the DR event participation between automated and non-automated customers showed that, with a few exceptions, the participants in the Auto-DR program display a higher level of participation than those without automation. Automated facilities shed more on average than their non-automated counterparts for all building categories.
Automation clearly contributes to increased participation and performance during DR events. These results should be used in recruitment to explain the success of Auto-DR to potential customers.
The two largest Program participants in terms of peak demand and demand reduction were industrial customers, whose combined demand reduction amounts to approximately two-thirds of the goals. The contribution of industrial customers will be key to achieving future goals.
Focus on recruiting industrial sites and understanding whether their production schedules, capacity, and product accumulation allow them to shed load during DR events. Research incentive opportunities that would directly increase production capacity or product accumulation capacity. Market these opportunities to potential customers. Research incentives that would entice industrial customers to join Auto-DR. Anticipate that the recruitment process will be longer and will include a more scrutinized review of documents such as the CPA and the TA/TI form, as these customers’ incentives are larger and their legal staff is brought more often into the process.
The Auto-DR website was important to customer engagement and as a source of timely information.
Update www.auto-dr.com as soon as 2008 Program information is available and send messages to customers to visit the updated site. Specific update recommendations include: (1) security enablement with password protection would allow customers to retrieve information specific to their communication and performance, and (2) providing a guide on the customer implementation process.
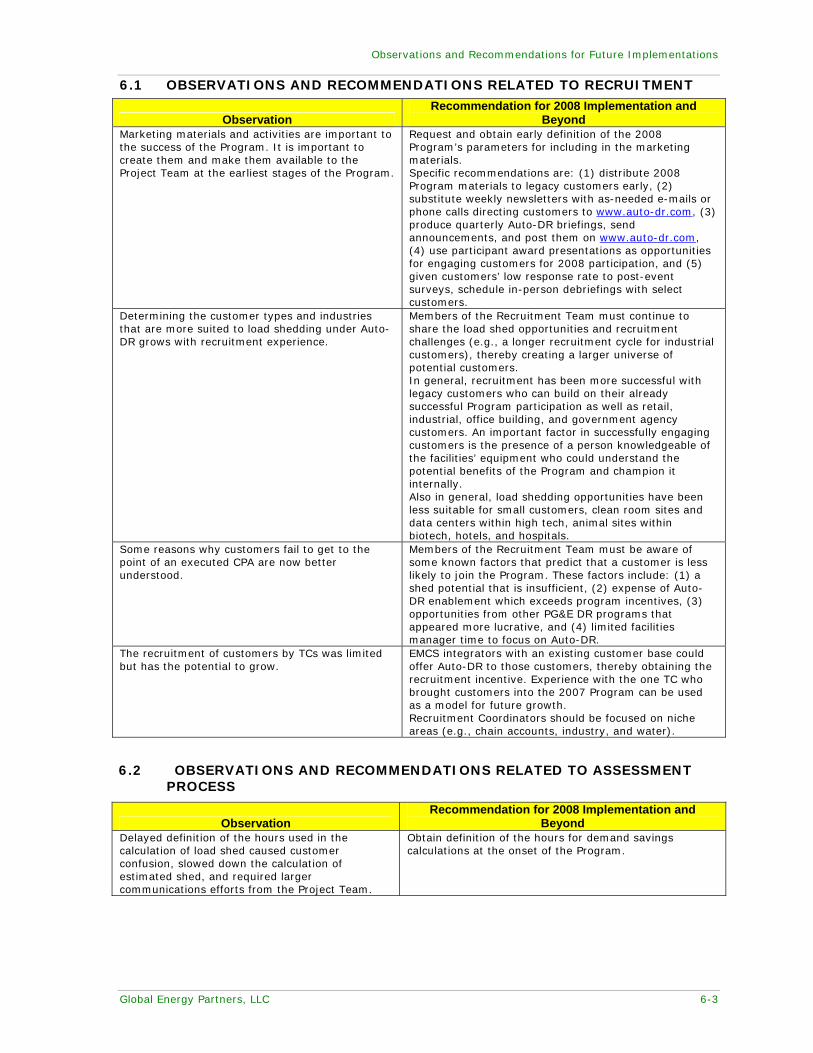
Observations and Recommendations for Future Implementations
Global Energy Partners, LLC 6-3
6.1 OBSERVATIONS AND RECOMMENDATIONS RELATED TO RECRUITMENT
Observation Recommendation for 2008 Implementation and
Beyond Marketing materials and activities are important to the success of the Program. It is important to create them and make them available to the Project Team at the earliest stages of the Program.
Request and obtain early definition of the 2008 Program’s parameters for including in the marketing materials. Specific recommendations are: (1) distribute 2008 Program materials to legacy customers early, (2) substitute weekly newsletters with as-needed e-mails or phone calls directing customers to www.auto-dr.com, (3) produce quarterly Auto-DR briefings, send announcements, and post them on www.auto-dr.com, (4) use participant award presentations as opportunities for engaging customers for 2008 participation, and (5) given customers’ low response rate to post-event surveys, schedule in-person debriefings with select customers.
Determining the customer types and industries that are more suited to load shedding under Auto-DR grows with recruitment experience.
Members of the Recruitment Team must continue to share the load shed opportunities and recruitment challenges (e.g., a longer recruitment cycle for industrial customers), thereby creating a larger universe of potential customers. In general, recruitment has been more successful with legacy customers who can build on their already successful Program participation as well as retail, industrial, office building, and government agency customers. An important factor in successfully engaging customers is the presence of a person knowledgeable of the facilities’ equipment who could understand the potential benefits of the Program and champion it internally. Also in general, load shedding opportunities have been less suitable for small customers, clean room sites and data centers within high tech, animal sites within biotech, hotels, and hospitals.
Some reasons why customers fail to get to the point of an executed CPA are now better understood.
Members of the Recruitment Team must be aware of some known factors that predict that a customer is less likely to join the Program. These factors include: (1) a shed potential that is insufficient, (2) expense of Auto-DR enablement which exceeds program incentives, (3) opportunities from other PG&E DR programs that appeared more lucrative, and (4) limited facilities manager time to focus on Auto-DR.
The recruitment of customers by TCs was limited but has the potential to grow.
EMCS integrators with an existing customer base could offer Auto-DR to those customers, thereby obtaining the recruitment incentive. Experience with the one TC who brought customers into the 2007 Program can be used as a model for future growth. Recruitment Coordinators should be focused on niche areas (e.g., chain accounts, industry, and water).
6.2 OBSERVATIONS AND RECOMMENDATIONS RELATED TO ASSESSMENT PROCESS
Observation Recommendation for 2008 Implementation and
Beyond Delayed definition of the hours used in the calculation of load shed caused customer confusion, slowed down the calculation of estimated shed, and required larger communications efforts from the Project Team.
Obtain definition of the hours for demand savings calculations at the onset of the Program.
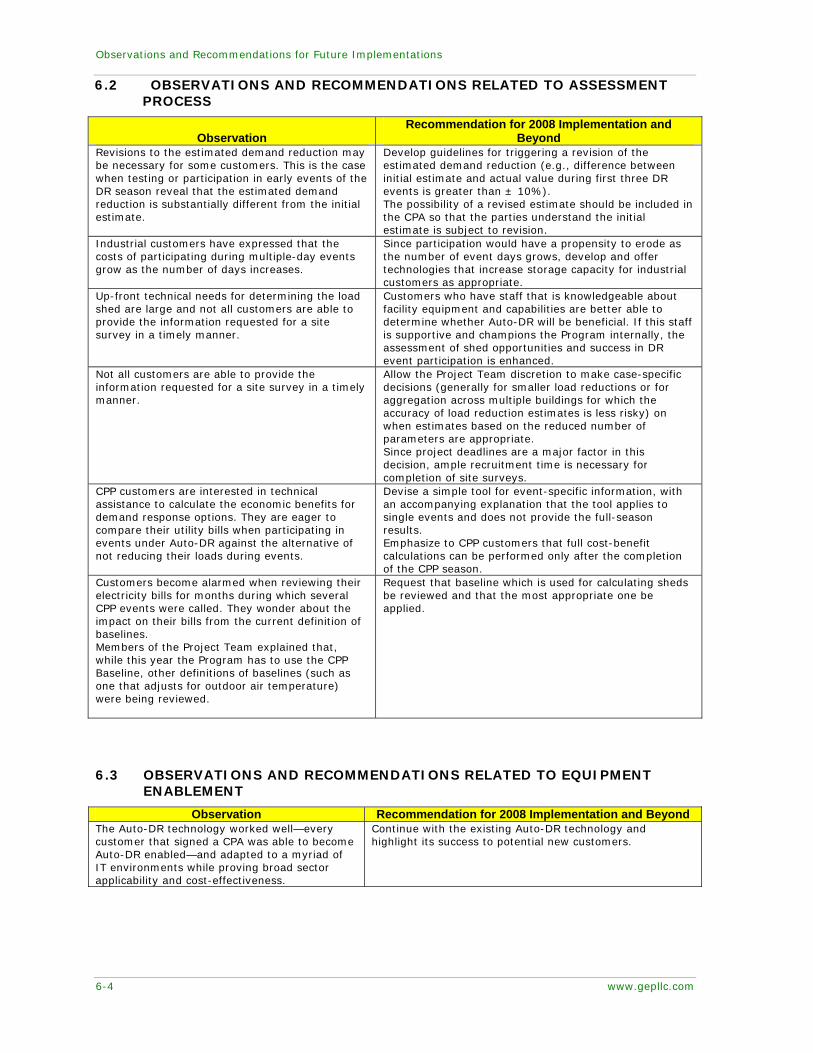
Observations and Recommendations for Future Implementations
6-4 www.gepllc.com
6.2 OBSERVATIONS AND RECOMMENDATIONS RELATED TO ASSESSMENT PROCESS
Observation Recommendation for 2008 Implementation and
Beyond Revisions to the estimated demand reduction may be necessary for some customers. This is the case when testing or participation in early events of the DR season reveal that the estimated demand reduction is substantially different from the initial estimate.
Develop guidelines for triggering a revision of the estimated demand reduction (e.g., difference between initial estimate and actual value during first three DR events is greater than ± 10%). The possibility of a revised estimate should be included in the CPA so that the parties understand the initial estimate is subject to revision.
Industrial customers have expressed that the costs of participating during multiple-day events grow as the number of days increases.
Since participation would have a propensity to erode as the number of event days grows, develop and offer technologies that increase storage capacity for industrial customers as appropriate.
Up-front technical needs for determining the load shed are large and not all customers are able to provide the information requested for a site survey in a timely manner.
Customers who have staff that is knowledgeable about facility equipment and capabilities are better able to determine whether Auto-DR will be beneficial. If this staff is supportive and champions the Program internally, the assessment of shed opportunities and success in DR event participation is enhanced.
Not all customers are able to provide the information requested for a site survey in a timely manner.
Allow the Project Team discretion to make case-specific decisions (generally for smaller load reductions or for aggregation across multiple buildings for which the accuracy of load reduction estimates is less risky) on when estimates based on the reduced number of parameters are appropriate. Since project deadlines are a major factor in this decision, ample recruitment time is necessary for completion of site surveys.
CPP customers are interested in technical assistance to calculate the economic benefits for demand response options. They are eager to compare their utility bills when participating in events under Auto-DR against the alternative of not reducing their loads during events.
Devise a simple tool for event-specific information, with an accompanying explanation that the tool applies to single events and does not provide the full-season results. Emphasize to CPP customers that full cost-benefit calculations can be performed only after the completion of the CPP season.
Customers become alarmed when reviewing their electricity bills for months during which several CPP events were called. They wonder about the impact on their bills from the current definition of baselines. Members of the Project Team explained that, while this year the Program has to use the CPP Baseline, other definitions of baselines (such as one that adjusts for outdoor air temperature) were being reviewed.
Request that baseline which is used for calculating sheds be reviewed and that the most appropriate one be applied.
6.3 OBSERVATIONS AND RECOMMENDATIONS RELATED TO EQUIPMENT ENABLEMENT
Observation Recommendation for 2008 Implementation and Beyond The Auto-DR technology worked well—every customer that signed a CPA was able to become Auto-DR enabled—and adapted to a myriad of IT environments while proving broad sector applicability and cost-effectiveness.
Continue with the existing Auto-DR technology and highlight its success to potential new customers.
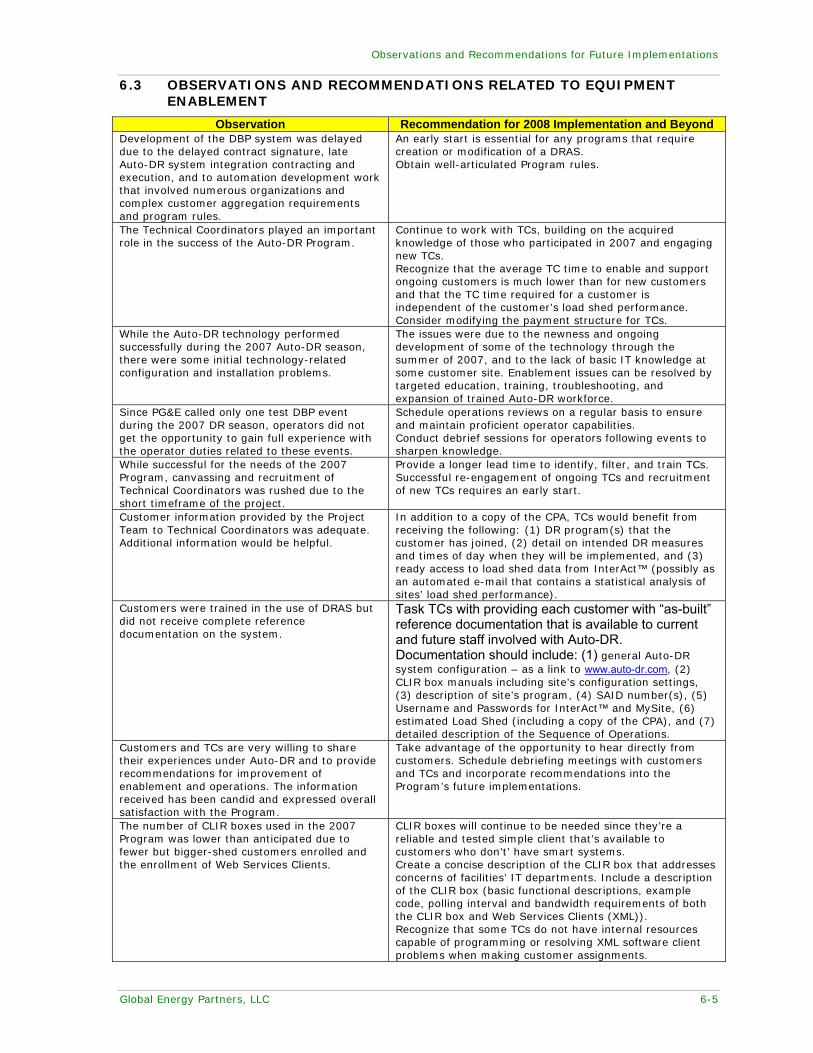
Observations and Recommendations for Future Implementations
Global Energy Partners, LLC 6-5
6.3 OBSERVATIONS AND RECOMMENDATIONS RELATED TO EQUIPMENT ENABLEMENT
Observation Recommendation for 2008 Implementation and Beyond Development of the DBP system was delayed due to the delayed contract signature, late Auto-DR system integration contracting and execution, and to automation development work that involved numerous organizations and complex customer aggregation requirements and program rules.
An early start is essential for any programs that require creation or modification of a DRAS. Obtain well-articulated Program rules.
The Technical Coordinators played an important role in the success of the Auto-DR Program.
Continue to work with TCs, building on the acquired knowledge of those who participated in 2007 and engaging new TCs. Recognize that the average TC time to enable and support ongoing customers is much lower than for new customers and that the TC time required for a customer is independent of the customer’s load shed performance. Consider modifying the payment structure for TCs.
While the Auto-DR technology performed successfully during the 2007 Auto-DR season, there were some initial technology-related configuration and installation problems.
The issues were due to the newness and ongoing development of some of the technology through the summer of 2007, and to the lack of basic IT knowledge at some customer site. Enablement issues can be resolved by targeted education, training, troubleshooting, and expansion of trained Auto-DR workforce.
Since PG&E called only one test DBP event during the 2007 DR season, operators did not get the opportunity to gain full experience with the operator duties related to these events.
Schedule operations reviews on a regular basis to ensure and maintain proficient operator capabilities. Conduct debrief sessions for operators following events to sharpen knowledge.
While successful for the needs of the 2007 Program, canvassing and recruitment of Technical Coordinators was rushed due to the short timeframe of the project.
Provide a longer lead time to identify, filter, and train TCs. Successful re-engagement of ongoing TCs and recruitment of new TCs requires an early start.
Customer information provided by the Project Team to Technical Coordinators was adequate. Additional information would be helpful.
In addition to a copy of the CPA, TCs would benefit from receiving the following: (1) DR program(s) that the customer has joined, (2) detail on intended DR measures and times of day when they will be implemented, and (3) ready access to load shed data from InterAct™ (possibly as an automated e-mail that contains a statistical analysis of sites’ load shed performance).
Customers were trained in the use of DRAS but did not receive complete reference documentation on the system.
Task TCs with providing each customer with “as-built” reference documentation that is available to current and future staff involved with Auto-DR. Documentation should include: (1) general Auto-DR system configuration – as a link to www.auto-dr.com, (2) CLIR box manuals including site’s configuration settings, (3) description of site’s program, (4) SAID number(s), (5) Username and Passwords for InterAct™ and MySite, (6) estimated Load Shed (including a copy of the CPA), and (7) detailed description of the Sequence of Operations.
Customers and TCs are very willing to share their experiences under Auto-DR and to provide recommendations for improvement of enablement and operations. The information received has been candid and expressed overall satisfaction with the Program.
Take advantage of the opportunity to hear directly from customers. Schedule debriefing meetings with customers and TCs and incorporate recommendations into the Program’s future implementations.
The number of CLIR boxes used in the 2007 Program was lower than anticipated due to fewer but bigger-shed customers enrolled and the enrollment of Web Services Clients.
CLIR boxes will continue to be needed since they’re a reliable and tested simple client that’s available to customers who don’t’ have smart systems. Create a concise description of the CLIR box that addresses concerns of facilities’ IT departments. Include a description of the CLIR box (basic functional descriptions, example code, polling interval and bandwidth requirements of both the CLIR box and Web Services Clients (XML)). Recognize that some TCs do not have internal resources capable of programming or resolving XML software client problems when making customer assignments.
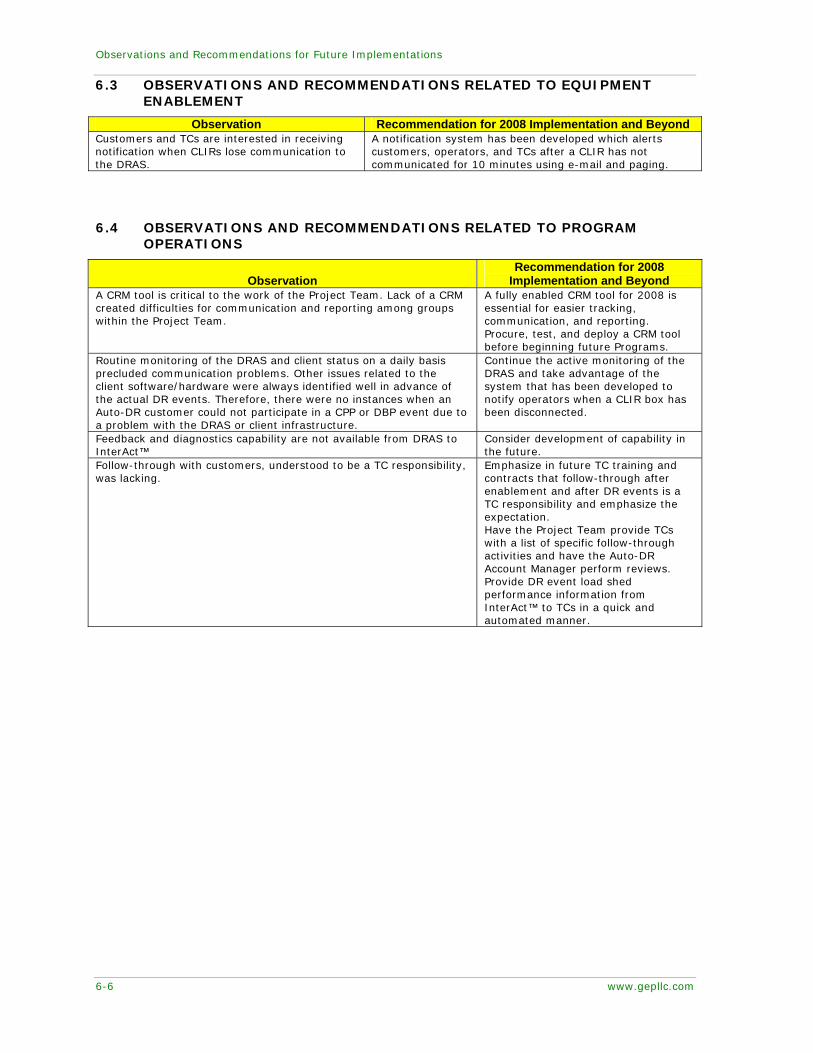
Observations and Recommendations for Future Implementations
6-6 www.gepllc.com
6.3 OBSERVATIONS AND RECOMMENDATIONS RELATED TO EQUIPMENT ENABLEMENT
Observation Recommendation for 2008 Implementation and Beyond Customers and TCs are interested in receiving notification when CLIRs lose communication to the DRAS.
A notification system has been developed which alerts customers, operators, and TCs after a CLIR has not communicated for 10 minutes using e-mail and paging.
6.4 OBSERVATIONS AND RECOMMENDATIONS RELATED TO PROGRAM OPERATIONS
Observation Recommendation for 2008
Implementation and Beyond A CRM tool is critical to the work of the Project Team. Lack of a CRM created difficulties for communication and reporting among groups within the Project Team.
A fully enabled CRM tool for 2008 is essential for easier tracking, communication, and reporting. Procure, test, and deploy a CRM tool before beginning future Programs.
Routine monitoring of the DRAS and client status on a daily basis precluded communication problems. Other issues related to the client software/hardware were always identified well in advance of the actual DR events. Therefore, there were no instances when an Auto-DR customer could not participate in a CPP or DBP event due to a problem with the DRAS or client infrastructure.
Continue the active monitoring of the DRAS and take advantage of the system that has been developed to notify operators when a CLIR box has been disconnected.
Feedback and diagnostics capability are not available from DRAS to InterAct™
Consider development of capability in the future.
Follow-through with customers, understood to be a TC responsibility, was lacking.
Emphasize in future TC training and contracts that follow-through after enablement and after DR events is a TC responsibility and emphasize the expectation. Have the Project Team provide TCs with a list of specific follow-through activities and have the Auto-DR Account Manager perform reviews. Provide DR event load shed performance information from InterAct™ to TCs in a quick and automated manner.