Embed Size (px)
Citation preview
�Pacific Flyway Management Plan for the
Pacific Coast Population of Band-tailed Pigeons

This management plan is one of a series of cooperatively developed plans for managing the various species of migratory birds of the Pacific Flyway. Inquiries about this plan may be directed to member states of the Pacific Flyway Council or to the Pacific Flyway Representative, U.S. Fish and Wildlife Service, 911 N.E. 11th Ave., Portland, OR 97232.
PACIFIC FLYWAY MANAGEMENT PLAN PACIFIC COAST POPULATION OF
BAND-TAILED PIGEONS
Prepared for the:
Pacific Flyway Council U.S. Fish and Wildlife Service
Canadian Wildlife Service
Prepared by:
Pacific Coast Band-tailed Pigeon Subcommittee Pacific Flyway Study Committee
March 1983 March 1994 July 2010
Approved by:__________________________________________ 11/24/2010 Chairman, Pacific Flyway Council Date
This management plan is one of a series of cooperatively developed plans for managing migratory birds in the Pacific Flyway. Inquiries about this plan may be directed to the Pacific Flyway Representative, U.S. Fish and Wildlife Service, 911 N.E. 11th Avenue, Portland, OR. Suggested Citation: Pacific Flyway Council 2010. Pacific Flyway management plan for the Pacific Coast population of band-tailed pigeons. Pacific Coast Band-tailed Pigeon Subcomm., Pacific Flyway Study Comm. [c/o USFWS], Portland, OR. Unpubl. rept. 19 pp.+ appendices.
PACIFIC FLYWAY MANAGEMENT PLAN
PACIFIC COAST POPULATION OF BAND-TAILED PIGEONS
Prepared by the Pacific Coast Population of Band-tailed Pigeon Subcommittee of the Pacific Flyway Study Committee:
Don Kraege, Washington Department of Fish and Wildlife Brad Bales, Oregon Department of Fish and Wildlife Dan Yparraguirre, California Department of Fish and Game Myke Chutter, British Columbia Ministry of Environment Andre Breault, Canadian Wildlife Service, Pacific & Yukon Region Brad Bortner, U.S. Fish and Wildlife Service, Region One Todd Sanders, U.S. Fish and Wildlife Service, Division of Migratory Bird Management Bob Trost, U.S. Fish and Wildlife Service, Division of Migratory Bird Management
TABLE OF CONTENTS
INTRODUCTION .......................................................................................................................... 1 GOAL AND OBJECTIVES ........................................................................................................... 2 STATUS ......................................................................................................................................... 3
A. Taxonomy and Description .................................................................................................... 3 B. Distribution, Abundance, and Migration ................................................................................ 3 C. Productivity and Survival ....................................................................................................... 6 D. Habitat Use ............................................................................................................................. 7 E. Hunting and Other Public Use ................................................................................................ 8
PROBLEMS ................................................................................................................................. 10 RECOMMENDED MANAGEMENT STRATEGIES ................................................................ 11
A. Population Assessment ......................................................................................................... 11 B. Habitat .................................................................................................................................. 11 C. Harvest .................................................................................................................................. 12 D. Research ............................................................................................................................... 13
ANNUAL REVIEW OF THE PLAN ........................................................................................... 14 LITERATURE CITED ................................................................................................................. 15
LIST OF FIGURES Figure 1: Breeding and winter ranges of the Pacific Coast ............................................................ 3 Figure 2. Estimated abundance (with 95% credible intervals) of Pacific Coast band-tailed
pigeons from the Mineral Site Survey, 2004–2009. ...................................................... 5 Figure 3: Federal frameworks for hunting seasons in WA, OR, CA .............................................. 8
LIST OF APPENDICES APPENDIX 1: Breeding Bird Survey (BBS) ............................................................................... 20 APPENDIX 2: Mineral Site Survey (MSS) .................................................................................. 21 APPENDIX 3: Direct and Indirect Recovery Locations of Pacific Coast Band-tailed Pigeons Banded Preseason* and Subsequently Shot or Found Dead, 1929-2008. .................................... 23 APPENDIX 4: Parts Collection Survey age structure of Pacific Coast band-tailed pigeons, determined from hunter shot birds during September through December, 1994 to 2009 ............ 24 APPENDIX 5: Estimated survival and recovery rates of Pacific Coast Band-tailed Pigeons for those areas and years with sufficient data (Brownie-Robson method) ................................... 25 APPENDIX 6: Pacific Coast band-tailed pigeon seasons in California, Oregon, and Washington, 1932–2009..................................................................................................................................... 26 APPENDIX 7: Harvest estimates for Pacific Coast band-tailed pigeons, 1999–2009 ................. 28 APPENDIX 8: Harvest Information Program active hunter estimates (mean and 95% confidence interval ½ width expressed as percent of the mean) for Pacific Coast band-tailed pigeons, 1999–2009............................................................................................................................................... 29 APPENDIX 9: Harvest Information Program days afield estimates (mean and 95% confidence interval ½ width expressed as percent of the mean) for Pacific Coast band-tailed pigeons, 1999–2009............................................................................................................................................... 30
1
INTRODUCTION
The Pacific Flyway Council is an administrative body that fosters cooperation among public wildlife agencies for the purpose of protecting and conserving migratory game birds in western North America. The Council has prepared numerous management plans for most populations of swans, geese, sandhill cranes, band-tailed pigeons, and mourning doves in the Pacific Flyway (www.pacificflyway.gov). These plans typically focus on populations, which are the primary unit of management, but may relate to a species or subspecies. Management plans serve to:
• Identify common goals • Coordinate collection and analysis of biological data • Establish priority of management actions and responsibility for them • Emphasize research needed to improve management
Flyway management plans are products of the Council, developed and adopted to help state and federal agencies cooperatively manage migratory game birds under common goals. Management strategies are recommendations, but do not commit agencies to specific actions or schedules. Fiscal, legislative, and priority constraints influence the level and timing of implementation. Pacific Flyway plans generally guide management and research for a 5-year planning horizon. This management plan is a revision of earlier plans adopted by the Pacific Flyway Council in 1983 and 1994. Neff (1947), Braun (1994), and Keppie and Braun (2000) have reviewed a substantial body of literature on band-tailed pigeons, this plan is not intended to replicate those efforts. The Pacific Coast band-tailed pigeon population ranges from British Columbia, Canada, through Washington, Oregon, California, and western Nevada in the United States and extends into northern Baja California in Mexico. Its breeding habitat preferences are conifer and oak-conifer woodlands, usually in mountainous terrain in and west of the Cascade and Sierra Nevada mountain ranges. Although migratory, the population breeds throughout its entire range and exhibits more of a nomadic movement, particularly in the south, than a true migration. Several factors combine to make management of the population difficult. Nesting populations generally are sparsely scattered throughout forested habitat, much of it in largely inaccessible mountainous terrain. Even in accessible areas, forest canopies prevent adequate observation of the birds. Direct census of the breeding population and is not possible due to these factors, and managers must rely on indices to assess annual fluctuations in populations. Likewise, inaccessible fall and winter habitat and nomadic characteristics of band-tails combined to render counts of birds at that time unreliable as annual indices to post-breeding season population size. Although historic banding data demonstrate relatively high adult survival, available evidence suggests band-tailed pigeon reproductive potential is low for a game bird. Any unusually high mortality could have immediate and long-lasting detrimental effects on the population. Various sources suggest that band-tailed pigeon populations have experienced significant long-term declines, including state and federal surveys in the 1960s and early 1970s. Because of these trends, the delicate relationship between mortality and reproduction, and the difficulty in assessing population status, special attention must be given to the Pacific Coast band-tailed pigeon population by wildlife agencies charged with its management.

2
GOAL AND OBJECTIVES
The goal of this management plan is to maintain the Pacific Coast band-tailed pigeon population and its habitat at levels to maintain current distribution and abundance, while sustaining recreational uses of this resource.
Objectives of this management plan are to:
A. Maintain or increase the Pacific Coast band-tailed pigeon population (objective is 5-year mean 2004-08 mineral site survey index).
B. Maintain sustainable levels of traditional consumptive and non-consumptive use.
C. Maintain, manage, and enhance nesting, migration and wintering habitats in sufficient quantity and quality to meet population and public use objectives.
3
STATUS A. Taxonomy and Description Taxonomy—Various authorities recognize six subspecies of band-tailed pigeon (Patagioenas fasciata) in the Western Hemisphere (Keppie and Braun 2000). The Pacific Coast band-tailed pigeon (P. f. monilis) has a distribution farther north and west than any of the other subspecies. Description— Pacific Coast band-tailed pigeons are large, stout-bodied birds, approximately 36 cm long and 300-500 gm in weight (Jeffrey 1977). Adults are blue-gray and both sexes have a conspicuous white neck crescent above an iridescent nape. The Pacific Coast band-tailed pigeon is larger and darker than the Interior subspecies (P. f. fasciata) which breeds in Arizona, Utah, Colorado, and New Mexico (see Figure 1). Detailed descriptions are given by Jeffrey (1977) and Braun (1994).
B. Distribution, Abundance, and Migration
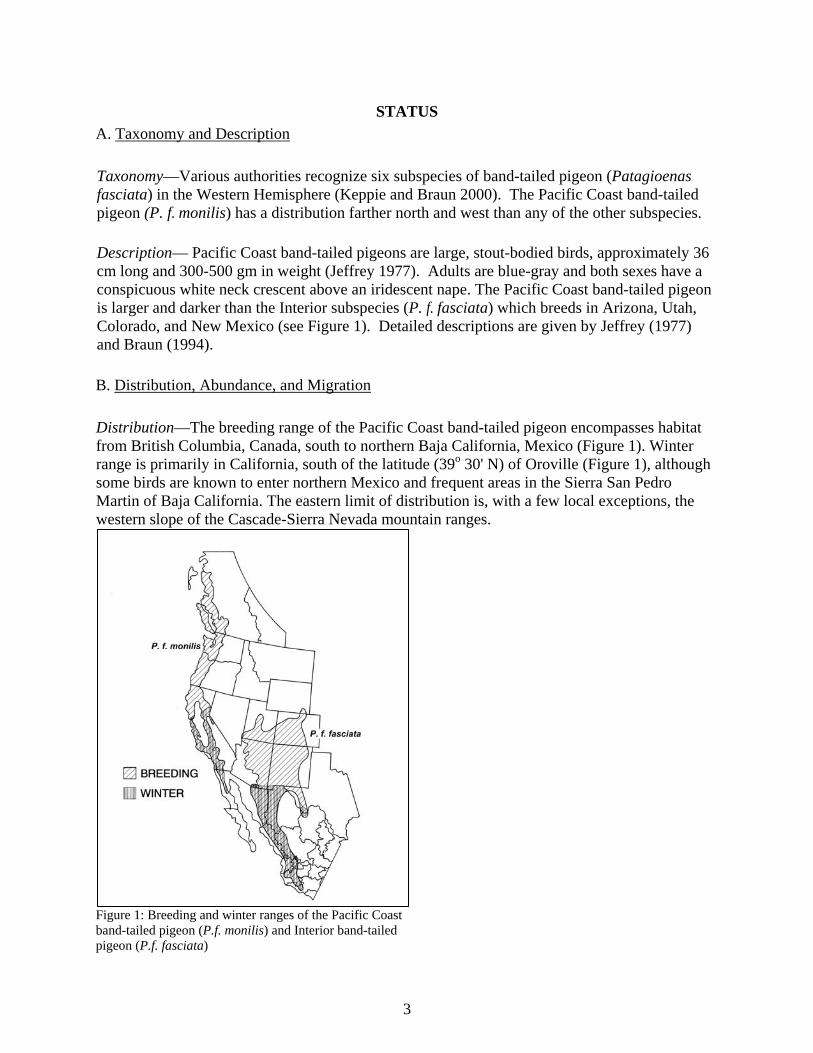
Distribution—The breeding range of the Pacific Coast band-tailed pigeon encompasses habitat from British Columbia, Canada, south to northern Baja California, Mexico (Figure 1). Winter range is primarily in California, south of the latitude (39o 30' N) of Oroville (Figure 1), although some birds are known to enter northern Mexico and frequent areas in the Sierra San Pedro Martin of Baja California. The eastern limit of distribution is, with a few local exceptions, the western slope of the Cascade-Sierra Nevada mountain ranges.
Figure 1: Breeding and winter ranges of the Pacific Coast band-tailed pigeon (P.f. monilis) and Interior band-tailed pigeon (P.f. fasciata)
4
Abundance—Direct population estimates of Pacific Coast band-tailed pigeons are extremely difficult to obtain because of their habits, visibility, and inaccessibility. In the early 1970s, the total population size was approximated at 2.9–7.1 million (Braun 1994). Two indirect estimates from the early 1990s placed the population at 2.4–3.1 million (R. Trost, pers. comm. 1993). The North American Breeding Bird Survey (BBS) has been conducted since 1966 in western states and Canada. From 252 BBS routes in British Columbia, California, Oregon, and Washington, coastal band-tailed pigeon populations are estimated to have decreased by 2.6 percent per year between 1966 and 2009, although the trend has not been significant (Sanders 2010). Recent BBS estimates indicate that the coastal population has decreased by 0.3% per year during the 2005-2009 period (Sanders 2010) (see Appendix 1). In much of their range, Pacific Coast band-tailed pigeons seek a mineral supplement to their diet of berries, which contain few minerals (Jarvis and Passmore 1992). Mineral sites have been known for many years to be important use areas for Pacific Coast band-tailed pigeons, which satisfy an elevated need for sodium (and possibly calcium), during the nesting season for egg and crop milk production (Sanders 2000). In 1950, Oregon Department of Fish and Wildlife (ODFW) initiated counts at mineral sites in August, just before the hunting season. Eight springs were selected based on consistency of surveys, and used as an index to the population (Jarvis and Passmore 1992). Although this index declined by over 50% from the early 1960s to the mid-1970s, the trend has been relatively stable since that time. In the late 1960s, students at Oregon State University demonstrated the feasibility of conducting call-count trend routes (Sisson 1968, Keppie et al. 1970). Their work was continued by the Washington Department of Fish and Wildlife (WDFW), and operational routes were established in Washington during 1975 (Jeffrey 1989). WDFW conducted the call-count survey from 1975-2003, maintaining 50 routes per year (WDFW 2008). Data from the survey were analyzed by USFWS using a route-regression method similar to the mourning dove call-count analysis (Sauer et al 2003). The survey showed a significant decline in the call-count index of 6.0% per year from 1975-1993 (p<0.05). After a season closure from 1991-2001, the survey indicated a long-term non-significant increasing trend of 1.8% per year for the period 1975-2003. In the 1960's, the California Department of Fish and Game (CDFG) conducted extensive counts of Pacific Coast band-tailed pigeons immediately before the hunting season (1960-63) and immediately after the season (1964-68). In each case, the department concluded that the surveys counted only a small and variable proportion of the total population and were not valid indices to population numbers (Mallette 1968), and these surveys were discontinued. Casazza et al. (2000) conducted a statistical power analysis of Pacific Coast band-tailed pigeon survey methods in Oregon and Washington, the BBS, and an experimental mineral site survey conducted at intervals throughout the nesting season. When compared with other surveys used at the time, mineral site counts conducted in July had the greatest power for detecting trends. Sample size requirements determined by power analysis suggested that a mineral site count of between 40 and 70 sites offered a high probability or power (>0.85) to detect 3-5 year trends in abundance. The analysis indicated that variance in the Oregon mineral site survey was adversely affected by the presence of migrants, which increasingly used the sites in August. For
5
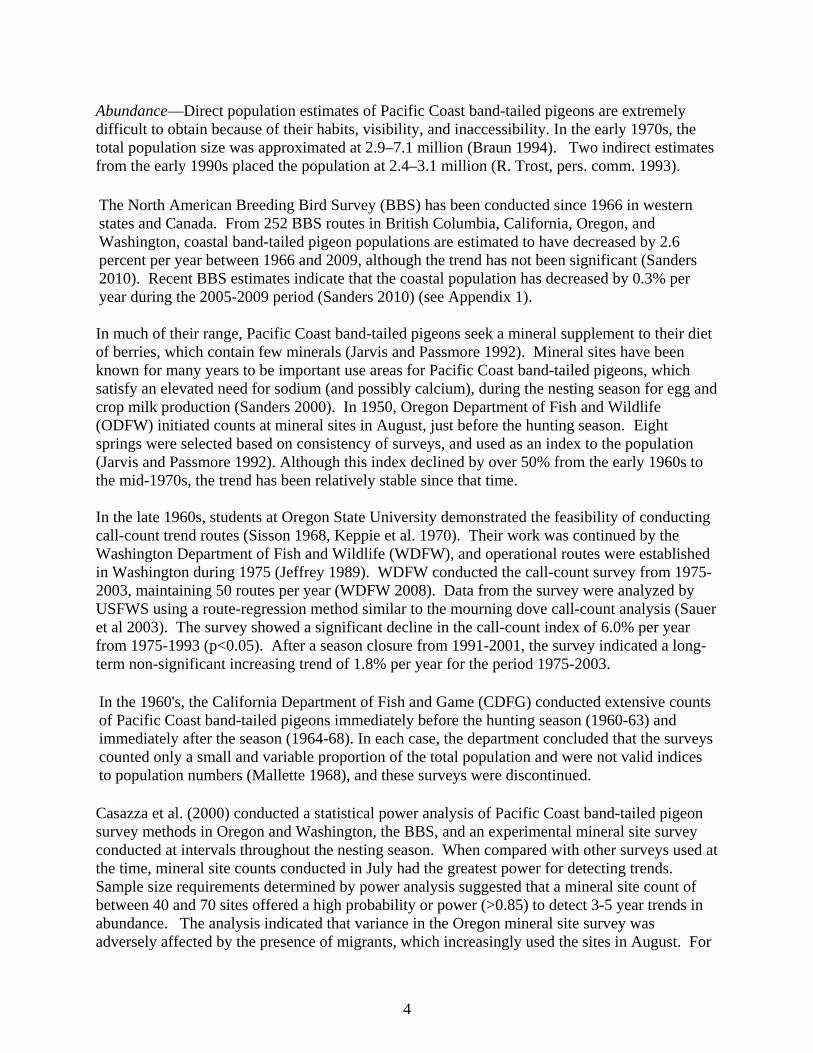
the Washington call-count survey, the low number of birds heard per route and observer changes led to high variance estimates. Based on this analysis, a mineral site survey (MSS) was developed and initiated on an experimental basis in 2001 and became operational range-wide in 2004 (Casazza et al. 2005). After development of the MSS, Washington call-count surveys were discontinued in 2004, but Oregon continued most August surveys of their mineral sites in addition to the MSS surveys in July. The MSS is a coordinated effort among State wildlife agencies in California, Oregon, and Washington, as well as the Canadian Wildlife Service (CWS) and U.S. Fish and Wildlife Service. The MSS involves a visual count of Pacific Coast band-tailed pigeons at approximately 45 mineral sites throughout the range of the population (10 in California, 19 in Oregon, 12 in Washington, and 4 in British Columbia) during July, from one-half hour before sunrise to noon. Results of the 2004-2009 MSS are presented in Figure 2 (see Appendix 2 for additional details). Analysis methods are described in Sanders (2010).
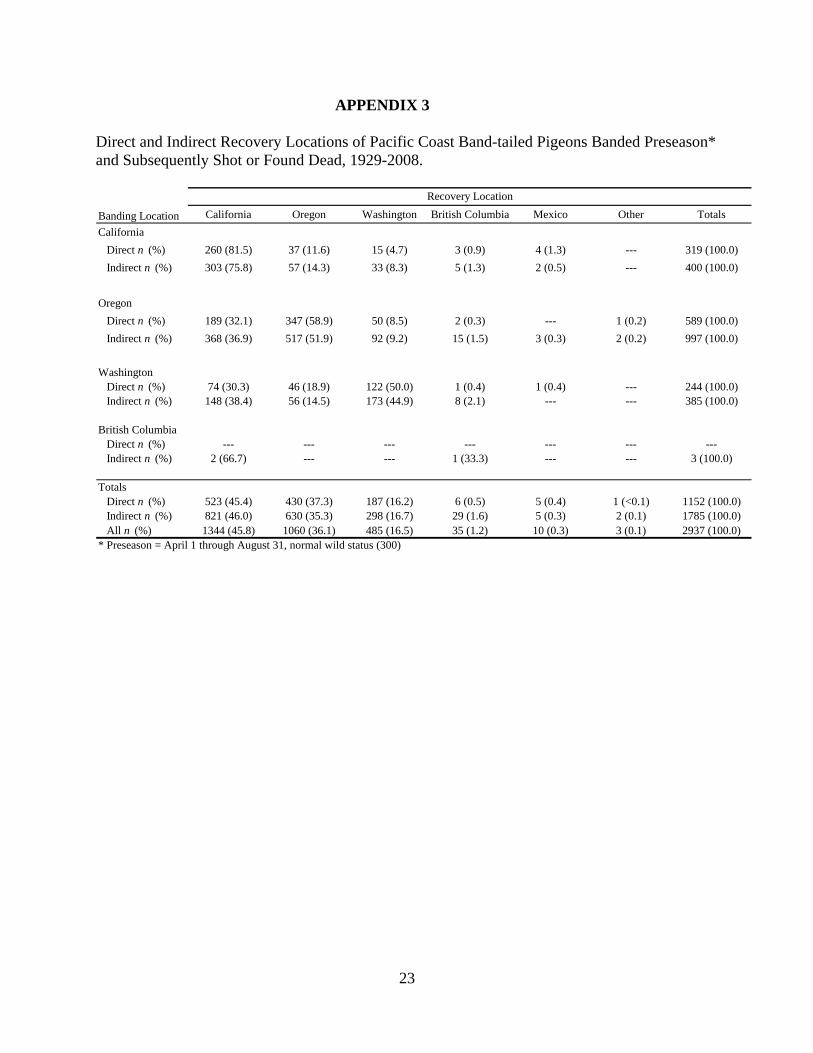
Figure 2. Estimated abundance (with 95% credible intervals) of Pacific Coast band-tailed pigeons from the Mineral Site Survey, 2004–2009. The first estimate is the average annual abundance index during the 5-year interval 2004–2008 (also the population objective and reference), and subsequent estimates are average annual abundance indices during 3-year moving intervals (2006 = 2004–2006, 2007 = 2005–2007, etc.). Migration— Since 1929, 57,457 Pacific Coast band-tailed pigeons have been banded preseason and 5,727 within season or postseason in California, Oregon, Washington, and British Columbia. Over 95% of these birds were banded before 1978. Because of the difficulty in trapping immature band-tailed pigeons, the preseason-banded sample consists mainly of adult birds (91%). Recovery locations from preseason bandings during 1929-2008 are summarized in Appendix 3.
6
In 2006, a satellite telemetry study was initiated by Casazza and Overton (2008) to evaluate breeding distribution and migration routes of Pacific Coast band-tailed pigeons. This study, which tracked 21 PC band-tails during 2007-09, found that spring migration started between April 16 and May 23 and ranged from 15 to 6 days, with an overall mean of 19 days. Fall migration had an average start date of September 23 and an average end date of November 7, for an average duration of 45 days. The overall average distance traveled between winter and breeding season use areas was about 740 km (n=35). C. Productivity and Survival
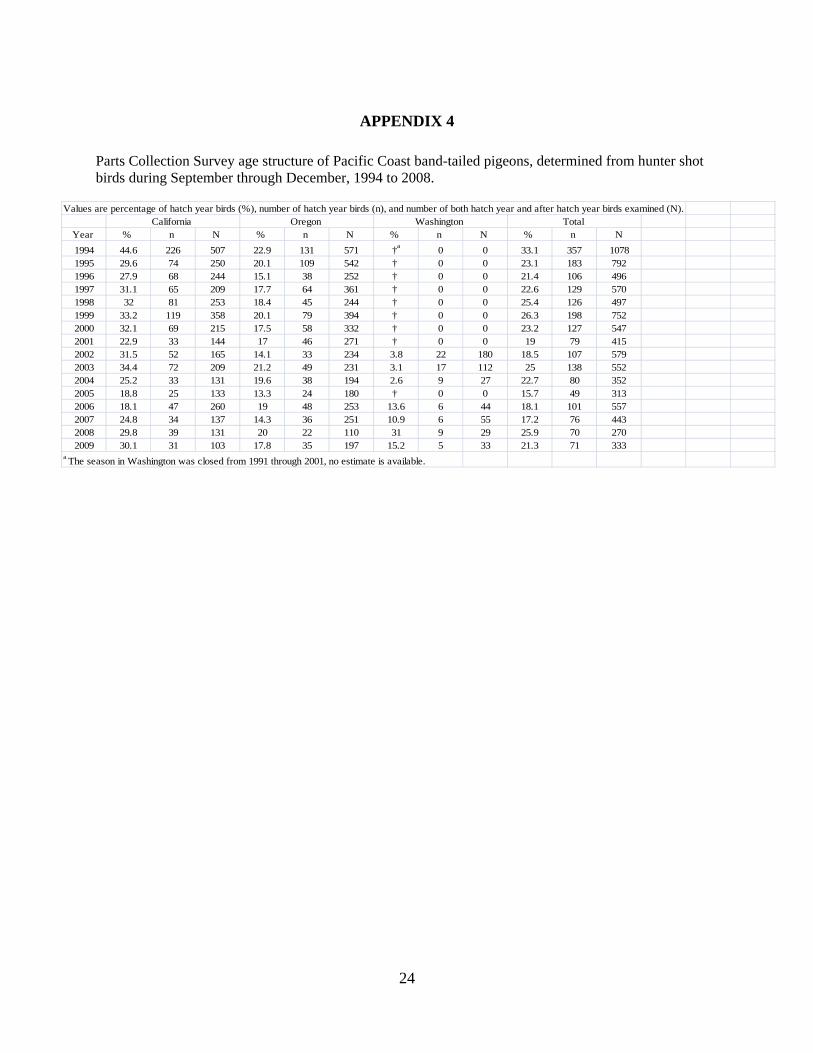
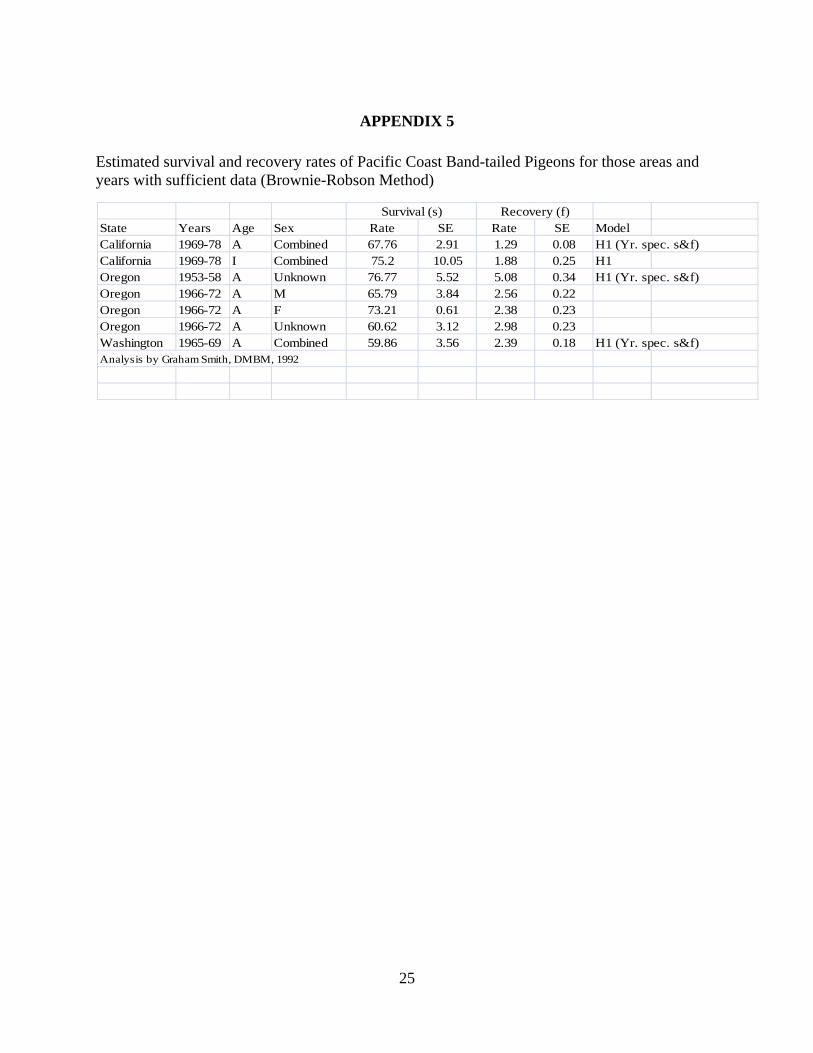
Productivity— Early studies provided basic data on nesting (Neff 1947, MacGregor and Smith 1955, Peeters 1962), while later projects have evaluated mineral site use, nesting habitat, and movements (Jarvis and Passmore 1992, Leonard 1998, Sanders 2000). Pacific Coast band-tailed pigeons nest primarily in conifers, occasionally in hardwoods and shrubs, within closed canopy conifer or mixed hardwood and conifer forest stands (Sanders 2008). Nests are loosely constructed twig platforms and placement is highly variable, ranging 6–120 feet above ground, but is generally near the bole and in dense foliage. Adults are presumably monogamous, and most clutches have one egg; however, some nesting pairs may complete up to three nesting cycles a year in mild climates offering long nesting seasons. Both parents incubate the egg and brood the squab. Nestlings are fed curd-like “crop milk” formed from the inside lining of the crop of both adults. Peak hatching dates were estimated from the progression of primary molt of wings collected from hunters in California (Slosson and Goss 1982), Washington (Jeffrey 1989), and Oregon (Jarvis and Passmore 1992). The peak of hatch was estimated to be during late July and early August. However, most of the wings were obtained from early September samples, and were thought to underestimate the numbers of squabs hatched between 1 August and 15 October. Wing collections of pigeons shot during mid- to late-September in California and Oregon, and during December in California, estimated that the peak of hatch was during the first 10 days of August, with a substantial number of birds hatched during September and October. Efforts to obtain age ratios in the Pacific Coast band-tailed pigeon harvest through wing-collection surveys were conducted sporadically in the past (Slosson and Goss 1982, Jeffrey 1989, and Jarvis and Passmore 1992). Since 1994, Pacific Coast band-tailed pigeons have been included in the nationwide Parts Collection Survey, which randomly selects a sample of hunters registered with the Harvest Information Program (HIP). These persons are sent envelopes in which to return one wing from each bird harvested. All wings received annually are examined and categorized by species, age, and sex (see Appendix 4). Survival— In an unpublished analysis of survival and recovery rates using the Brownie Robson method (Graham Smith, USFWS, pers. comm.), survival estimates for adults during 1965-78 varied from about 60-77% in California, Oregon, and Washington (see Appendix 5). A recent evaluation of banding needs concluded that over 15,000 bands would be required over a 5 year period to estimate survival, due to low band recovery rates associated with the population (Michael Casazza, USGS, pers. comm.).
7
Due to low band recovery rates, it is likely that hunting plays a minor role in annual mortality. Slosson and Goss (1982) reported mean direct band recovery rates of 0.37% and 2.38%, respectively, for pre- and post-season bandings in California during 1973-77. In Washington, mean direct recovery rates were 0.34% for immatures and 0.26% for adults during 1971-77 (Jeffrey 1989). Recovery rates derived from the Brownie-Robson method (Brownie et al. 1978) ranged from 1.29% in California to 2.98% in Oregon during varying time periods from 1965-78 (Appendix 5). In some years, virulent avian trichomoniasis contributes to increased mortality of band-tailed pigeons (Cole 1999). This disease is caused by a parasite passed directly from one bird to another through food, water, and crop milk, and is responsible for mortalities of at least 16,000 Pacific Coast band-tailed pigeons in California in 1988 (Cole 1999). D. Habitat Use
Preferred habitat types vary within breeding and wintering areas from near sea-level on the coast to 14,000 feet in elevation in the Cascade and Sierra Nevada mountains. Preferred tree species generally consist of conifers such as Douglas fir (Pseudotsuga menziesii), hemlock (Tsuga heterophylla), spruce (Picea spp.), fir (Abies spp.), and pine (Pinus spp.); broad-leaved trees such as alder (Alnus spp.), maple (Acer spp.), and particularly oak (Quercus spp.). Habitats components include berry- and nut-producing trees and shrubs such as cascara (Rhamnus purshiana), elderberry (Sambucus spp.), wild cherry (Prunus spp.), huckleberry (Vaccinium spp.), madrone (Arbutus spp.). Wintering Pacific Coast band-tailed pigeons generally frequent pine-oak woodland and coastal chaparral plant associations. However, they are nomadic and seek out locations with abundant food sources, particularly oak mast, pinon pine (Pinus edulis) nuts, and manzanita (Arctostaphylos spp.) fruits (Neff 1947, Smith 1968). Cultivated crops, such as wheat, corn, and peas also are attractive to pigeons as food sources in some years, particularly during early spring and winter (Braun 1994); commercial fruit, particularly cherries, also lure band-tails to orchards in years of natural food shortage. Feeding areas vary in location from year to year; an area containing large numbers of birds one year may be completely empty of birds the next. Habitats for Pacific Coast band-tailed pigeons have been influenced by timber harvest and other human activities. Although timber harvest on private lands began in the late 1800s, major timber harvest programs by the Forest Service and BLM started between 1945-50 (Lujan et al. 1992). Clear-cutting with subsequent replanting has been the most widely used technique. Modern silvicultural practices, including the use of herbicides to control deciduous shrubs and trees, have potentially reduced food-producing plants throughout the range of the Pacific Coast band-tailed pigeon (Braun 1994). Berry/mast- producing shrubs and trees are important food sources, particularly close to mineral sources and higher elevation areas used during migration (Braun 1994). Mineral sites used by band-tails are not very common, and many are in private ownership without protection from loss or degradation (Casazza 2003). Casazza and Overton (2008) found high fidelity of birds to breeding areas. Based on tracking movements of individual birds with satellite transmitters between 2007 and 2009, the average distance between the centers of annual
8
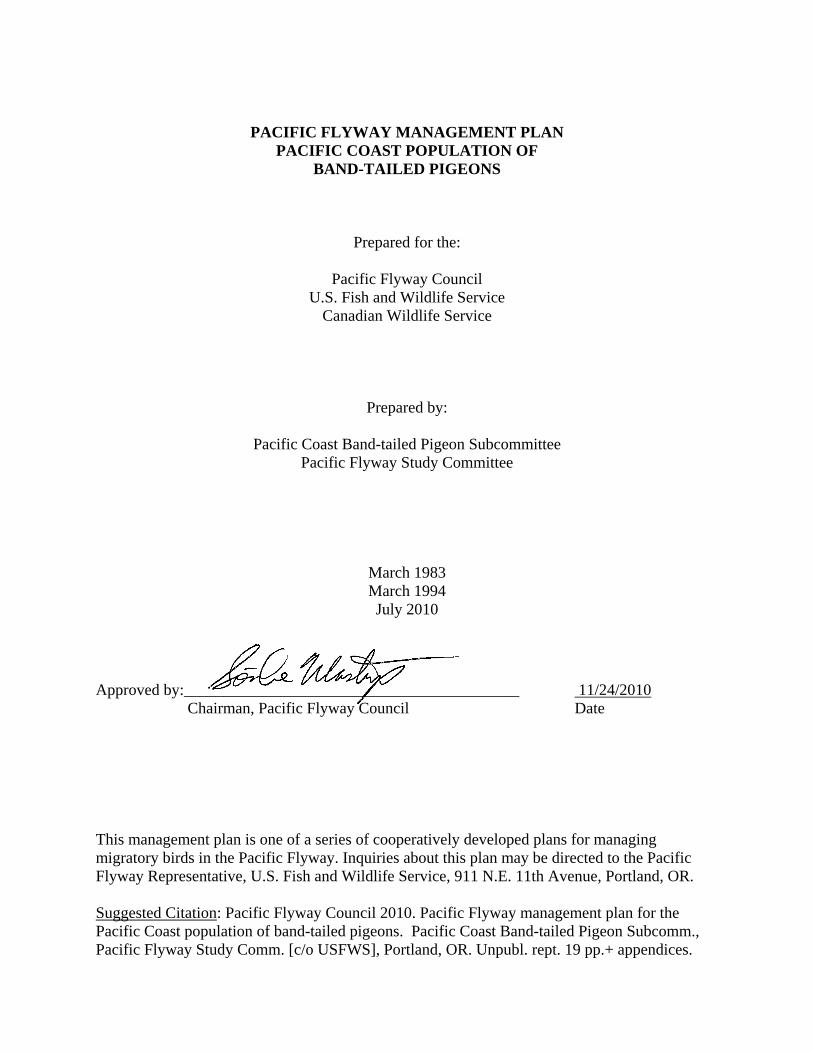
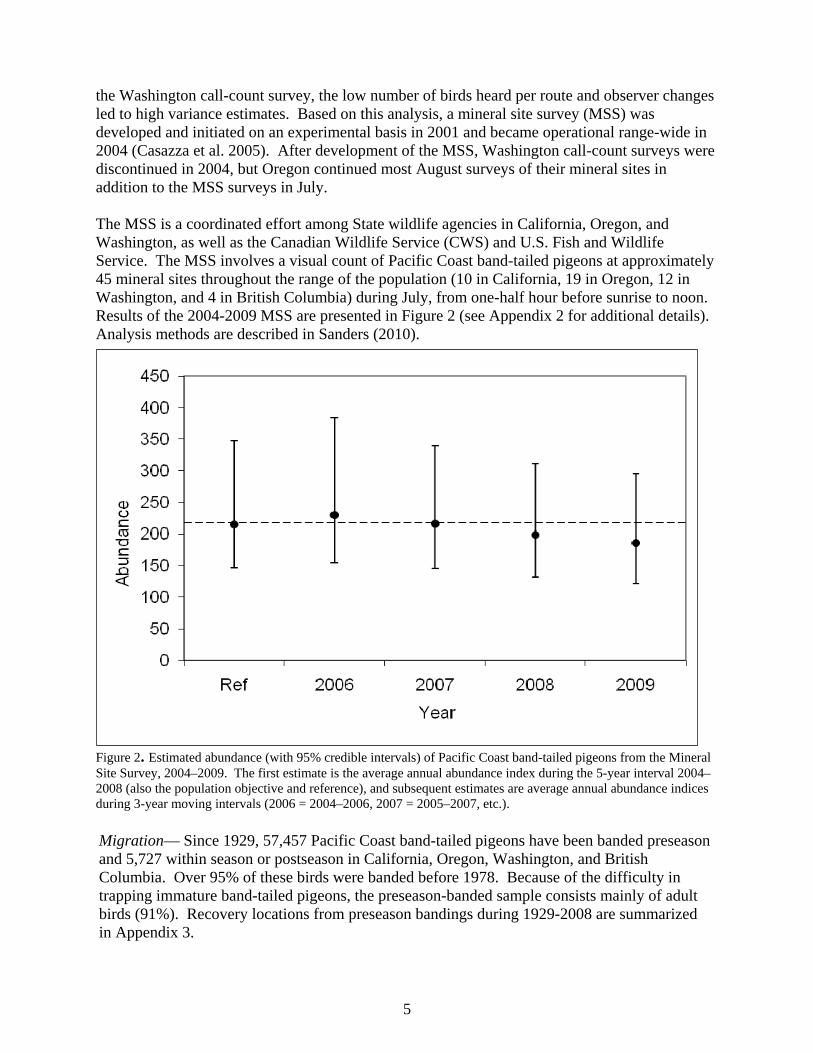
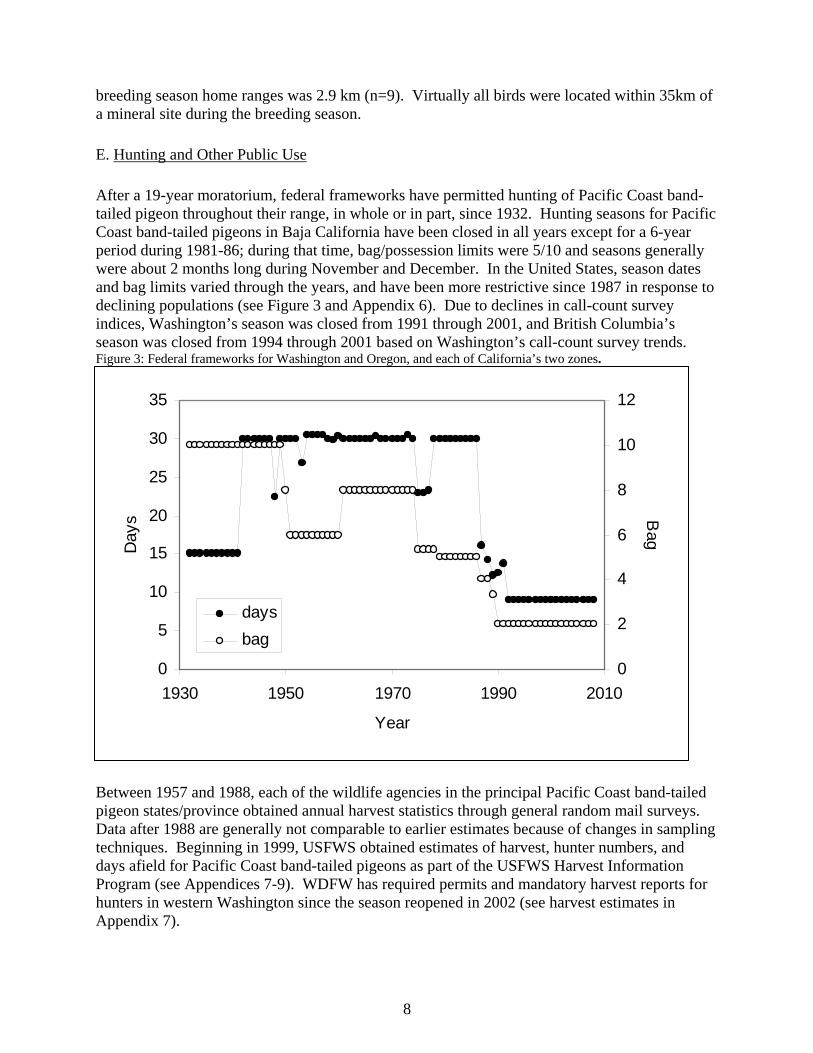
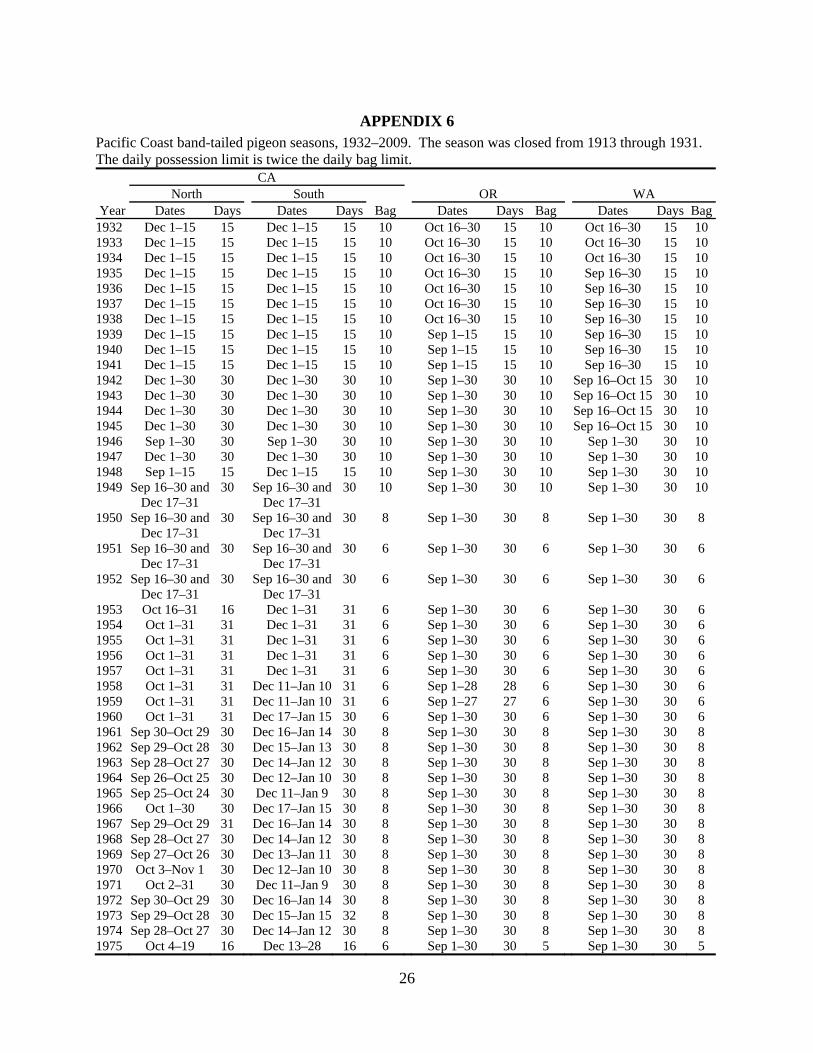
breeding season home ranges was 2.9 km (n=9). Virtually all birds were located within 35km of a mineral site during the breeding season. E. Hunting and Other Public Use After a 19-year moratorium, federal frameworks have permitted hunting of Pacific Coast band-tailed pigeon throughout their range, in whole or in part, since 1932. Hunting seasons for Pacific Coast band-tailed pigeons in Baja California have been closed in all years except for a 6-year period during 1981-86; during that time, bag/possession limits were 5/10 and seasons generally were about 2 months long during November and December. In the United States, season dates and bag limits varied through the years, and have been more restrictive since 1987 in response to declining populations (see Figure 3 and Appendix 6). Due to declines in call-count survey indices, Washington’s season was closed from 1991 through 2001, and British Columbia’s season was closed from 1994 through 2001 based on Washington’s call-count survey trends. Figure 3: Federal frameworks for Washington and Oregon, and each of California’s two zones.
Between 1957 and 1988, each of the wildlife agencies in the principal Pacific Coast band-tailed pigeon states/province obtained annual harvest statistics through general random mail surveys. Data after 1988 are generally not comparable to earlier estimates because of changes in sampling techniques. Beginning in 1999, USFWS obtained estimates of harvest, hunter numbers, and days afield for Pacific Coast band-tailed pigeons as part of the USFWS Harvest Information Program (see Appendices 7-9). WDFW has required permits and mandatory harvest reports for hunters in western Washington since the season reopened in 2002 (see harvest estimates in Appendix 7).
0
5
10
15
20
25
30
35
1930 1950 1970 1990 2010
Year
Day
s
0
2
4
6
8
10
12
Bag
daysbag
9
The Canadian Wildlife Service (CWS) has estimated harvest in British Columbia since 1967, and the BC Ministry of Environment has provided an additional mail questionnaire since re-opening the season in 2002 (see Appendix 7). The CWS Committee on the Status of Endangered Wildlife in Canada (COSEWIC 2008) recently completed an assessment of the status of Pacific Coast band-tailed pigeons in Canada and recommended the species be listed under the Species At Risk Act (SARA) as “Species of Concern”, which may affect its future status as a game species. The federal Minister of the Environment will oversee consultation on whether the species should be added to the List of Wildlife Species at Risk (Schedule 1) under SARA. Provincially the species is Blue-listed in BC (equivalent of Special Concern). Studies conducted in Oregon in the 1980s found that hunting at mineral sites in Oregon during early September may disproportionately harvest experienced adult breeders (Jarvis and Passmore 1992). Based on this information, federal season frameworks in Oregon and Washington have been restricted to September 15 or later since 1988 to reduce harvest on this productive portion of the population. Likewise, research in British Columbia by March (1971) indicated similar impacts from early September harvest. Band-tailed pigeon seasons were closed in British Columbia between 1994 and 2001 and a restrictive season with a delayed opening (moved from 1 to 15 September) was re-introduced in 2002. Because the band-tailed pigeon generally is a secretive bird in secluded habitat, birders seek it and other forest birds during field trips. The band-tailed pigeon's habit of frequenting mineral springs is exploited by photographers who can establish blinds in advantageous positions for close-up photographs. During the past 30 years, many people have established backyard feeder and water stations in urban and suburban areas that attract band-tails on a daily basis.
10
PROBLEMS
A. Uncertainty associated with assessment of population size and trends. B. Lack of current information to derive survival and harvest rates, assess vital rates, and
determine effects on population dynamics. C. Low reproductive potential relative to other game birds, limiting population growth rates. D. Unknown effects of timber management, as well as loss or degradation of mineral sites,
on the potential for remaining habitats to support desired population levels. Of particular concern are:
a. Herbicide treatment of clear-cut areas causing reduction of food-producing shrubs.
b. Monoculture in forest regeneration causing lack of variety in feeding areas. c. Harvest of cascara bark; this practice kills the plants with resultant loss of an
important food source. d. Removal of oak species for charcoal and firewood and to provide grazing areas in
California and Oregon; removal of oak and other forage species by residential and commercial development in Washington and British Columbia.
e. Loss of mineral springs because of natural degeneration or development. E. Unknown effects of environmental pollution and disease, including Trichomoniasis.
11
RECOMMENDED MANAGEMENT STRATEGIES
The following management procedures are recommended in recognition that the degree and timing of their implementation by the various agencies will be influenced by staffing levels and fiscal and legislative constraints beyond the scope of this plan. However, considering the present status of Pacific Coast band-tailed pigeons, a renewed effort among states, provinces, and federal wildlife/land management agencies should be made to provide adequate funding and personnel to achieve the goals, objectives, and management strategies outlined in this plan.
A. Population Assessment
1. Coordinate and conduct annual mineral site survey to assess population trends.
Lead Agency: USFWS Participating: States, BC, CWS Priority: 1 Schedule: Ongoing
2. Maintain and enhance mail-parts survey to assess annual production.
Lead Agency: USFWS Priority: 2 Schedule: Ongoing
B. Habitat
1. Develop and distribute habitat management guidelines to promote beneficial silvicultural
and land development practices for Pacific Coast band-tailed pigeons.
Lead Agencies: States, BC, USFWS, USFS, CWS Priority: 1 Schedule: ongoing
2. Support documentation, acquisition, and enhancement of all existing mineral sites, and
establishment of new mineral sites.
Lead Agencies: States, BC, USFWS, USFS, CWS Priority: 1 Schedule: ongoing
12
3. Identify status and trends of habitat used by Pacific Coast band-tailed pigeons throughout their range.
Lead Agencies: States, BC, USFWS, USFS, CWS Priority: 2 Schedule: ongoing
C. Harvest
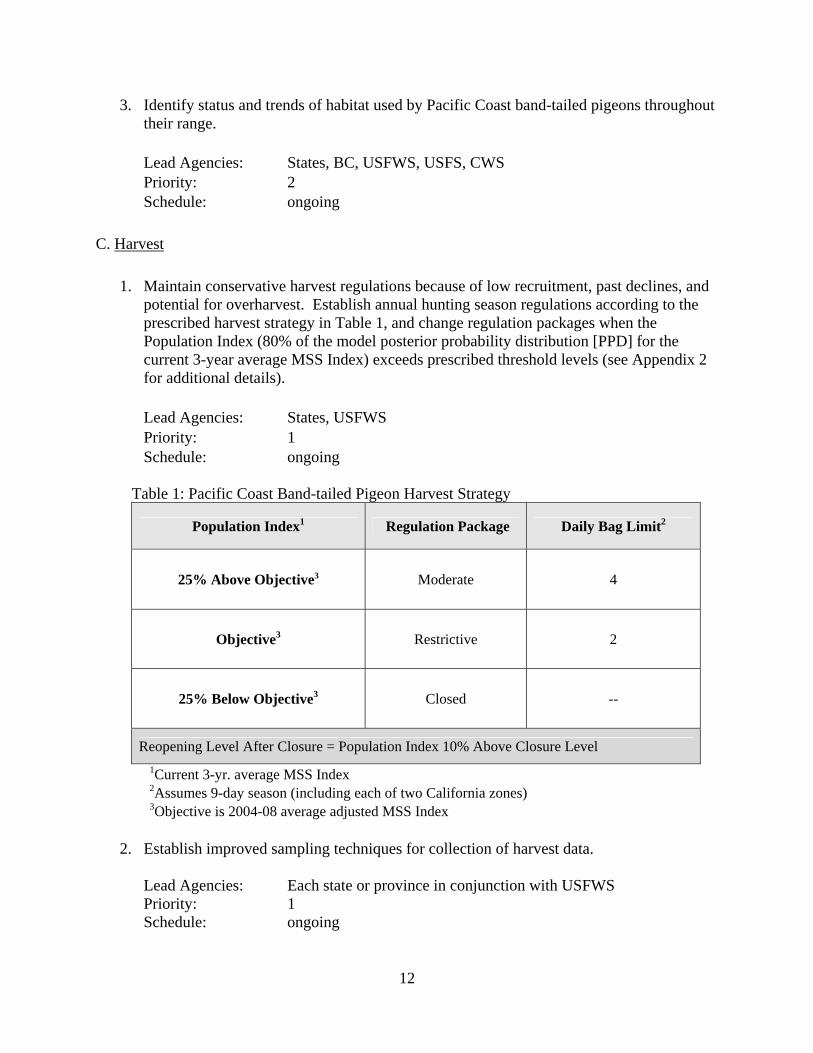
1. Maintain conservative harvest regulations because of low recruitment, past declines, and potential for overharvest. Establish annual hunting season regulations according to the prescribed harvest strategy in Table 1, and change regulation packages when the Population Index (80% of the model posterior probability distribution [PPD] for the current 3-year average MSS Index) exceeds prescribed threshold levels (see Appendix 2 for additional details).
Lead Agencies: States, USFWS Priority: 1 Schedule: ongoing
Table 1: Pacific Coast Band-tailed Pigeon Harvest Strategy
Population Index1 Regulation Package Daily Bag Limit2
25% Above Objective3
Moderate
4
Objective3 Restrictive 2
25% Below Objective3 Closed --
Reopening Level After Closure = Population Index 10% Above Closure Level 1Current 3-yr. average MSS Index 2Assumes 9-day season (including each of two California zones) 3Objective is 2004-08 average adjusted MSS Index
2. Establish improved sampling techniques for collection of harvest data.
Lead Agencies: Each state or province in conjunction with USFWS Priority: 1
Schedule: ongoing
13
D. Research 1. Evaluate the reliability of the MSS and BBS to estimate trends and abundance.
Lead Agencies: USFWS, USGS, CWS Priority: 1 Schedule: 2011-2012
2. Support research to evaluate foraging habitat in relation to nesting areas, compare quality of foraging habitat relative to vital rates, investigate the effects of herbicide applications on forage species, and evaluate other silvicultural practices affecting band-tail survival and reproduction.
Lead Agencies: Subcommittee Priority: 1 Schedule: 2011-2012
3. Evaluate effects of disturbance on daily use of mineral sites and reproductive success. Lead Agencies: USGS, States, BC/CWS Priority: 2 Schedule: 2010-11
4. Investigate the effects of diseases and contaminants on Pacific Coast band-tailed pigeons.
Lead Agencies: USGS Priority: 2 Schedule: ongoing
5. Evaluate telemetry marking project to assess current survival rates.
Lead Agency: USGS Participating: Subcommittee Priority: 3 Schedule: 2010-11

14
ANNUAL REVIEW OF THE PLAN
The subcommittee shall meet annually, or as needed, to review progress in meeting the goals and objectives of this plan and to recommend revisions. The subcommittee shall report on this progress to the Pacific Flyway Council and to other organizations interested in cooperating in management of Pacific Coast band-tailed pigeons. It will be the responsibility of the U.S. Fish and Wildlife Service (DMBM) to annually update tables on population status and harvest, and determine the current population parameters for the harvest strategy.
15
LITERATURE CITED
American Ornithologists’ Union. 2008. Check-list of North American birds, 6th ed. Allen Press, Inc., Lawrence, Ks. 877 pp.
Atwood, E. L. 1956. Validity of mail survey data on bagged waterfowl. J. Wildl. Manage. 20(1):1-16.
Babcock, K. M., E. G. Hunt, and P. S. Duncan. 1990. Waterfowl breeding ground surveys and migratory bird harvest surveys. Ad hoc committee report to IAFWA. 28 pp.
Bendire, C. 1892. Life histories of North American birds with special reference to their breeding habits and eggs. Smithsonian Contrib. to Knowledge 28. U.S. Natl. Mus., Special Bull. No.1. 446pp.
Benson, D. A. 1968. Waterfowl harvest and hunter activity in Canada during the 1967-68 hunting season. Progress Notes—Can. Wildl. Serv. No.5. 6pp.
Benson, D. A. 1969. Waterfowl harvest and hunter activity in Canada during the 1968-69 hunting season. Progress Notes—Can. Wildl. Servo No. 10. 6pp.
Benson, D. A. 1970. Report on sales of the Canada migratory game bird hunting permit and waterfowl harvest and hunter activity, 1969-70. Progress Notes—Can. Wildl. Serv. No. 16. 34pp.
Benson, D. A. 1971. Report on sales of the Canada migratory game bird hunting permit and waterfowl harvest and hunter activity, 1970. Progress Notes—Can. Wildl. Serv. No. 22. 29pp.
Bolsinger, C. L. 1988. The hardwoods of California’s timberlands, woodlands, and savannas. Resource. Bull. PNW-RB148. Portland, Ore. U.S. Dept. Agri., Forest Service, Pac. Northwest Res. Sta. 148pp.
Braun, C. E. 1972. Movements and hunting mortality of Colorado band-tailed pigeons. Trans. N. Am. Wildl. Nat. Resour. Conf. 37:326-334.
Braun, C. E. 1973. Distribution and habitats of band-tailed pigeons in Colorado. Proceedings—West. Assoc. State Game and Fish Comm. 53:336-344.
Braun, C. E. 1994. Band-tailed Pigeon. In Tacha, T. and C. E. Braun. Migratory shore and upland game bird management in North America. Allen Press, Lawrence, Kansas. 223 pp.
Braun, C. E., W. J. Adrian, and R. E. Keiss. 1977. Mercury residues in Colorado band-tailed pigeons. J. Wildl. Manage. 41:131-134.
Braun, C. E., D. E. Brown, J. D. Pederson, and T. P. Zapatka. 1975. Results of the Four-corners cooperative band-tailed pigeon investigation. U.S. Fish Wildl. Serv., Resour. Pub. 126. 20pp.
Braun, C. E., F. J. Ward, J. Allen, and R. J. Boyd. 1979. Plumage aberrancies in band-tailed pigeons. Southwest Nat. 24(2) :391-393.
Brewer, L. W. 1981. Pages 87-91. Migratory upland bird report — band-tailed pigeon. In western migratory upland game bird committee report, 1981. Compiler J. C. Bartonek. 91pp.
Brownie, C., D. R. Anderson, K. P. Burnham, and D. S. Robson. 1978. Statistical inference from band recovery data—A handbook. U.S. Fish and Wildl. Servo Resource Publ. 131. 212 pp.
16
California Department of Fish and Game. 1966. Calif. Fish and Wildl. Plan. Vol. II. Calif.
Dept. of Fish and Game. 68pp. Casazza, Michael L., J.L. Yee, M. R. Miller, D.L. Orthmeyer, D. R. Yparraguirre, R. L. Jarvis,
and C. T. Overton. 2005. Evaluation of current population indices for band-tailed pigeons. Wildlife Society Bulletin 33(2):606-615.
Casazza, Michael L., and C. T. Overton. 2008. Breeding distribution and migration routes of Pacific Coast band-tailed pigeons In Dolton, D. D. (Compiler). 2009. Webless Migratory Game Bird Research Program, Project Abstracts – 2008. USFWS, Laurel, MD.
Chambers, W. L. 1912. Who will save the band-tailed pigeon? Condor 14(3) :108. Cole, R.A. 1999. Trichomoniasis. Pages 201-206 in M. Friend and J.C. Franson, editors. Field
manual of wildlife diseases. U.S. Geological Survey, Madison, WI, USA. Cooch, F. G., G. W. Kaiser, and L. Wight. 1973. Report on 1972 sales of the Canada migratory
game bird hunting permit, migratory game bird harvest and hunter activity. Progress Notes—Can. Wildl. Serv. No. 34. 10 pp.
Cooley, C. D., J. A. Jackson, B. J. Schardien, and F. Swan. 1979. Band-tailed pigeon—first state record for Mississippi. Miss. Kite 9(1):5-6.
Coues, E. 1874. Birds of the northwest: A handbook of the ornithology of the region drained by the Missouri River and its tributaries. U.S. Geol. Survey of the Territories, Misc. Publ. No.3, Wash., 791pp.
Curtis, P. D. 1981. Evaluation of daily counts of band-tailed pigeons as a census method. M.S. Thesis. Colo. State Univ., Ft. Collins. 113pp.
Curtis, P. D., and C. E. Braun. 1980. Evaluation of daily counts of band-tailed pigeons as a census method. J. Colo.-Wyo. Acad. Sci. 12(1):36-37. Abstract only.
Curtis, P. D., and C. E. Braun. 1981. Band-tailed pigeon behavior at artificial bait sites in Colorado. J. Colo.-Wyo. Acad. Sci. 13(1):56. Abstract only.
Denney, R. R. 1981. Pages 73-82. Band-tailed pigeon report. In western upland game bird committee report, 1981. Compiler J. C. Bartonek. 91pp.
Dolton, D. D. 1985. Mourning dove breeding population status, 1985. U. S. Fish and Wildl. Servo Admin. Rept., Laurel, Md., 11 pp.
Dolton, D. D. 1993. The call-count survey: historic development and current procedures. Pp. 233-252 in T. S. Baskett, M. W. Sayre, R. E. Tomlinson, and R. E. Mirarchi, eds., Ecology and management of the mourning dove. Stackpole Books, Harrisburg, PA 567 pp.
Drewien, R. C., R. J. Vernimen, S. W. Harris, and C. F. Yocom. 1966. Spring weights of band-tailed pigeons. J. Wildl. Manage. 30(1):190-192.
Duncan, L. R. 1979. A band-tailed pigeon recovery in Florida. Fla. Field Nat. 7(2).28-29. Einarsen, A. S. 1953. Problems of the band-tailed pigeon. Proceedings of the Western Assoc.
State Game and Fish Comm. 33:140-146. Evans, M. 1980. First North Carolina record of a band-tailed pigeon. Chat 44(4) :106-107. Fitzhugh, E. L. 1970. Literature review and bibliography of the band-tailed pigeon of Arizona,
Colorado, New Mexico and Utah. Ariz. Dept. of Game and Fish, Spec. Rep. 33pp. Fitzhugh, E. L. 1974. Chronology of calling, egg laying, crop gland activity, and breeding
among wild band-tailed pigeons in Arizona. Ph.D. Dissertation. Univ. of Ariz., Tucson. 85pp.
17
Fry, M. E., and C. E. Vaughn. 1977. Acorn selection by band-tailed pigeons. Calif. Fish and Game 63(1):59-60.
Geissler, P. H. 1984. Estimation of animal population trends and annual indices from a survey
of call-counts or other indications. Pages 472-477 in Proc. 1984 Amer. Statis. Assoc., Sec. on Surv. Res. Methods. Amer. Statis. Assoc., 21 Washington, D. C. 830 pp.
Glover, F. A. 1953. A nesting study of the band-tailed pigeon (Columba fasciata) in northwestern California. Calif. Fish and Game 39(3) :397-407.
Goodwin, D. 1983. Pigeons and doves of the world. 3rd ed. Cornell Univ. Press, Ithaca, N.Y. 363 pp.
Grinnell, J. 1913. The outlook for conserving the band-tailed pigeon as a game bird of California. Condor 15(1) :25-40.
Gutierrez, R. J. 1973. Reproductive biology of the band-tailed pigeon (Columba fasciata). M.S. Thesis. Univ. of N.M., Albuquerque. 28pp.
Gutierrez, R. J., C. E. Braun, and T. P. Zapatka. 1975. Reproductive biology of the band-tailed pigeon in Colorado and New Mexico. Auk 92(4) :665-677.
Harris. 1968. Methods for determining age of band-tailed pigeons. J. Wildl. Manage. 32(2):421-424.
Houston, D. B. 1963. A contribution to the ecology of the band-tailed pigeon, Columba fasciata M.A. Thesis. Univ. of Wyo., Laramie. 74pp.
Hunt, C. B. 1967. Physiography of the United States. W. H. Freeman & Co., San Francisco, Calif. 480pp.
Jarvis, R. L., and M. F. Passmore. 1992. Ecology of band-tailed pigeons. In Oregon. Biol. Rept. 6, U. S. Fish and Wildl. Serv., Washington, D. C. 38 pp.
Jeffrey, R. G., Chairman. 1977. Pages 210-245. Band-tailed pigeon (Columba fasciata). In G. C. Sanderson (editor). Management of migratory shore and upland game birds in North America. Intl. Assoc. of Fish and Wildl. Agencies., Wash., D.C. 358pp.
Jeffrey, R. G. 1989. The band-tailed pigeon: distribution, effects of harvest, regulations, mortality rates, and habits, 1968-79. Completion Rept., Washington Dept. of Wildlife, Olympia. 97 pp.
Kautz, J. E., and C. E. Braun. 1981. Survival and recovery rates of band-tailed pigeons in Colorado. J. Wildl. Manage. 45(1):214-218.
Keppie, D. M. 1977. Morning versus afternoon calling of band-tailed pigeons. J. Wildl. Manage. 41(2) :320-322.
Keppie, D.M. and C.E. Braun. 2000. Band-tailed pigeon (Columba fasciata) In The Birds of North America, No. 530 (A. Poole and F. Gill, eds.). The Birds of North America, Inc., Philadelphia, PA.
Keppie, D. M., H. M. Wight, and W. S. Overton. 1970. A proposed band-tailed pigeon census—a management need. Trans. N. Am. Wildl. Nat. Resour. Conf. 35:157-171.
Legris, A. M., and H. Levesque. 1991. Migratory game birds harvested in Canada during the 1990 hunting season. Can. Wildl. Serv. Prog. Notes 197. 40 pp.
Link, W. A., and J. R. Sauer. 2002. A hierarchical model of population change with application to Cerulean Warblers. Ecology 83:2832-2840.
Link, W. A., J. R. Sauer, and D. K. Niven. 2006. A hierarchical model for regional analysis of population change using Christmas Bird Count data, with application to the American Black Duck. Condor 108:13–24.
18
Lujan, M., D. R. Knowls, J. Turner, and M. L. Plenert. 1992. The recovery plan for the northern spotted owl. Draft U.S. Govt. Print. Office, Washington, D.C. 662pp.
Mace, R. U., and W. M. Batterson. 1961. Results of a band-tailed pigeon banding study at
Nehalem, Oregon. Proceedings—West. Corom. 41:151153. MacGregor, W. G., and W. M. Smith. 1955. Nesting and reproduction of the band-tailed
pigeon in California. Calif. Fish and Game 41(4) :315-326. Mallette, R. D. 1968. Band-tailed pigeon population surveys and management studies. Calif. P-
R Completion Rep., Proj. W-47-R-16, Work Plan 1, Job 3. March, G. L., and B. A. McKeown. 1973. Serum and pituitary prolactin changes in the band-
tailed pigeon (Columbia fasciata) in relation to the reproductive cycle. Can. J. Physiol. And Pharmacol. 51:583-589.
March, G. L., and R. M. F. S. Sadleir. 1970. Studies on the band-tailed pigeon (Columba fasciata) in British Columbia. Vol. I. Seasonal changes in gonadal development and crop gland activity. Can. J. Zool. 48(6) :1353-1357.
March, G. L., and R. M. F. S. Sadleir. 1972. Studies on the band-tailed pigeon (Columba fasciata) in British Columbia. Vol. II. Food resource and mineral-gravelling activity. Syesis 5:279-284.
March, G. L., and R. M. F. S. Sadleir. 1975. Studies on the band-tailed pigeon (Columba fasciata) in British Columbia. Vol. III. Seasonal changes in body weight and calcium distribution. Physiol. Zool. 48:49-56.
McCaughran, D. A., and R. Jeffrey. 1980. Estimation of the audio index of relative abundance of band-tailed pigeons. J. Wildl. Manage. 44(1):204-209.
Morse, W. B. 1950. Observations on the band-tailed pigeon in Oregon. Proceedings—West. Assoc. State Game and Fish Comm. 30:102-104.
Neff, J. A. 1947. Habits, food and economic status of the band-tailed pigeon. U.S. Fish Wildl. Serv., N. Am. Fauna No. 58. 76pp.
Olsen, O. W., and C. E. Braun. 1976. New species of Splendidofilaria and Chandlerella (Filarioidea:Nematoda), with keys to the species, from the band-tailed pigeon (Columba fasciata fasciata) in the Rocky Mountain region. Great Basin Nat. 36(4):445-457.
Olsen, O. W., and C. E. Braun. 1980. Band-tailed pigeons in Colorado. 16(1) :65-66. Passmore, M. F. 1977. Utilization of mineral sites by band-tailed pigeons. M.S. Thesis. Oreg.
State Univ., Corvallis. 56pp. Passmore, M. F., and R. L. Jarvis. 1979. Reliability of determining sex of band-tailed pigeons
by plumage characters. Wildl. Soc. Bull. 7(2):124-125. Peeters, H. J. 1962. Nuptial behavior of the band-tailed pigeon in the San Francisco Bay area.
Condor 64(6) :445-470. Sanders, T. A. 2000. Habitat availability, dietary mineral supplement, and measuring
abundance of band-tailed pigeons in western Oregon. Ph.D. Dissertation, Oregon State University, Corvallis, Oregon.
Sanders, T. A. 2010. Band-tailed pigeon population status, 2010. U.S. Department of the Interior, Fish and Wildlife Service, Division of Migratory Bird Management, Washington, D.C.
19
Sauer, J. R., J. E. Hines, and J. Fallon. 2008. The North American Breeding Bird Survey, Results and Analysis 1966 — 2007. Version 5.15.2008. USGS Patuxent Wildlife Research Center, Laurel, MD.
Sileo, L., Jr., and E. L. Fitzhugh. 1969. Incidence of trichomoniasis in the band-tailed pigeons of southern Arizona. Bull. Wildl. Dis. Assoc. 5(3):146.
Silovsky, G. D. 1969. Distribution and mortality of the Pacific Coast band-tailed pigeon. M.S. Thesis. Oreg. State Univ., Corvallis. 70pp.
Silovsky, G. D., H. M. Wight, L. H. Sisson, T. L. Fox, and S. W. Sisson, L. H. 1968. Calling behavior of band-tailed pigeons in reference to a census technique. M.S. Thesis. Oreg. State Univ., Corvallis. 57pp.
Slosson, J. R., and R. Goss. 1982. Status of the band-tailed pigeon (Columbia fasciata) in California. Admin. Rept. 822. Calif. Dept. of Fish and Wildl., Sacramento. 27 pp.
Smith, W. A. 1968. The band-tailed pigeon in California. Calif. Fish and Game 54(1) :4-16. Stabler, R. M., and C. E. Braun. 1975. Effect of virulent Trichomonas gallinae on the band-
tailed pigeon. J. wild1. Dis. 11(4) :482-483. Stabler, R. M., and C. E. Braun. 1979. Effects of a California-derived strain of Trichomonas
gallinae on Colorado band-tailed pigeons. Calif. Fish and Game 65(1) :56-58. Stabler, R. M., C. E. Braun, and P. D. Curtis. 1981. Bacterial disease in band-tailed pigeons. J.
Colo.-Wyo. Acad. Sci. 13(1):59. Abstract only. Stabler, R. M., N. J. Kitzmiller, and C. E. Braun. 1977. Blood parasites from band-tailed
pigeons. J. Wildl. Manage. 41(1):128-130. Stabler, R. M., and C. P. Matteson. 1950. Incidence of Trichomonas gallinae in Colorado
mourning doves and band-tailed pigeons. J. Parasitol. 36(6) :25-26. Stockbridge, J. 1976. The case of the band-tailed pigeon. Wash. Wildl. 28:10-11. USFWS. 1992. Migratory bird harvest information program. Fed. Regist. 57:24736-24741. Weaver, J. E., and F. C. Clements. 1938. Plant ecology, 2nd ed. McGraw-Hill Book Co., New
York. 601pp. White, J. A. 1973. A study of molt of band-tailed pigeons. M.S. Thesis. Colo. State Univ., Ft.
Collins. 27pp. White, J. A., and C. E. Braun. 1978. Age and sex determination of juvenile band-tailed
pigeons. J. Wildl. Manage.42 (3) : 564-569. Wight, H. M. 1966. A band-tailed pigeon research and management program. In files of U.S.
Fish Wildl. Serv., Laurel, Md. 9pp. Abstracted in Proceedings—Intl. Assoc. Game, Fish, and Conserv. Comm. 56:40.
Wight, H. M., R. U. Mace, and W. M. Batterson. 1967. Mortality estimates of an adult band-tailed pigeon population in Oregon. J. Wildl. Manage. 31(3) :519-525.
Zeigler, D. L. 1971. Crop-milk cycles in band-tailed pigeons and losses of squabs due to hunting pigeons in September. M.S. Thesis. Oreg. State Univ., Corvallis, OR. 48pp.
20
APPENDIX 1
Breeding Bird Survey (BBS)
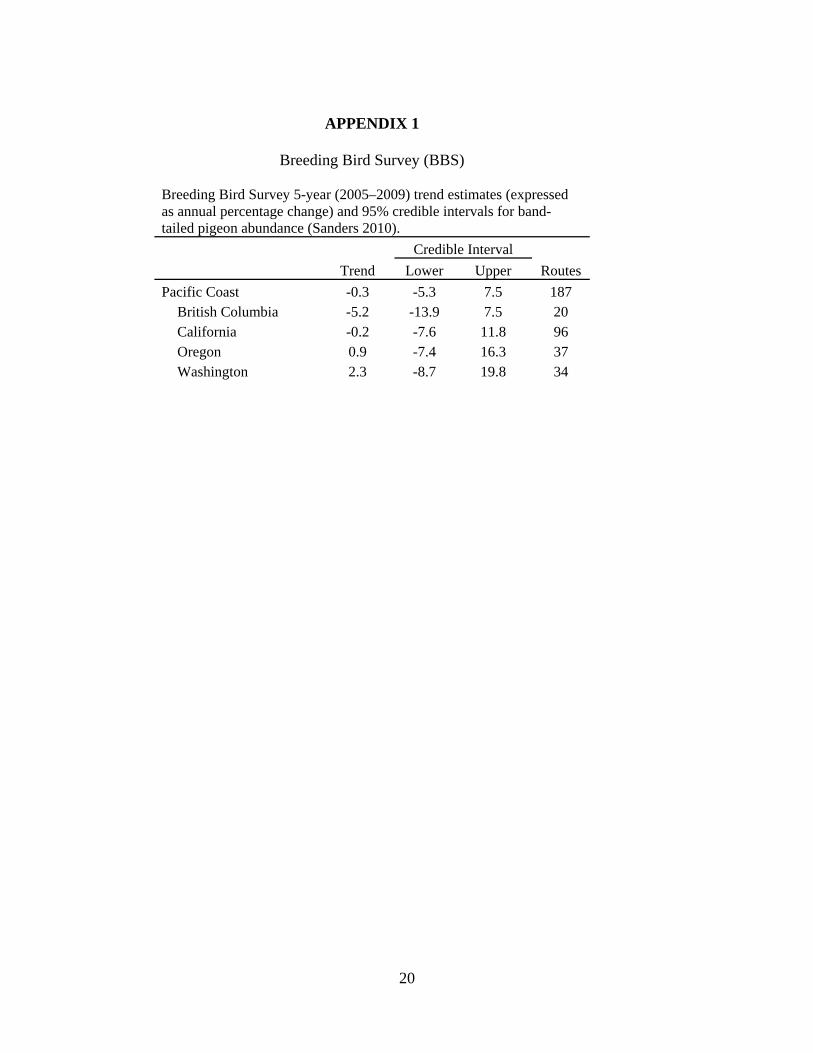
Breeding Bird Survey 5-year (2005–2009) trend estimates (expressed as annual percentage change) and 95% credible intervals for band-tailed pigeon abundance (Sanders 2010). Credible Interval Trend Lower Upper Routes Pacific Coast -0.3 -5.3 7.5 187
British Columbia -5.2 -13.9 7.5 20 California -0.2 -7.6 11.8 96 Oregon 0.9 -7.4 16.3 37 Washington 2.3 -8.7 19.8 34
21
APPENDIX 2
Mineral Site Survey (MSS)
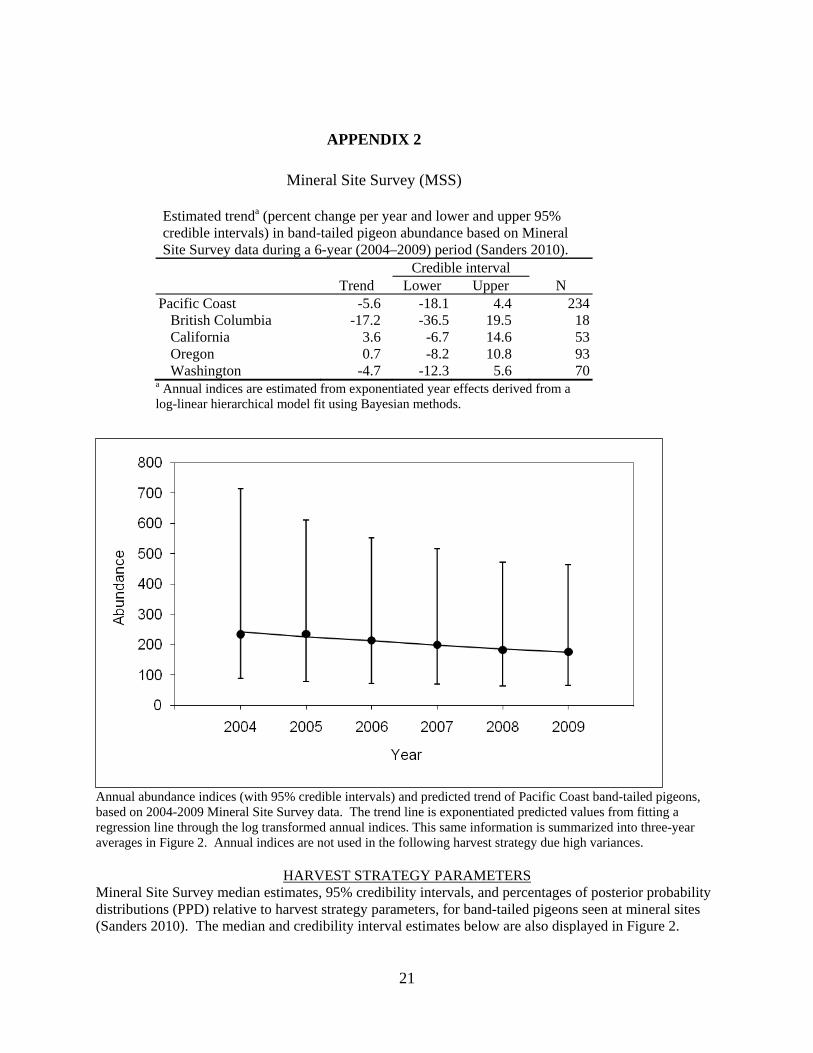
Estimated trenda (percent change per year and lower and upper 95% credible intervals) in band-tailed pigeon abundance based on Mineral Site Survey data during a 6-year (2004–2009) period (Sanders 2010).
Credible interval Trend Lower Upper N Pacific Coast -5.6 -18.1 4.4 234 British Columbia -17.2 -36.5 19.5 18 California 3.6 -6.7 14.6 53 Oregon 0.7 -8.2 10.8 93 Washington -4.7 -12.3 5.6 70
a Annual indices are estimated from exponentiated year effects derived from a log-linear hierarchical model fit using Bayesian methods.
Annual abundance indices (with 95% credible intervals) and predicted trend of Pacific Coast band-tailed pigeons, based on 2004-2009 Mineral Site Survey data. The trend line is exponentiated predicted values from fitting a regression line through the log transformed annual indices. This same information is summarized into three-year averages in Figure 2. Annual indices are not used in the following harvest strategy due high variances.
HARVEST STRATEGY PARAMETERS Mineral Site Survey median estimates, 95% credibility intervals, and percentages of posterior probability distributions (PPD) relative to harvest strategy parameters, for band-tailed pigeons seen at mineral sites (Sanders 2010). The median and credibility interval estimates below are also displayed in Figure 2.
22
• All natural mineral sites with known mineral sources surveyed at least 3 times from 2004 to 2009 were included.
• Median estimates below may change based on the number of surveys and the length of time that data from these surveys are available.
• The median population objective (2004-08) will change slightly based on additional data, less so for each subsequent survey year.
• Estimates were derived from the same hierarchical model used to assess Christmas Bird Count, Breeding Bird Survey, and Mourning Dove Call-count Survey data (Link and Sauer 2002, Link et al 2006).
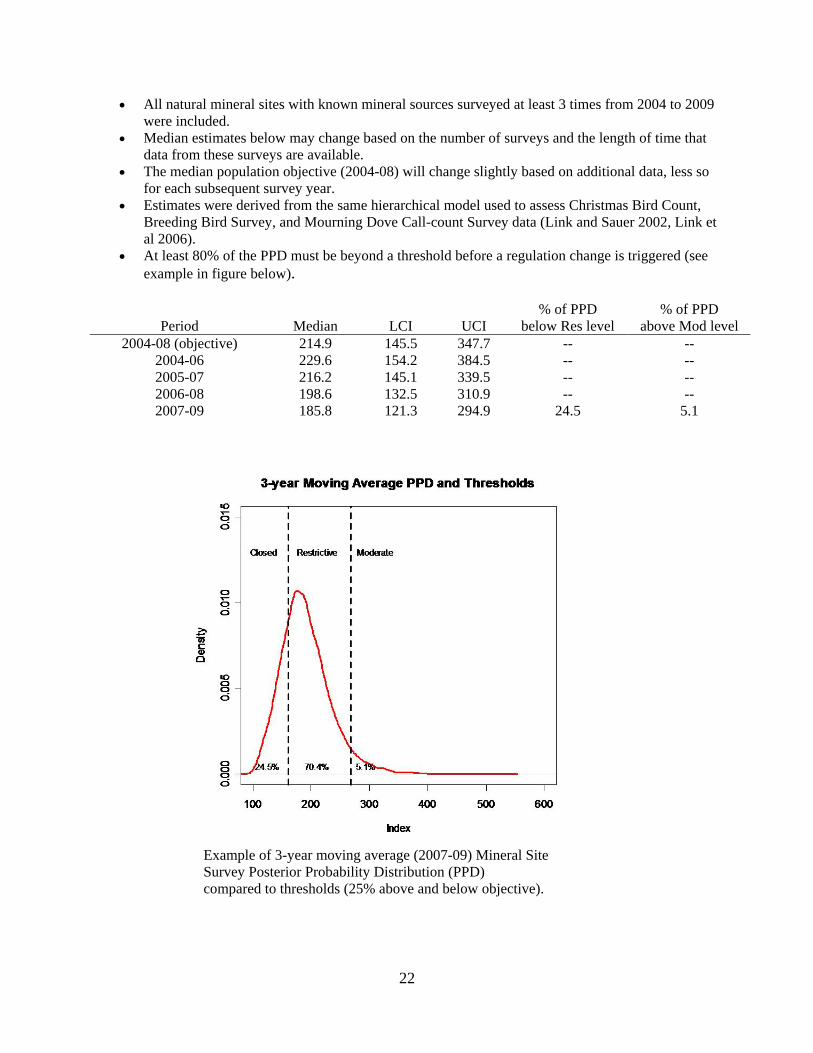
• At least 80% of the PPD must be beyond a threshold before a regulation change is triggered (see example in figure below).
Period Median LCI UCI % of PPD
below Res level % of PPD
above Mod level 2004-08 (objective) 214.9 145.5 347.7 -- --
2004-06 229.6 154.2 384.5 -- -- 2005-07 216.2 145.1 339.5 -- -- 2006-08 198.6 132.5 310.9 -- -- 2007-09 185.8 121.3 294.9 24.5 5.1
Example of 3-year moving average (2007-09) Mineral Site Survey Posterior Probability Distribution (PPD) compared to thresholds (25% above and below objective).
23
APPENDIX 3
Direct and Indirect Recovery Locations of Pacific Coast Band-tailed Pigeons Banded Preseason* and Subsequently Shot or Found Dead, 1929-2008.
Banding Location California Oregon Washington British Columbia Mexico Other TotalsCalifornia Direct n (%) 260 (81.5) 37 (11.6) 15 (4.7) 3 (0.9) 4 (1.3) --- 319 (100.0) Indirect n (%) 303 (75.8) 57 (14.3) 33 (8.3) 5 (1.3) 2 (0.5) --- 400 (100.0)
Oregon Direct n (%) 189 (32.1) 347 (58.9) 50 (8.5) 2 (0.3) --- 1 (0.2) 589 (100.0) Indirect n (%) 368 (36.9) 517 (51.9) 92 (9.2) 15 (1.5) 3 (0.3) 2 (0.2) 997 (100.0)
Washington Direct n (%) 74 (30.3) 46 (18.9) 122 (50.0) 1 (0.4) 1 (0.4) --- 244 (100.0) Indirect n (%) 148 (38.4) 56 (14.5) 173 (44.9) 8 (2.1) --- --- 385 (100.0)
British Columbia Direct n (%) --- --- --- --- --- --- --- Indirect n (%) 2 (66.7) --- --- 1 (33.3) --- --- 3 (100.0)
Totals Direct n (%) 523 (45.4) 430 (37.3) 187 (16.2) 6 (0.5) 5 (0.4) 1 (<0.1) 1152 (100.0) Indirect n (%) 821 (46.0) 630 (35.3) 298 (16.7) 29 (1.6) 5 (0.3) 2 (0.1) 1785 (100.0) All n (%) 1344 (45.8) 1060 (36.1) 485 (16.5) 35 (1.2) 10 (0.3) 3 (0.1) 2937 (100.0)* Preseason = April 1 through August 31, normal wild status (300)
Recovery Location
24
APPENDIX 4
Parts Collection Survey age structure of Pacific Coast band-tailed pigeons, determined from hunter shot birds during September through December, 1994 to 2008.
Values are percentage of hatch year birds (%), number of hatch year birds (n), and number of both hatch year and after hatch year birds examined (N).
Year % n N % n N % n N % n N1994 44.6 226 507 22.9 131 571 †a 0 0 33.1 357 10781995 29.6 74 250 20.1 109 542 † 0 0 23.1 183 7921996 27.9 68 244 15.1 38 252 † 0 0 21.4 106 4961997 31.1 65 209 17.7 64 361 † 0 0 22.6 129 5701998 32 81 253 18.4 45 244 † 0 0 25.4 126 4971999 33.2 119 358 20.1 79 394 † 0 0 26.3 198 7522000 32.1 69 215 17.5 58 332 † 0 0 23.2 127 5472001 22.9 33 144 17 46 271 † 0 0 19 79 4152002 31.5 52 165 14.1 33 234 3.8 22 180 18.5 107 5792003 34.4 72 209 21.2 49 231 3.1 17 112 25 138 5522004 25.2 33 131 19.6 38 194 2.6 9 27 22.7 80 3522005 18.8 25 133 13.3 24 180 † 0 0 15.7 49 3132006 18.1 47 260 19 48 253 13.6 6 44 18.1 101 5572007 24.8 34 137 14.3 36 251 10.9 6 55 17.2 76 4432008 29.8 39 131 20 22 110 31 9 29 25.9 70 2702009 30.1 31 103 17.8 35 197 15.2 5 33 21.3 71 333
a The season in Washington was closed from 1991 through 2001, no estimate is available.
California Oregon Washington Total
25
APPENDIX 5
Estimated survival and recovery rates of Pacific Coast Band-tailed Pigeons for those areas and years with sufficient data (Brownie-Robson Method)
State Years Age Sex Rate SE Rate SE Model California 1969-78 A Combined 67.76 2.91 1.29 0.08 H1 (Yr. spec. s&f)California 1969-78 I Combined 75.2 10.05 1.88 0.25 H1 Oregon 1953-58 A Unknown 76.77 5.52 5.08 0.34 H1 (Yr. spec. s&f)Oregon 1966-72 A M 65.79 3.84 2.56 0.22Oregon 1966-72 A F 73.21 0.61 2.38 0.23Oregon 1966-72 A Unknown 60.62 3.12 2.98 0.23Washington 1965-69 A Combined 59.86 3.56 2.39 0.18 H1 (Yr. spec. s&f)Analysis by Graham Smith, DMBM, 1992
Survival (s) Recovery (f)
26
APPENDIX 6 Pacific Coast band-tailed pigeon seasons, 1932–2009. The season was closed from 1913 through 1931. The daily possession limit is twice the daily bag limit.
CA North South OR WA
Year Dates Days Dates Days Bag Dates Days Bag Dates Days Bag1932 Dec 1–15 15 Dec 1–15 15 10 Oct 16–30 15 10 Oct 16–30 15 10 1933 Dec 1–15 15 Dec 1–15 15 10 Oct 16–30 15 10 Oct 16–30 15 10 1934 Dec 1–15 15 Dec 1–15 15 10 Oct 16–30 15 10 Oct 16–30 15 10 1935 Dec 1–15 15 Dec 1–15 15 10 Oct 16–30 15 10 Sep 16–30 15 10 1936 Dec 1–15 15 Dec 1–15 15 10 Oct 16–30 15 10 Sep 16–30 15 10 1937 Dec 1–15 15 Dec 1–15 15 10 Oct 16–30 15 10 Sep 16–30 15 10 1938 Dec 1–15 15 Dec 1–15 15 10 Oct 16–30 15 10 Sep 16–30 15 10 1939 Dec 1–15 15 Dec 1–15 15 10 Sep 1–15 15 10 Sep 16–30 15 10 1940 Dec 1–15 15 Dec 1–15 15 10 Sep 1–15 15 10 Sep 16–30 15 10 1941 Dec 1–15 15 Dec 1–15 15 10 Sep 1–15 15 10 Sep 16–30 15 10 1942 Dec 1–30 30 Dec 1–30 30 10 Sep 1–30 30 10 Sep 16–Oct 15 30 10 1943 Dec 1–30 30 Dec 1–30 30 10 Sep 1–30 30 10 Sep 16–Oct 15 30 10 1944 Dec 1–30 30 Dec 1–30 30 10 Sep 1–30 30 10 Sep 16–Oct 15 30 10 1945 Dec 1–30 30 Dec 1–30 30 10 Sep 1–30 30 10 Sep 16–Oct 15 30 10 1946 Sep 1–30 30 Sep 1–30 30 10 Sep 1–30 30 10 Sep 1–30 30 10 1947 Dec 1–30 30 Dec 1–30 30 10 Sep 1–30 30 10 Sep 1–30 30 10 1948 Sep 1–15 15 Dec 1–15 15 10 Sep 1–30 30 10 Sep 1–30 30 10 1949 Sep 16–30 and
Dec 17–31 30 Sep 16–30 and
Dec 17–31 30 10 Sep 1–30 30 10 Sep 1–30 30 10
1950 Sep 16–30 and Dec 17–31
30 Sep 16–30 and Dec 17–31
30 8 Sep 1–30 30 8 Sep 1–30 30 8
1951 Sep 16–30 and Dec 17–31
30 Sep 16–30 and Dec 17–31
30 6 Sep 1–30 30 6 Sep 1–30 30 6
1952 Sep 16–30 and Dec 17–31
30 Sep 16–30 and Dec 17–31
30 6 Sep 1–30 30 6 Sep 1–30 30 6
1953 Oct 16–31 16 Dec 1–31 31 6 Sep 1–30 30 6 Sep 1–30 30 6 1954 Oct 1–31 31 Dec 1–31 31 6 Sep 1–30 30 6 Sep 1–30 30 6 1955 Oct 1–31 31 Dec 1–31 31 6 Sep 1–30 30 6 Sep 1–30 30 6 1956 Oct 1–31 31 Dec 1–31 31 6 Sep 1–30 30 6 Sep 1–30 30 6 1957 Oct 1–31 31 Dec 1–31 31 6 Sep 1–30 30 6 Sep 1–30 30 6 1958 Oct 1–31 31 Dec 11–Jan 10 31 6 Sep 1–28 28 6 Sep 1–30 30 6 1959 Oct 1–31 31 Dec 11–Jan 10 31 6 Sep 1–27 27 6 Sep 1–30 30 6 1960 Oct 1–31 31 Dec 17–Jan 15 30 6 Sep 1–30 30 6 Sep 1–30 30 6 1961 Sep 30–Oct 29 30 Dec 16–Jan 14 30 8 Sep 1–30 30 8 Sep 1–30 30 8 1962 Sep 29–Oct 28 30 Dec 15–Jan 13 30 8 Sep 1–30 30 8 Sep 1–30 30 8 1963 Sep 28–Oct 27 30 Dec 14–Jan 12 30 8 Sep 1–30 30 8 Sep 1–30 30 8 1964 Sep 26–Oct 25 30 Dec 12–Jan 10 30 8 Sep 1–30 30 8 Sep 1–30 30 8 1965 Sep 25–Oct 24 30 Dec 11–Jan 9 30 8 Sep 1–30 30 8 Sep 1–30 30 8 1966 Oct 1–30 30 Dec 17–Jan 15 30 8 Sep 1–30 30 8 Sep 1–30 30 8 1967 Sep 29–Oct 29 31 Dec 16–Jan 14 30 8 Sep 1–30 30 8 Sep 1–30 30 8 1968 Sep 28–Oct 27 30 Dec 14–Jan 12 30 8 Sep 1–30 30 8 Sep 1–30 30 8 1969 Sep 27–Oct 26 30 Dec 13–Jan 11 30 8 Sep 1–30 30 8 Sep 1–30 30 8 1970 Oct 3–Nov 1 30 Dec 12–Jan 10 30 8 Sep 1–30 30 8 Sep 1–30 30 8 1971 Oct 2–31 30 Dec 11–Jan 9 30 8 Sep 1–30 30 8 Sep 1–30 30 8 1972 Sep 30–Oct 29 30 Dec 16–Jan 14 30 8 Sep 1–30 30 8 Sep 1–30 30 8 1973 Sep 29–Oct 28 30 Dec 15–Jan 15 32 8 Sep 1–30 30 8 Sep 1–30 30 8 1974 Sep 28–Oct 27 30 Dec 14–Jan 12 30 8 Sep 1–30 30 8 Sep 1–30 30 8 1975 Oct 4–19 16 Dec 13–28 16 6 Sep 1–30 30 5 Sep 1–30 30 5
27
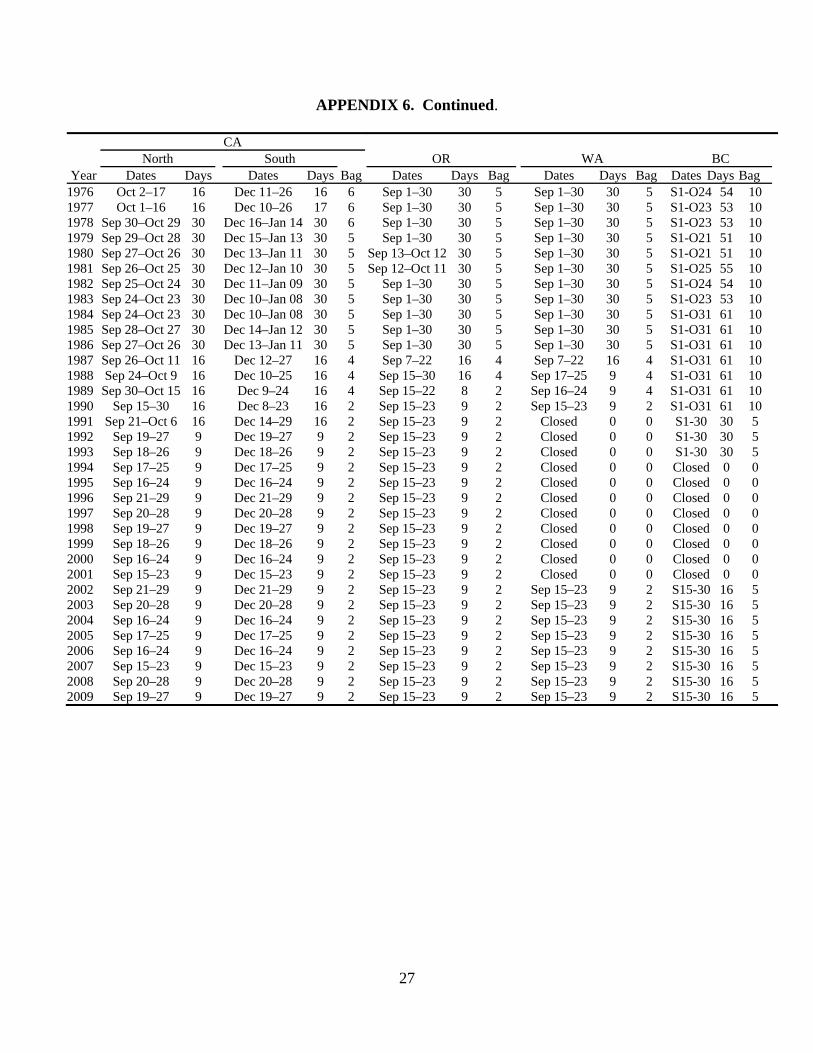
APPENDIX 6. Continued.
CA North South OR WA BC
Year Dates Days Dates Days Bag Dates Days Bag Dates Days Bag Dates Days Bag1976 Oct 2–17 16 Dec 11–26 16 6 Sep 1–30 30 5 Sep 1–30 30 5 S1-O24 54 10 1977 Oct 1–16 16 Dec 10–26 17 6 Sep 1–30 30 5 Sep 1–30 30 5 S1-O23 53 10 1978 Sep 30–Oct 29 30 Dec 16–Jan 14 30 6 Sep 1–30 30 5 Sep 1–30 30 5 S1-O23 53 10 1979 Sep 29–Oct 28 30 Dec 15–Jan 13 30 5 Sep 1–30 30 5 Sep 1–30 30 5 S1-O21 51 10 1980 Sep 27–Oct 26 30 Dec 13–Jan 11 30 5 Sep 13–Oct 12 30 5 Sep 1–30 30 5 S1-O21 51 10 1981 Sep 26–Oct 25 30 Dec 12–Jan 10 30 5 Sep 12–Oct 11 30 5 Sep 1–30 30 5 S1-O25 55 10 1982 Sep 25–Oct 24 30 Dec 11–Jan 09 30 5 Sep 1–30 30 5 Sep 1–30 30 5 S1-O24 54 10 1983 Sep 24–Oct 23 30 Dec 10–Jan 08 30 5 Sep 1–30 30 5 Sep 1–30 30 5 S1-O23 53 10 1984 Sep 24–Oct 23 30 Dec 10–Jan 08 30 5 Sep 1–30 30 5 Sep 1–30 30 5 S1-O31 61 10 1985 Sep 28–Oct 27 30 Dec 14–Jan 12 30 5 Sep 1–30 30 5 Sep 1–30 30 5 S1-O31 61 10 1986 Sep 27–Oct 26 30 Dec 13–Jan 11 30 5 Sep 1–30 30 5 Sep 1–30 30 5 S1-O31 61 10 1987 Sep 26–Oct 11 16 Dec 12–27 16 4 Sep 7–22 16 4 Sep 7–22 16 4 S1-O31 61 10 1988 Sep 24–Oct 9 16 Dec 10–25 16 4 Sep 15–30 16 4 Sep 17–25 9 4 S1-O31 61 10 1989 Sep 30–Oct 15 16 Dec 9–24 16 4 Sep 15–22 8 2 Sep 16–24 9 4 S1-O31 61 10 1990 Sep 15–30 16 Dec 8–23 16 2 Sep 15–23 9 2 Sep 15–23 9 2 S1-O31 61 10 1991 Sep 21–Oct 6 16 Dec 14–29 16 2 Sep 15–23 9 2 Closed 0 0 S1-30 30 5 1992 Sep 19–27 9 Dec 19–27 9 2 Sep 15–23 9 2 Closed 0 0 S1-30 30 5 1993 Sep 18–26 9 Dec 18–26 9 2 Sep 15–23 9 2 Closed 0 0 S1-30 30 5 1994 Sep 17–25 9 Dec 17–25 9 2 Sep 15–23 9 2 Closed 0 0 Closed 0 0 1995 Sep 16–24 9 Dec 16–24 9 2 Sep 15–23 9 2 Closed 0 0 Closed 0 0 1996 Sep 21–29 9 Dec 21–29 9 2 Sep 15–23 9 2 Closed 0 0 Closed 0 0 1997 Sep 20–28 9 Dec 20–28 9 2 Sep 15–23 9 2 Closed 0 0 Closed 0 0 1998 Sep 19–27 9 Dec 19–27 9 2 Sep 15–23 9 2 Closed 0 0 Closed 0 0 1999 Sep 18–26 9 Dec 18–26 9 2 Sep 15–23 9 2 Closed 0 0 Closed 0 0 2000 Sep 16–24 9 Dec 16–24 9 2 Sep 15–23 9 2 Closed 0 0 Closed 0 0 2001 Sep 15–23 9 Dec 15–23 9 2 Sep 15–23 9 2 Closed 0 0 Closed 0 0 2002 Sep 21–29 9 Dec 21–29 9 2 Sep 15–23 9 2 Sep 15–23 9 2 S15-30 16 5 2003 Sep 20–28 9 Dec 20–28 9 2 Sep 15–23 9 2 Sep 15–23 9 2 S15-30 16 5 2004 Sep 16–24 9 Dec 16–24 9 2 Sep 15–23 9 2 Sep 15–23 9 2 S15-30 16 5 2005 Sep 17–25 9 Dec 17–25 9 2 Sep 15–23 9 2 Sep 15–23 9 2 S15-30 16 5 2006 Sep 16–24 9 Dec 16–24 9 2 Sep 15–23 9 2 Sep 15–23 9 2 S15-30 16 5 2007 Sep 15–23 9 Dec 15–23 9 2 Sep 15–23 9 2 Sep 15–23 9 2 S15-30 16 5 2008 Sep 20–28 9 Dec 20–28 9 2 Sep 15–23 9 2 Sep 15–23 9 2 S15-30 16 5 2009 Sep 19–27 9 Dec 19–27 9 2 Sep 15–23 9 2 Sep 15–23 9 2 S15-30 16 5
28
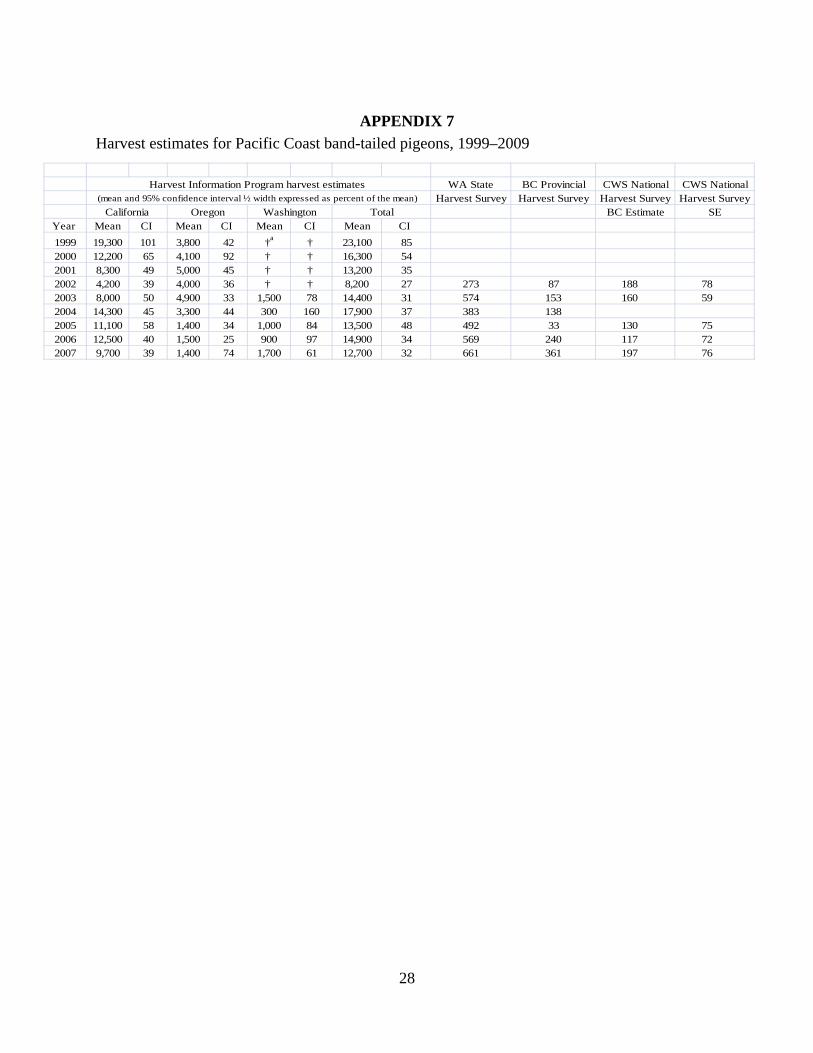
APPENDIX 7 Harvest estimates for Pacific Coast band-tailed pigeons, 1999–2009
WA State BC Provincial CWS National CWS NationalHarvest Survey Harvest Survey Harvest Survey Harvest Survey
BC Estimate SEYear Mean CI Mean CI Mean CI Mean CI 1999 19,300 101 3,800 42 †a † 23,100 852000 12,200 65 4,100 92 † † 16,300 542001 8,300 49 5,000 45 † † 13,200 352002 4,200 39 4,000 36 † † 8,200 27 273 87 188 78 2003 8,000 50 4,900 33 1,500 78 14,400 31 574 153 160 59 2004 14,300 45 3,300 44 300 160 17,900 37 383 1382005 11,100 58 1,400 34 1,000 84 13,500 48 492 33 130 75 2006 12,500 40 1,500 25 900 97 14,900 34 569 240 117 72 2007 9,700 39 1,400 74 1,700 61 12,700 32 661 361 197 76
Harvest Information Program harvest estimates (mean and 95% confidence interval ½ width expressed as percent of the mean)
California Oregon Washington Total
29
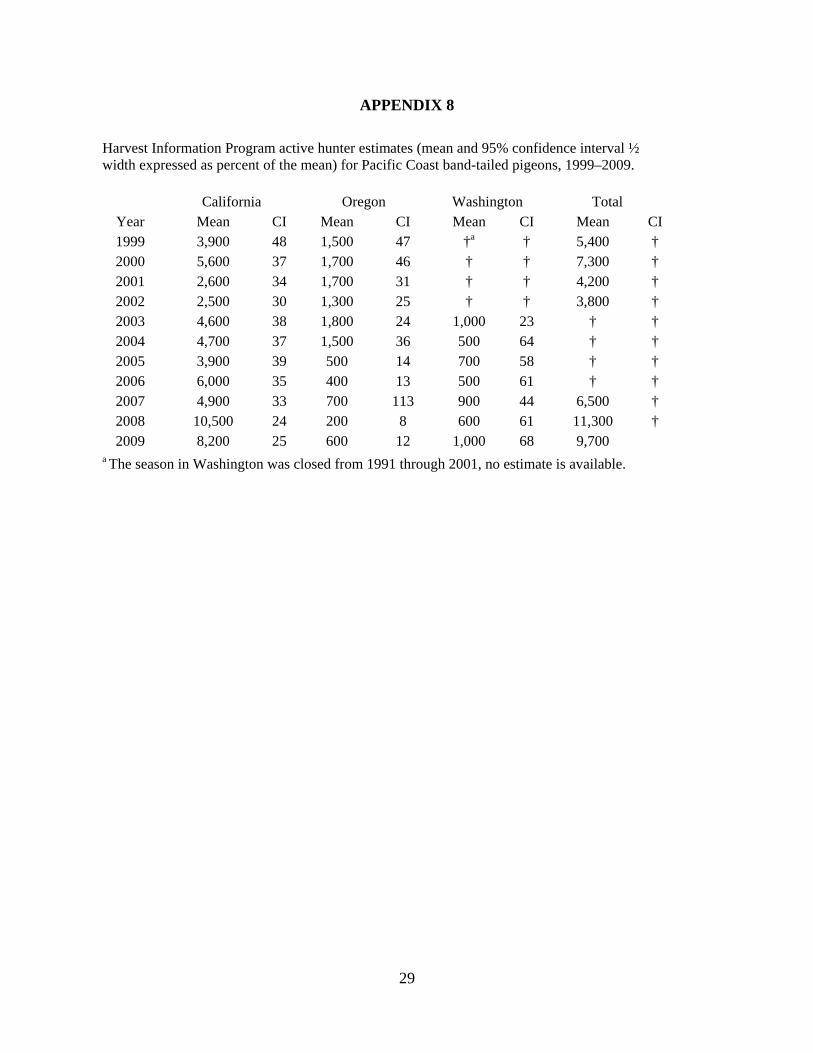
APPENDIX 8
Harvest Information Program active hunter estimates (mean and 95% confidence interval ½ width expressed as percent of the mean) for Pacific Coast band-tailed pigeons, 1999–2009.
California Oregon Washington Total Year Mean CI Mean CI Mean CI Mean CI1999 3,900 48 1,500 47 †a † 5,400 † 2000 5,600 37 1,700 46 † † 7,300 † 2001 2,600 34 1,700 31 † † 4,200 † 2002 2,500 30 1,300 25 † † 3,800 † 2003 4,600 38 1,800 24 1,000 23 † † 2004 4,700 37 1,500 36 500 64 † † 2005 3,900 39 500 14 700 58 † † 2006 6,000 35 400 13 500 61 † † 2007 4,900 33 700 113 900 44 6,500 † 2008 10,500 24 200 8 600 61 11,300 † 2009 8,200 25 600 12 1,000 68 9,700
a The season in Washington was closed from 1991 through 2001, no estimate is available.
30
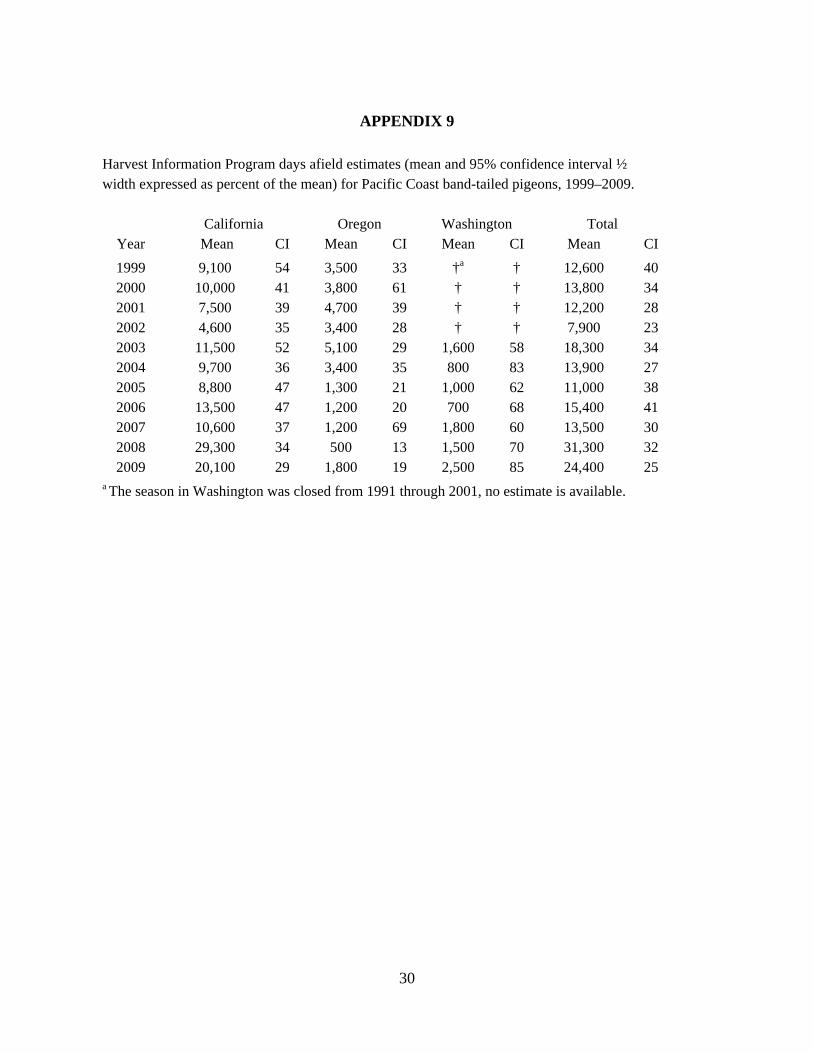
APPENDIX 9
Harvest Information Program days afield estimates (mean and 95% confidence interval ½ width expressed as percent of the mean) for Pacific Coast band-tailed pigeons, 1999–2009.
California Oregon Washington Total Year Mean CI Mean CI Mean CI Mean CI 1999 9,100 54 3,500 33 †a † 12,600 40 2000 10,000 41 3,800 61 † † 13,800 34 2001 7,500 39 4,700 39 † † 12,200 28 2002 4,600 35 3,400 28 † † 7,900 23 2003 11,500 52 5,100 29 1,600 58 18,300 34 2004 9,700 36 3,400 35 800 83 13,900 27 2005 8,800 47 1,300 21 1,000 62 11,000 38 2006 13,500 47 1,200 20 700 68 15,400 41 2007 10,600 37 1,200 69 1,800 60 13,500 30 2008 29,300 34 500 13 1,500 70 31,300 32 2009 20,100 29 1,800 19 2,500 85 24,400 25
a The season in Washington was closed from 1991 through 2001, no estimate is available.