Embed Size (px)
Citation preview
Pacific CommunityAnnual Report
2014Sustainable Paci�c development through science,
knowledge and innovation
Headquarters: Noumea, New Caledonia
ISSN 1017-1983
Pacific Community│[email protected]│www.spc.int

Noumea, New Caledonia, 2015
Pacific CommunityAnnual Report
2014
New logo : 6 October 2015
© Pacific Community (SPC) 2015
All rights for commercial/for profit reproduction or translation, in any form, reserved. SPC authorises the partial reproduction or translation of this material for scientific, educational or research purposes, provided that SPC and the source document are properly acknowledged. Permission to reproduce the document and/or translate in whole, in any form, whether for commercial/for profit or non-profit purposes, must be requested in writing. Original SPC artwork may not be altered or separately published without permission.
Original text: English
Pacific Community Cataloguing-in-Publication Data
Pacific Community Annual Report: 2014 / Pacific Community
(Annual Report of the Pacific Community / Pacific Community)
ISSN: 1017-1983
1. Pacific Community — Periodicals.
2. Technical assistance — Oceania — Periodicals.
I. Title II. Pacific Community III. Series
341.246 AACR2
ISSN: 1017-1983
Design and layout: Publications Section, SPC
Prepared for publication and printed at the Pacific Community
BP D5, 98848 Noumea Cedex, New Caledonia
2015
This Annual Report has been printed on Cocoon Offset.
Contents
Acknowledgements v
Foreword 1
High-Level Dialogue on Climate Change 2
Permanent Observer to the UN General Assembly 2
CRGA 44 – meeting highlights 3
Governance review 3
Gender Equality 4
Membership 4
Multi-sector approaches 4
SPC staff profile 5Staff engagement 5Reducing our carbon footprint 5
Our three goals 6
Goal 1: Sustainable economic growth 6
Goal 2: Pacific Communities are empowered and resilient 7Goal 3: Pacific Island people reach their potential and live long and healthy lives. 8
Balance sheet as at 31 December 2014 13
Statement of income and expenditure - core funds for the year ended 31 December 2014 14
Statement of cash flows for the year ended 31 December 2014 15Notes to the financial statements 16Statement of accounting policies 46
2014 Income by source 51Statistical information 532014 Expenditure by activity 542014 Expenditure by Divisions 54Provident fund 58Significant accounting policies and notes to the Provident Fund accounts 61Pacific Community members 62
ANNUAL REPORT 2014
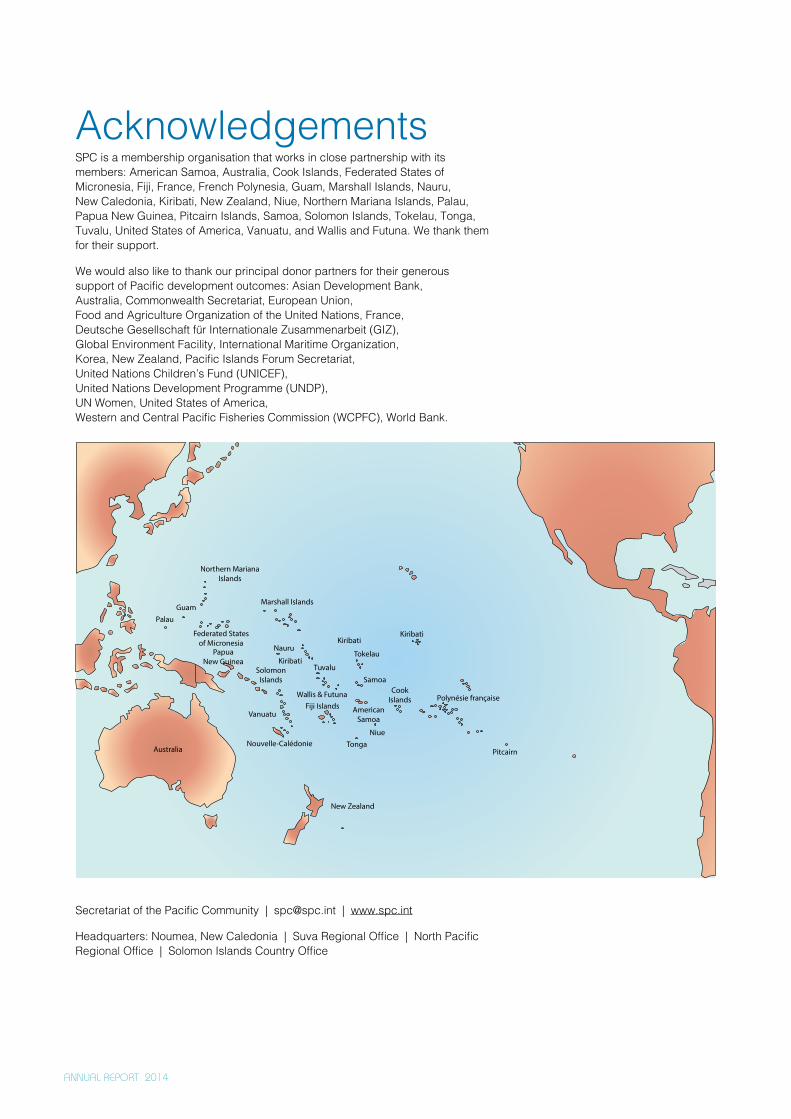
AcknowledgementsSPC is a membership organisation that works in close partnership with its members: American Samoa, Australia, Cook Islands, Federated States of Micronesia, Fiji, France, French Polynesia, Guam, Marshall Islands, Nauru, New Caledonia, Kiribati, New Zealand, Niue, Northern Mariana Islands, Palau, Papua New Guinea, Pitcairn Islands, Samoa, Solomon Islands, Tokelau, Tonga, Tuvalu, United States of America, Vanuatu, and Wallis and Futuna. We thank them for their support.
We would also like to thank our principal donor partners for their generous support of Pacific development outcomes: Asian Development Bank, Australia, Commonwealth Secretariat, European Union, Food and Agriculture Organization of the United Nations, France, Deutsche Gesellschaft für Internationale Zusammenarbeit (GIZ), Global Environment Facility, International Maritime Organization, Korea, New Zealand, Pacific Islands Forum Secretariat, United Nations Children’s Fund (UNICEF), United Nations Development Programme (UNDP), UN Women, United States of America, Western and Central Pacific Fisheries Commission (WCPFC), World Bank.
Secretariat of the Pacific Community | [email protected] | www.spc.int
Headquarters: Noumea, New Caledonia | Suva Regional Office | North Pacific Regional Office | Solomon Islands Country Office
PapuaNew Guinea
SolomonIslands
Federated Statesof Micronesia
Marshall Islands
Kiribati
Nauru
Northern MarianaIslands
GuamPalau
Tuvalu
Tokelau
Samoa
Wallis & Futuna
KiribatiKiribati
CookIslands Polynésie française
Nouvelle-Calédonie TongaNiue
Vanuatu
Pitcairn
New Zealand
Australia
Fiji Islands AmericanSamoa
ANNUAL REPORT 2014 1
ForewordI am pleased to present SPC’s Annual Report for 2014 comprising a brief overview of the year’s activities and the financial statements and audit reports.
In 2014, we embarked on a change agenda designed to re-position SPC as the principal scientific and technical agency supporting development in the Pacific region. As part of our overall goal of improving the effectiveness and added value of our work in support of our members, the objectives of the change agenda include introducing an integrated programming approach in which sector specialists work together on multi-disciplinary responses to development issues.
The first two priorities for this approach are Climate Change/Disaster Risk Reduction and Non-communicable Diseases/Food Security ‒ not only defining challenges for the region, but also ones that must engage every area of our work. Two working groups were set up in November to bring together relevant expertise from all our programmes.
A Programme Support Unit and Programme Appraisal Committee were established in 2014 as part of our commitment to strengthen the effectiveness of our work and results achieved against members’ priorities. The new programming process, which starts at concept development, is aimed at improving the design, implementation, monitoring and evaluation of programmes and projects.
The change agenda is also part of positioning SPC to be able to provide strong support for members’ participation in global processes such as the Sustainable Development Goals, the SAMOA Pathway that was the outcome document of the United Nations Third International Conference on Small Island Developing States in Samoa, and the United Nations Climate Change Conference (COP21) in late 2015, which aims to achieve a universal and binding agreement on climate. These processes have important implications for the Pacific Community and also offer major opportunities for advancing development agendas.
Within the region, the Framework for Pacific Regionalism, endorsed by Pacific leaders in 2014, is highly relevant to our work and to the way we work with CROP (Council of Regional Organisations of the Pacific) agencies, particularly in relation to improving coordination of policy development and service provision across the region.
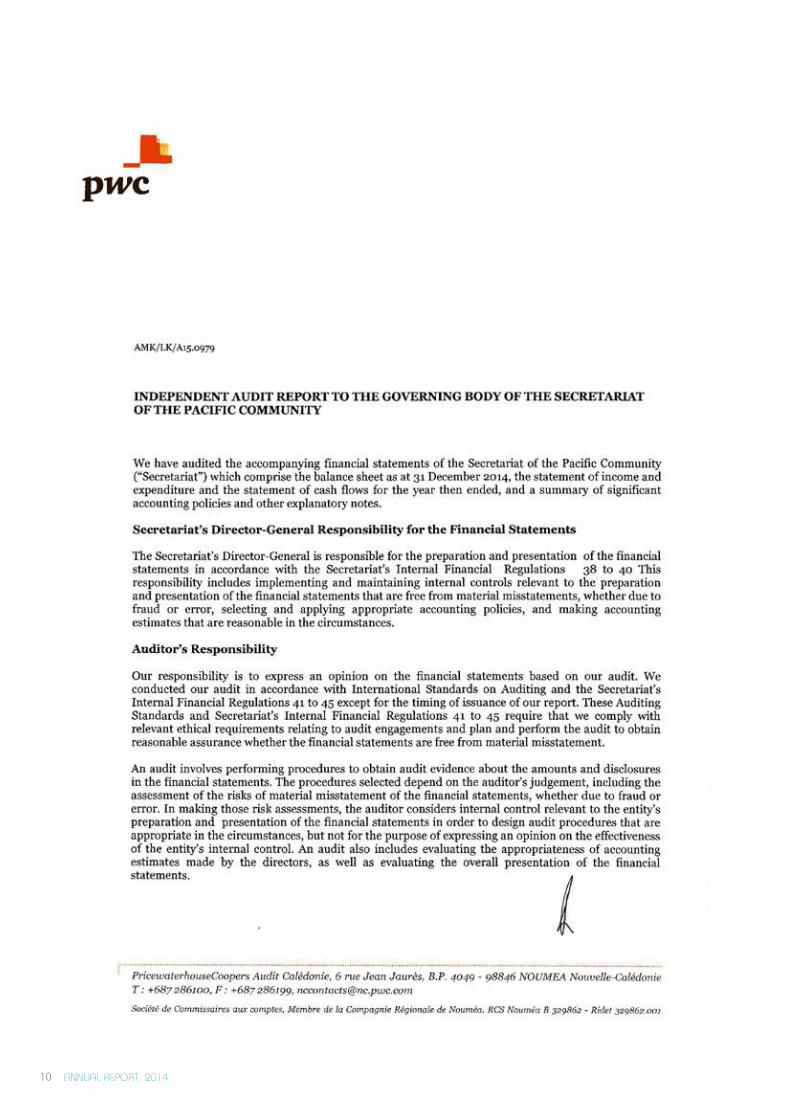
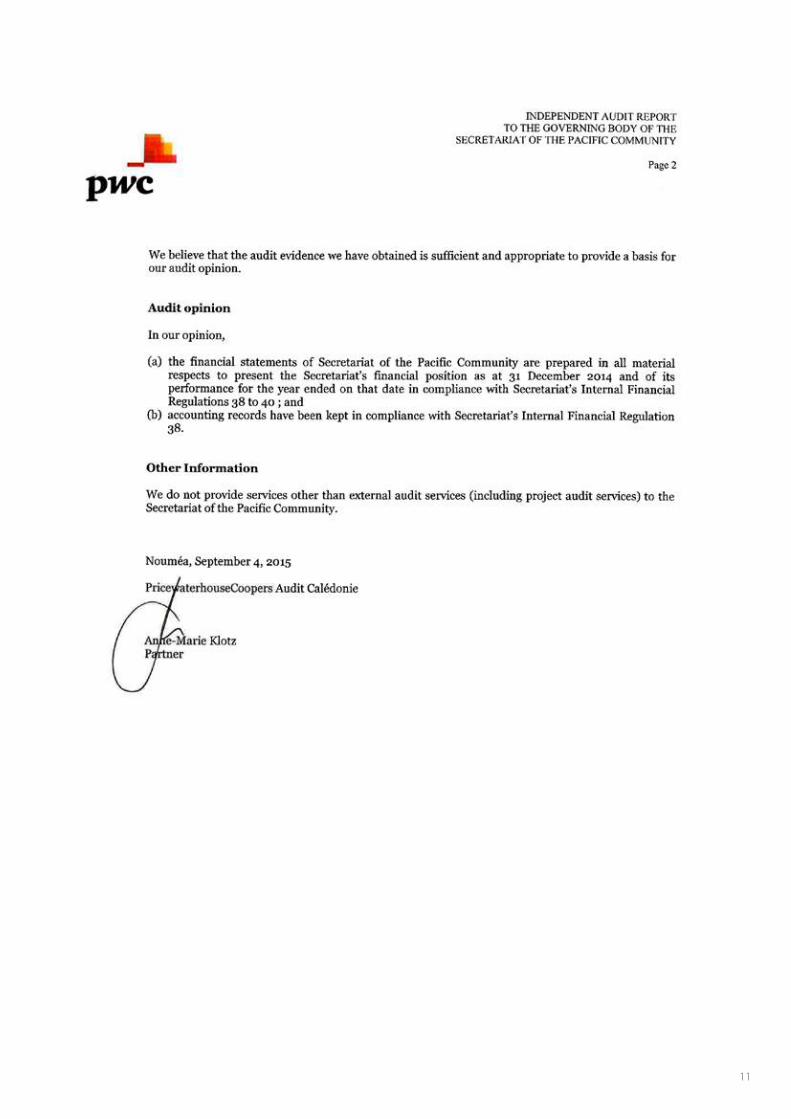
Again we are pleased to report that for the 19th year in succession, the independent auditors have provided an unqualified audit opinion on SPC’s accounts.
The Audit and Risk Committee, a committee of our governing body, met three times in 2014 and in the course of the year approved an assurance framework to provide a structure for the internal audit and risk function; a strategic risk plan; and a three-year internal audit and risk plan outlining the audit coverage to be provided over the following three years. The committee also reviewed the revised Financial Regulations for SPC. We are grateful for the work of the Audit and Risk Committee in providing independent oversight and advice, and for Australia’s support of this important mechanism.
The sustainable financing of SPC’s work into the future is a challenge that requires careful assessment of priorities. It is a challenge that we have been addressing actively, including through an increased focus on long-term partnerships. The signing in 2014 of new partnership agreements with Australia and New Zealand provides more flexible and predictable funding, and supports aid effectiveness by allowing longer term approaches that better match country priorities and capacities compared with project-by-project approaches.
Above all, the spirit of trust and cooperation that exists between Pacific Community members and their secretariat is critical to the effectiveness of our work and will be at the forefront of our new Strategic Plan for 2016‒2020, which has been developed in close consultation with them.
Finally, I wish to thank the staff of SPC for their dedication and commitment to their work, and to acknowledge the support this work receives from all our members of the Pacific Community and partners. Their generous assistance enables us to continue providing scientific and technical expertise, knowledge and services for Pacific Island people in every part of the region.
Colin Tukuitonga, Director-General
1. A full account of the work of our programmes is given in the SPC Programme Results Report 2013‒2014. The next edition of the Programme Results Report will be published in the first half of 2016. Detailed reports of our programme work at country level in 2014 were provided in the country reports prepared for each of our Pacific Island members. These reports also form part of our monitoring and evaluation processes.
ANNUAL REPORT 2014 2
Permanent Observer to the UN General Assembly
High-Level Dialogue on Climate Change
to discuss the particular challenges of climate change for Pacific Island people.
Leaders thanked France for its support of SPC, acknowledging in particular the President’s announcement of France’s decision to provide a high-level international technical expert to lead SPC’s Environmental Sustainability and Climate Change Programme in 2015.
They also welcomed France’s commitment to ensuring the success of COP21 and its recognition of the particular threat of climate change for the Pacific Island region, and pledged their support for achieving a legally binding agreement at the Paris conference. However, they underlined the continued need for a balance between mitigation and adaptation strategies in addressing climate change issues.
Development partners – Agence Française de Développement, Deutsche Gesellschaft für Internationale Zusammenarbeit (GIZ) and the European Union ‒ and representatives of Pacific regional organisations including the Pacific Islands Forum Fisheries Agency, Pacific Islands Forum Secretariat and Secretariat of the Pacific Regional Environment Programme, also attended.
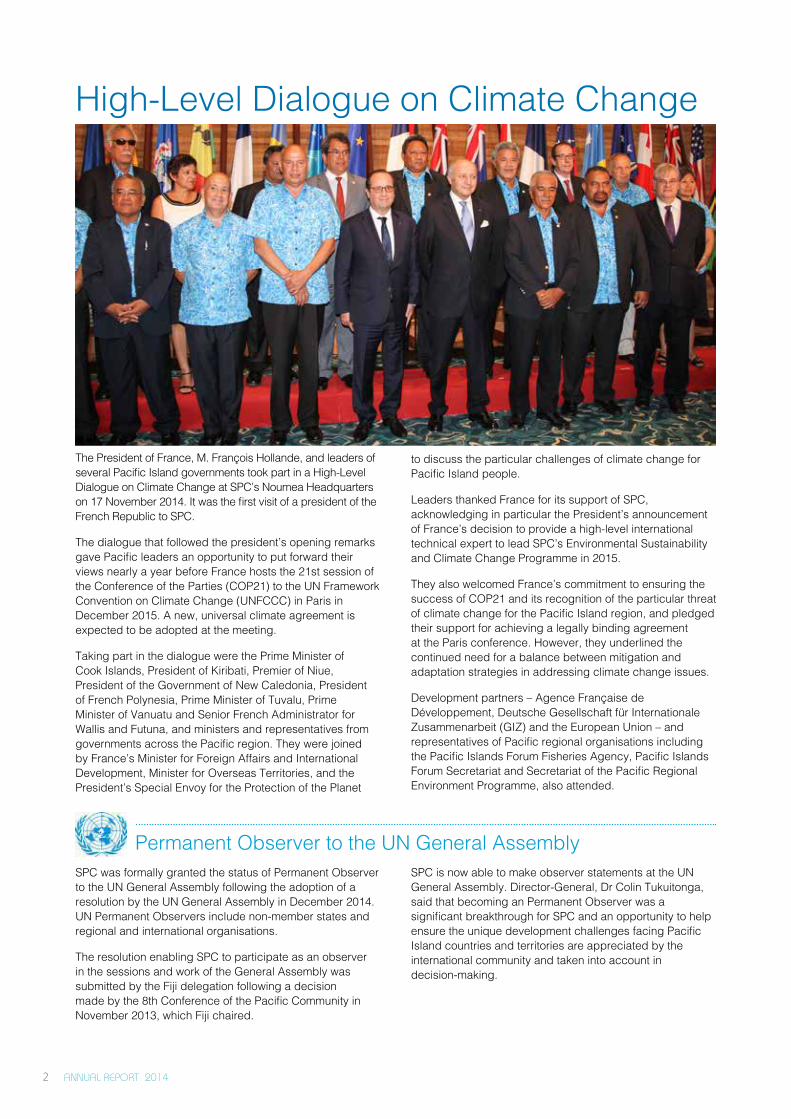
The President of France, M. François Hollande, and leaders of several Pacific Island governments took part in a High-Level Dialogue on Climate Change at SPC’s Noumea Headquarters on 17 November 2014. It was the first visit of a president of the French Republic to SPC.
The dialogue that followed the president’s opening remarks gave Pacific leaders an opportunity to put forward their views nearly a year before France hosts the 21st session of the Conference of the Parties (COP21) to the UN Framework Convention on Climate Change (UNFCCC) in Paris in December 2015. A new, universal climate agreement is expected to be adopted at the meeting.
Taking part in the dialogue were the Prime Minister of Cook Islands, President of Kiribati, Premier of Niue, President of the Government of New Caledonia, President of French Polynesia, Prime Minister of Tuvalu, Prime Minister of Vanuatu and Senior French Administrator for Wallis and Futuna, and ministers and representatives from governments across the Pacific region. They were joined by France’s Minister for Foreign Affairs and International Development, Minister for Overseas Territories, and the President’s Special Envoy for the Protection of the Planet
SPC was formally granted the status of Permanent Observer to the UN General Assembly following the adoption of a resolution by the UN General Assembly in December 2014. UN Permanent Observers include non-member states and regional and international organisations.
The resolution enabling SPC to participate as an observer in the sessions and work of the General Assembly was submitted by the Fiji delegation following a decision made by the 8th Conference of the Pacific Community in November 2013, which Fiji chaired.
SPC is now able to make observer statements at the UN General Assembly. Director-General, Dr Colin Tukuitonga, said that becoming an Permanent Observer was a significant breakthrough for SPC and an opportunity to help ensure the unique development challenges facing Pacific Island countries and territories are appreciated by the international community and taken into account in decision-making.
ANNUAL REPORT 2014 3
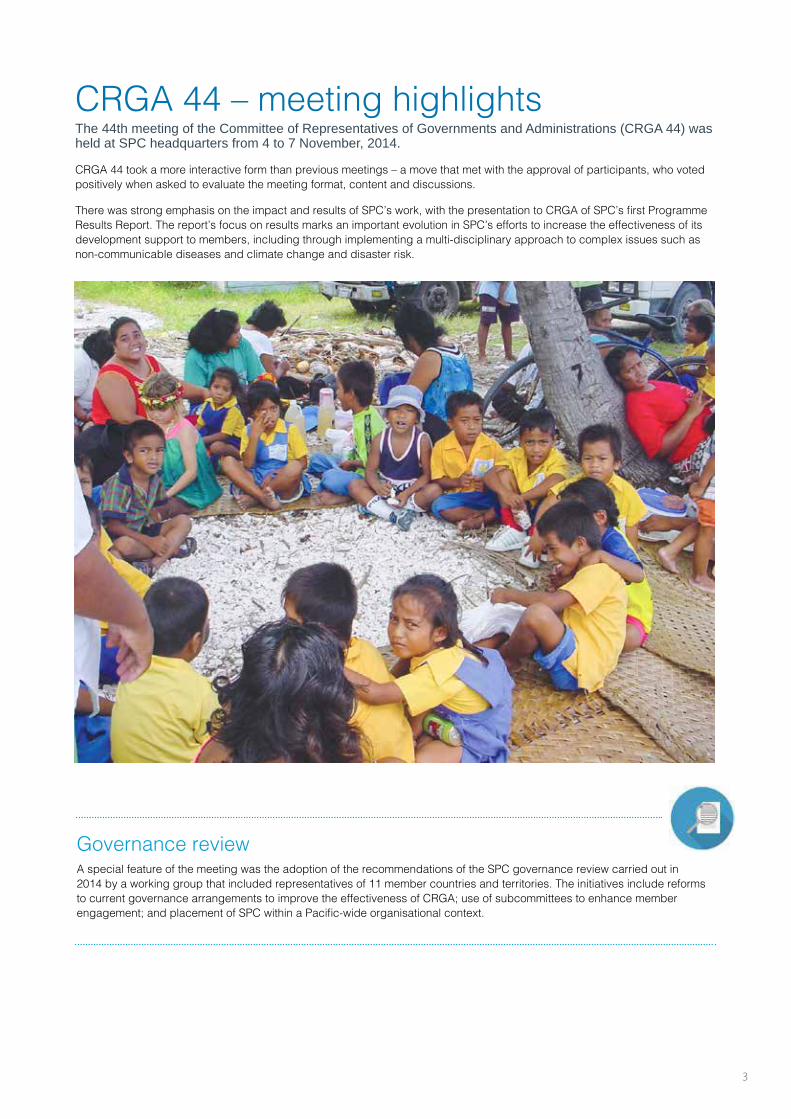
CRGA 44 – meeting highlightsThe 44th meeting of the Committee of Representatives of Governments and Administrations (CRGA 44) was held at SPC headquarters from 4 to 7 November, 2014.
CRGA 44 took a more interactive form than previous meetings ‒ a move that met with the approval of participants, who voted positively when asked to evaluate the meeting format, content and discussions.
There was strong emphasis on the impact and results of SPC’s work, with the presentation to CRGA of SPC’s first Programme Results Report. The report’s focus on results marks an important evolution in SPC’s efforts to increase the effectiveness of its development support to members, including through implementing a multi-disciplinary approach to complex issues such as non-communicable diseases and climate change and disaster risk.
Governance review A special feature of the meeting was the adoption of the recommendations of the SPC governance review carried out in 2014 by a working group that included representatives of 11 member countries and territories. The initiatives include reforms to current governance arrangements to improve the effectiveness of CRGA; use of subcommittees to enhance member engagement; and placement of SPC within a Pacific-wide organisational context.
ANNUAL REPORT 2014 4
Gender equalitySPC’s commitment to equal relationships between women and men was reflected in the launching of two initiatives.
At the opening session of CRGA, the Director-General launched the White Ribbon Campaign at SPC. The campaign is an international male-led movement to end violence against women. Stressing that violence against women and girls is one of the most pervasive manifestations of inequality in the Pacific and the world, Dr Tukuitonga invited all male participants and SPC staff to sign a pledge never to commit, condone or remain silent on such violence. To further improve staff understanding and awareness of sexual and gender based violence, SPC is implementing updated policies and providing opportunities for discussion and training for staff and the wider staff community.
The launch of the Pacific Gender and Climate Change Toolkit highlighted the multi-dimensional impacts of climate change and the need to put people at the centre of climate change adaptation and mitigation strategies.
The toolkit, which was developed by SPC and GIZ (German Agency for International Cooperation), in collaboration with the United Nations Development Programme, UN Women, and the Secretariat of the Pacific Regional Environment Programme (SPREP), will support countries in developing inclusive, gender-responsive strategies to climate change.
Multi-sector approachesNon communicable diseases (NCDs) – In a thematic session on the crisis-levels of NCDs in Pacific populations, the meeting recognised the importance of people’s environments in the development of these diseases and the need for a multi-sector approach involving all relevant sectors and incorporating a ‘Health in All Policies’ approach. The meeting supported SPC’s leadership in establishing the Pacific NCD Partnership, which aims to strengthen and coordinate the capacity and expertise needed to support Pacific Island countries and territories; the NCD Roadmap, which was developed in response to demands from Forum Economic Ministers for economic solutions to NCDs; and SPC’s cross-divisional NCDs/Food Security Working Group that has been set up to consolidate the multi-sector approach.
Climate change and disasters – CRGA acknowledged the extensive consultation and progress made by the regional steering committee in drafting a proposed Strategy for Climate and Disaster Resilient Development in the Pacific ‒ a new policy instrument aimed at building the resilience of Pacific Island communities through integrated management of climate change and disaster risks. However, the meeting noted that further development of the strategy must take into account concerns raised by SPC members, including on governance, plans for implementation, cooperation between agencies, and optimal use of resources.
Dilli
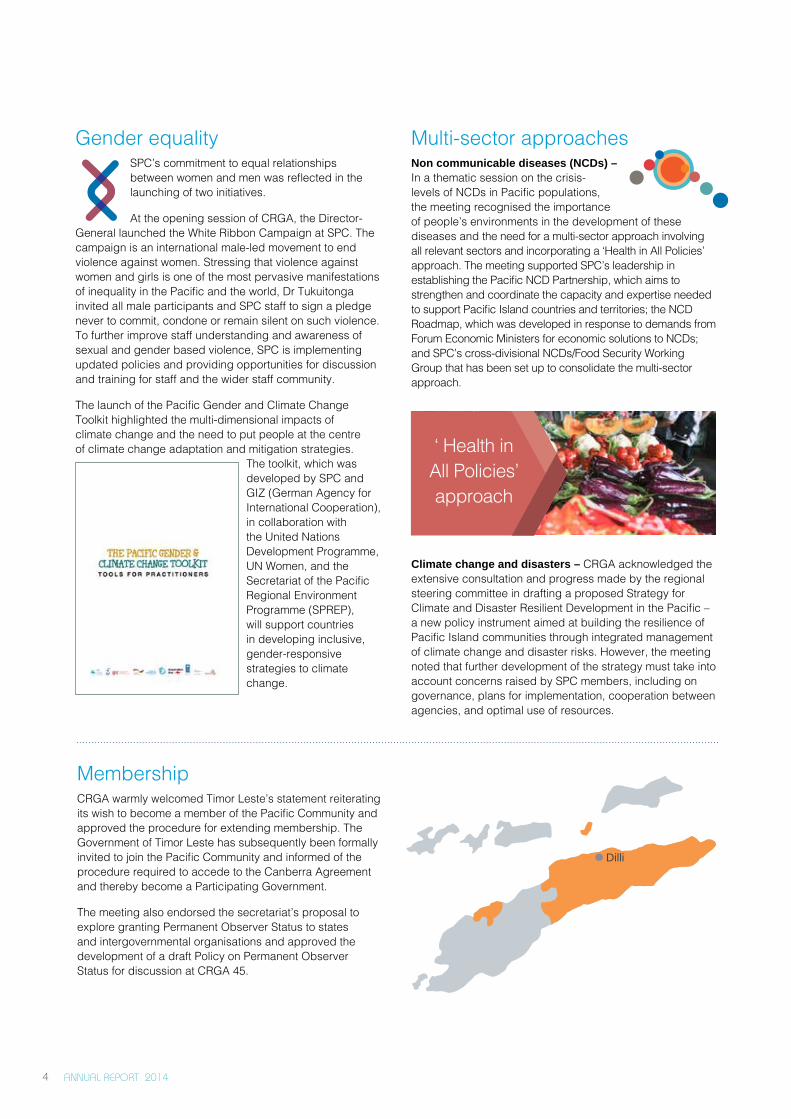
MembershipCRGA warmly welcomed Timor Leste’s statement reiterating its wish to become a member of the Pacific Community and approved the procedure for extending membership. The Government of Timor Leste has subsequently been formally invited to join the Pacific Community and informed of the procedure required to accede to the Canberra Agreement and thereby become a Participating Government.
The meeting also endorsed the secretariat’s proposal to explore granting Permanent Observer Status to states and intergovernmental organisations and approved the development of a draft Policy on Permanent Observer Status for discussion at CRGA 45.
‘ Health in All Policies’ approach
ANNUAL REPORT 2014 5
654 EMPLOYED IN 2014
50% WOMEN
319 INTERNATIONALLY
RECRUITED 37% WOMEN
59% PAC. ISL.
60% SUVA
1.5% SOL. ISL.
4% NORTH PAC.
35% NOUMEA
35% PAC. ISL.
MANAGEMENT(Band 13 and above)
21% WOMEN
51% LOCALLY RECRUITED
64% WOMEN
EMPLOYED IN 2014
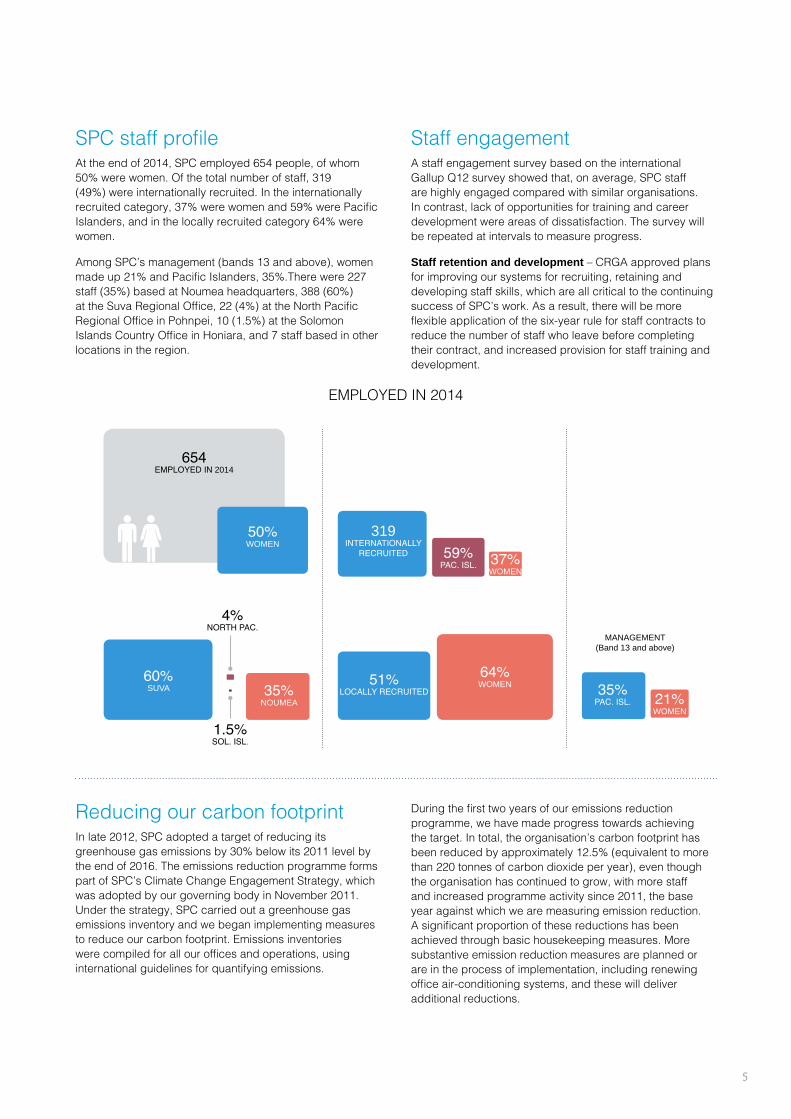
Reducing our carbon footprintIn late 2012, SPC adopted a target of reducing its greenhouse gas emissions by 30% below its 2011 level by the end of 2016. The emissions reduction programme forms part of SPC’s Climate Change Engagement Strategy, which was adopted by our governing body in November 2011. Under the strategy, SPC carried out a greenhouse gas emissions inventory and we began implementing measures to reduce our carbon footprint. Emissions inventories were compiled for all our offices and operations, using international guidelines for quantifying emissions.
SPC staff profileAt the end of 2014, SPC employed 654 people, of whom 50% were women. Of the total number of staff, 319 (49%) were internationally recruited. In the internationally recruited category, 37% were women and 59% were Pacific Islanders, and in the locally recruited category 64% were women.
Among SPC’s management (bands 13 and above), women made up 21% and Pacific Islanders, 35%.There were 227 staff (35%) based at Noumea headquarters, 388 (60%) at the Suva Regional Office, 22 (4%) at the North Pacific Regional Office in Pohnpei, 10 (1.5%) at the Solomon Islands Country Office in Honiara, and 7 staff based in other locations in the region.
Staff engagement A staff engagement survey based on the international Gallup Q12 survey showed that, on average, SPC staff are highly engaged compared with similar organisations. In contrast, lack of opportunities for training and career development were areas of dissatisfaction. The survey will be repeated at intervals to measure progress.
Staff retention and development – CRGA approved plans for improving our systems for recruiting, retaining and developing staff skills, which are all critical to the continuing success of SPC’s work. As a result, there will be more flexible application of the six-year rule for staff contracts to reduce the number of staff who leave before completing their contract, and increased provision for staff training and development.
During the first two years of our emissions reduction programme, we have made progress towards achieving the target. In total, the organisation’s carbon footprint has been reduced by approximately 12.5% (equivalent to more than 220 tonnes of carbon dioxide per year), even though the organisation has continued to grow, with more staff and increased programme activity since 2011, the base year against which we are measuring emission reduction. A significant proportion of these reductions has been achieved through basic housekeeping measures. More substantive emission reduction measures are planned or are in the process of implementation, including renewing office air-conditioning systems, and these will deliver additional reductions.
ANNUAL REPORT 2014 6
Our three goals
Goal 1: Sustainable economic growthSPC contributed to the following key results under this development goal in 2014.
Management of natural resources: As the regional centre for tuna fisheries science and information, SPC collates and analyses oceanic fisheries data to provide scientific advice to countries, subregional and regional agencies to provide a basis for conservation and management of the resource. It also contributes to enhancing country capacity in many areas and continues to manage the region’s tuna data holdings using the Tuna Fisheries Database Management System. The region’s fisheries are its largest renewable resource, providing employment and significant revenue.
Land, agriculture and forestry management: SPC contributed to more effective resource management by developing capacity in policy development, economic analysis, and technical advice on forestry and agricultural practices.
Deep Sea Minerals (DSM): DSM presents an alternative economic development opportunity that could bring about significant economic prosperity if managed appropriately and sustainably. SPC contributed to laying the foundations to this end through providing legal and policy advice, which has been adopted by Pacific Island countries and territories (PICTs).
Maritime boundaries: Defining boundaries allows for improved ocean governance and management of resources within national jurisdictions. SPC provides technical assistance and data to support PICTs in mapping their territorial sea limits and protecting their natural resources. Currently, 58% of all boundaries have been defined in the region.
Exports to international markets: SPC provided support for 42 small and medium enterprises from 15 PICTs in the forestry, agriculture, and aquaculture sectors in areas ranging from production to processing, value-adding,
and marketing. It also provided technical assistance in the phytosanitary and biosecurity strategic areas. This assistance contributed to job creation, export revenue and access to new markets.
Qualified labour force: SPC was instrumental in the benchmarking of national qualifications, international recognition of Pacific qualifications and nationalisation of the Form 6 Pacific Senior Secondary Certificate, for greater labour mobility, national ownership and accountability.
Infrastructure ‒ Transport: Sound infrastructure is key to improving conditions for economic growth.
Working closely with governments and the private sector, SPC was instrumental in strengthening the reliability and affordability of shipping for four island states through the formation of the Central Pacific Shipping Commission. SPC also provided technical assistance to support efficient and safe movement of shipping cargo, safety and security for seafarers, and continued compliance with international requirements.
Infrastructure – Energy: To increase the reliability and affordability of energy, SPC worked with six PICTs to develop national energy plans and national legislation and regulations to strengthen enabling conditions for stronger economic and social development.
Data for sound policies: SPC provided technical support for sound statistical data collection and analysis to inform evidence-based policy making as a key prerequisite for economic growth and development throughout the region. SPC developed and maintains the Pacific regional statistics database with some 200 indicators on strategic sectors in PICTs, and has been instrumental in improving the comparability of data across the Pacific.
SPC works to achieve three interrelated development goals:
1. The Pacific region and its people benefit from inclusive and sustainable economic growth
2. Pacific communities are empowered and resilient
3. Pacific Island people reach their potential and live long and healthy lives
ANNUAL REPORT 2014 7
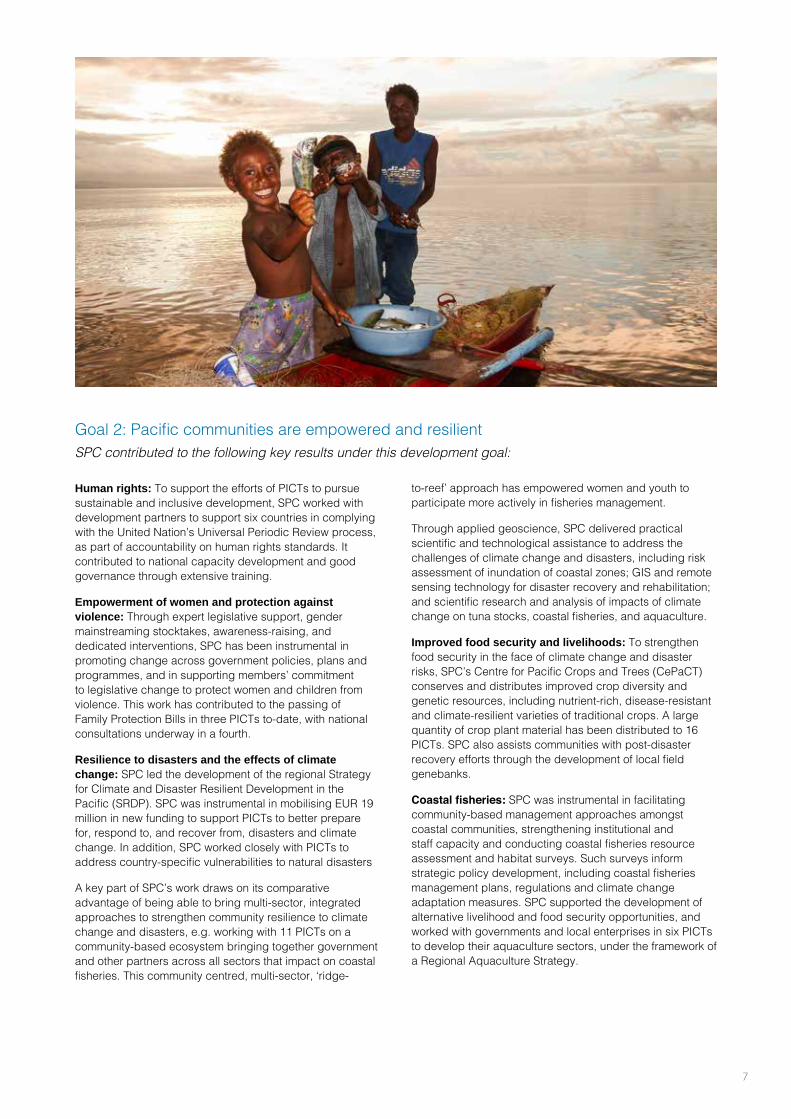
Goal 2: Pacific communities are empowered and resilient SPC contributed to the following key results under this development goal:
to-reef’ approach has empowered women and youth to participate more actively in fisheries management.
Through applied geoscience, SPC delivered practical scientific and technological assistance to address the challenges of climate change and disasters, including risk assessment of inundation of coastal zones; GIS and remote sensing technology for disaster recovery and rehabilitation; and scientific research and analysis of impacts of climate change on tuna stocks, coastal fisheries, and aquaculture.
Improved food security and livelihoods: To strengthen food security in the face of climate change and disaster risks, SPC’s Centre for Pacific Crops and Trees (CePaCT) conserves and distributes improved crop diversity and genetic resources, including nutrient-rich, disease-resistant and climate-resilient varieties of traditional crops. A large quantity of crop plant material has been distributed to 16 PICTs. SPC also assists communities with post-disaster recovery efforts through the development of local field genebanks.
Coastal fisheries: SPC was instrumental in facilitating community-based management approaches amongst coastal communities, strengthening institutional and staff capacity and conducting coastal fisheries resource assessment and habitat surveys. Such surveys inform strategic policy development, including coastal fisheries management plans, regulations and climate change adaptation measures. SPC supported the development of alternative livelihood and food security opportunities, and worked with governments and local enterprises in six PICTs to develop their aquaculture sectors, under the framework of a Regional Aquaculture Strategy.
Human rights: To support the efforts of PICTs to pursue sustainable and inclusive development, SPC worked with development partners to support six countries in complying with the United Nation’s Universal Periodic Review process, as part of accountability on human rights standards. It contributed to national capacity development and good governance through extensive training.
Empowerment of women and protection against violence: Through expert legislative support, gender mainstreaming stocktakes, awareness-raising, and dedicated interventions, SPC has been instrumental in promoting change across government policies, plans and programmes, and in supporting members’ commitment to legislative change to protect women and children from violence. This work has contributed to the passing of Family Protection Bills in three PICTs to-date, with national consultations underway in a fourth.
Resilience to disasters and the effects of climate change: SPC led the development of the regional Strategy for Climate and Disaster Resilient Development in the Pacific (SRDP). SPC was instrumental in mobilising EUR 19 million in new funding to support PICTs to better prepare for, respond to, and recover from, disasters and climate change. In addition, SPC worked closely with PICTs to address country-specific vulnerabilities to natural disasters
A key part of SPC’s work draws on its comparative advantage of being able to bring multi-sector, integrated approaches to strengthen community resilience to climate change and disasters, e.g. working with 11 PICTs on a community-based ecosystem bringing together government and other partners across all sectors that impact on coastal fisheries. This community centred, multi-sector, ‘ridge-
ANNUAL REPORT 2014 8
FINANCIAL STATEMENTS AND AUDIT REPORTS FOR YEAR ENDING DECEMBER 2014
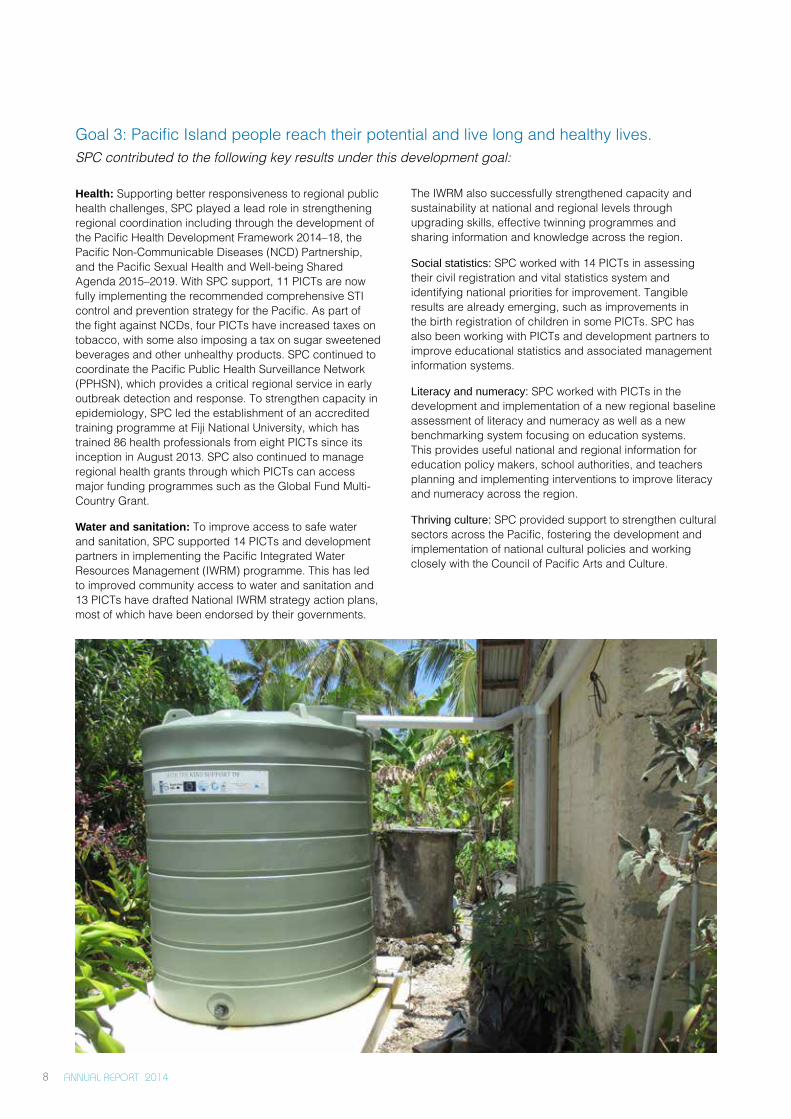
Goal 3: Pacific Island people reach their potential and live long and healthy lives. SPC contributed to the following key results under this development goal:
Health: Supporting better responsiveness to regional public health challenges, SPC played a lead role in strengthening regional coordination including through the development of the Pacific Health Development Framework 2014–18, the Pacific Non-Communicable Diseases (NCD) Partnership, and the Pacific Sexual Health and Well-being Shared Agenda 2015‒2019. With SPC support, 11 PICTs are now fully implementing the recommended comprehensive STI control and prevention strategy for the Pacific. As part of the fight against NCDs, four PICTs have increased taxes on tobacco, with some also imposing a tax on sugar sweetened beverages and other unhealthy products. SPC continued to coordinate the Pacific Public Health Surveillance Network (PPHSN), which provides a critical regional service in early outbreak detection and response. To strengthen capacity in epidemiology, SPC led the establishment of an accredited training programme at Fiji National University, which has trained 86 health professionals from eight PICTs since its inception in August 2013. SPC also continued to manage regional health grants through which PICTs can access major funding programmes such as the Global Fund Multi-Country Grant.
Water and sanitation: To improve access to safe water and sanitation, SPC supported 14 PICTs and development partners in implementing the Pacific Integrated Water Resources Management (IWRM) programme. This has led to improved community access to water and sanitation and 13 PICTs have drafted National IWRM strategy action plans, most of which have been endorsed by their governments.
The IWRM also successfully strengthened capacity and sustainability at national and regional levels through upgrading skills, effective twinning programmes and sharing information and knowledge across the region.
Social statistics: SPC worked with 14 PICTs in assessing their civil registration and vital statistics system and identifying national priorities for improvement. Tangible results are already emerging, such as improvements in the birth registration of children in some PICTs. SPC has also been working with PICTs and development partners to improve educational statistics and associated management information systems.
Literacy and numeracy: SPC worked with PICTs in the development and implementation of a new regional baseline assessment of literacy and numeracy as well as a new benchmarking system focusing on education systems. This provides useful national and regional information for education policy makers, school authorities, and teachers planning and implementing interventions to improve literacy and numeracy across the region.
Thriving culture: SPC provided support to strengthen cultural sectors across the Pacific, fostering the development and implementation of national cultural policies and working closely with the Council of Pacific Arts and Culture.
ANNUAL REPORT 2014 9
FINANCIAL STATEMENTS AND AUDIT REPORTS FOR YEAR ENDING DECEMBER 2014
ANNUAL REPORT 2014 10
ANNUAL REPORT 2014 11

ANNUAL REPORT 2014 12
ANNUAL REPORT 2014 13
ASSETS NOTE 2014 CFP UNITS
2013 CFP UNITS
CURRENT ASSETS
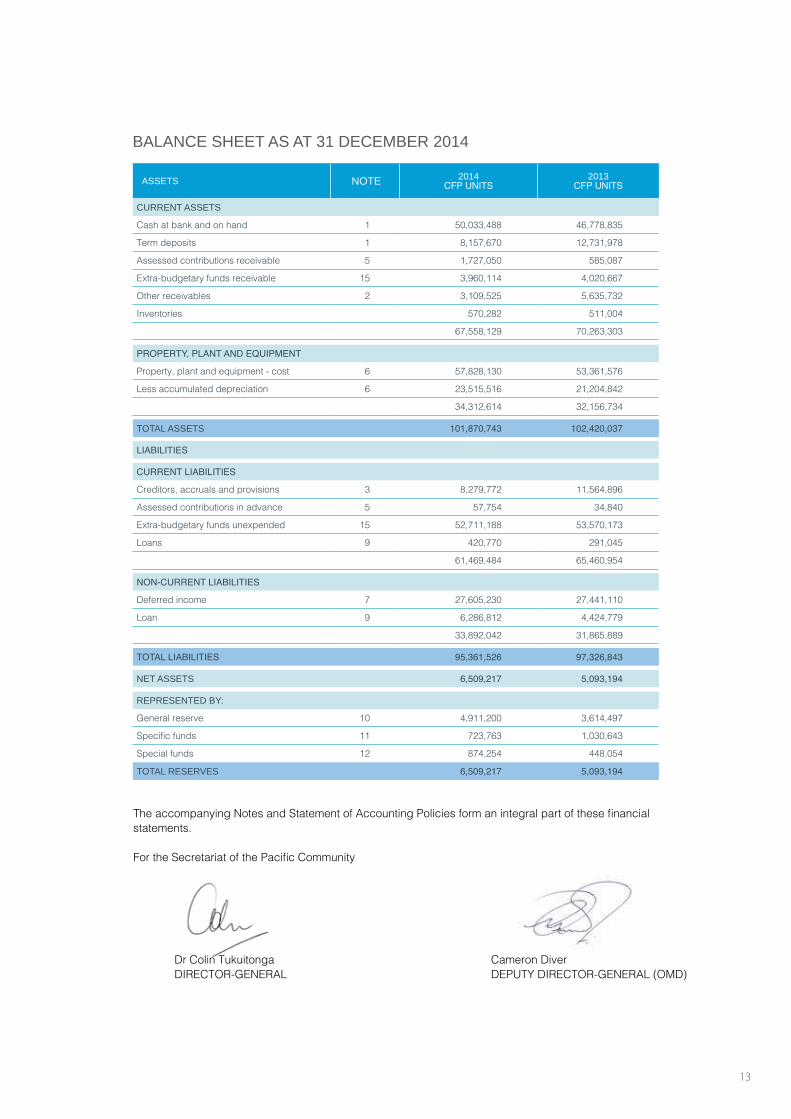
Cash at bank and on hand 1 50,033,488 46,778,835
Term deposits 1 8,157,670 12,731,978
Assessed contributions receivable 5 1,727,050 585,087
Extra-budgetary funds receivable 15 3,960,114 4,020,667
Other receivables 2 3,109,525 5,635,732
Inventories 570,282 511,004
67,558,129 70,263,303
PROPERTY, PLANT AND EQUIPMENT
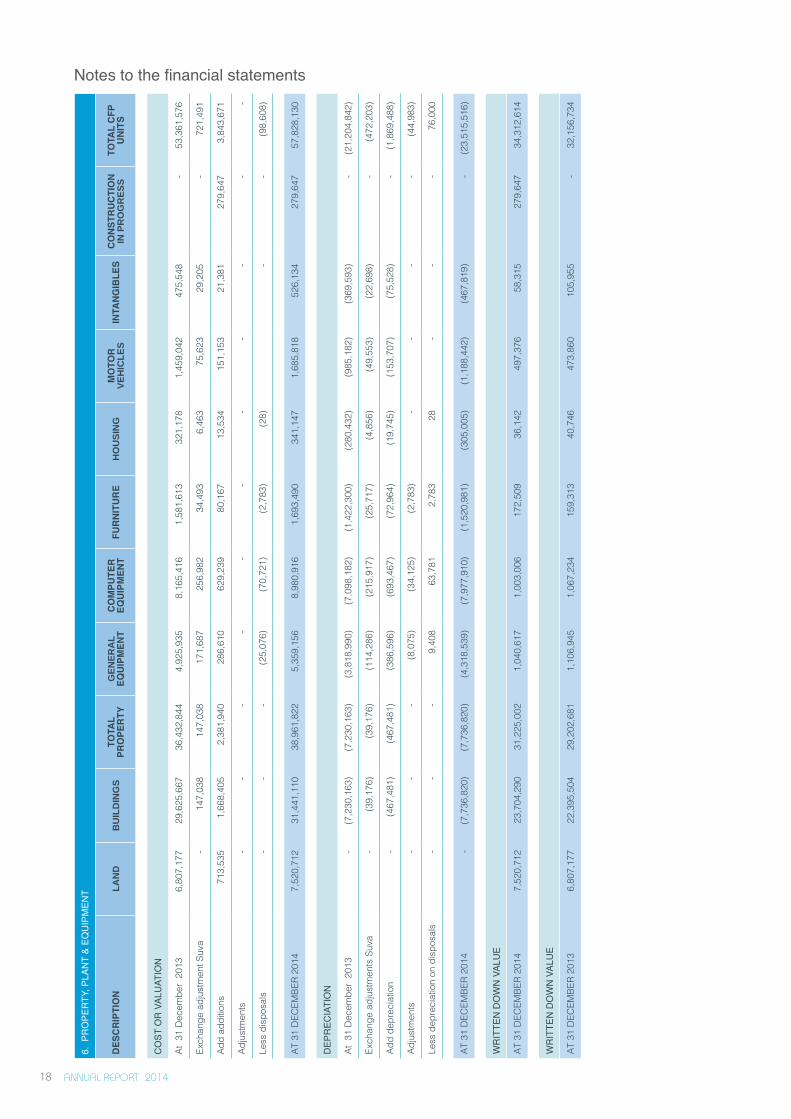
Property, plant and equipment - cost 6 57,828,130 53,361,576
Less accumulated depreciation 6 23,515,516 21,204,842
34,312,614 32,156,734
TOTAL ASSETS 101,870,743 102,420,037
LIABILITIES
CURRENT LIABILITIES
Creditors, accruals and provisions 3 8,279,772 11,564,896
Assessed contributions in advance 5 57,754 34,840
Extra-budgetary funds unexpended 15 52,711,188 53,570,173
Loans 9 420,770 291,045
61,469,484 65,460,954
NON-CURRENT LIABILITIES
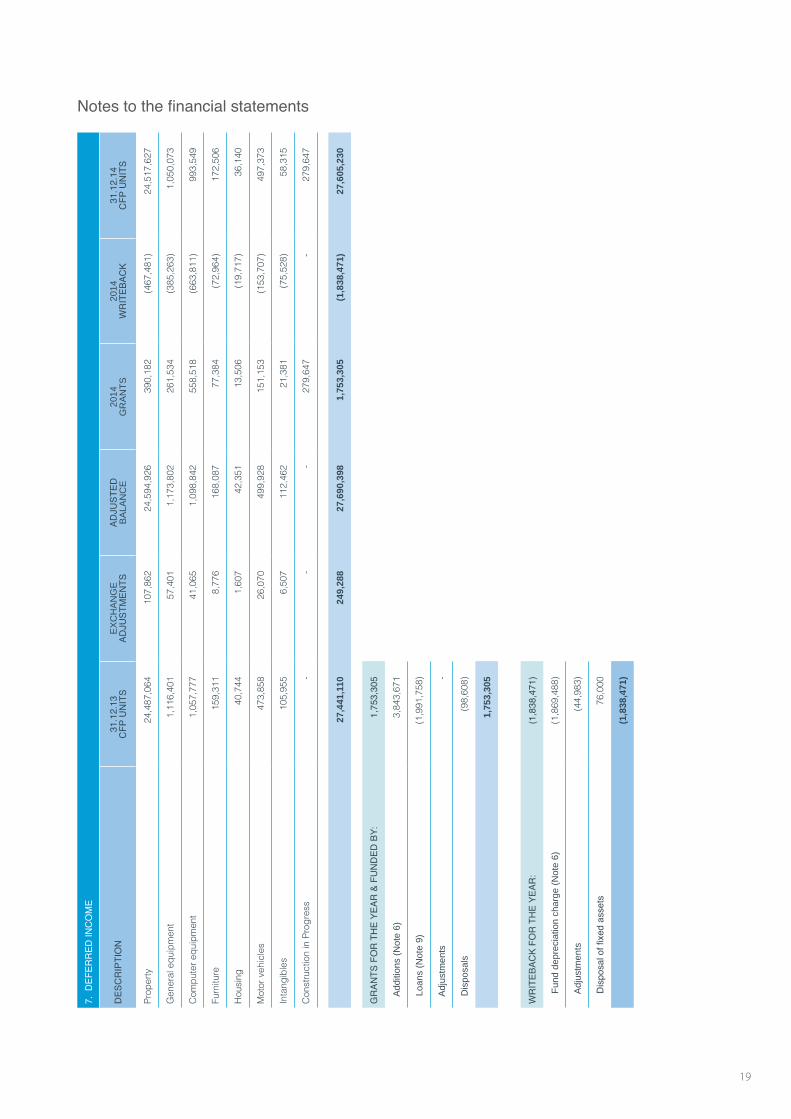
Deferred income 7 27,605,230 27,441,110
Loan 9 6,286,812 4,424,779
33,892,042 31,865,889
TOTAL LIABILITIES 95,361,526 97,326,843
NET ASSETS 6,509,217 5,093,194
REPRESENTED BY:
General reserve 10 4,911,200 3,614,497
Specific funds 11 723,763 1,030,643
Special funds 12 874,254 448,054
TOTAL RESERVES 6,509,217 5,093,194
The accompanying Notes and Statement of Accounting Policies form an integral part of these financial statements.
For the Secretariat of the Pacific Community
Dr Colin Tukuitonga Cameron Diver DIRECTOR-GENERAL DEPUTY DIRECTOR-GENERAL (OMD)
BALANCE SHEET AS AT 31 DECEMBER 2014
ANNUAL REPORT 2014 14
NOTE 2014
CFP UNITS
2014 REVISED BUDGET
CFP UNITS
2014 VARIATION CFP UNITS
2013 CFP UNITS
INCOME & TRANSFERS
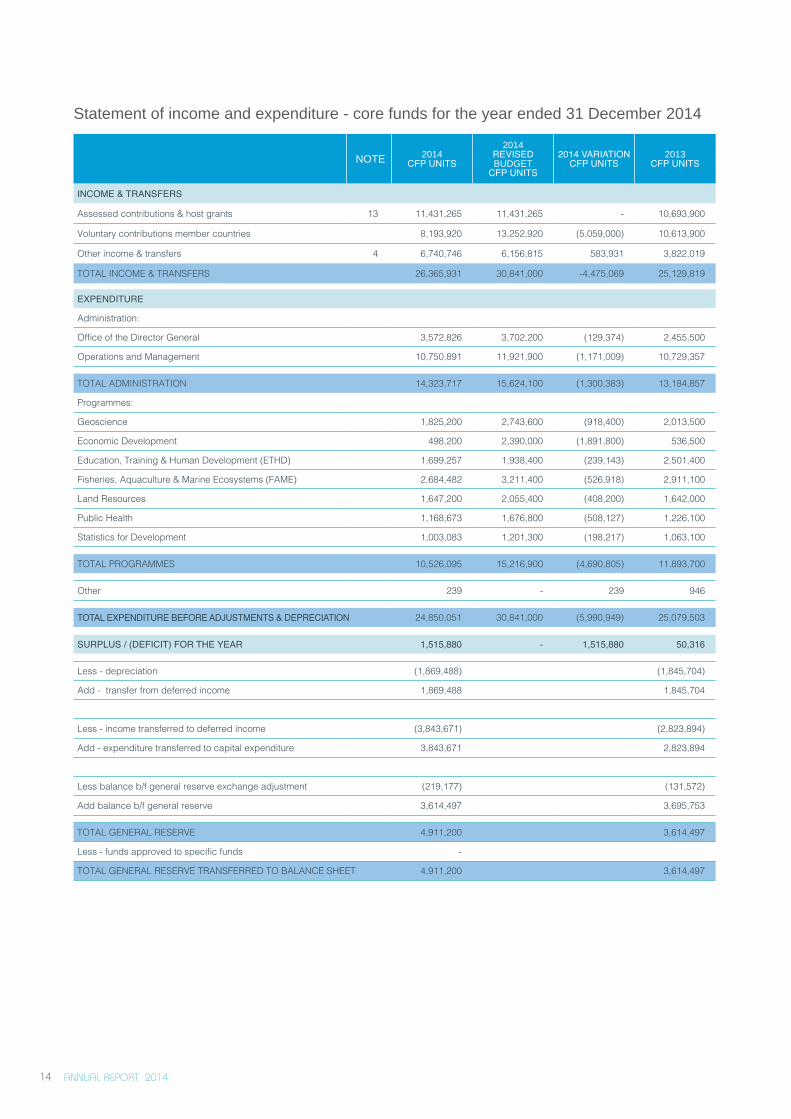
Assessed contributions & host grants 13 11,431,265 11,431,265 - 10,693,900
Voluntary contributions member countries 8,193,920 13,252,920 (5,059,000) 10,613,900
Other income & transfers 4 6,740,746 6,156,815 583,931 3,822,019
TOTAL INCOME & TRANSFERS 26,365,931 30,841,000 -4,475,069 25,129,819
EXPENDITURE
Administration:
Office of the Director General 3,572,826 3,702,200 (129,374) 2,455,500
Operations and Management 10,750,891 11,921,900 (1,171,009) 10,729,357
TOTAL ADMINISTRATION 14,323,717 15,624,100 (1,300,383) 13,184,857
Programmes:
Geoscience 1,825,200 2,743,600 (918,400) 2,013,500
Economic Development 498,200 2,390,000 (1,891,800) 536,500
Education, Training & Human Development (ETHD) 1,699,257 1,938,400 (239,143) 2,501,400
Fisheries, Aquaculture & Marine Ecosystems (FAME) 2,684,482 3,211,400 (526,918) 2,911,100
Land Resources 1,647,200 2,055,400 (408,200) 1,642,000
Public Health 1,168,673 1,676,800 (508,127) 1,226,100
Statistics for Development 1,003,083 1,201,300 (198,217) 1,063,100
TOTAL PROGRAMMES 10,526,095 15,216,900 (4,690,805) 11,893,700
Other 239 - 239 946
TOTAL EXPENDITURE BEFORE ADJUSTMENTS & DEPRECIATION 24,850,051 30,841,000 (5,990,949) 25,079,503
SURPLUS / (DEFICIT) FOR THE YEAR 1,515,880 - 1,515,880 50,316
Less - depreciation (1,869,488) (1,845,704)
Add - transfer from deferred income 1,869,488 1,845,704
Less - income transferred to deferred income (3,843,671) (2,823,894)
Add - expenditure transferred to capital expenditure 3,843,671 2,823,894
Less balance b/f general reserve exchange adjustment (219,177) (131,572)
Add balance b/f general reserve 3,614,497 3,695,753
TOTAL GENERAL RESERVE 4,911,200 3,614,497
Less - funds approved to specific funds -
TOTAL GENERAL RESERVE TRANSFERRED TO BALANCE SHEET 4,911,200 3,614,497
Statement of income and expenditure - core funds for the year ended 31 December 2014
ANNUAL REPORT 2014 15
NOTE 2014 CFP UNITS
2013 CFP UNITS
CASH FLOWS FROM OPERATING ACTIVITIES
INFLOWS:
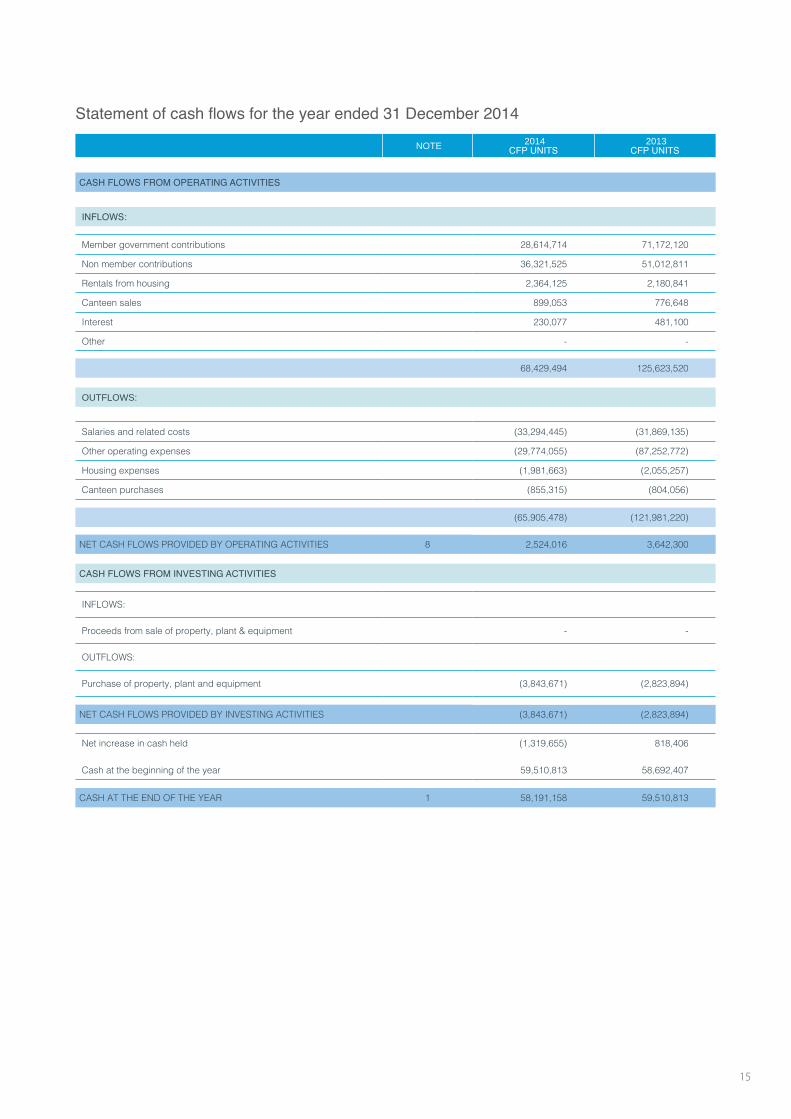
Member government contributions 28,614,714 71,172,120
Non member contributions 36,321,525 51,012,811
Rentals from housing 2,364,125 2,180,841
Canteen sales 899,053 776,648
Interest 230,077 481,100
Other - -
68,429,494 125,623,520
OUTFLOWS:
Salaries and related costs (33,294,445) (31,869,135)
Other operating expenses (29,774,055) (87,252,772)
Housing expenses (1,981,663) (2,055,257)
Canteen purchases (855,315) (804,056)
(65,905,478) (121,981,220)
NET CASH FLOWS PROVIDED BY OPERATING ACTIVITIES 8 2,524,016 3,642,300
CASH FLOWS FROM INVESTING ACTIVITIES
INFLOWS:
Proceeds from sale of property, plant & equipment - -
OUTFLOWS:
Purchase of property, plant and equipment (3,843,671) (2,823,894)
NET CASH FLOWS PROVIDED BY INVESTING ACTIVITIES (3,843,671) (2,823,894)
Net increase in cash held (1,319,655) 818,406
Cash at the beginning of the year 59,510,813 58,692,407
CASH AT THE END OF THE YEAR 1 58,191,158 59,510,813
Statement of cash flows for the year ended 31 December 2014
ANNUAL REPORT 2014 ANNUAL REPORT 2014 16
Notes to the financial statements
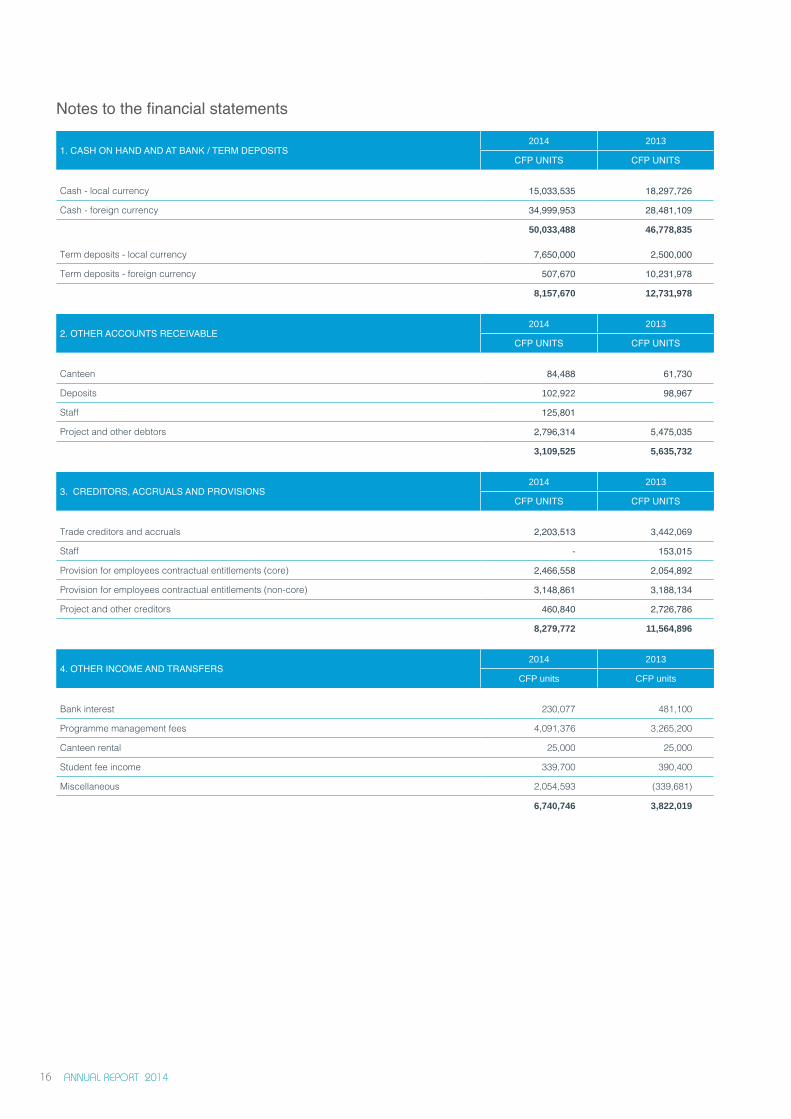
1. CASH ON HAND AND AT BANK / TERM DEPOSITS2014 2013
CFP UNITS CFP UNITS
Cash - local currency 15,033,535 18,297,726
Cash - foreign currency 34,999,953 28,481,109
50,033,488 46,778,835
Term deposits - local currency 7,650,000 2,500,000
Term deposits - foreign currency 507,670 10,231,978
8,157,670 12,731,978
2. OTHER ACCOUNTS RECEIVABLE2014 2013
CFP UNITS CFP UNITS
Canteen 84,488 61,730
Deposits 102,922 98,967
Staff 125,801
Project and other debtors 2,796,314 5,475,035
3,109,525 5,635,732
3. CREDITORS, ACCRUALS AND PROVISIONS2014 2013
CFP UNITS CFP UNITS
Trade creditors and accruals 2,203,513 3,442,069
Staff - 153,015
Provision for employees contractual entitlements (core) 2,466,558 2,054,892
Provision for employees contractual entitlements (non-core) 3,148,861 3,188,134
Project and other creditors 460,840 2,726,786
8,279,772 11,564,896
4. OTHER INCOME AND TRANSFERS2014 2013
CFP units CFP units
Bank interest 230,077 481,100
Programme management fees 4,091,376 3,265,200
Canteen rental 25,000 25,000
Student fee income 339,700 390,400
Miscellaneous 2,054,593 (339,681)
6,740,746 3,822,019
ANNUAL REPORT 2014 17ANNUAL REPORT 2014
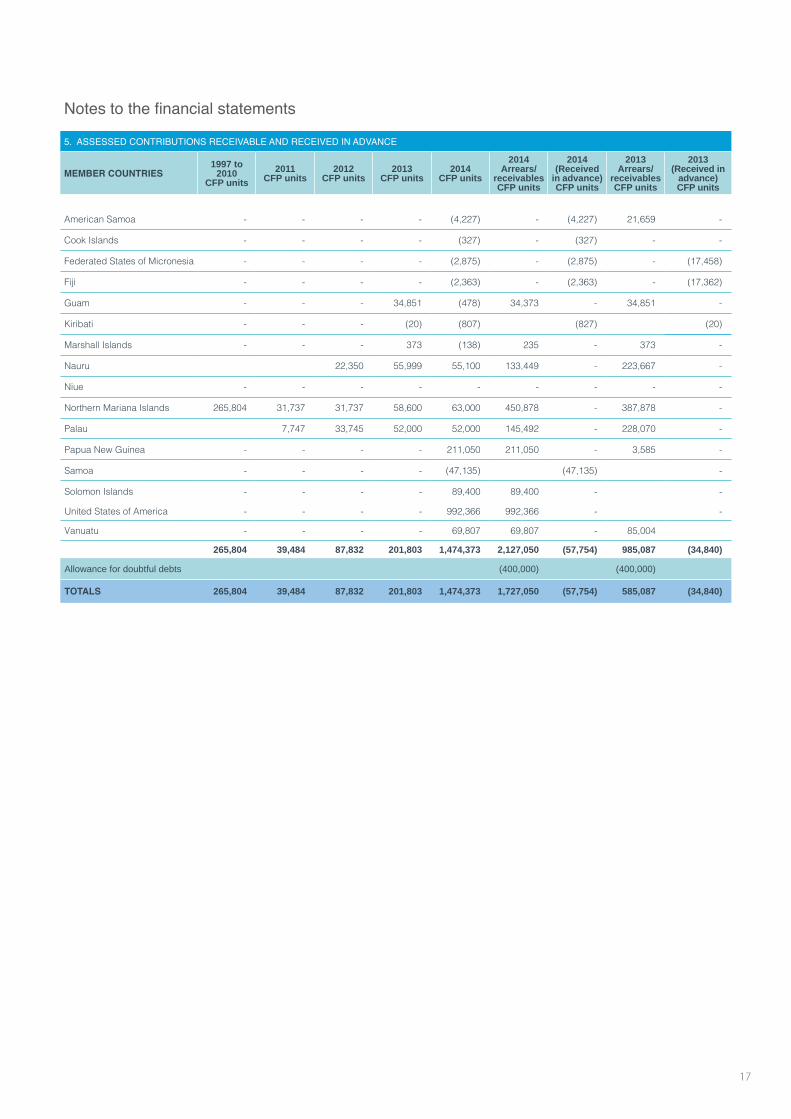
5. ASSESSED CONTRIBUTIONS RECEIVABLE AND RECEIVED IN ADVANCE
MEMBER COUNTRIES1997 to
2010 CFP units
2011CFP units
2012CFP units
2013CFP units
2014CFP units
2014 Arrears/
receivables CFP units
2014 (Received
in advance) CFP units
2013 Arrears/
receivables CFP units
2013 (Received in
advance) CFP units
American Samoa - - - - (4,227) - (4,227) 21,659 -
Cook Islands - - - - (327) - (327) - -
Federated States of Micronesia - - - - (2,875) - (2,875) - (17,458)
Fiji - - - - (2,363) - (2,363) - (17,362)
Guam - - - 34,851 (478) 34,373 - 34,851 -
Kiribati - - - (20) (807) (827) (20)
Marshall Islands - - - 373 (138) 235 - 373 -
Nauru 22,350 55,999 55,100 133,449 - 223,667 -
Niue - - - - - - - - -
Northern Mariana Islands 265,804 31,737 31,737 58,600 63,000 450,878 - 387,878 -
Palau 7,747 33,745 52,000 52,000 145,492 - 228,070 -
Papua New Guinea - - - - 211,050 211,050 - 3,585 -
Samoa - - - - (47,135) (47,135) -
Solomon Islands - - - - 89,400 89,400 - -
United States of America - - - - 992,366 992,366 - -
Vanuatu - - - - 69,807 69,807 - 85,004
265,804 39,484 87,832 201,803 1,474,373 2,127,050 (57,754) 985,087 (34,840)
Allowance for doubtful debts (400,000) (400,000)
TOTALS 265,804 39,484 87,832 201,803 1,474,373 1,727,050 (57,754) 585,087 (34,840)
Notes to the financial statements
ANNUAL REPORT 2014 18
6. P
RO
PERT
Y, P
LAN
T &
EQU
IPM
ENT
DES
CR
IPTI
ON
LA
ND
BU
ILD
ING
STO
TAL
PRO
PER
TYG
EN
ER
AL
EQ
UIP
MEN
TC
OM
PUTE
R
EQU
IPM
ENT
FUR
NIT
UR
EH
OU
SIN
GM
OTO
R
VE
HIC
LE
SIN
TAN
GIB
LES
CO
NST
RU
CTI
ON
IN
PR
OG
RE
SS
TOTA
L C
FP
UN
ITS
CO
ST O
R V
ALU
ATIO
N
At 3
1 D
ecem
ber
2013
6,80
7,17
729
,625
,667
36,4
32,8
444,
925,
935
8,16
5,41
61,
581,
613
321,
178
1,45
9,04
247
5,54
8 -
53,3
61,5
76
Exch
ange
adj
ustm
ent S
uva
- 14
7,03
814
7,03
817
1,68
725
6,98
234
,493
6,46
375
,623
29,2
05 -
721,
491
Add
addi
tions
713,
535
1,66
8,40
52,
381,
940
286,
610
629,
239
80,1
6713
,534
151,
153
21,3
8127
9,64
73,
843,
671
Adju
stm
ents
- -
- -
- -
- -
- -
-
Less
dis
posa
ls -
- -
(25,
076)
(70,
721)
(2,7
83)
(28)
- -
(98,
608)
AT 3
1 D
ECEM
BER
2014
7,52
0,71
231
,441
,110
38,9
61,8
225,
359,
156
8,98
0,91
61,
693,
490
341,
147
1,68
5,81
852
6,13
427
9,64
757
,828
,130
DEP
REC
IATI
ON
At 3
1 D
ecem
ber
2013
- (7
,230
,163
)(7
,230
,163
)(3
,818
,990
)(7
,098
,182
)(1
,422
,300
)(2
80,4
32)
(985
,182
)(3
69,5
93)
- (2
1,20
4,84
2)
Exch
ange
adj
ustm
ents
Suv
a -
(39,
176)
(39,
176)
(114
,286
)(2
15,9
17)
(25,
717)
(4,8
56)
(49,
553)
(22,
698)
- (4
72,2
03)
Add
depr
ecia
tion
- (4
67,4
81)
(467
,481
)(3
86,5
96)
(693
,467
)(7
2,96
4)(1
9,74
5)(1
53,7
07)
(75,
528)
- (1
,869
,488
)
Adju
stm
ents
- -
- (8
,075
)(3
4,12
5)(2
,783
) -
- -
- (4
4,98
3)
Less
dep
reci
atio
n on
dis
posa
ls -
- -
9,40
863
,781
2,78
328
- -
- 76
,000
AT 3
1 D
ECEM
BER
2014
- (7
,736
,820
)(7
,736
,820
)(4
,318
,539
)(7
,977
,910
)(1
,520
,981
)(3
05,0
05)
(1,1
88,4
42)
(467
,819
) -
(23,
515,
516)
WR
ITTE
N D
OW
N V
ALU
E
AT 3
1 D
ECEM
BER
2014
7,52
0,71
223
,704
,290
31,2
25,0
021,
040,
617
1,00
3,00
617
2,50
936
,142
497,
376
58,3
1527
9,64
734
,312
,614
WR
ITTE
N D
OW
N V
ALU
E
AT 3
1 D
ECEM
BER
2013
6,80
7,17
722
,395
,504
29,2
02,6
811,
106,
945
1,06
7,23
415
9,31
340
,746
473,
860
105,
955
- 32
,156
,734
Notes to the financial statements
ANNUAL REPORT 2014 19
7. D
EFER
RED
INC
OM
E
DES
CR
IPTI
ON
31.1
2.13
C
FP U
NIT
SE
XC
HA
NG
E
ADJU
STM
ENTS
ADJU
STED
B
ALA
NC
E20
14
GR
AN
TS
2014
W
RIT
EBAC
K31
.12.
14
CFP
UN
ITS
Prop
erty
24,
487,
064
107
,862
2
4,59
4,92
6 39
0,18
2 (4
67,4
81)
24,
517,
627
Gen
eral
equ
ipm
ent
1,1
16,4
01
57,
401
1,17
3,80
2 26
1,53
4 (3
85,2
63)
1,0
50,0
73
Com
pute
r equ
ipm
ent
1,0
57,7
77
41,
065
1,09
8,84
2 55
8,51
8 (6
63,8
11)
993
,549
Furn
iture
159
,311
8
,776
16
8,08
7 77
,384
(7
2,96
4) 1
72,5
06
Hou
sing
40,
744
1,6
07
42,3
51
13,5
06
(19,
717)
36,
140
Mot
or v
ehic
les
473
,858
2
6,07
0 49
9,92
8 15
1,15
3 (1
53,7
07)
497
,373
Inta
ngib
les
105
,955
6
,507
1
12,4
62
21,3
81 (7
5,52
8) 5
8,31
5
Con
stru
ctio
n in
Pro
gres
s -
- -
279,
647
- 2
79,6
47
27,4
41,1
10
249
,288
27
,690
,398
1,
753,
305
(1,
838,
471)
27,6
05,2
30
GR
ANTS
FO
R T
HE
YEAR
& F
UN
DED
BY:
1,75
3,30
5
A
dditi
ons
(Not
e 6)
3,84
3,67
1
Lo
ans
(Not
e 9)
(1,9
91,7
58)
A
djus
tmen
ts -
D
ispo
sals
(98,
608)
1,75
3,30
5
WR
ITEB
ACK
FOR
TH
E YE
AR:
(1,8
38,4
71)
F
und
depr
ecia
tion
char
ge (
Not
e 6)
(1,8
69,4
88)
A
djus
tmen
ts (4
4,98
3)
D
ispo
sal o
f fixe
d as
sets
76,
000
(1,
838,
471)
Notes to the financial statements
ANNUAL REPORT 2014 20
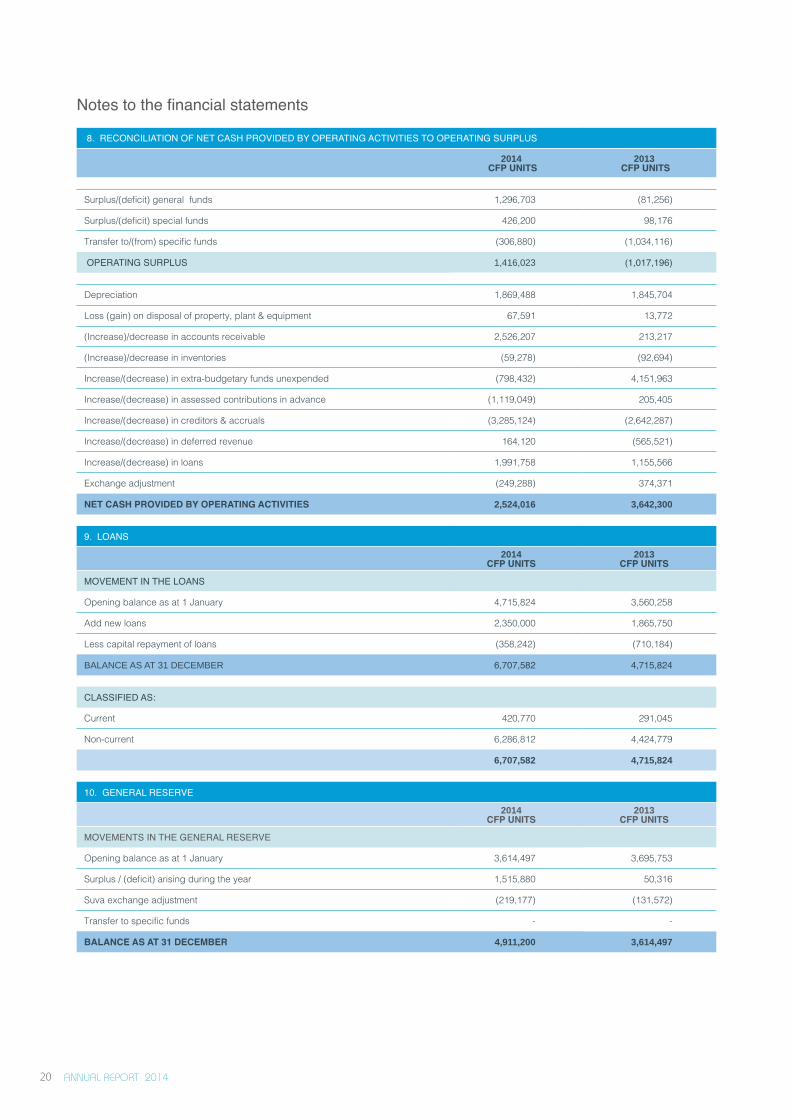
8. RECONCILIATION OF NET CASH PROVIDED BY OPERATING ACTIVITIES TO OPERATING SURPLUS
2014 CFP UNITS
2013 CFP UNITS
Surplus/(deficit) general funds 1,296,703 (81,256)
Surplus/(deficit) special funds 426,200 98,176
Transfer to/(from) specific funds (306,880) (1,034,116)
OPERATING SURPLUS 1,416,023 (1,017,196)
Depreciation 1,869,488 1,845,704
Loss (gain) on disposal of property, plant & equipment 67,591 13,772
(Increase)/decrease in accounts receivable 2,526,207 213,217
(Increase)/decrease in inventories (59,278) (92,694)
Increase/(decrease) in extra-budgetary funds unexpended (798,432) 4,151,963
Increase/(decrease) in assessed contributions in advance (1,119,049) 205,405
Increase/(decrease) in creditors & accruals (3,285,124) (2,642,287)
Increase/(decrease) in deferred revenue 164,120 (565,521)
Increase/(decrease) in loans 1,991,758 1,155,566
Exchange adjustment (249,288) 374,371
NET CASH PROVIDED BY OPERATING ACTIVITIES 2,524,016 3,642,300
9. LOANS
2014 CFP UNITS
2013 CFP UNITS
MOVEMENT IN THE LOANS
Opening balance as at 1 January 4,715,824 3,560,258
Add new loans 2,350,000 1,865,750
Less capital repayment of loans (358,242) (710,184)
BALANCE AS AT 31 DECEMBER 6,707,582 4,715,824
CLASSIFIED AS:
Current 420,770 291,045
Non-current 6,286,812 4,424,779
6,707,582 4,715,824
10. GENERAL RESERVE
2014 CFP UNITS
2013 CFP UNITS
MOVEMENTS IN THE GENERAL RESERVE
Opening balance as at 1 January 3,614,497 3,695,753
Surplus / (deficit) arising during the year 1,515,880 50,316
Suva exchange adjustment (219,177) (131,572)
Transfer to specific funds - -
BALANCE AS AT 31 DECEMBER 4,911,200 3,614,497
Notes to the financial statements
ANNUAL REPORT 2014 21
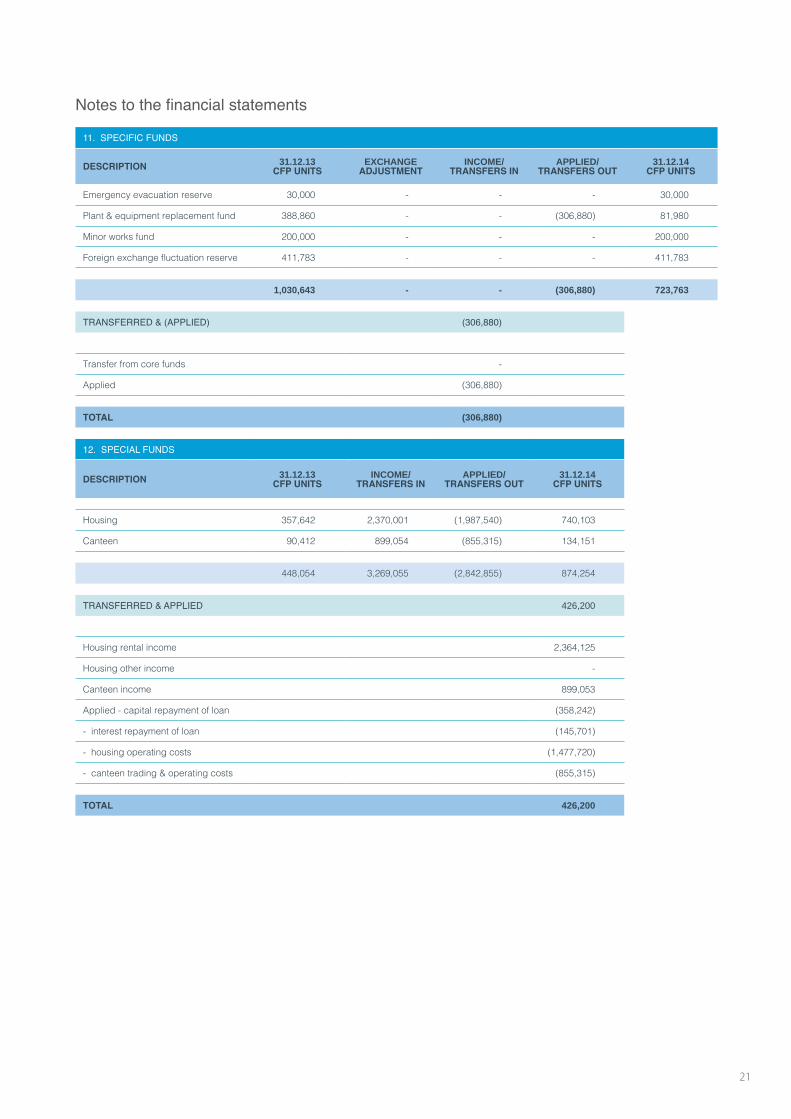
11. SPECIFIC FUNDS
DESCRIPTION 31.12.13CFP UNITS
EXCHANGEADJUSTMENT
INCOME/TRANSFERS IN
APPLIED/TRANSFERS OUT
31.12.14CFP UNITS
Emergency evacuation reserve 30,000 - - - 30,000
Plant & equipment replacement fund 388,860 - - (306,880) 81,980
Minor works fund 200,000 - - - 200,000
Foreign exchange fluctuation reserve 411,783 - - - 411,783
1,030,643 - - (306,880) 723,763
TRANSFERRED & (APPLIED) (306,880)
Transfer from core funds -
Applied (306,880)
TOTAL (306,880)
12. SPECIAL FUNDS
DESCRIPTION 31.12.13CFP UNITS
INCOME/TRANSFERS IN
APPLIED/TRANSFERS OUT
31.12.14CFP UNITS
Housing 357,642 2,370,001 (1,987,540) 740,103
Canteen 90,412 899,054 (855,315) 134,151
448,054 3,269,055 (2,842,855) 874,254
TRANSFERRED & APPLIED 426,200
Housing rental income 2,364,125
Housing other income -
Canteen income 899,053
Applied - capital repayment of loan (358,242)
- interest repayment of loan (145,701)
- housing operating costs (1,477,720)
- canteen trading & operating costs (855,315)
TOTAL 426,200
Notes to the financial statements
ANNUAL REPORT 2014 22
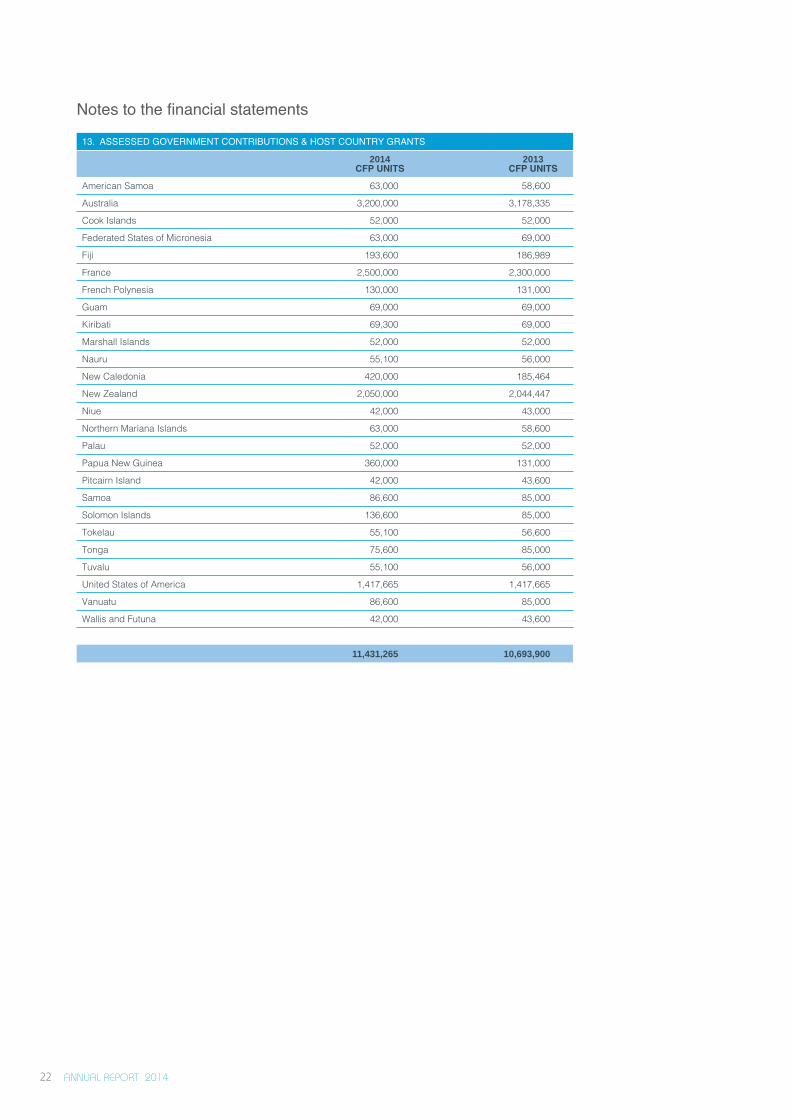
13. ASSESSED GOVERNMENT CONTRIBUTIONS & HOST COUNTRY GRANTS
2014CFP UNITS
2013CFP UNITS
American Samoa 63,000 58,600
Australia 3,200,000 3,178,335
Cook Islands 52,000 52,000
Federated States of Micronesia 63,000 69,000
Fiji 193,600 186,989
France 2,500,000 2,300,000
French Polynesia 130,000 131,000
Guam 69,000 69,000
Kiribati 69,300 69,000
Marshall Islands 52,000 52,000
Nauru 55,100 56,000
New Caledonia 420,000 185,464
New Zealand 2,050,000 2,044,447
Niue 42,000 43,000
Northern Mariana Islands 63,000 58,600
Palau 52,000 52,000
Papua New Guinea 360,000 131,000
Pitcairn Island 42,000 43,600
Samoa 86,600 85,000
Solomon Islands 136,600 85,000
Tokelau 55,100 56,600
Tonga 75,600 85,000
Tuvalu 55,100 56,000
United States of America 1,417,665 1,417,665
Vanuatu 86,600 85,000
Wallis and Futuna 42,000 43,600
11,431,265 10,693,900
Notes to the financial statements
ANNUAL REPORT 2014 23
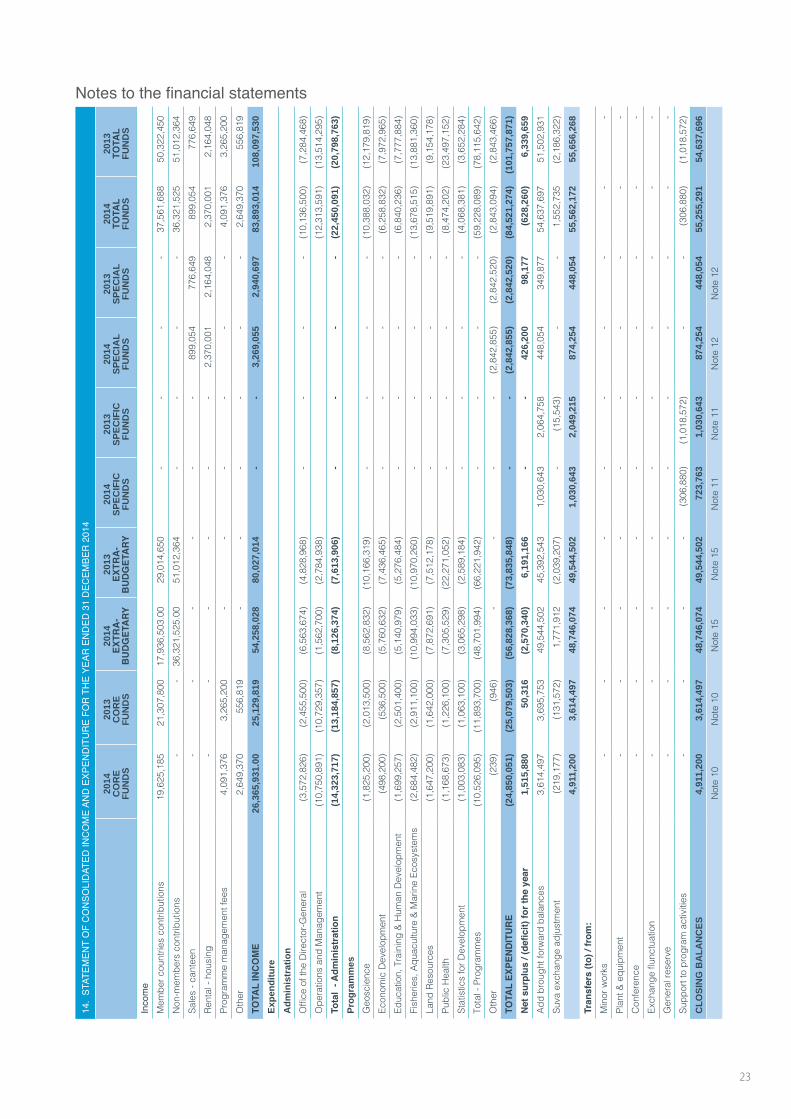
14.
STAT
EMEN
T O
F C
ON
SOLI
DAT
ED IN
CO
ME
AND
EXP
END
ITU
RE
FOR
TH
E YE
AR E
ND
ED 3
1 D
ECEM
BER
201
4
2014
CO
RE
FU
ND
S
2013
CO
RE
FU
ND
S
2014
EXTR
A-
BU
DG
ETA
RY
2013
EXTR
A-
BU
DG
ETA
RY
2014
SP
EC
IFIC
FU
ND
S
2013
SP
EC
IFIC
FU
ND
S
2014
SP
EC
IAL
FU
ND
S
2013
SP
EC
IAL
FU
ND
S
2014
TOTA
L F
UN
DS
2013
TOTA
L F
UN
DS
Inco
me
Mem
ber c
ount
ries
cont
ribut
ions
19,
625,
185
21,
307,
800
17,
936,
503.
00
29,
014,
650
- -
- -
37,
561,
688
50,
322,
450
Non
-mem
bers
con
tribu
tions
- -
36,
321,
525.
00
51,
012,
364
- -
- -
36,
321,
525
51,
012,
364
Sale
s - c
ante
en -
- -
- -
- 8
99,0
54
776
,649
8
99,0
54
776
,649
Re
ntal
- ho
usin
g -
- -
- -
- 2
,370
,001
2
,164
,048
2
,370
,001
2
,164
,048
Pr
ogra
mm
e m
anag
emen
t fee
s 4
,091
,376
3
,265
,200
-
- -
- -
- 4
,091
,376
3
,265
,200
O
ther
2,6
49,3
70
556
,819
-
- -
- -
- 2
,649
,370
5
56,8
19
TOTA
L IN
CO
ME
26,
365,
931.
00
25,
129,
819
54,
258,
028
80,
027,
014
-
-
3,2
69,0
55
2,9
40,6
97
83,
893,
014
108
,097
,530
Exp
end
itu
re
Ad
min
istr
atio
n
Offi
ce o
f the
Dire
ctor
-Gen
eral
(3,5
72,8
26)
(2,4
55,5
00)
(6,5
63,6
74)
(4,8
28,9
68)
- -
- -
(10,
136,
500)
(7,2
84,4
68)
Ope
ratio
ns a
nd M
anag
emen
t (1
0,75
0,89
1) (1
0,72
9,35
7) (1
,562
,700
) (2
,784
,938
) (1
2,31
3,59
1) (1
3,51
4,29
5)To
tal
- Adm
inis
trat
ion
(14
,323
,717
) (
13,1
84,8
57)
(8,
126,
374)
(7,
613,
906)
-
-
-
-
(22
,450
,091
) (
20,7
98,7
63)
Pro
gra
mm
es
Geo
scie
nce
(1,8
25,2
00)
(2,0
13,5
00)
(8,5
62,8
32)
(10,
166,
319)
- -
- -
(10,
388,
032)
(12,
179,
819)
Econ
omic
Dev
elop
men
t (4
98,2
00)
(536
,500
) (5
,760
,632
) (7
,436
,465
) -
- -
- (6
,258
,832
) (7
,972
,965
)Ed
ucat
ion,
Tra
inin
g &
Hum
an D
evel
opm
ent
(1,6
99,2
57)
(2,5
01,4
00)
(5,1
40,9
79)
(5,2
76,4
84)
- -
- -
(6,8
40,2
36)
(7,7
77,8
84)
Fish
erie
s, A
quac
ultu
re &
Mar
ine
Ecos
yste
ms
(2,6
84,4
82)
(2,9
11,1
00)
(10,
994,
033)
(10,
970,
260)
- -
- -
(13,
678,
515)
(13,
881,
360)
Land
Res
ourc
es (1
,647
,200
) (1
,642
,000
) (7
,872
,691
) (7
,512
,178
) -
- -
- (9
,519
,891
) (9
,154
,178
)Pu
blic
Hea
lth (1
,168
,673
) (1
,226
,100
) (7
,305
,529
) (2
2,27
1,05
2) -
- -
- (8
,474
,202
) (2
3,49
7,15
2)St
atis
tics
for D
evel
opm
ent
(1,0
03,0
83)
(1,0
63,1
00)
(3,0
65,2
98)
(2,5
89,1
84)
- -
- -
(4,0
68,3
81)
(3,6
52,2
84)
Tota
l - P
rogr
amm
es (1
0,52
6,09
5) (1
1,89
3,70
0) (4
8,70
1,99
4) (6
6,22
1,94
2) -
- -
- (5
9,22
8,08
9) (7
8,11
5,64
2)O
ther
(2
39)
(946
) -
- -
- (2
,842
,855
) (2
,842
,520
) (2
,843
,094
) (2
,843
,466
)TO
TAL
EXPE
ND
ITU
RE
(24
,850
,051
) (
25,0
79,5
03)
(56
,828
,368
) (
73,8
35,8
48)
-
-
(2,
842,
855)
(2,
842,
520)
(84
,521
,274
) (
101,
757,
871)
Net
sur
plus
/ (d
efici
t) fo
r the
yea
r 1
,515
,880
5
0,31
6 (
2,57
0,34
0) 6
,191
,166
-
-
4
26,2
00
98,
177
(62
8,26
0) 6
,339
,659
Add
brou
ght f
orw
ard
bala
nces
3,6
14,4
97
3,6
95,7
53
49,
544,
502
45,
392,
543
1,0
30,6
43
2,0
64,7
58
448,
054
349
,877
5
4,63
7,69
7 5
1,50
2,93
1 Su
va e
xcha
nge
adju
stm
ent
(219
,177
) (1
31,5
72)
1,7
71,9
12
(2,0
39,2
07)
- (1
5,54
3) -
- 1
,552
,735
(2
,186
,322
)
4,9
11,2
00
3,6
14,4
97
48,
746,
074
49,
544,
502
1,0
30,6
43
2,0
49,2
15
874
,254
4
48,0
54
55,
562,
172
55,
656,
268
Tran
sfer
s (to
) / fr
om:
Min
or w
orks
- -
- -
- -
- -
- -
Plan
t & e
quip
men
t -
- -
- -
- -
- -
- C
onfe
renc
e -
- -
- -
- -
- -
- Ex
chan
ge fl
unct
uatio
n -
- -
- -
- -
- -
- G
ener
al re
serv
e -
- -
- -
- -
- -
- Su
ppor
t to
prog
ram
act
iviti
es -
- -
- (3
06,8
80)
(1,0
18,5
72)
- -
(306
,880
) (1
,018
,572
)C
LO
SIN
G B
AL
AN
CE
S 4
,911
,200
3
,614
,497
4
8,74
6,07
4 4
9,54
4,50
2 7
23,7
63
1,0
30,6
43
874
,254
4
48,0
54
55,
255,
291
54,
637,
696
N
ote
10
Not
e 10
N
ote
15
N
ote
15
Not
e 11
N
ote
11
Not
e 12
N
ote
12
Notes to the financial statements
ANNUAL REPORT 2014 24
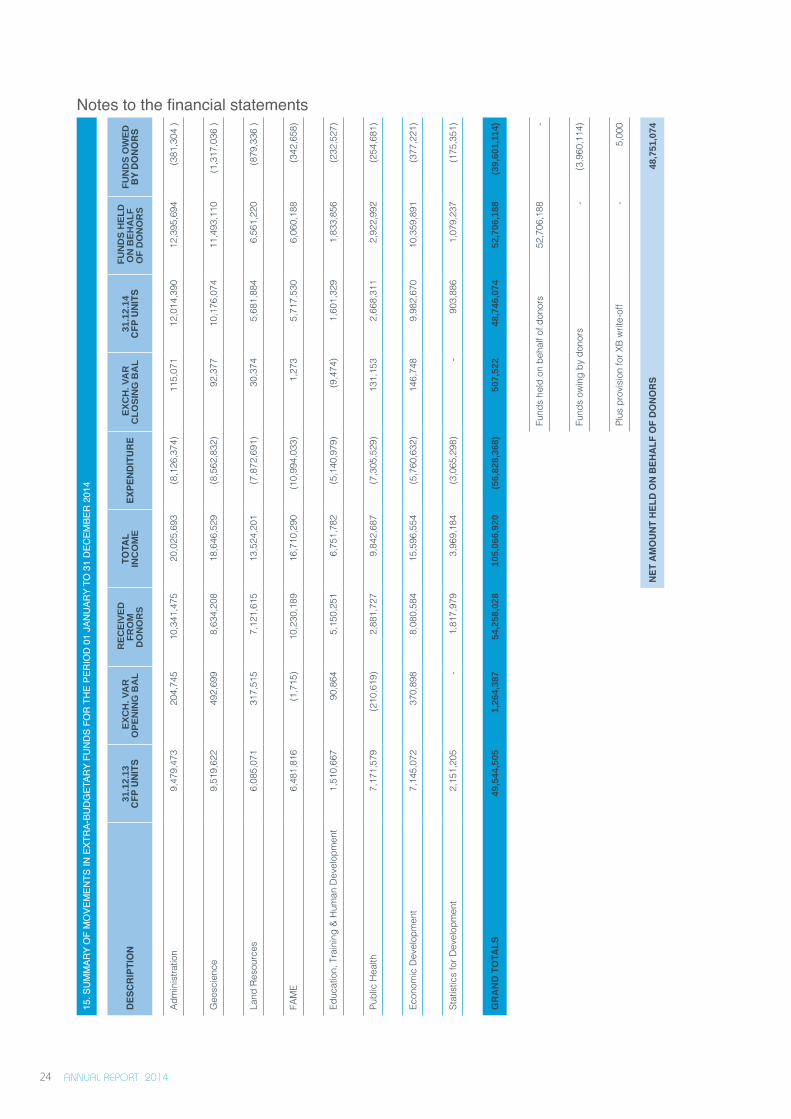
15. S
UM
MAR
Y O
F M
OVE
MEN
TS IN
EXT
RA-
BUD
GET
ARY
FUN
DS
FOR
TH
E PE
RIO
D 0
1 JA
NU
ARY
TO 3
1 D
ECEM
BER
201
4
DES
CR
IPTI
ON
31.1
2.13
CFP
UN
ITS
EX
CH
. VA
R
OP
EN
ING
BA
L
RE
CE
IVE
D
FR
OM
D
ON
OR
S
TOTA
L
INC
OM
EEX
PEN
DIT
UR
E E
XC
H. V
AR
C
LO
SIN
G B
AL
31
.12.
14C
FP U
NIT
S F
UN
DS
HE
LD
O
N B
EH
AL
F
OF
DO
NO
RS
FU
ND
S O
WE
D
BY
DO
NO
RS
Adm
inis
tratio
n 9
,479
,473
20
4,74
510
,341
,475
20,
025,
693
(8,1
26,3
74)
115,
071
12,0
14,3
90 1
2,39
5,69
4 (3
81,3
04 )
Geo
scie
nce
9,5
19,6
22
492,
699
8,63
4,20
8 1
8,64
6,52
9 (8
,562
,832
)92
,377
10,1
76,0
74 1
1,49
3,11
0 (1
,317
,036
)
Land
Res
ourc
es 6
,085
,071
31
7,51
57,
121,
615
13,
524,
201
(7,8
72,6
91)
30,3
745,
681,
884
6,5
61,2
20
(879
,336
)
FAM
E 6
,481
,816
(1
,715
)10
,230
,189
16,
710,
290
(10,
994,
033)
1,27
35,
717,
530
6,0
60,1
88
(342
,658
)
Educ
atio
n, T
rain
ing
& H
uman
Dev
elop
men
t 1
,510
,667
90
,864
5,15
0,25
1 6
,751
,782
(5
,140
,979
)(9
,474
)1,
601,
329
1,8
33,8
56
(232
,527
)
Publ
ic H
ealth
7
,171
,579
(2
10,6
19)
2,88
1,72
7 9
,842
,687
(7
,305
,529
)13
1,15
32,
668,
311
2,9
22,9
92
(254
,681
)
Econ
omic
Dev
elop
men
t 7
,145
,072
37
0,89
88,
080,
584
15,
596,
554
(5,7
60,6
32)
146,
748
9,98
2,67
010
,359
,891
(377
,221
)
Stat
istic
s fo
r Dev
elop
men
t 2
,151
,205
-
1,81
7,97
9 3
,969
,184
(3
,065
,298
)-
903,
886
1,0
79,2
37
(175
,351
)
GR
AN
D T
OTA
LS49
,544
,505
1,26
4,38
754
,258
,028
105,
066,
920
(56,
828,
368)
507,
522
48,7
46,0
7452
,706
,188
(39,
601,
114)
Fund
s he
ld o
n be
half
of d
onor
s52
,706
,188
-
Fund
s ow
ing
by d
onor
s -
(3,9
60,1
14)
Plus
pro
visi
on fo
r XB
writ
e-of
f -
5,00
0
NET
AM
OU
NT
HEL
D O
N B
EHA
LF O
F D
ON
OR
S
48,7
51,0
74
Notes to the financial statements
ANNUAL REPORT 2014 25
PRO
JEC
T C
OD
ED
ESC
RIPT
ION
31.1
2.20
13
EXC
H.
VARI
ATIO
N
OPE
NIN
G B
AL
REC
EIVE
DFR
OM
DO
NO
RS T
OTA
L IN
CO
ME
EXPE
ND
ITU
RE
EXC
H.
VARI
ATIO
N
CLO
SIN
G B
AL 3
1.12
.201
4 F
UN
DS
HEL
D
ON
BEH
ALF
OF
DO
NO
RS
FU
ND
S O
WED
BY
DO
NO
RS
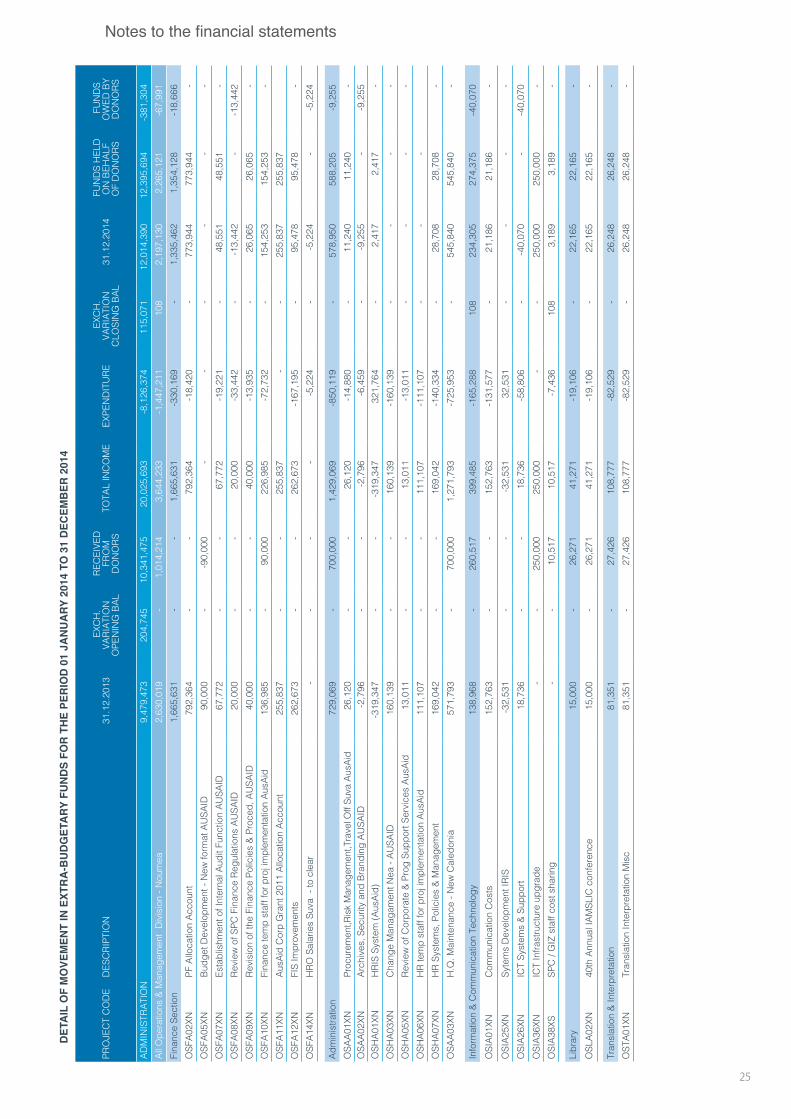
ADM
INIS
TRAT
ION
9,4
79,4
73
204
,745
1
0,34
1,47
5 2
0,02
5,69
3 -8
,126
,374
1
15,0
71
12,
014,
390
12,
395,
694
-381
,304
Al
l Ope
ratio
ns &
Man
agem
ent
Div
isio
n - N
oum
ea 2
,630
,019
-
1,0
14,2
14
3,6
44,2
33
-1,4
47,2
11
108
2
,197
,130
2
,265
,121
-6
7,99
1 Fi
nanc
e Se
ctio
n 1
,665
,631
-
- 1
,665
,631
-3
30,1
69
- 1
,335
,462
1
,354
,128
-1
8,66
6 O
SFA0
2XN
PF A
lloca
tion
Acco
unt
792
,364
-
- 7
92,3
64
-18,
420
- 7
73,9
44
773
,944
-
OSF
A05X
NBu
dget
Dev
elop
men
t - N
ew fo
rmat
AU
SAID
90,
000
- -9
0,00
0 -
- -
- -
- O
SFA0
7XN
Esta
blis
hmen
t of I
nter
nal A
udit
Func
tion
AUSA
ID 6
7,77
2 -
- 6
7,77
2 -1
9,22
1 -
48,
551
48,
551
- O
SFA0
8XN
Revi
ew o
f SPC
Fin
ance
Reg
ulat
ions
AU
SAID
20,
000
- -
20,
000
-33,
442
- -1
3,44
2 -
-13,
442
OSF
A09X
NRe
visi
on o
f the
Fin
ance
Pol
icie
s &
Proc
ed, A
USA
ID 4
0,00
0 -
- 4
0,00
0 -1
3,93
5 -
26,
065
26,
065
- O
SFA1
0XN
Fina
nce
tem
p st
aff f
or p
roj i
mpl
emen
tatio
n Au
sAid
136
,985
-
90,
000
226
,985
-7
2,73
2 -
154
,253
1
54,2
53
- O
SFA1
1XN
AusA
id C
orp
Gra
nt 2
011
Allo
catio
n Ac
coun
t 2
55,8
37
- -
255
,837
-
- 2
55,8
37
255
,837
O
SFA1
2XN
FIS
Impr
ovem
ents
262
,673
-
- 2
62,6
73
-167
,195
-
95,
478
95,
478
- O
SFA1
4XN
HRO
Sal
arie
s Su
va -
to c
lear
- -
- -
-5,2
24
- -5
,224
-
-5,2
24
Adm
inis
tratio
n 7
29,0
69
- 7
00,0
00
1,4
29,0
69
-850
,119
-
578
,950
5
88,2
05
-9,2
55
OSA
A01X
NPr
ocur
emen
t,Risk
Man
agem
ent,T
rave
l Off
Suva
Aus
Aid
26,
120
- -
26,
120
-14,
880
- 1
1,24
0 1
1,24
0 -
OSA
A02X
NAr
chiv
es, S
ecur
ity a
nd B
rand
ing
AUSA
ID-2
,796
-
- -2
,796
-6
,459
-
-9,2
55
- -9
,255
O
SHA0
1XN
HRI
S Sy
stem
(Aus
Aid)
-319
,347
-
- -3
19,3
47
321
,764
-
2,4
17
2,4
17
- O
SHA0
3XN
Cha
nge
Man
agam
ent N
ea -
AUSA
ID 1
60,1
39
- -
160
,139
-1
60,1
39
- -
- -
OSH
A05X
NRe
view
of C
orpo
rate
& P
rog
Supp
ort S
ervi
ces
AusA
id 1
3,01
1 -
- 1
3,01
1 -1
3,01
1 -
- -
- O
SHA0
6XN
HR
tem
p st
aff f
or p
roj i
mpl
emen
tatio
n Au
sAid
111
,107
-
- 1
11,1
07
-111
,107
-
- -
OSH
A07X
NH
R Sy
stem
s, P
olic
ies
& M
anag
emen
t 1
69,0
42
- -
169
,042
-1
40,3
34
- 2
8,70
8 2
8,70
8 -
OSA
A03X
NH
.Q. M
aint
enan
ce -
New
Cal
edon
ia 5
71,7
93
- 7
00,0
00
1,2
71,7
93
-725
,953
-
545
,840
5
45,8
40
-
Info
rmat
ion
& C
omm
unic
atio
n Te
chno
logy
138
,968
-
260
,517
3
99,4
85
-165
,288
1
08
234
,305
2
74,3
75
-40,
070
OSI
A01X
NC
omm
unic
atio
n C
osts
152
,763
-
- 1
52,7
63
-131
,577
-
21,
186
21,
186
- O
SIA2
5XN
Syte
ms
Dev
elop
men
t IRI
S-3
2,53
1 -
- -3
2,53
1 3
2,53
1 -
- -
- O
SIA2
6XN
ICT
Syst
ems
& Su
ppor
t 1
8,73
6 -
- 1
8,73
6 -5
8,80
6 -
-40,
070
- -4
0,07
0 O
SIA3
6XN
ICT
Infra
stru
ctur
e up
grad
e -
- 2
50,0
00
250
,000
-
- 2
50,0
00
250
,000
-
OSI
A38X
SSP
C /
GIZ
sta
ff co
st s
harin
g -
- 1
0,51
7 1
0,51
7 -7
,436
1
08
3,1
89
3,1
89
-
Libr
ary
15,
000
- 2
6,27
1 4
1,27
1 -1
9,10
6 -
22,
165
22,
165
- O
SLA0
2XN
40th
Ann
ual I
AMSL
IC c
onfe
renc
e 1
5,00
0 -
26,
271
41,
271
-19,
106
- 2
2,16
5 2
2,16
5 -
Tran
slat
ion
& In
terp
reta
tion
81,
351
- 2
7,42
6 1
08,7
77
-82,
529
- 2
6,24
8 2
6,24
8 -
OST
A01X
NTr
ansl
atio
n In
terp
reta
tion
Mis
c 8
1,35
1 -
27,
426
108
,777
-8
2,52
9 -
26,
248
26,
248
-
Notes to the financial statements
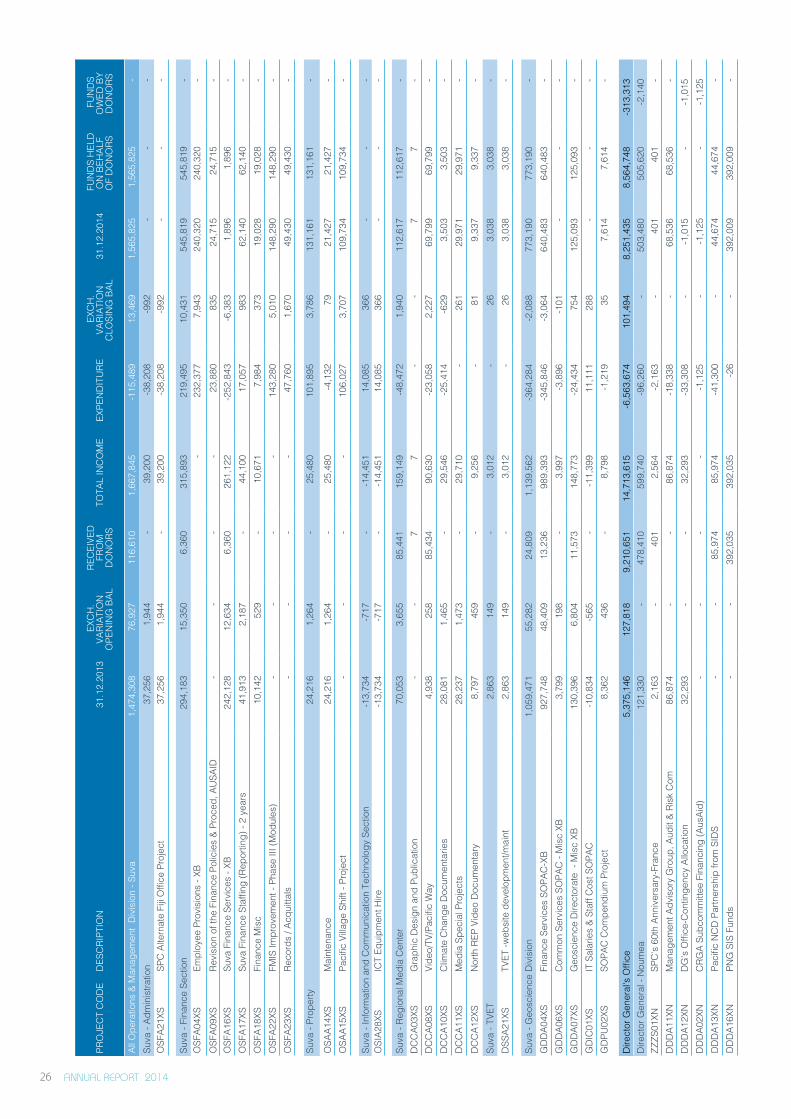
1.
DET
AIL
OF
MO
VEM
ENT
IN E
XTR
A-B
UD
GET
ARY
FU
ND
S FO
R T
HE
PER
IOD
01
JAN
UA
RY 2
014
TO 3
1 D
ECEM
BER
201
4
ANNUAL REPORT 2014 26
PRO
JEC
T C
OD
ED
ESC
RIPT
ION
31.
12.2
013
EXC
H.
VARI
ATIO
N
OPE
NIN
G B
AL
REC
EIVE
DFR
OM
DO
NO
RS T
OTA
L IN
CO
ME
EXPE
ND
ITU
RE
EXC
H.
VARI
ATIO
N
CLO
SIN
G B
AL 3
1.12
.201
4 F
UN
DS
HEL
D
ON
BEH
ALF
OF
DO
NO
RS
FU
ND
S O
WED
BY
DO
NO
RS
All O
pera
tions
& M
anag
emen
t D
ivis
ion
- Suv
a 1
,474
,308
7
6,92
7 1
16,6
10
1,6
67,8
45
-115
,489
1
3,46
9 1
,565
,825
1
,565
,825
-
Suva
- Ad
min
istra
tion
37,
256
1,9
44
- 3
9,20
0 -3
8,20
8 -9
92
- -
- O
SFA2
1XS
SPC
Alte
rnat
e Fi
ji O
ffice
Pro
ject
37,
256
1,9
44
- 3
9,20
0 -3
8,20
8 -9
92
- -
-
Suva
- Fi
nanc
e Se
ctio
n 2
94,1
83
15,
350
6,3
60
315
,893
2
19,4
95
10,
431
545
,819
5
45,8
19
- O
SFA0
4XS
Empl
oyee
Pro
visi
ons
- XB
- 2
32,3
77
7,9
43
240
,320
2
40,3
20
- O
SFA0
9XS
Revi
sion
of t
he F
inan
ce P
olic
ies
& Pr
oced
, AU
SAID
- -
- -
23,
880
835
2
4,71
5 2
4,71
5 -
OSF
A16X
SSu
va F
inan
ce S
ervi
ces
- XB
242
,128
1
2,63
4 6
,360
2
61,1
22
-252
,843
-6
,383
1
,896
1
,896
-
OSF
A17X
SSu
va F
inan
ce S
taffi
ng (R
epor
ting)
- 2
year
s 4
1,91
3 2
,187
-
44,
100
17,
057
983
6
2,14
0 6
2,14
0 -
OSF
A18X
SFi
nanc
e M
isc
10,
142
529
-
10,
671
7,9
84
373
1
9,02
8 1
9,02
8 -
OSF
A22X
SFM
IS Im
prov
emen
t - P
hase
III (
Mod
ules
) -
- -
- 1
43,2
80
5,0
10
148
,290
1
48,2
90
- O
SFA2
3XS
Reco
rds
/ Acq
uitta
ls -
- -
- 4
7,76
0 1
,670
4
9,43
0 4
9,43
0 -
Suva
- Pr
oper
ty 2
4,21
6 1
,264
-
25,
480
101
,895
3
,786
1
31,1
61
131
,161
-
OSA
A14X
SM
aint
enan
ce 2
4,21
6 1
,264
-
25,
480
-4,1
32
79
21,
427
21,
427
- O
SAA1
5XS
Paci
fic V
illage
Shi
ft - P
roje
ct -
- -
- 1
06,0
27
3,7
07
109
,734
1
09,7
34
-
Suva
- In
form
atio
n an
d C
omm
unic
atio
n Te
chno
logy
Sec
tion
-13,
734
-717
-
-14,
451
14,
085
366
-
- -
OSI
A28X
SIC
T Eq
uipm
ent H
ire-1
3,73
4 -7
17
- -1
4,45
1 1
4,08
5 3
66
- -
-
Suva
- Re
gion
al M
edia
Cen
ter
70,
053
3,6
55
85,
441
159
,149
-4
8,47
2 1
,940
1
12,6
17
112
,617
-
DC
CA0
3XS
Gra
phic
Des
ign
and
Publ
icat
ion
- -
7
7
- -
7
7
- D
CC
A08X
SVi
deo/
TV/P
acifi
c W
ay 4
,938
2
58
85,
434
90,
630
-23,
058
2,2
27
69,
799
69,
799
- D
CC
A10X
SC
limat
e C
hang
e D
ocum
enta
ries
28,
081
1,4
65
- 2
9,54
6 -2
5,41
4 -6
29
3,5
03
3,5
03
- D
CC
A11X
SM
edia
Spe
cial
Pro
ject
s 2
8,23
7 1
,473
-
29,
710
- 2
61
29,
971
29,
971
- D
CC
A12X
SN
orth
REP
Vid
eo D
ocum
enta
ry 8
,797
45
9 -
9,25
6 -
81
9,3
37
9,3
37
- Su
va -
TVET
2,8
63
149
-
3,0
12
- 2
6 3
,038
3
,038
-
DSS
A21X
STV
ET -w
ebsi
te d
evel
opm
ent/m
aint
2,8
63
149
-
3,0
12
- 2
6 3
,038
3
,038
-
Suva
- G
eosc
ienc
e D
ivis
ion
1,0
59,4
71
55,
282
24,
809
1,1
39,5
62
-364
,284
-2
,088
7
73,1
90
773
,190
-
GD
DA0
4XS
Fina
nce
Serv
ices
SO
PAC
-XB
927
,748
4
8,40
9 1
3,23
6 9
89,3
93
-345
,846
-3
,064
6
40,4
83
640
,483
-
GD
DA0
6XS
Com
mon
Ser
vice
s SO
PAC
- M
isc
XB 3
,799
1
98
- 3
,997
-3
,896
-1
01
- -
- G
DD
A07X
SG
eosc
ienc
e D
irect
orat
e -
Mis
c XB
130
,396
6
,804
1
1,57
3 1
48,7
73
-24,
434
754
1
25,0
93
125
,093
-
GD
IC01
XSIT
Sal
arie
s &
Staf
f Cos
t SO
PAC
-10,
834
-565
-
-11,
399
11,
111
288
-
- -
GD
PU02
XSSO
PAC
Com
pend
ium
Pro
ject
8,3
62
436
-
8,7
98
-1,2
19
35
7,6
14
7,6
14
-
Dire
ctor
Gen
eral
's O
ffice
5,3
75,1
46
127
,818
9
,210
,651
1
4,71
3,61
5 -6
,563
,674
1
01,4
94
8,2
51,4
35
8,5
64,7
48
-313
,313
D
irect
or G
ener
al -
Nou
mea
121
,330
-
478
,410
5
99,7
40
-96,
260
- 5
03,4
80
505
,620
-2
,140
ZZ
ZS01
XNSP
C's
60t
h An
nive
rsar
y-Fr
ance
2,1
63
- 4
01
2,5
64
-2,1
63
- 4
01
401
-
DD
DA1
1XN
Man
agem
ent A
dvis
ory
Gro
up, A
udit
& Ri
sk C
om 8
6,87
4 -
- 8
6,87
4 -1
8,33
8 -
68,
536
68,
536
- D
DD
A12X
ND
G's
Offi
ce-C
ontin
genc
y Al
loca
tion
32,
293
- -
32,
293
-33,
308
- -1
,015
-
-1,0
15
DD
DA0
2XN
CRG
A Su
bcom
mitt
ee F
inan
cing
(Aus
Aid)
- -
- -
-1,1
25
- -1
,125
-
-1,1
25
DD
DA1
3XN
Paci
fic N
CD
Par
tner
ship
from
SID
S -
- 8
5,97
4 8
5,97
4 -4
1,30
0 -
44,
674
44,
674
- D
DD
A16X
NPN
G S
IS F
unds
- -
392
,035
3
92,0
35
-26
- 3
92,0
09
392
,009
-
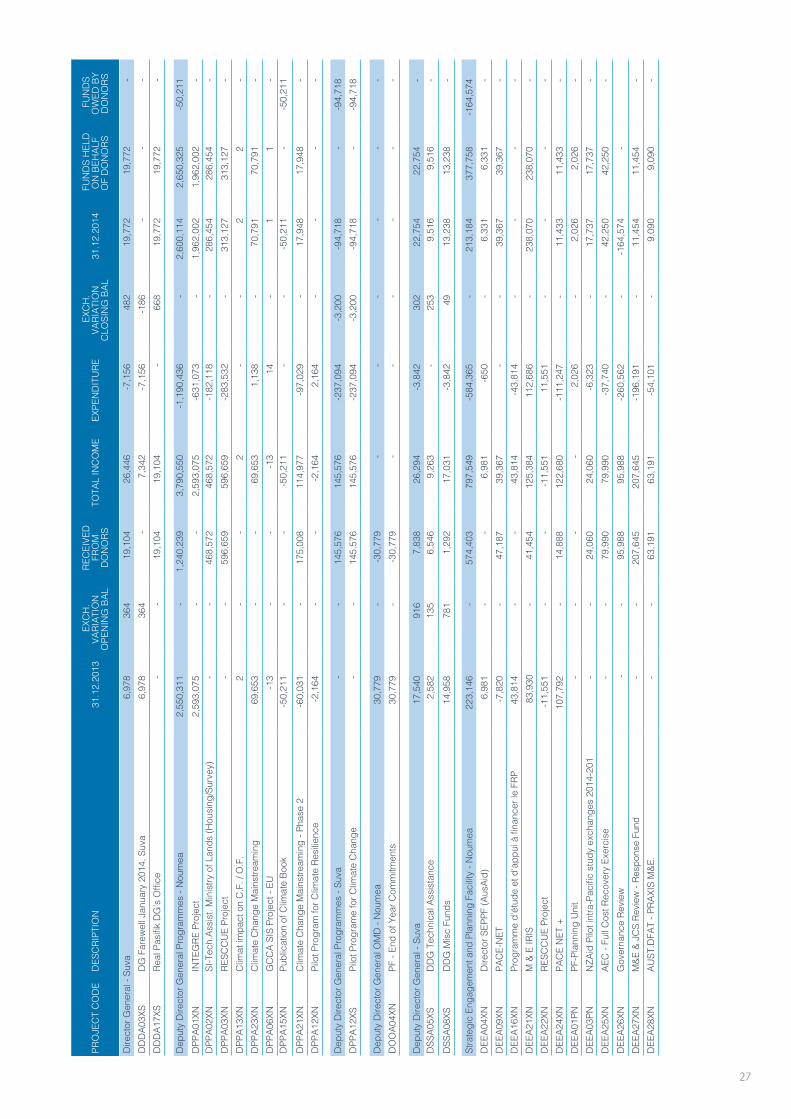
ANNUAL REPORT 2014 27
PRO
JEC
T C
OD
ED
ESC
RIPT
ION
31.
12.2
013
EXC
H.
VARI
ATIO
N
OPE
NIN
G B
AL
REC
EIVE
DFR
OM
DO
NO
RS T
OTA
L IN
CO
ME
EXPE
ND
ITU
RE
EXC
H.
VARI
ATIO
N
CLO
SIN
G B
AL 3
1.12
.201
4 F
UN
DS
HEL
D
ON
BEH
ALF
OF
DO
NO
RS
FU
ND
S O
WED
BY
DO
NO
RS
Dire
ctor
Gen
eral
- Su
va 6
,978
3
64
19,
104
26,
446
-7,1
56
482
1
9,77
2 1
9,77
2 -
DD
DA0
3XS
DG
Far
ewel
l Jan
uary
201
4, S
uva
6,9
78
364
-
7,3
42
-7,1
56
-186
-
- -
DD
DA1
7XS
Real
Pas
ifik
DG
’s O
ffice
- -
19,
104
19,
104
- 6
68
19,
772
19,
772
-
Dep
uty
Dire
ctor
Gen
eral
Pro
gram
mes
- N
oum
ea 2
,550
,311
-
1,2
40,2
39
3,7
90,5
50
-1,1
90,4
36
- 2
,600
,114
2
,650
,325
-5
0,21
1 D
PPA0
1XN
INTE
GRE
Pro
ject
2,5
93,0
75
- -
2,5
93,0
75
-631
,073
-
1,9
62,0
02
1,9
62,0
02
- D
PPA0
2XN
SI-T
ech.
Assi
st. M
inis
try o
f Lan
ds (H
ousi
ng/S
urve
y) -
- 4
68,5
72
468
,572
-1
82,1
18
- 2
86,4
54
286
,454
-
DPP
A03X
NRE
SCC
UE
Proj
ect
- -
596
,659
5
96,6
59
-283
,532
-
313
,127
3
13,1
27
- D
PPA1
3XN
Clim
at im
pact
on
C.F
. / O
.F.
2
- -
2
- -
2
2
- D
PPA2
3XN
Clim
ate
Cha
nge
Mai
nstre
amin
g 6
9,65
3 -
- 6
9,65
3 1
,138
-
70,
791
70,
791
- D
PPA0
6XN
GC
CA
SIS
Proj
ect -
EU
-13
- -
-13
14
- 1
1
-
DPP
A15X
NPu
blic
atio
n of
Clim
ate
Book
-50,
211
- -
-50,
211
- -
-50,
211
- -5
0,21
1 D
PPA2
1XN
Clim
ate
Cha
nge
Mai
nstre
amin
g - P
hase
2-6
0,03
1 -
175
,008
1
14,9
77
-97,
029
- 1
7,94
8 1
7,94
8 -
DPP
A12X
NPi
lot P
rogr
am fo
r Clim
ate
Resi
lienc
e-2
,164
-
- -2
,164
2
,164
-
- -
-
Dep
uty
Dire
ctor
Gen
eral
Pro
gram
mes
- Su
va -
- 1
45,5
76
145
,576
-2
37,0
94
-3,2
00
-94,
718
- -9
4,71
8 D
PPA1
2XS
Pilo
t Pro
gram
e fo
r Clim
ate
Cha
nge
- -
145
,576
1
45,5
76
-237
,094
-3
,200
-9
4,71
8 -
-94,
718
Dep
uty
Dire
ctor
Gen
eral
OM
D -
Nou
mea
30,
779
- -3
0,77
9 -
- -
- -
- D
OO
A04X
NPF
- En
d of
Yea
r Com
mitm
ents
30,
779
- -3
0,77
9 -
- -
- -
-
Dep
uty
Dire
ctor
Gen
eral
- Su
va 1
7,54
0 9
16
7,8
38
26,
294
-3,8
42
302
2
2,75
4 2
2,75
4 -
DSS
A05X
SD
DG
Tec
hnic
al A
ssis
tanc
e 2
,582
1
35
6,5
46
9,2
63
- 2
53
9,5
16
9,5
16
- D
SSA0
8XS
DD
G M
isc
Fund
s 1
4,95
8 7
81
1,2
92
17,
031
-3,8
42
49
13,
238
13,
238
-
Stra
tegi
c En
gage
men
t and
Pla
nnin
g Fa
cilit
y - N
oum
ea 2
23,1
46
- 5
74,4
03
797
,549
-5
84,3
65
- 2
13,1
84
377
,758
-1
64,5
74
DEE
A04X
ND
irect
or S
EPPF
(Aus
Aid)
6,9
81
- -
6,9
81
-650
-
6,3
31
6,3
31
- D
EEA0
9XN
PAC
E-N
ET-7
,820
-
47,
187
39,
367
- -
39,
367
39,
367
- D
EEA1
6XN
Prog
ram
me
d'ét
ude
et d
'app
ui à
fina
ncer
le F
RP 4
3,81
4 -
- 4
3,81
4 -4
3,81
4 -
- -
- D
EEA2
1XN
M &
E IR
IS 8
3,93
0 -
41,
454
125
,384
1
12,6
86
- 2
38,0
70
238
,070
-
DEE
A22X
NRE
SCC
UE
Proj
ect
-11,
551
- -
-11,
551
11,
551
- -
- -
DEE
A24X
NPA
CE
NET
+ 1
07,7
92
- 1
4,88
8 1
22,6
80
-111
,247
-
11,
433
11,
433
- D
EEA0
1PN
PF-P
lann
ing
Uni
t -
- -
- 2
,026
-
2,0
26
2,0
26
- D
EEA0
3PN
NZA
id P
ilot i
ntra
-Pac
ific
stud
y ex
chan
ges
2014
-201
- -
24,
060
24,
060
-6,3
23
- 1
7,73
7 1
7,73
7 -
DEE
A25X
NAE
C -
Full
Cos
t Rec
over
y Ex
erci
se -
- 7
9,99
0 7
9,99
0 -3
7,74
0 -
42,
250
42,
250
- D
EEA2
6XN
Gov
erna
nce
Revi
ew -
- 9
5,98
8 9
5,98
8 -2
60,5
62
- -1
64,5
74
- D
EEA2
7XN
M&E
& J
CS
Revi
ew -
Resp
onse
Fun
d -
- 2
07,6
45
207
,645
-1
96,1
91
- 1
1,45
4 1
1,45
4 -
DEE
A28X
NAU
ST.D
FAT
- PRA
XIS
M&E
. -
- 6
3,19
1 6
3,19
1 -5
4,10
1 -
9,0
90
9,0
90
-
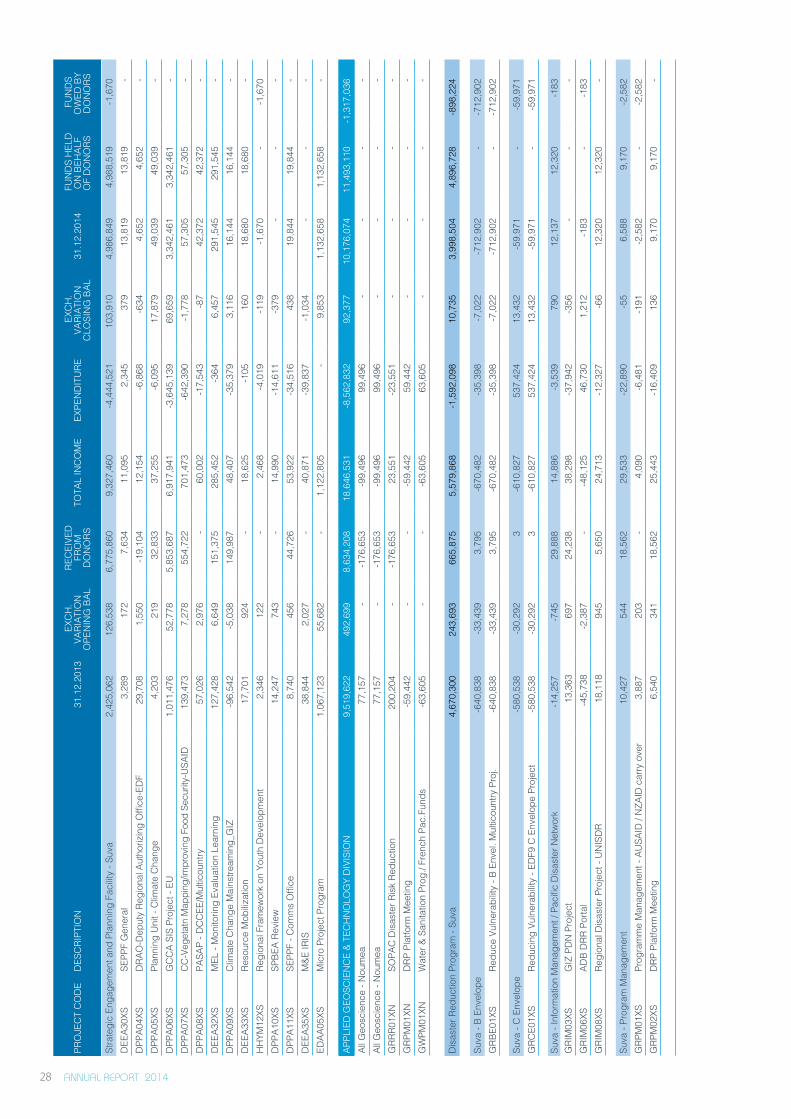
ANNUAL REPORT 2014 28
PRO
JEC
T C
OD
ED
ESC
RIPT
ION
31.
12.2
013
EXC
H.
VARI
ATIO
N
OPE
NIN
G B
AL
REC
EIVE
DFR
OM
DO
NO
RS T
OTA
L IN
CO
ME
EXPE
ND
ITU
RE
EXC
H.
VARI
ATIO
N
CLO
SIN
G B
AL 3
1.12
.201
4 F
UN
DS
HEL
D
ON
BEH
ALF
OF
DO
NO
RS
FU
ND
S O
WED
BY
DO
NO
RS
Stra
tegi
c En
gage
men
t and
Pla
nnin
g Fa
cilit
y - S
uva
2,4
25,0
62
126
,538
6
,775
,860
9
,327
,460
-4
,444
,521
1
03,9
10
4,9
86,8
49
4,9
88,5
19
-1,6
70
DEE
A30X
SSE
PPF
Gen
eral
3,2
89
172
7
,634
1
1,09
5 2
,345
3
79
13,
819
13,
819
- D
PPA0
4XS
DRA
O-D
eput
y Re
gion
al A
utho
rizin
g O
ffice
-ED
F 2
9,70
8 1
,550
-1
9,10
4 1
2,15
4 -6
,868
-6
34
4,6
52
4,6
52
- D
PPA0
5XS
Plan
ning
Uni
t - C
limat
e C
hang
e 4
,203
2
19
32,
833
37,
255
-6,0
95
17,
879
49,
039
49,
039
- D
PPA0
6XS
GC
CA
SIS
Proj
ect -
EU
1,0
11,4
76
52,
778
5,8
53,6
87
6,9
17,9
41
-3,6
45,1
39
69,
659
3,3
42,4
61
3,3
42,4
61
- D
PPA0
7XS
CC-V
eget
atn
Map
ping
/impr
ovin
g Fo
od S
ecur
ity-U
SAID
139
,473
7
,278
5
54,7
22
701
,473
-6
42,3
90
-1,7
78
57,
305
57,
305
- D
PPA0
8XS
PASA
P - D
CC
EE/M
ultic
ount
ry 5
7,02
6 2
,976
-
60,
002
-17,
543
-87
42,
372
42,
372
- D
EEA3
2XS
MEL
- M
onito
ring
Eval
uatio
n Le
arni
ng 1
27,4
28
6,6
49
151
,375
2
85,4
52
-364
6
,457
2
91,5
45
291
,545
-
DPP
A09X
SC
limat
e C
hang
e M
ains
tream
ing_
GIZ
-96,
542
-5,0
38
149
,987
4
8,40
7 -3
5,37
9 3
,116
1
6,14
4 1
6,14
4 -
DEE
A33X
SRe
sour
ce M
obiliz
atio
n 1
7,70
1 9
24
- 1
8,62
5 -1
05
160
1
8,68
0 1
8,68
0 -
HH
YM12
XSRe
gion
al F
ram
ewor
k on
You
th D
evel
opm
ent
2,3
46
122
-
2,4
68
-4,0
19
-119
-1
,670
-
-1,6
70
DPP
A10X
SSP
BEA
Revi
ew 1
4,24
7 7
43
- 1
4,99
0 -1
4,61
1 -3
79
- -
- D
PPA1
1XS
SEPP
F - C
omm
s O
ffice
8,7
40
456
4
4,72
6 5
3,92
2 -3
4,51
6 4
38
19,
844
19,
844
- D
EEA3
5XS
M&E
IRIS
38,
844
2,0
27
- 4
0,87
1 -3
9,83
7 -1
,034
-
- -
EDAA
05XS
Mic
ro P
roje
ct P
rogr
am 1
,067
,123
5
5,68
2 -
1,1
22,8
05
- 9
,853
1
,132
,658
1
,132
,658
-
APPL
IED
GEO
SCIE
NC
E &
TEC
HN
OLO
GY
DIV
ISIO
N 9
,519
,622
4
92,6
99
8,6
34,2
08
18,
646,
531
-8,5
62,8
32
92,
377
10,
176,
074
11,
493,
110
-1,3
17,0
36
All G
eosc
ienc
e - N
oum
ea 7
7,15
7 -
-176
,653
-9
9,49
6 9
9,49
6 -
- -
- Al
l Geo
scie
nce
- Nou
mea
77,
157
- -1
76,6
53
-99,
496
99,
496
- -
- -
GRR
R01X
NSO
PAC
Dis
aste
r Ris
k Re
duct
ion
200
,204
-
-176
,653
2
3,55
1 -2
3,55
1 -
- -
- G
RPM
01XN
DRP
Pla
tform
Mee
ting
-59,
442
- -
-59,
442
59,
442
- -
- -
GW
PM01
XNW
ater
& S
anita
tion
Prog
./ Fr
ench
Pac
.Fun
ds-6
3,60
5 -
- -6
3,60
5 6
3,60
5 -
- -
-
Dis
aste
r Red
uctio
n Pr
ogra
m -
Suva
4,6
70,3
00
243
,693
6
65,8
75
5,5
79,8
68
-1,5
92,0
98
10,
735
3,9
98,5
04
4,8
96,7
28
-898
,224
Suva
- B
Enve
lope
-640
,838
-3
3,43
9 3
,795
-6
70,4
82
-35,
398
-7,0
22
-712
,902
-
-712
,902
G
RBE0
1XS
Redu
ce V
ulne
rabi
lity
- B E
nvel
. Mul
ticou
ntry
Pro
j.-6
40,8
38
-33,
439
3,7
95
-670
,482
-3
5,39
8 -7
,022
-7
12,9
02
- -7
12,9
02
Suva
- C
Env
elop
e-5
80,5
38
-30,
292
3
-610
,827
5
37,4
24
13,
432
-59,
971
- -5
9,97
1 G
RCE0
1XS
Redu
cing
Vul
nera
bilit
y - E
DF9
C E
nvel
ope
Proj
ect
-580
,538
-3
0,29
2 3
-6
10,8
27
537
,424
1
3,43
2 -5
9,97
1 -
-59,
971
Suva
- In
form
atio
n M
anag
emen
t / P
acifi
c D
isas
ter N
etw
ork
-14,
257
-745
2
9,88
8 1
4,88
6 -3
,539
7
90
12,
137
12,
320
-183
G
RIM
03XS
GIZ
PD
N P
roje
ct 1
3,36
3 6
97
24,
238
38,
298
-37,
942
-356
-
- -
GRI
M06
XSAD
B D
RR P
orta
l-4
5,73
8 -2
,387
-
-48,
125
46,
730
1,2
12
-183
-
-183
G
RIM
08XS
Regi
onal
Dis
aste
r Pro
ject
- U
NIS
DR
18,
118
945
5
,650
2
4,71
3 -1
2,32
7 -6
6 1
2,32
0 1
2,32
0 -
Suva
- Pr
ogra
m M
anag
emen
t 1
0,42
7 5
44
18,
562
29,
533
-22,
890
-55
6,5
88
9,1
70
-2,5
82
GRP
M01
XSPr
ogra
mm
e M
anag
emen
t - A
USA
ID /
NZA
ID c
arry
ove
r 3
,887
2
03
- 4
,090
-6
,481
-1
91
-2,5
82
- -2
,582
G
RPM
02XS
DRP
Pla
tform
Mee
ting
6,5
40
341
1
8,56
2 2
5,44
3 -1
6,40
9 1
36
9,1
70
9,1
70
-
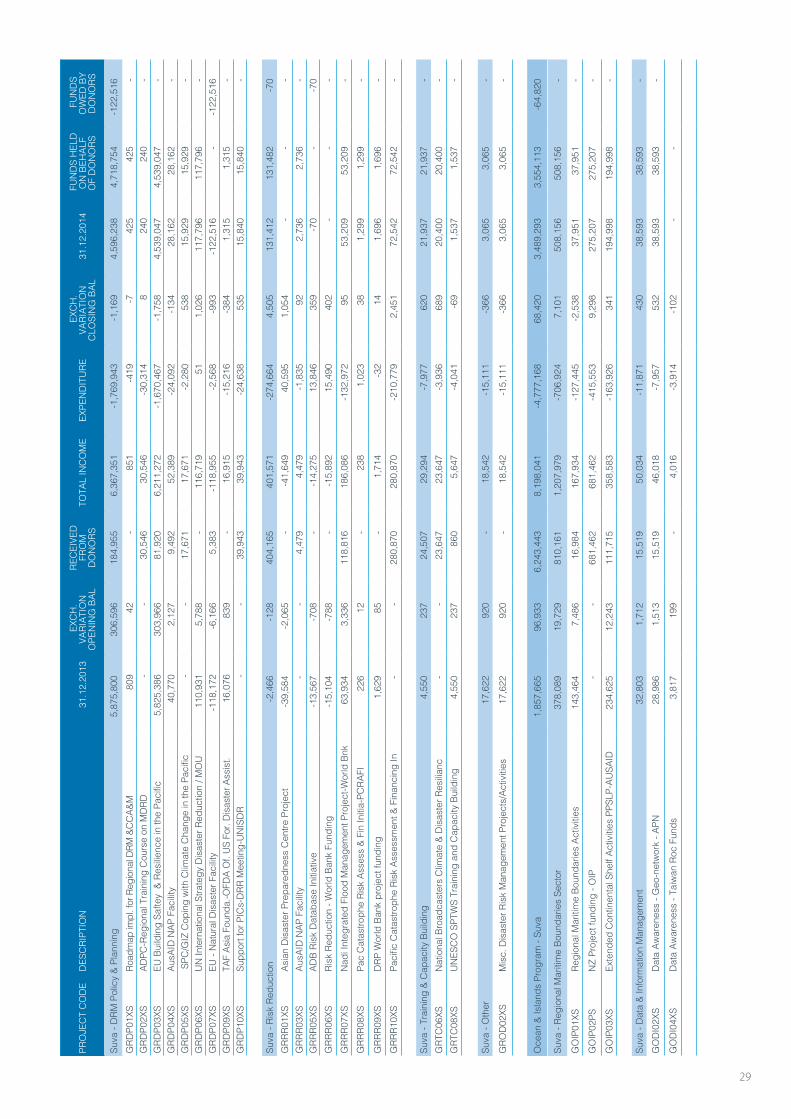
ANNUAL REPORT 2014 29
PRO
JEC
T C
OD
ED
ESC
RIPT
ION
31.
12.2
013
EXC
H.
VARI
ATIO
N
OPE
NIN
G B
AL
REC
EIVE
DFR
OM
DO
NO
RS T
OTA
L IN
CO
ME
EXPE
ND
ITU
RE
EXC
H.
VARI
ATIO
N
CLO
SIN
G B
AL 3
1.12
.201
4 F
UN
DS
HEL
D
ON
BEH
ALF
OF
DO
NO
RS
FU
ND
S O
WED
BY
DO
NO
RS
Suva
- D
RM P
olic
y &
Plan
ning
5,8
75,8
00
306
,596
1
84,9
55
6,3
67,3
51
-1,7
69,9
43
-1,1
69
4,5
96,2
38
4,7
18,7
54
-122
,516
G
RDP0
1XS
Road
map
impl
. for
Reg
iona
l DRM
&C
CA&
M 8
09
42
- 8
51
-419
-7
4
25
425
-
GRD
P02X
SAD
PC-R
egio
nal T
rain
ing
Cou
rse
on M
DRD
- -
30,
546
30,
546
-30,
314
8
240
2
40
- G
RDP0
3XS
EU B
uild
ing
Safte
y &
Res
ilienc
e in
the
Paci
fic 5
,825
,386
3
03,9
66
81,
920
6,2
11,2
72
-1,6
70,4
67
-1,7
58
4,5
39,0
47
4,5
39,0
47
- G
RDP0
4XS
AusA
ID N
AP F
acilit
y 4
0,77
0 2
,127
9
,492
5
2,38
9 -2
4,09
2 -1
34
28,
162
28,
162
- G
RDP0
5XS
SPC
/GIZ
Cop
ing
with
Clim
ate
Cha
nge
in th
e Pa
cific
- -
17,
671
17,
671
-2,2
80
538
1
5,92
9 1
5,92
9 -
GRD
P06X
SU
N In
tern
atio
nal S
trate
gy D
isas
ter R
educ
tion
/ MO
U 1
10,9
31
5,7
88
- 1
16,7
19
51
1,0
26
117
,796
1
17,7
96
- G
RDP0
7XS
EU -
Nat
ural
Dis
aste
r Fac
ility
-118
,172
-6
,166
5
,383
-1
18,9
55
-2,5
68
-993
-1
22,5
16
- -1
22,5
16
GRD
P09X
STA
F As
ia F
ound
a.-O
FDA
Of.
US F
or. D
isast
er A
ssis
t. 1
6,07
6 8
39
- 1
6,91
5 -1
5,21
6 -3
84
1,3
15
1,3
15
- G
RDP1
0XS
Supp
ort f
or P
ICs-
DRR
Mee
ting-
UN
ISD
R -
- 3
9,94
3 3
9,94
3 -2
4,63
8 5
35
15,
840
15,
840
-
Suva
- Ri
sk R
educ
tion
-2,4
66
-128
4
04,1
65
401
,571
-2
74,6
64
4,5
05
131
,412
1
31,4
82
-70
GRR
R01X
SAs
ian
Dis
aste
r Pre
pare
dnes
s C
entre
Pro
ject
-39,
584
-2,0
65
- -4
1,64
9 4
0,59
5 1
,054
-
- -
GRR
R03X
SAu
sAID
NAP
Fac
ility
- -
4,4
79
4,4
79
-1,8
35
92
2,7
36
2,7
36
- G
RRR0
5XS
ADB
Risk
Dat
abas
e In
itiat
ive
-13,
567
-708
-
-14,
275
13,
846
359
-7
0 -
-70
GRR
R06X
SRi
sk R
educ
tion
- Wor
ld B
ank
Fund
ing
-15,
104
-788
-
-15,
892
15,
490
402
-
- -
GRR
R07X
SN
adi I
nteg
rate
d Fl
ood
Man
agem
ent P
roje
ct-W
orld
Bnk
63,
934
3,3
36
118
,816
1
86,0
86
-132
,972
9
5 5
3,20
9 5
3,20
9 -
GRR
R08X
SPa
c C
atas
troph
e Ri
sk A
sses
s &
Fin
Initi
a-PC
RAFI
226
1
2 -
238
1
,023
3
8 1
,299
1
,299
-
GRR
R09X
SD
RP W
orld
Ban
k pr
ojec
t fun
ding
1,6
29
85
- 1
,714
-3
2 1
4 1
,696
1
,696
-
GRR
R10X
SPa
cific
Cat
astro
phe
Risk
Ass
essm
ent &
Fin
anci
ng In
- -
280
,870
2
80,8
70
-210
,779
2
,451
7
2,54
2 7
2,54
2 -
Suva
- Tr
aini
ng &
Cap
acity
Bui
ldin
g 4
,550
2
37
24,
507
29,
294
-7,9
77
620
2
1,93
7 2
1,93
7 -
GRT
C06
XSN
atio
nal B
road
cast
ers
Clim
ate
& D
isas
ter R
esilia
nc -
- 2
3,64
7 2
3,64
7 -3
,936
6
89
20,
400
20,
400
- G
RTC
08XS
UN
ESC
O S
PTW
S Tr
aini
ng a
nd C
apac
ity B
uild
ing
4,5
50
237
8
60
5,6
47
-4,0
41
-69
1,5
37
1,5
37
-
Suva
- O
ther
17,
622
920
-
18,
542
-15,
111
-366
3
,065
3
,065
-
GRO
D02
XSM
isc.
Dis
aste
r Ris
k M
anag
emen
t Pro
ject
s/Ac
tiviti
es 1
7,62
2 9
20
- 1
8,54
2 -1
5,11
1 -3
66
3,0
65
3,0
65
-
Oce
an &
Isla
nds
Prog
ram
- Su
va 1
,857
,665
9
6,93
3 6
,243
,443
8
,198
,041
-4
,777
,168
6
8,42
0 3
,489
,293
3
,554
,113
-6
4,82
0
Suva
- Re
gion
al M
ariti
me
Boun
darie
s Se
ctor
378
,089
1
9,72
9 8
10,1
61
1,2
07,9
79
-706
,924
7
,101
5
08,1
56
508
,156
-
GO
IP01
XSRe
gion
al M
ariti
me
Boun
darie
s Ac
tiviti
es 1
43,4
64
7,4
86
16,
984
167
,934
-1
27,4
45
-2,5
38
37,
951
37,
951
-
GO
IP02
PSN
Z Pr
ojec
t fun
ding
- O
IP -
- 6
81,4
62
681
,462
-4
15,5
53
9,2
98
275
,207
2
75,2
07
-
GO
IP03
XSEx
tend
ed C
ontin
enta
l She
lf Ac
tiviti
es P
PSLP
-AU
SAID
234
,625
1
2,24
3 1
11,7
15
358
,583
-1
63,9
26
341
1
94,9
98
194
,998
-
Suva
- D
ata
& In
form
atio
n M
anag
emen
t 3
2,80
3 1
,712
1
5,51
9 5
0,03
4 -1
1,87
1 4
30
38,
593
38,
593
- G
OD
I02X
SD
ata
Awar
enes
s - G
eo-n
etw
ork
- APN
28,
986
1,5
13
15,
519
46,
018
-7,9
57
532
3
8,59
3 3
8,59
3 -
GO
DI0
4XS
Dat
a Aw
aren
ess
- Tai
wan
Roc
Fun
ds 3
,817
1
99
- 4
,016
-3
,914
-1
02
- -
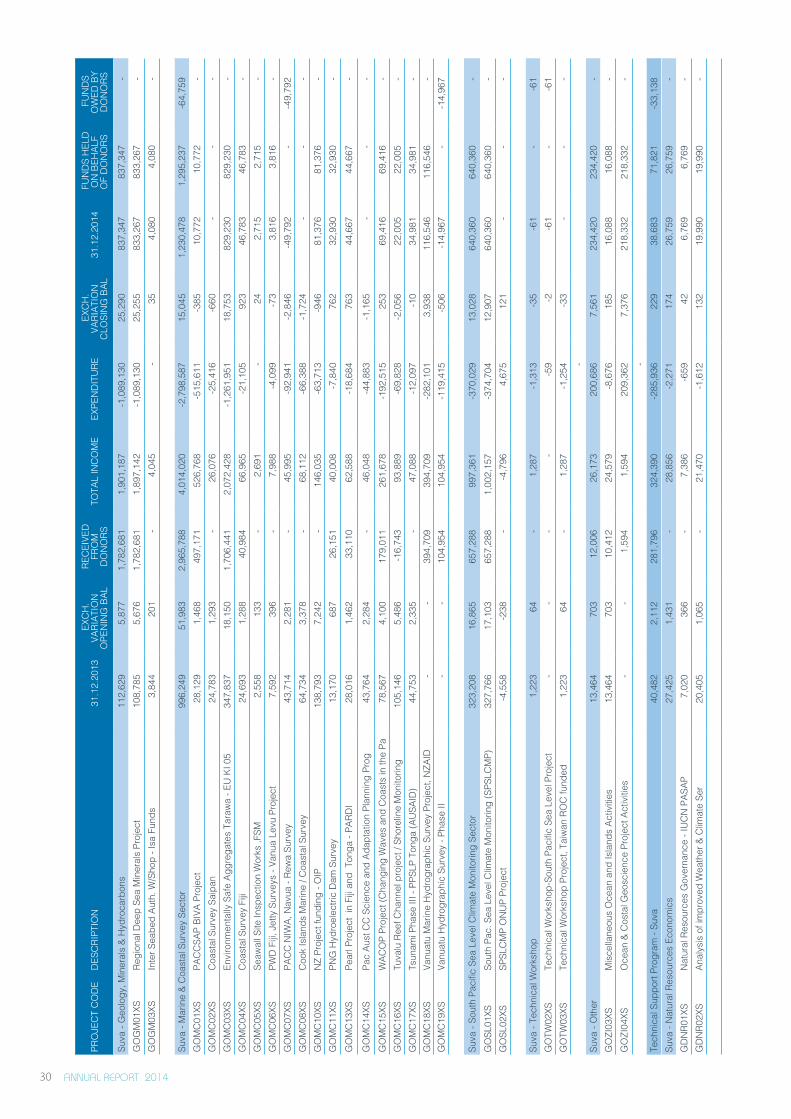
ANNUAL REPORT 2014 30
PRO
JEC
T C
OD
ED
ESC
RIPT
ION
31.
12.2
013
EXC
H.
VARI
ATIO
N
OPE
NIN
G B
AL
REC
EIVE
DFR
OM
DO
NO
RS T
OTA
L IN
CO
ME
EXPE
ND
ITU
RE
EXC
H.
VARI
ATIO
N
CLO
SIN
G B
AL 3
1.12
.201
4 F
UN
DS
HEL
D
ON
BEH
ALF
OF
DO
NO
RS
FU
ND
S O
WED
BY
DO
NO
RS
Suva
- G
eolo
gy, M
iner
als
& H
ydro
carb
ons
112
,629
5
,877
1
,782
,681
1
,901
,187
-1
,089
,130
2
5,29
0 8
37,3
47
837
,347
-
GO
GM
01XS
Regi
onal
Dee
p Se
a M
iner
als
Proj
ect
108
,785
5
,676
1
,782
,681
1
,897
,142
-1
,089
,130
2
5,25
5 8
33,2
67
833
,267
-
GO
GM
03XS
Inte
r Sea
bed
Auth
. W/S
hop
- Isa
Fun
ds 3
,844
2
01
- 4
,045
-
35
4,0
80
4,0
80
-
Suva
- M
arin
e &
Coa
stal
Sur
vey
Sect
or 9
96,2
49
51,
983
2,9
65,7
88
4,0
14,0
20
-2,7
98,5
87
15,
045
1,2
30,4
78
1,2
95,2
37
-64,
759
GO
MC
01XS
PAC
CSA
P BI
VA P
roje
ct 2
8,12
9 1
,468
4
97,1
71
526
,768
-5
15,6
11
-385
1
0,77
2 1
0,77
2 -
GO
MC
02XS
Coa
stal
Sur
vey
Saip
an 2
4,78
3 1
,293
-
26,
076
-25,
416
-660
-
- -
GO
MC
03XS
Envi
ronm
enta
lly S
afe
Aggr
egat
es T
araw
a - E
U K
I 05
347
,837
1
8,15
0 1
,706
,441
2
,072
,428
-1
,261
,951
1
8,75
3 8
29,2
30
829
,230
-
GO
MC
04XS
Coa
stal
Sur
vey
Fiji
24,
693
1,2
88
40,
984
66,
965
-21,
105
923
4
6,78
3 4
6,78
3 -
GO
MC
05XS
Seaw
all S
ite In
spec
tion
Wor
ks ,F
SM 2
,558
1
33
- 2
,691
-
24
2,7
15
2,7
15
- G
OM
C06
XSPW
D F
iji, J
etty
Sur
veys
- Va
nua
Levu
Pro
ject
7,5
92
396
-
7,9
88
-4,0
99
-73
3,8
16
3,8
16
- G
OM
C07
XSPA
CC
NIW
A, N
avua
- Re
wa
Surv
ey 4
3,71
4 2
,281
-
45,
995
-92,
941
-2,8
46
-49,
792
- -4
9,79
2 G
OM
C08
XSC
ook
Isla
nds
Mar
ine
/ Coa
stal
Sur
vey
64,
734
3,3
78
- 6
8,11
2 -6
6,38
8 -1
,724
-
- -
GO
MC
10XS
NZ
Proj
ect f
undi
ng -
OIP
138
,793
7
,242
-
146
,035
-6
3,71
3 -9
46
81,
376
81,
376
- G
OM
C11
XSPN
G H
ydro
elec
tric
Dam
Sur
vey
13,
170
687
2
6,15
1 4
0,00
8 -7
,840
7
62
32,
930
32,
930
- G
OM
C13
XSPe
arl P
roje
ct i
n Fi
ji an
d T
onga
- PA
RDI
28,
016
1,4
62
33,
110
62,
588
-18,
684
763
4
4,66
7 4
4,66
7 -
GO
MC
14XS
Pac
Aust
CC
Sci
ence
and
Ada
ptat
ion
Plan
ning
Pro
g 4
3,76
4 2
,284
-
46,
048
-44,
883
-1,1
65
- -
- G
OM
C15
XSW
ACO
P Pr
ojec
t (C
hang
ing
Wav
es a
nd C
oast
s in
the
Pa 7
8,56
7 4
,100
1
79,0
11
261
,678
-1
92,5
15
253
6
9,41
6 6
9,41
6 -
GO
MC
16XS
Tuva
lu R
eef C
hann
el p
roje
ct /
Shor
elin
e M
onito
ring
105
,146
5
,486
-1
6,74
3 9
3,88
9 -6
9,82
8 -2
,056
2
2,00
5 2
2,00
5 -
GO
MC
17XS
Tsun
ami P
hase
III -
PPS
LP T
onga
(AU
SAID
) 4
4,75
3 2
,335
-
47,
088
-12,
097
-10
34,
981
34,
981
- G
OM
C18
XSVa
nuat
u M
arin
e H
ydro
grap
hic
Surv
ey P
roje
ct, N
ZAID
- -
394
,709
3
94,7
09
-282
,101
3
,938
1
16,5
46
116
,546
-
GO
MC
19XS
Vanu
atu
Hyd
rogr
aphi
c Su
rvey
- Ph
ase
II -
- 1
04,9
54
104
,954
-1
19,4
15
-506
-1
4,96
7 -
-14,
967
Suva
- So
uth
Paci
fic S
ea L
evel
Clim
ate
Mon
itorin
g Se
ctor
323
,208
1
6,86
5 6
57,2
88
997
,361
-3
70,0
29
13,
028
640
,360
6
40,3
60
- G
OSL
01XS
Sout
h Pa
c. S
ea L
evel
Clim
ate
Mon
itorin
g (S
PSLC
MP)
327
,766
1
7,10
3 6
57,2
88
1,0
02,1
57
-374
,704
1
2,90
7 6
40,3
60
640
,360
-
GO
SL02
XSSP
SLC
MP
ON
UP
Proj
ect
-4,5
58
-238
-
-4,7
96
4,6
75
121
-
- -
Suva
- Te
chni
cal W
orks
hop
1,2
23
64
- 1
,287
-1
,313
-3
5 -6
1 -
-61
GO
TW02
XSTe
chni
cal W
orks
hop-
Sout
h Pa
cific
Sea
Lev
el P
roje
ct -
- -
- -5
9 -2
-6
1 -
-61
GO
TW03
XSTe
chni
cal W
orks
hop
Proj
ect,
Taiw
an R
OC
fund
ed 1
,223
6
4 -
1,2
87
-1,2
54
-33
- -
- -
Suva
- O
ther
13,
464
703
1
2,00
6 2
6,17
3 2
00,6
86
7,5
61
234
,420
2
34,4
20
- G
OZI
03XS
Mis
cella
neou
s O
cean
and
Isla
nds
Activ
ities
13,
464
703
1
0,41
2 2
4,57
9 -8
,676
1
85
16,
088
16,
088
- G
OZI
04XS
Oce
an &
Cos
tal G
eosc
ienc
e Pr
ojec
t Act
iviti
es -
- 1
,594
1
,594
2
09,3
62
7,3
76
218
,332
2
18,3
32
- -
Tech
nica
l Sup
port
Prog
ram
- Su
va 4
0,48
2 2
,112
2
81,7
96
324
,390
-2
85,9
36
229
3
8,68
3 7
1,82
1 -3
3,13
8 Su
va -
Nat
ural
Res
ourc
es E
cono
mic
s 2
7,42
5 1
,431
-
28,
856
-2,2
71
174
2
6,75
9 2
6,75
9 -
GD
NR0
1XS
Nat
ural
Res
ourc
es G
over
nanc
e - I
UC
N P
ASAP
7,0
20
366
-
7,3
86
-659
4
2 6
,769
6
,769
-
GD
NR0
2XS
Anal
ysis
of i
mpr
oved
Wea
ther
& C
limat
e Se
r 2
0,40
5 1
,065
-
21,
470
-1,6
12
132
1
9,99
0 1
9,99
0 -
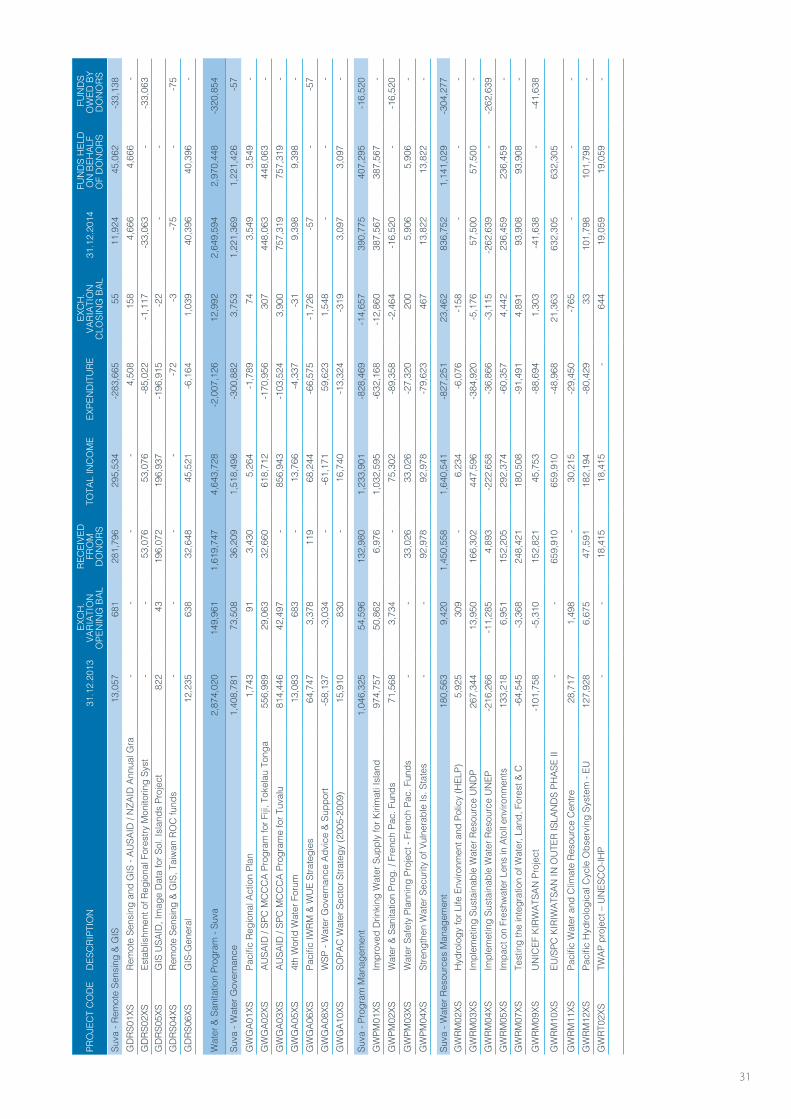
ANNUAL REPORT 2014 31
PRO
JEC
T C
OD
ED
ESC
RIPT
ION
31.
12.2
013
EXC
H.
VARI
ATIO
N
OPE
NIN
G B
AL
REC
EIVE
DFR
OM
DO
NO
RS T
OTA
L IN
CO
ME
EXPE
ND
ITU
RE
EXC
H.
VARI
ATIO
N
CLO
SIN
G B
AL 3
1.12
.201
4 F
UN
DS
HEL
D
ON
BEH
ALF
OF
DO
NO
RS
FU
ND
S O
WED
BY
DO
NO
RSSu
va -
Rem
ote
Sens
ing
& G
IS 1
3,05
7 6
81
281
,796
2
95,5
34
-283
,665
5
5 1
1,92
4 4
5,06
2 -3
3,13
8 G
DRS
01XS
Rem
ote
Sens
ing
and
GIS
- AU
SAID
/ N
ZAID
Ann
ual G
ra -
- -
- 4
,508
1
58
4,6
66
4,6
66
- G
DRS
02XS
Esta
blis
hmen
t of R
egio
nal F
ores
try M
onito
ring
Syst
- -
53,
076
53,
076
-85,
022
-1,1
17
-33,
063
- -3
3,06
3 G
DRS
05XS
GIS
USA
ID, I
mag
e D
ata
for S
ol. I
slan
ds P
roje
ct 8
22
43
196
,072
1
96,9
37
-196
,915
-2
2 -
- G
DRS
04XS
Rem
ote
Sens
ing
& G
IS, T
aiw
an R
OC
fund
s -
- -
- -7
2 -3
-7
5 -
-75
GD
RS06
XSG
IS-G
ener
al 1
2,23
5 6
38
32,
648
45,
521
-6,1
64
1,0
39
40,
396
40,
396
-
Wat
er &
San
itatio
n Pr
ogra
m -
Suva
2,8
74,0
20
149
,961
1
,619
,747
4
,643
,728
-2
,007
,126
1
2,99
2 2
,649
,594
2
,970
,448
-3
20,8
54
Suva
- W
ater
Gov
erna
nce
1,4
08,7
81
73,
508
36,
209
1,5
18,4
98
-300
,882
3
,753
1
,221
,369
1
,221
,426
-5
7 G
WG
A01X
SPa
cific
Reg
iona
l Act
ion
Plan
1,7
43
91
3,4
30
5,2
64
-1,7
89
74
3,5
49
3,5
49
- G
WG
A02X
SAU
SAID
/ SP
C M
CC
CA
Prog
ram
for F
iji, T
okel
au T
onga
556
,989
2
9,06
3 3
2,66
0 6
18,7
12
-170
,956
3
07
448
,063
4
48,0
63
- G
WG
A03X
SAU
SAID
/ SP
C M
CC
CA
Prog
ram
e fo
r Tuv
alu
814
,446
4
2,49
7 -
856
,943
-1
03,5
24
3,9
00
757
,319
7
57,3
19
- G
WG
A05X
S4t
h W
orld
Wat
er F
orum
13,
083
683
-
13,
766
-4,3
37
-31
9,3
98
9,3
98
- G
WG
A06X
SPa
cific
IWRM
& W
UE
Stra
tegi
es 6
4,74
7 3
,378
1
19
68,
244
-66,
575
-1,7
26
-57
- -5
7 G
WG
A08X
SW
SP -
Wat
er G
over
nanc
e Ad
vice
& S
uppo
rt-5
8,13
7 -3
,034
-
-61,
171
59,
623
1,5
48
- -
- G
WG
A10X
SSO
PAC
Wat
er S
ecto
r Stra
tegy
(200
5-20
09)
15,
910
830
-
16,
740
-13,
324
-319
3
,097
3
,097
-
Suva
- Pr
ogra
m M
anag
emen
t 1
,046
,325
5
4,59
6 1
32,9
80
1,2
33,9
01
-828
,469
-1
4,65
7 3
90,7
75
407
,295
-1
6,52
0 G
WPM
01XS
Impr
oved
Drin
king
Wat
er S
uppl
y fo
r Kiri
mat
i Isl
and
974
,757
5
0,86
2 6
,976
1
,032
,595
-6
32,1
68
-12,
860
387
,567
3
87,5
67
- G
WPM
02XS
Wat
er &
San
itatio
n Pr
og. /
Fre
nch
Pac.
Fun
ds 7
1,56
8 3
,734
-
75,
302
-89,
358
-2,4
64
-16,
520
- -1
6,52
0 G
WPM
03XS
Wat
er S
afet
y Pl
anni
ng P
roje
ct -
Fren
ch P
ac. F
unds
- -
33,
026
33,
026
-27,
320
200
5
,906
5
,906
-
GW
PM04
XSSt
reng
then
Wat
er S
ecur
ity o
f Vul
nera
ble
Is. S
tate
s -
- 9
2,97
8 9
2,97
8 -7
9,62
3 4
67
13,
822
13,
822
-
Suva
- W
ater
Res
ourc
es M
anag
emen
t 1
80,5
63
9,4
20
1,4
50,5
58
1,6
40,5
41
-827
,251
2
3,46
2 8
36,7
52
1,1
41,0
29
-304
,277
G
WRM
02XS
Hyd
rolo
gy fo
r Life
Env
ironm
ent a
nd P
olic
y (H
ELP)
5,9
25
309
-
6,2
34
-6,0
76
-158
-
- -
GW
RM03
XSIm
plem
etin
g Su
stai
nabl
e W
ater
Res
ourc
e U
ND
P 2
67,3
44
13,
950
166
,302
4
47,5
96
-384
,920
-5
,176
5
7,50
0 5
7,50
0 -
GW
RM04
XSIm
plem
etin
g Su
stai
nabl
e W
ater
Res
ourc
e U
NEP
-216
,266
-1
1,28
5 4
,893
-2
22,6
58
-36,
866
-3,1
15
-262
,639
-
-262
,639
G
WRM
05XS
Impa
ct o
n Fr
eshw
ater
Len
s in
Ato
ll en
viro
nmen
ts 1
33,2
18
6,9
51
152
,205
2
92,3
74
-60,
357
4,4
42
236
,459
2
36,4
59
- G
WRM
07XS
Test
ing
the
inte
grat
ion
of W
ater
, Lan
d, F
ores
t & C
-64,
545
-3,3
68
248
,421
1
80,5
08
-91,
491
4,8
91
93,
908
93,
908
-
GW
RM09
XSU
NIC
EF K
IRW
ATSA
N P
roje
ct-1
01,7
58
-5,3
10
152
,821
4
5,75
3 -8
8,69
4 1
,303
-4
1,63
8 -
-41,
638
GW
RM10
XSEU
/SPC
KIR
IWAT
SAN
IN O
UTE
R IS
LAN
DS
PHAS
E II
- -
659
,910
6
59,9
10
-48,
968
21,
363
632
,305
6
32,3
05
GW
RM11
XSPa
cific
Wat
er a
nd C
limat
e Re
sour
ce C
entre
28,
717
1,4
98
- 3
0,21
5 -2
9,45
0 -7
65
- -
- G
WRM
12XS
Paci
fic H
ydro
logi
cal C
ycle
Obs
ervi
ng S
yste
m -
EU 1
27,9
28
6,6
75
47,
591
182
,194
-8
0,42
9 3
3 1
01,7
98
101
,798
-
GW
RT02
XSTW
AP p
roje
ct –
UN
ESC
O-IH
P -
- 1
8,41
5 1
8,41
5 -
644
1
9,05
9 1
9,05
9 -
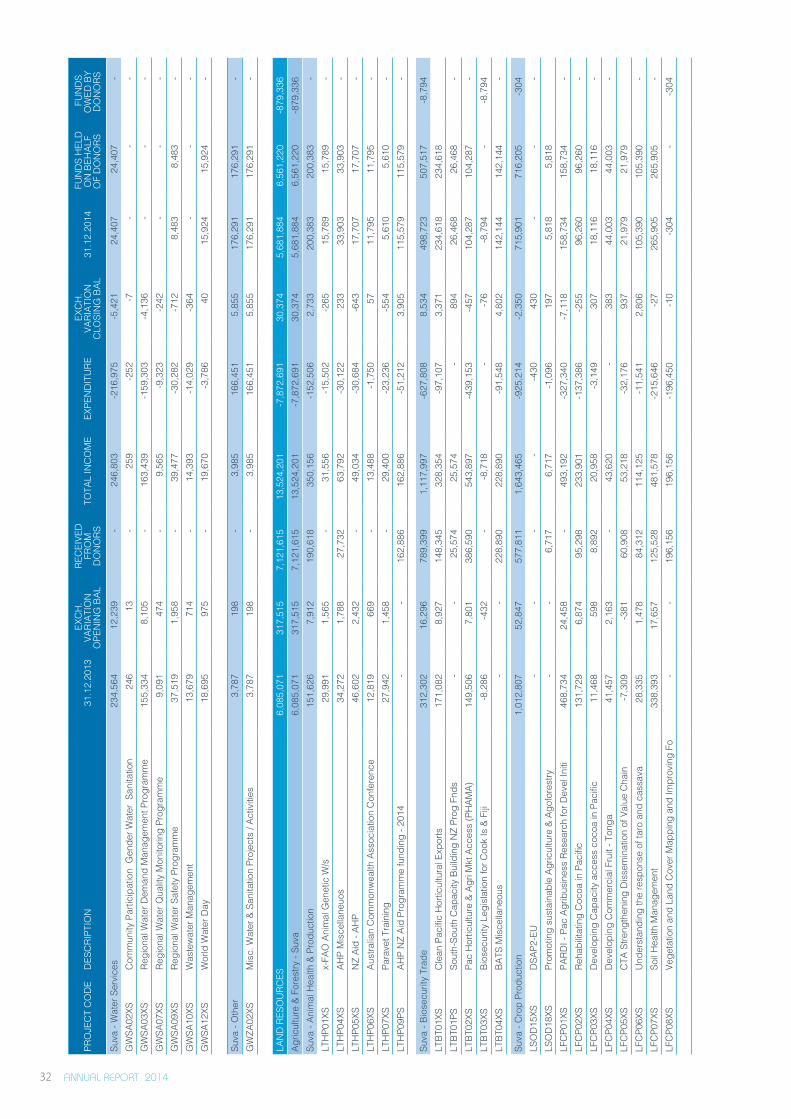
ANNUAL REPORT 2014 32
PRO
JEC
T C
OD
ED
ESC
RIPT
ION
31.
12.2
013
EXC
H.
VARI
ATIO
N
OPE
NIN
G B
AL
REC
EIVE
DFR
OM
DO
NO
RS T
OTA
L IN
CO
ME
EXPE
ND
ITU
RE
EXC
H.
VARI
ATIO
N
CLO
SIN
G B
AL 3
1.12
.201
4 F
UN
DS
HEL
D
ON
BEH
ALF
OF
DO
NO
RS
FU
ND
S O
WED
BY
DO
NO
RS
Suva
- W
ater
Ser
vice
s 2
34,5
64
12,
239
- 2
46,8
03
-216
,975
-5
,421
2
4,40
7 2
4,40
7 -
GW
SA02
XSC
omm
unity
Par
ticip
atio
n G
ende
r Wat
er S
anita
tion
246
1
3 -
259
-2
52
-7
- -
- G
WSA
03XS
Regi
onal
Wat
er D
eman
d M
anag
emen
t Pro
gram
me
155
,334
8
,105
-
163
,439
-1
59,3
03
-4,1
36
- -
- G
WSA
07XS
Regi
onal
Wat
er Q
ualit
y M
onito
ring
Prog
ram
me
9,0
91
474
-
9,5
65
-9,3
23
-242
-
- -
GW
SA09
XSRe
gion
al W
ater
Saf
ety
Prog
ram
me
37,
519
1,9
58
- 3
9,47
7 -3
0,28
2 -7
12
8,4
83
8,4
83
- G
WSA
10XS
Was
tew
ater
Man
agem
ent
13,
679
714
-
14,
393
-14,
029
-364
-
- -
GW
SA12
XSW
orld
Wat
er D
ay 1
8,69
5 9
75
- 1
9,67
0 -3
,786
4
0 1
5,92
4 1
5,92
4 -
Suva
- O
ther
3,7
87
198
-
3,9
85
166
,451
5
,855
1
76,2
91
176
,291
-
GW
ZA02
XSM
isc.
Wat
er &
San
itatio
n Pr
ojec
ts /
Activ
ities
3,7
87
198
-
3,9
85
166
,451
5
,855
1
76,2
91
176
,291
-
LAN
D R
ESO
URC
ES 6
,085
,071
3
17,5
15
7,1
21,6
15
13,
524,
201
-7,8
72,6
91
30,
374
5,6
81,8
84
6,5
61,2
20
-879
,336
Ag
ricul
ture
& F
ores
try -
Suva
6,0
85,0
71
317
,515
7
,121
,615
1
3,52
4,20
1 -7
,872
,691
3
0,37
4 5
,681
,884
6
,561
,220
-8
79,3
36
Suva
- An
imal
Hea
lth &
Pro
duct
ion
151
,626
7
,912
1
90,6
18
350
,156
-1
52,5
06
2,7
33
200
,383
2
00,3
83
- LT
HP0
1XS
x-FA
O A
nim
al G
enet
ic W
/s 2
9,99
1 1
,565
-
31,
556
-15,
502
-265
1
5,78
9 1
5,78
9 -
LTH
P04X
SAH
P M
isce
llane
uos
34,
272
1,7
88
27,
732
63,
792
-30,
122
233
3
3,90
3 3
3,90
3 -
LTH
P05X
SN
Z Ai
d - A
HP
46,
602
2,4
32
- 4
9,03
4 -3
0,68
4 -6
43
17,
707
17,
707
- LT
HP0
6XS
Aust
ralia
n C
omm
onw
ealth
Ass
ocia
tion
Con
fere
nce
12,
819
669
-
13,
488
-1,7
50
57
11,
795
11,
795
- LT
HP0
7XS
Para
vet T
rain
ing
27,
942
1,4
58
- 2
9,40
0 -2
3,23
6 -5
54
5,6
10
5,6
10
- LT
HP0
9PS
AHP
NZ
Aid
Prog
ram
me
fund
ing
- 201
4 -
- 1
62,8
86
162
,886
-5
1,21
2 3
,905
1
15,5
79
115
,579
-
Suva
- Bi
osec
urity
Tra
de 3
12,3
02
16,
296
789
,399
1
,117
,997
-6
27,8
08
8,5
34
498
,723
5
07,5
17
-8,7
94
LTBT
01XS
Cle
an P
acifi
c H
ortic
ultu
ral E
xpor
ts 1
71,0
82
8,9
27
148
,345
3
28,3
54
-97,
107
3,3
71
234
,618
2
34,6
18
LTBT
01PS
Sout
h-So
uth
Cap
acity
Bui
ldin
g N
Z Pr
og F
nds
- -
25,
574
25,
574
- 8
94
26,
468
26,
468
- LT
BT02
XSPa
c H
ortic
ultu
re &
Agr
i Mkt
Acc
ess
(PH
AMA)
149
,506
7
,801
3
86,5
90
543
,897
-4
39,1
53
-457
1
04,2
87
104
,287
-
LTBT
03XS
Bios
ecur
ity L
egis
latio
n fo
r Coo
k Is
& F
iji-8
,286
-4
32
- -8
,718
-
-76
-8,7
94
- -8
,794
LT
BT04
XSBA
TS M
isce
llane
ous
- -
228
,890
2
28,8
90
-91,
548
4,8
02
142
,144
1
42,1
44
-
Suva
- C
rop
Prod
uctio
n 1
,012
,807
5
2,84
7 5
77,8
11
1,6
43,4
65
-925
,214
-2
,350
7
15,9
01
716
,205
-3
04
LSO
D15
XSD
SAP2
-EU
- -
- -
-430
4
30
- -
- LS
OD
18XS
Prom
otin
g su
stai
nabl
e Ag
ricul
ture
& A
gofo
rest
ry -
- 6
,717
6
,717
-1
,096
1
97
5,8
18
5,8
18
LFC
P01X
SPA
RDI -
Pac
Agr
ibus
ines
s Re
sear
ch fo
r Dev
el In
iti 4
68,7
34
24,
458
- 4
93,1
92
-327
,340
-7
,118
1
58,7
34
158
,734
-
LFC
P02X
SRe
habi
litat
ing
Coc
oa in
Pac
ific
131
,729
6
,874
9
5,29
8 2
33,9
01
-137
,386
-2
55
96,
260
96,
260
- LF
CP0
3XS
Dev
elop
ing
Cap
acity
acc
ess
coco
a in
Pac
ific
11,
468
598
8
,892
2
0,95
8 -3
,149
3
07
18,
116
18,
116
- LF
CP0
4XS
Dev
elop
ing
Com
mer
cial
Fru
it - T
onga
41,
457
2,1
63
- 4
3,62
0 -
383
4
4,00
3 4
4,00
3 -
LFC
P05X
SC
TA S
treng
then
ing
Dis
sem
inat
ion
of V
alue
Cha
in-7
,309
-3
81
60,
908
53,
218
-32,
176
937
2
1,97
9 2
1,97
9 LF
CP0
6XS
Und
erst
andi
ng th
e re
spon
se o
f tar
o an
d ca
ssav
a 2
8,33
5 1
,478
8
4,31
2 1
14,1
25
-11,
541
2,8
06
105
,390
1
05,3
90
- LF
CP0
7XS
Soil
Hea
lth M
anag
emen
t 3
38,3
93
17,
657
125
,528
4
81,5
78
-215
,646
-2
7 2
65,9
05
265
,905
-
LFC
P08X
SVe
geta
tion
and
Land
Cov
er M
appi
ng a
nd Im
prov
ing
Fo -
- 1
96,1
56
196
,156
-1
96,4
50
-10
-304
-
-304
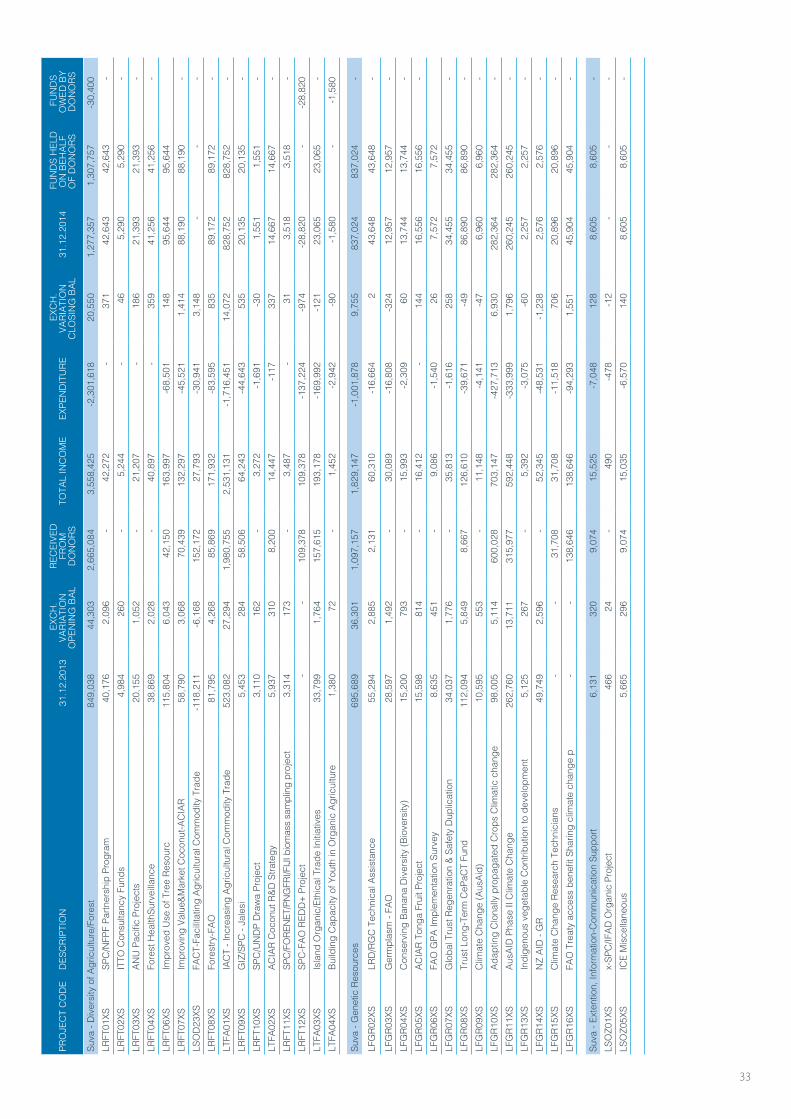
ANNUAL REPORT 2014 33
PRO
JEC
T C
OD
ED
ESC
RIPT
ION
31.
12.2
013
EXC
H.
VARI
ATIO
N
OPE
NIN
G B
AL
REC
EIVE
DFR
OM
DO
NO
RS T
OTA
L IN
CO
ME
EXPE
ND
ITU
RE
EXC
H.
VARI
ATIO
N
CLO
SIN
G B
AL 3
1.12
.201
4 F
UN
DS
HEL
D
ON
BEH
ALF
OF
DO
NO
RS
FU
ND
S O
WED
BY
DO
NO
RS
Suva
- D
iver
sity
of A
gric
ultu
re/F
ores
t 8
49,0
38
44,
303
2,6
65,0
84
3,5
58,4
25
-2,3
01,6
18
20,
550
1,2
77,3
57
1,3
07,7
57
-30,
400
LRFT
01XS
SPC
/NFP
F Pa
rtner
ship
Pro
gram
40,
176
2,0
96
- 4
2,27
2 -
371
4
2,64
3 4
2,64
3 -
LRFT
02XS
ITTO
Con
sulta
ncy
Fund
s 4
,984
2
60
- 5
,244
-
46
5,2
90
5,2
90
- LR
FT03
XSAN
U P
acifi
c Pr
ojec
ts 2
0,15
5 1
,052
-
21,
207
- 1
86
21,
393
21,
393
- LR
FT04
XSFo
rest
Hea
lthSu
rvei
llanc
e 3
8,86
9 2
,028
-
40,
897
- 3
59
41,
256
41,
256
- LR
FT06
XSIm
prov
ed U
se o
f Tre
e Re
sour
c 1
15,8
04
6,0
43
42,
150
163
,997
-6
8,50
1 1
48
95,
644
95,
644
LRFT
07XS
Impr
ovin
g Va
lue&
Mar
ket C
ocon
ut-A
CIA
R 5
8,79
0 3
,068
7
0,43
9 1
32,2
97
-45,
521
1,4
14
88,
190
88,
190
- LS
OD
23XS
FAC
T-Fa
cilit
atin
g Ag
ricul
tura
l Com
mod
ity T
rade
-118
,211
-6
,168
1
52,1
72
27,
793
-30,
941
3,1
48
- -
- LR
FT08
XSFo
rest
ry-F
AO 8
1,79
5 4
,268
8
5,86
9 1
71,9
32
-83,
595
835
8
9,17
2 8
9,17
2 -
LTFA
01XS
IAC
T - I
ncre
asin
g Ag
ricul
tura
l Com
mod
ity T
rade
523
,082
2
7,29
4 1
,980
,755
2
,531
,131
-1
,716
,451
1
4,07
2 8
28,7
52
828
,752
-
LRFT
09XS
GIZ
/SPC
- Ja
lesi
5,4
53
284
5
8,50
6 6
4,24
3 -4
4,64
3 5
35
20,
135
20,
135
- LR
FT10
XSSP
C/U
ND
P D
raw
a Pr
ojec
t 3
,110
1
62
- 3
,272
-1
,691
-3
0 1
,551
1
,551
-
LTFA
02XS
ACIA
R C
ocon
ut R
&D S
trate
gy 5
,937
3
10
8,2
00
14,
447
-117
3
37
14,
667
14,
667
- LR
FT11
XSSP
C/FO
RENE
T/PN
GFR
I/FIJ
I bio
mas
s sa
mpl
ing
proj
ect
3,3
14
173
-
3,4
87
- 3
1 3
,518
3
,518
-
LRFT
12XS
SPC
-FAO
RED
D+
Proj
ect
- -
109
,378
1
09,3
78
-137
,224
-9
74
-28,
820
- -2
8,82
0 LT
FA03
XSIs
land
Org
anic
/Eth
ical
Tra
de In
itiat
ives
33,
799
1,7
64
157
,615
1
93,1
78
-169
,992
-1
21
23,
065
23,
065
- LT
FA04
XSBu
ildin
g C
apac
ity o
f You
th in
Org
anic
Agr
icul
ture
1,3
80
72
- 1
,452
-2
,942
-9
0 -1
,580
-
-1,5
80
Suva
- G
enet
ic R
esou
rces
695
,689
3
6,30
1 1
,097
,157
1
,829
,147
-1
,001
,878
9
,755
8
37,0
24
837
,024
-
LFG
R02X
SLR
D/R
GC
Tec
hnic
al A
ssis
tanc
e 5
5,29
4 2
,885
2
,131
6
0,31
0 -1
6,66
4 2
4
3,64
8 4
3,64
8 -
LFG
R03X
SG
erm
plas
m -
FAO
28,
597
1,4
92
- 3
0,08
9 -1
6,80
8 -3
24
12,
957
12,
957
- LF
GR0
4XS
Con
serv
ing
Bana
na D
iver
sity
(Bio
vers
ity)
15,
200
793
-
15,
993
-2,3
09
60
13,
744
13,
744
- LF
GR0
5XS
ACIA
R To
nga
Frui
t Pro
ject
15,
598
814
-
16,
412
- 1
44
16,
556
16,
556
- LF
GR0
6XS
FAO
GPA
Impl
emen
tatio
n Su
rvey
8,6
35
451
-
9,0
86
-1,5
40
26
7,5
72
7,5
72
LFG
R07X
SG
loba
l Tru
st R
egen
ratio
n &
Safe
ty D
uplic
atio
n 3
4,03
7 1
,776
-
35,
813
-1,6
16
258
3
4,45
5 3
4,45
5 -
LFG
R08X
STr
ust L
ong-
Term
CeP
aCT
Fund
112
,094
5
,849
8
,667
1
26,6
10
-39,
671
-49
86,
890
86,
890
- LF
GR0
9XS
Clim
ate
Cha
nge
(Aus
Aid)
10,
595
553
-
11,
148
-4,1
41
-47
6,9
60
6,9
60
- LF
GR1
0XS
Adap
ting
Clo
nally
pro
paga
ted
Cro
ps C
limat
ic c
hang
e 9
8,00
5 5
,114
6
00,0
28
703
,147
-4
27,7
13
6,9
30
282
,364
2
82,3
64
- LF
GR1
1XS
AusA
ID P
hase
II C
limat
e C
hang
e 2
62,7
60
13,
711
315
,977
5
92,4
48
-333
,999
1
,796
2
60,2
45
260
,245
-
LFG
R13X
SIn
dige
nous
veg
etab
le C
ontri
butio
n to
dev
elop
men
t 5
,125
2
67
- 5
,392
-3
,075
-6
0 2
,257
2
,257
-
LFG
R14X
SN
Z AI
D -
GR
49,
749
2,5
96
- 5
2,34
5 -4
8,53
1 -1
,238
2
,576
2
,576
-
LFG
R15X
SC
limat
e C
hang
e Re
sear
ch T
echn
icia
ns -
- 3
1,70
8 3
1,70
8 -1
1,51
8 7
06
20,
896
20,
896
- LF
GR1
6XS
FAO
Tre
aty
acce
ss b
enefi
t Sha
ring
clim
ate
chan
ge p
- -
138
,646
1
38,6
46
-94,
293
1,5
51
45,
904
45,
904
-
Suva
- Ex
tent
ion,
Info
rmat
ion-
Com
mun
icat
ion
Supp
ort
6,1
31
320
9
,074
1
5,52
5 -7
,048
1
28
8,6
05
8,6
05
- LS
OZ0
1XS
x-SP
C/IF
AD O
rgan
ic P
roje
ct 4
66
24
- 4
90
-478
-1
2 -
- -
LSO
Z05X
SIC
E M
isce
llane
ous
5,6
65
296
9
,074
1
5,03
5 -6
,570
1
40
8,6
05
8,6
05
-
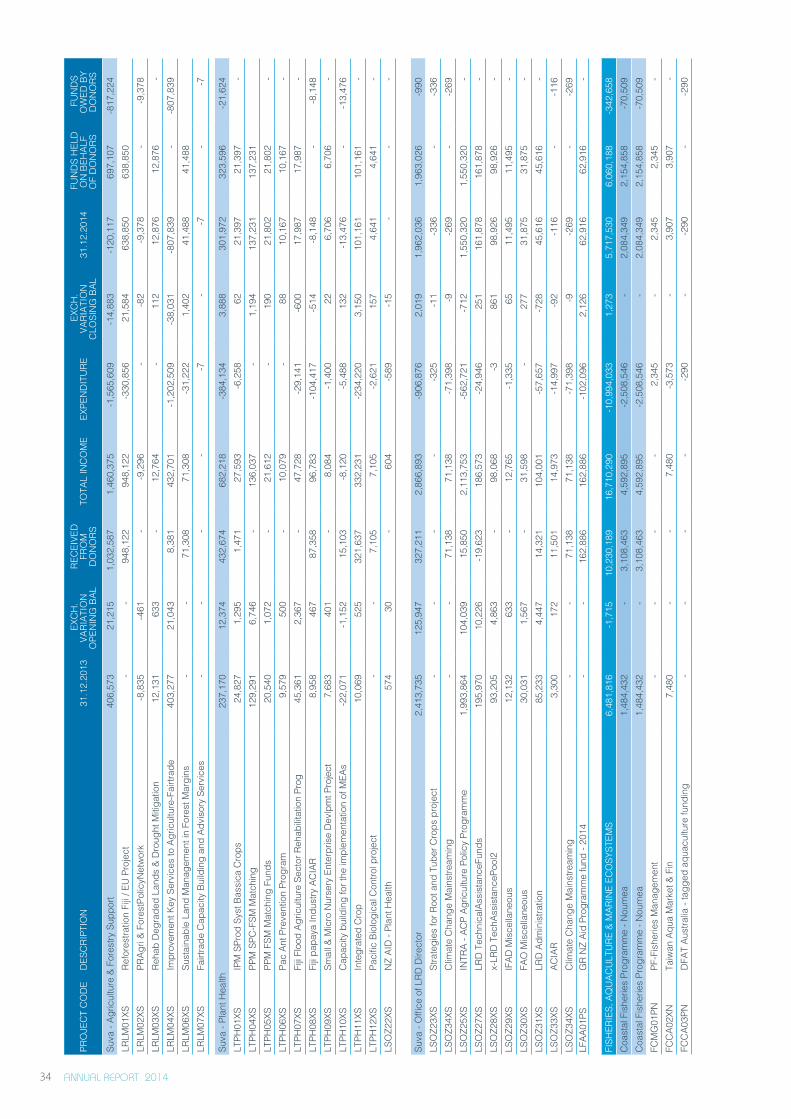
ANNUAL REPORT 2014 34
PRO
JEC
T C
OD
ED
ESC
RIPT
ION
31.
12.2
013
EXC
H.
VARI
ATIO
N
OPE
NIN
G B
AL
REC
EIVE
DFR
OM
DO
NO
RS T
OTA
L IN
CO
ME
EXPE
ND
ITU
RE
EXC
H.
VARI
ATIO
N
CLO
SIN
G B
AL 3
1.12
.201
4 F
UN
DS
HEL
D
ON
BEH
ALF
OF
DO
NO
RS
FU
ND
S O
WED
BY
DO
NO
RS
Suva
- Ag
ricul
ture
& F
ores
try S
uppo
rt 4
06,5
73
21,
215
1,0
32,5
87
1,4
60,3
75
-1,5
65,6
09
-14,
883
-120
,117
6
97,1
07
-817
,224
LR
LM01
XSRe
fore
stra
tion
Fiji
/ EU
Pro
ject
- -
948
,122
9
48,1
22
-330
,856
2
1,58
4 6
38,8
50
638
,850
LR
LM02
XSPR
Agri
& Fo
rest
Polic
yNet
wor
k-8
,835
-4
61
- -9
,296
-
-82
-9,3
78
- -9
,378
LR
LM03
XSRe
hab
Deg
rade
d La
nds
& D
roug
ht M
itiga
tion
12,
131
633
-
12,
764
- 1
12
12,
876
12,
876
- LR
LM04
XSIm
prov
emen
t Key
Ser
vice
s to
Agr
icul
ture
-Fai
rtrad
e 4
03,2
77
21,
043
8,3
81
432
,701
-1
,202
,509
-3
8,03
1 -8
07,8
39
- -8
07,8
39
LRLM
06XS
Sust
aina
ble
Land
Man
agem
ent i
n Fo
rest
Mar
gins
- -
71,
308
71,
308
-31,
222
1,4
02
41,
488
41,
488
LRLM
07XS
Fairt
rade
Cap
acity
Bui
ldin
g an
d Ad
viso
ry S
ervi
ces
- -
- -
-7
- -7
-
-7
Suva
- Pl
ant H
ealth
237
,170
1
2,37
4 4
32,6
74
682
,218
-3
84,1
34
3,8
88
301
,972
3
23,5
96
-21,
624
LTPH
01XS
IPM
SPr
od S
yst B
assi
ca C
rops
24,
827
1,2
95
1,4
71
27,
593
-6,2
58
62
21,
397
21,
397
- LT
PH04
XSPP
M S
PC-F
SM M
atch
ing
129
,291
6
,746
-
136
,037
-
1,1
94
137
,231
1
37,2
31
LTPH
05XS
PPM
FSM
Mat
chin
g Fu
nds
20,
540
1,0
72
- 2
1,61
2 -
190
2
1,80
2 2
1,80
2 -
LTPH
06XS
Pac
Ant P
reve
ntio
n Pr
ogra
m 9
,579
5
00
- 1
0,07
9 -
88
10,
167
10,
167
- LT
PH07
XSFi
ji Fl
ood
Agric
ultu
re S
ecto
r Reh
abilit
atio
n Pr
og 4
5,36
1 2
,367
-
47,
728
-29,
141
-600
1
7,98
7 1
7,98
7 -
LTPH
08XS
Fiji
papa
ya In
dust
ry A
CIA
R 8
,958
4
67
87,
358
96,
783
-104
,417
-5
14
-8,1
48
- -8
,148
LT
PH09
XSSm
all &
Mic
ro N
urse
ry E
nter
pris
e D
evlp
mt P
roje
ct 7
,683
4
01
- 8
,084
-1
,400
2
2 6
,706
6
,706
-
LTPH
10XS
Cap
acity
bui
ldin
g fo
r the
impl
emen
tatio
n of
MEA
s-2
2,07
1 -1
,152
1
5,10
3 -8
,120
-5
,488
1
32
-13,
476
- -1
3,47
6 LT
PH11
XSIn
tegr
ated
Cro
p 1
0,06
9 5
25
321
,637
3
32,2
31
-234
,220
3
,150
1
01,1
61
101
,161
-
LTPH
12XS
Paci
fic B
iolo
gica
l Con
trol p
roje
ct -
- 7
,105
7
,105
-2
,621
1
57
4,6
41
4,6
41
- LS
OZ2
2XS
NZ
AID
- Pl
ant H
ealth
574
3
0 -
604
-5
89
-15
- -
-
Suva
- O
ffice
of L
RD D
irect
or 2
,413
,735
1
25,9
47
327
,211
2
,866
,893
-9
06,8
76
2,0
19
1,9
62,0
36
1,9
63,0
26
-990
LS
OZ2
3XS
Stra
tegi
es fo
r Roo
t and
Tub
er C
rops
pro
ject
- -
- -
-325
-1
1 -3
36
- -3
36
LSO
Z34X
SC
limat
e C
hang
e M
ains
tream
ing
- -
71,
138
71,
138
-71,
398
-9
-269
-
-269
LS
OZ2
5XS
INTR
A - A
CP
Agric
ultu
re P
olic
y Pr
ogra
mm
e 1
,993
,864
1
04,0
39
15,
850
2,1
13,7
53
-562
,721
-7
12
1,5
50,3
20
1,5
50,3
20
- LS
OZ2
7XS
LRD
Tec
hnic
alAs
sist
ance
Fund
s 1
95,9
70
10,
226
-19,
623
186
,573
-2
4,94
6 2
51
161
,878
1
61,8
78
- LS
OZ2
8XS
x-LR
D T
echA
ssis
tanc
ePoo
l2 9
3,20
5 4
,863
-
98,
068
-3
861
9
8,92
6 9
8,92
6 -
LSO
Z29X
SIF
AD M
isce
llane
ous
12,
132
633
-
12,
765
-1,3
35
65
11,
495
11,
495
- LS
OZ3
0XS
FAO
Mis
cella
neou
s 3
0,03
1 1
,567
-
31,
598
- 2
77
31,
875
31,
875
- LS
OZ3
1XS
LRD
Adm
inis
tratio
n 8
5,23
3 4
,447
1
4,32
1 1
04,0
01
-57,
657
-728
4
5,61
6 4
5,61
6 -
LSO
Z33X
SAC
IAR
3,3
00
172
1
1,50
1 1
4,97
3 -1
4,99
7 -9
2 -1
16
- -1
16
LSO
Z34X
SC
limat
e C
hang
e M
ains
tream
ing
- -
71,
138
71,
138
-71,
398
-9
-269
-
-269
LF
AA01
PSG
R N
Z Ai
d Pr
ogra
mm
e fu
nd -
2014
- -
162
,886
1
62,8
86
-102
,096
2
,126
6
2,91
6 6
2,91
6 -
FISH
ERIE
S, A
QU
ACU
LTU
RE &
MAR
INE
ECO
SYST
EMS
6,4
81,8
16
-1,7
15
10,
230,
189
16,
710,
290
-10,
994,
033
1,2
73
5,7
17,5
30
6,0
60,1
88
-342
,658
C
oast
al F
ishe
ries
Prog
ram
me
- Nou
mea
1,4
84,4
32
- 3
,108
,463
4
,592
,895
-2
,508
,546
-
2,0
84,3
49
2,1
54,8
58
-70,
509
Coa
stal
Fis
herie
s Pr
ogra
mm
e - N
oum
ea 1
,484
,432
-
3,1
08,4
63
4,5
92,8
95
-2,5
08,5
46
- 2
,084
,349
2
,154
,858
-7
0,50
9 FC
MG
01PN
PF-F
ishe
ries
Man
agem
ent
- -
- -
2,3
45
- 2
,345
2
,345
-
FCC
A02X
NTa
iwan
Aqu
a M
arke
t & F
in 7
,480
-
- 7
,480
-3
,573
-
3,9
07
3,9
07
- FC
CA0
3PN
DFA
T Au
stra
lia -
tagg
ed a
quac
ultu
re fu
ndin
g -
- -
- -2
90
- -2
90
- -2
90

ANNUAL REPORT 2014 35
PRO
JEC
T C
OD
ED
ESC
RIPT
ION
31.
12.2
013
EXC
H.
VARI
ATIO
N
OPE
NIN
G B
AL
REC
EIVE
DFR
OM
DO
NO
RS T
OTA
L IN
CO
ME
EXPE
ND
ITU
RE
EXC
H.
VARI
ATIO
N
CLO
SIN
G B
AL 3
1.12
.201
4 F
UN
DS
HEL
D
ON
BEH
ALF
OF
DO
NO
RS
FU
ND
S O
WED
BY
DO
NO
RSFC
CA0
7XN
ACIA
R - M
ini-p
roje
cts
99,
701
- -
99,
701
-40,
646
- 5
9,05
5 5
9,05
5 -
FCC
A12X
NAu
sAid
Mar
icul
ture
53,
983
- 2
09,2
31
263
,214
-2
03,8
41
- 5
9,37
3 5
9,37
3 -
FCC
A13X
NAU
SAid
Aqu
acul
ture
Fre
shw
ater
28,
850
- 5
19,5
27
548
,377
-2
78,8
37
- 2
69,5
40
269
,540
-
FCC
A14X
NAC
IAR
FIS
/ 201
0 / 0
57-2
,849
-
16,
683
13,
834
-3,8
24
- 1
0,01
0 1
0,01
0 -
FCC
A15X
NAC
IAR
FIS
/ 201
2 / 0
76 1
48,0
89
- 3
09,9
07
457
,996
-2
74,7
60
- 1
83,2
36
183
,236
-
FCC
A16X
NAq
uacu
lture
Con
sulta
ncy/
EU
Pro
ject
- -
6,9
81
6,9
81
-3,9
09
- 3
,072
3
,072
-
FCC
A17X
NAC
IAR/
JCU
Pea
rl Aq
uacu
lture
- -
11,
989
11,
989
-29,
296
- -1
7,30
7 -
-17,
307
FCFP
05PN
CFP
NZA
ID 2
014-
2016
Allo
catio
n -
- 2
18,9
53
218
,953
-1
55,1
50
- 6
3,80
3 6
3,80
3 -
FCFP
07PN
NC
Pro
gram
me
Gra
nt -
- 9
7,89
4 9
7,89
4 -5
1,83
1 -
46,
063
46,
063
- FC
FP14
XNC
oast
.Fis
herie
s M
gt M
eetg
6,1
35
- -
6,1
35
- -
6,1
35
6,1
35
- FC
FP16
XNRe
g. S
trat P
lan
/Coa
st F
ish
5,1
31
- -
5,1
31
- -
5,1
31
5,1
31
- FC
FP17
XND
evel
opin
g Ki
ribat
i Eco
syst
em F
ishe
ries
Mgm
t Pro
g 4
,257
-
- 4
,257
-
- 4
,257
4
,257
-
FCFP
23XN
Fish
erie
s aw
aren
ess
mat
eria
l pro
duct
ion
2,6
14
- -
2,6
14
- -
2,6
14
2,6
14
- FC
FP24
XNH
EAD
S-FI
SHER
IES
MEE
TIN
G 2
6,19
1 -
- 2
6,19
1 -
- 2
6,19
1 2
6,19
1 -
FCFP
28XN
SPC
-GIZ
Clim
ate
Cha
nge
Coa
stal
-9,4
47
- 1
38,9
43
129
,496
-1
21,8
43
- 7
,653
7
,653
-
FCFP
29XN
CBF
M fo
r Kiri
bati
23,
448
- 3
3,56
3 5
7,01
1 -3
4,44
8 -
22,
563
22,
563
- FC
FP30
XNC
BFM
for V
anua
tu-5
80
- 2
6,81
1 2
6,23
1 -4
0,50
8 -
-14,
277
- -1
4,27
7 FC
FP35
XNRe
sour
ces
Mat
eria
ls 7
,337
-
3,7
73
11,
110
-53
- 1
1,05
7 1
1,05
7 -
FCD
V05X
NFa
d Re
sear
ch 1
,601
-
2,8
18
4,4
19
- -
4,4
19
4,4
19
- FC
FP38
XNFi
sh S
ILAG
E 6
,224
-
2,7
10
8,9
34
-49
- 8
,885
8
,885
-
FCFP
39XN
Spor
t Fis
hing
Dev
elop
men
t 7
,199
-
- 7
,199
-1
,306
-
5,8
93
5,8
93
- FC
DV0
6XN
Fish
erie
s Tr
aini
ng (N
.Z.)
85,
204
- 1
82,2
67
267
,471
-1
89,8
04
- 7
7,66
7 7
7,66
7 -
FCD
V13X
NSe
afoo
d qu
ality
& v
alue
-ad
7,7
80
- -
7,7
80
- -
7,7
80
7,7
80
- FC
FP48
XNSe
a Sa
fety
Pro
ject
s 9
,198
-
- 9
,198
-
- 9
,198
9
,198
-
FCFP
49XN
Fish
erie
s O
ffice
r Tra
inin
g 3
7,89
4 -
-37,
894
- -
- -
- -
FCFP
50XN
AusA
id E
xpor
ts 1
94,5
24
- 2
49,8
95
444
,419
-3
18,3
85
- 1
26,0
34
126
,034
-
FCFP
52XN
Tong
a de
mer
sal l
ine
proj
ect (
Niw
a) -
- -
- -2
6,47
5 -
-26,
475
- -2
6,47
5 FC
FP57
XND
evfis
h -
- -
- -4
1 -
-41
- -4
1 FC
FP65
XNLi
ve re
ef fi
sh 2
70,2
44
- 1
89,3
23
459
,567
-3
69,2
35
- 9
0,33
2 9
0,33
2 -
FCFP
72XN
CFP
Gen
eral
Pro
ject
s 6
3,27
1 -
393
6
3,66
4 -5
,422
-
58,
242
58,
242
- FC
FP73
XNC
oast
al C
limat
e C
hang
e Au
sAid
27,
374
- -
27,
374
- -
27,
374
27,
374
- FC
FP74
XNBl
dg C
lim R
esilie
nce
& C
oast
Res
Gov
Cap
acity
Fiji
387
,282
-
- 3
87,2
82
-59,
548
- 3
27,7
34
327
,734
-
FCFP
75XN
Bldg
Cap
acity
of T
okel
au C
oast
Fis
h M
anag
ers
38,
106
- -
38,
106
-6,7
28
- 3
1,37
8 3
1,37
8 -
FCFP
77XN
SPC
-IRD
Dep
loym
ent o
f Tem
pera
ture
Log
gers
-CC
12,
147
- -
12,
147
- -
12,
147
12,
147
- FC
FP78
XNC
FP N
ZAID
201
3 Al
loca
tion
64,
527
- -
64,
527
-64,
095
- 4
32
432
-
FCFP
79XN
AUSA
ID C
oast
al C
limat
e C
hang
e M
onito
ring
Phas
e II
-128
,483
-
284
,388
1
55,9
05
-168
,024
-
-12,
119
- -1
2,11
9 FC
FP81
XNFP
F C
onna
issa
nce
Cig
uate
ra d
ans
le P
acifi
que
- -
11,
933
11,
933
-781
-
11,
152
11,
152
- FC
FP82
XNN
ZAID
Kiri
bati
Sust
aina
ble
Coa
stal
Fis
herie
s Pg
m -
- 3
82,5
54
382
,554
-4
0,86
1 -
341
,693
3
41,6
93
- FC
FP83
XND
FAT
CBF
M W
orks
hop
Mar
ch 2
014
- -
245
,821
2
45,8
21
-17,
328
- 2
28,4
93
228
,493
-
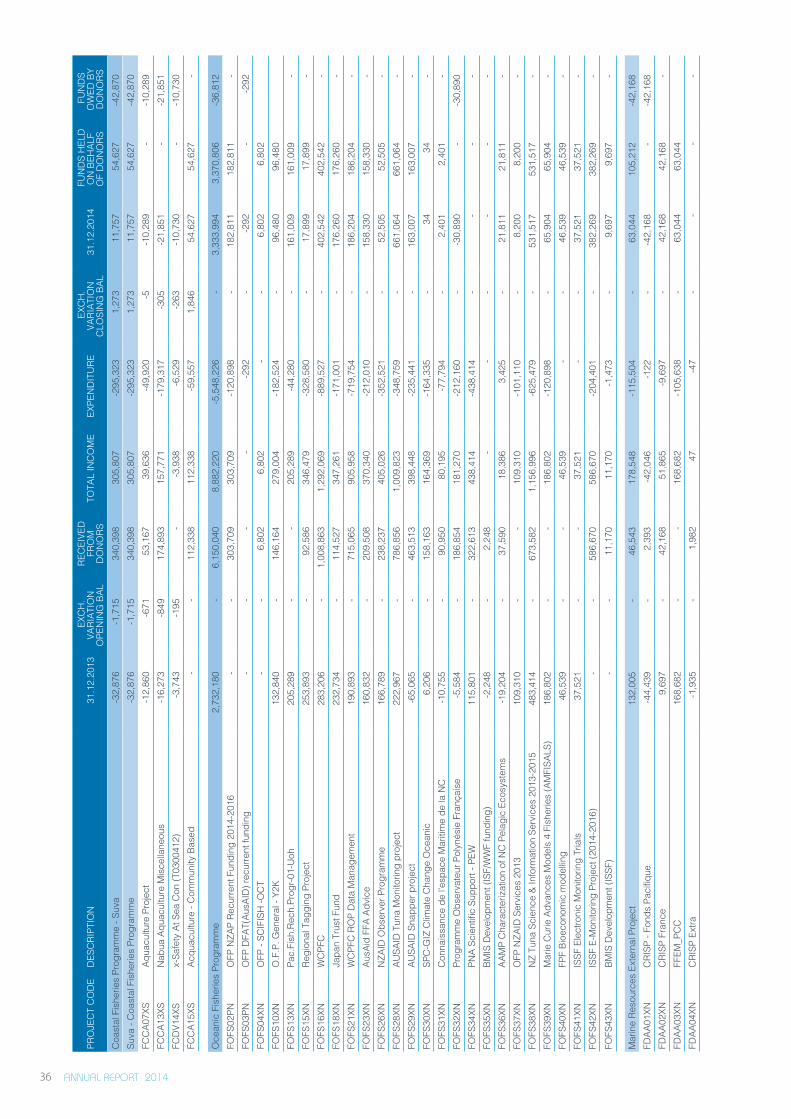
ANNUAL REPORT 2014 36
PRO
JEC
T C
OD
ED
ESC
RIPT
ION
31.
12.2
013
EXC
H.
VARI
ATIO
N
OPE
NIN
G B
AL
REC
EIVE
DFR
OM
DO
NO
RS T
OTA
L IN
CO
ME
EXPE
ND
ITU
RE
EXC
H.
VARI
ATIO
N
CLO
SIN
G B
AL 3
1.12
.201
4 F
UN
DS
HEL
D
ON
BEH
ALF
OF
DO
NO
RS
FU
ND
S O
WED
BY
DO
NO
RSC
oast
al F
ishe
ries
Prog
ram
me
- Suv
a-3
2,87
6 -1
,715
3
40,3
98
305
,807
-2
95,3
23
1,2
73
11,
757
54,
627
-42,
870
Suva
- C
oast
al F
ishe
ries
Prog
ram
me
-32,
876
-1,7
15
340
,398
3
05,8
07
-295
,323
1
,273
1
1,75
7 5
4,62
7 -4
2,87
0 FC
CA0
7XS
Aqua
cultu
re P
roje
ct-1
2,86
0 -6
71
53,
167
39,
636
-49,
920
-5
-10,
289
- -1
0,28
9 FC
CA1
3XS
Nab
ua A
quac
ultu
re M
isce
llane
ous
-16,
273
-849
1
74,8
93
157
,771
-1
79,3
17
-305
-2
1,85
1 -
-21,
851
FCD
V14X
Sx-
Safe
ty A
t Sea
Con
(T03
0041
2)-3
,743
-1
95
- -3
,938
-6
,529
-2
63
-10,
730
- -1
0,73
0 FC
CA1
5XS
Acqu
acul
ture
- C
omm
unity
Bas
ed -
- 1
12,3
38
112
,338
-5
9,55
7 1
,846
5
4,62
7 5
4,62
7 -
Oce
anic
Fis
herie
s Pr
ogra
mm
e 2
,732
,180
-
6,1
50,0
40
8,8
82,2
20
-5,5
48,2
26
- 3
,333
,994
3
,370
,806
-3
6,81
2 FO
FS02
PNO
FP N
ZAP
Recu
rrent
Fun
ding
201
4-20
16 -
- 3
03,7
09
303
,709
-1
20,8
98
- 1
82,8
11
182
,811
-
FOFS
03PN
OFP
DFA
T(Au
sAID
) rec
urre
nt fu
ndin
g -
- -
- -2
92
- -2
92
- -2
92
FOFS
04XN
OFP
- SC
IFIS
H -O
CT
- -
6,8
02
6,8
02
- -
6,8
02
6,8
02
FOFS
10XN
O.F
.P. G
ener
al -
Y2K
132
,840
-
146
,164
2
79,0
04
-182
,524
-
96,
480
96,
480
FOFS
13XN
Pac.
Fish
.Rec
h.Pr
ogr-0
1-U
oh 2
05,2
89
- -
205
,289
-4
4,28
0 -
161
,009
1
61,0
09
- FO
FS15
XNRe
gion
al T
aggi
ng P
roje
ct 2
53,8
93
- 9
2,58
6 3
46,4
79
-328
,580
-
17,
899
17,
899
- FO
FS16
XNW
CPF
C 2
83,2
06
- 1
,008
,863
1
,292
,069
-8
89,5
27
- 4
02,5
42
402
,542
-
FOFS
18XN
Japa
n Tr
ust F
und
232
,734
-
114
,527
3
47,2
61
-171
,001
-
176
,260
1
76,2
60
- FO
FS21
XNW
CPF
C R
OP
Dat
a M
anag
emen
t 1
90,8
93
- 7
15,0
65
905
,958
-7
19,7
54
- 1
86,2
04
186
,204
-
FOFS
23XN
AusA
id F
FA A
dvic
e 1
60,8
32
- 2
09,5
08
370
,340
-2
12,0
10
- 1
58,3
30
158
,330
-
FOFS
26XN
NZA
ID O
bser
ver P
rogr
amm
e 1
66,7
89
- 2
38,2
37
405
,026
-3
52,5
21
- 5
2,50
5 5
2,50
5 -
FOFS
28XN
AUSA
ID T
una
Mon
itorin
g pr
ojec
t 2
22,9
67
- 7
86,8
56
1,0
09,8
23
-348
,759
-
661
,064
6
61,0
64
- FO
FS29
XNAU
SAID
Sna
pper
pro
ject
-65,
065
- 4
63,5
13
398
,448
-2
35,4
41
- 1
63,0
07
163
,007
-
FOFS
30XN
SPC
-GIZ
Clim
ate
Cha
nge
Oce
anic
6,2
06
- 1
58,1
63
164
,369
-1
64,3
35
- 3
4 3
4 -
FOFS
31XN
Con
nais
sanc
e de
l'es
pace
Mar
itim
e de
la N
C-1
0,75
5 -
90,
950
80,
195
-77,
794
- 2
,401
2
,401
-
FOFS
32XN
Prog
ram
me
Obs
erva
teur
Pol
ynés
ie F
ranç
aise
-5,5
84
- 1
86,8
54
181
,270
-2
12,1
60
- -3
0,89
0 -
-30,
890
FOFS
34XN
PNA
Scie
ntifi
c Su
ppor
t - P
EW 1
15,8
01
- 3
22,6
13
438
,414
-4
38,4
14
- -
- -
FOFS
35XN
BMIS
Dev
elop
men
t (IS
F/W
WF
fund
ing)
-2,2
48
- 2
,248
-
- -
- -
- FO
FS36
XNAA
MP
Cha
ract
eriz
atio
n of
NC
Pel
agic
Eco
syst
ems
-19,
204
- 3
7,59
0 1
8,38
6 3
,425
-
21,
811
21,
811
- FO
FS37
XNO
FP N
ZAID
Ser
vice
s 20
13 1
09,3
10
- -
109
,310
-1
01,1
10
- 8
,200
8
,200
-
FOFS
38XN
NZ
Tuna
Sci
ence
& In
form
atio
n Se
rvic
es 2
013-
2015
483
,414
-
673
,582
1
,156
,996
-6
25,4
79
- 5
31,5
17
531
,517
-
FOFS
39XN
Mar
ie C
urie
Adv
ance
s M
odel
s 4
Fish
erie
s (A
MFI
SALS
) 1
86,8
02
- -
186
,802
-1
20,8
98
- 6
5,90
4 6
5,90
4 -
FOFS
40XN
FPF
Bioe
cono
mic
mod
ellin
g 4
6,53
9 -
- 4
6,53
9 -
- 4
6,53
9 4
6,53
9 -
FOFS
41XN
ISSF
Ele
ctro
nic
Mon
itorin
g Tr
ials
37,
521
- -
37,
521
- -
37,
521
37,
521
- FO
FS42
XNIS
SF E
-Mon
itorin
g Pr
ojec
t (20
14-2
016)
- -
586
,670
5
86,6
70
-204
,401
-
382
,269
3
82,2
69
- FO
FS43
XNBM
IS D
evel
opm
ent (
ISSF
) -
- 1
1,17
0 1
1,17
0 -1
,473
-
9,6
97
9,6
97
-
Mar
ine
Reso
urce
s Ex
tern
al P
roje
ct 1
32,0
05
- 4
6,54
3 1
78,5
48
-115
,504
-
63,
044
105
,212
-4
2,16
8 FD
AA01
XNC
RISP
- Fo
nds
Paci
fique
-44,
439
- 2
,393
-4
2,04
6 -1
22
- -4
2,16
8 -
-42,
168
FDAA
02XN
CRI
SP F
ranc
e 9
,697
-
42,
168
51,
865
-9,6
97
- 4
2,16
8 4
2,16
8 -
FDAA
03XN
FFEM
_PC
C 1
68,6
82
- -
168
,682
-1
05,6
38
- 6
3,04
4 6
3,04
4 FD
AA04
XNC
RISP
Ext
ra-1
,935
-
1,9
82
47
-47
- -
- -
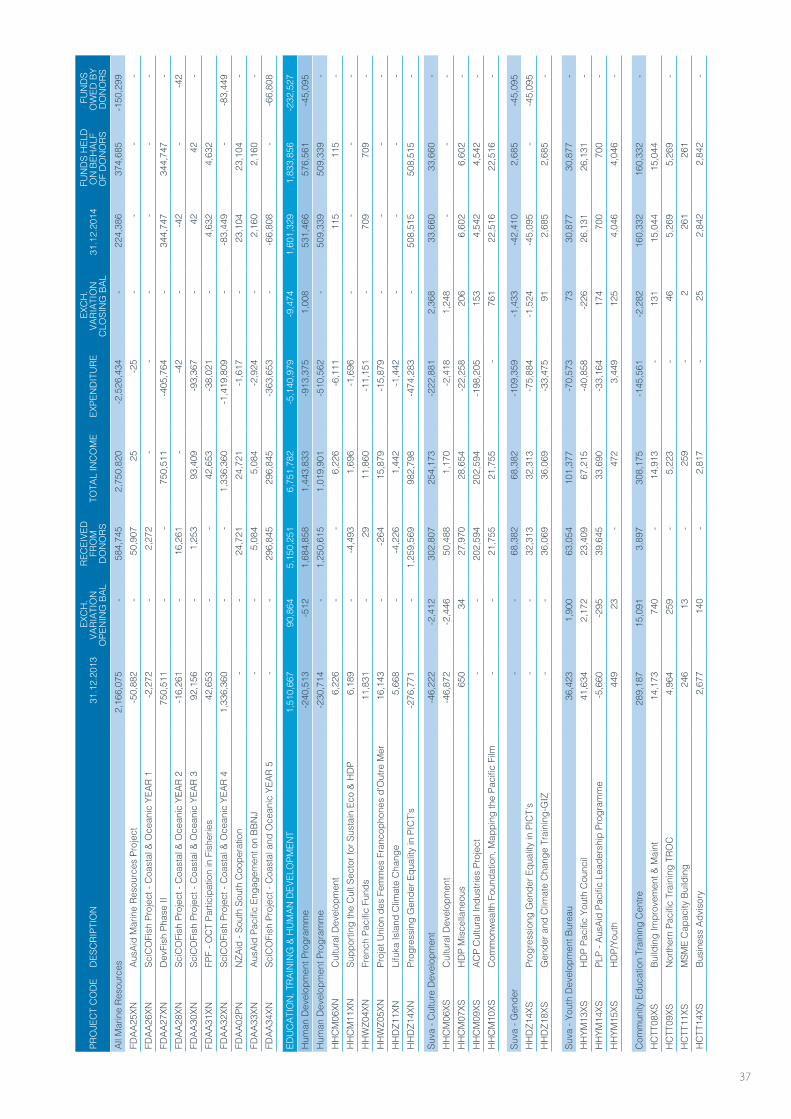
ANNUAL REPORT 2014 37
PRO
JEC
T C
OD
ED
ESC
RIPT
ION
31.
12.2
013
EXC
H.
VARI
ATIO
N
OPE
NIN
G B
AL
REC
EIVE
DFR
OM
DO
NO
RS T
OTA
L IN
CO
ME
EXPE
ND
ITU
RE
EXC
H.
VARI
ATIO
N
CLO
SIN
G B
AL 3
1.12
.201
4 F
UN
DS
HEL
D
ON
BEH
ALF
OF
DO
NO
RS
FU
ND
S O
WED
BY
DO
NO
RSAl
l Mar
ine
Reso
urce
s 2
,166
,075
-
584
,745
2
,750
,820
-2
,526
,434
-
224
,386
3
74,6
85
-150
,299
FD
AA25
XNAu
sAid
Mar
ine
Reso
urce
s Pr
ojec
t-5
0,88
2 -
50,
907
25
-25
- -
- -
FDAA
26XN
SciC
OFi
sh P
roje
ct -
Coa
stal
& O
cean
ic Y
EAR
1-2
,272
-
2,2
72
- -
- -
- -
FDAA
27XN
Dev
Fish
Pha
se II
750
,511
-
- 7
50,5
11
-405
,764
-
344
,747
3
44,7
47
- FD
AA28
XNSc
iCO
Fish
Pro
ject
- C
oast
al &
Oce
anic
YEA
R 2
-16,
261
- 1
6,26
1 -
-42
- -4
2 -
-42
FDAA
30XN
SciC
OFi
sh P
roje
ct -
Coa
stal
& O
cean
ic Y
EAR
3 9
2,15
6 -
1,2
53
93,
409
-93,
367
- 4
2 4
2 -
FDAA
31XN
FPF
- OC
T Pa
rtici
patio
n in
Fis
herie
s 4
2,65
3 -
- 4
2,65
3 -3
8,02
1 -
4,6
32
4,6
32
FDAA
32XN
SciC
OFi
sh P
roje
ct -
Coa
stal
& O
cean
ic Y
EAR
4 1
,336
,360
-
- 1
,336
,360
-1
,419
,809
-
-83,
449
- -8
3,44
9 FD
AA02
PNN
ZAid
- So
uth
Sout
h C
oope
ratio
n -
- 2
4,72
1 2
4,72
1 -1
,617
-
23,
104
23,
104
- FD
AA33
XNAu
sAid
Pac
ific
Enga
gem
ent o
n BB
NJ
- -
5,0
84
5,0
84
-2,9
24
- 2
,160
2
,160
-
FDAA
34XN
SciC
OFi
sh P
roje
ct -
Coa
stal
and
Oce
anic
YEA
R 5
- -
296
,845
2
96,8
45
-363
,653
-
-66,
808
- -6
6,80
8
EDU
CAT
ION
, TRA
ININ
G &
HU
MAN
DEV
ELO
PMEN
T 1
,510
,667
9
0,86
4 5
,150
,251
6
,751
,782
-5
,140
,979
-9
,474
1
,601
,329
1
,833
,856
-2
32,5
27
Hum
an D
evel
opm
ent P
rogr
amm
e-2
40,5
13
-512
1
,684
,858
1
,443
,833
-9
13,3
75
1,0
08
531
,466
5
76,5
61
-45,
095
Hum
an D
evel
opm
ent P
rogr
amm
e-2
30,7
14
- 1
,250
,615
1
,019
,901
-5
10,5
62
- 5
09,3
39
509
,339
-
HH
CM
06XN
Cul
tura
l Dev
elop
men
t 6
,226
-
- 6
,226
-6
,111
1
15
115
-
HH
CM
11XN
Supp
ortin
g th
e C
ult S
ecto
r for
Sus
tain
Eco
& H
DP
6,1
89
- -4
,493
1
,696
-1
,696
-
- -
- H
HW
Z04X
NFr
ench
Pac
ific
Fund
s 1
1,83
1 -
29
11,
860
-11,
151
- 7
09
709
-
HH
WZ0
5XN
Proj
et U
nion
des
Fem
mes
Fra
ncop
hone
s d'
Out
re M
er 1
6,14
3 -
-264
1
5,87
9 -1
5,87
9 -
- -
- H
HD
Z11X
NLi
fuka
Isla
nd C
limat
e C
hang
e 5
,668
-
-4,2
26
1,4
42
-1,4
42
- -
- -
HH
DZ1
4XN
Prog
ress
ing
Gen
der E
qual
ity in
PIC
T's
-276
,771
-
1,2
59,5
69
982
,798
-4
74,2
83
- 5
08,5
15
508
,515
-
Suva
- C
ultu
re D
evel
opm
ent
-46,
222
-2,4
12
302
,807
2
54,1
73
-222
,881
2
,368
3
3,66
0 3
3,66
0 -
HH
CM
06XS
Cul
tura
l Dev
elop
men
t-4
6,87
2 -2
,446
5
0,48
8 1
,170
-2
,418
1
,248
-
- -
HH
CM
07XS
HD
P M
isce
llane
ous
650
3
4 2
7,97
0 2
8,65
4 -2
2,25
8 2
06
6,6
02
6,6
02
- H
HC
M09
XSAC
P C
ultu
ral I
ndus
tries
Pro
ject
- -
202
,594
2
02,5
94
-198
,205
1
53
4,5
42
4,5
42
- H
HC
M10
XSC
omm
onw
ealth
Fou
ndat
ion,
Map
ping
the
Paci
fic F
ilm -
- 2
1,75
5 2
1,75
5 -
761
2
2,51
6 2
2,51
6 -
Suva
- G
ende
r -
- 6
8,38
2 6
8,38
2 -1
09,3
59
-1,4
33
-42,
410
2,6
85
-45,
095
HH
DZ1
4XS
Prog
ress
iong
Gen
der E
qual
ity in
PIC
T's
- -
32,
313
32,
313
-75,
884
-1,5
24
-45,
095
- -4
5,09
5 H
HD
Z18X
SG
ende
r and
Clim
ate
Cha
nge
Trai
ning
-GIZ
- -
36,
069
36,
069
-33,
475
91
2,6
85
2,6
85
-
Suva
- Yo
uth
Dev
elop
men
t Bur
eau
36,
423
1,9
00
63,
054
101
,377
-7
0,57
3 7
3 3
0,87
7 3
0,87
7 -
HH
YM13
XSH
DP
Paci
fic Y
outh
Cou
ncil
41,
634
2,1
72
23,
409
67,
215
-40,
858
-226
2
6,13
1 2
6,13
1 -
HH
YM14
XSPL
P - A
usAi
d Pa
cific
Lea
ders
hip
Prog
ram
me
-5,6
60
-295
3
9,64
5 3
3,69
0 -3
3,16
4 1
74
700
7
00
- H
HYM
15XS
HD
P/Yo
uth
449
2
3 -
472
3
,449
1
25
4,0
46
4,0
46
-
Com
mun
ity E
duca
tion
Trai
ning
Cen
tre 2
89,1
87
15,
091
3,8
97
308
,175
-1
45,5
61
-2,2
82
160
,332
1
60,3
32
- H
CTT
08XS
Build
ing
Impr
ovem
ent &
Mai
nt 1
4,17
3 7
40
- 1
4,91
3 -
131
1
5,04
4 1
5,04
4 H
CTT
09XS
Nor
ther
n Pa
cific
Tra
inin
g TR
OC
4,9
64
259
-
5,2
23
- 4
6 5
,269
5
,269
-
HC
TT11
XSM
SME
Cap
acity
Bui
ldin
g 2
46
13
- 2
59
- 2
2
61
261
H
CTT
14XS
Busi
ness
Adv
isor
y 2
,677
1
40
- 2
,817
-
25
2,8
42
2,8
42
-
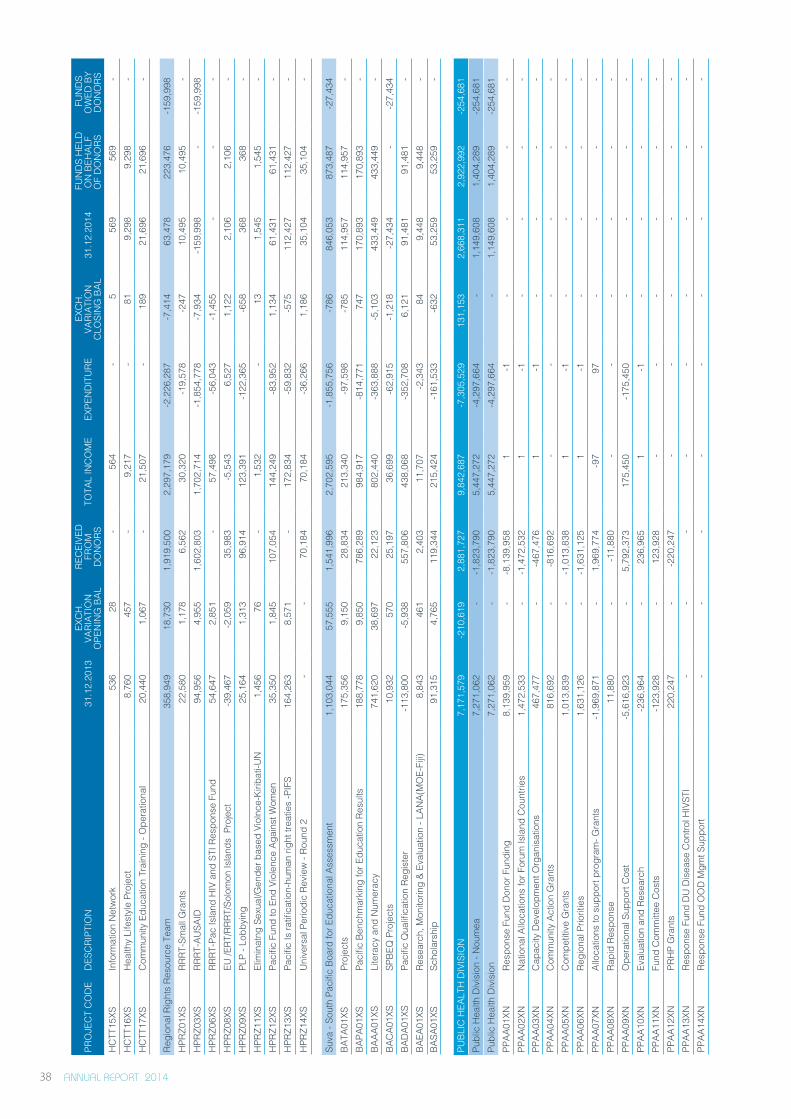
ANNUAL REPORT 2014 38
PRO
JEC
T C
OD
ED
ESC
RIPT
ION
31.
12.2
013
EXC
H.
VARI
ATIO
N
OPE
NIN
G B
AL
REC
EIVE
DFR
OM
DO
NO
RS T
OTA
L IN
CO
ME
EXPE
ND
ITU
RE
EXC
H.
VARI
ATIO
N
CLO
SIN
G B
AL 3
1.12
.201
4 F
UN
DS
HEL
D
ON
BEH
ALF
OF
DO
NO
RS
FU
ND
S O
WED
BY
DO
NO
RSH
CTT
15XS
Info
rmat
ion
Net
wor
k 5
36
28
- 5
64
- 5
5
69
569
-
HC
TT16
XSH
ealth
y Li
fest
yle
Proj
ect
8,7
60
457
-
9,2
17
- 8
1 9
,298
9
,298
-
HC
TT17
XSC
omm
unity
Edu
catio
n Tr
aini
ng -
Ope
ratio
nal
20,
440
1,0
67
- 2
1,50
7 -
189
2
1,69
6 2
1,69
6 -
Regi
onal
Rig
hts
Reso
urce
Tea
m 3
58,9
49
18,
730
1,9
19,5
00
2,2
97,1
79
-2,2
26,2
87
-7,4
14
63,
478
223
,476
-1
59,9
98
HPR
Z01X
SRR
RT-S
mal
l Gra
nts
22,
580
1,1
78
6,5
62
30,
320
-19,
578
-247
1
0,49
5 1
0,49
5 -
HPR
Z03X
SRR
RT-A
USA
ID 9
4,95
6 4
,955
1
,602
,803
1
,702
,714
-1
,854
,778
-7
,934
-1
59,9
98
- -1
59,9
98
HPR
Z06X
SRR
RT-P
ac Is
land
HIV
and
STI
Res
pons
e Fu
nd 5
4,64
7 2
,851
-
57,
498
-56,
043
-1,4
55
- -
- H
PRZ0
8XS
EU /E
RT/R
RRT/
Solo
mon
Isla
nds
Pro
ject
-39,
467
-2,0
59
35,
983
-5,5
43
6,5
27
1,1
22
2,1
06
2,1
06
- H
PRZ0
9XS
PLP
- Lob
byin
g 2
5,16
4 1
,313
9
6,91
4 1
23,3
91
-122
,365
-6
58
368
3
68
- H
PRZ1
1XS
Elim
inat
ng S
exua
l/Gen
der b
ased
Vio
lnce
-Kiri
bati-
UN
1,4
56
76
- 1
,532
-
13
1,5
45
1,5
45
- H
PRZ1
2XS
Paci
fic F
und
to E
nd V
iole
nce
Agai
nst W
omen
35,
350
1,8
45
107
,054
1
44,2
49
-83,
952
1,1
34
61,
431
61,
431
- H
PRZ1
3XS
Paci
fic Is
ratifi
catio
n-hu
man
righ
t tre
atie
s -P
IFS
164
,263
8
,571
-
172
,834
-5
9,83
2 -5
75
112
,427
1
12,4
27
- H
PRZ1
4XS
Uni
vers
al P
erio
dic
Revi
ew -
Roun
d 2
- -
70,
184
70,
184
-36,
266
1,1
86
35,
104
35,
104
-
Suva
- So
uth
Paci
fic B
oard
for E
duca
tiona
l Ass
essm
ent
1,1
03,0
44
57,
555
1,5
41,9
96
2,7
02,5
95
-1,8
55,7
56
-786
8
46,0
53
873
,487
-2
7,43
4 BA
TA01
XSPr
ojec
ts 1
75,3
56
9,1
50
28,
834
213
,340
-9
7,59
8 -7
85
114
,957
1
14,9
57
- BA
PA01
XSPa
cific
Ben
chm
arki
ng fo
r Edu
catio
n Re
sults
188
,778
9
,850
7
86,2
89
984
,917
-8
14,7
71
747
1
70,8
93
170
,893
-
BAAA
01XS
Lite
racy
and
Num
erac
y 7
41,6
20
38,
697
22,
123
802
,440
-3
63,8
88
-5,1
03
433
,449
4
33,4
49
- BA
CA0
1XS
SPBE
Q P
roje
cts
10,
932
570
2
5,19
7 3
6,69
9 -6
2,91
5 -1
,218
-2
7,43
4 -
-27,
434
BAD
A01X
SPa
cific
Qua
lifica
tion
Regi
ster
-113
,800
-5
,938
5
57,8
06
438
,068
-3
52,7
08
6,1
21
91,
481
91,
481
- BA
EA01
XSRe
sear
ch, M
onito
ring
& Ev
alua
tion
- LAN
A(M
OE-
Fiji)
8,8
43
461
2
,403
1
1,70
7 -2
,343
8
4 9
,448
9
,448
-
BASA
01XS
Scho
lars
hip
91,
315
4,7
65
119
,344
2
15,4
24
-161
,533
-6
32
53,
259
53,
259
-
PUBL
IC H
EALT
H D
IVIS
ION
7,1
71,5
79
-210
,619
2
,881
,727
9
,842
,687
-7
,305
,529
1
31,1
53
2,6
68,3
11
2,9
22,9
92
-254
,681
Pu
blic
Hea
lth D
ivis
ion
- Nou
mea
7,2
71,0
62
- -1
,823
,790
5
,447
,272
-4
,297
,664
-
1,1
49,6
08
1,4
04,2
89
-254
,681
Pu
blic
Hea
lth D
ivis
ion
7,2
71,0
62
- -1
,823
,790
5
,447
,272
-4
,297
,664
-
1,1
49,6
08
1,4
04,2
89
-254
,681
PP
AA01
XNRe
spon
se F
und
Don
or F
undi
ng 8
,139
,959
-
-8,1
39,9
58
1
-1
- -
- -
PPAA
02XN
Nat
iona
l Allo
catio
ns fo
r For
um Is
land
Cou
ntrie
s 1
,472
,533
-
-1,4
72,5
32
1
-1
- -
- -
PPAA
03XN
Cap
acity
Dev
elop
men
t Org
anis
atio
ns 4
67,4
77
- -4
67,4
76
1
-1
- -
- -
PPAA
04XN
Com
mun
ity A
ctio
n G
rant
s 8
16,6
92
- -8
16,6
92
- -
- -
- -
PPAA
05XN
Com
petit
ive
Gra
nts
1,0
13,8
39
- -1
,013
,838
1
-1
-
- -
- PP
AA06
XNRe
gion
al P
riorit
ies
1,6
31,1
26
- -1
,631
,125
1
-1
-
- -
- PP
AA07
XNAl
loca
tions
to s
uppo
rt pr
ogra
m- G
rant
s-1
,969
,871
-
1,9
69,7
74
-97
97
- -
- -
PPAA
08XN
Rapi
d Re
spon
se 1
1,88
0 -
-11,
880
- -
- -
- -
PPAA
09XN
Ope
ratio
nal S
uppo
rt C
ost
-5,6
16,9
23
- 5
,792
,373
1
75,4
50
-175
,450
-
- -
- PP
AA10
XNEv
alua
tion
and
Rese
arch
-236
,964
-
236
,965
1
-1
-
- -
- PP
AA11
XNFu
nd C
omm
ittee
Cos
ts-1
23,9
28
- 1
23,9
28
- -
- -
- -
PPAA
12XN
PRH
P G
rant
s 2
20,2
47
- -2
20,2
47
- -
- -
- -
PPAA
13XN
Resp
onse
Fun
d D
U D
isea
se C
ontro
l HIV
STI
- -
- -
- -
- -
- PP
AA14
XNRe
spon
se F
und
OO
D M
gmt S
uppo
rt -
- -
- -
- -
- -
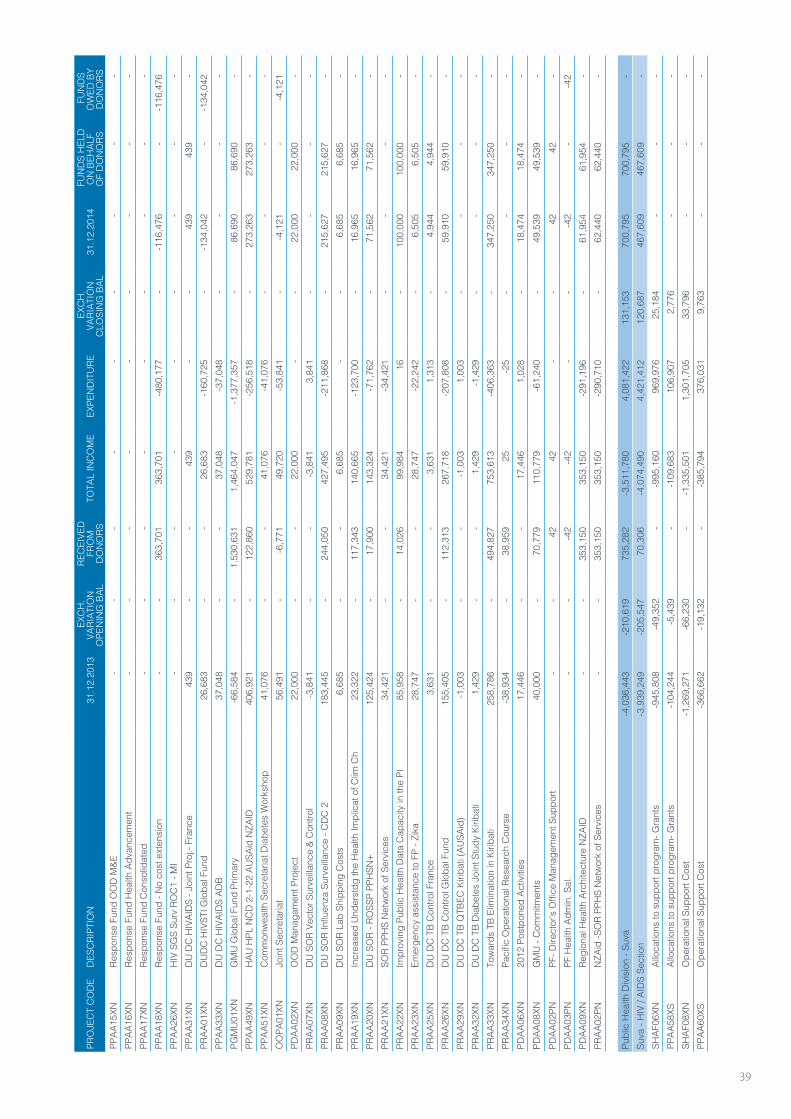
ANNUAL REPORT 2014 39
PRO
JEC
T C
OD
ED
ESC
RIPT
ION
31.
12.2
013
EXC
H.
VARI
ATIO
N
OPE
NIN
G B
AL
REC
EIVE
DFR
OM
DO
NO
RS T
OTA
L IN
CO
ME
EXPE
ND
ITU
RE
EXC
H.
VARI
ATIO
N
CLO
SIN
G B
AL 3
1.12
.201
4 F
UN
DS
HEL
D
ON
BEH
ALF
OF
DO
NO
RS
FU
ND
S O
WED
BY
DO
NO
RSPP
AA15
XNRe
spon
se F
und
OO
D M
&E -
- -
- -
- -
- -
PPAA
16XN
Resp
onse
Fun
d H
ealth
Adv
ance
men
t -
- -
- -
- -
- -
PPAA
17XN
Resp
onse
Fun
d C
onso
lidat
ed -
- -
- -
- -
- -
PPAA
18XN
Resp
onse
Fun
d - N
o co
st e
xten
sion
- -
363
,701
3
63,7
01
-480
,177
-
-116
,476
-
-116
,476
PP
AA26
XNH
IV S
GS
Surv
RO
C1
- MI
- -
- -
- -
- -
- PP
AA31
XND
U D
C H
IVAI
DS
- Joi
nt P
roj.-
Fra
nce
439
-
- 4
39
- -
439
4
39
- PR
AA01
XND
UD
C H
IVST
I Glo
bal F
und
26,
683
- -
26,
683
-160
,725
-
-134
,042
-
-134
,042
PP
AA33
XND
U D
C H
IVAI
DS
ADB
37,
048
- -
37,
048
-37,
048
- -
- -
PGM
U01
XNG
MU
Glo
bal F
und
Prim
ary
-66,
584
- 1
,530
,631
1
,464
,047
-1
,377
,357
-
86,
690
86,
690
- PP
AA49
XNH
AU H
PL N
CD
2-1
-22
AUSA
id N
ZAID
406
,921
-
122
,860
5
29,7
81
-256
,518
-
273
,263
2
73,2
63
- PP
AA51
XNC
omm
onw
ealth
Sec
reta
riat D
iabe
tes
Wor
ksho
p 4
1,07
6 -
- 4
1,07
6 -4
1,07
6 -
- -
- O
OPA
01XN
Join
t Sec
reta
riat
56,
491
- -6
,771
4
9,72
0 -5
3,84
1 -
-4,1
21
- -4
,121
PD
AA02
XNO
OD
Man
agam
ent P
roje
ct 2
2,00
0 -
- 2
2,00
0 -
- 2
2,00
0 2
2,00
0 -
PRAA
07XN
DU
SO
R Ve
ctor
Sur
veilla
nce
& C
ontro
l-3
,841
-
- -3
,841
3
,841
-
- -
- PR
AA08
XND
U S
OR
Influ
enza
Sur
veilla
nce
- CD
C 2
183
,445
-
244
,050
4
27,4
95
-211
,868
-
215
,627
2
15,6
27
- PR
AA09
XND
U S
OR
Lab
Ship
ping
Cos
ts 6
,685
-
- 6
,685
-
- 6
,685
6
,685
-
PRAA
19XN
Incr
ease
d U
nder
stdg
the
Hea
lth Im
plic
at o
f Clim
Ch
23,
322
- 1
17,3
43
140
,665
-1
23,7
00
- 1
6,96
5 1
6,96
5 -
PRAA
20XN
DU
SO
R - R
OSS
P PP
HSN
+ 1
25,4
24
- 1
7,90
0 1
43,3
24
-71,
762
- 7
1,56
2 7
1,56
2 -
PRAA
21XN
SOR
PPH
S N
etw
ork
of S
ervi
ces
34,
421
- -
34,
421
-34,
421
- -
- -
PRAA
22XN
Impr
ovin
g Pu
blic
Hea
lth D
ata
Cap
acity
in th
e PI
85,
958
- 1
4,02
6 9
9,98
4 1
6 -
100
,000
1
00,0
00
- PR
AA23
XNEm
erge
ncy
assi
stan
ce to
FP
- Zik
a 2
8,74
7 -
- 2
8,74
7 -2
2,24
2 -
6,5
05
6,5
05
- PR
AA25
XND
U D
C T
B C
ontro
l Fra
nce
3,6
31
- -
3,6
31
1,3
13
- 4
,944
4
,944
-
PRAA
26XN
DU
DC
TB
Con
trol G
loba
l Fun
d 1
55,4
05
- 1
12,3
13
267
,718
-2
07,8
08
- 5
9,91
0 5
9,91
0 -
PRAA
29XN
DU
DC
TB
QTB
EC K
iriba
ti (A
USA
id)
-1,0
03
- -
-1,0
03
1,0
03
- -
- -
PRAA
32XN
DU
DC
TB
Dia
bete
s Jo
int S
tudy
Kiri
bati
1,4
29
- -
1,4
29
-1,4
29
- -
- -
PRAA
33XN
Tow
ards
TB
Elim
inat
ion
in K
iriba
ti 2
58,7
86
- 4
94,8
27
753
,613
-4
06,3
63
- 3
47,2
50
347
,250
-
PRAA
34XN
Paci
fic O
pera
tiona
l Res
earc
h C
ours
e-3
8,93
4 -
38,
959
25
-25
- -
- -
PDAA
06XN
2012
Pos
tpon
ed A
ctiv
ities
17,
446
- -
17,
446
1,0
28
- 1
8,47
4 1
8,47
4 -
PDAA
08XN
GM
U -
Com
mitm
ents
40,
000
- 7
0,77
9 1
10,7
79
-61,
240
- 4
9,53
9 4
9,53
9 -
PDAA
02PN
PF- D
irect
or's
Offi
ce M
anag
emen
t Sup
port
- -
42
42
- -
42
42
- PD
AA03
PNPF
Hea
lth A
dmin
. Sal
. -
- -4
2 -4
2 -
- -4
2 -
-42
PDAA
09XN
Regi
onal
Hea
lth A
rchi
tect
ure
NZA
ID -
- 3
53,1
50
353
,150
-2
91,1
96
- 6
1,95
4 6
1,95
4 -
PRAA
02PN
NZA
id -S
OR
PPH
S N
etw
ork
of S
ervi
ces
- -
353
,150
3
53,1
50
-290
,710
-
62,
440
62,
440
-
Publ
ic H
ealth
Div
isio
n - S
uva
-4,0
36,4
43
-210
,619
7
35,2
82
-3,5
11,7
80
4,0
81,4
22
131
,153
7
00,7
95
700
,795
-
Suva
- H
IV /
AID
S Se
ctio
n-3
,939
,249
-2
05,5
47
70,
306
-4,0
74,4
90
4,4
21,4
12
120
,687
4
67,6
09
467
,609
-
SHAF
06XN
Allo
catio
ns to
sup
port
prog
ram
- Gra
nts
-945
,808
-4
9,35
2 -
-995
,160
9
69,9
76
25,
184
- -
- PP
AA58
XSAl
loca
tions
to s
uppo
rt pr
ogra
m- G
rant
s-1
04,2
44
-5,4
39
- -1
09,6
83
106
,907
2
,776
-
- -
SHAF
08XN
Ope
ratio
nal S
uppo
rt C
ost
-1,2
69,2
71
-66,
230
- -1
,335
,501
1
,301
,705
3
3,79
6 -
- -
PPAA
60XS
Ope
ratio
nal S
uppo
rt C
ost
-366
,662
-1
9,13
2 -
-385
,794
3
76,0
31
9,7
63
- -
-
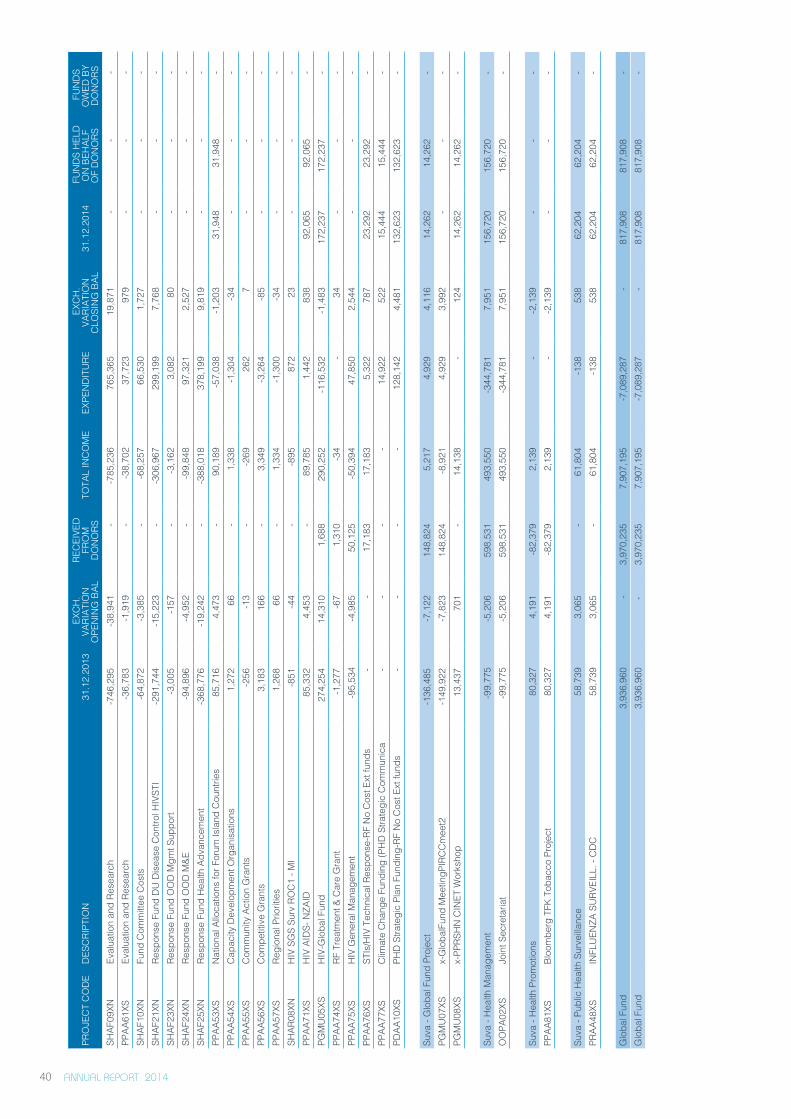
ANNUAL REPORT 2014 40
PRO
JEC
T C
OD
ED
ESC
RIPT
ION
31.
12.2
013
EXC
H.
VARI
ATIO
N
OPE
NIN
G B
AL
REC
EIVE
DFR
OM
DO
NO
RS T
OTA
L IN
CO
ME
EXPE
ND
ITU
RE
EXC
H.
VARI
ATIO
N
CLO
SIN
G B
AL 3
1.12
.201
4 F
UN
DS
HEL
D
ON
BEH
ALF
OF
DO
NO
RS
FU
ND
S O
WED
BY
DO
NO
RSSH
AF09
XNEv
alua
tion
and
Rese
arch
-746
,295
-3
8,94
1 -
-785
,236
7
65,3
65
19,
871
- -
- PP
AA61
XSEv
alua
tion
and
Rese
arch
-36,
783
-1,9
19
- -3
8,70
2 3
7,72
3 9
79
- -
- SH
AF10
XNFu
nd C
omm
ittee
Cos
ts-6
4,87
2 -3
,385
-
-68,
257
66,
530
1,7
27
- -
- SH
AF21
XNRe
spon
se F
und
DU
Dis
ease
Con
trol H
IVST
I-2
91,7
44
-15,
223
- -3
06,9
67
299
,199
7
,768
-
- -
SHAF
23XN
Resp
onse
Fun
d O
OD
Mgm
t Sup
port
-3,0
05
-157
-
-3,1
62
3,0
82
80
- -
- SH
AF24
XNRe
spon
se F
und
OO
D M
&E-9
4,89
6 -4
,952
-
-99,
848
97,
321
2,5
27
- -
- SH
AF25
XNRe
spon
se F
und
Hea
lth A
dvan
cem
ent
-368
,776
-1
9,24
2 -
-388
,018
3
78,1
99
9,8
19
- -
- PP
AA53
XSN
atio
nal A
lloca
tions
for F
orum
Isla
nd C
ount
ries
85,
716
4,4
73
- 9
0,18
9 -5
7,03
8 -1
,203
3
1,94
8 3
1,94
8 -
PPAA
54XS
Cap
acity
Dev
elop
men
t Org
anis
atio
ns 1
,272
6
6 -
1,3
38
-1,3
04
-34
- -
- PP
AA55
XSC
omm
unity
Act
ion
Gra
nts
-256
-1
3 -
-269
2
62
7
- -
- PP
AA56
XSC
ompe
titiv
e G
rant
s 3
,183
1
66
- 3
,349
-3
,264
-8
5 -
- -
PPAA
57XS
Regi
onal
Prio
ritie
s 1
,268
6
6 -
1,3
34
-1,3
00
-34
- -
- SH
AR08
XNH
IV S
GS
Surv
RO
C1
- MI
-851
-4
4 -
-895
8
72
23
- -
- PP
AA71
XSH
IV A
IDS-
NZA
ID 8
5,33
2 4
,453
-
89,
785
1,4
42
838
9
2,06
5 9
2,06
5 -
PGM
U05
XSH
IV-G
loba
l Fun
d 2
74,2
54
14,
310
1,6
88
290
,252
-1
16,5
32
-1,4
83
172
,237
1
72,2
37
- PP
AA74
XSRF
Tre
atm
ent &
Car
e G
rant
-1,2
77
-67
1,3
10
-34
- 3
4 -
- -
PPAA
75XS
HIV
Gen
eral
Man
agem
ent
-95,
534
-4,9
85
50,
125
-50,
394
47,
850
2,5
44
- -
- PP
AA76
XSST
Is/H
IV T
echn
ical
Res
pons
e-RF
No
Cos
t Ext
fund
s -
- 1
7,18
3 1
7,18
3 5
,322
7
87
23,
292
23,
292
- PP
AA77
XSC
limat
e C
hang
e Fu
ndin
g (P
HD
Stra
tegi
c C
omm
unic
a -
- -
- 1
4,92
2 5
22
15,
444
15,
444
- PD
AA10
XSPH
D S
trate
gic
Plan
Fun
ding
-RF
No
Cos
t Ext
fund
s -
- -
- 1
28,1
42
4,4
81
132
,623
1
32,6
23
-
Suva
- G
loba
l Fun
d Pr
ojec
t-1
36,4
85
-7,1
22
148
,824
5
,217
4
,929
4
,116
1
4,26
2 1
4,26
2 -
PGM
U07
XSx-
Glo
balF
und
Mee
tingP
IRC
Cm
eet2
-149
,922
-7
,823
1
48,8
24
-8,9
21
4,9
29
3,9
92
- -
- PG
MU
08XS
x-PP
RSH
N C
INET
Wor
ksho
p 1
3,43
7 7
01
- 1
4,13
8 -
124
1
4,26
2 1
4,26
2 -
Suva
- H
ealth
Man
agem
ent
-99,
775
-5,2
06
598
,531
4
93,5
50
-344
,781
7
,951
1
56,7
20
156
,720
-
OO
PA02
XSJo
int S
ecre
taria
t-9
9,77
5 -5
,206
5
98,5
31
493
,550
-3
44,7
81
7,9
51
156
,720
1
56,7
20
-
Suva
- H
ealth
Pro
mot
ions
80,
327
4,1
91
-82,
379
2,1
39
- -2
,139
-
- -
PPAA
81XS
Bloo
mbe
rg T
FK T
obac
co P
roje
ct 8
0,32
7 4
,191
-8
2,37
9 2
,139
-
-2,1
39
- -
-
Suva
- Pu
blic
Hea
lth S
urve
illanc
e 5
8,73
9 3
,065
-
61,
804
-138
5
38
62,
204
62,
204
- PR
AA48
XSIN
FLU
ENZA
SU
RVEI
LL. -
CD
C 5
8,73
9 3
,065
-
61,
804
-138
5
38
62,
204
62,
204
-
Glo
bal F
und
3,9
36,9
60
- 3
,970
,235
7
,907
,195
-7
,089
,287
-
817
,908
8
17,9
08
- G
loba
l Fun
d 3
,936
,960
-
3,9
70,2
35
7,9
07,1
95
-7,0
89,2
87
- 8
17,9
08
817
,908
-
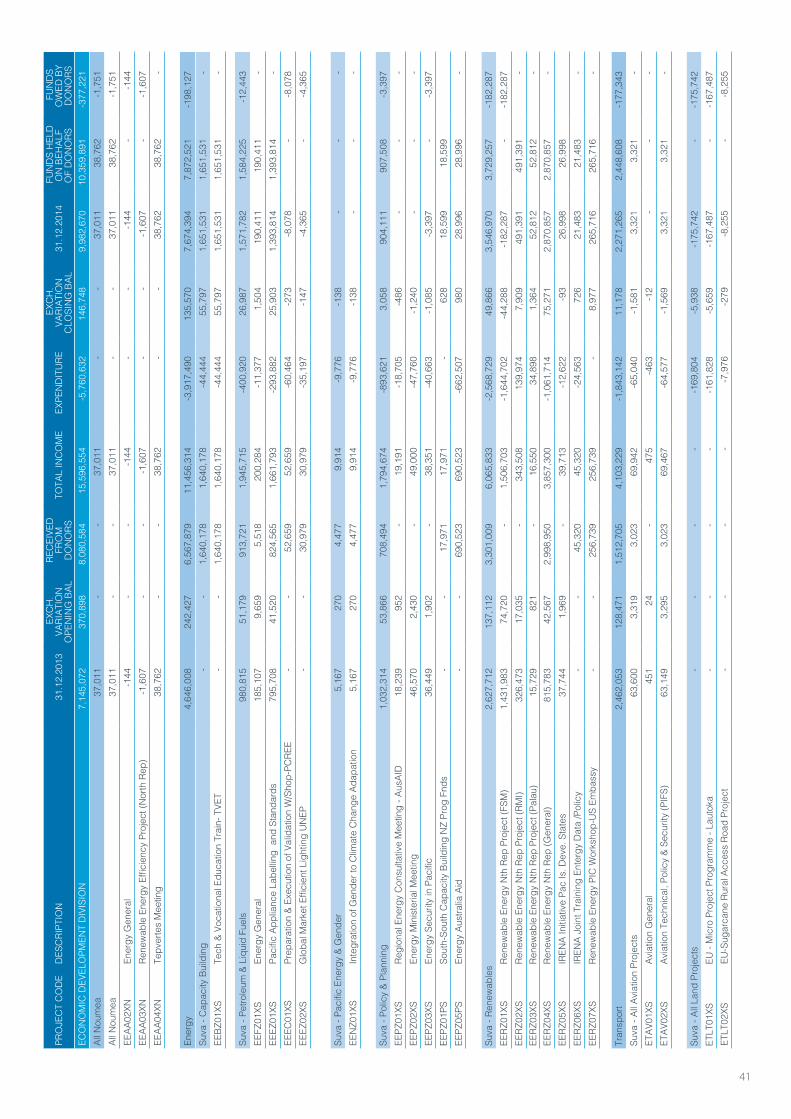
ANNUAL REPORT 2014 41
PRO
JEC
T C
OD
ED
ESC
RIPT
ION
31.
12.2
013
EXC
H.
VARI
ATIO
N
OPE
NIN
G B
AL
REC
EIVE
DFR
OM
DO
NO
RS T
OTA
L IN
CO
ME
EXPE
ND
ITU
RE
EXC
H.
VARI
ATIO
N
CLO
SIN
G B
AL 3
1.12
.201
4 F
UN
DS
HEL
D
ON
BEH
ALF
OF
DO
NO
RS
FU
ND
S O
WED
BY
DO
NO
RSEC
ON
OM
IC D
EVEL
OPM
ENT
DIV
ISIO
N 7
,145
,072
3
70,8
98
8,0
80,5
84
15,
596,
554
-5,7
60,6
32
146
,748
9
,982
,670
1
0,35
9,89
1-3
77,2
21Al
l Nou
mea
37,
011
- -
37,
011
- -
37,
011
38,
762
-1,7
51
All N
oum
ea 3
7,01
1 -
- 3
7,01
1 -
- 3
7,01
1 3
8,76
2 -1
,751
EE
AA02
XNEn
ergy
Gen
eral
-144
-
- -1
44
- -
-144
-
-144
EE
AA03
XNRe
new
able
Ene
rgy
Effic
ienc
y Pr
ojec
t (N
orth
Rep
)-1
,607
-
- -1
,607
-
- -1
,607
-
-1,6
07
EEAA
04XN
Tepv
erte
s M
eetin
g 3
8,76
2 -
- 3
8,76
2 -
- 3
8,76
2 3
8,76
2 -
Ener
gy 4
,646
,008
2
42,4
27
6,5
67,8
79
11,
456,
314
-3,9
17,4
90
135
,570
7
,674
,394
7
,872
,521
-1
98,1
27
Suva
- C
apac
ity B
uild
ing
- -
1,6
40,1
78
1,6
40,1
78
-44,
444
55,
797
1,6
51,5
31
1,6
51,5
31
- EE
BZ01
XSTe
ch &
Voc
atio
nal E
duca
tion
Trai
n- T
VET
- -
1,6
40,1
78
1,6
40,1
78
-44,
444
55,
797
1,6
51,5
31
1,6
51,5
31
-
Suva
- Pe
trole
um &
Liq
uid
Fuel
s 9
80,8
15
51,
179
913
,721
1
,945
,715
-4
00,9
20
26,
987
1,5
71,7
82
1,5
84,2
25
-12,
443
EEFZ
01XS
Ener
gy G
ener
al 1
85,1
07
9,6
59
5,5
18
200
,284
-1
1,37
7 1
,504
1
90,4
11
190
,411
-
EEEZ
01XS
Paci
fic A
pplia
nce
Labe
lling
and
Sta
ndar
ds 7
95,7
08
41,
520
824
,565
1
,661
,793
-2
93,8
82
25,
903
1,3
93,8
14
1,3
93,8
14
- EE
EC01
XSPr
epar
atio
n &
Exec
utio
n of
Val
idat
ion
W/S
hop-
PCRE
E -
- 5
2,65
9 5
2,65
9 -6
0,46
4 -2
73
-8,0
78
- -8
,078
EE
EZ02
XSG
loba
l Mar
ket E
ffici
ent L
ight
ing
UN
EP -
- 3
0,97
9 3
0,97
9 -3
5,19
7 -1
47
-4,3
65
- -4
,365
Suva
- Pa
cific
Ene
rgy
& G
ende
r 5
,167
2
70
4,4
77
9,9
14
-9,7
76
-138
-
- -
EEN
Z01X
SIn
tegr
atio
n of
Gen
der t
o C
limat
e C
hang
e Ad
apat
ion
5,1
67
270
4
,477
9
,914
-9
,776
-1
38
- -
-
Suva
- Po
licy
& Pl
anni
ng 1
,032
,314
5
3,86
6 7
08,4
94
1,7
94,6
74
-893
,621
3
,058
9
04,1
11
907
,508
-3
,397
EE
PZ01
XSRe
gion
al E
nerg
y C
onsu
ltativ
e M
eetin
g - A
usAI
D 1
8,23
9 9
52
- 1
9,19
1 -1
8,70
5 -4
86
- -
- EE
PZ02
XSEn
ergy
Min
iste
rial M
eetin
g 4
6,57
0 2
,430
-
49,
000
-47,
760
-1,2
40
- -
- EE
PZ03
XSEn
ergy
Sec
urity
in P
acifi
c 3
6,44
9 1
,902
-
38,
351
-40,
663
-1,0
85
-3,3
97
- -3
,397
EE
PZ01
PSSo
uth-
Sout
h C
apac
ity B
uild
ing
NZ
Prog
Fnd
s -
- 1
7,97
1 1
7,97
1 -
628
1
8,59
9 1
8,59
9 EE
PZ05
PSEn
ergy
Aus
tralia
Aid
- -
690
,523
6
90,5
23
-662
,507
9
80
28,
996
28,
996
-
Suva
- Re
new
able
s 2
,627
,712
1
37,1
12
3,3
01,0
09
6,0
65,8
33
-2,5
68,7
29
49,
866
3,5
46,9
70
3,7
29,2
57
-182
,287
EE
RZ01
XSRe
new
able
Ene
rgy
Nth
Rep
Pro
ject
(FSM
) 1
,431
,983
7
4,72
0 -
1,5
06,7
03
-1,6
44,7
02
-44,
288
-182
,287
-
-182
,287
EE
RZ02
XSRe
new
able
Ene
rgy
Nth
Rep
Pro
ject
(RM
I) 3
26,4
73
17,
035
- 3
43,5
08
139
,974
7
,909
4
91,3
91
491
,391
-
EERZ
03XS
Rene
wab
le E
nerg
y N
th R
ep P
roje
ct (P
alau
) 1
5,72
9 8
21
- 1
6,55
0 3
4,89
8 1
,364
5
2,81
2 5
2,81
2 -
EERZ
04XS
Rene
wab
le E
nerg
y N
th R
ep (G
ener
al)
815
,783
4
2,56
7 2
,998
,950
3
,857
,300
-1
,061
,714
7
5,27
1 2
,870
,857
2
,870
,857
-
EERZ
05XS
IREN
A In
itiat
ive
Pac
Is. D
eve.
Sta
tes
37,
744
1,9
69
- 3
9,71
3 -1
2,62
2 -9
3 2
6,99
8 2
6,99
8 EE
RZ06
XSIR
ENA
Join
t Tra
inin
g En
terg
y D
ata
/Pol
icy
- -
45,
320
45,
320
-24,
563
726
2
1,48
3 2
1,48
3 -
EERZ
07XS
Rene
wab
le E
nerg
y PI
C W
orks
hop-
US
Emba
ssy
- -
256
,739
2
56,7
39
- 8
,977
2
65,7
16
265
,716
-
Tran
spor
t 2
,462
,053
1
28,4
71
1,5
12,7
05
4,1
03,2
29
-1,8
43,1
42
11,
178
2,2
71,2
65
2,4
48,6
08-1
77,3
43Su
va -
All A
viat
ion
Proj
ects
63,
600
3,3
19
3,0
23
69,
942
-65,
040
-1,5
81
3,3
21
3,3
21
- ET
AV01
XSAv
iatio
n G
ener
al 4
51
24
- 4
75
-463
-1
2 -
- -
ETAV
02XS
Avia
tion
Tech
nica
l, Po
licy
& Se
curit
y (P
IFS)
63,
149
3,2
95
3,0
23
69,
467
-64,
577
-1,5
69
3,3
21
3,3
21
-
Suva
- Al
l Lan
d Pr
ojec
ts -
- -
- -1
69,8
04
-5,9
38
-175
,742
-
-175
,742
ET
LT01
XSEU
- M
icro
Pro
ject
Pro
gram
me
- Lau
toka
- -
- -
-161
,828
-5
,659
-1
67,4
87
- -1
67,4
87
ETLT
02XS
EU-S
ugar
cane
Rur
al A
cces
s Ro
ad P
roje
ct -
- -
- -7
,976
-2
79
-8,2
55
- -8
,255
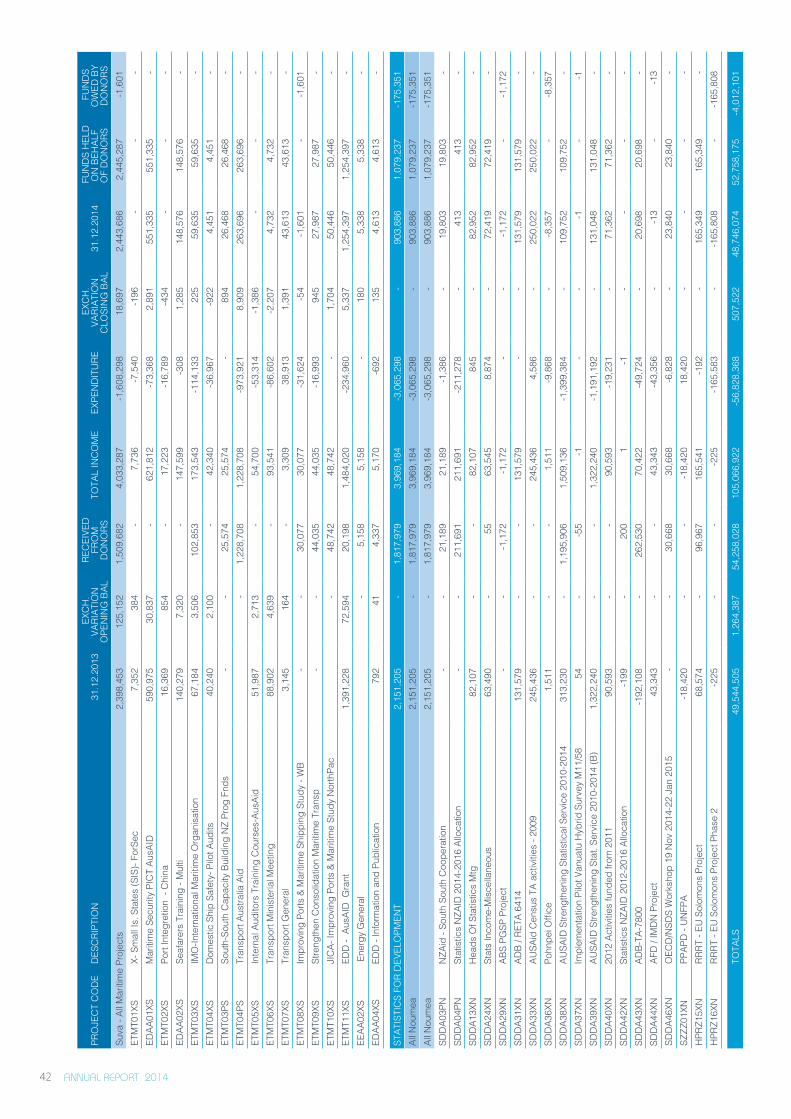
ANNUAL REPORT 2014 42
PRO
JEC
T C
OD
ED
ESC
RIPT
ION
31.
12.2
013
EXC
H.
VARI
ATIO
N
OPE
NIN
G B
AL
REC
EIVE
DFR
OM
DO
NO
RS T
OTA
L IN
CO
ME
EXPE
ND
ITU
RE
EXC
H.
VARI
ATIO
N
CLO
SIN
G B
AL 3
1.12
.201
4 F
UN
DS
HEL
D
ON
BEH
ALF
OF
DO
NO
RS
FU
ND
S O
WED
BY
DO
NO
RSSu
va -
All M
ariti
me
Proj
ects
2,3
98,4
53
125
,152
1
,509
,682
4
,033
,287
-1
,608
,298
1
8,69
7 2
,443
,686
2
,445
,287
-1
,601
ET
MT0
1XS
X- S
mal
l Is.
Sta
tes
(SIS
)- Fo
rSec
7,3
52
384
-
7,7
36
-7,5
40
-196
-
- -
EDAA
01XS
Mar
itim
e Se
curit
y PI
CT
AusA
ID 5
90,9
75
30,
837
- 6
21,8
12
-73,
368
2,8
91
551
,335
5
51,3
35
- ET
MT0
2XS
Port
Inte
gret
ion
- C
hina
16,
369
854
-
17,
223
-16,
789
-434
-
- -
EDAA
02XS
Seaf
arer
s Tr
aini
ng -
Mul
ti 1
40,2
79
7,3
20
- 1
47,5
99
-308
1
,285
1
48,5
76
148
,576
-
ETM
T03X
SIM
O-In
tern
atio
nal M
ariti
me
Org
anis
atio
n 6
7,18
4 3
,506
1
02,8
53
173
,543
-1
14,1
33
225
5
9,63
5 5
9,63
5 -
ETM
T04X
SD
omes
tic S
hip
Safe
ty- P
ilot A
udits
40,
240
2,1
00
- 4
2,34
0 -3
6,96
7 -9
22
4,4
51
4,4
51
- ET
MT0
3PS
Sout
h-So
uth
Cap
acity
Bui
ldin
g N
Z Pr
og F
nds
- -
25,
574
25,
574
- 8
94
26,
468
26,
468
- ET
MT0
4PS
Tran
spor
t Aus
tralia
Aid
- 1
,228
,708
1
,228
,708
-9
73,9
21
8,9
09
263
,696
2
63,6
96
- ET
MT0
5XS
Inte
rnal
Aud
itors
Tra
inin
g C
ours
es-A
usAi
d 5
1,98
7 2
,713
-
54,
700
-53,
314
-1,3
86
- -
- ET
MT0
6XS
Tran
spor
t Min
iste
rial M
eetin
g 8
8,90
2 4
,639
-
93,
541
-86,
602
-2,2
07
4,7
32
4,7
32
- ET
MT0
7XS
Tran
spor
t Gen
eral
3,1
45
164
-
3,3
09
38,
913
1,3
91
43,
613
43,
613
- ET
MT0
8XS
Impr
ovin
g Po
rts &
Mar
itim
e Sh
ippi
ng S
tudy
- W
B -
- 3
0,07
7 3
0,07
7 -3
1,62
4 -5
4 -1
,601
-
-1,6
01
ETM
T09X
SSt
reng
then
Con
solid
atio
n M
ariti
me
Tran
sp -
- 4
4,03
5 4
4,03
5 -1
6,99
3 9
45
27,
987
27,
987
- ET
MT1
0XS
JIC
A- Im
prov
ing
Ports
& M
ariti
me
Stud
y N
orth
Pac
- 4
8,74
2 4
8,74
2 -
1,7
04
50,
446
50,
446
- ET
MT1
1XS
EDD
- A
usAI
D G
rant
1,3
91,2
28
72,
594
20,
198
1,4
84,0
20
-234
,960
5
,337
1
,254
,397
1
,254
,397
-
EEAA
02XS
Ene
rgy
Gen
eral
-
5,1
58
5,1
58
- 1
80
5,3
38
5,3
38
- ED
AA04
XSED
D -
Info
rmat
ion
and
Publ
icat
ion
792
4
1 4
,337
5
,170
-6
92
135
4
,613
4
,613
-
STAT
ISTI
CS
FOR
DEV
ELO
PMEN
T 2
,151
,205
-
1,8
17,9
79
3,9
69,1
84
-3,0
65,2
98
- 9
03,8
86
1,0
79,2
37
-175
,351
Al
l Nou
mea
2,1
51,2
05
- 1
,817
,979
3
,969
,184
-3
,065
,298
-
903
,886
1
,079
,237
-1
75,3
51
All N
oum
ea 2
,151
,205
-
1,8
17,9
79
3,9
69,1
84
-3,0
65,2
98
- 9
03,8
86
1,0
79,2
37
-175
,351
SD
DA0
3PN
NZA
id -
Sout
h So
uth
Coo
pera
tion
- -
21,
189
21,
189
-1,3
86
- 1
9,80
3 1
9,80
3 -
SDD
A04P
NSt
atis
tics
NZA
ID 2
014-
2016
Allo
catio
n -
- 2
11,6
91
211
,691
-2
11,2
78
- 4
13
413
-
SDD
A13X
NH
eads
Of S
tatis
tics
Mtg
82,
107
- -
82,
107
845
-
82,
952
82,
952
- SD
DA2
4XN
Stat
s In
com
e-M
isce
llane
ous
63,
490
- 5
5 6
3,54
5 8
,874
-
72,
419
72,
419
- SD
DA2
9XN
ABS
PGSP
Pro
ject
- -
-1,1
72
-1,1
72
- -
-1,1
72
- -1
,172
SD
DA3
1XN
ADB
/ RET
A 64
14 1
31,5
79
- -
131
,579
-
- 1
31,5
79
131
,579
-
SDD
A33X
NAU
SAid
Cen
sus
TA a
ctiv
ities
- 20
09 2
45,4
36
- -
245
,436
4
,586
-
250
,022
2
50,0
22
- SD
DA3
6XN
Pohn
pei O
ffice
1,5
11
- -
1,5
11
-9,8
68
- -8
,357
-
-8,3
57
SDD
A38X
NAU
SAID
Stre
ngth
enin
g St
atis
tical
Ser
vice
201
0-20
14 3
13,2
30
- 1
,195
,906
1
,509
,136
-1
,399
,384
-
109
,752
1
09,7
52
- SD
DA3
7XN
Impl
emen
tatio
n Pi
lot V
anua
tu H
ybrid
Sur
vey
M11
/58
54
- -5
5 -1
-
- -1
-
-1
SDD
A39X
NAU
SAID
Stre
ngth
enin
g St
at. S
ervi
ce 2
010-
2014
(B)
1,3
22,2
40
- -
1,3
22,2
40
-1,1
91,1
92
- 1
31,0
48
131
,048
-
SDD
A40X
N20
12 A
ctiv
ities
fund
ed fr
om 2
011
90,
593
- -
90,
593
-19,
231
- 7
1,36
2 7
1,36
2 -
SDD
A42X
NSt
atis
tics
NZA
ID 2
012-
2016
Allo
catio
n-1
99
- 2
00
1
-1
- -
- -
SDD
A43X
NAD
B-TA
-780
0-1
92,1
08
- 2
62,5
30
70,
422
-49,
724
- 2
0,69
8 2
0,69
8 -
SDD
A44X
NAF
D /
IMD
N P
roje
ct 4
3,34
3 -
- 4
3,34
3 -4
3,35
6 -
-13
- -1
3 SD
DA4
6XN
OEC
D/N
SDS
Wor
ksho
p 19
Nov
201
4-22
Jan
201
5 -
- 3
0,66
8 3
0,66
8 -6
,828
-
23,
840
23,
840
- SZ
ZZ01
XNPP
APD
- U
NFP
A-1
8,42
0 -
- -1
8,42
0 1
8,42
0 -
- -
- H
PRZ1
5XN
RRRT
- EU
Sol
omon
s Pr
ojec
t 6
8,57
4 -
96,
967
165
,541
-1
92
- 1
65,3
49
165
,349
-
HPR
Z16X
NRR
RT -
EU S
olom
ons
Proj
ect P
hase
2-2
25
- -
-225
-1
65,5
83
- -1
65,8
08
- -1
65,8
08
TOTA
LS 4
9,54
4,50
5 1
,264
,387
5
4,25
8,02
8 1
05,0
66,9
22
-56,
828,
368
507
,522
4
8,74
6,07
4 5
2,75
8,17
5 -4
,012
,101

ANNUAL REPORT 2014 43
PRO
JEC
T C
OD
ED
ESC
RIPT
ION
31.
12.2
013
EXC
H.
VARI
ATIO
N
OPE
NIN
G B
AL
REC
EIVE
DFR
OM
DO
NO
RS T
OTA
L IN
CO
ME
EXPE
ND
ITU
RE
EXC
H.
VARI
ATIO
N
CLO
SIN
G B
AL 3
1.12
.201
4 F
UN
DS
HEL
D
ON
BEH
ALF
OF
DO
NO
RS
FU
ND
S O
WED
BY
DO
NO
RSSu
va -
All M
ariti
me
Proj
ects
2,3
98,4
53
125
,152
1
,509
,682
4
,033
,287
-1
,608
,298
1
8,69
7 2
,443
,686
2
,445
,287
-1
,601
ET
MT0
1XS
X- S
mal
l Is.
Sta
tes
(SIS
)- Fo
rSec
7,3
52
384
-
7,7
36
-7,5
40
-196
-
- -
EDAA
01XS
Mar
itim
e Se
curit
y PI
CT
AusA
ID 5
90,9
75
30,
837
- 6
21,8
12
-73,
368
2,8
91
551
,335
5
51,3
35
- ET
MT0
2XS
Port
Inte
gret
ion
- C
hina
16,
369
854
-
17,
223
-16,
789
-434
-
- -
EDAA
02XS
Seaf
arer
s Tr
aini
ng -
Mul
ti 1
40,2
79
7,3
20
- 1
47,5
99
-308
1
,285
1
48,5
76
148
,576
-
ETM
T03X
SIM
O-In
tern
atio
nal M
ariti
me
Org
anis
atio
n 6
7,18
4 3
,506
1
02,8
53
173
,543
-1
14,1
33
225
5
9,63
5 5
9,63
5 -
ETM
T04X
SD
omes
tic S
hip
Safe
ty- P
ilot A
udits
40,
240
2,1
00
- 4
2,34
0 -3
6,96
7 -9
22
4,4
51
4,4
51
- ET
MT0
3PS
Sout
h-So
uth
Cap
acity
Bui
ldin
g N
Z Pr
og F
nds
- -
25,
574
25,
574
- 8
94
26,
468
26,
468
- ET
MT0
4PS
Tran
spor
t Aus
tralia
Aid
- 1
,228
,708
1
,228
,708
-9
73,9
21
8,9
09
263
,696
2
63,6
96
- ET
MT0
5XS
Inte
rnal
Aud
itors
Tra
inin
g C
ours
es-A
usAi
d 5
1,98
7 2
,713
-
54,
700
-53,
314
-1,3
86
- -
- ET
MT0
6XS
Tran
spor
t Min
iste
rial M
eetin
g 8
8,90
2 4
,639
-
93,
541
-86,
602
-2,2
07
4,7
32
4,7
32
- ET
MT0
7XS
Tran
spor
t Gen
eral
3,1
45
164
-
3,3
09
38,
913
1,3
91
43,
613
43,
613
- ET
MT0
8XS
Impr
ovin
g Po
rts &
Mar
itim
e Sh
ippi
ng S
tudy
- W
B -
- 3
0,07
7 3
0,07
7 -3
1,62
4 -5
4 -1
,601
-
-1,6
01
ETM
T09X
SSt
reng
then
Con
solid
atio
n M
ariti
me
Tran
sp -
- 4
4,03
5 4
4,03
5 -1
6,99
3 9
45
27,
987
27,
987
- ET
MT1
0XS
JIC
A- Im
prov
ing
Ports
& M
ariti
me
Stud
y N
orth
Pac
- 4
8,74
2 4
8,74
2 -
1,7
04
50,
446
50,
446
- ET
MT1
1XS
EDD
- A
usAI
D G
rant
1,3
91,2
28
72,
594
20,
198
1,4
84,0
20
-234
,960
5
,337
1
,254
,397
1
,254
,397
-
EEAA
02XS
Ene
rgy
Gen
eral
-
5,1
58
5,1
58
- 1
80
5,3
38
5,3
38
- ED
AA04
XSED
D -
Info
rmat
ion
and
Publ
icat
ion
792
4
1 4
,337
5
,170
-6
92
135
4
,613
4
,613
-
STAT
ISTI
CS
FOR
DEV
ELO
PMEN
T 2
,151
,205
-
1,8
17,9
79
3,9
69,1
84
-3,0
65,2
98
- 9
03,8
86
1,0
79,2
37
-175
,351
Al
l Nou
mea
2,1
51,2
05
- 1
,817
,979
3
,969
,184
-3
,065
,298
-
903
,886
1
,079
,237
-1
75,3
51
All N
oum
ea 2
,151
,205
-
1,8
17,9
79
3,9
69,1
84
-3,0
65,2
98
- 9
03,8
86
1,0
79,2
37
-175
,351
SD
DA0
3PN
NZA
id -
Sout
h So
uth
Coo
pera
tion
- -
21,
189
21,
189
-1,3
86
- 1
9,80
3 1
9,80
3 -
SDD
A04P
NSt
atis
tics
NZA
ID 2
014-
2016
Allo
catio
n -
- 2
11,6
91
211
,691
-2
11,2
78
- 4
13
413
-
SDD
A13X
NH
eads
Of S
tatis
tics
Mtg
82,
107
- -
82,
107
845
-
82,
952
82,
952
- SD
DA2
4XN
Stat
s In
com
e-M
isce
llane
ous
63,
490
- 5
5 6
3,54
5 8
,874
-
72,
419
72,
419
- SD
DA2
9XN
ABS
PGSP
Pro
ject
- -
-1,1
72
-1,1
72
- -
-1,1
72
- -1
,172
SD
DA3
1XN
ADB
/ RET
A 64
14 1
31,5
79
- -
131
,579
-
- 1
31,5
79
131
,579
-
SDD
A33X
NAU
SAid
Cen
sus
TA a
ctiv
ities
- 20
09 2
45,4
36
- -
245
,436
4
,586
-
250
,022
2
50,0
22
- SD
DA3
6XN
Pohn
pei O
ffice
1,5
11
- -
1,5
11
-9,8
68
- -8
,357
-
-8,3
57
SDD
A38X
NAU
SAID
Stre
ngth
enin
g St
atis
tical
Ser
vice
201
0-20
14 3
13,2
30
- 1
,195
,906
1
,509
,136
-1
,399
,384
-
109
,752
1
09,7
52
- SD
DA3
7XN
Impl
emen
tatio
n Pi
lot V
anua
tu H
ybrid
Sur
vey
M11
/58
54
- -5
5 -1
-
- -1
-
-1
SDD
A39X
NAU
SAID
Stre
ngth
enin
g St
at. S
ervi
ce 2
010-
2014
(B)
1,3
22,2
40
- -
1,3
22,2
40
-1,1
91,1
92
- 1
31,0
48
131
,048
-
SDD
A40X
N20
12 A
ctiv
ities
fund
ed fr
om 2
011
90,
593
- -
90,
593
-19,
231
- 7
1,36
2 7
1,36
2 -
SDD
A42X
NSt
atis
tics
NZA
ID 2
012-
2016
Allo
catio
n-1
99
- 2
00
1
-1
- -
- -
SDD
A43X
NAD
B-TA
-780
0-1
92,1
08
- 2
62,5
30
70,
422
-49,
724
- 2
0,69
8 2
0,69
8 -
SDD
A44X
NAF
D /
IMD
N P
roje
ct 4
3,34
3 -
- 4
3,34
3 -4
3,35
6 -
-13
- -1
3 SD
DA4
6XN
OEC
D/N
SDS
Wor
ksho
p 19
Nov
201
4-22
Jan
201
5 -
- 3
0,66
8 3
0,66
8 -6
,828
-
23,
840
23,
840
- SZ
ZZ01
XNPP
APD
- U
NFP
A-1
8,42
0 -
- -1
8,42
0 1
8,42
0 -
- -
- H
PRZ1
5XN
RRRT
- EU
Sol
omon
s Pr
ojec
t 6
8,57
4 -
96,
967
165
,541
-1
92
- 1
65,3
49
165
,349
-
HPR
Z16X
NRR
RT -
EU S
olom
ons
Proj
ect P
hase
2-2
25
- -
-225
-1
65,5
83
- -1
65,8
08
- -1
65,8
08
TOTA
LS 4
9,54
4,50
5 1
,264
,387
5
4,25
8,02
8 1
05,0
66,9
22
-56,
828,
368
507
,522
4
8,74
6,07
4 5
2,75
8,17
5 -4
,012
,101

ANNUAL REPORT 2014 44
ANNUAL REPORT 2014 45
ANNUAL REPORT 2014 46
STATEMENT OF ACCOUNTING POLICIES
1. Principal activity
The principal activity of the Secretariat of the Pacific Community is to undertake research and provide technical assistance and training in support of the economic and social development of its 22 Pacific Island member countries and territories.
2. Summary of significant accounting policies
The principal accounting policies applied in the preparation of the financial statements of the Secretariat are set out below. These policies have been consistently applied to all the years presented, unless otherwise stated.
2.1 Basis of preparationThe financial statements of the SPC have been prepared in accordance with the Secretariat’s financial regulations.
The financial statements have been prepared under the historical cost convention, except as disclosed in the accounting policies below.
Management is required to exercise its judgement in determining certain critical accounting estimates and the application of the organisation’s accounting policies. Areas involving a higher degree of judgement or complexity, or areas where assumptions and estimates are significant to the financial statements, are disclosed in Note 2.14.
All amounts shown in the financial statements are expressed in units of Pacific Francs (CFP) (1 unit = 100 Pacific Francs).
2.2 Fund accountingThe Secretariat utilises a fund accounting system, given that a considerable part of its annual income comprises individual grants and donor funds for specified projects.
Individual funds are separately maintained throughout the accounting system, thus providing the control necessary to ensure that each fund is used only for the purpose for which it is received.
A separate fund is established to record the amount received, expenditure incurred and the net balance of the funds available to be carried forward into the next financial
period. Although the general rule is the accrual basis of accounting, when funds are committed, accounting for individual projects has to comply with donors’ requirements. Some donors require that expenditures are recognised only on a cash basis.
Although the various funds are available only for the specific purpose for which they have been given, and they are accounted for separately, it is considered appropriate for reporting purposes in these financial statements to aggregate income and expenditure under summary headings.
2.3 Foreign currencyFunctional and presentation currency
Items included in the financial statements of the organisation are measured using the currency of the primary economic environment in which the organisation operates (‘the functional currency’). The functional currency for operations in Fiji is the Fijian dollar; for operations in New Caledonia it is the Pacific Franc. The financial statements are presented in units of Pacific Francs, which is the Secretariat of the Pacific Community’s presentation currency.
Transactions and balances
Foreign currency transactions are translated into the functional currency of each branch using the exchange rates prevailing at the date of the transactions. Foreign exchange gains and losses resulting from the settlement of such transactions and from the translation at year end exchange rates of monetary assets and liabilities denominated in foreign currencies are recognised in the income statement.
Suva branch accounts are consolidated at balance date by converting income and expenditure at the year’s average bank buying rate and net assets at the bank buying rate as at balance date.
Average rate used: FJD 1 = CFP 47.76 (2013: FJD 1 = CFP 49.00)
Balance date bank buying rate was FJD 1 = CFP 49.43 (2013: FJD 1 = CFP 46.57)
ANNUAL REPORT 2014 47
2.4 Revenue recognitionAssessed contributions
Contributions from member countries are recognised on an accrual basis and made from reference to assessed computations approved at annual conferences. Contributions to be allocated to the financing of capital expenditures are transferred to deferred income and brought to the income statement over the useful life of the assets.
Extra-budgetary funds
Funds received from governments and aid agencies under extra-budgetary work programmes are usually for specified purposes. These funds are separately identified in the accounting system and expenditure recorded against each fund. Revenue is generally recognised at the time of receipt of funds to comply with the fund reporting required by the donor.
Project management fees
Revenue received for the management of funds is based on an agreed percentage of the fund disbursements. This is recognised as expenditure on the project is recognised.
Interest revenue
Interest revenue is recognised on a straight line basis.
Sale of goods
Revenue from the sale of goods is recognised when the Secretariat has transferred to the buyer the significant risks and rewards of ownership of the goods.
2.5 Income taxThe Secretariat is exempt from income tax.
2.6 LeasesAll leases of property, plant and equipment under which the risks and benefits of ownership are effectively retained by the lessor are classified as operating leases. Obligations incurred under operating leases are charged to the income statement on a cash basis over the period of the lease.
2.7 Research and development costsResearch and development costs are recognised as an expense in the period in which they are incurred.
2.8 Property, plant and equipmentProperty, plant and equipment are stated at historical cost less depreciation. Historical cost includes expenditure that is directly attributable to the acquisition of the items. Land is not depreciated.
Subsequent costs are included in the asset’s carrying amount or recognised as a separate asset, as appropriate, only when it is probable that future economic benefits associated with the item will flow to the group and the cost of the item can be measured reliably. All other repairs and maintenance are charged to the income statement during the financial period in which they are incurred.
Depreciation on assets is calculated using the straight-line method to allocate their cost to their residual values over their estimated useful lives. Depreciation of an item of property, plant and equipment begins when it is available for use and ceases at the earlier of either the date that it is classified as held for sale or the date it is derecognised upon disposal.
The following estimated useful lives are used in the calculation of depreciation:
■ Motor vehicles, equipment, furniture 5 years and fittings
■ Computer equipment 3 years
■ Buildings 66.6 years
The depreciation charge for the year is matched by a corresponding transfer from the deferred income account. The assets’ residual values and useful lives are reviewed, and adjusted if appropriate, at each balance sheet date.
An asset’s carrying amount is written down immediately to its recoverable amount if the asset’s carrying amount is greater than its estimated recoverable amount. Gains and losses on disposals are determined by comparing proceeds with carrying amounts. These are included in the income statement.
2.9 InventoryInventories are stated at the lower of cost and net realisable value. Cost is calculated on a first-in, first-out (FIFO) basis. Net realisable value is the estimated selling price in the ordinary course of business, less applicable variable selling expenses.
ANNUAL REPORT 2014 48
2.10 Financial instrumentsFinancial assets and liabilities are recognised on the organisation’s balance sheet when it becomes a party to the contractual provisions of the instrument.
Financial assets
(i) Loans and receivables
Loans and receivables are non-derivative financial assets with fixed or determinable payments that are not quoted in an active market. They arise when the organisation provides money, goods or services directly to a debtor with no intention of trading the receivable.
They are included in current assets, except for maturities greater than 12 months after the balance sheet date, which are classified as non-current assets. Loans and receivables are included in trade and other receivables in the balance sheet.
Trade receivables are recognised initially at fair value and subsequently measured at amortised cost less provision for impairment. A provision for impairment of trade receivables is established when there is objective evidence that the organisation will not be able to collect all amounts due according to the original terms of receivables. The amount of the impairment is the difference between the asset’s carrying amount and the present value of estimated future cash flows. Significant financial difficulties of the debtor, probability that the debtor will enter bankruptcy or financial reorganisation, default or delinquency in payments are considered indicators that the trade receivables are impaired. The amount of the impairment is recognised in the income statement.
(ii) Cash and cash equivalents
Cash and cash equivalents are carried in the balance sheet at cost. Cash and cash equivalents comprise cash on hand, deposits held at call with banks and other short-term liquid investments that are readily convertible to a known amount of cash and are subject to an insignificant risk of change in value, net of bank overdrafts. In the balance sheet, bank overdrafts are included in borrowings in current liabilities.
Financial liabilities
Financial liabilities are initially measured at fair value, and are subsequently measured at amortised cost.
Offset
Where a legally enforceable right of offset exists for recognised financial assets and financial liabilities, and there is an intention to settle the liability and realise the asset simultaneously or to settle on a net basis, all related financial effects are offset.
2.11 ProvisionsProvisions are recognised when the organisation has a present legal or constructive obligation as a result of past events, when it is probable that an outflow of resources embodying economic benefits will be required to settle the obligation, and when a reliable estimate of the amount of the obligation can be made.
Where there are a number of similar obligations, the likelihood that an outflow will be required in settlement is determined by considering the class of obligations as a whole. A provision is recognised even if the likelihood of an outflow with respect to any one item included in the same class of obligations may be small.
Provisions are measured at the present value of the expenditures expected to be required to settle the obligation using a rate that reflects current market assessments of the time value of money and the risks specific to the obligation. The increase in the provision due to passage of time is recognised as interest expense.
2.12 Retirement benefitsThe organisation operates a defined contribution plan, the assets of which are held in a separate trustee-administered fund. The defined contribution plan is funded by payments from the organisation. A defined contribution plan is a pension plan under which the group pays fixed contributions into a separate entity. The organisation has no legal or constructive obligation to pay further contributions if the fund does not hold sufficient assets to pay all employees the benefits relating to employee service in the current and prior periods. Contributions to the defined contribution plan are charged to the income statement in the year to which they relate. The organisation has no further payment obligations once the contributions have been paid. The defined contribution plan is governed by the Provident Fund Rules of the Secretariat of the Pacific Community.
2.13 Non-current liabilities – Housing loansBorrowings
Borrowings relating to the loans on staff housing are initially recognised at fair value plus transaction costs incurred. Borrowings are subsequently measured at amortised cost. Any difference between the proceeds and the redemption amount is recognised in the income statement over the period of the borrowings on a straight line basis. Borrowings are classified as current liabilities unless the organisation has an unconditional right to defer settlement of the liability for at least 12 months after the reporting date.
Borrowing costs
Borrowing costs directly attributable to buildings are expensed in the period they are incurred.
ANNUAL REPORT 2014 49
2.14 Critical accounting estimates and judgementsEstimates and judgements are continually evaluated and are based on historical experience and other factors, including expectations of future events that are believed to be reasonable under the circumstances.
The organisation makes estimates and assumptions concerning the future. The resulting accounting estimates will, by definition, seldom equal the related actual results. Estimates and assumptions that have a significant risk of causing a material adjustment to the carrying amounts of assets and liabilities within the next financial year are discussed below.
a) Employee benefits
Liabilities for salaries and annual leave which are expected to be settled within 12 months of the reporting date are recognised in creditors, accruals and provisions in respect of employees’ services up to the reporting date and are measured at the amounts expected to be paid when the liabilities are settled.
The liability for expatriate repatriation has been based on the estimated airfares, removal cost and removal allowance. No discount rate has been applied.
The provision for expatriate home leave has been based on a 3 year cycle with an estimate of the average family size and estimated airfares.
2.15 ReservesThe following categories of Reserves are held in accordance with the reserve policy of the entity:
a) General Reserve represents the sum total of the accumulated results arising from core activities not assigned to a specific fund reserve.
b) Specific Funds Reserve comprises funds earmarked for specific purposes and generally not available for uses other than those specified.
c) Special Funds represent the accumulated results of self-funded activities, i.e. housing and canteen activities. Revenues and costs incurred for these activities are not presented under the statement of income and expenditure for core activities.
2.16 Statement of cash flowsThe statement of cash flows forms part of the Financial Statements to provide information on the movements in cash and cash equivalents of the organisation. The terms used in the statement of cash flows are defined as follows:
■ Operating activities include all transactions and other events that are not investing or financing activities.
■ Investing activities are those relating to the acquisition, holding and disposal of property, plant and equipment and of investments. Investments can include securities not falling within the definition of cash.
■ Cash and cash equivalents comprise cash on hand, cash in banks and term deposits held with banks.
3. Financial risk management
Financial risk factors
The organisation is exposed to a variety of financial risks: market risk (such as currency risk), credit risk and liquidity risk. The organisation’s overall risk management programme focuses on the unpredictability of financial markets and seeks to minimise potential adverse effects on the organisation’s financial performance.
CRGA provides principles for overall risk management, as well as policies covering specific areas.
a) Market risk
Foreign exchange risk
The organisation is exposed to foreign exchange risk arising from currency exposure, primarily with respect to the United States, Australian and New Zealand dollars. In particular, foreign exchange risk arises from donations and transactions, and recognised assets and liabilities.
To manage the foreign exchange risk, the organisation has opened bank accounts in different currencies to obtain the most favourable outcome and to settle foreign currency liabilities in the currency received from donors.
In addition, a foreign exchange fluctuation reserve (within the Specific Funds) has been set up to cover adverse fluctuation events that may occur in future years.
b) Credit risk
Management has a credit policy in place and exposure to credit risk is monitored on an ongoing basis.
Credit risk with respect to trade receivables is limited due to the sovereign debt status of the Assessed Contributions owed by member countries. At balance sheet date, there were no significant concentrations of credit risk.
ANNUAL REPORT 2014 50
c) Liquidity risk
Prudent liquidity risk management implies maintaining sufficient cash and the availability of funding through an adequate amount of cash and committed credit facilities.
d) Cash flow and fair value interest rate risk
As the organisation has minimal interest-bearing liabilities, the organisation’s expenditure and operating cash flows are substantially independent of changes in market interest rates.
The group’s interest rate risk arises from interest-bearing assets (classified as cash and cash equivalents). Variable rates expose the group to cash flow interest rate risk.
Cash investments are limited to financial institutions with high credit quality.
4. Contingent liabilitiesThe Secretariat has no contingent liabilities as at 31 December 2014.
5. CommitmentsCapital commitments
The Secretariat has a capital commitment of 325,231 CFP Units in relation to air-conditioning works at the Noumea office at 31 December 2014.
6. InsuranceThe Secretariat has taken out insurance to cover its assets equivalent to the replacement value of its fixed assets.
7. Events occurring after balance dateNo other matter or circumstance, other than that referred to in the financial statements or notes thereto, has arisen since the end of the financial year that has significantly affected, or may significantly affect, the operations of the Secretariat, the results of those operations, or the state of affairs of the Secretariat in future financial years.
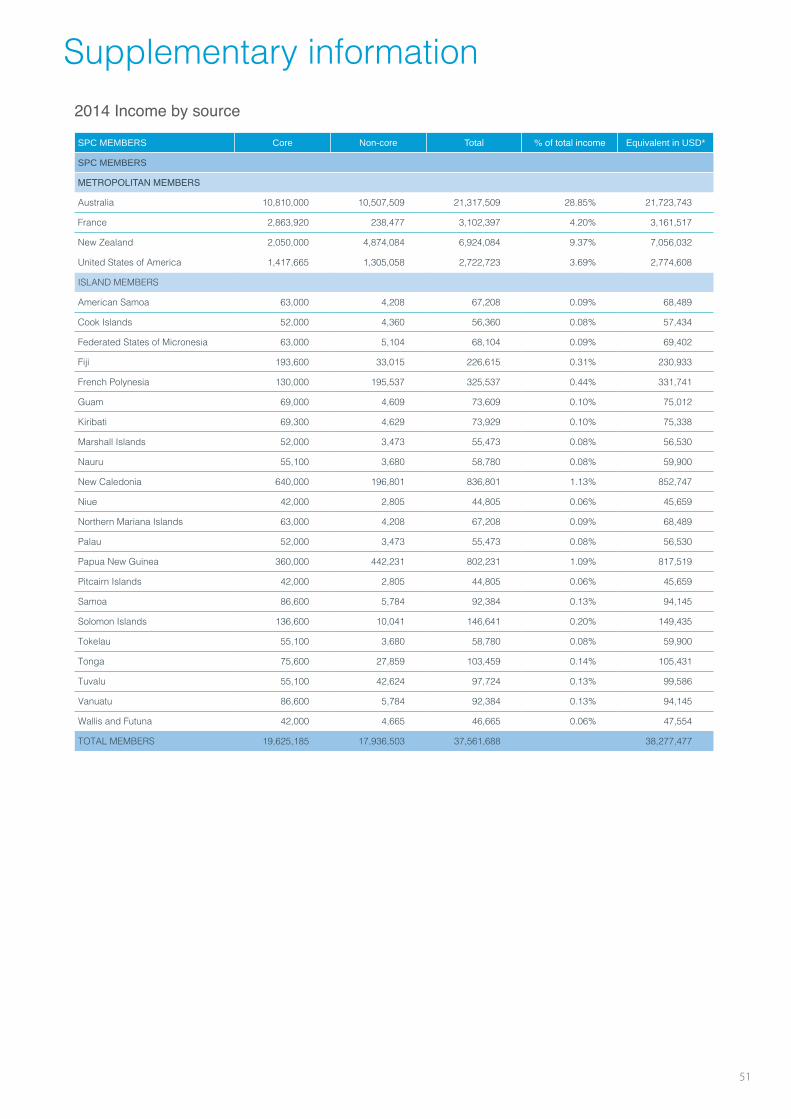
ANNUAL REPORT 2014 51
SPC MEMBERS Core Non-core Total % of total income Equivalent in USD*
SPC MEMBERS
METROPOLITAN MEMBERS
Australia 10,810,000 10,507,509 21,317,509 28.85% 21,723,743
France 2,863,920 238,477 3,102,397 4.20% 3,161,517
New Zealand 2,050,000 4,874,084 6,924,084 9.37% 7,056,032
United States of America 1,417,665 1,305,058 2,722,723 3.69% 2,774,608
ISLAND MEMBERS
American Samoa 63,000 4,208 67,208 0.09% 68,489
Cook Islands 52,000 4,360 56,360 0.08% 57,434
Federated States of Micronesia 63,000 5,104 68,104 0.09% 69,402
Fiji 193,600 33,015 226,615 0.31% 230,933
French Polynesia 130,000 195,537 325,537 0.44% 331,741
Guam 69,000 4,609 73,609 0.10% 75,012
Kiribati 69,300 4,629 73,929 0.10% 75,338
Marshall Islands 52,000 3,473 55,473 0.08% 56,530
Nauru 55,100 3,680 58,780 0.08% 59,900
New Caledonia 640,000 196,801 836,801 1.13% 852,747
Niue 42,000 2,805 44,805 0.06% 45,659
Northern Mariana Islands 63,000 4,208 67,208 0.09% 68,489
Palau 52,000 3,473 55,473 0.08% 56,530
Papua New Guinea 360,000 442,231 802,231 1.09% 817,519
Pitcairn Islands 42,000 2,805 44,805 0.06% 45,659
Samoa 86,600 5,784 92,384 0.13% 94,145
Solomon Islands 136,600 10,041 146,641 0.20% 149,435
Tokelau 55,100 3,680 58,780 0.08% 59,900
Tonga 75,600 27,859 103,459 0.14% 105,431
Tuvalu 55,100 42,624 97,724 0.13% 99,586
Vanuatu 86,600 5,784 92,384 0.13% 94,145
Wallis and Futuna 42,000 4,665 46,665 0.06% 47,554
TOTAL MEMBERS 19,625,185 17,936,503 37,561,688 38,277,477
Supplementary information2014 Income by source
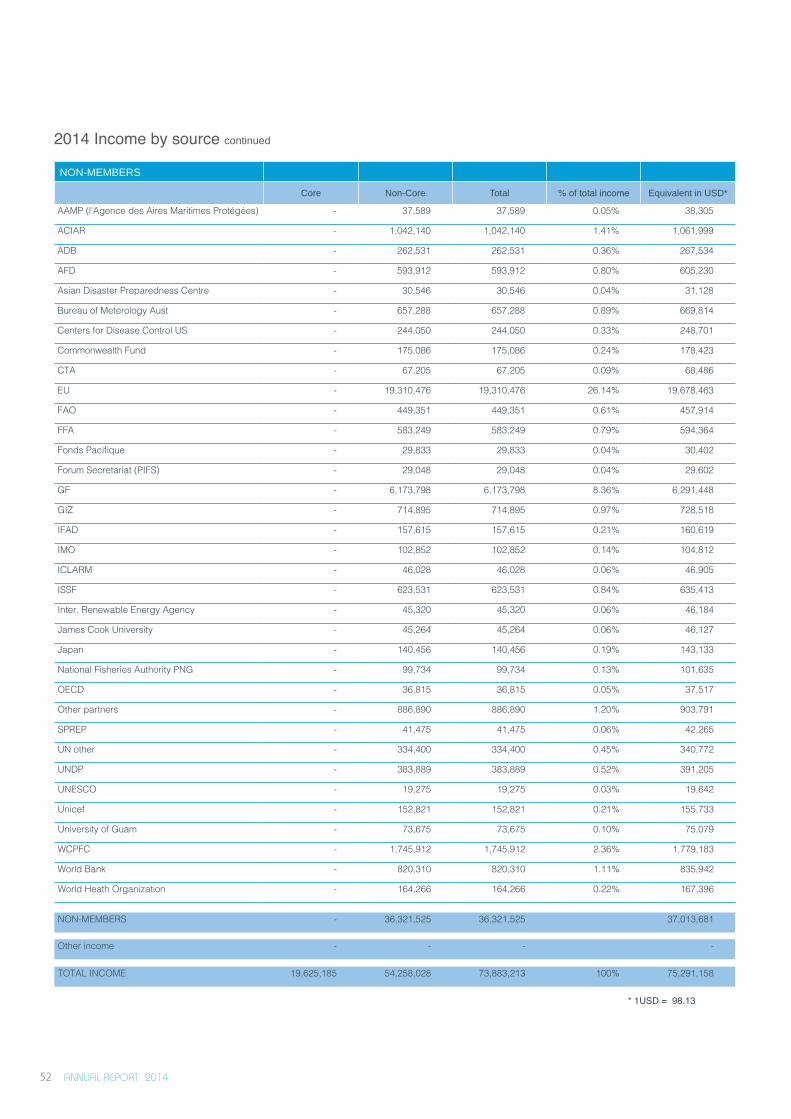
ANNUAL REPORT 2014 52
NON-MEMBERS
Core Non-Core Total % of total income Equivalent in USD*
AAMP (l'Agence des Aires Maritimes Protégées) - 37,589 37,589 0.05% 38,305
ACIAR - 1,042,140 1,042,140 1.41% 1,061,999
ADB - 262,531 262,531 0.36% 267,534
AFD - 593,912 593,912 0.80% 605,230
Asian Disaster Preparedness Centre - 30,546 30,546 0.04% 31,128
Bureau of Meterology Aust - 657,288 657,288 0.89% 669,814
Centers for Disease Control US - 244,050 244,050 0.33% 248,701
Commonwealth Fund - 175,086 175,086 0.24% 178,423
CTA - 67,205 67,205 0.09% 68,486
EU - 19,310,476 19,310,476 26.14% 19,678,463
FAO - 449,351 449,351 0.61% 457,914
FFA - 583,249 583,249 0.79% 594,364
Fonds Pacifique - 29,833 29,833 0.04% 30,402
Forum Secretariat (PIFS) - 29,048 29,048 0.04% 29,602
GF - 6,173,798 6,173,798 8.36% 6,291,448
GIZ - 714,895 714,895 0.97% 728,518
IFAD - 157,615 157,615 0.21% 160,619
IMO - 102,852 102,852 0.14% 104,812
ICLARM - 46,028 46,028 0.06% 46,905
ISSF - 623,531 623,531 0.84% 635,413
Inter. Renewable Energy Agency - 45,320 45,320 0.06% 46,184
James Cook University - 45,264 45,264 0.06% 46,127
Japan - 140,456 140,456 0.19% 143,133
National Fisheries Authority PNG - 99,734 99,734 0.13% 101,635
OECD - 36,815 36,815 0.05% 37,517
Other partners - 886,890 886,890 1.20% 903,791
SPREP - 41,475 41,475 0.06% 42,265
UN other - 334,400 334,400 0.45% 340,772
UNDP - 383,889 383,889 0.52% 391,205
UNESCO - 19,275 19,275 0.03% 19,642
Unicef - 152,821 152,821 0.21% 155,733
University of Guam - 73,675 73,675 0.10% 75,079
WCPFC - 1,745,912 1,745,912 2.36% 1,779,183
World Bank - 820,310 820,310 1.11% 835,942
World Heath Organization - 164,266 164,266 0.22% 167,396
NON-MEMBERS - 36,321,525 36,321,525 37,013,681
Other income - - - -
TOTAL INCOME 19,625,185 54,258,028 73,883,213 100% 75,291,158
* 1USD = 98.13
2014 Income by source continued
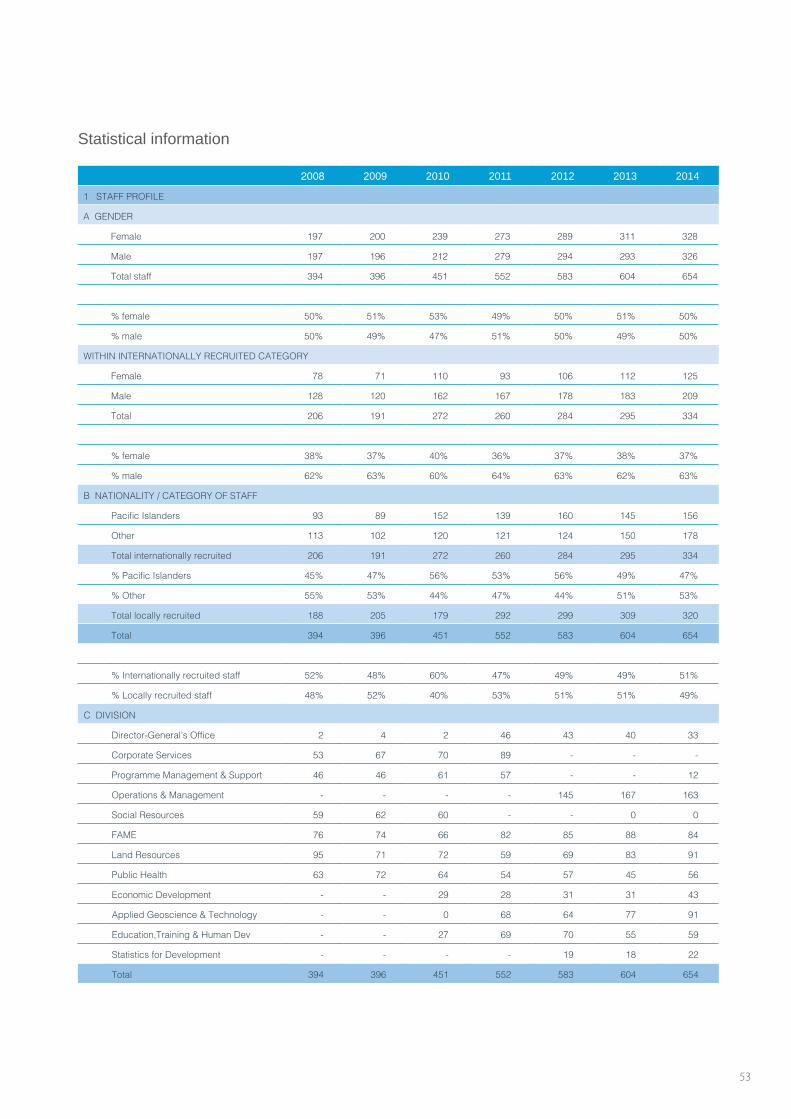
ANNUAL REPORT 2014 53
2008 2009 2010 2011 2012 2013 2014
1 STAFF PROFILE
A GENDER
Female 197 200 239 273 289 311 328
Male 197 196 212 279 294 293 326
Total staff 394 396 451 552 583 604 654
% female 50% 51% 53% 49% 50% 51% 50%
% male 50% 49% 47% 51% 50% 49% 50%
WITHIN INTERNATIONALLY RECRUITED CATEGORY
Female 78 71 110 93 106 112 125
Male 128 120 162 167 178 183 209
Total 206 191 272 260 284 295 334
% female 38% 37% 40% 36% 37% 38% 37%
% male 62% 63% 60% 64% 63% 62% 63%
B NATIONALITY / CATEGORY OF STAFF
Pacific Islanders 93 89 152 139 160 145 156
Other 113 102 120 121 124 150 178
Total internationally recruited 206 191 272 260 284 295 334
% Pacific Islanders 45% 47% 56% 53% 56% 49% 47%
% Other 55% 53% 44% 47% 44% 51% 53%
Total locally recruited 188 205 179 292 299 309 320
Total 394 396 451 552 583 604 654
% Internationally recruited staff 52% 48% 60% 47% 49% 49% 51%
% Locally recruited staff 48% 52% 40% 53% 51% 51% 49%
C DIVISION
Director-General’s Office 2 4 2 46 43 40 33
Corporate Services 53 67 70 89 - - -
Programme Management & Support 46 46 61 57 - - 12
Operations & Management - - - - 145 167 163
Social Resources 59 62 60 - - 0 0
FAME 76 74 66 82 85 88 84
Land Resources 95 71 72 59 69 83 91
Public Health 63 72 64 54 57 45 56
Economic Development - - 29 28 31 31 43
Applied Geoscience & Technology - - 0 68 64 77 91
Education,Training & Human Dev - - 27 69 70 55 59
Statistics for Development - - - - 19 18 22
Total 394 396 451 552 583 604 654
Statistical information
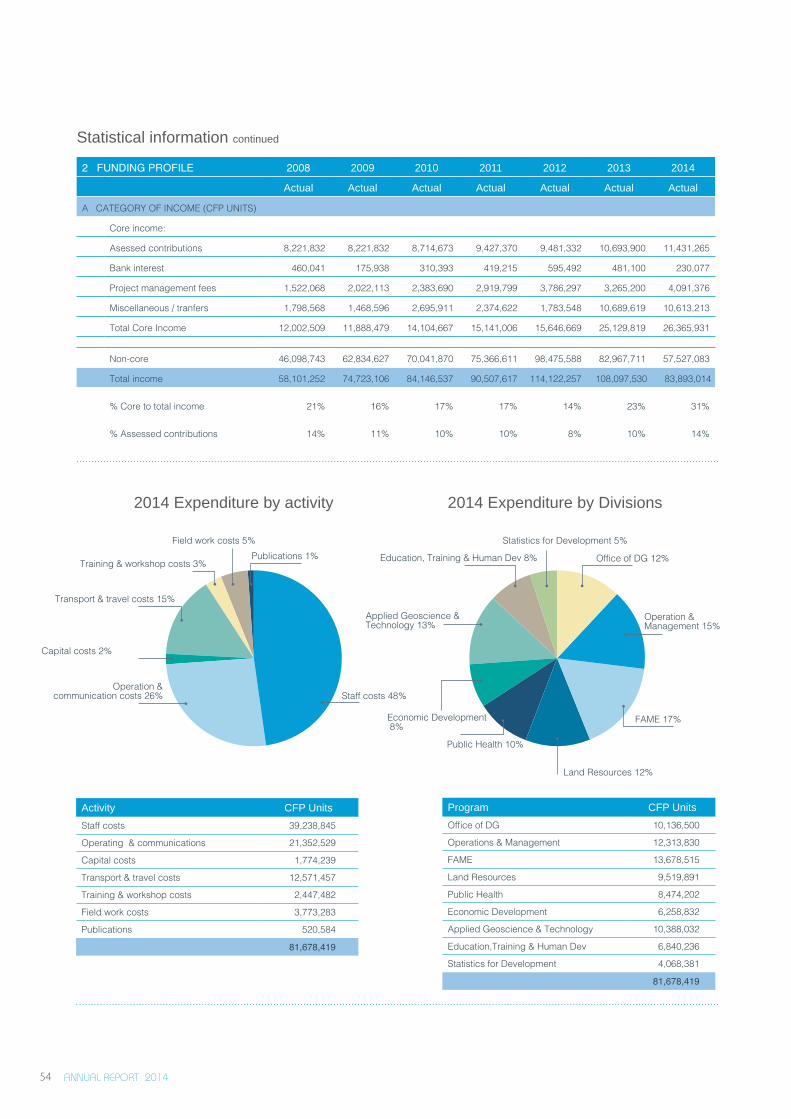
ANNUAL REPORT 2014 54
Program CFP Units
Office of DG 10,136,500
Operations & Management 12,313,830
FAME 13,678,515
Land Resources 9,519,891
Public Health 8,474,202
Economic Development 6,258,832
Applied Geoscience & Technology 10,388,032
Education,Training & Human Dev 6,840,236
Statistics for Development 4,068,381
81,678,419
Activity CFP Units
Staff costs 39,238,845
Operating & communications 21,352,529
Capital costs 1,774,239
Transport & travel costs 12,571,457
Training & workshop costs 2,447,482
Field work costs 3,773,283
Publications 520,584
81,678,419
Statistical information continued
2 FUNDING PROFILE 2008 2009 2010 2011 2012 2013 2014
Actual Actual Actual Actual Actual Actual Actual
A CATEGORY OF INCOME (CFP UNITS)
Core income:
Asessed contributions 8,221,832 8,221,832 8,714,673 9,427,370 9,481,332 10,693,900 11,431,265
Bank interest 460,041 175,938 310,393 419,215 595,492 481,100 230,077
Project management fees 1,522,068 2,022,113 2,383,690 2,919,799 3,786,297 3,265,200 4,091,376
Miscellaneous / tranfers 1,798,568 1,468,596 2,695,911 2,374,622 1,783,548 10,689,619 10,613,213
Total Core Income 12,002,509 11,888,479 14,104,667 15,141,006 15,646,669 25,129,819 26,365,931
Non-core 46,098,743 62,834,627 70,041,870 75,366,611 98,475,588 82,967,711 57,527,083
Total income 58,101,252 74,723,106 84,146,537 90,507,617 114,122,257 108,097,530 83,893,014
% Core to total income 21% 16% 17% 17% 14% 23% 31%
% Assessed contributions 14% 11% 10% 10% 8% 10% 14%
PROVIDENT FUND
FINANCIAL STATEMENTS AND AUDIT REPORTS FOR YEAR ENDING DECEMBER 2014
Transport & travel costs 15%
Training & workshop costs 3%
Field work costs 5%Publications 1%
Staff costs 48%
Capital costs 2%
Operation & communication costs 26%
Education, Training & Human Dev 8%
Statistics for Development 5%
Office of DG 12%
Applied Geoscience & Technology 13%
Operation & Management 15%
FAME 17%
Public Health 10%
Economic Development 8%
Land Resources 12%
2014 Expenditure by activity 2014 Expenditure by Divisions
ANNUAL REPORT 2014 55
PROVIDENT FUND
FINANCIAL STATEMENTS AND AUDIT REPORTS FOR YEAR ENDING DECEMBER 2014
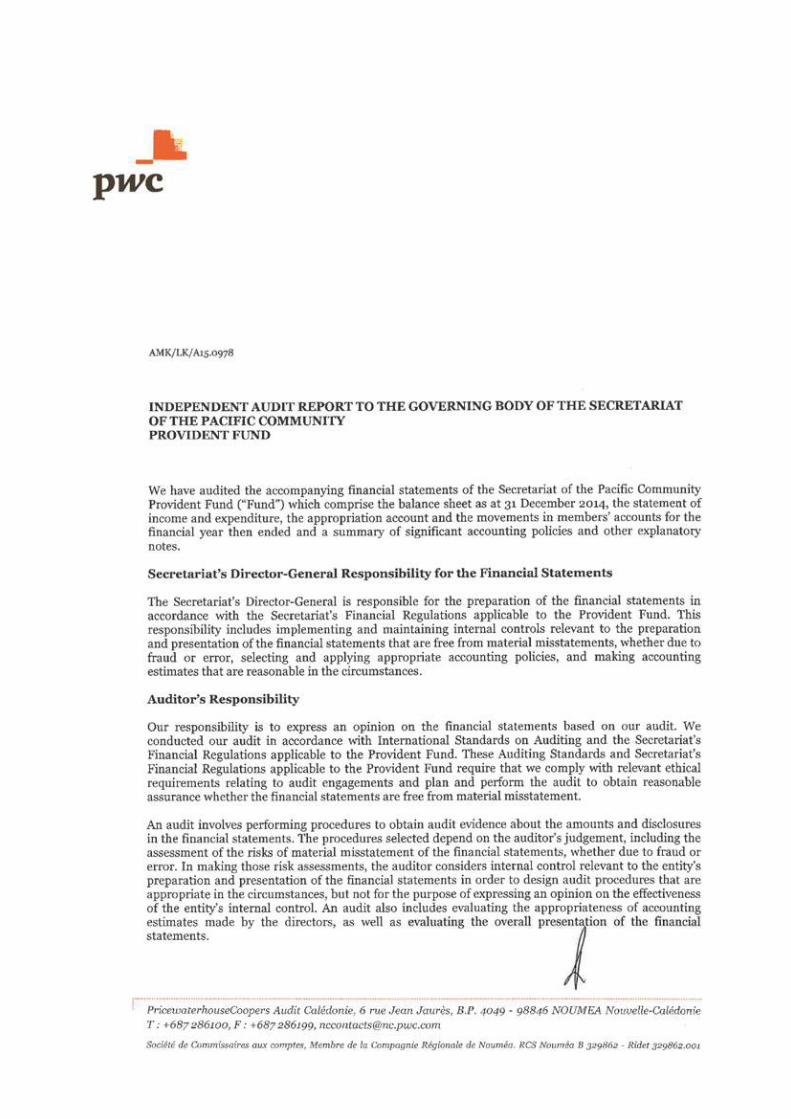
ANNUAL REPORT 2014 56
ANNUAL REPORT 2014 57
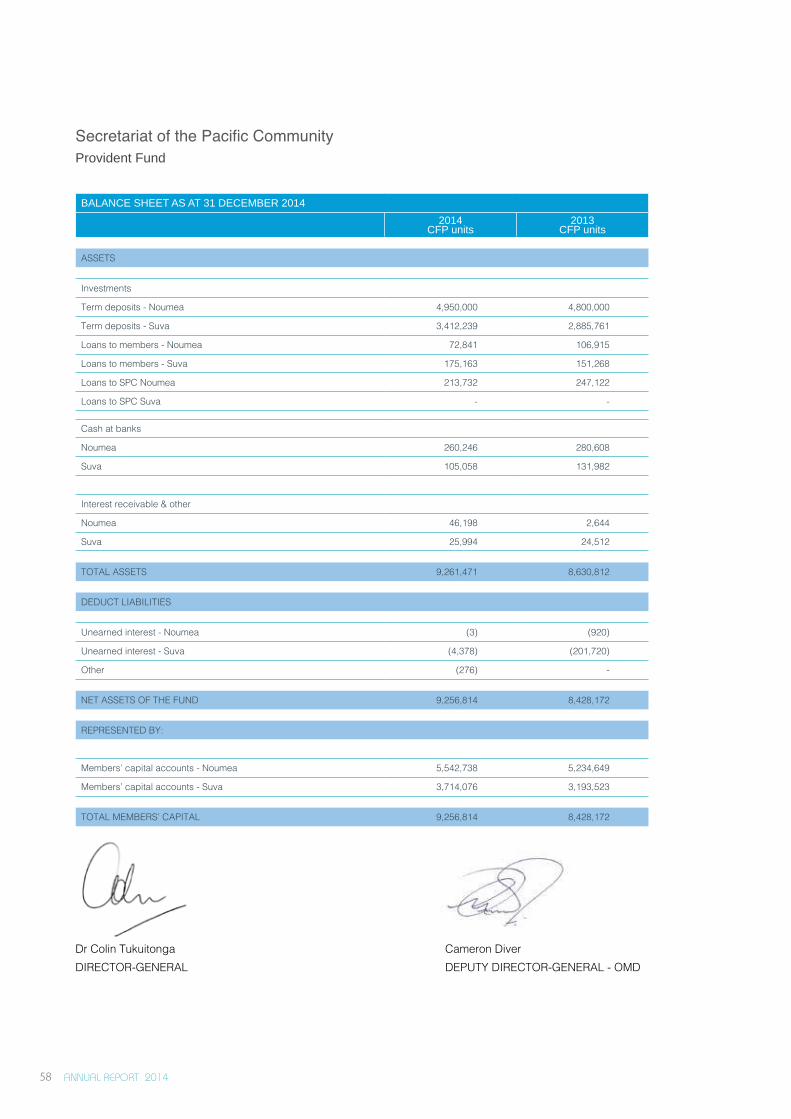
ANNUAL REPORT 2014 58
Secretariat of the Pacific CommunityProvident Fund
Dr Colin Tukuitonga Cameron Diver DIRECTOR-GENERAL DEPUTY DIRECTOR-GENERAL - OMD
BALANCE SHEET AS AT 31 DECEMBER 2014
2014CFP units
2013CFP units
ASSETS
Investments
Term deposits - Noumea 4,950,000 4,800,000
Term deposits - Suva 3,412,239 2,885,761
Loans to members - Noumea 72,841 106,915
Loans to members - Suva 175,163 151,268
Loans to SPC Noumea 213,732 247,122
Loans to SPC Suva - -
Cash at banks
Noumea 260,246 280,608
Suva 105,058 131,982
Interest receivable & other
Noumea 46,198 2,644
Suva 25,994 24,512
TOTAL ASSETS 9,261,471 8,630,812
DEDUCT LIABILITIES
Unearned interest - Noumea (3) (920)
Unearned interest - Suva (4,378) (201,720)
Other (276) -
NET ASSETS OF THE FUND 9,256,814 8,428,172
REPRESENTED BY:
Members’ capital accounts - Noumea 5,542,738 5,234,649
Members’ capital accounts - Suva 3,714,076 3,193,523
TOTAL MEMBERS’ CAPITAL 9,256,814 8,428,172
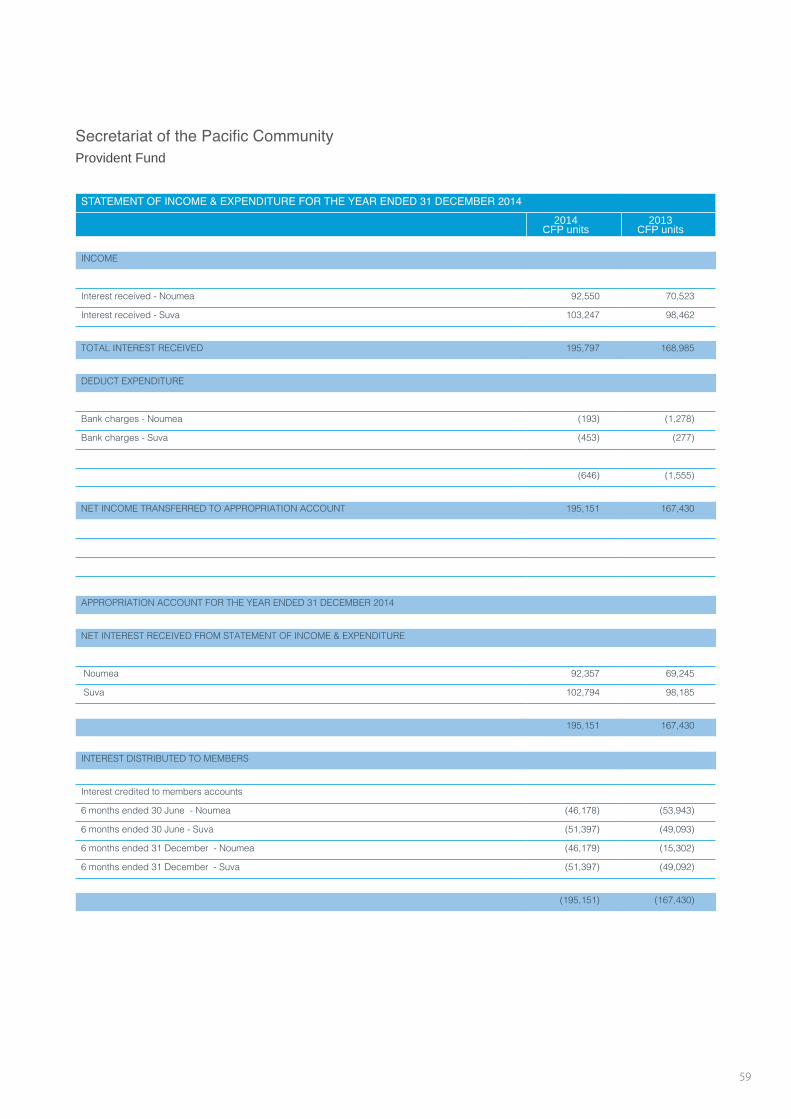
ANNUAL REPORT 2014 59
STATEMENT OF INCOME & EXPENDITURE FOR THE YEAR ENDED 31 DECEMBER 2014
2014CFP units
2013CFP units
INCOME
Interest received - Noumea 92,550 70,523
Interest received - Suva 103,247 98,462
TOTAL INTEREST RECEIVED 195,797 168,985
DEDUCT EXPENDITURE
Bank charges - Noumea (193) (1,278)
Bank charges - Suva (453) (277)
(646) (1,555)
NET INCOME TRANSFERRED TO APPROPRIATION ACCOUNT 195,151 167,430
APPROPRIATION ACCOUNT FOR THE YEAR ENDED 31 DECEMBER 2014
NET INTEREST RECEIVED FROM STATEMENT OF INCOME & EXPENDITURE
Noumea 92,357 69,245
Suva 102,794 98,185
195,151 167,430
INTEREST DISTRIBUTED TO MEMBERS
Interest credited to members accounts
6 months ended 30 June - Noumea (46,178) (53,943)
6 months ended 30 June - Suva (51,397) (49,093)
6 months ended 31 December - Noumea (46,179) (15,302)
6 months ended 31 December - Suva (51,397) (49,092)
(195,151) (167,430)
Secretariat of the Pacific CommunityProvident Fund
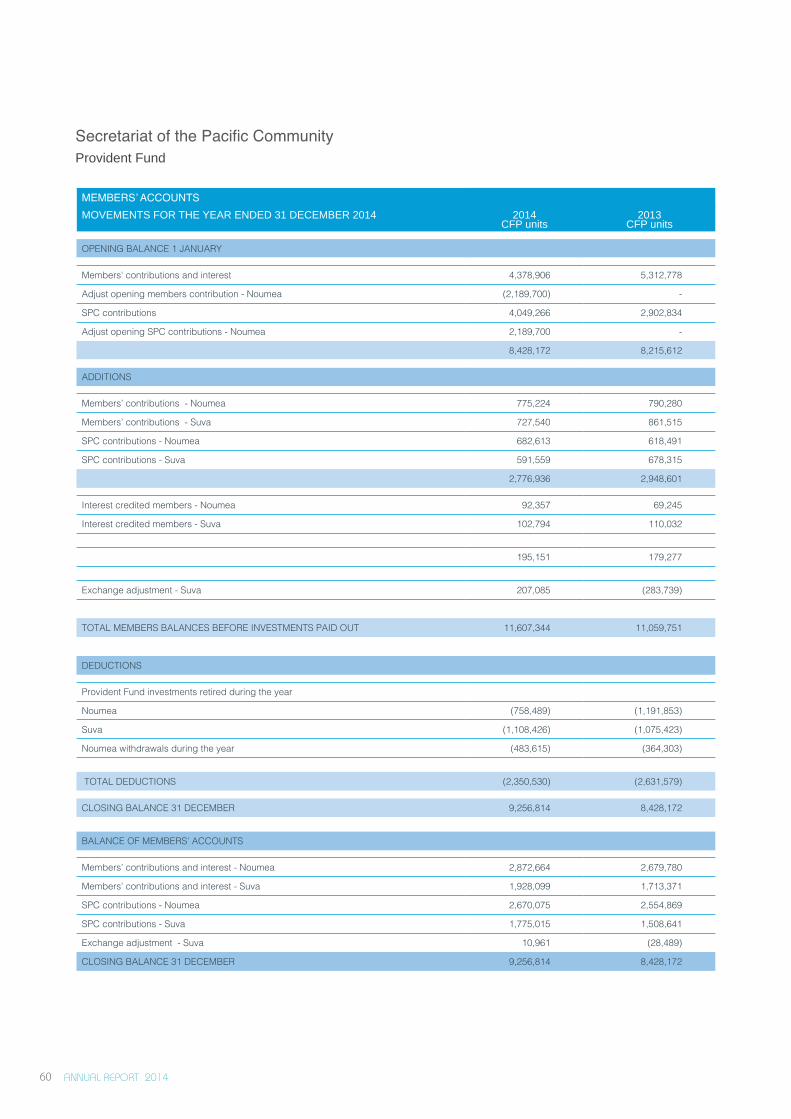
ANNUAL REPORT 2014 60
MEMBERS’ ACCOUNTS
MOVEMENTS FOR THE YEAR ENDED 31 DECEMBER 2014
2014CFP units
2013CFP units
OPENING BALANCE 1 JANUARY
Members' contributions and interest 4,378,906 5,312,778
Adjust opening members contribution - Noumea (2,189,700) -
SPC contributions 4,049,266 2,902,834
Adjust opening SPC contributions - Noumea 2,189,700 -
8,428,172 8,215,612
ADDITIONS
Members’ contributions - Noumea 775,224 790,280
Members’ contributions - Suva 727,540 861,515
SPC contributions - Noumea 682,613 618,491
SPC contributions - Suva 591,559 678,315
2,776,936 2,948,601
Interest credited members - Noumea 92,357 69,245
Interest credited members - Suva 102,794 110,032
195,151 179,277
Exchange adjustment - Suva 207,085 (283,739)
TOTAL MEMBERS BALANCES BEFORE INVESTMENTS PAID OUT 11,607,344 11,059,751
DEDUCTIONS
Provident Fund investments retired during the year
Noumea (758,489) (1,191,853)
Suva (1,108,426) (1,075,423)
Noumea withdrawals during the year (483,615) (364,303)
TOTAL DEDUCTIONS (2,350,530) (2,631,579)
CLOSING BALANCE 31 DECEMBER 9,256,814 8,428,172
BALANCE OF MEMBERS’ ACCOUNTS
Members’ contributions and interest - Noumea 2,872,664 2,679,780
Members’ contributions and interest - Suva 1,928,099 1,713,371
SPC contributions - Noumea 2,670,075 2,554,869
SPC contributions - Suva 1,775,015 1,508,641
Exchange adjustment - Suva 10,961 (28,489)
CLOSING BALANCE 31 DECEMBER 9,256,814 8,428,172
Secretariat of the Pacific CommunityProvident Fund
ANNUAL REPORT 2014 61
Statement of accounting policies
General
The Provident Fund of the Secretariat of the Pacific Community (hereinafter called ‘the Fund’) was established on January 1, 1953, for its officers and employees for the purpose of discharging the liability and/or responsibility (if any) of the Secretariat to the members in respect of provision for superannuation.
In accordance with the Rules of the Provident Fund (hereinafter called ‘the Rules’), the Fund is vested in and administered by the Secretariat on the trusts declared therein.
Subject to these Rules, and to any direction by the Secretariat in accordance therewith, the Director-General shall have and may exercise the powers and functions of the Secretariat under the Rules, with the exception of Rule 26, which covers amendments.
Any member may appeal to the Joint Appeals Board against any decision of the Director-General, as provided for in Chapter XIII of the Staff Rules.
Significant accounting policies and notes to the Provident Fund accounts
1. Accounting period
The accounting period used in the preparation of these accounts is the calendar year 1 January 2014 to 31 December 2014.
2. Currency used
The Provident Fund of all Noumea members, comprising both members’ and employer’s contributions, is invested in Noumea in CFP francs, while the Provident Fund of all Suva members is invested in Suva in Fiji dollars.
3. Exchange rate policy
For the purpose of consolidating the Suva Provident Fund investment with the Noumea Provident Fund investment at year end, the Suva Provident Fund interest and investment have been converted to CFP francs at the bank buying rate as at 31 December 2014 of FJD 1.00 = CFP49.43.
4. Loans to members
Loans to members consist of short-term loans borrowed against their holdings in the Provident Fund. In accordance with the Secretariat’s policy, a member can borrow an amount up to 90% of the member’s holdings in the Fund, provided that arrangements are made to repay the loan over a period of no longer than 12 months. The interest rate charged for such borrowings is a compound rate of 3.67% (which is 2% higher than the weighted average rate of interest earned on Provident Fund investments) as at 31 December 2014.
5. Loan to Secretariat of the Pacific Community
The Secretariat of the Pacific Community has borrowed money from the Fund to purchase accommodation for its staff in New Caledonia. This loan less capital repayments received is recognised as an asset by the Fund. Interest income is recognised on a straight line basis over the period of the loan.
ANNUAL REPORT 2014 62
Pacific Community members
American Samoa, Australia, Cook Islands, Federated States of Micronesia, Fiji, France, French Polynesia, Guam, Kiribati, Marshall Islands, Nauru, New Caledonia, New Zealand, Niue, Northern Mariana Islands, Palau, Papua New Guinea, Pitcairn
Islands, Samoa, Solomon Islands, Tokelau, Tonga, Tuvalu, United States of America, Vanuatu, and Wallis and Futuna.

Pacific CommunityAnnual Report
2014Sustainable Paci�c development through science,
knowledge and innovation
Headquarters: Noumea, New Caledonia
ISSN 1017-1983
Pacific Community│[email protected]│www.spc.int