Embed Size (px)
Citation preview
2 0 0 8 a n n u a l r e p o r t
S T A T E M E N T O F C O M P A N Y B U S I N E S SS T O C K H O L D E R S ’ I N F O R M A T I O N
Corporate OfficesPACCAR Building777 106th Avenue N.E.Bellevue, Washington98004
Mailing AddressP.O. Box 1518Bellevue, Washington98009
Telephone425.468.7400
Facsimile425.468.8216
Web sitewww.paccar.com
AeroCab, AERODYNE, Air Leaf, Braden, Carco, ComfortClass, DAF, Gearmatic, Kenmex, Kenworth, Kenworth Clean Power, Leyland, PACCAR, PACCAR MX, PACCAR PX, PacLease, PacTrac, Peterbilt, PX-6, PX-8, TRP, UltraCab and Unibilt are trademarks owned by PACCAR Inc and its subsidiaries.
Independent AuditorsErnst & Young LLPSeattle, Washington
SEC Form 10-KPACCAR’s annual report to the Securities and Exchange Commission will be furnished to stockholders on request to the Corporate Secretary, PACCAR Inc, P.O. Box 1518, Bellevue, Washington 98009. It is also available online at www.paccar.com/investors/investor_resources.asp, under SEC Filings.
Annual Stockholders’MeetingApril 28, 2009, 10:30 a.m. Meydenbauer Center11100 N.E. Sixth StreetBellevue, Washington98004
An Equal Opportunity Employer
This report was printed on recycled paper.
Stock Transfer and Dividend Dispersing AgentWells Fargo Bank Minnesota, N.A.Shareowner ServicesP.O. Box 64854St. Paul, Minnesota 55164-0854800.468.9716www.wellsfargo.com/shareownerservices
PACCAR’s transfer agent maintains the company’s shareholder records, issues stock certificates and distributes dividends and IRS Form 1099. Requests concerning these matters should be directed to Wells Fargo.
Online Delivery of Annual Report and Proxy StatementPACCAR’s 2008 Annual Report and the 2009 Proxy Statement are available on PACCAR’s Web site at www.paccar.com/2008annualmeeting/
Stockholders who hold PACCAR stock in street name may inquire of their bank or broker about the availability of electronic delivery of annual meeting documents.
Financial Highlights
Message to Shareholders
6 PACCAR Operations
Financial Charts
3 Stockholder Return Performance Graph
4 Management’s Discussion and Analysis
3 Consolidated Statements of Income
3 Consolidated Balance Sheets
34 Consolidated Statements of Cash Flows
35 Consolidated Statements
of Stockholders’ Equity
36 Consolidated Statements
of Comprehensive Income
36 Notes to Consolidated Financial Statements
50 Management’s Report on Internal Control
Over Financial Reporting
50 Report of Independent Registered Public
Accounting Firm on the Company’s
Consolidated Financial Statements
5 Report of Independent Registered Public
Accounting Firm on the Company’s
Internal Controls
5 Selected Financial Data
5 Common Stock Market Prices and Dividends
53 Quarterly Results
54 Market Risks and Derivative Instruments
55 Officers and Directors
56 Divisions and Subsidiaries
CONTENTS
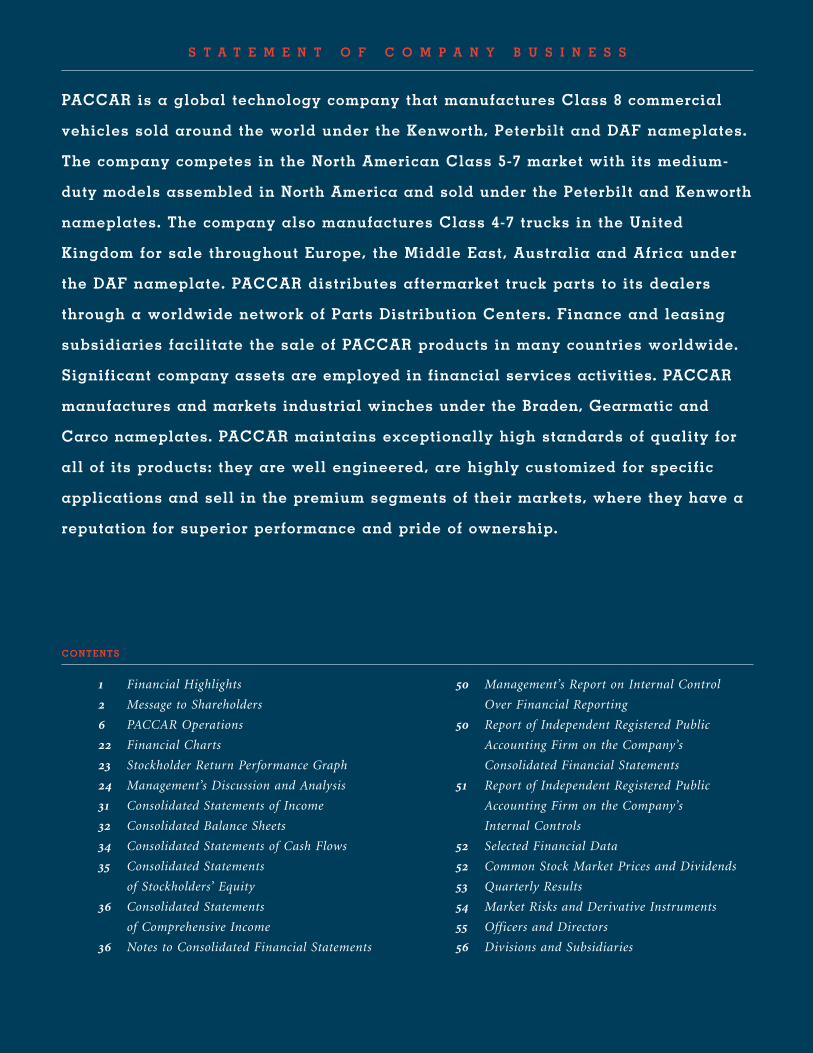
PACCAR is a global technology company that manufactures Class 8 commercial
vehicles sold around the world under the Kenworth, Peterbilt and DAF nameplates.
The company competes in the North American Class 5-7 market with its medium-
duty models assembled in North America and sold under the Peterbilt and Kenworth
nameplates. The company also manufactures Class 4-7 trucks in the United
Kingdom for sale throughout Europe, the Middle East, Australia and Africa under
the DAF nameplate. PACCAR distributes aftermarket truck parts to its dealers
through a worldwide network of Parts Distribution Centers. Finance and leasing
subsidiaries facilitate the sale of PACCAR products in many countries worldwide.
Significant company assets are employed in financial services activities. PACCAR
manufactures and markets industrial winches under the Braden, Gearmatic and
Carco nameplates. PACCAR maintains exceptionally high standards of quality for
all of its products: they are well engineered, are highly customized for specific
applications and sell in the premium segments of their markets, where they have a
reputation for superior performance and pride of ownership.
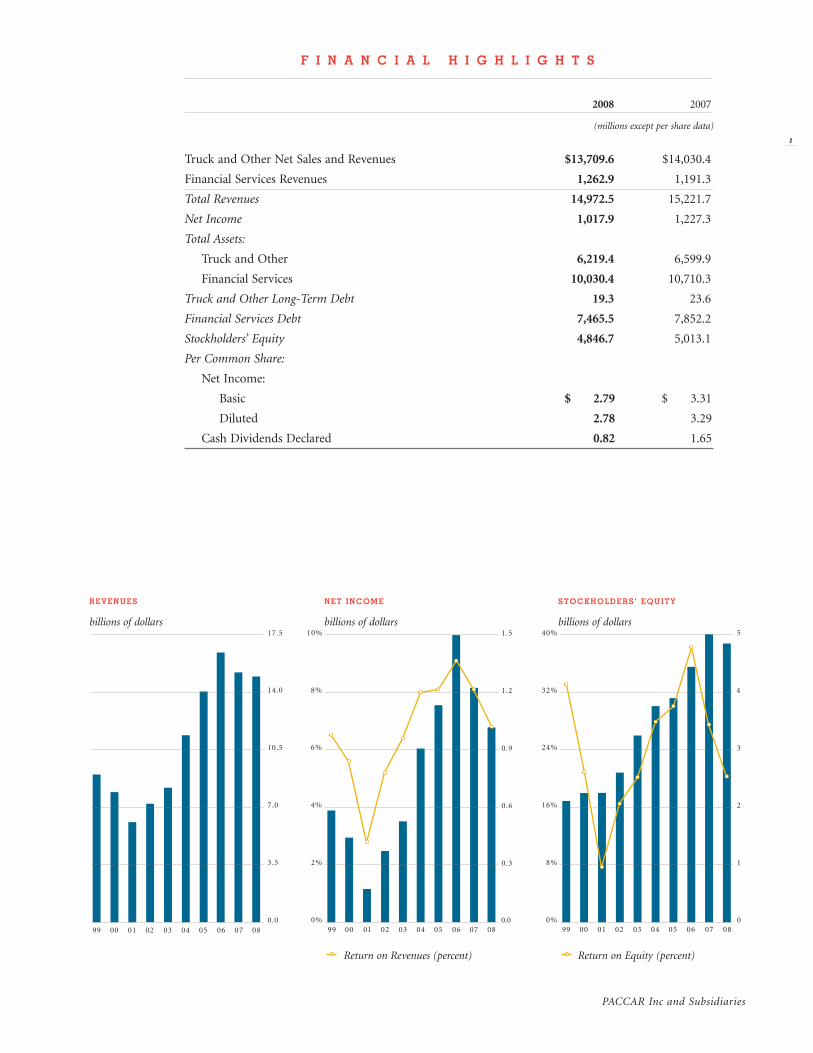
F i n a n c i a l h i g h l i g h t s
1
2008 2007
(millions except per share data)
Truck and Other Net Sales and Revenues $13,709.6 $14,030.4
Financial Services Revenues 1,262.9 1,191.3
Total Revenues 14,972.5 15,221.7
Net Income 1,017.9 1,227.3
Total Assets:
Truck and Other 6,219.4 6,599.9
Financial Services 10,030.4 10,710.3
Truck and Other Long-Term Debt 19.3 23.6
Financial Services Debt 7,465.5 7,852.2
Stockholders’ Equity 4,846.7 5,013.1
Per Common Share:
Net Income:
Basic $ 2.79 $ 3.31
Diluted 2.78 3.29
Cash Dividends Declared 0.82 1.65
PACCAR Inc and Subsidiaries
$
REVEnUEs
billions of dollars
stockholdERs’ EqUity
billions of dollars
nEt incomE
billions of dollars
Return on Equity (percent)
99 00 01 02 03 04 05 06 07 08
R E V E N U E S
billions of dollars17.5
14.0
10.5
7.0
3.5
0.099 00 01 02 03 04 05 06 07 08
N E T I N C O M E
billions o f do l lar s 1.5
1.2
0.9
0.6
0.3
0.0
4%
6%
8%
10%
2%
0%99 00 01 02 03 04 05 06 07 08
S T O C K H O L D E R S ’ E Q U I T Y
billions of dollars 5
4
3
216%
24%
32%
40%
8%
0%
1
0
Return on Revenues (percent)
2
Industry Class 8 truck sales in North America, including
Mexico, declined to 179,000 vehicles, compared to
207,000 the prior year. Over 3,000 fleets declared
bankruptcy due to lower freight volume, higher fuel
prices and the recessionary economy. The European
heavy truck market in 2008 was 334,000 vehicles,
compared to 337,000 in 2007, a strong performance that
declined abruptly in the fourth quarter 2008. Many of
our competitors are discounting their vehicles below
cost in the challenging market. There may be some
competitors exiting the business in the next few years
due to lack of profitability.
Even in this troubled market, PACCAR continued to
be one of the leaders in financial performance for
capital goods companies worldwide. After-tax return on
beginning shareholder equity (ROE) was 20.3 percent in
2008, compared to 27.5 percent in 2007. The company’s
2008 after-tax return on revenues was 6.8 percent.
PACCAR has distributed over $3.5 billion in dividends
and increased shareholder equity to $4.85 billion during
the last ten years. PACCAR’s average annual total
shareholder return was 17.6 percent over the last decade,
versus a negative 1.4 percent for the Standard & Poor’s
500 Index. The fragility of global financial institutions
provided a timely reminder of the merits of PACCAR’s
conservative business approach and quality product and
customer service focus.
t o o U R s h a R E h o l d E R s
PaccaR had a very good year in 2008, even as the global recession had an
increasingly negative impact on the company’s results throughout the year. PaccaR’s
success is due to its global diversification, superior product quality, technology-led
process efficiency and strong results from aftermarket parts and financial services.
the company has delivered an impressive 70 consecutive years of net income.
customers benefited from PaccaR’s record $805 million of capital investments and
research and development, which enhanced manufacturing capability, developed
innovative aftermarket support programs and accelerated new product introductions.
PaccaR delivered 126,000 trucks to its customers and sold $2.3 billion of aftermarket
parts. PaccaR had record truck deliveries in Europe, which were offset by a depressed
truck market in the U.s. and canada. PaccaR Financial services generated $3.4
billion of new loan and lease business.
net income of $1.02 billion on revenues of $15.0 billion was the fourth highest in
the company’s 103-year history. PaccaR declared cash dividends of $.82 per share,
including a special dividend of $.10 per share. Regular quarterly cash dividends have
increased over 500 percent in the last 10 years.
3
inVEsting FoR thE FUtURE — PACCAR’s solid
profits, excellent balance sheet and intense focus on
quality, technology and productivity enhancements have
allowed the company to invest $3.8 billion since 1999
in capital projects, products and processes. Yearly
productivity and efficiency improvement of 5-7 percent
and capacity improvement of over 100 percent in the last
five years have enhanced the capability of manufacturing
and parts facilities. PACCAR is recognized as one of the
leading applied-information technology companies in the
industry, and innovation continues to be a cornerstone
of its success.
Capital investments were a record $463 million in
2008. One exciting multi-year initiative is the
construction of PACCAR’s engine assembly plant in
Mississippi, which builds upon our legacy as a premier
engine manufacturer. Other major capital projects
during the year included the unveiling of an enhanced
engine research and development center in PACCAR’s
Technical Center (Mt. Vernon, Washington), opening of
a new parts distribution center (PDC) in Budapest,
Hungary, and a 20 percent capacity improvement at
Leyland’s manufacturing facility.
PACCAR continues to examine business opportunities
in Asia, with its primary focus on China and India.
PACCAR is increasing its purchases and component sales
in China through its Shanghai office. The business
opportunities in Asia have dampened, but still present
attractive long-term returns.
siX sigma — Six Sigma is integrated into all business
activities at PACCAR and has been adopted at 190 of the
company’s suppliers and many of the company’s dealers.
Its statistical methodology is critical in the development
of new product designs, customer services and
manufacturing processes. Since inception, Six Sigma has
delivered over $1.2 billion in cumulative savings across
the company. In addition, “High Impact Kaizen Events”
(HIKEs) leverage Six Sigma methods with production
flow improvement concepts. Almost 13,000 employees
have been trained in Six Sigma and 9,700 projects have
been implemented since its inception. Six Sigma, in
conjunction with Supplier Quality and Development,
has been vital to improving logistics performance and
component quality by the company’s suppliers.
inFoRmation tEchnology — PACCAR’s
Information Technology Division (ITD) and its 650
innovative employees are an important competitive
asset for the company. PACCAR’s use of information
technology is centered on developing and integrating
software and hardware that will enhance the quality and
efficiency of all products and operations throughout
the company, including the seamless integration of
suppliers, dealers and customers. In 2008, ITD provided
innovative advancements in new manufacturing software
and infrastructure capacity upgrades. Over 17,000 dealers,
customers, suppliers and employees have experienced
the company’s technology center highlighting surface
computing, tablet PCs, an electronic leasing and finance
office and an electronic service analyst.
tRUcks — U.S. and Canadian Class 8 industry retail
sales in 2008 were 153,000 units, and the Mexican market
totaled 26,000. The European Union (EU) industry
heavy truck sales were 334,000 units.
PACCAR’s Class 8 retail sales in the U.S. and Canada
achieved a market share of 26.0 percent in 2008
compared to 26.4 percent the prior year. DAF achieved
14.1 percent share in the 15+ tonne truck market in
Europe. Industry Class 6 and 7 truck registrations in the
U.S. and Canada were 60,000 units, a 31 percent decrease
from the previous year. In the EU, the 6- to 15-tonne
market was 80,000 units, down 5 percent from 2007.
PACCAR’s North American and European market shares
in the medium-duty truck segment were excellent, as the
company delivered 23,000 medium-duty trucks and
tractors in 2008.
A tremendous team effort by the company’s
purchasing, materials and production personnel
contributed to improved product quality and
manufacturing efficiency during challenging market
conditions. High commodity prices, which began to
abate during the year, were partially offset by PACCAR’s
excellent long-term supplier partnerships, which enabled
production and efficiency improvements.
PACCAR’s product quality continued to be recognized
as the industry leader in 2008. Kenworth dominated
customer satisfaction awards in the Class 8 markets and the
DAF CF was the 2008 Fleet Truck of the Year in the U.K.
Over 65 percent of PACCAR’s revenue was generated
outside the United States, and the company realized
4
excellent synergies globally in product development, sales
and finance activities, purchasing and manufacturing.
DAF Trucks achieved record truck production and sales
and excellent market share.
Leyland Trucks is the United Kingdom’s leading truck
manufacturer. Leyland expanded its innovative body-
building program that has delivered over 750 custom-
built-bodied vehicles to customers.
PACCAR Mexico (KENMEX) had a challenging year
as the Mexican economy slowed and truck fleets were
reduced. Their new manufacturing facility is delivering
improved efficiency and product quality.
PACCAR Australia achieved good results in 2008. The
introduction of new Kenworth models and expansion
of the DAF product range in Australia combined for a
24.5 percent heavy-duty market share in 2008. PACCAR
Parts Australian sales delivered another year of record
performance.
PACCAR International exports trucks and parts to
over 100 countries and had an excellent year due to strong
sales buoyed by natural resource exploration globally.
AFTERMARKET CUSTOMER SERVICES — PACCAR
Parts had an excellent year in 2008. With sales of
$2.3 billion, PACCAR Parts is the primary source for
aftermarket parts for PACCAR products, and supplies
parts for other truck brands to PACCAR’s dealer networks
around the world. Over five million heavy-duty trucks
are operating in North America and Europe, and the
average age of these vehicles is estimated to be over six
years. The large vehicle parc creates excellent demand
for parts and service and moderates the cyclicality of
truck sales.
PACCAR Parts added new distribution centers and
expanded current facilities to enhance logistics
performance to dealers and customers. PACCAR Parts
continues to lead the industry with technology that
offers competitive advantages at PACCAR dealerships.
Managed Dealer Inventory (MDI) is now installed at
1,050 PACCAR dealers worldwide. PACCAR Parts
enhanced its Connect program, a software solution for
customer fleet-maintenance management. The web-based
application provides fleets with the tools to reduce their
vehicle operating costs.
FINANCIAL SERVICES — PACCAR Financial Services’
(PFS) conservative business approach, coupled with
PACCAR’s superb S&P credit rating of AA- and the
strength of the dealer network, enabled PFS to earn good
results in 2008 despite turbulent worldwide financial
markets. The PACCAR Financial Services group of
companies has operations covering three continents
and 20 countries. The global breadth of PFS and its
responsive credit application processes supported a
portfolio of 166,000 trucks and trailers, with total assets
of $10 billion and earned a pre-tax profit of $217 million.
PACCAR Financial Services is the preferred funding
source in North America for Peterbilt and Kenworth
trucks, financing 32 percent of dealer sales.
The unsettled financial markets and resulting “credit
crunch” presented a daily challenge that increased
funding costs for our customers and prompted a
contraction in our finance companies’ assets. Special
praise is merited for PACCAR’s treasury and finance
teams who diligently, creatively and positively managed
the company through a very challenging market in 2008.
PACCAR Financial Europe (PFE) completed its
seventh year of operations, with increased assets and
good profits as it served DAF dealers in 16 European
countries. PFE provides wholesale and retail financing
for DAF dealers and customers, and finances 21 percent
of DAF’s vehicle sales.
PACCAR Leasing (PacLease) earned its 15th
consecutive year of record operating profits and placed
4,900 new PACCAR vehicles in service in 2008. The
PacLease fleet grew to over 32,500 vehicles as 18 percent
of the North American Class 6-8 market selected full-
service leasing to satisfy their equipment needs. PacLease
substantially strengthened its market presence in 2008,
increasing its global network to 362 outlets, and
represents one of the largest full-service truck rental
and leasing operations in North America.
ENVIRONMENTAL LEADERSHIP — PACCAR is a global
environmental leader. A significant accomplishment
during the year was earning ISO 14001 environmental
certification at all PACCAR manufacturing facilities in
Europe and North America. PACCAR introduced
medium-duty hybrid-electric vehicles, which can achieve
up to a 30 percent fuel economy improvement. Several
of the manufacturing facilities achieved “Zero Waste to
Landfill” status during the year. PACCAR employees
are environmentally conscious and utilize van pools, car
pools and bus passes for 30 percent of their business
commuting.
A LOOK AHEAD — The dedicated efforts of PACCAR’s
18,000 employees enabled the company to distinguish
itself as a global leader in the technology, capital goods,
financial services and aftermarket parts businesses.
Superior product quality, technological innovation and
balanced global diversification are three key operating
characteristics that define PACCAR’s business philosophy.
In North America and Europe, the recession will have
a negative impact on the truck market in 2009. The
implementation of updated North American engine
emission standards in 2010 may encourage some
operators to slightly pull forward their truck purchases.
Current estimates for Class 8 trucks in North America
indicate that annual industry sales could be similar to
2001 and range from 130,000-170,000 units. This is one
of the lowest levels of sales in the last 10 years. Sales
for Class 6-7 trucks are expected to be between 50,000-
60,000 vehicles. The European heavy-duty truck market,
which had a strong year in 2008, could decline by 40
percent, with sales between 200,000-240,000 trucks,
while demand for medium trucks should range from
50,000-65,000 units.
Though PACCAR had a very good year in 2008, with
several operating divisions achieving record results, the
outlook for 2009 appears difficult due to tumultuous
economic conditions. The company has taken proactive
steps to adjust production rates as well as structurally
reduce costs throughout the organization. The benefits of
geographic diversification, dedicated employees, quality
products, modern facilities, innovative IT systems and a
strong balance sheet, working in tandem with the best
distribution network in the industry, are the fundamental
elements that make PACCAR a vibrant, dynamic
company. PACCAR is well positioned and committed to
maintaining the profitable results its shareholders expect,
by delivering global leading products and services.
PACCAR recognizes two significant retirements. Vice
Chairman Mike Tembreull retired upon completion of
over 38 years of exemplary service, in which he was
instrumental in the profitable growth of PACCAR
Financial and the integration of DAF into PACCAR.
Jim Pigott is retiring after 37 years on the Board of
Directors. Jim also worked for PACCAR for thirteen years
and was an inspirational leader on the Board, sharing his
wisdom, insight and global business knowledge. We
thank Jim and Mike for their dedication and wish both
a happy and healthy retirement.
PACCAR and its employees are firmly committed to
strong quality growth and are proud of the remarkable
achievement of 70 consecutive years of net profit.
PACCAR plans for the long-term, and our shareholders
have benefited from that approach. The embedded
principles of integrity, quality and consistency of
purpose continue to define the course in PACCAR’s
operations. The proven business strategy — delivering
technologically advanced, premium products and an
extensive array of tailored aftermarket customer services
— enables PACCAR to approach growth opportunities
pragmatically with a long-term focus. In a challenging
recession, PACCAR continues to enhance its stellar
reputation as a leading technology company in the
capital goods and financial service marketplace.
5
m A r K c . p i g O t t
Chairman and Chief Executive Officer
February 16, 2009
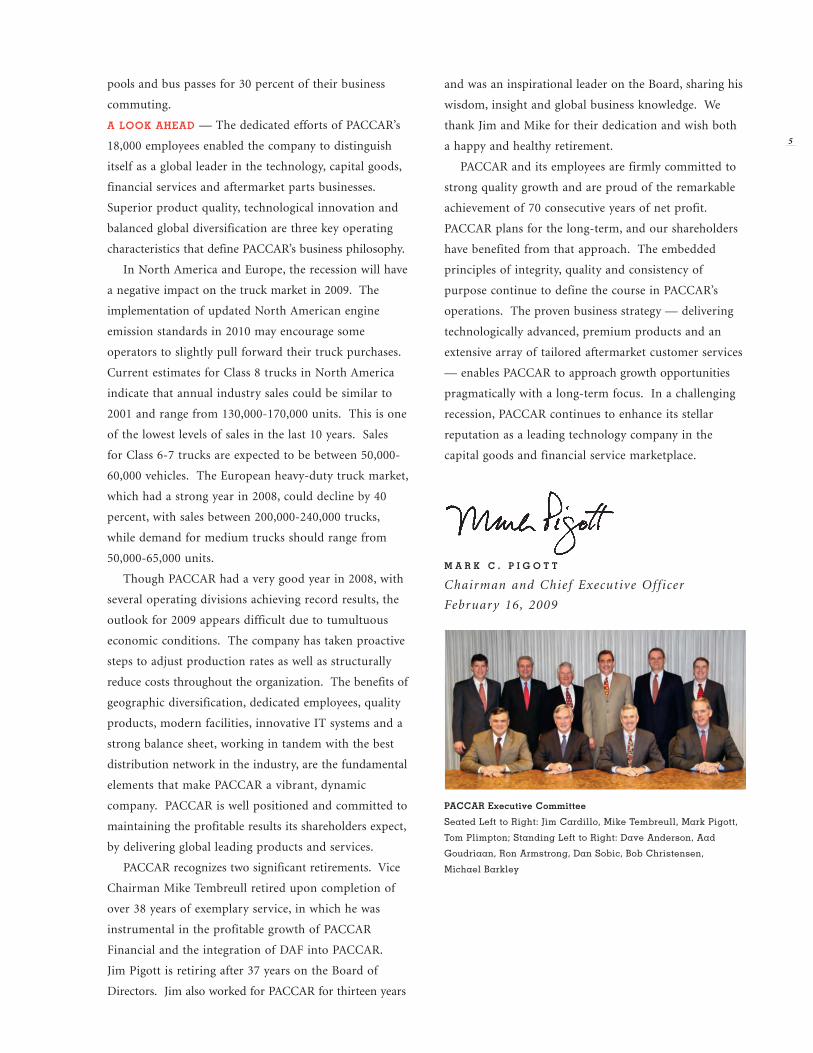
pAccAr Executive committee
Seated Left to Right: Jim Cardillo, Mike Tembreull, Mark Pigott,
Tom Plimpton; Standing Left to Right: Dave Anderson, Aad
Goudriaan, Ron Armstrong, Dan Sobic, Bob Christensen,
Michael Barkley
D A F T R U C K S
DAF Trucks N.V. celebrated its 80th anniversary in 2008 by achieving new sales and
production records. Truck deliveries exceeded 64,000 units as DAF strengthened its
reputation as one of Europe’s leading commercial vehicle manufacturers.
DAF Trucks increased its market share in both the light and heavy truck segments due to a class-leading
product range and a comprehensive dealer network throughout Europe. In the light truck segment, market share
grew from 8.3 percent in 2007 to 9.3 percent in the EU last year. In the over 15-tonne segment, DAF’s EU share
increased from 13.9 percent in 2007 to 14.1 percent in 2008.
The DAF CF85 won “Fleet Truck of the Year” for an unprecedented eighth time at the Motor Transport awards in
London. Organized by the leading British magazine Motor Transport, the judging panel consisted of 25 prominent
U.K. based fleet operators. The CF series also captured the “Technology and Innovation Award,” a distinction
awarded by the Australian trade journal Motoring Matters to truck and trailer manufacturers who have made
important contributions to the advancement of vehicle and driver safety.
DAF earned, for the second year, the award for “Best Bus
Engine Producer” and “Best Coach Engine Producer” at Bus
World Asia in Shanghai. The engines were honored due to the
reliability and durability of the PACCAR 9.2-liter and PACCAR
12.9-liter engines, combined with their excellent fuel efficiency.
In 2008, DAF Trucks was the world’s first truck
manufacturer to offer Enhanced Environmentally-friendly
Vehicles (EEV) in its entire product range. These EEV trucks feature particulate emissions 50 percent lower than
the stringent Euro 5 emission standards scheduled for October 2009.
DAF unveiled significant enhancements to its popular CF and XF105 models for 2009. The vehicles offer
attractive and contemporary new interior designs, an enhanced driveline and — as options — adaptive cruise
control and forward collision warning systems. In recognition of its 80th anniversary, DAF unveiled a limited
edition XF105. The special flagship model exhibits a striking distinctive exterior design with silver accents and
extensive premium interior features.
DAF introduced a sophisticated telematics package that offers a data communications system enabling
operators to optimize fuel management and their business processes.
The PACCAR Production System (PPS) integration enhanced DAF’s manufacturing efficiency and product
quality. The 50-PPM (Parts Per Million) Initiative, introduced in all manufacturing plants, sets a new standard
for supplier operational excellence.
DAF Trucks expanded its extensive distribution network with 25 new facilities opening in Central and Eastern
European markets.
7
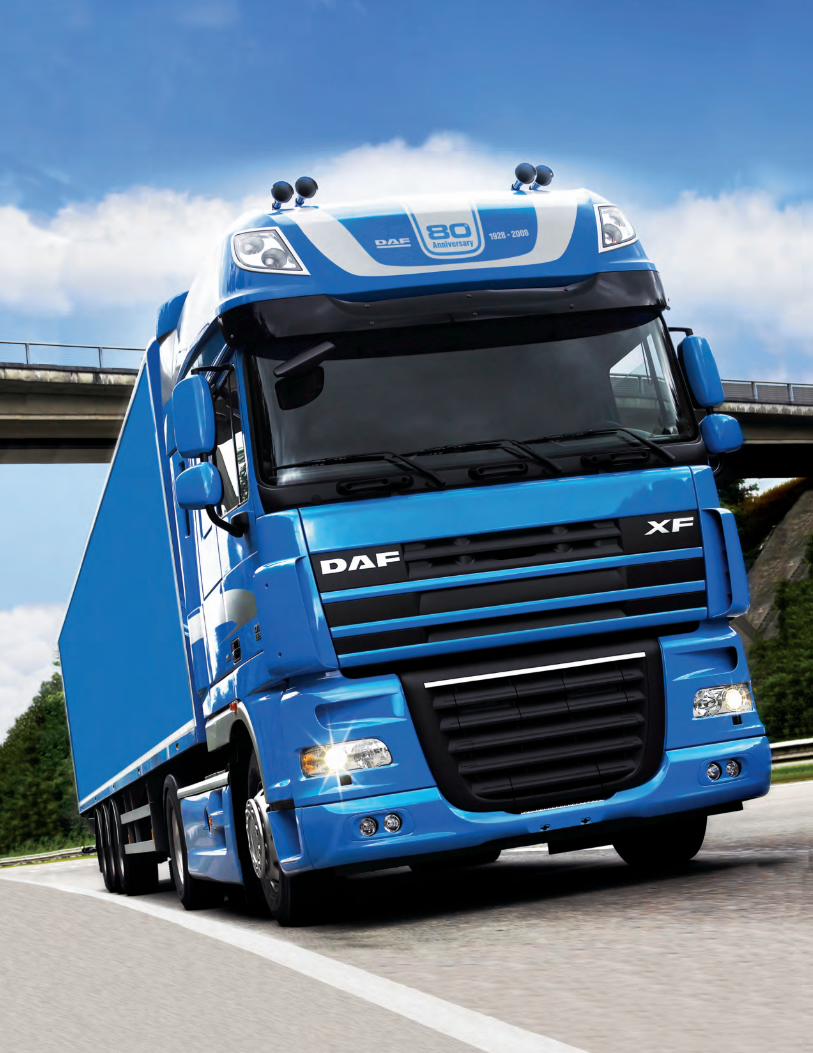
DAF has earned a reputation, during the past 80 years, for developing, manufacturing and
servicing innovative, industry-leading transport equipment of the highest quality. DAF
marked its eighth decade with a special, limited edition of its flagship model XF105.

p e t e r b i l t m o t o r s c o m p a n y
peterbilt set a market share record in 2008, capturing more than 13 percent of class 8
truck sales in the U.s. peterbilt’s innovative fuel-conserving technology, leading-edge
aerodynamics and superior product quality reinforce peterbilt’s position as the “class”
of the industry.
Peterbilt Models 387 and 386 were recognized as fuel efficient and environmental vehicle leaders by the
Environmental Protection Agency’s (EPA) SmartWaySM program. These Peterbilt trucks utilize a proprietary
range of fuel-saving, low-emission equipment specifications for Class 8 long-haul tractors and trailers which
have established the industry performance standard.
In 2008, Peterbilt introduced the Class 6 Model 330 and Class 7 Model 335 hybrid vehicles that reduce
emissions and the vehicle’s carbon footprint, as well as delivering Peterbilt quality and performance. The
fuel savings achieved by these hybrid vehicles range up to
30 percent depending on the application.
Peterbilt introduced the Model 388 Low Profile truck,
designed specifically for the auto carrier industry. The lower
cab height allows the transport of larger vehicles and increases
by 10 percent the number of vehicles that may be hauled.
Peterbilt is developing hybrid Hydraulic Launch Assist
technology on its low-cab-forward Model 320 for vocational and refuse applications. Testing has shown a
significant improvement in fuel economy and potential brake maintenance reduction of 50 percent annually.
Peterbilt launched a proprietary front Air Leaf Suspension on Models 384, 386, 388 and 389, which offers a
20 percent improvement in ride and delivers excellent handling characteristics.
Peterbilt updated its conventional medium-duty product Model 335 with a new dash featuring improved
side-window defrost and new panel colors. The Peterbilt Navigation System incorporates a five-inch touch-
screen and an MP3 audio player.
Peterbilt continues to make significant investments in its manufacturing facilities to enhance efficiency and
product quality. The Denton, Texas, plant installed a chassis robotic paint system to increase capacity by 50
percent and enhance Peterbilt’s industry-leading quality. Peterbilt is the first North American truck
manufacturer to achieve this innovative milestone.
The Peterbilt Denton facility achieved an impressive environmental standard of “Zero Waste to Landfill” and
global ISO 14001 certification. The elimination of waste was accomplished through recycling programs, employee
involvement and partnering with strategic suppliers. Peterbilt Denton produced its 300,000th vehicle during the
year.
The Peterbilt dealer network expanded to a record 246 locations throughout the U.S. and Canada.
9
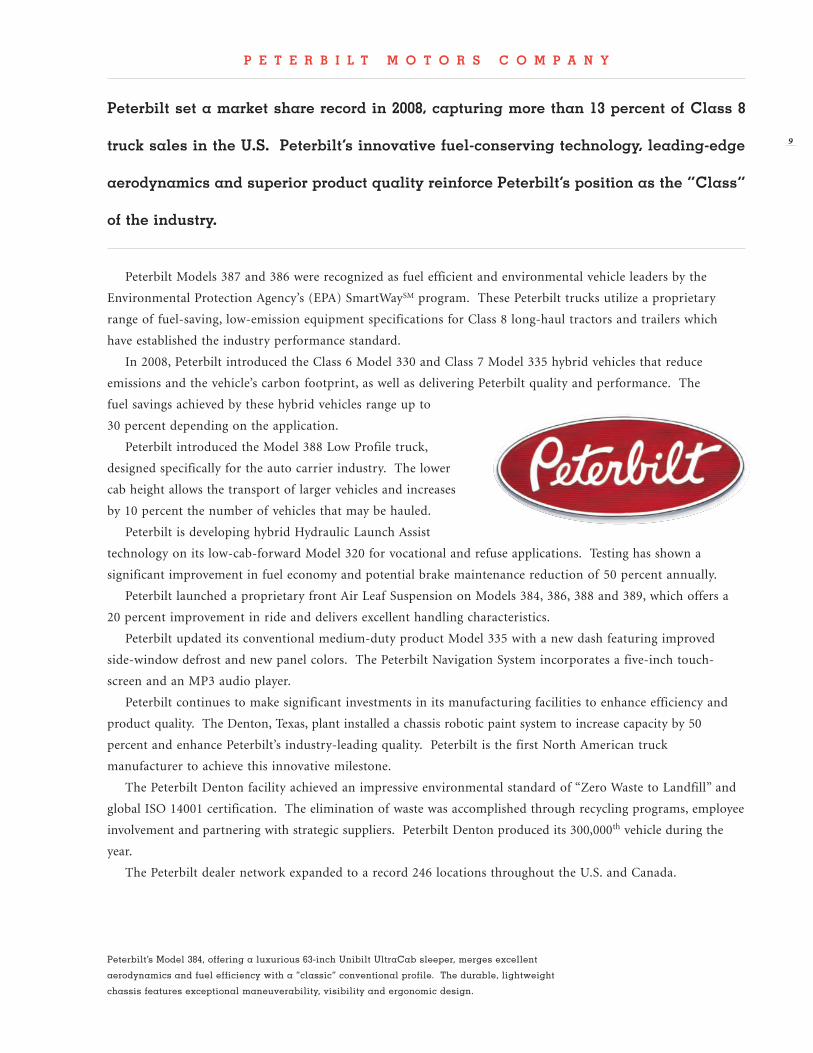
Peterbilt’s Model 384, offering a luxurious 63-inch Unibilt UltraCab sleeper, merges excellent
aerodynamics and fuel efficiency with a “classic” conventional profile. The durable, lightweight
chassis features exceptional maneuverability, visibility and ergonomic design.
f i n a n c i a l c h a r t s
k e n w o r t h t r u c k c o m p a n y
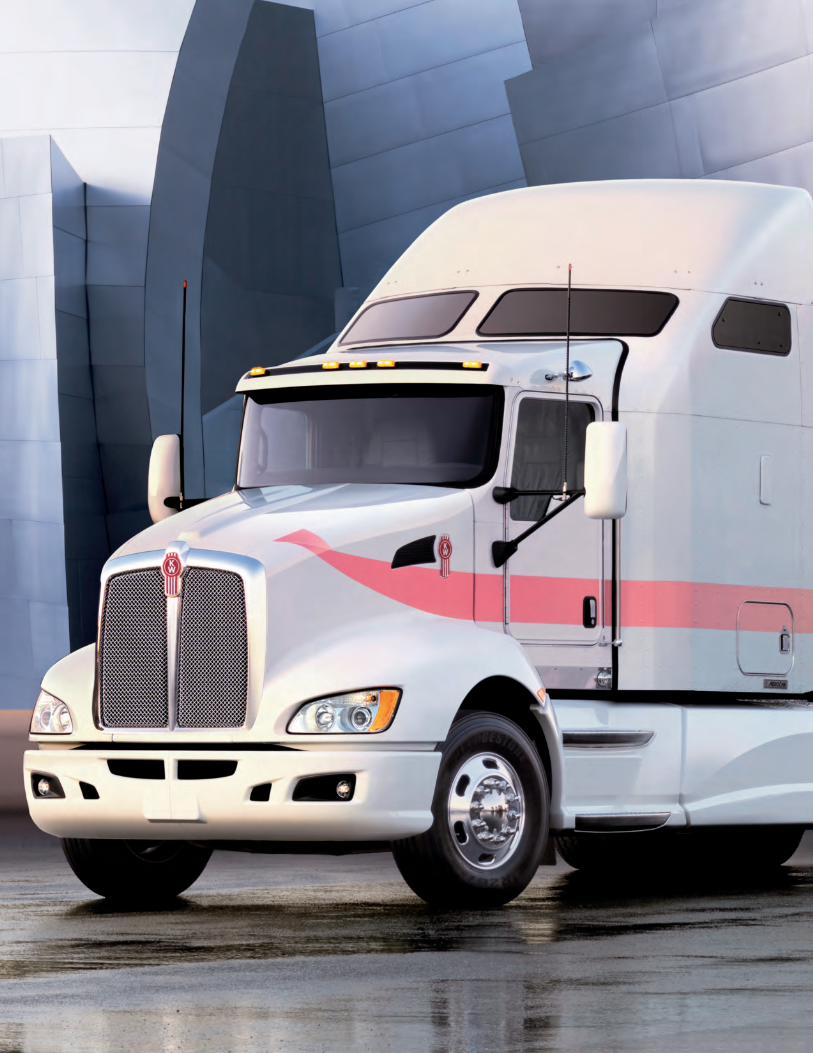
kenworth swept the vehicle segment awards in the 2008 J.D. power and associates
heavy Duty truck customer Satisfaction Study for the second consecutive year —
ranking highest in the over the road and Vocational categories.*
Kenworth introduced a new Driver Information Center for the T2000, which provides drivers with real-time
information to increase fuel economy and efficiency. The Driver Information Center offers an enhanced
multiplex instrumentation system featuring diagnostic information to optimize engine performance.
Kenworth delivered record Class 6-7 market share in the U.S. as more customers recognized the benefits of
Kenworth vehicle durability and ease of handling for city applications.
Kenworth’s new T270 and T370 medium duty diesel-electric hybrid trucks offer
fuel efficiency improvements up to 30 percent in delivery applications and up to
50 percent in utility applications.
Kenworth T800 liquefied natural gas (LNG) trucks were launched with excellent
results. Greenhouse gas emissions were reduced by 20 percent and this new model
has been embraced as a leading alternative fuel vehicle at West Coast ports, such as
the Ports of Los Angeles and Long Beach.
The environmentally friendly Kenworth Clean Power no-idle system is available
on all 72-inch AeroCab sleepers, including the T660, T800 and W900 models. Clean
Power is a proprietary thermal storage technology that maintains constant cab
temperature during non-driving hours. Savings from Clean Power can improve fuel
economy by up to eight percent for fleets with high idle time.
Kenworth Class 8 truck models introduced updated interior trim packages that
incorporated additional storage, ergonomic display panels and new dash refinements.
Kenworth introduced new proprietary suspensions to enhance the ride and handling performance in its
vehicles. The Kenworth AG130 front-axle air suspension is the first front air suspension designed for Kenworth
trucks and improves ride performance by over 15 percent. The new AG400L rear suspension is available in a
tandem axle configuration for Class 8 trucks and a single axle configuration for medium duty models.
Kenworth installed a second robotic paint line at its Chillicothe, Ohio, plant. This is the first PACCAR facility
to integrate four robots painting cabs, hoods and sleepers simultaneously. Kenworth plants in Chillicothe and
Renton, Washington, earned the International Organization for Standardization (ISO) 14001 certification for
superior environmental management systems.
The Kenworth Dealer Network increased to a record 301 dealer locations in the U.S. and Canada.
11
* Kenworth received the highest numerical score among Over the Road and Vocational Class 8 trucks in the proprietary J.D. Power and Associates 2008 Heavy-Duty Truck Customer Satisfaction StudySM. Study based on 2,692 U.S. responses and measures opinions of principal maintainers. Proprietary study results are based on experiences and perceptions of those surveyed in March-June 2008.
Kenworth is a leader in designing innovative, technology-driven products that meet the
challenges of today’s operating environment. The T660 AeroCab AERODYNE delivers fuel
optimizing aerodynamic design and long-haul luxury.
12
P A C C A R A u s t R A l i A
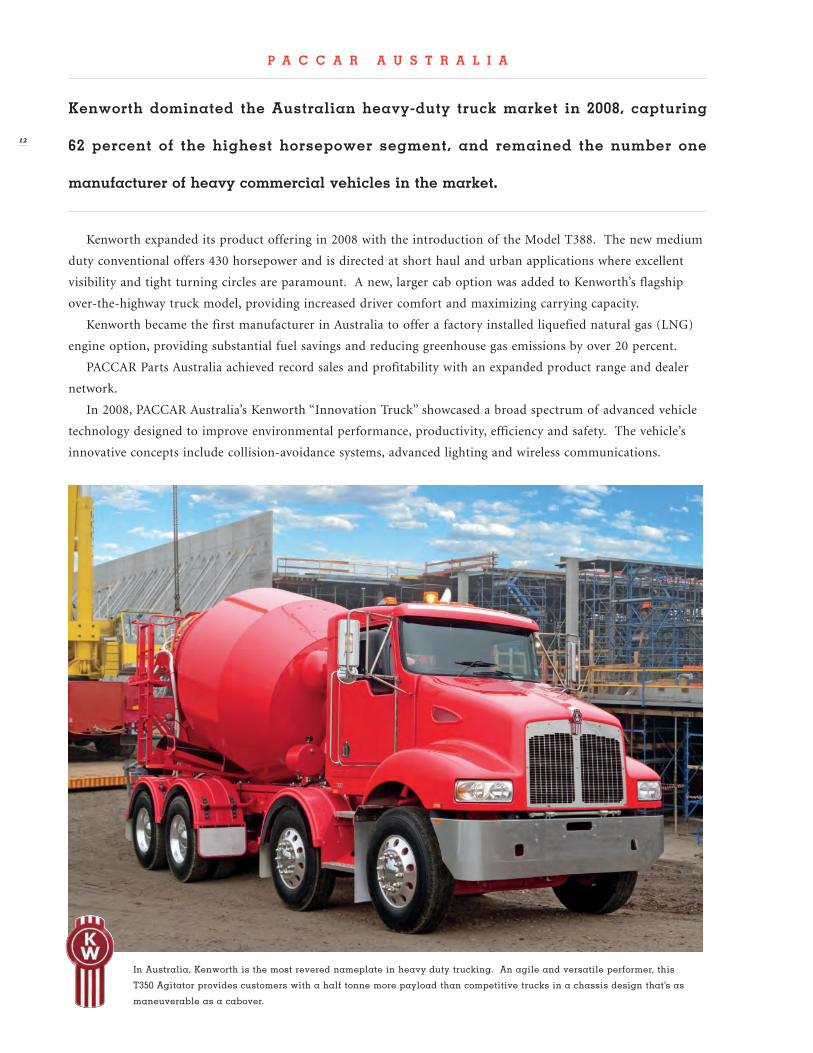
Kenworth dominated the Australian heavy-duty truck market in 2008, capturing
62 percent of the highest horsepower segment, and remained the number one
manufacturer of heavy commercial vehicles in the market.
Kenworth expanded its product offering in 2008 with the introduction of the Model T388. The new medium
duty conventional offers 430 horsepower and is directed at short haul and urban applications where excellent
visibility and tight turning circles are paramount. A new, larger cab option was added to Kenworth’s flagship
over-the-highway truck model, providing increased driver comfort and maximizing carrying capacity.
Kenworth became the first manufacturer in Australia to offer a factory installed liquefied natural gas (LNG)
engine option, providing substantial fuel savings and reducing greenhouse gas emissions by over 20 percent.
PACCAR Parts Australia achieved record sales and profitability with an expanded product range and dealer
network.
In 2008, PACCAR Australia’s Kenworth “Innovation Truck” showcased a broad spectrum of advanced vehicle
technology designed to improve environmental performance, productivity, efficiency and safety. The vehicle’s
innovative concepts include collision-avoidance systems, advanced lighting and wireless communications.
In Australia, Kenworth is the most revered nameplate in heavy duty trucking. An agile and versatile performer, this
T350 Agitator provides customers with a half tonne more payload than competitive trucks in a chassis design that’s as
maneuverable as a cabover.
p a c c a r m e x i c o
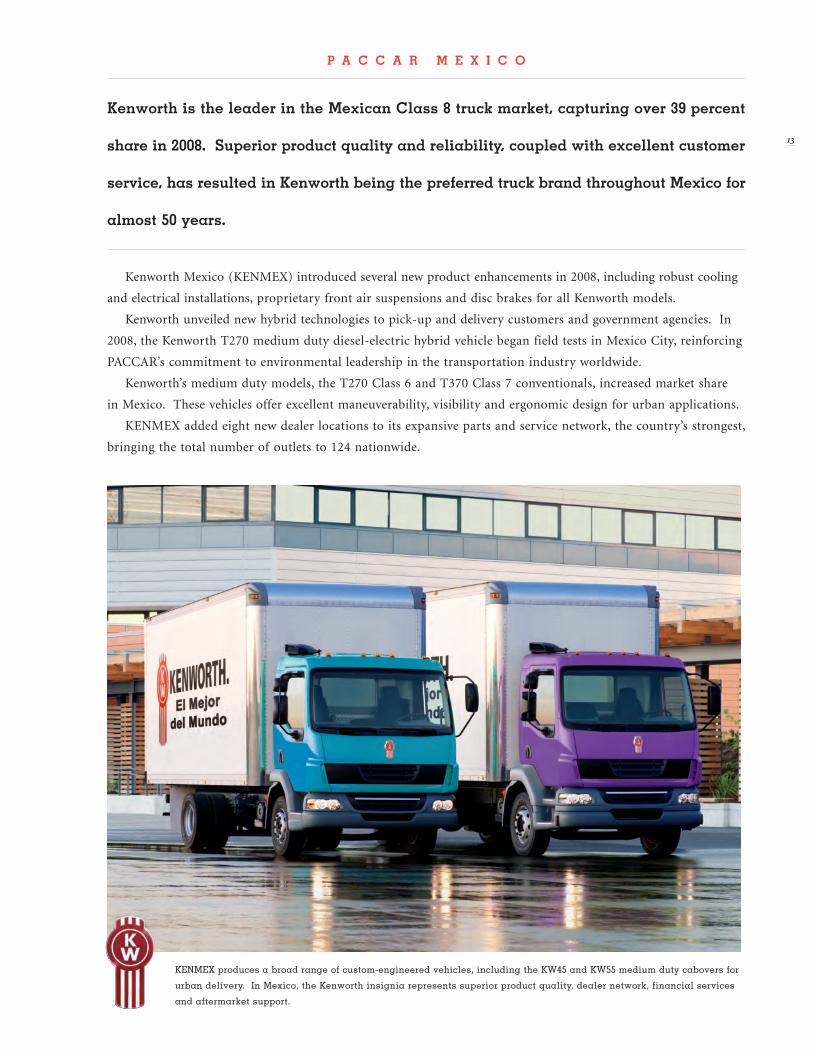
Kenworth is the leader in the mexican class 8 truck market, capturing over 39 percent
share in 2008. Superior product quality and reliability, coupled with excellent customer
service, has resulted in Kenworth being the preferred truck brand throughout mexico for
almost 50 years.
Kenworth Mexico (KENMEX) introduced several new product enhancements in 2008, including robust cooling
and electrical installations, proprietary front air suspensions and disc brakes for all Kenworth models.
Kenworth unveiled new hybrid technologies to pick-up and delivery customers and government agencies. In
2008, the Kenworth T270 medium duty diesel-electric hybrid vehicle began field tests in Mexico City, reinforcing
PACCAR’s commitment to environmental leadership in the transportation industry worldwide.
Kenworth’s medium duty models, the T270 Class 6 and T370 Class 7 conventionals, increased market share
in Mexico. These vehicles offer excellent maneuverability, visibility and ergonomic design for urban applications.
KENMEX added eight new dealer locations to its expansive parts and service network, the country’s strongest,
bringing the total number of outlets to 124 nationwide.
13
KENMEX produces a broad range of custom-engineered vehicles, including the KW45 and KW55 medium duty cabovers for
urban delivery. In Mexico, the Kenworth insignia represents superior product quality, dealer network, financial services
and aftermarket support.
14
l e y l a n d t r u c K S
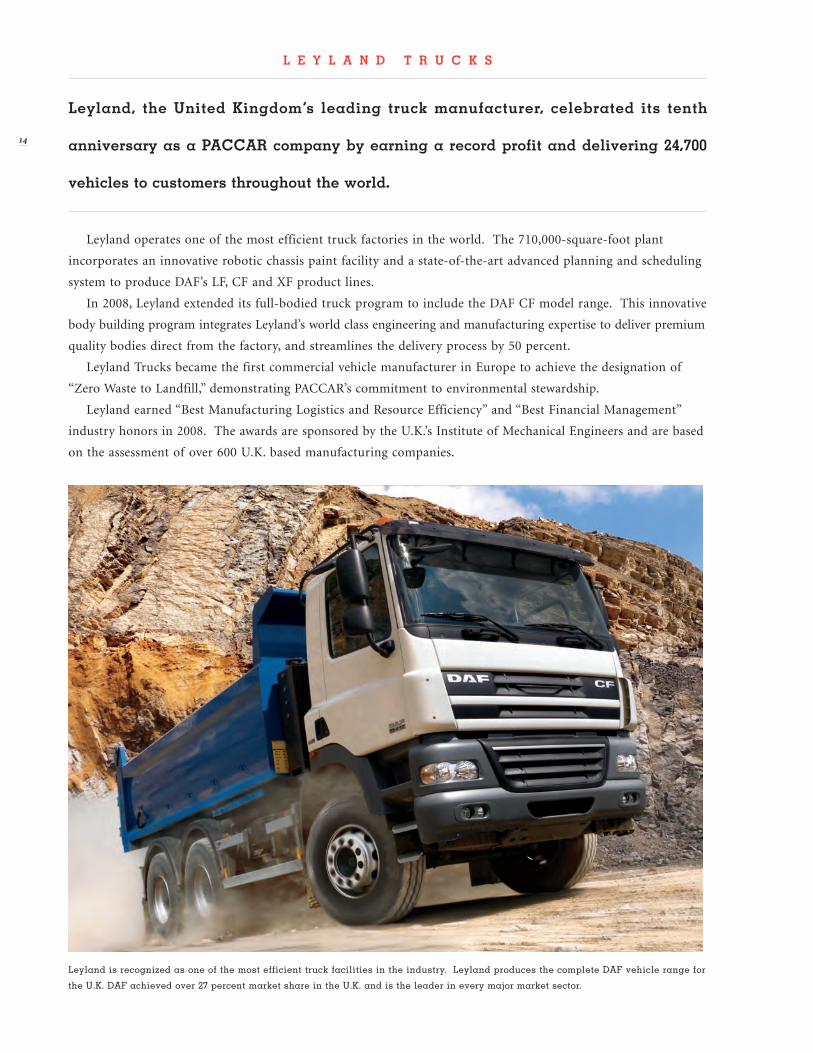
leyland, the united Kingdom’s leading truck manufacturer, celebrated its tenth
anniversary as a paccar company by earning a record profit and delivering 24,700
vehicles to customers throughout the world.
Leyland operates one of the most efficient truck factories in the world. The 710,000-square-foot plant
incorporates an innovative robotic chassis paint facility and a state-of-the-art advanced planning and scheduling
system to produce DAF’s LF, CF and XF product lines.
In 2008, Leyland extended its full-bodied truck program to include the DAF CF model range. This innovative
body building program integrates Leyland’s world class engineering and manufacturing expertise to deliver premium
quality bodies direct from the factory, and streamlines the delivery process by 50 percent.
Leyland Trucks became the first commercial vehicle manufacturer in Europe to achieve the designation of
“Zero Waste to Landfill,” demonstrating PACCAR’s commitment to environmental stewardship.
Leyland earned “Best Manufacturing Logistics and Resource Efficiency” and “Best Financial Management”
industry honors in 2008. The awards are sponsored by the U.K.’s Institute of Mechanical Engineers and are based
on the assessment of over 600 U.K. based manufacturing companies.
Leyland is recognized as one of the most efficient truck facilities in the industry. Leyland produces the complete DAF vehicle range for
the U.K. DAF achieved over 27 percent market share in the U.K. and is the leader in every major market sector.
15
p a c c a r i n t e r n a t i o n a l
paccar international achieved outstanding sales and profits in 2008 distributing
Kenworth, peterbilt and DaF trucks and parts.
PACCAR International vehicle sales benefited from infrastructure projects in Latin America, Russia and Asia.
Oilfield exploration, drilling and servicing sectors remained strong throughout China, Russia, India, the Middle
East and North Africa, benefiting the Kenworth 963 and K500 off-highway models. The Kenworth K500 was
introduced last year and has added innovative multi-axle configurations, enhancing its mobility in rugged oilfields.
The introduction of the Peterbilt Model 367 generated strong sales for oil well servicing in the Middle East,
Russia and China.
PACCAR International launched the aerodynamic Kenworth T660 and the T800 equipped with additional
sleeper combinations. DAF on-highway vehicle sales increased in Latin American and Asian markets. DAF
increased sales in Taiwan and New Zealand by over 200 percent.
PACCAR International increased its global dealer network by adding eight new dealer locations in 2008.
Customers in over 100 countries benefit from the durability and reliability of PACCAR trucks and on-time
delivery of parts and services.
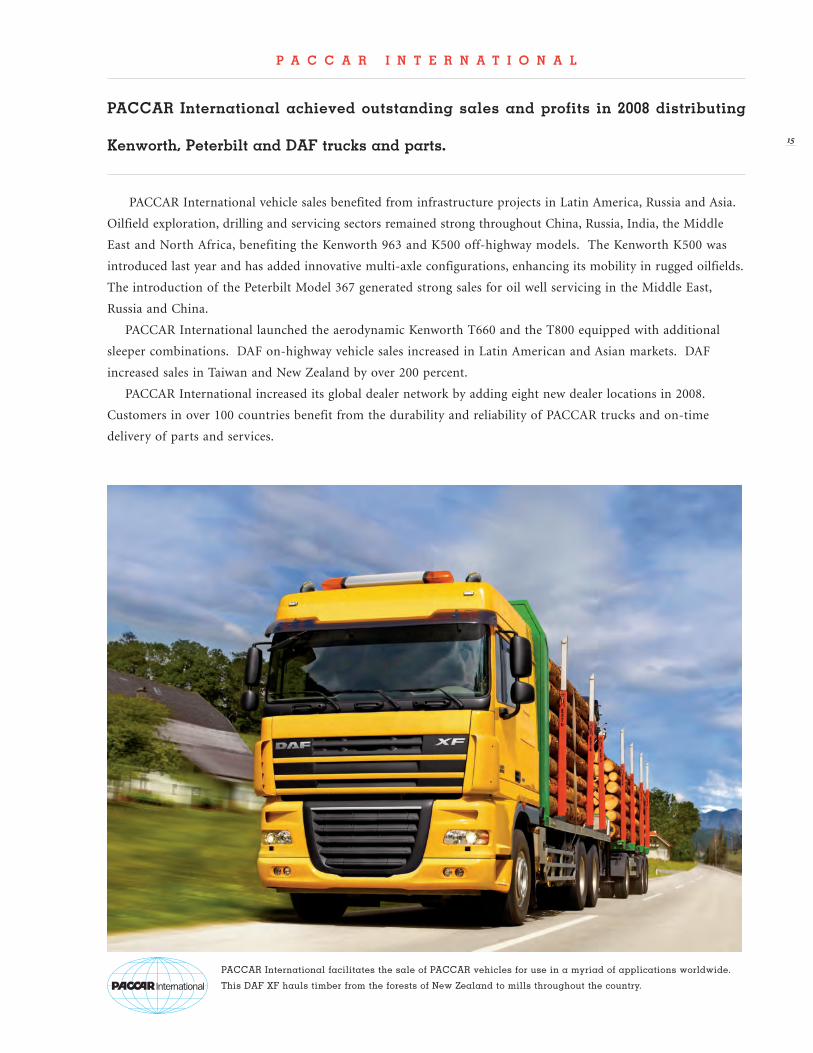
PACCAR International facilitates the sale of PACCAR vehicles for use in a myriad of applications worldwide.
This DAF XF hauls timber from the forests of New Zealand to mills throughout the country.
P A C C A R P A R t s
PACCAR Parts achieved excellent results in 2008 with strong sales and profit
performance — delivering 1.3 million parts shipments worldwide to 1,900 Kenworth,
Peterbilt and DAF dealer locations.
PACCAR Parts expanded its worldwide parts distribution centers (PDC) to 13 to support the growing network
of dealers and customers. The 260,000-square-foot parts distribution center in Budapest, Hungary, began operation
in 2008 and serves DAF’s customers in Central and Eastern Europe. PACCAR Parts completed a 45,000-square-
foot addition of the San Luis Potosi, Mexico, PDC, enhancing service to its Kenworth Mexico dealers.
Introduction of the Peterbilt Preferred, Kenworth Privileges and the DAF “MAX” Loyalty Cards generated
significant retail sales in 2008. More than 75,000 customers worldwide are registered to utilize PACCAR Parts
monthly parts and service programs.
PACCAR Parts implemented a new Radio Frequency (RF) Shipping System in its North American distribution
centers. The system processes freight bills and customer order invoices and reduces transportation costs by
consolidating multiple shipments.
Four PACCAR Parts distribution centers in the U.S. achieved ISO14001 Environmental Certification.
16
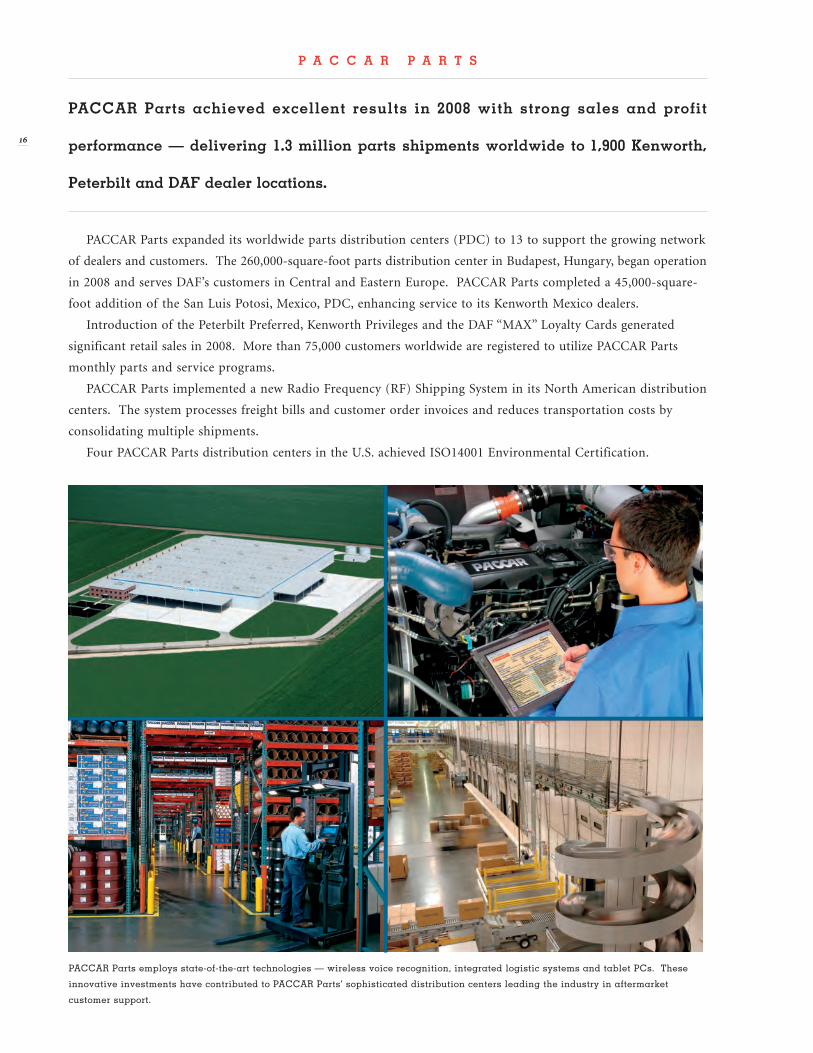
PACCAR Parts employs state-of-the-art technologies — wireless voice recognition, integrated logistic systems and tablet PCs. These
innovative investments have contributed to PACCAR Parts’ sophisticated distribution centers leading the industry in aftermarket
customer support.
17
p a c c a r W i n c h
paccar Winch division, the premier full-line producer of industrial winches globally,
achieved another year of record sales and profits during 2008 — driven principally by
strong demand in the mobile crane and energy sectors.
PACCAR Winch increased sales in the European and Asian markets due to the growth of Braden recovery
winches, hoists and drives, Gearmatic planetary hoists and Carco tractor winches — nameplates recognized
worldwide for their superior quality, performance and dependability.
PACCAR Winch unveiled a new GH30B winch for pipelayer applications. The GH30B enhances efficiency
and durability, reduces cycle time by as much as 30 percent and increases overall productivity in the installation
of gas and oil pipelines.
The Winch Division introduced a proprietary, aerodynamic composite bumper incorporating a recovery
winch mount for the utility industry. The bumper reduces vehicle weight by 100 pounds compared to
traditional metal bumpers, and integrates into utility vehicles chassis.
PACCAR Winch was recognized as an Energy Champion Award winner by the U.S. Department of Energy
in 2008. This honor is awarded to facilities that have saved 15 percent of total plant energy consumption.
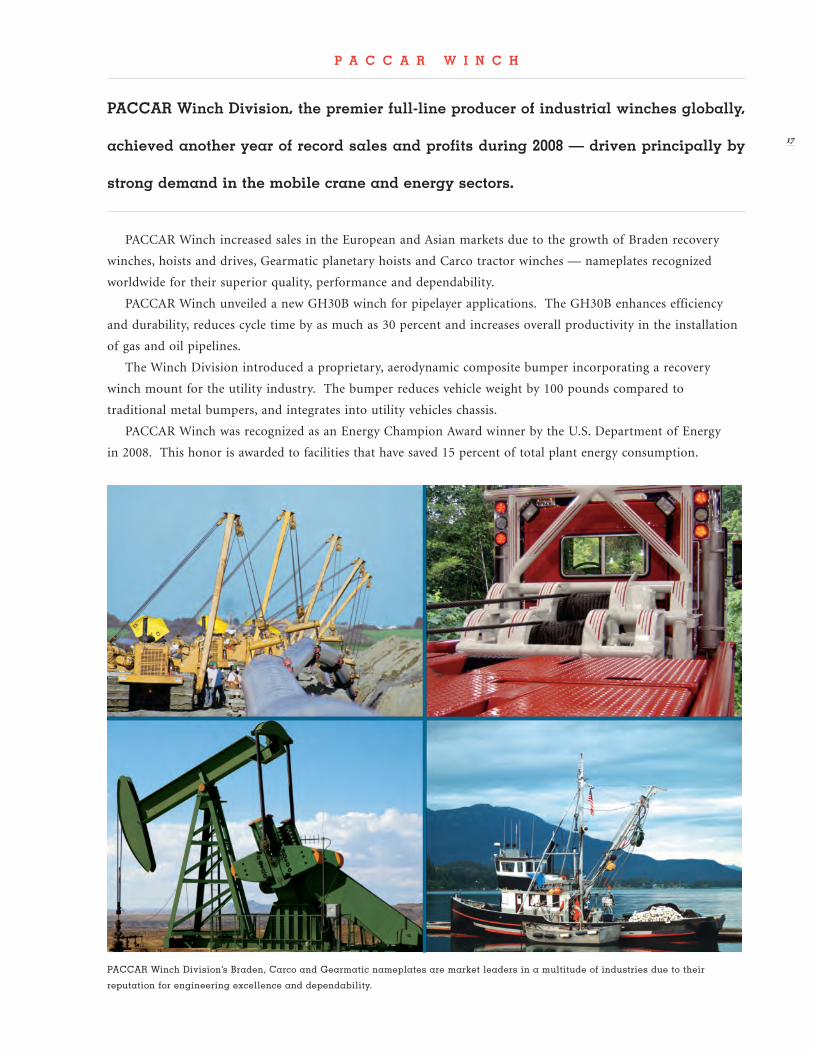
PACCAR Winch Division’s Braden, Carco and Gearmatic nameplates are market leaders in a multitude of industries due to their
reputation for engineering excellence and dependability.
18
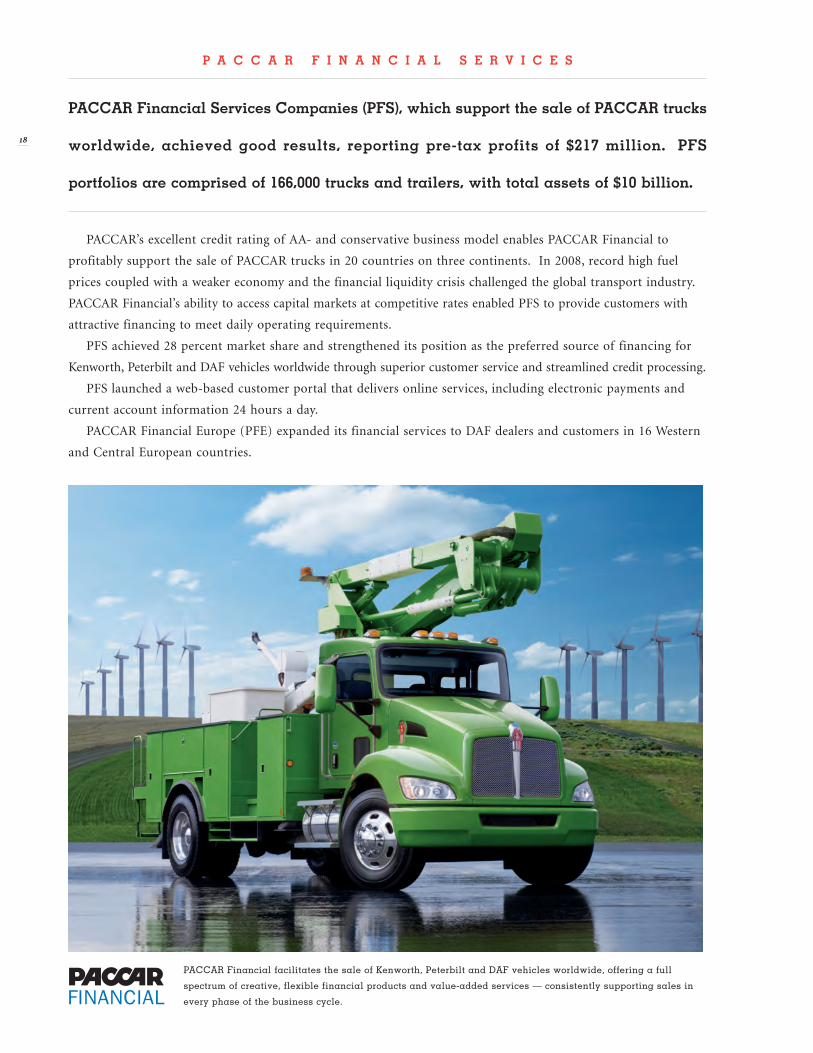
p a c c a r f i n a n c i a l s e r v i c e s
paccar financial services companies (pfs), which support the sale of paccar trucks
worldwide, achieved good results, reporting pre-tax profits of $217 million. pfs
portfolios are comprised of 166,000 trucks and trailers, with total assets of $10 billion.
PACCAR’s excellent credit rating of AA- and conservative business model enables PACCAR Financial to
profitably support the sale of PACCAR trucks in 20 countries on three continents. In 2008, record high fuel
prices coupled with a weaker economy and the financial liquidity crisis challenged the global transport industry.
PACCAR Financial’s ability to access capital markets at competitive rates enabled PFS to provide customers with
attractive financing to meet daily operating requirements.
PFS achieved 28 percent market share and strengthened its position as the preferred source of financing for
Kenworth, Peterbilt and DAF vehicles worldwide through superior customer service and streamlined credit processing.
PFS launched a web-based customer portal that delivers online services, including electronic payments and
current account information 24 hours a day.
PACCAR Financial Europe (PFE) expanded its financial services to DAF dealers and customers in 16 Western
and Central European countries.
PACCAR Financial facilitates the sale of Kenworth, Peterbilt and DAF vehicles worldwide, offering a full
spectrum of creative, flexible financial products and value-added services — consistently supporting sales in
every phase of the business cycle.
19
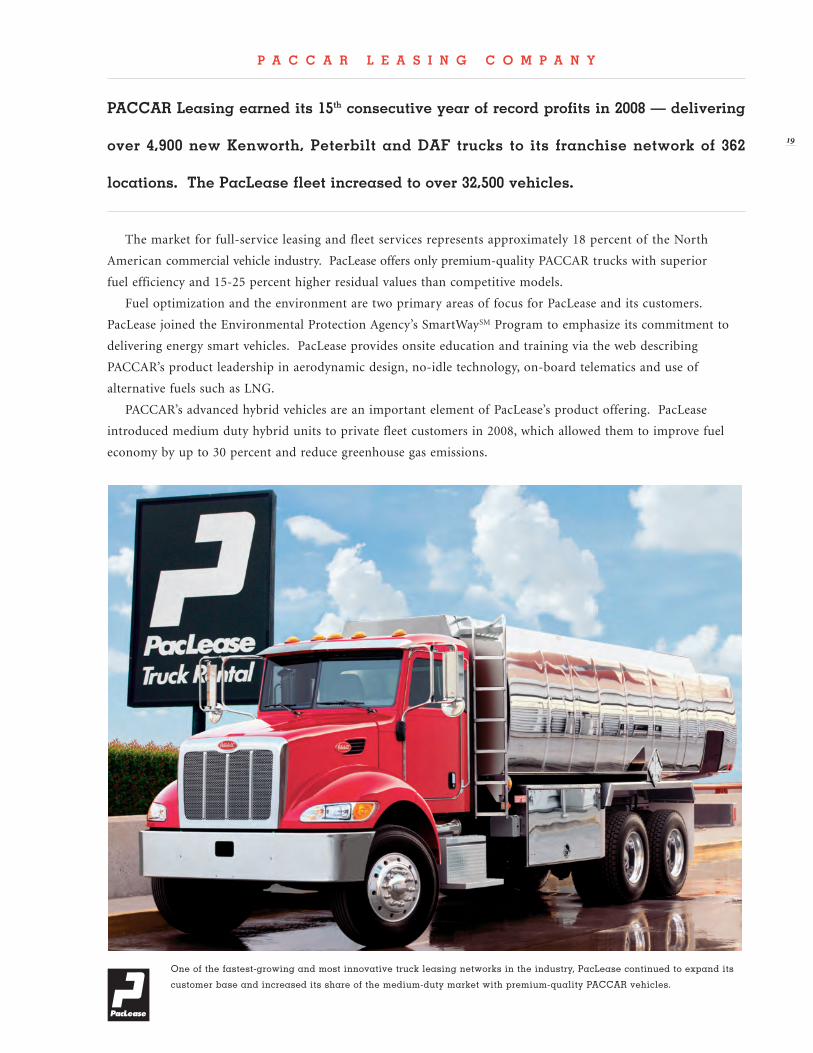
p a c c a r L e a s i n g c o m p a n y
paccar Leasing earned its 15th consecutive year of record profits in 2008 — delivering
over 4,900 new Kenworth, peterbilt and DaF trucks to its franchise network of 362
locations. The pacLease fleet increased to over 32,500 vehicles.
The market for full-service leasing and fleet services represents approximately 18 percent of the North
American commercial vehicle industry. PacLease offers only premium-quality PACCAR trucks with superior
fuel efficiency and 15-25 percent higher residual values than competitive models.
Fuel optimization and the environment are two primary areas of focus for PacLease and its customers.
PacLease joined the Environmental Protection Agency’s SmartWaySM Program to emphasize its commitment to
delivering energy smart vehicles. PacLease provides onsite education and training via the web describing
PACCAR’s product leadership in aerodynamic design, no-idle technology, on-board telematics and use of
alternative fuels such as LNG.
PACCAR’s advanced hybrid vehicles are an important element of PacLease’s product offering. PacLease
introduced medium duty hybrid units to private fleet customers in 2008, which allowed them to improve fuel
economy by up to 30 percent and reduce greenhouse gas emissions.
One of the fastest-growing and most innovative truck leasing networks in the industry, PacLease continued to expand its
customer base and increased its share of the medium-duty market with premium-quality PACCAR vehicles.
20
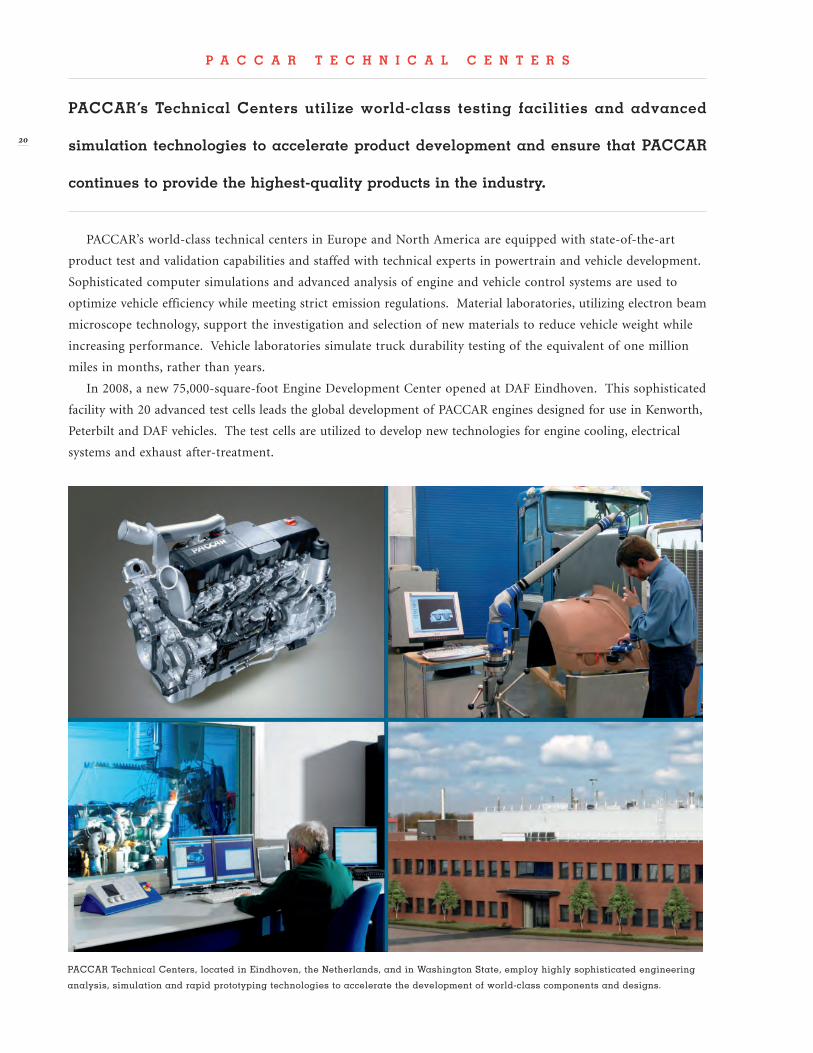
p a c c a r t e c h n i c a l c e n t e r S
paccar’s technical centers utilize world-class testing facilities and advanced
simulation technologies to accelerate product development and ensure that paccar
continues to provide the highest-quality products in the industry.
PACCAR’s world-class technical centers in Europe and North America are equipped with state-of-the-art
product test and validation capabilities and staffed with technical experts in powertrain and vehicle development.
Sophisticated computer simulations and advanced analysis of engine and vehicle control systems are used to
optimize vehicle efficiency while meeting strict emission regulations. Material laboratories, utilizing electron beam
microscope technology, support the investigation and selection of new materials to reduce vehicle weight while
increasing performance. Vehicle laboratories simulate truck durability testing of the equivalent of one million
miles in months, rather than years.
In 2008, a new 75,000-square-foot Engine Development Center opened at DAF Eindhoven. This sophisticated
facility with 20 advanced test cells leads the global development of PACCAR engines designed for use in Kenworth,
Peterbilt and DAF vehicles. The test cells are utilized to develop new technologies for engine cooling, electrical
systems and exhaust after-treatment.
PACCAR Technical Centers, located in Eindhoven, the Netherlands, and in Washington State, employ highly sophisticated engineering
analysis, simulation and rapid prototyping technologies to accelerate the development of world-class components and designs.
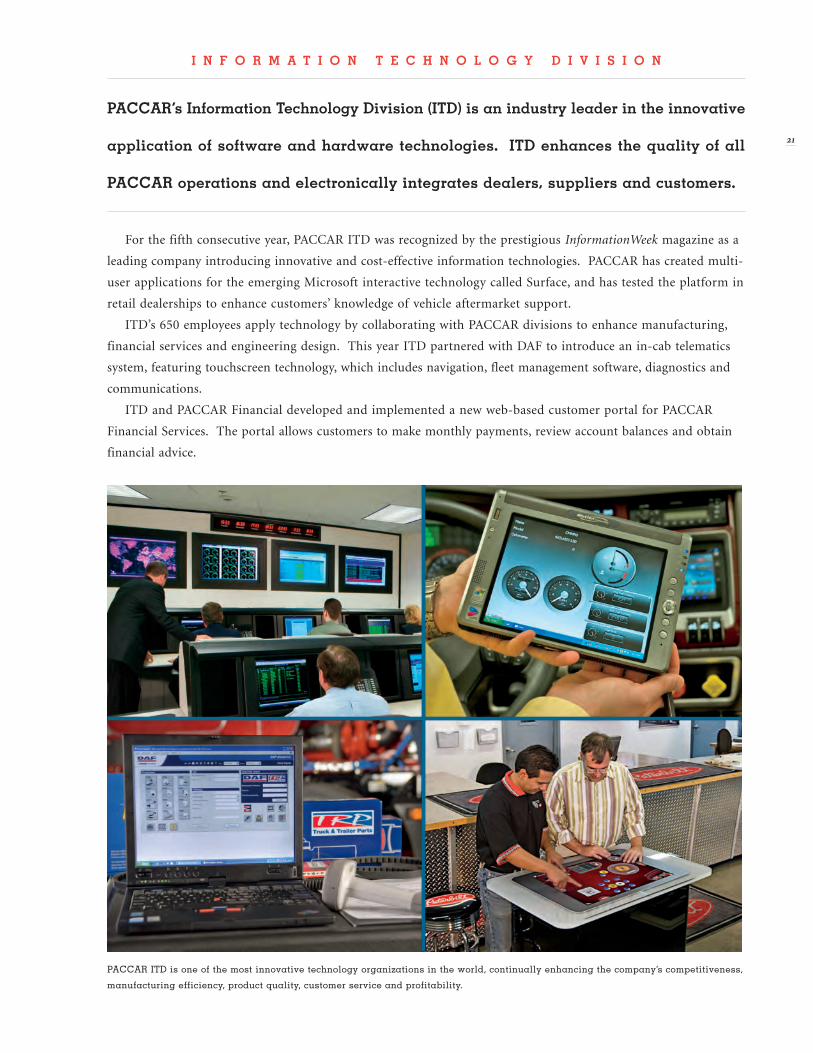
I N F O R M A T I O N T E C H N O L O G Y D I V I S I O N
PACCAR’s Information Technology Division (ITD) is an industry leader in the innovative
application of software and hardware technologies. ITD enhances the quality of all
PACCAR operations and electronically integrates dealers, suppliers and customers.
For the fifth consecutive year, PACCAR ITD was recognized by the prestigious InformationWeek magazine as a
leading company introducing innovative and cost-effective information technologies. PACCAR has created multi-
user applications for the emerging Microsoft interactive technology called Surface, and has tested the platform in
retail dealerships to enhance customers’ knowledge of vehicle aftermarket support.
ITD’s 650 employees apply technology by collaborating with PACCAR divisions to enhance manufacturing,
financial services and engineering design. This year ITD partnered with DAF to introduce an in-cab telematics
system, featuring touchscreen technology, which includes navigation, fleet management software, diagnostics and
communications.
ITD and PACCAR Financial developed and implemented a new web-based customer portal for PACCAR
Financial Services. The portal allows customers to make monthly payments, review account balances and obtain
financial advice.
21
PACCAR ITD is one of the most innovative technology organizations in the world, continually enhancing the company’s competitiveness,
manufacturing efficiency, product quality, customer service and profitability.
f i n a n c i a l c h a r t s
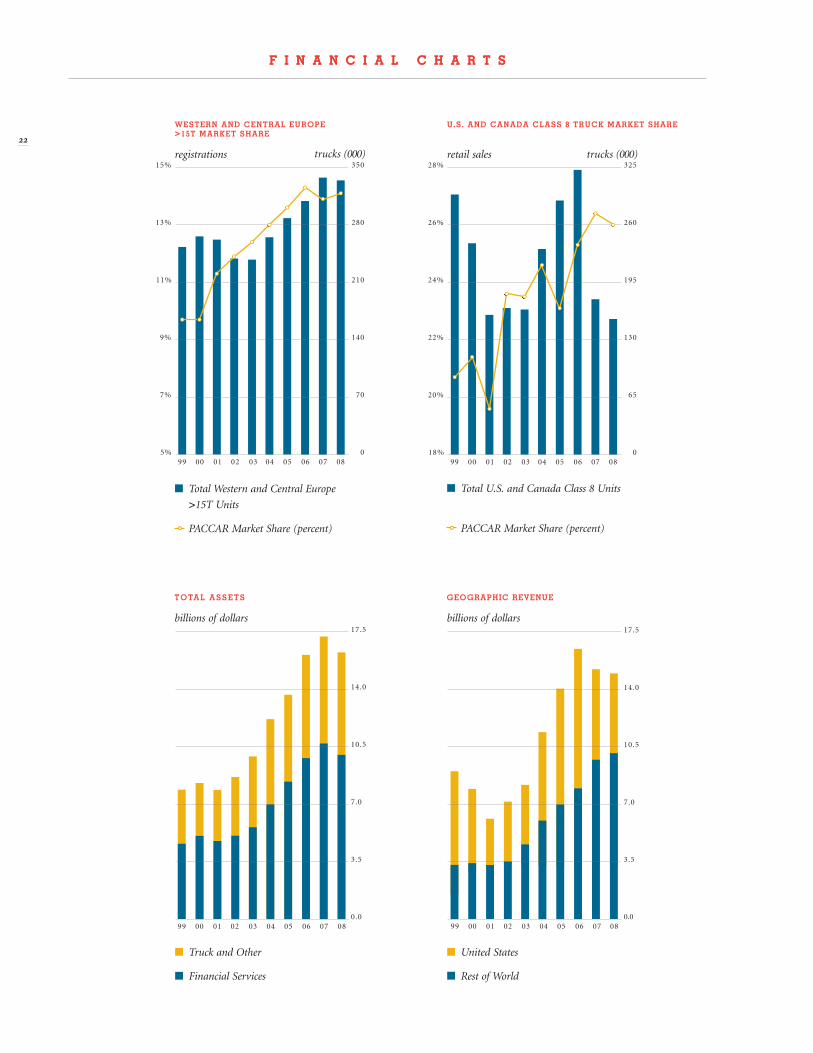
22
f i n a n c i a l c h a r t s
■ Total U.S. and Canada Class 8 Units
PACCAR Market Share (percent)
GEOGraPhic rEVEnUE
billions of dollars
t O ta l a s s E t s
billions of dollars
■ Total Western and Central Europe
>15T Units
PACCAR Market Share (percent)
■ Truck and Other
■ Financial Services
■ United States
■ Rest of World
U.s. and canada class 8 trUck markEt sharE
retail sales
WEstErn and cEntral EUrOPE >15t markEt sharE
registrations
99 00 01 02 03 04 05 06 07 08
17.5
14.0
10.5
3.5
7.0
0.0
GEOGRAPHIC REVENUE
billions of dollars
W E S T E R N A N D C E N T R A L E U R O P E > 1 5 T M A R K E T S H A R E
99 00 01 02 03 04 05 06 07 08
15%
13%
11%
9%
7%
5%
280
350
210
140
70
0
registrations
U . S . A N D C A N A D A C L A S S 8 T R U C K M A R K E T S H A R E
99 00 01 02 03 04 05 06 07 08
28%
26%
24%
22%
20%
18%
260
325
195
130
65
0
retail sales
99 00 01 02 03 04 05 06 07 08
17.5
14.0
10.5
3.5
7.0
0.0
T O TA L A S S E T S
b il lions o f do l lar s
trucks (000)
trucks (000)
PACCAR Inc and Subsidiaries
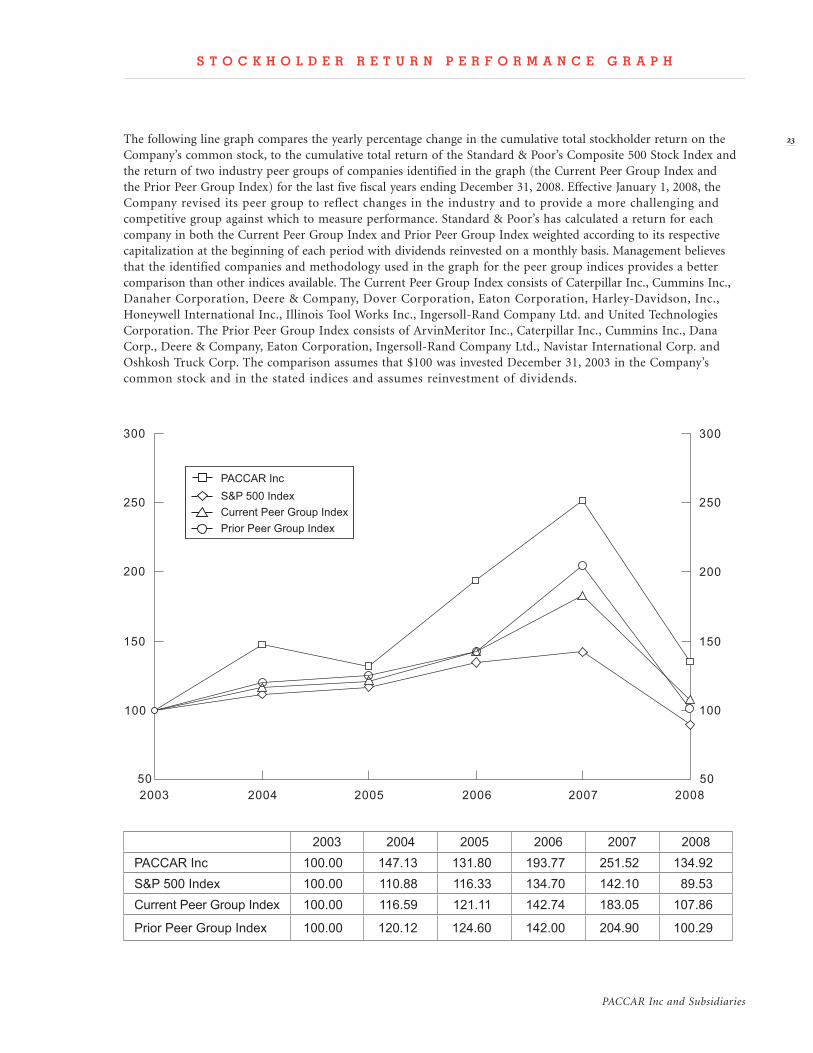
S T O C K H O L D E R R E T U R N P E R F O R M A N C E G R A P H
The following line graph compares the yearly percentage change in the cumulative total stockholder return on the Company’s common stock, to the cumulative total return of the Standard & Poor’s Composite 500 Stock Index and the return of two industry peer groups of companies identified in the graph (the Current Peer Group Index and the Prior Peer Group Index) for the last five fiscal years ending December 31, 2008. Effective January 1, 2008, the Company revised its peer group to reflect changes in the industry and to provide a more challenging and competitive group against which to measure performance. Standard & Poor’s has calculated a return for each company in both the Current Peer Group Index and Prior Peer Group Index weighted according to its respective capitalization at the beginning of each period with dividends reinvested on a monthly basis. Management believes that the identified companies and methodology used in the graph for the peer group indices provides a better comparison than other indices available. The Current Peer Group Index consists of Caterpillar Inc., Cummins Inc., Danaher Corporation, Deere & Company, Dover Corporation, Eaton Corporation, Harley-Davidson, Inc., Honeywell International Inc., Illinois Tool Works Inc., Ingersoll-Rand Company Ltd. and United Technologies Corporation. The Prior Peer Group Index consists of ArvinMeritor Inc., Caterpillar Inc., Cummins Inc., Dana Corp., Deere & Company, Eaton Corporation, Ingersoll-Rand Company Ltd., Navistar International Corp. and Oshkosh Truck Corp. The comparison assumes that $100 was invested December 31, 2003 in the Company’s common stock and in the stated indices and assumes reinvestment of dividends.
100
2003 2004 2005 2006 2007 2008
150
200
50 50
100
150
200
250
PACCAR Inc
S&P 500 Index
Current Peer Group Index
300300
Prior Peer Group Index
250
2003 2004 2005 2006 2007 2008PACCAR Inc 100.00 147.13 131.80 193.77 251.52 134.92S&P 500 Index 100.00 110.88 116.33 134.70 142.10 89.53Current Peer Group Index 100.00 116.59 121.11 142.74 183.05 107.86
Prior Peer Group Index 100.00 120.12 124.60 142.00 204.90 100.29
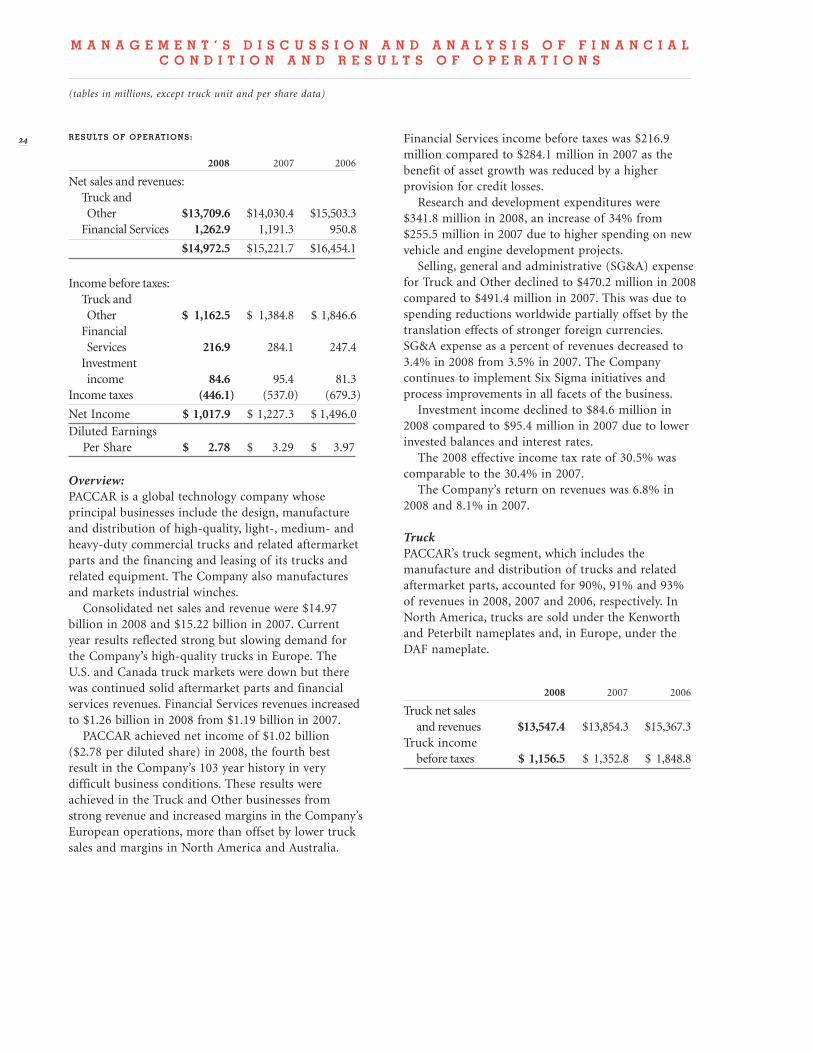
results of operations:
2008 2007 2006
Net sales and revenues: Truck and Other $13,709.6 $14,030.4 $15,503.3 Financial Services 1,262.9 1,191.3 950.8
$14,972.5 $15,221.7 $16,454.1
Income before taxes: Truck and Other $ 1,162.5 $ 1,384.8 $ 1,846.6 Financial Services 216.9 284.1 247.4 Investment income 84.6 95.4 81.3Income taxes (446.1) (537.0) (679.3)
Net Income $ 1,017.9 $ 1,227.3 $ 1,496.0
Diluted Earnings Per Share $ 2.78 $ 3.29 $ 3.97
Overview:PACCAR is a global technology company whose principal businesses include the design, manufacture and distribution of high-quality, light-, medium- and heavy-duty commercial trucks and related aftermarket parts and the financing and leasing of its trucks and related equipment. The Company also manufactures and markets industrial winches. Consolidated net sales and revenue were $14.97 billion in 2008 and $15.22 billion in 2007. Current year results reflected strong but slowing demand for the Company’s high-quality trucks in Europe. The U.S. and Canada truck markets were down but there was continued solid aftermarket parts and financial services revenues. Financial Services revenues increased to $1.26 billion in 2008 from $1.19 billion in 2007. PACCAR achieved net income of $1.02 billion ($2.78 per diluted share) in 2008, the fourth best result in the Company’s 103 year history in very difficult business conditions. These results were achieved in the Truck and Other businesses from strong revenue and increased margins in the Company’s European operations, more than offset by lower truck sales and margins in North America and Australia.
Financial Services income before taxes was $216.9 million compared to $284.1 million in 2007 as the benefit of asset growth was reduced by a higher provision for credit losses. Research and development expenditures were $341.8 million in 2008, an increase of 34% from $255.5 million in 2007 due to higher spending on new vehicle and engine development projects. Selling, general and administrative (SG&A) expense for Truck and Other declined to $470.2 million in 2008 compared to $491.4 million in 2007. This was due to spending reductions worldwide partially offset by the translation effects of stronger foreign currencies. SG&A expense as a percent of revenues decreased to 3.4% in 2008 from 3.5% in 2007. The Company continues to implement Six Sigma initiatives and process improvements in all facets of the business. Investment income declined to $84.6 million in 2008 compared to $95.4 million in 2007 due to lower invested balances and interest rates. The 2008 effective income tax rate of 30.5% was comparable to the 30.4% in 2007. The Company’s return on revenues was 6.8% in 2008 and 8.1% in 2007.
TruckPACCAR’s truck segment, which includes the manufacture and distribution of trucks and related aftermarket parts, accounted for 90%, 91% and 93% of revenues in 2008, 2007 and 2006, respectively. In North America, trucks are sold under the Kenworth and Peterbilt nameplates and, in Europe, under the DAF nameplate.
2008 2007 2006
Truck net sales and revenues $13,547.4 $13,854.3 $15,367.3Truck income before taxes $ 1,156.5 $ 1,352.8 $ 1,848.8
M a n a g e M e n t ’ s d i s c u s s i o n a n d a n a l y s i s o f f i n a n c i a l c o n d i t i o n a n d r e s u l t s o f o p e r a t i o n s
(tables in millions, except truck unit and per share data)
PACCAR Inc and Subsidiaries
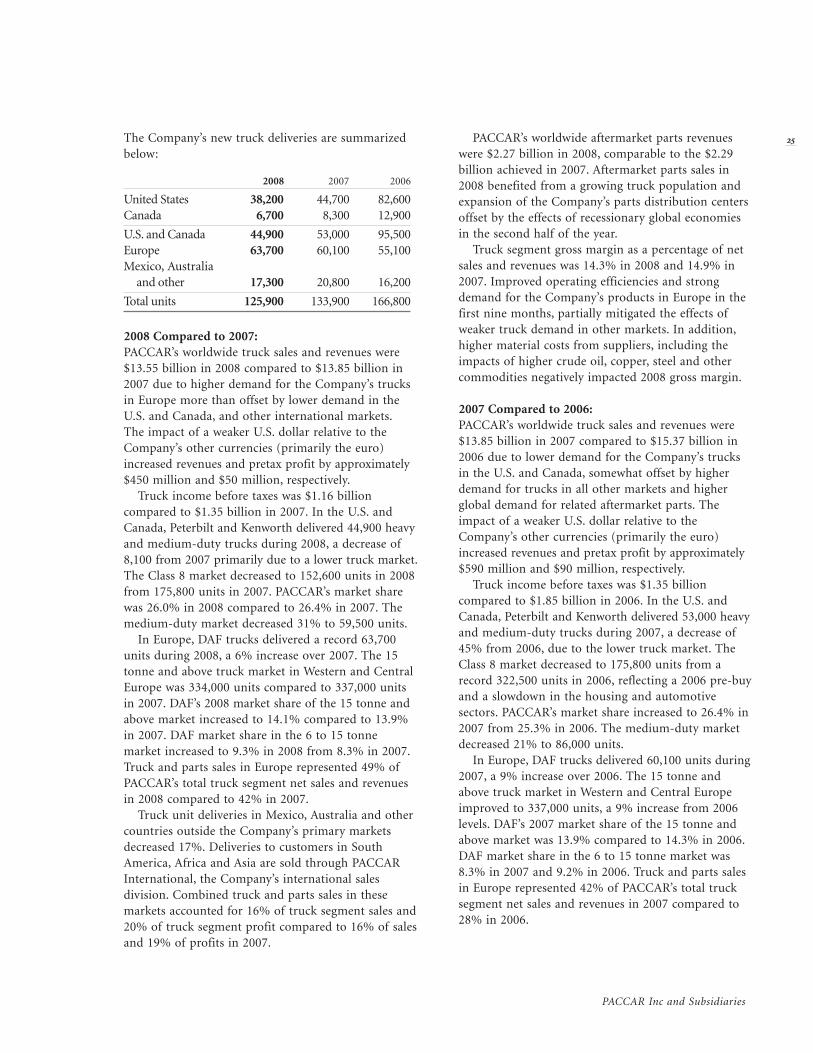
The Company’s new truck deliveries are summarized below:
2008 2007 2006
United States 38,200 44,700 82,600Canada 6,700 8,300 12,900
U.S. and Canada 44,900 53,000 95,500Europe 63,700 60,100 55,100Mexico, Australia and other 17,300 20,800 16,200
Total units 125,900 133,900 166,800
2008 Compared to 2007:PACCAR’s worldwide truck sales and revenues were $13.55 billion in 2008 compared to $13.85 billion in 2007 due to higher demand for the Company’s trucks in Europe more than offset by lower demand in the U.S. and Canada, and other international markets. The impact of a weaker U.S. dollar relative to the Company’s other currencies (primarily the euro) increased revenues and pretax profit by approximately $450 million and $50 million, respectively. Truck income before taxes was $1.16 billion compared to $1.35 billion in 2007. In the U.S. and Canada, Peterbilt and Kenworth delivered 44,900 heavy and medium-duty trucks during 2008, a decrease of 8,100 from 2007 primarily due to a lower truck market. The Class 8 market decreased to 152,600 units in 2008 from 175,800 units in 2007. PACCAR’s market share was 26.0% in 2008 compared to 26.4% in 2007. The medium-duty market decreased 31% to 59,500 units. In Europe, DAF trucks delivered a record 63,700 units during 2008, a 6% increase over 2007. The 15 tonne and above truck market in Western and Central Europe was 334,000 units compared to 337,000 units in 2007. DAF’s 2008 market share of the 15 tonne and above market increased to 14.1% compared to 13.9% in 2007. DAF market share in the 6 to 15 tonne market increased to 9.3% in 2008 from 8.3% in 2007. Truck and parts sales in Europe represented 49% of PACCAR’s total truck segment net sales and revenues in 2008 compared to 42% in 2007. Truck unit deliveries in Mexico, Australia and other countries outside the Company’s primary markets decreased 17%. Deliveries to customers in South America, Africa and Asia are sold through PACCAR International, the Company’s international sales division. Combined truck and parts sales in these markets accounted for 16% of truck segment sales and 20% of truck segment profit compared to 16% of sales and 19% of profits in 2007.
PACCAR’s worldwide aftermarket parts revenues were $2.27 billion in 2008, comparable to the $2.29 billion achieved in 2007. Aftermarket parts sales in 2008 benefited from a growing truck population and expansion of the Company’s parts distribution centers offset by the effects of recessionary global economies in the second half of the year. Truck segment gross margin as a percentage of net sales and revenues was 14.3% in 2008 and 14.9% in 2007. Improved operating efficiencies and strong demand for the Company’s products in Europe in the first nine months, partially mitigated the effects of weaker truck demand in other markets. In addition, higher material costs from suppliers, including the impacts of higher crude oil, copper, steel and other commodities negatively impacted 2008 gross margin.
2007 Compared to 2006:PACCAR’s worldwide truck sales and revenues were $13.85 billion in 2007 compared to $15.37 billion in 2006 due to lower demand for the Company’s trucks in the U.S. and Canada, somewhat offset by higher demand for trucks in all other markets and higher global demand for related aftermarket parts. The impact of a weaker U.S. dollar relative to the Company’s other currencies (primarily the euro) increased revenues and pretax profit by approximately $590 million and $90 million, respectively. Truck income before taxes was $1.35 billion compared to $1.85 billion in 2006. In the U.S. and Canada, Peterbilt and Kenworth delivered 53,000 heavy and medium-duty trucks during 2007, a decrease of 45% from 2006, due to the lower truck market. The Class 8 market decreased to 175,800 units from a record 322,500 units in 2006, reflecting a 2006 pre-buy and a slowdown in the housing and automotive sectors. PACCAR’s market share increased to 26.4% in 2007 from 25.3% in 2006. The medium-duty market decreased 21% to 86,000 units. In Europe, DAF trucks delivered 60,100 units during 2007, a 9% increase over 2006. The 15 tonne and above truck market in Western and Central Europe improved to 337,000 units, a 9% increase from 2006 levels. DAF’s 2007 market share of the 15 tonne and above market was 13.9% compared to 14.3% in 2006. DAF market share in the 6 to 15 tonne market was 8.3% in 2007 and 9.2% in 2006. Truck and parts sales in Europe represented 42% of PACCAR’s total truck segment net sales and revenues in 2007 compared to 28% in 2006.
Truck unit deliveries in Mexico, Australia and other countries outside the Company’s primary markets increased 28%. Combined truck and parts sales in these markets accounted for 16% of truck segment sales and 19% of truck segment profit, an increase from 10% of sales and 9% of profits in 2006. PACCAR’s worldwide aftermarket parts revenues were $2.29 billion in 2007, an increase of 18% compared to $1.94 billion in 2006. Aftermarket parts sales increased in all major markets from a growing truck population, expansion of parts distribution centers and focused sales efforts. Truck segment gross margin as a percentage of net sales and revenues was 14.9% in 2007 and 15.7% in 2006. Improved operating efficiencies and strong demand for the Company’s products outside the U.S. and Canada were dampened by a weak truck market in the U.S. and Canada. Higher material costs negatively impacted truck gross margins.
Truck OutlookWorldwide recessionary economic conditions are currently forecast to dampen demand for heavy-duty trucks for 2009. In North America, industry retail sales are expected to be 130,000–170,000 trucks. Western and Central European heavy-duty registrations for 2009 are projected to decline between 30% to 40% to 200,000–240,000 units. International markets are also expected to be weaker in 2009.
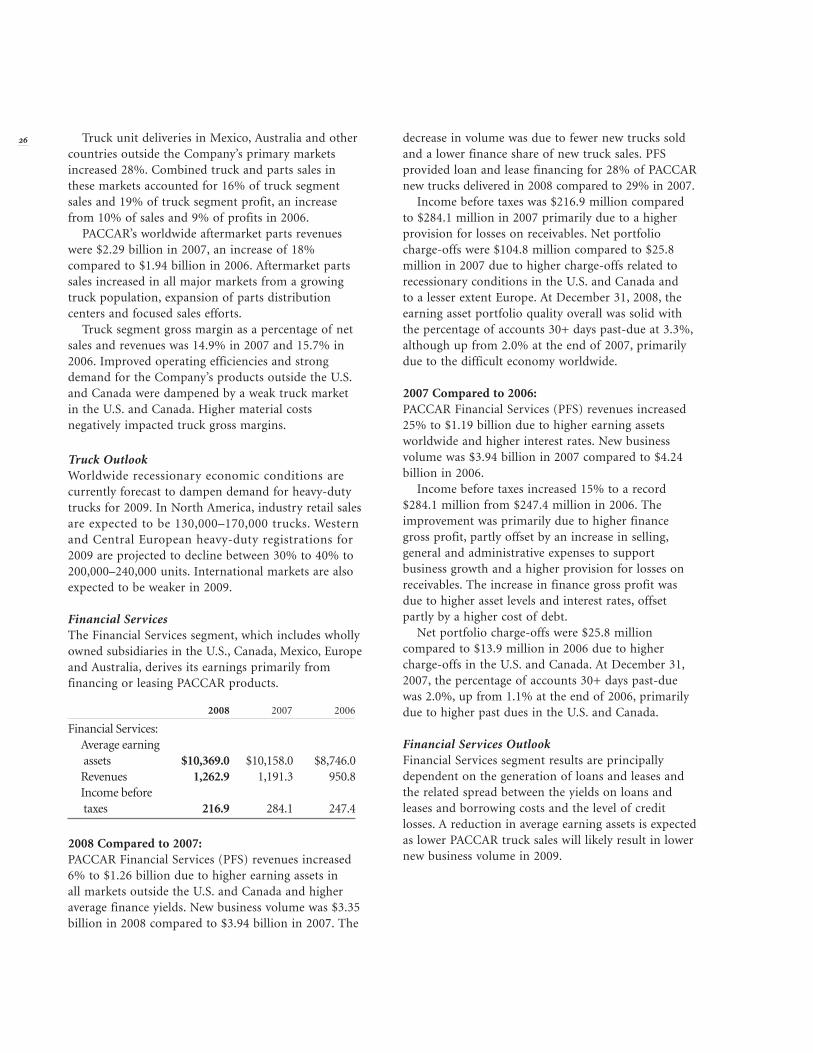
Financial ServicesThe Financial Services segment, which includes wholly owned subsidiaries in the U.S., Canada, Mexico, Europe and Australia, derives its earnings primarily from financing or leasing PACCAR products.
2008 2007 2006
Financial Services: Average earning assets $10,369.0 $10,158.0 $8,746.0 Revenues 1,262.9 1,191.3 950.8 Income before taxes 216.9 284.1 247.4
2008 Compared to 2007:PACCAR Financial Services (PFS) revenues increased 6% to $1.26 billion due to higher earning assets in all markets outside the U.S. and Canada and higher average finance yields. New business volume was $3.35 billion in 2008 compared to $3.94 billion in 2007. The
decrease in volume was due to fewer new trucks sold and a lower finance share of new truck sales. PFS provided loan and lease financing for 28% of PACCAR new trucks delivered in 2008 compared to 29% in 2007. Income before taxes was $216.9 million compared to $284.1 million in 2007 primarily due to a higher provision for losses on receivables. Net portfolio charge-offs were $104.8 million compared to $25.8 million in 2007 due to higher charge-offs related to recessionary conditions in the U.S. and Canada and to a lesser extent Europe. At December 31, 2008, the earning asset portfolio quality overall was solid with the percentage of accounts 30+ days past-due at 3.3%, although up from 2.0% at the end of 2007, primarily due to the difficult economy worldwide.
2007 Compared to 2006:PACCAR Financial Services (PFS) revenues increased 25% to $1.19 billion due to higher earning assets worldwide and higher interest rates. New business volume was $3.94 billion in 2007 compared to $4.24 billion in 2006. Income before taxes increased 15% to a record $284.1 million from $247.4 million in 2006. The improvement was primarily due to higher finance gross profit, partly offset by an increase in selling, general and administrative expenses to support business growth and a higher provision for losses on receivables. The increase in finance gross profit was due to higher asset levels and interest rates, offset partly by a higher cost of debt. Net portfolio charge-offs were $25.8 million compared to $13.9 million in 2006 due to higher charge-offs in the U.S. and Canada. At December 31, 2007, the percentage of accounts 30+ days past-due was 2.0%, up from 1.1% at the end of 2006, primarily due to higher past dues in the U.S. and Canada.
Financial Services OutlookFinancial Services segment results are principally dependent on the generation of loans and leases and the related spread between the yields on loans and leases and borrowing costs and the level of credit losses. A reduction in average earning assets is expected as lower PACCAR truck sales will likely result in lower new business volume in 2009.
PACCAR Inc and Subsidiaries
The segment continues to be exposed to the risk that economic weakness around the world may continue to exert pressure on the profit margins of truck operators and result in higher past-due accounts and repossessions.
Other BusinessIncluded in Truck and Other is the Company’s winch manufacturing business. Sales from this business represent approximately 1% of net sales for 2008, 2007 and 2006.
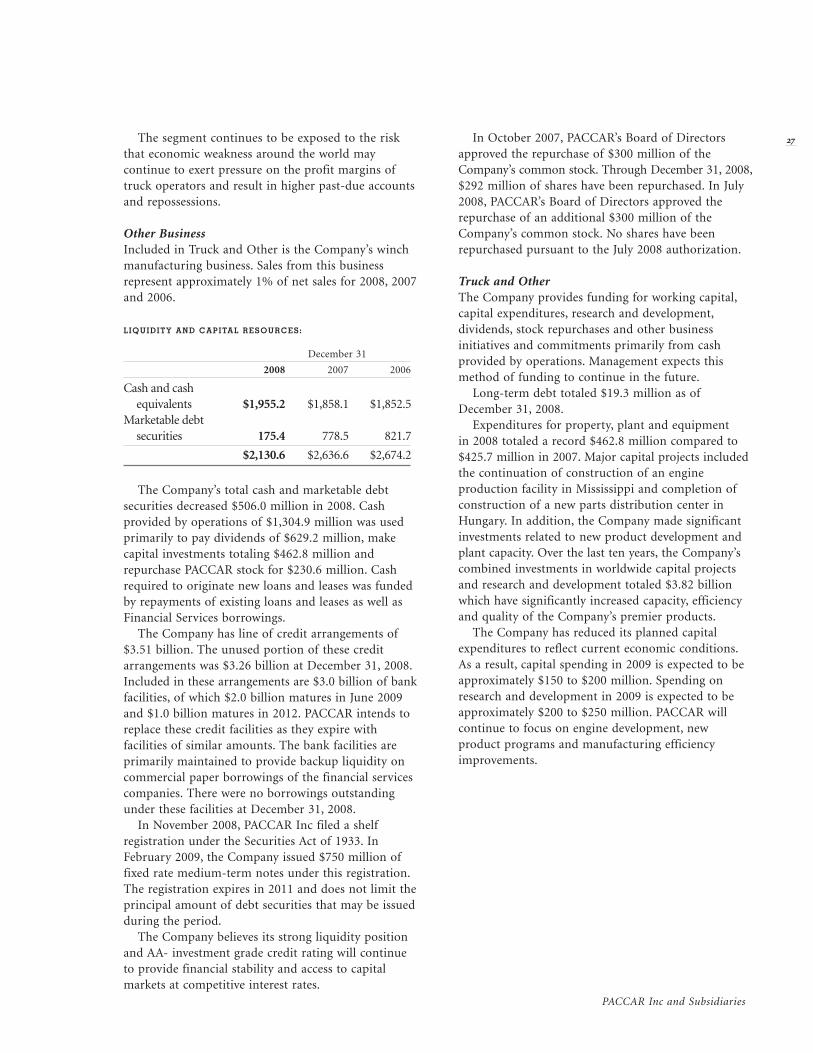
liquidity and capital resources:
December 31
2008 2007 2006
Cash and cash equivalents $1,955.2 $1,858.1 $1,852.5Marketable debt securities 175.4 778.5 821.7
$2,130.6 $2,636.6 $2,674.2
The Company’s total cash and marketable debt securities decreased $506.0 million in 2008. Cash provided by operations of $1,304.9 million was used primarily to pay dividends of $629.2 million, make capital investments totaling $462.8 million and repurchase PACCAR stock for $230.6 million. Cash required to originate new loans and leases was funded by repayments of existing loans and leases as well as Financial Services borrowings. The Company has line of credit arrangements of $3.51 billion. The unused portion of these credit arrangements was $3.26 billion at December 31, 2008.Included in these arrangements are $3.0 billion of bank facilities, of which $2.0 billion matures in June 2009 and $1.0 billion matures in 2012. PACCAR intends to replace these credit facilities as they expire with facilities of similar amounts. The bank facilities are primarily maintained to provide backup liquidity on commercial paper borrowings of the financial services companies. There were no borrowings outstanding under these facilities at December 31, 2008. In November 2008, PACCAR Inc filed a shelf registration under the Securities Act of 1933. In February 2009, the Company issued $750 million of fixed rate medium-term notes under this registration. The registration expires in 2011 and does not limit the principal amount of debt securities that may be issued during the period. The Company believes its strong liquidity position and AA- investment grade credit rating will continue to provide financial stability and access to capital markets at competitive interest rates.
In October 2007, PACCAR’s Board of Directors approved the repurchase of $300 million of the Company’s common stock. Through December 31, 2008, $292 million of shares have been repurchased. In July 2008, PACCAR’s Board of Directors approved the repurchase of an additional $300 million of the Company’s common stock. No shares have been repurchased pursuant to the July 2008 authorization.
Truck and OtherThe Company provides funding for working capital, capital expenditures, research and development, dividends, stock repurchases and other business initiatives and commitments primarily from cash provided by operations. Management expects this method of funding to continue in the future. Long-term debt totaled $19.3 million as of December 31, 2008. Expenditures for property, plant and equipment in 2008 totaled a record $462.8 million compared to $425.7 million in 2007. Major capital projects included the continuation of construction of an engine production facility in Mississippi and completion of construction of a new parts distribution center in Hungary. In addition, the Company made significant investments related to new product development and plant capacity. Over the last ten years, the Company’s combined investments in worldwide capital projects and research and development totaled $3.82 billion which have significantly increased capacity, efficiency and quality of the Company’s premier products. The Company has reduced its planned capital expenditures to reflect current economic conditions. As a result, capital spending in 2009 is expected to be approximately $150 to $200 million. Spending on research and development in 2009 is expected to be approximately $200 to $250 million. PACCAR will continue to focus on engine development, new product programs and manufacturing efficiency improvements.
Financial ServicesThe Company funds its financial services activities primarily from collections on existing finance receivables and borrowings in the capital markets. An additional source of funds is loans from other PACCAR companies. PACCAR’s strong cash position and credit ratings enabled PFS to meet its funding requirements despite a decline in liquidity in the debt and capital markets since the second half of 2007. The primary sources of borrowings in the capital markets are commercial paper and medium-term notes issued in the public markets and, to a lesser extent, bank loans. The majority of the medium-term notes are issued by PACCAR’s largest financial services subsidiary, PACCAR Financial Corp. (PFC). PFC filed a shelf registration under the Securities Act of 1933 in November 2006. The registration expires in November 2009 and does not limit the principal amount of debt securities that may be issued during the period. PFC participates in the Commercial Paper Funding Facility offered by the Federal Reserve Bank of New York. Under this funding facility, PFC may issue 90-day commercial paper through October 30, 2009. The total amount of commercial paper that PFC may have outstanding under this program is $1.46 billion, of which, $.74 billion was outstanding at December 31, 2008. In June 2008, PACCAR’s European finance subsidiary, PACCAR Financial Europe, renewed and increased the registration of a €1.5 billion medium-term note program with the London Stock Exchange. On December 31, 2008, €402 million remained available for issuance. This program is renewable annually through the filing of a new prospectus. In June 2008, PACCAR Mexico registered a 7.0 billion peso medium-term note program with the Comision Nacional Bancaria y de Valores. The registration expires in 2012 and at December 31, 2008, 6.1 billion pesos remained available for issuance. To reduce exposure to fluctuations in interest rates, the Financial Services companies pursue a policy of structuring borrowings with interest-rate characteristics similar to the assets being funded. As part of this policy, the companies use interest-rate contracts. The permitted types of interest-rate contracts and transaction limits have been established by the Company’s senior management, who receive periodic reports on the contract amounts outstanding and counterparty’s involved.
PACCAR believes its Financial Services companies will be able to continue funding receivables, servicing debt and paying dividends through internally generated funds, access to public and private debt markets and lines of credit.
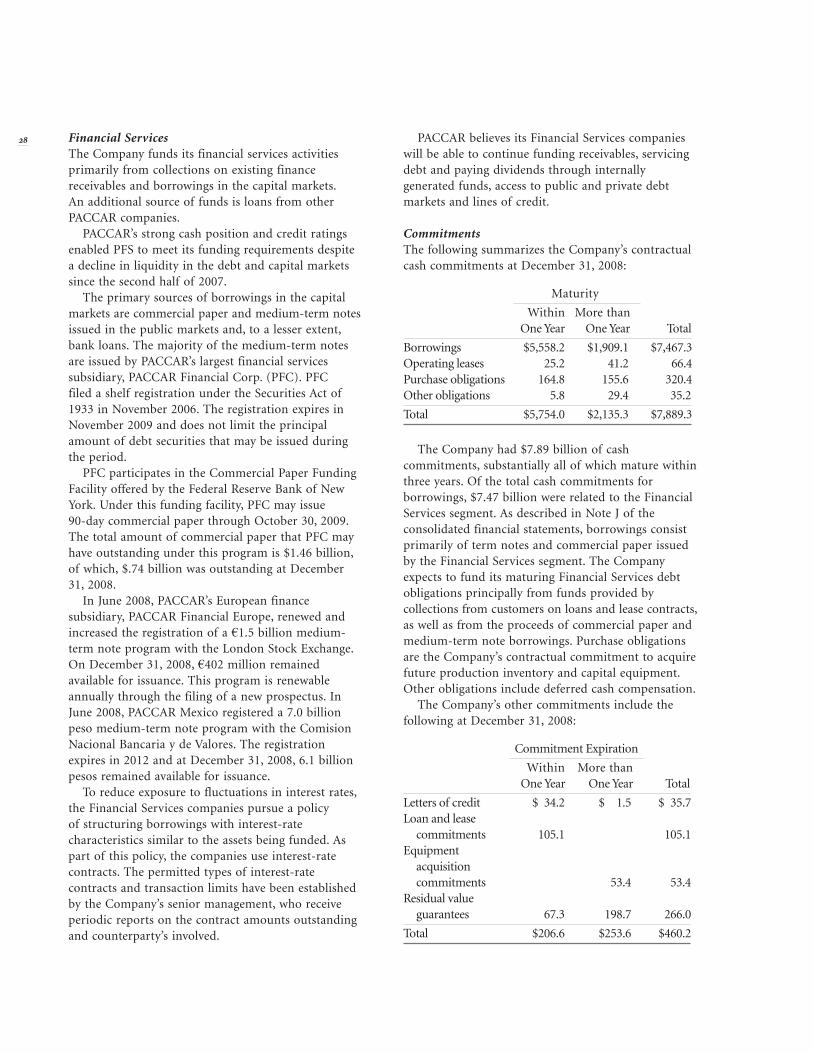
Commitments The following summarizes the Company’s contractual cash commitments at December 31, 2008:
Maturity
Within More than One Year One Year Total
Borrowings $5,558.2 $1,909.1 $7,467.3Operating leases 25.2 41.2 66.4Purchase obligations 164.8 155.6 320.4Other obligations 5.8 29.4 35.2
Total $5,754.0 $2,135.3 $7,889.3
The Company had $7.89 billion of cash commitments, substantially all of which mature within three years. Of the total cash commitments for borrowings, $7.47 billion were related to the Financial Services segment. As described in Note J of the consolidated financial statements, borrowings consist primarily of term notes and commercial paper issued by the Financial Services segment. The Company expects to fund its maturing Financial Services debt obligations principally from funds provided by collections from customers on loans and lease contracts, as well as from the proceeds of commercial paper and medium-term note borrowings. Purchase obligations are the Company’s contractual commitment to acquire future production inventory and capital equipment. Other obligations include deferred cash compensation. The Company’s other commitments include the following at December 31, 2008:
Commitment Expiration
Within More than One Year One Year Total
Letters of credit $ 34.2 $ 1.5 $ 35.7Loan and lease commitments 105.1 105.1Equipment acquisition commitments 53.4 53.4Residual value guarantees 67.3 198.7 266.0
Total $206.6 $253.6 $460.2
PACCAR Inc and Subsidiaries
Loan and lease commitments are for funding new retail loan and lease contracts. Equipment acquisition commitments require the Company, under specified circumstances, to purchase equipment. Residual value guarantees represent the Company’s commitment to acquire trucks at a guaranteed value if the customer decides to return the truck at a specified date in the future.
impact of environmental matters:
The Company, its competitors and industry in general are subject to various domestic and foreign requirements relating to the environment. The Company believes its policies, practices and procedures are designed to prevent unreasonable risk of environmental damage and that its handling, use and disposal of hazardous or toxic substances have been in accordance with environmental laws and regulations enacted at the time such use and disposal occurred. Expenditures related to environmental activities in 2008, 2007 and 2006 were immaterial. The Company is involved in various stages of investi gations and cleanup actions in different countries related to environmental matters. In certain of these matters, the Company has been designated as a “potentially responsible party” by domestic and foreign environmental agencies. The Company has provided an accrual for the estimated costs to investigate and complete cleanup actions where it is probable that the Company will incur such costs in the future. Management expects that these matters will not have a significant effect on the Company’s consolidated cash flow, liquidity or financial condition.
critical accounting policies:
In the preparation of the Company’s financial statements, in accordance with U.S. generally accepted accounting principles, management uses estimates and makes judgments and assumptions that affect asset and liability values and the amounts reported as income and expense during the periods presented. The following are accounting policies which, in the opinion of management, are particularly sensitive and which, if actual results are different from estimates used by management, may have a material impact on the financial statements.
Operating LeasesThe accounting for trucks sold pursuant to agreements accounted for as operating leases is discussed in Notes A and G of the consolidated financial statements. In deter mining its estimate of the residual value of such vehicles, the Company considers the length of the lease term, the truck model, the expected usage of the truck and anticipated market demand. If the sales price of the trucks at the end of the term of the agreement differs from the Company’s estimate, a gain or loss will result. The Company believes its residual-setting policies are appropriate; however, future market conditions, changes in government regulations and other factors outside the Company’s control could impact the ultimate sales price of trucks returned under these contracts. Residual values are reviewed regularly and adjusted if market conditions warrant.
Allowance for Credit LossesThe Company determines the allowance for credit losses on financial services receivables based on a combination of historical information and current market conditions. This determination is dependent on estimates, including assumptions regarding the likelihood of collecting current and past-due accounts, repossession rates and the recovery rate on the underlying collateral based on used truck values and other pledged collateral or recourse. The Company believes its reserve-setting policies adequately take into account the known risks inherent in the financial services portfolio. If there are significant variations in the actual results from those estimates, the provision for credit losses and operating earnings may be materially impacted.
Product WarrantyThe expenses related to product warranty are estimated and recorded at the time products are sold based on historical and current data and reasonable expectations for the future regarding the frequency and cost of warranty claims. Management believes that the warranty reserve is appropriate and takes actions to minimize warranty costs through quality-improvement programs; however, actual claims incurred could materially differ from the estimated amounts and require adjustments to the reserve.
9
30 Pension and Other Postretirement BenefitsThe Company’s accounting for employee pension and other postretirement benefit costs and obligations is based on management assumptions about the future used by actuaries to estimate net costs and liabilities. These assumptions include discount rates, long-term rates of return on plan assets, health care cost trends, inflation rates, retirement rates, mortality rates and other factors. Management bases these assumptions on historical results, the current environment and reasonable estimates of future events. The discount rate for each plan is based on market interest rates of high-quality corporate bonds with a maturity profile that matches the timing of the projected benefit payments of the plans. Changes in the discount rate affect the valuation of the plan benefits obligation and funded status of the plans. The long-term rate of return on plan assets is based on projected returns for each asset class and relative weighting of those asset classes in the plans. Actual results that differ from these assumptions are accumulated and amortized into expense over future periods. While management believes the assumptions used are appropriate, significant differences in actual experience or significant changes in assumptions would affect pension and other postretirement benefit costs and obligations and the balance sheet funded status of the plans.
Derivative Financial Instruments and Hedging ActivitiesThe Company uses derivative financial instruments to minimize risk exposures from the fluctuation in interest rates and foreign currency exchange rates. All derivative financial instruments are recorded at fair value as either assets or liabilities. The Company designates certain of its derivative financial instruments as qualifying hedges under accounting standards. The changes in the fair value of derivative financial instruments of qualifying fair value hedges are offset by the effective portion of the changes in the fair value of the hedged item attributable to the risk being hedged. The changes in the fair value of derivative financial instruments, to the extent they are considered to be effective cash flow hedges, are initially reported in other comprehensive income and reclassified into earnings in the period the hedged item affects earnings. Changes in fair value of derivative financial instruments that are not designated in hedge accounting relationships are reported in earnings in the period in which the change occurs.
The determination of the fair value of derivatives and whether hedge relationships qualify for hedge accounting is complex and requires management estimates and involves judgment. If the Company determines that the derivative financial instruments no longer qualify for hedge accounting, the fair value changes of derivative financial instruments are reported in earnings.
Income Taxes The Company calculates income tax expense on pretax income based on current tax law. Deferred tax assets and liabilities are recorded for future tax consequences on temporary differences between recorded amounts in the financial statements and their respective tax basis. The determination of income tax expense requires management estimates and involves judgment regarding jurisdictional mix of earnings, indefinitely reinvested foreign earnings and future outcomes regarding tax law issues included in tax returns. If the Company’s assessment of these matters changes, the effect is accounted for in earnings in the period the change is made.
forward-looking statements:
Certain information presented in this report contains forward-looking statements made pursuant to the Private Securities Litigation Reform Act of 1995, which are subject to risks and uncertainties that may affect actual results. Risks and uncertainties include, but are not limited to: a significant decline in industry sales; competitive pressures; reduced market share; reduced availability of or higher prices for fuel; increased safety, emissions, or other regulations resulting in higher costs and/or sales restrictions; currency or commodity price fluctuations; lower used truck prices; insufficient or under-utilization of manufacturing capacity; supplier interruptions; insufficient liquidity in the capital markets; fluctuations in interest rates; insufficient supplier capacity or access to raw materials; labor disruptions; shortages of commercial truck drivers; increased warranty costs or litigation; or legislative and governmental regulations.
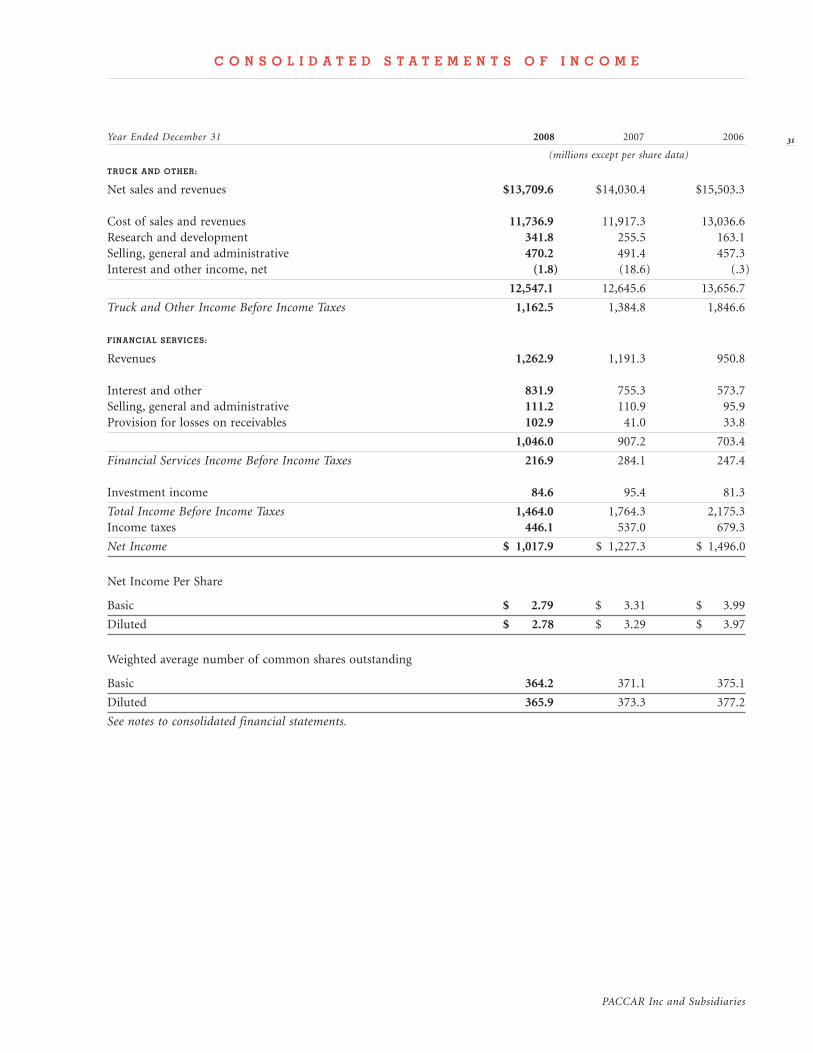
PACCAR Inc and Subsidiaries
Year Ended December 31 2008 2007 2006
(millions except per share data)
truck and other:
Net sales and revenues $13,709.6 $14,030.4 $15,503.3
Cost of sales and revenues 11,736.9 11,917.3 13,036.6Research and development 341.8 255.5 163.1Selling, general and administrative 470.2 491.4 457.3Interest and other income, net (1.8) (18.6) (.3)
12,547.1 12,645.6 13,656.7
Truck and Other Income Before Income Taxes 1,162.5 1,384.8 1,846.6 financial services:
Revenues 1,262.9 1,191.3 950.8
Interest and other 831.9 755.3 573.7Selling, general and administrative 111.2 110.9 95.9Provision for losses on receivables 102.9 41.0 33.8
1,046.0 907.2 703.4
Financial Services Income Before Income Taxes 216.9 284.1 247.4
Investment income 84.6 95.4 81.3
Total Income Before Income Taxes 1,464.0 1,764.3 2,175.3Income taxes 446.1 537.0 679.3
Net Income $ 1,017.9 $ 1,227.3 $ 1,496.0
Net Income Per Share
Basic $ 2.79 $ 3.31 $ 3.99
Diluted $ 2.78 $ 3.29 $ 3.97
Weighted average number of common shares outstanding
Basic 364.2 371.1 375.1
Diluted 365.9 373.3 377.2
See notes to consolidated financial statements.
c o n s o l i d a t e d s t a t e m e n t s o f i n c o m e
31
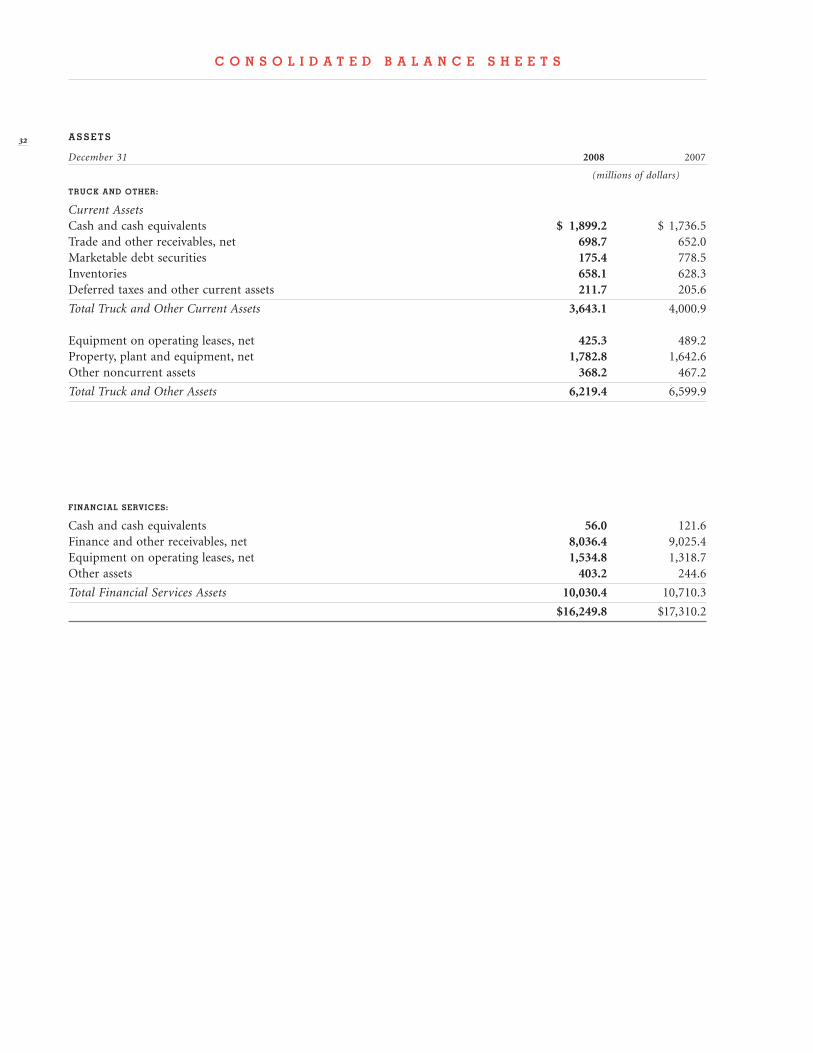
December 31 2008 2007
(millions of dollars)
truck and other:
Current AssetsCash and cash equivalents $ 1,899.2 $ 1,736.5Trade and other receivables, net 698.7 652.0Marketable debt securities 175.4 778.5Inventories 658.1 628.3Deferred taxes and other current assets 211.7 205.6
Total Truck and Other Current Assets 3,643.1 4,000.9
Equipment on operating leases, net 425.3 489.2Property, plant and equipment, net 1,782.8 1,642.6Other noncurrent assets 368.2 467.2
Total Truck and Other Assets 6,219.4 6,599.9
financial services:
Cash and cash equivalents 56.0 121.6Finance and other receivables, net 8,036.4 9,025.4Equipment on operating leases, net 1,534.8 1,318.7Other assets 403.2 244.6
Total Financial Services Assets 10,030.4 10,710.3
$16,249.8 $17,310.2
a s s e t s
c o n s o l i d a t e d b a l a n c e s h e e t s
2
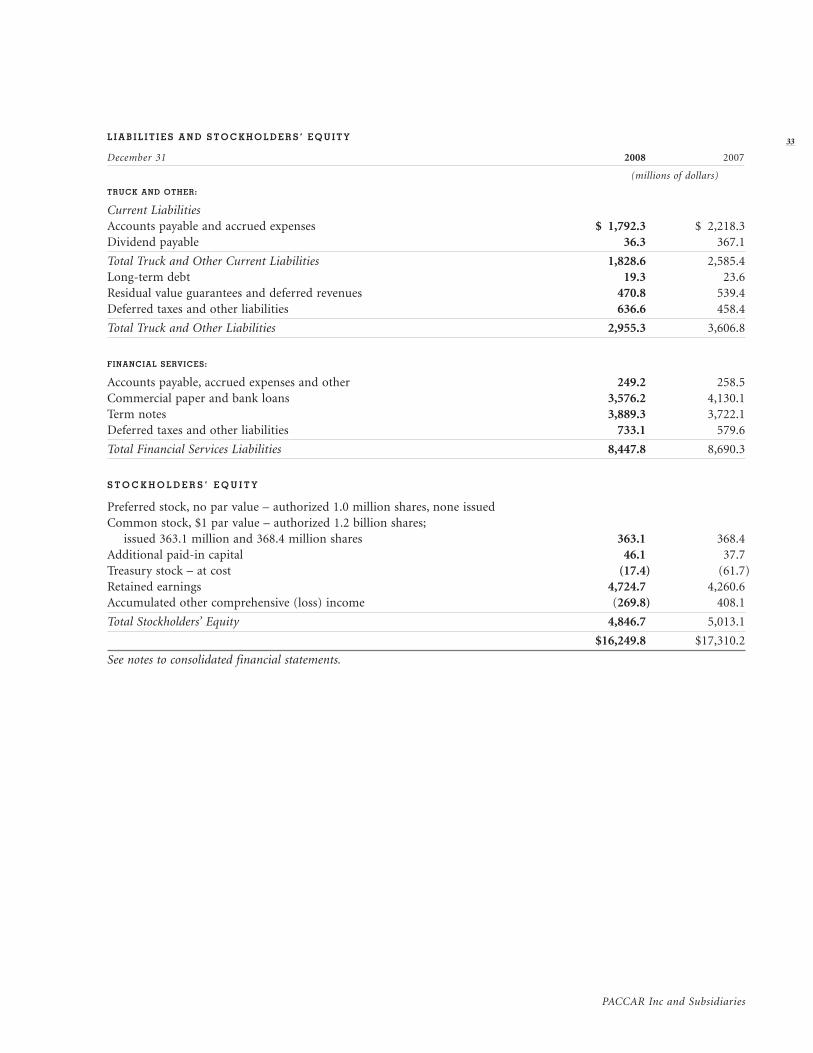
PACCAR Inc and Subsidiaries
l i a b i l i t i e s a n d s t o c k h o l d e r s ’ e q u i t y
December 31 2008 2007
(millions of dollars)
truck and other:
Current LiabilitiesAccounts payable and accrued expenses $ 1,792.3 $ 2,218.3Dividend payable 36.3 367.1
Total Truck and Other Current Liabilities 1,828.6 2,585.4Long‑term debt 19.3 23.6Residual value guarantees and deferred revenues 470.8 539.4Deferred taxes and other liabilities 636.6 458.4
Total Truck and Other Liabilities 2,955.3 3,606.8
financial services:
Accounts payable, accrued expenses and other 249.2 258.5Commercial paper and bank loans 3,576.2 4,130.1Term notes 3,889.3 3,722.1Deferred taxes and other liabilities 733.1 579.6
Total Financial Services Liabilities 8,447.8 8,690.3
s t o c k h o l d e r s ’ e q u i t y
Preferred stock, no par value – authorized 1.0 million shares, none issuedCommon stock, $1 par value – authorized 1.2 billion shares; issued 363.1 million and 368.4 million shares 363.1 368.4Additional paid‑in capital 46.1 37.7Treasury stock – at cost (17.4) (61.7)Retained earnings 4,724.7 4,260.6Accumulated other comprehensive (loss) income (269.8) 408.1
Total Stockholders’ Equity 4,846.7 5,013.1
$16,249.8 $17,310.2
See notes to consolidated financial statements.
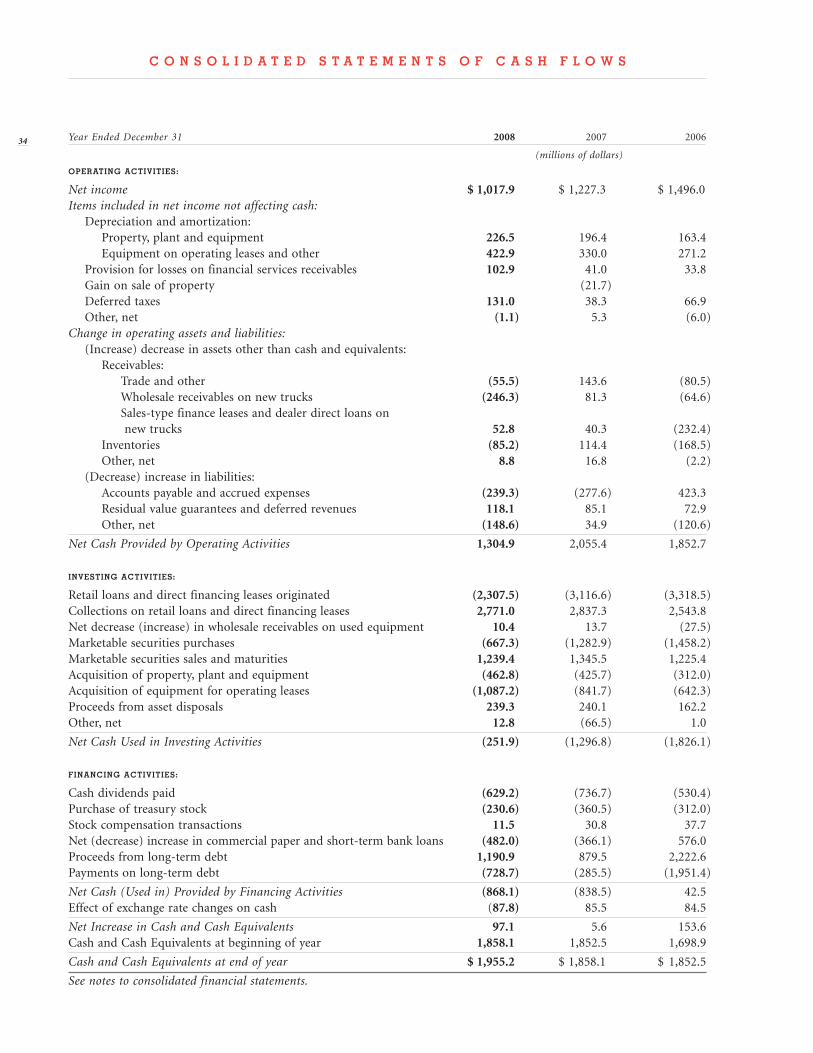
Year Ended December 31 2008 2007 2006
(millions of dollars)
operating activities:
Net income $ 1,017.9 $ 1,227.3 $ 1,496.0Items included in net income not affecting cash: Depreciation and amortization: Property, plant and equipment 226.5 196.4 163.4 Equipment on operating leases and other 422.9 330.0 271.2 Provision for losses on financial services receivables 102.9 41.0 33.8 Gain on sale of property (21.7) Deferred taxes 131.0 38.3 66.9 Other, net (1.1) 5.3 (6.0)Change in operating assets and liabilities: (Increase) decrease in assets other than cash and equivalents: Receivables: Trade and other (55.5) 143.6 (80.5) Wholesale receivables on new trucks (246.3) 81.3 (64.6) Sales-type finance leases and dealer direct loans on new trucks 52.8 40.3 (232.4) Inventories (85.2) 114.4 (168.5) Other, net 8.8 16.8 (2.2) (Decrease) increase in liabilities: Accounts payable and accrued expenses (239.3) (277.6) 423.3 Residual value guarantees and deferred revenues 118.1 85.1 72.9 Other, net (148.6) 34.9 (120.6)
Net Cash Provided by Operating Activities 1,304.9 2,055.4 1,852.7
investing activities:
Retail loans and direct financing leases originated (2,307.5) (3,116.6) (3,318.5)Collections on retail loans and direct financing leases 2,771.0 2,837.3 2,543.8Net decrease (increase) in wholesale receivables on used equipment 10.4 13.7 (27.5)Marketable securities purchases (667.3) (1,282.9) (1,458.2)Marketable securities sales and maturities 1,239.4 1,345.5 1,225.4Acquisition of property, plant and equipment (462.8) (425.7) (312.0)Acquisition of equipment for operating leases (1,087.2) (841.7) (642.3)Proceeds from asset disposals 239.3 240.1 162.2Other, net 12.8 (66.5) 1.0
Net Cash Used in Investing Activities (251.9) (1,296.8) (1,826.1)
financing activities:
Cash dividends paid (629.2) (736.7) (530.4)Purchase of treasury stock (230.6) (360.5) (312.0)Stock compensation transactions 11.5 30.8 37.7Net (decrease) increase in commercial paper and short-term bank loans (482.0) (366.1) 576.0Proceeds from long-term debt 1,190.9 879.5 2,222.6Payments on long-term debt (728.7) (285.5) (1,951.4)
Net Cash (Used in) Provided by Financing Activities (868.1) (838.5) 42.5Effect of exchange rate changes on cash (87.8) 85.5 84.5
Net Increase in Cash and Cash Equivalents 97.1 5.6 153.6Cash and Cash Equivalents at beginning of year 1,858.1 1,852.5 1,698.9
Cash and Cash Equivalents at end of year $ 1,955.2 $ 1,858.1 $ 1,852.5
See notes to consolidated financial statements.
c o n s o l i d a t e d s t a t e m e n t s o f c a s h f l o w s
4
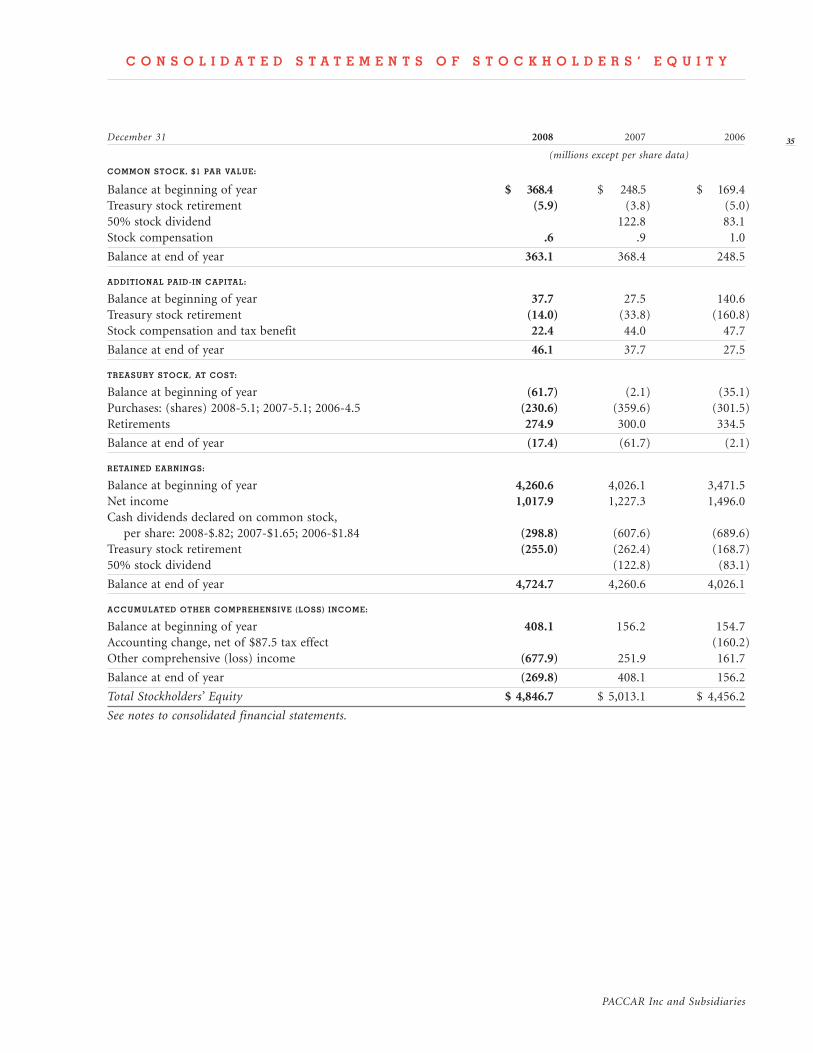
December 31 2008 2007 2006
(millions except per share data)
common stock, $1 par value:
Balance at beginning of year $ 368.4 $ 248.5 $ 169.4Treasury stock retirement (5.9) (3.8) (5.0)50% stock dividend 122.8 83.1Stock compensation .6 .9 1.0
Balance at end of year 363.1 368.4 248.5
additional paid-in capital:
Balance at beginning of year 37.7 27.5 140.6Treasury stock retirement (14.0) (33.8) (160.8)Stock compensation and tax benefit 22.4 44.0 47.7
Balance at end of year 46.1 37.7 27.5
treasury stock, at cost:
Balance at beginning of year (61.7) (2.1) (35.1)Purchases: (shares) 2008-5.1; 2007-5.1; 2006-4.5 (230.6) (359.6) (301.5)Retirements 274.9 300.0 334.5
Balance at end of year (17.4) (61.7) (2.1)
retained earnings:
Balance at beginning of year 4,260.6 4,026.1 3,471.5Net income 1,017.9 1,227.3 1,496.0Cash dividends declared on common stock, per share: 2008-$.82; 2007-$1.65; 2006-$1.84 (298.8) (607.6) (689.6)Treasury stock retirement (255.0) (262.4) (168.7)50% stock dividend (122.8) (83.1)
Balance at end of year 4,724.7 4,260.6 4,026.1
accumulated other comprehensive (loss) income:
Balance at beginning of year 408.1 156.2 154.7Accounting change, net of $87.5 tax effect (160.2)Other comprehensive (loss) income (677.9) 251.9 161.7
Balance at end of year (269.8) 408.1 156.2
Total Stockholders’ Equity $ 4,846.7 $ 5,013.1 $ 4,456.2
See notes to consolidated financial statements.
c o n s o l i d a t e d s t a t e m e n t s o f s t o c k h o l d e r s ’ e q u i t y
5
PACCAR Inc and Subsidiaries
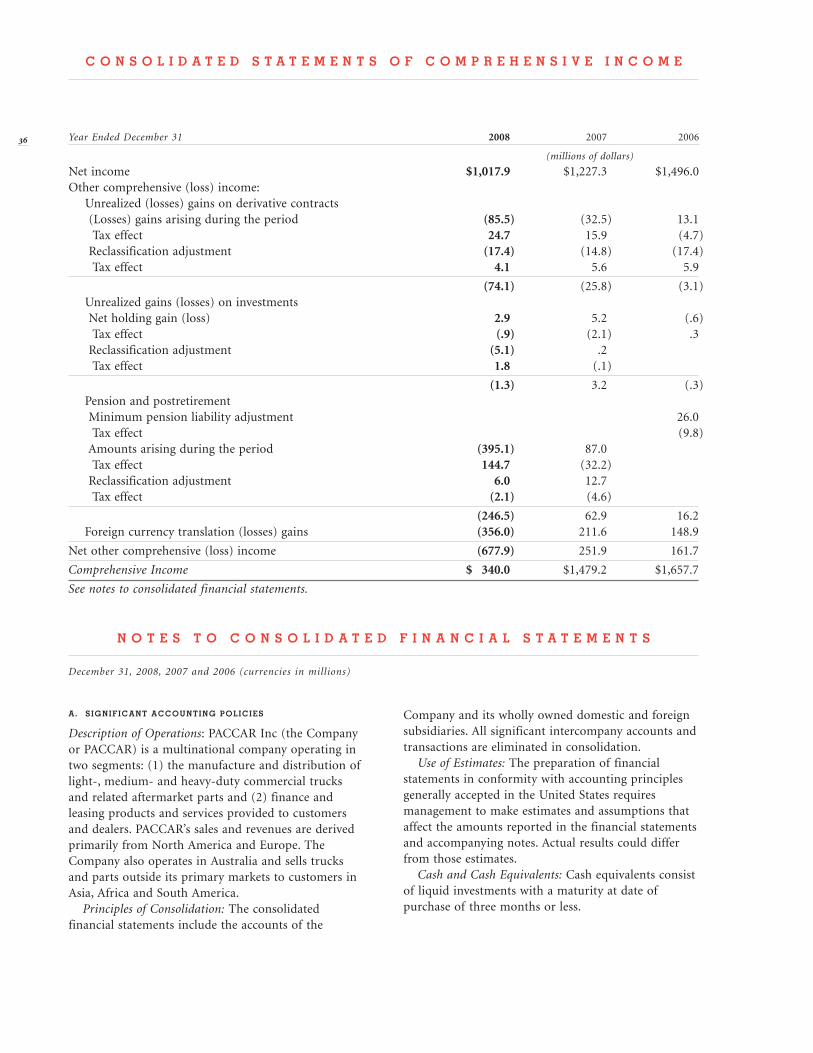
a. significant accounting policies
Description of Operations: PACCAR Inc (the Company or PACCAR) is a multinational company operating in two segments: (1) the manufacture and distribution of light-, medium- and heavy-duty commercial trucks and related aftermarket parts and (2) finance and leasing products and services provided to customers and dealers. PACCAR’s sales and revenues are derived primarily from North America and Europe. The Company also operates in Australia and sells trucks and parts outside its primary markets to customers in Asia, Africa and South America. Principles of Consolidation: The consolidated financial statements include the accounts of the
Company and its wholly owned domestic and foreign subsidiaries. All significant intercompany accounts and transactions are eliminated in consolidation. Use of Estimates: The preparation of financial statements in conformity with accounting principles generally accepted in the United States requires management to make estimates and assumptions that affect the amounts reported in the financial statements and accompanying notes. Actual results could differ from those estimates. Cash and Cash Equivalents: Cash equivalents consist of liquid investments with a maturity at date of purchase of three months or less.
6 Year Ended December 31 2008 2007 2006
(millions of dollars)
Net income $1,017.9 $1,227.3 $1,496.0Other comprehensive (loss) income: Unrealized (losses) gains on derivative contracts (Losses) gains arising during the period (85.5) (32.5) 13.1 Tax effect 24.7 15.9 (4.7) Reclassification adjustment (17.4) (14.8) (17.4) Tax effect 4.1 5.6 5.9
(74.1) (25.8) (3.1) Unrealized gains (losses) on investments Net holding gain (loss) 2.9 5.2 (.6) Tax effect (.9) (2.1) .3 Reclassification adjustment (5.1) .2 Tax effect 1.8 (.1)
(1.3) 3.2 (.3) Pension and postretirement Minimum pension liability adjustment 26.0 Tax effect (9.8) Amounts arising during the period (395.1) 87.0 Tax effect 144.7 (32.2) Reclassification adjustment 6.0 12.7 Tax effect (2.1) (4.6)
(246.5) 62.9 16.2 Foreign currency translation (losses) gains (356.0) 211.6 148.9
Net other comprehensive (loss) income (677.9) 251.9 161.7
Comprehensive Income $ 340.0 $1,479.2 $1,657.7
See notes to consolidated financial statements.
c o n s o l i d a t e d s t a t e m e n t s o f c o m p r e h e n s i v e i n c o m e
n o t e s t o c o n s o l i d a t e d f i n a n c i a l s t a t e m e n t s
December 31, 2008, 2007 and 2006 (currencies in millions)
PACCAR Inc and Subsidiaries
Trade and Other Receivables: The Company’s trade and other receivables are recorded at cost on the balance sheet net of allowances. Long-lived Assets, Goodwill and Other Intangible Assets: The Company evaluates the carrying value of long-lived assets (including property and equipment, goodwill and other intangible assets) when events and circumstances warrant such a review. Goodwill is tested for impairment on an annual basis. Impairment charges were insignificant during the three years ended December 31, 2008. Revenue Recognition: Substantially all sales and revenues of trucks and related aftermarket parts are recorded by the Company when products are shipped to dealers or customers, except for certain truck shipments that are subject to a residual value guarantee to the customer. Revenues related to these shipments are recognized on a straight-line basis over the guarantee period (see Note G). At the time certain truck and parts sales to a dealer are recognized, the Company records an estimate of the future sales incentive costs related to such sales. The estimate is based on historical data and announced incentive programs. Interest income from finance and other receivables is recognized using the interest method. Certain loan origination costs are deferred and amortized to interest income. For operating leases, rental revenue is recog nized on a straight-line basis over the lease term. Recognition of interest income and rental revenue is suspended when management determines that collection is not probable (generally after 90 days past the contractual due date). Recognition is resumed if the receivable becomes contractually current and the collection of amounts is again considered probable. Foreign Currency Translation: For most of PACCAR’s foreign subsidiaries, the local currency is the functional currency. All assets and liabilities are translated at year-end exchange rates and all income statement amounts are translated at the weighted average rates for the period. Translation adjustments are record ed in accumulated other comprehensive income (loss), a component of stockholders’ equity. PACCAR uses the U.S. dollar as the functional currency for its Mexican subsidiaries. Accordingly, inventories, cost of sales, property, plant and equipment, and depreciation are remeasured at historical rates. Resulting gains and losses are included in net income.
Earnings per Share: Diluted earnings per share are based on the weighted average number of basic shares outstanding during the year, adjusted for the dilutive effects of stock-based compensation awards under the treasury stock method. New Accounting Pronouncements: The Company adopted FASB Statement No. 159, The Fair Value Option for Financial Assets and Financial Liabilities (FAS 159) effective January 1, 2008. FAS 159 permits entities to measure most financial instruments at fair value if desired and requires that unrealized gains and losses on instruments for which the option has been elected to be reported in earnings. During 2008, the Company did not elect the fair value option for any financial instruments. See Note Q. The Company adopted FASB Statement No.157, Fair Value Measurements (FAS 157) effective January 1, 2008 with no significant effect on the financial statements. In March 2008, the FASB issued Statement No. 161, Disclosures about Derivative Instruments and Hedging Activities (FAS 161). FAS 161, which is effective January 1, 2009, amends and expands the disclosure requirements for derivative instruments and hedging activities. In December 2008, the FASB issued FASB Staff Position FAS132R-1, Employers’ Disclosures about Postretirement Benefit Plan Assets (FSP FAS 132R-1) which is effective for the year ending December 31, 2009. This standard provides guidance on an employer’s disclosures about plan assets of a defined benefit pension or other postretirement plan. Reclassifications: Certain prior-year amounts have been reclassified to conform to the 2008 presentation.
7
n o t e s t o c o n s o l i D a t e D f i n a n c i a l s t a t e m e n t s
December 31, 2008, 2007 and 2006 (currencies in millions)
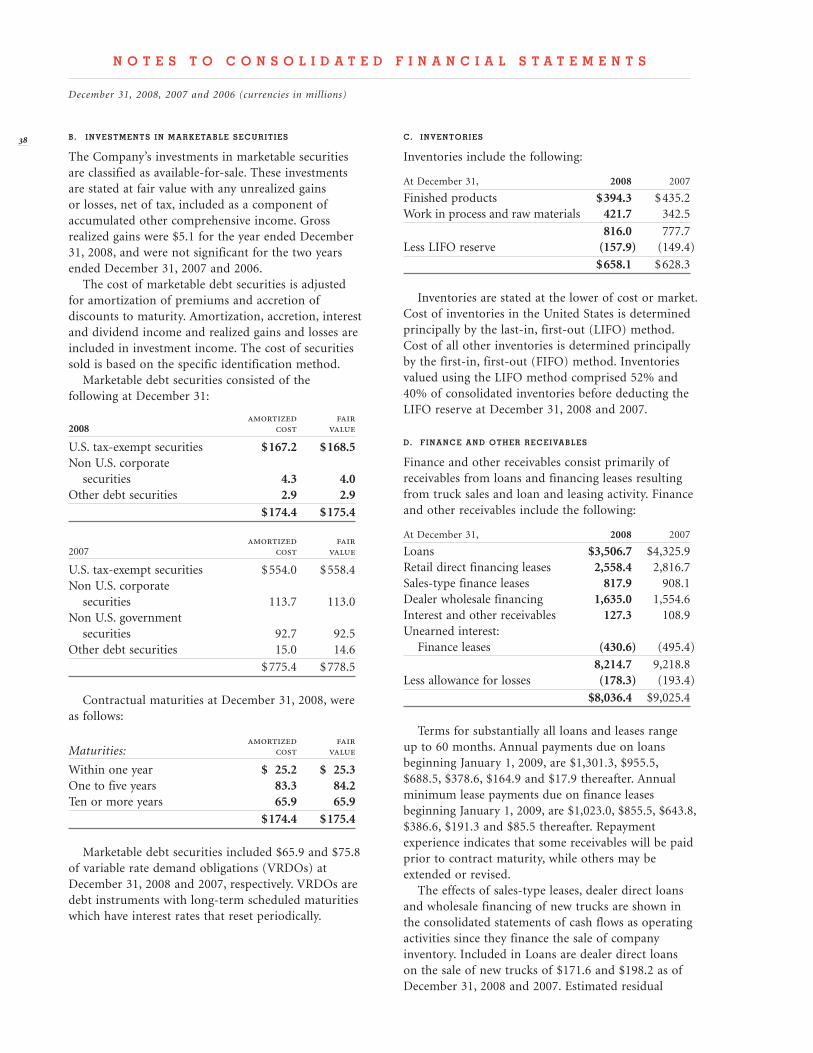
b. investments in marketable securities
The Company’s investments in marketable securities are classified as available-for-sale. These investments are stated at fair value with any unrealized gains or losses, net of tax, included as a component of accumulated other comprehensive income. Gross realized gains were $5.1 for the year ended December 31, 2008, and were not significant for the two years ended December 31, 2007 and 2006. The cost of marketable debt securities is adjusted for amortization of premiums and accretion of discounts to maturity. Amortization, accretion, interest and dividend income and realized gains and losses are included in investment income. The cost of securities sold is based on the specific identification method. Marketable debt securities consisted of the following at December 31:
amortized fair 2008 cost value
U.S. tax-exempt securities $ 167.2 $ 168.5Non U.S. corporate securities 4.3 4.0Other debt securities 2.9 2.9 $ 174.4 $ 175.4
amortized fair 2007 cost value
U.S. tax-exempt securities $ 554.0 $ 558.4Non U.S. corporate securities 113.7 113.0Non U.S. government securities 92.7 92.5Other debt securities 15.0 14.6
$ 775.4 $ 778.5
Contractual maturities at December 31, 2008, were as follows:
amortized fair Maturities: cost value
Within one year $ 25.2 $ 25.3One to five years 83.3 84.2Ten or more years 65.9 65.9 $ 174.4 $ 175.4
Marketable debt securities included $65.9 and $75.8 of variable rate demand obligations (VRDOs) at December 31, 2008 and 2007, respectively. VRDOs are debt instruments with long-term scheduled maturities which have interest rates that reset periodically.
c. inventories
Inventories include the following:
At December 31, 2008 2007
Finished products $ 394.3 $ 435.2Work in process and raw materials 421.7 342.5
816.0 777.7Less LIFO reserve (157.9) (149.4)
$ 658.1 $ 628.3
Inventories are stated at the lower of cost or market. Cost of inventories in the United States is determined principally by the last-in, first-out (LIFO) method. Cost of all other inventories is determined principally by the first-in, first-out (FIFO) method. Inventories valued using the LIFO method comprised 52% and 40% of consolidated inventories before deducting the LIFO reserve at December 31, 2008 and 2007.
D. Finance anD other receivables
Finance and other receivables consist primarily of receivables from loans and financing leases resulting from truck sales and loan and leasing activity. Finance and other receivables include the following:
At December 31, 2008 2007
Loans $ 3,506.7 $ 4,325.9Retail direct financing leases 2,558.4 2,816.7Sales-type finance leases 817.9 908.1Dealer wholesale financing 1,635.0 1,554.6Interest and other receivables 127.3 108.9Unearned interest: Finance leases (430.6) (495.4)
8,214.7 9,218.8Less allowance for losses (178.3) (193.4)
$ 8,036.4 $ 9,025.4
Terms for substantially all loans and leases range up to 60 months. Annual payments due on loans beginning January 1, 2009, are $1,301.3, $955.5, $688.5, $378.6, $164.9 and $17.9 thereafter. Annual minimum lease payments due on finance leases beginning January 1, 2009, are $1,023.0, $855.5, $643.8, $386.6, $191.3 and $85.5 thereafter. Repayment experience indicates that some receivables will be paid prior to contract maturity, while others may be extended or revised. The effects of sales-type leases, dealer direct loans and wholesale financing of new trucks are shown in the consolidated statements of cash flows as operating activities since they finance the sale of company inventory. Included in Loans are dealer direct loans on the sale of new trucks of $171.6 and $198.2 as of December 31, 2008 and 2007. Estimated residual
8
n o t e s t o c o n s o l i D a t e D F i n a n c i a l s t a t e m e n t s
December 31, 2008, 2007 and 2006 (currencies in millions)
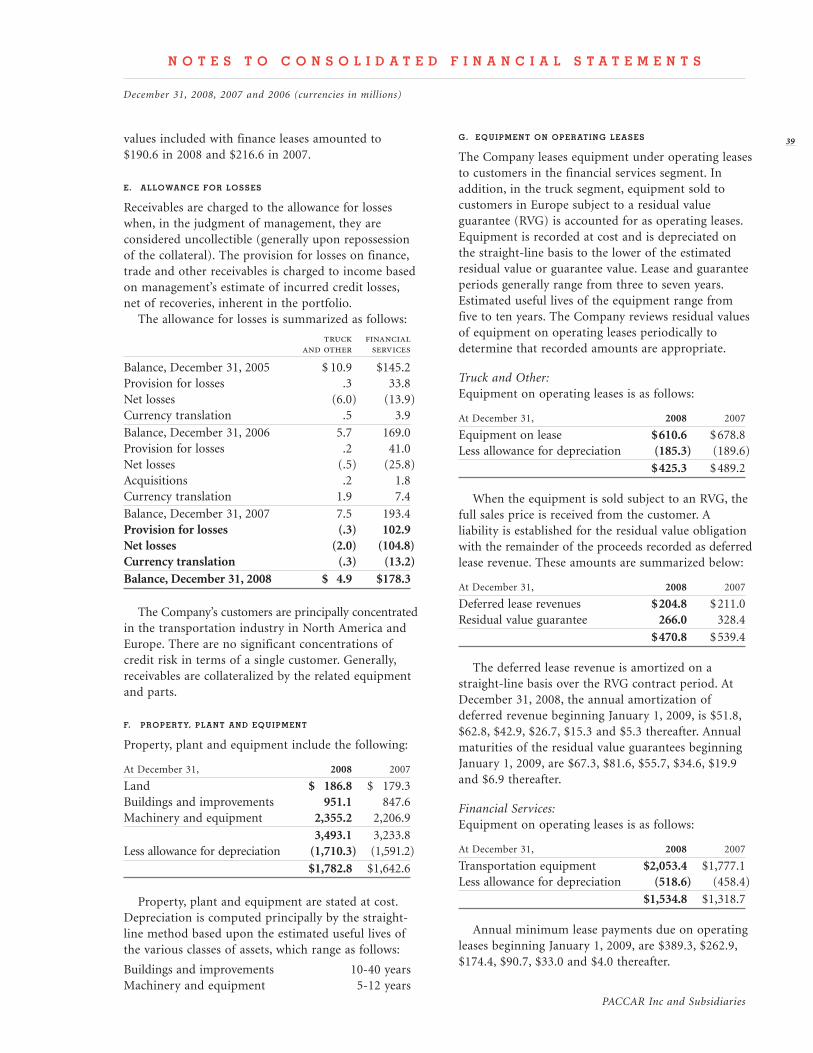
PACCAR Inc and Subsidiaries
9values included with finance leases amounted to $190.6 in 2008 and $216.6 in 2007.
E. AllowAncE for lossEs
Receivables are charged to the allowance for losses when, in the judgment of management, they are considered uncollectible (generally upon repossession of the collateral). The provision for losses on finance, trade and other receivables is charged to income based on management’s estimate of incurred credit losses, net of recoveries, inherent in the portfolio. The allowance for losses is summarized as follows:
truck financial
and other services
Balance, December 31, 2005 $ 10.9 $ 145.2Provision for losses .3 33.8Net losses (6.0) (13.9)Currency translation .5 3.9
Balance, December 31, 2006 5.7 169.0Provision for losses .2 41.0Net losses (.5) (25.8)Acquisitions .2 1.8Currency translation 1.9 7.4
Balance, December 31, 2007 7.5 193.4Provision for losses (.3) 102.9Net losses (2.0) (104.8)Currency translation (.3) (13.2)Balance, December 31, 2008 $ 4.9 $ 178.3
The Company’s customers are principally concentrated in the transportation industry in North America and Europe. There are no significant concentrations of credit risk in terms of a single customer. Generally, receivables are collateralized by the related equipment and parts.
f. ProPErty, PlAnt And EquiPmEnt
Property, plant and equipment include the following:
At December 31, 2008 2007
Land $ 186.8 $ 179.3Buildings and improvements 951.1 847.6Machinery and equipment 2,355.2 2,206.9
3,493.1 3,233.8Less allowance for depreciation (1,710.3) (1,591.2)
$ 1,782.8 $ 1,642.6
Property, plant and equipment are stated at cost. Depreciation is computed principally by the straight- line method based upon the estimated useful lives of the various classes of assets, which range as follows:
Buildings and improvements 10-40 yearsMachinery and equipment 5-12 years
g. EquiPmEnt on oPErAting lEAsEs
The Company leases equipment under operating leases to customers in the financial services segment. In addition, in the truck segment, equipment sold to customers in Europe subject to a residual value guarantee (RVG) is accounted for as operating leases. Equipment is recorded at cost and is depreciated on the straight-line basis to the lower of the estimated residual value or guarantee value. Lease and guarantee periods generally range from three to seven years. Estimated useful lives of the equipment range from five to ten years. The Company reviews residual values of equipment on operating leases periodically to determine that recorded amounts are appropriate.
Truck and Other:Equipment on operating leases is as follows:
At December 31, 2008 2007
Equipment on lease $ 610.6 $ 678.8Less allowance for depreciation (185.3) (189.6)
$ 425.3 $ 489.2
When the equipment is sold subject to an RVG, the full sales price is received from the customer. A liability is established for the residual value obligation with the remainder of the proceeds recorded as deferred lease revenue. These amounts are summarized below:
At December 31, 2008 2007
Deferred lease revenues $ 204.8 $ 211.0Residual value guarantee 266.0 328.4
$ 470.8 $ 539.4
The deferred lease revenue is amortized on a straight-line basis over the RVG contract period. At December 31, 2008, the annual amortization of deferred revenue beginning January 1, 2009, is $51.8, $62.8, $42.9, $26.7, $15.3 and $5.3 thereafter. Annual maturities of the residual value guarantees beginning January 1, 2009, are $67.3, $81.6, $55.7, $34.6, $19.9 and $6.9 thereafter.
Financial Services:Equipment on operating leases is as follows:
At December 31, 2008 2007
Transportation equipment $ 2,053.4 $ 1,777.1Less allowance for depreciation (518.6) (458.4)
$ 1,534.8 $ 1,318.7
Annual minimum lease payments due on operating leases beginning January 1, 2009, are $389.3, $262.9, $174.4, $90.7, $33.0 and $4.0 thereafter.
n o t E s t o c o n s o l i d A t E d f i n A n c i A l s t A t E m E n t s
December 31, 2008, 2007 and 2006 (currencies in millions)
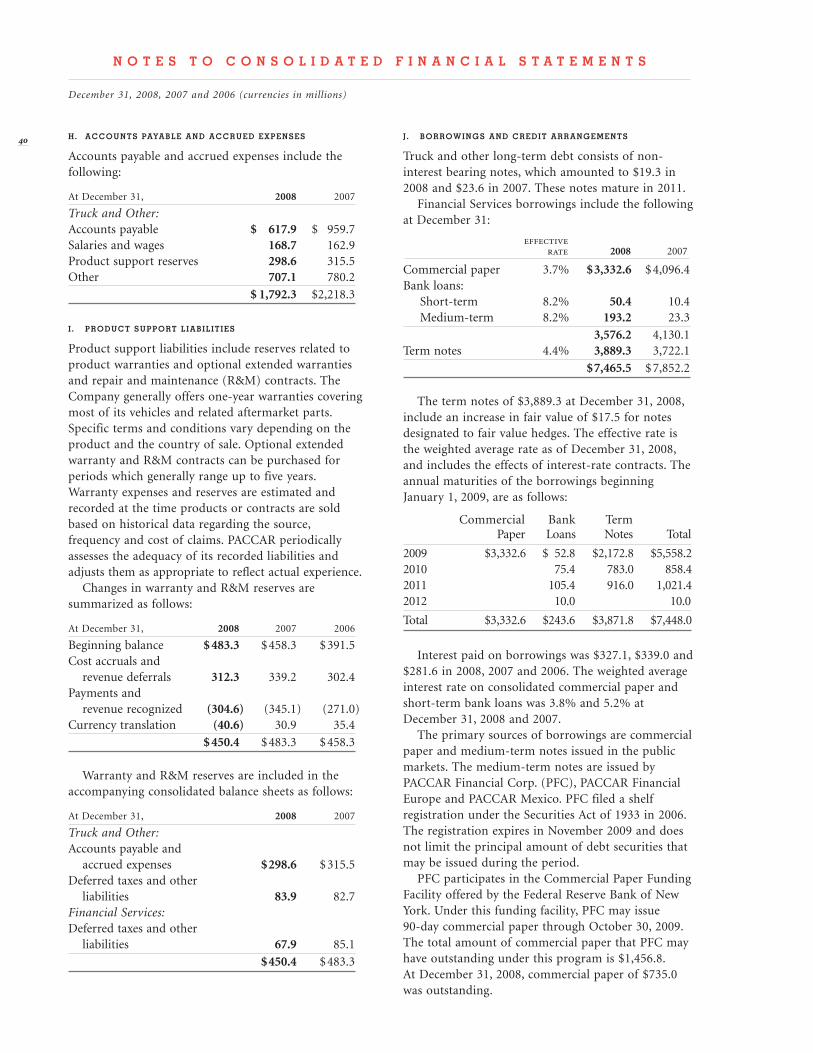
h. accounts payable and accrued expenses
Accounts payable and accrued expenses include the following:
At December 31, 2008 2007
Truck and Other:Accounts payable $ 617.9 $ 959.7Salaries and wages 168.7 162.9Product support reserves 298.6 315.5Other 707.1 780.2
$ 1,792.3 $ 2,218.3
I . product support lIabIlItIes
Product support liabilities include reserves related to product warranties and optional extended warranties and repair and maintenance (R&M) contracts. The Company generally offers one‑year warranties covering most of its vehicles and related aftermarket parts. Specific terms and conditions vary depending on the product and the country of sale. Optional extended warranty and R&M contracts can be purchased for periods which generally range up to five years. Warranty expenses and reserves are estimated and recorded at the time products or contracts are sold based on historical data regarding the source, frequency and cost of claims. PACCAR periodically assesses the adequacy of its recorded liabilities and adjusts them as appropriate to reflect actual experience. Changes in warranty and R&M reserves are summarized as follows:
At December 31, 2008 2007 2006
Beginning balance $ 483.3 $ 458.3 $ 391.5Cost accruals and revenue deferrals 312.3 339.2 302.4Payments and revenue recognized (304.6) (345.1) (271.0)Currency translation (40.6) 30.9 35.4
$ 450.4 $ 483.3 $ 458.3
Warranty and R&M reserves are included in the accompanying consolidated balance sheets as follows:
At December 31, 2008 2007
Truck and Other:Accounts payable and accrued expenses $ 298.6 $ 315.5Deferred taxes and other liabilities 83.9 82.7Financial Services:Deferred taxes and other liabilities 67.9 85.1
$ 450.4 $ 483.3
J . borrowIngs and credIt arrangements
Truck and other long‑term debt consists of non‑interest bearing notes, which amounted to $19.3 in 2008 and $23.6 in 2007. These notes mature in 2011. Financial Services borrowings include the following at December 31:
effective rate 2008 2007
Commercial paper 3.7% $ 3,332.6 $ 4,096.4Bank loans: Short‑term 8.2% 50.4 10.4 Medium‑term 8.2% 193.2 23.3
3,576.2 4,130.1Term notes 4.4% 3,889.3 3,722.1
$ 7,465.5 $ 7,852.2
The term notes of $3,889.3 at December 31, 2008, include an increase in fair value of $17.5 for notes designated to fair value hedges. The effective rate is the weighted average rate as of December 31, 2008, and includes the effects of interest‑rate contracts. The annual maturities of the borrowings beginning January 1, 2009, are as follows:
Commercial Bank Term Paper Loans Notes Total
2009 $3,332.6 $ 52.8 $2,172.8 $5,558.22010 75.4 783.0 858.42011 105.4 916.0 1,021.42012 10.0 10.0
Total $3,332.6 $243.6 $3,871.8 $7,448.0
Interest paid on borrowings was $327.1, $339.0 and $281.6 in 2008, 2007 and 2006. The weighted average interest rate on consolidated commercial paper and short‑term bank loans was 3.8% and 5.2% at December 31, 2008 and 2007. The primary sources of borrowings are commercial paper and medium‑term notes issued in the public markets. The medium‑term notes are issued by PACCAR Financial Corp. (PFC), PACCAR Financial Europe and PACCAR Mexico. PFC filed a shelf registration under the Securities Act of 1933 in 2006. The registration expires in November 2009 and does not limit the principal amount of debt securities that may be issued during the period. PFC participates in the Commercial Paper Funding Facility offered by the Federal Reserve Bank of New York. Under this funding facility, PFC may issue 90‑day commercial paper through October 30, 2009. The total amount of commercial paper that PFC may have outstanding under this program is $1,456.8. At December 31, 2008, commercial paper of $735.0 was outstanding.
40
n o t e s t o c o n s o l I d a t e d f I n a n c I a l s t a t e m e n t s
December 31, 2008, 2007 and 2006 (currencies in millions)
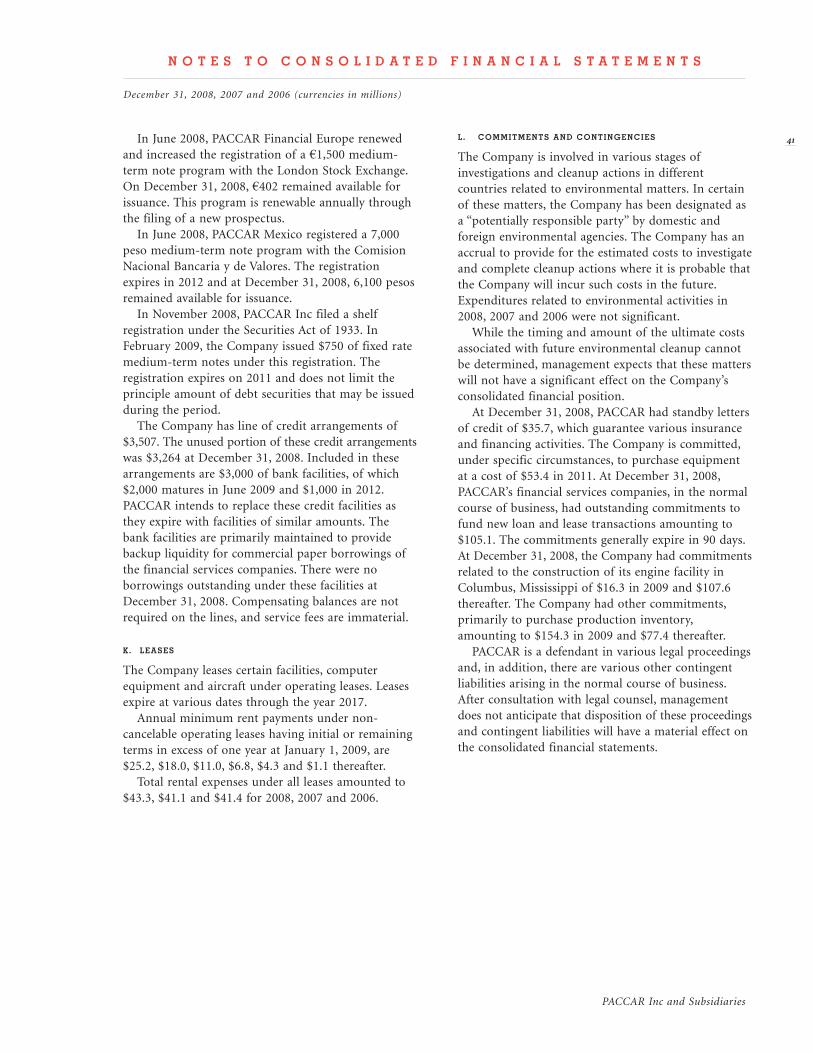
PACCAR Inc and Subsidiaries
In June 2008, PACCAR Financial Europe renewed and increased the registration of a €1,500 medium-term note program with the London Stock Exchange. On December 31, 2008, €402 remained available for issuance. This program is renewable annually through the filing of a new prospectus. In June 2008, PACCAR Mexico registered a 7,000 peso medium-term note program with the Comision Nacional Bancaria y de Valores. The registration expires in 2012 and at December 31, 2008, 6,100 pesos remained available for issuance. In November 2008, PACCAR Inc filed a shelf registration under the Securities Act of 1933. In February 2009, the Company issued $750 of fixed rate medium-term notes under this registration. The registration expires on 2011 and does not limit the principle amount of debt securities that may be issued during the period. The Company has line of credit arrangements of $3,507. The unused portion of these credit arrangements was $3,264 at December 31, 2008. Included in these arrangements are $3,000 of bank facilities, of which $2,000 matures in June 2009 and $1,000 in 2012. PACCAR intends to replace these credit facilities as they expire with facilities of similar amounts. The bank facilities are primarily maintained to provide backup liquidity for commercial paper borrowings of the financial services companies. There were no borrowings outstanding under these facilities at December 31, 2008. Compensating balances are not required on the lines, and service fees are immaterial.
K. Leases
The Company leases certain facilities, computer equipment and aircraft under operating leases. Leases expire at various dates through the year 2017. Annual minimum rent payments under non-cancelable operating leases having initial or remaining terms in excess of one year at January 1, 2009, are $25.2, $18.0, $11.0, $6.8, $4.3 and $1.1 thereafter. Total rental expenses under all leases amounted to $43.3, $41.1 and $41.4 for 2008, 2007 and 2006.
L. commitments and contingencies
The Company is involved in various stages of investigations and cleanup actions in different countries related to environmental matters. In certain of these matters, the Company has been designated as a “potentially responsible party” by domestic and foreign environmen tal agencies. The Company has an accrual to provide for the estimated costs to investigate and complete cleanup actions where it is probable that the Company will incur such costs in the future. Expenditures related to environmental activities in 2008, 2007 and 2006 were not significant. While the timing and amount of the ultimate costs associated with future environmental cleanup cannot be determined, management expects that these matters will not have a significant effect on the Company’s consolidated financial position. At December 31, 2008, PACCAR had standby letters of credit of $35.7, which guarantee various insurance and financing activities. The Company is committed, under specific circumstances, to purchase equipment at a cost of $53.4 in 2011. At December 31, 2008, PACCAR’s financial services companies, in the normal course of business, had outstanding commitments to fund new loan and lease transactions amounting to $105.1. The commitments generally expire in 90 days. At December 31, 2008, the Company had commitments related to the construction of its engine facility in Columbus, Mississippi of $16.3 in 2009 and $107.6 thereafter. The Company had other commitments, primarily to purchase production inventory, amounting to $154.3 in 2009 and $77.4 thereafter. PACCAR is a defendant in various legal proceedings and, in addition, there are various other contingent liabilities arising in the normal course of business. After consultation with legal counsel, management does not anticipate that disposition of these proceedings and contingent liabilities will have a material effect on the consolidated financial statements.
41
n o t e s t o c o n s o L i d a t e d f i n a n c i a L s t a t e m e n t s
December 31, 2008, 2007 and 2006 (currencies in millions)
M. eMployee benefit plans
PACCAR has several defined benefit pension plans, which cover a majority of its employees. The Company evaluates its actuarial assumptions on an annual basis and considers changes based upon market conditions and other factors. The Company funds its pensions in accordance with applicable employee benefit and tax laws. The Company contributed $63.9 to its pension plans in 2008 and $13.8 in 2007. The Company expects to contribute in the range of $50.0 to $150.0 to its pension plans in 2009 of which $11.0 is estimated to satisfy minimum funding requirements. Annual benefits expected to be paid beginning January 1, 2009, are $47.8, $50.9, $56.4, $62.0, $65.8, and for the five years thereafter, a total of $398.5. Plan assets are invested in a diversified mix of equity and debt securities through professional investment managers with the objective to achieve targeted risk adjusted returns and maintain liquidity sufficient to fund current benefit payments. Allocation of plan assets may change over time based upon investment manager determination of the relative attractiveness of equity and debt securities. The Company periodically assesses allocation of plan assets by investment type and evaluates external sources of information regarding the long-term historical returns and expected future returns for each investment type. The following information details the allocation of plan assets by investment type:
Actual Target 2008 2007
Plan Assets Allocation as of December 31:Equity securities 50-70% 59.3% 65.6%Debt securities 30-50% 40.7% 34.4%
100.0% 100.0%
The following additional data relates to all pension plans of the Company, except for certain multi-employer and foreign-insured plans:
At December 31, 2008 2007
Weighted Average Assumptions:Discount rate 6.2% 6.2%Rate of increase in future compensation levels 4.3% 4.3%Assumed long-term rate of return on plan assets 7.4% 7.4%
2008 2007
Change in Projected Benefit Obligation:Benefit obligation at January 1 $ 1,201.0 $ 1,193.4Service cost 46.6 49.7Interest cost 73.9 68.7Benefits paid (48.8) (41.4)Actuarial loss (gain) 3.0 (86.6)Curtailment (3.3) (5.5)Currency translation (80.9) 18.1Participant contributions 4.9 4.6
Projected benefit obligation at December 31 $ 1,196.4 $ 1,201.0
Change in Plan Assets: Fair value of plan assets at January 1 $ 1,312.5 $ 1,242.1Employer contributions 63.9 13.8Actual return on plan assets (336.4) 74.3Benefits paid (48.8) (41.4)Currency translation (82.3) 19.1Participant contributions 4.9 4.6
Fair value of plan assets at December 31 913.8 1,312.5
Funded Status at December 31 $ (282.6) $ 111.5
Amounts Recorded in Balance Sheet:Other noncurrent assets $ 5.5 $ 158.1Other noncurrent liabilities (288.1) (46.6)Accumulated other comprehensive loss: Actuarial loss 334.5 78.0 Prior service cost 10.1 12.6 Net initial transition amount 1.0 1.4
Of the December 31, 2008 amounts in accumulated other comprehensive income, $12.8 of unrecognized actuarial loss, $2.0 of unrecognized prior service cost and $.1 of unrecognized net initial transition amount are expected to be amortized into net pension expense in 2009. The accumulated benefit obligation for all pension plans of the Company, except for certain multi-employer and foreign-insured plans was $1,037.6 at December 31, 2008, and $1,055.5 at December 31, 2007. Information for all plans with accumulated benefit obligation in excess of plan assets is as follows:
At December 31, 2008 2007
Projected benefit obligation $ 933.7 $ 43.9Accumulated benefit obligation 791.9 33.8Fair value of plan assets 650.9 1.0
2
n o t e s t o c o n s o l i D a t e D f i n a n c i a l s t a t e M e n t s
December 31, 2008, 2007 and 2006 (currencies in millions)
PACCAR Inc and Subsidiaries
Year Ended December 31, 2008 2007 2006
Components of Pension Expense:Service cost $ 46.6 $ 49.7 $ 50.5Interest on projected benefit obligation 73.9 68.7 60.8Expected return on assets (92.8) (89.7) (76.7)Amortization of prior service costs 2.4 2.9 3.6Recognized actuarial loss 3.0 8.4 12.7Curtailment .9 2.7 .1
Net pension expense $ 34.0 $ 42.7 $ 51.0
Pension expense for multi-employer and foreign-insured plans was $45.8, $37.9 and $32.0 in 2008, 2007 and 2006. The Company has certain defined contribution benefit plans whereby it generally matches employee contributions up to 5% of base wages. The majority of participants in these plans are non-union employees located in the United States. Expenses for these plans were $22.1, $22.6 and $22.1 in 2008, 2007 and 2006. The Company also provides optional coverage of approxi mately 50% of medical costs for the majority of its U.S. employees from retirement until age 65 as well as a death benefit. The following data relates to unfunded postretirement medical and life insurance plans:
Year Ended December 31, 2008 2007 2006
Components of Retiree Expense:Service cost $ 3.2 $ 4.8 $ 5.4Interest cost 4.7 5.2 4.8Recognized actuarial loss .9 1.4Recognized prior service cost .1 .1 .1Recognized net initial obligation .4 .4 .5
Net retiree expense $ 8.4 $ 11.4 $ 12.2
The discount rate used for calculating the accumu-lated plan benefits was 6.1% for 2008 and 6.5% for 2007. In 2008 the assumed long-term medical inflation rate was 9% declining to 6% over three years. In 2007 the rate assumption was 10% declining to 6% over four years. Annual benefits expected to be paid beginning January 1, 2009, are $4.3, $5.0, $6.0, $6.6, and $7.3; and for the five years thereafter, a total of $41.5.
Assumed health care cost trends have an effect on the amounts reported for the postretirement health care plans. A one-percentage-point change in assumed health care cost trend rates would have the following effects: 1% 1% increase decrease
Effect on annual total of service and interest cost components $ 1.0 $ (.8)Effect on accumulated postretirement benefit obligation $ 8.0 $ (6.4)
2008 2007
Change in Projected Benefit Obligation:Benefit obligation at January 1 $ 88.0 $ 92.4Service cost 3.2 4.8Interest cost 4.7 5.2Benefits paid (4.1) (3.0)Curtailment (5.3)Actuarial gain (10.9) (6.1)
Projected benefit obligation at December 31 $ 80.9 $ 88.0
Unfunded Status at December 31 $ (80.9) $ (88.0)
Amounts Recorded in Balance Sheet:Other noncurrent liabilities $ (80.9) $ (88.0)Accumulated other comprehensive loss: Actuarial loss 1.8 8.6 Prior service cost .1 .2 Net initial transition amount .8 1.0
3
n o t e s t o c o n s o l i D a t e D f i n a n c i a l s t a t e m e n t s
December 31, 2008, 2007 and 2006 (currencies in millions)
N. iNcome taxes
Year Ended December 31, 2008 2007 2006
Income Before Income Taxes:Domestic $ 96.0 $ 419.1 $ 1,149.3Foreign 1,368.0 1,345.2 1,026.0
$ 1,464.0 $ 1,764.3 $ 2,175.3
Provision for Income Taxes:Current provision (benefit): Federal $ (24.7) $ 120.5 $ 280.4 State (7.9) 11.1 39.6 Foreign 347.7 367.1 292.4
315.1 498.7 612.4Deferred provision (benefit): Federal 123.7 41.9 49.6 State 12.5 3.6 4.7 Foreign (5.2) (7.2) 12.6
131.0 38.3 66.9
$ 446.1 $ 537.0 $ 679.3
Reconciliation of Statutory U.S. Federal Tax to Actual Provision:Statutory rate 35% 35% 35%Statutory tax $ 512.4 $ 617.5 $ 761.4Effect of: Tax on foreign earnings (67.3) (72.4) (48.8) Other, net 1.0 (8.1) (33.3)
$ 446.1 $ 537.0 $ 679.3
U.S. income taxes are not provided on the undistributed earnings of the Company’s foreign subsidiaries that are considered to be indefinitely reinvested. At December 31, 2008, the amount of undistributed earnings which are considered to be indefinitely reinvested is $2,835.0.
At December 31, 2008, the Company’s net tax operating loss carryforwards were $203.0. Substantially all of the loss carryforwards are in foreign subsidiaries and carry forward indefinitely, subject to certain limita tions under applicable laws. The future tax benefits of net operating loss carryforwards are evaluated on a regular basis, including a review of historical and projected future operating results.
At December 31: 2008 2007
Components of Deferred Tax Assets (Liabilities):Assets: Postretirement benefit plans $ 196.6 $ 50.8 Accrued expenses 156.4 208.2 Allowance for losses on receivables 58.0 62.1 Net operating loss carryforwards 54.0 54.9 Other 152.1 77.8
617.1 453.8 Valuation allowance (5.4) (18.8)
611.7 435.0Liabilities: Financial Services leasing depreciation (524.1) (410.3) Depreciation and amortization (116.4) (125.0) Postretirement benefit plans (72.3) (61.8) Other (55.1) (23.9)
(767.9) (621.0)
Net deferred tax liability $ (156.2) $ (186.0)
At December 31: 2008 2007
Classification of Deferred Tax Assets (Liabilities):Truck and Other: Deferred taxes and other current assets $ 83.5 $ 107.2 Other noncurrent assets 195.3 108.4 Accounts payable and accrued expense (13.3) Deferred taxes and other liabilities (13.1) (47.3)Financial Services: Other assets 56.4 34.3 Deferred taxes and other liabilities (465.0) (388.6)
Net deferred tax liability $ (156.2) $ (186.0)
Cash paid for income taxes was $452.0, $412.9 and $611.5 in 2008, 2007 and 2006.
N o t e s t o c o N s o l i D a t e D f i N a N c i a l s t a t e m e N t s
December 31, 2008, 2007 and 2006 (currencies in millions)
PACCAR Inc and Subsidiaries
5 A reconciliation of the beginning and ending amount of unrecognized tax benefits is as follows:
2008 2007
Balance at January 1 $ 57.9 $ 54.3Additions based on tax positions and settlements related to the current year 9.7 11.4Reductions for tax positions of prior years (20.7) (2.9)Lapse of statute of limitations (9.8) (4.9)
Balance at December 31 $ 37.1 $ 57.9
The Company had $15.3 of related assets at December 31, 2008 and $30.6 of related assets at December 31, 2007. All of the unrecognized tax benefits and related assets would impact the effective tax rate if recognized. The Company does not currently anticipate any significant changes to its unrecognized tax benefits during the next twelve months. Interest and penalties are classified as income taxes in the accompanying statements of income and were not significant during any of the three years ended December 31, 2008. Amounts accrued for the payment of penalties and interest at December 31, 2008 and 2007 were also not significant. The United States Internal Revenue Service has completed examinations of the Company’s tax returns for all years through 2004. Examinations of the Company’s tax returns for other major jurisdictions have not been completed for years ranging from 2001 through 2008.
O. StOckhOlderS’ equity
Stockholder Rights Plan: The plan provides one right for each share of PACCAR common stock outstanding. Rights become exercisable if a person publicly announces the intention to acquire 15% or more of PACCAR’s common stock or if a person (Acquiror) acquires such amount of common stock. In all cases, rights held by the Acquiror are not exercisable. When exercisable, each right entitles the holder to purchase for two hundred dollars a fractional share of Series A Junior Participating Preferred Stock. Each fractional preferred share has dividend, liquidation and voting rights which are no less than those for a share of common stock. Under certain circumstances, the rights may become exercisable for shares of PACCAR common stock or common stock of the Acquiror having a market value equal to twice the exercise price of the right. Also under certain circumstances, the
Board of Directors may ex change exercisable rights, in whole or in part, for one share of PACCAR common stock per right. The rights, which will expire on February 19, 2009, may be redeemed at one cent per right, subject to certain conditions. For this plan, 50,000 preferred shares are reserved for issuance. No shares have been issued. Accumulated Other Comprehensive (Loss) Income: Following are the components of accumulated other comprehensive income:
At December 31: 2008 2007 2006
Unrealized gain (loss) on investments $ 1.0 $ 3.2 $ (2.2)Tax effect (.4) (1.3) .9
.6 1.9 (1.3)
Unrealized (loss) gain on derivative contracts (121.7) (18.8) 28.5Tax effect 39.4 10.6 (10.9)
(82.3) (8.2) 17.6
Pension and postretirement: Unrecognized: Actuarial loss (525.9) (131.6) (225.2) Prior service cost (16.0) (20.0) (25.3) Net initial obligation (2.3) (3.5) (4.4) Tax effect 195.9 53.3 90.1
(348.3) (101.8) (164.8)
Currency translation adjustment 160.2 516.2 304.7
Accumulated other comprehensive income $ (269.8) $ 408.1 $ 156.2
Other Capital Stock Changes: PACCAR had 409,000, 1,278,900 and 32,873 treasury shares at December 31, 2008, 2007 and 2006, respectively. Stock Dividend: A 50% common stock dividend was paid in October 2007. This resulted in the issuance of 122,775,211 additional shares and 613 fractional shares paid in cash. In 2006, a 50% common stock dividend was paid, which resulted in the issuance of 83,104,090 additional shares and 543 fractional shares paid in cash.
n O t e S t O c O n S O l i d a t e d f i n a n c i a l S t a t e m e n t S
December 31, 2008, 2007 and 2006 (currencies in millions)
P. Derivative financial instruments
Derivative financial instruments are used as hedges to manage exposures to fluctuations in interest rates and foreign currency exchange rates. Instruments designated as either cash flow hedges or fair value hedges may qualify for hedge accounting. Derivative instruments that do not qualify for hedge accounting are held as economic hedges. The Company’s policies prohibit the use of derivatives for speculation or trading. At inception of each hedge relationship, the Company documents its risk management objectives, procedures and accounting treatment. Exposure limits and minimum credit ratings are used to minimize the risks of counterparty default. The Company had no material exposures to default at December 31, 2008. Interest-Rate Contracts: The Company enters into various interest-rate contracts, including interest-rate swaps and cap agreements. Interest-rate swaps involve the exchange of fixed and floating rate interest payments based on the contractual notional amounts. These contracts are used to manage exposures to fluctuations in interest rates. Net amounts paid or received are reflected as adjustments to interest expense. The following table presents the notional amounts and fair value of interest-rate contracts:
At December 31, 2008 2007
Notional amounts $ 5,055.7 $ 5,355.6Fair value: Assets 25.1 18.9 Liabilities 151.5 53.6
Notional maturities for all interest-rate contracts for the five years beginning January 1, 2009, are $1,599.5, $1,528.8, $1,494.0, $401.9, and $31.5. The majority of these contracts are floating to fixed swaps that effectively convert an equivalent amount of commercial paper and other variable rate debt to fixed rates. Foreign Currency Exchange Contracts: The Company enters into foreign currency exchange contracts to hedge certain anticipated transactions and borrowings denominated in foreign currencies, particularly the Canadian dollar, the euro, the British pound and the Mexican peso. The following table presents the notional amounts and fair value of foreign currency exchange contracts:
At December 31, 2008 2007
Notional amounts $ 925.1 $ 494.9Fair value: Assets 35.3 19.2 Liabilities 21.5 .3
Foreign currency exchange contracts mature within one year.
All derivative financial instruments are recorded at fair value in the consolidated balance sheets. Derivative assets are included in the consolidated balance sheets in Truck and Other “Deferred taxes and other current assets” and in Financial Services “Other assets.” Derivative liabilities are included in Truck and Other “Accounts payable and accrued expenses” and in Financial Services “Accounts payable, accrued expenses and other.” During 2008, the Company did not elect to offset the fair value of derivative instruments. There was no collateral pledged to derivative positions at December 31, 2008. Changes in the fair value of derivatives designated as cash flow hedges are recorded in accumulated other comprehensive income to the extent such hedges are considered effective. Changes in the fair value of derivatives designated as fair value hedges are recorded in earnings together with the changes in fair value of the hedged item attributable to the risk being hedged. Changes in the fair value of economic hedges that do not qualify for hedge accounting are recorded in earnings in the period in which the change occurs. Amounts in accumulated other comprehensive income are reclassified into net income in the same period in which the hedged transaction affects earnings. Of the accumulated net loss included in other compre hensive income as of December 31, 2008, $34.7, net of taxes, is expected to be reclassified to interest expense or cost of sales in 2009. Net realized gains and losses from foreign exchange contracts are recognized as an adjustment to cost of sales or to financial services interest expense, consistent with the hedged transaction. Net realized gains and losses from interest-rate contracts are recognized as an adjustment to interest expense. The fixed interest earned on finance receivables will offset the amount recognized in interest expense, resulting in a stable interest margin consistent with the Company’s risk management strategy. Substantially all of the Company’s interest-rate contracts and foreign currency exchange contracts have been designated as cash flow hedges. The Company uses regression analysis to assess and measure effectiveness of interest-rate contracts. For foreign currency exchange contracts, the Company performs quarterly assessments to ensure that critical terms continue to match. Gains or losses on the ineffective portion of cash flow hedges are recognized currently in earnings and were immaterial for each of the three years ended December 31, 2008. Hedge accounting is discontinued prospectively when the Company determines that a derivative financial instrument has ceased to be a highly effective hedge. As a result of a reduction of certain forecasted sales transactions in the fourth quarter of 2008, the foreign
6
n o t e s t o c o n s o l i D a t e D f i n a n c i a l s t a t e m e n t s
December 31, 2008, 2007 and 2006 (currencies in millions)
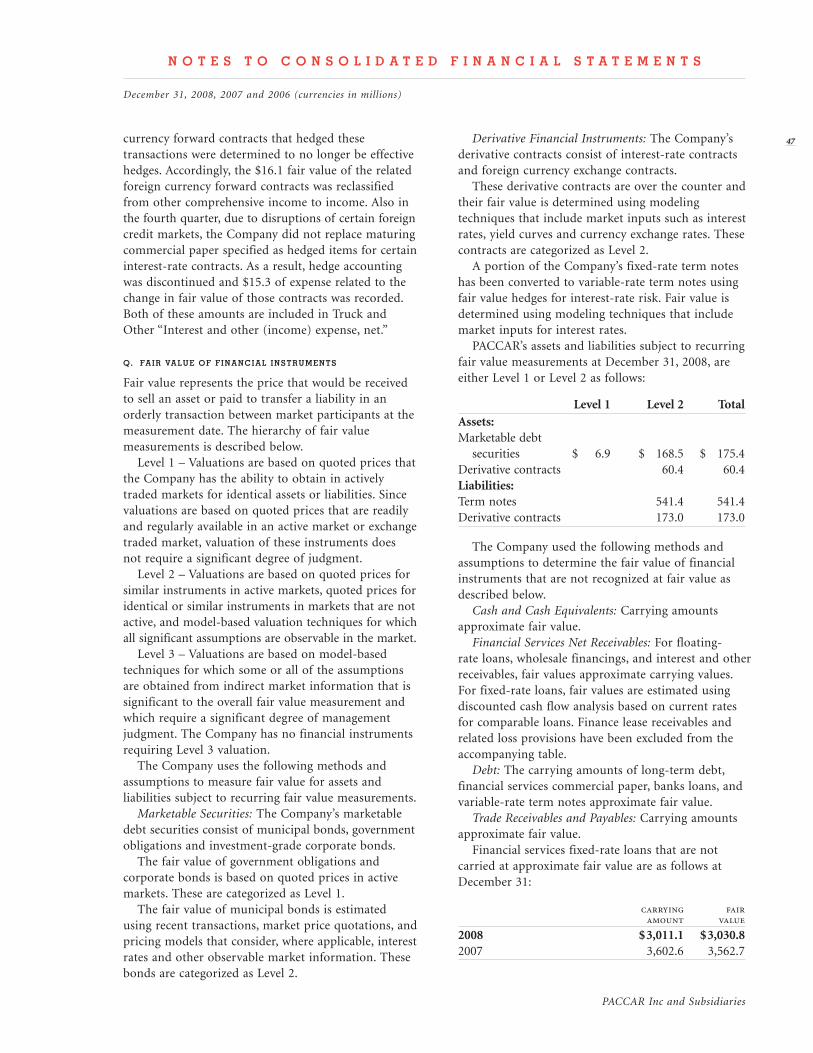
PACCAR Inc and Subsidiaries
currency forward contracts that hedged these transactions were determined to no longer be effective hedges. Accordingly, the $16.1 fair value of the related foreign currency forward contracts was reclassified from other comprehensive income to income. Also in the fourth quarter, due to disruptions of certain foreign credit markets, the Company did not replace maturing commercial paper specified as hedged items for certain interest-rate contracts. As a result, hedge accounting was discontinued and $15.3 of expense related to the change in fair value of those contracts was recorded. Both of these amounts are included in Truck and Other “Interest and other (income) expense, net.”
q. fair value of financial instruments
Fair value represents the price that would be received to sell an asset or paid to transfer a liability in an orderly transaction between market participants at the measurement date. The hierarchy of fair value measurements is described below. Level 1 – Valuations are based on quoted prices that the Company has the ability to obtain in actively traded markets for identical assets or liabilities. Since valuations are based on quoted prices that are readily and regularly available in an active market or exchange traded market, valuation of these instruments does not require a significant degree of judgment. Level 2 – Valuations are based on quoted prices for similar instruments in active markets, quoted prices for identical or similar instruments in markets that are not active, and model-based valuation techniques for which all significant assumptions are observable in the market. Level 3 – Valuations are based on model-based techniques for which some or all of the assumptions are obtained from indirect market information that is significant to the overall fair value measurement and which require a significant degree of management judgment. The Company has no financial instruments requiring Level 3 valuation. The Company uses the following methods and assumptions to measure fair value for assets and liabilities subject to recurring fair value measurements. Marketable Securities: The Company’s marketable debt securities consist of municipal bonds, government obligations and investment-grade corporate bonds. The fair value of government obligations and corporate bonds is based on quoted prices in active markets. These are categorized as Level 1. The fair value of municipal bonds is estimated using recent transactions, market price quotations, and pricing models that consider, where applicable, interest rates and other observable market information. These bonds are categorized as Level 2.
Derivative Financial Instruments: The Company’s derivative contracts consist of interest-rate contracts and foreign currency exchange contracts. These derivative contracts are over the counter and their fair value is determined using modeling techniques that include market inputs such as interest rates, yield curves and currency exchange rates. These contracts are categorized as Level 2. A portion of the Company’s fixed-rate term notes has been converted to variable-rate term notes using fair value hedges for interest-rate risk. Fair value is determined using modeling techniques that include market inputs for interest rates. PACCAR’s assets and liabilities subject to recurring fair value measurements at December 31, 2008, are either Level 1 or Level 2 as follows:
Level 1 Level 2 TotalAssets:Marketable debt securities $ 6.9 $ 168.5 $ 175.4Derivative contracts 60.4 60.4Liabilities: Term notes 541.4 541.4Derivative contracts 173.0 173.0
The Company used the following methods and assumptions to determine the fair value of financial instruments that are not recognized at fair value as described below. Cash and Cash Equivalents: Carrying amounts approximate fair value. Financial Services Net Receivables: For floating-rate loans, wholesale financings, and interest and other receivables, fair values approximate carrying values. For fixed-rate loans, fair values are estimated using discounted cash flow analysis based on current rates for comparable loans. Finance lease receivables and related loss provisions have been excluded from the accompanying table. Debt: The carrying amounts of long-term debt, financial services commercial paper, banks loans, and variable-rate term notes approximate fair value. Trade Receivables and Payables: Carrying amounts approximate fair value. Financial services fixed-rate loans that are not carried at approximate fair value are as follows at December 31:
carrying fair amount value
2008 $ 3,011.1 $ 3,030.82007 3,602.6 3,562.7
7
n o t e s t o c o n s o l i D a t e D f i n a n c i a l s t a t e m e n t s
December 31, 2008, 2007 and 2006 (currencies in millions)
R. stock compensation plans
PACCAR has certain plans under which officers and key employees may be granted options to purchase shares of the Company’s authorized but unissued common stock. Non-employee directors and certain officers may be granted restricted shares of the Company’s common stock. The maximum number of shares of the Company’s common stock authorized for issuance under these plans is 46.7 million, and as of December 31, 2008, the maximum number of shares available for future grants was 18.8 million. Options outstanding under these plans were granted with exercise prices equal to the fair market value of the Company’s common stock at the date of grant. Options expire no later than ten years from the grant date and generally vest within three years. Stock option activity is summarized below:
number exercise of shares price*
Outstanding at 12/31/05 7,131,400 $ 15.64 Granted 964,700 32.23 Exercised (1,883,400) 11.15 Cancelled (50,700) 29.13Outstanding at 12/31/06 6,162,000 19.50 Granted 824,200 44.56 Exercised (1,168,200) 14.79 Cancelled (109,000) 34.80Outstanding at 12/31/07 5,709,000 23.79 Granted 734,300 45.74 Exercised (403,000) 16.95 Cancelled (241,000) 39.50Outstanding at 12/31/08 5,799,300 $ 26.39
For options exercised, the aggregate difference between the market price and strike price on the date of exercise was $10.8 in 2008, $40.4 in 2007, and $43.2 in 2006. The following tables summarize information about options outstanding at December 31, 2008:
remaining average range of number contractual exercise exercise prices of shares life in years price*
Exercisable: $ 8.25-10.62 1,242,000 1.2 $ 9.63 12.54-13.96 1,070,800 3.6 13.30 25.31 503,300 4.9 25.31 32.11 775,900 5.8 32.11
3,592,000 3.4 17.78Not Exercisable: 32.23 809,500 7.1 32.23 44.56 713,200 8.1 44.56 45.74 684,600 9.1 45.74
2,207,300 8.0 40.40
5,799,300 5.2 $26.39
*Weighted Average
The fair value of restricted stock awards was determined based on the stock price at the award date. Certain restricted stock awards granted in 2008 and 2007 contain conditions tied to the Company’s performance over a five year period. Compensation expense for awards with performance conditions is recorded only when it is probable that the requirements will be achieved. Compensation expense related to restricted stock awards with only service conditions is recognized over the requisite service period. Realized tax benefits for 2008 of $3.7 and 2007 of $13.6 related to the excess of deductible amounts over compensation costs recognized have been classified as a financing cash flow. Stock based compensation expense was $10.2, $12.3 and $10.0 in 2008, 2007 and 2006 respectively. As of December 31, 2008, there was $5.9 of unrecognized compensation cost related to unvested stock options, which is expected to be recognized over a remaining weighted-average vesting period of 1.5 years. Unrecognized compensation cost at December 31, 2008, related to unvested restricted stock awards of $1.2 is expected to be recognized over a remaining weighted-average vesting period of .4 years. The estimated fair value of stock options granted during 2008, 2007 and 2006 was $8.58, $10.10 and $7.96 per share. These amounts were determined using the Black-Scholes-Merton option-pricing model, which values options based on the stock price at the grant date and the following assumptions:
2008 2007 2006
Risk-free interest rate 2.86% 4.80% 4.44%Expected volatility 29% 30% 34%Expected dividend yield 4.0% 4.0% 4.0%Expected term 5 years 5 years 5 years
Diluted Earnings Per Share: The following table shows additional shares added to weighted average basic shares outstanding to calculate diluted earnings per share. These additional shares primarily represent the effect of stock options.
At December 31: 2008 2007 2006
Additional shares 1,721,300 2,206,800 2,064,300
There were 1,397,800 antidilutive options in 2008, none in 2007 and 948,000 in 2006.
8
n o t e s t o c o n s o l i D a t e D f i n a n c i a l s t a t e m e n t s
December 31, 2008, 2007 and 2006 (currencies in millions except per share amounts)
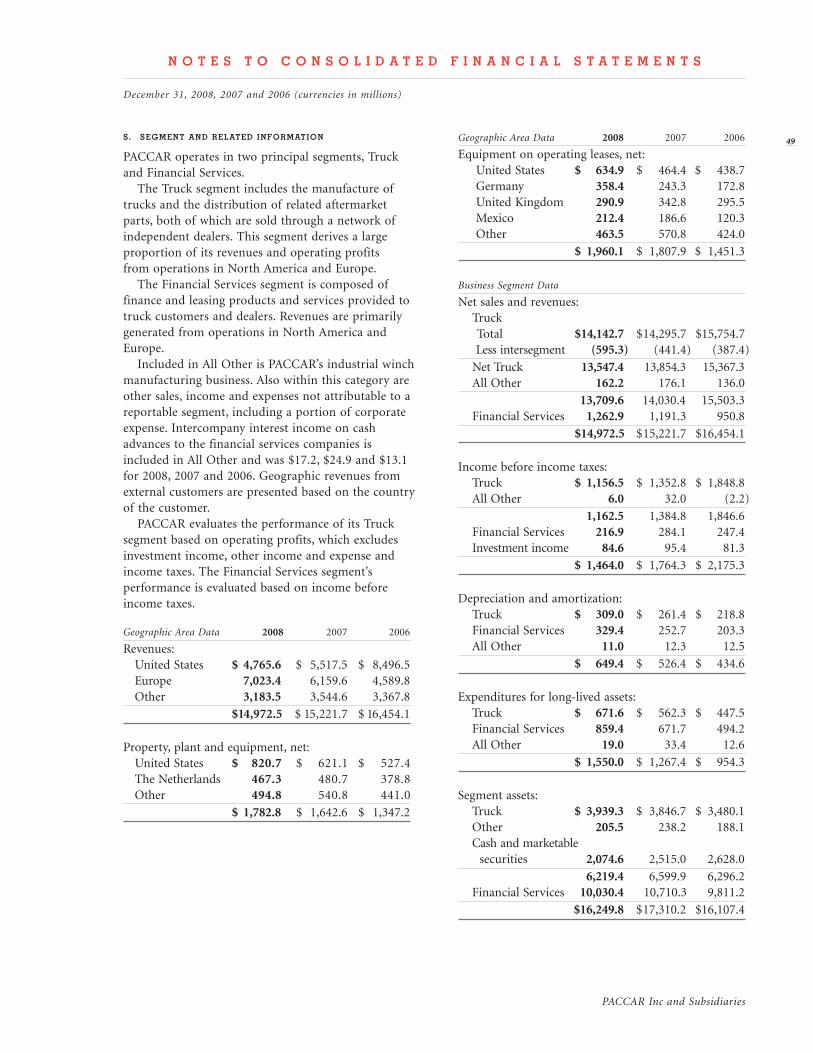
PACCAR Inc and Subsidiaries
s. segment and related information
PACCAR operates in two principal segments, Truck and Financial Services. The Truck segment includes the manufacture of trucks and the distribution of related aftermarket parts, both of which are sold through a network of independent dealers. This segment derives a large proportion of its revenues and operating profits from operations in North America and Europe. The Financial Services segment is composed of finance and leasing products and services provided to truck customers and dealers. Revenues are primarily generated from operations in North America and Europe. Included in All Other is PACCAR’s industrial winch manufacturing business. Also within this category are other sales, income and expenses not attributable to a reportable segment, including a portion of corporate expense. Intercompany interest income on cash advances to the financial services companies is included in All Other and was $17.2, $24.9 and $13.1 for 2008, 2007 and 2006. Geographic revenues from external customers are presented based on the country of the customer. PACCAR evaluates the performance of its Truck segment based on operating profits, which excludes investment income, other income and expense and income taxes. The Financial Services segment’s performance is evaluated based on income before income taxes.
Geographic Area Data 2008 2007 2006
Revenues: United States $ 4,765.6 $ 5,517.5 $ 8,496.5 Europe 7,023.4 6,159.6 4,589.8 Other 3,183.5 3,544.6 3,367.8
$ 14,972.5 $ 15,221.7 $ 16,454.1
Property, plant and equipment, net: United States $ 820.7 $ 621.1 $ 527.4 The Netherlands 467.3 480.7 378.8 Other 494.8 540.8 441.0
$ 1,782.8 $ 1,642.6 $ 1,347.2
Geographic Area Data 2008 2007 2006
Equipment on operating leases, net: United States $ 634.9 $ 464.4 $ 438.7 Germany 358.4 243.3 172.8 United Kingdom 290.9 342.8 295.5 Mexico 212.4 186.6 120.3 Other 463.5 570.8 424.0
$ 1,960.1 $ 1,807.9 $ 1,451.3
Business Segment Data
Net sales and revenues: Truck Total $ 14,142.7 $ 14,295.7 $ 15,754.7 Less intersegment (595.3) (441.4) (387.4)
Net Truck 13,547.4 13,854.3 15,367.3 All Other 162.2 176.1 136.0
13,709.6 14,030.4 15,503.3 Financial Services 1,262.9 1,191.3 950.8
$ 14,972.5 $ 15,221.7 $ 16,454.1
Income before income taxes: Truck $ 1,156.5 $ 1,352.8 $ 1,848.8 All Other 6.0 32.0 (2.2)
1,162.5 1,384.8 1,846.6 Financial Services 216.9 284.1 247.4 Investment income 84.6 95.4 81.3
$ 1,464.0 $ 1,764.3 $ 2,175.3
Depreciation and amortization: Truck $ 309.0 $ 261.4 $ 218.8 Financial Services 329.4 252.7 203.3 All Other 11.0 12.3 12.5
$ 649.4 $ 526.4 $ 434.6
Expenditures for long-lived assets: Truck $ 671.6 $ 562.3 $ 447.5 Financial Services 859.4 671.7 494.2 All Other 19.0 33.4 12.6
$ 1,550.0 $ 1,267.4 $ 954.3
Segment assets: Truck $ 3,939.3 $ 3,846.7 $ 3,480.1 Other 205.5 238.2 188.1 Cash and marketable securities 2,074.6 2,515.0 2,628.0
6,219.4 6,599.9 6,296.2 Financial Services 10,030.4 10,710.3 9,811.2
$ 16,249.8 $ 17,310.2 $ 16,107.4
9
n o t e s t o c o n s o l i d a t e d f i n a n c i a l s t a t e m e n t s
December 31, 2008, 2007 and 2006 (currencies in millions)
50
M a n a g e M e n t ’ s r e p o r t o n i n t e r n a l c o n t r o l o v e r f i n a n c i a l r e p o r t i n g
The Board of Directors and Stockholders of PACCAR Inc
We have audited the accompanying consolidated balance sheets of PACCAR Inc as of December 31, 2008 and 2007, and the related consolidated statements of income, comprehensive income, stockholders’ equity, and cash flows for each of the three years in the period ended December 31, 2008. These financial statements are the responsibility of the Company’s management. Our responsibility is to express an opinion on these financial statements based on our audits. We conducted our audits in accordance with the standards of the Public Company Accounting Oversight Board (United States). Those standards require that we plan and perform the audit to obtain reasonable assurance about whether the financial statements are free of material misstatement. An audit includes examining, on a test basis, evidence supporting the amounts and disclosures in the financial statements. An audit also includes assessing the accounting principles used and significant estimates made by management, as well as evaluating the overall financial statement presentation. We believe that our audits provide a reasonable basis for our opinion. In our opinion, the financial statements referred to above present fairly, in all material respects, the consolidated financial position of PACCAR Inc at December 31, 2008 and 2007, and the consolidated results of its operations and its cash flows for each of the three years in the period ended December 31, 2008, in conformity with U.S. generally accepted accounting principles. We also have audited, in accordance with the standards of the Public Company Accounting Oversight Board (United States), PACCAR Inc’s internal control over financial reporting as of December 31, 2008, based on criteria established in Internal Control-Integrated Framework issued by the Committee of Sponsoring Organizations of the Treadway Commission and our report dated February 13, 2009 expressed an unqualified opinion thereon.
Seattle, WashingtonFebruary 13, 2009
The management of PACCAR Inc (the Company) is responsible for establishing and maintaining satisfactory internal control over financial reporting. Internal control over financial reporting is a process designed to provide reasonable assurance regarding the reliability of financial reporting and the preparation of financial statements for external purposes in accordance with generally accepted accounting principles. Internal control over financial reporting may not prevent or detect misstatements because of its inherent limitations. Projections of any evaluation of effectiveness to future periods are subject to the risk that controls may become inadequate because of changes in conditions, or that the degree of compliance with the policies and procedures may deteriorate. Management assessed the Company’s internal control over financial reporting as of December 31, 2008, based on criteria for effective internal control over financial reporting described in Internal Control—Integrated Framework issued by the Committee of Sponsoring Organizations of the Treadway Commission. Based on this assessment, we concluded that the Company maintained effective internal control over financial reporting as of December 31, 2008. Ernst & Young LLP, the Independent Registered Public Accounting Firm that audited the financial statements included in this Annual Report, has issued an attestation report on the Company’s internal control over financial reporting. The attestation report is included on page 51.
Mark C. Pigott Chairman and Chief Executive Officer
r e p o r t o f i n d e p e n d e n t r e g i s t e r e d p u b l i c a c c o u n t i n g f i r M o n t h e c o M p a n y ’ s c o n s o l i d a t e d f i n a n c i a l s t a t e M e n t s
PACCAR Inc and Subsidiaries
51
r e p o r t o f i n d e p e n d e n t r e g i s t e r e d p u b l i c a c c o u n t i n g f i r m o n t h e c o m p a n y ’ s i n t e r n a l c o n t r o l s
The Board of Directors and Stockholders of PACCAR Inc
We have audited PACCAR Inc’s internal control over financial reporting as of December 31, 2008, based on criteria established in Internal Control—Integrated Framework issued by the Committee of Sponsoring Organizations of the Treadway Commission (the COSO criteria). PACCAR Inc’s management is responsible for maintaining effective internal control over financial reporting, and for its assessment of the effectiveness of internal control over financial reporting included in the accompanying Management’s Report on Internal Control Over Financial Reporting. Our responsibility is to express an opinion on the company’s internal control over financial reporting based on our audit. We conducted our audit in accordance with the standards of the Public Company Accounting Oversight Board (United States). Those standards require that we plan and perform the audit to obtain reasonable assurance about whether effective internal control over financial reporting was maintained in all material respects. Our audit included obtaining an understanding of internal control over financial reporting, assessing the risk that a material weakness exists, testing and evaluating the design and operating effectiveness of internal control based on the assessed risk, and performing such other procedures as we considered necessary in the circumstances. We believe that our audit provides a reasonable basis for our opinion. A company’s internal control over financial reporting is a process designed to provide reasonable assurance regarding the reliability of financial reporting and the preparation of financial statements for external purposes in accordance with generally accepted accounting principles. A company’s internal control over financial reporting includes those policies and procedures that (1) pertain to the maintenance of records that, in reasonable detail, accurately and fairly reflect the transactions and dispositions of the assets of the company; (2) provide reasonable assurance that transactions are recorded as necessary to permit preparation of financial statements in accordance with generally accepted accounting principles, and that receipts and expenditures of the company are being made only in accordance with authorizations of management and directors of the company; and (3) provide reasonable assurance regarding prevention or timely detection of unauthorized acquisition, use, or disposition of the company’s assets that could have a material effect on the financial statements. Because of its inherent limitations, internal control over financial reporting may not prevent or detect misstatements. Also, projections of any evaluation of effectiveness to future periods are subject to the risk that controls may become inadequate because of changes in conditions, or that the degree of compliance with the policies or procedures may deteriorate. In our opinion, PACCAR Inc maintained, in all material respects, effective internal control over financial reporting as of December 31, 2008, based on the COSO criteria. We also have audited, in accordance with the standards of the Public Company Accounting Oversight Board (United States), the consolidated balance sheets of PACCAR Inc as of December 31, 2008 and 2007 and the related consolidated statements of income, stockholders’ equity, comprehensive income and cash flows for each of the three years in the period ended December 31, 2008 and our report dated February 13, 2009 expressed an unqualified opinion thereon.
Seattle, WashingtonFebruary 13, 2009
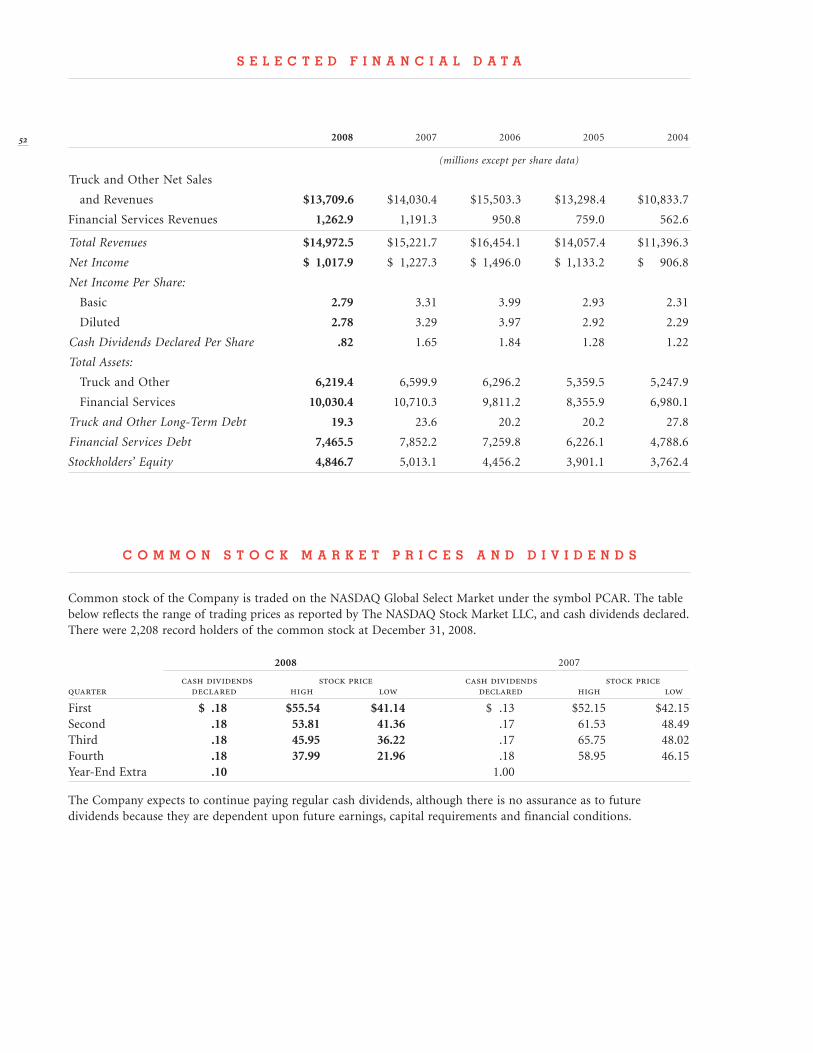
52
c o m m o n s t o c k m a r k e t p r i c e s a n d d i v i d e n d s
Common stock of the Company is traded on the NASDAQ Global Select Market under the symbol PCAR. The table be low reflects the range of trading prices as reported by The NASDAQ Stock Market LLC, and cash dividends declared. There were 2,208 record holders of the common stock at December 31, 2008.
2008 2007
cash dividends stock price cash dividends stock pricequarter declared high low declared high low
First $ .18 $55.54 $41.14 $ .13 $52.15 $42.15Second .18 53.81 41.36 .17 61.53 48.49Third .18 45.95 36.22 .17 65.75 48.02Fourth .18 37.99 21.96 .18 58.95 46.15Year-End Extra .10 1.00
The Company expects to continue paying regular cash dividends, although there is no assurance as to future dividends because they are dependent upon future earnings, capital requirements and financial conditions.
2008 2007 2006 2005 2004
(millions except per share data)
Truck and Other Net Sales
and Revenues $ 13,709.6 $ 14,030.4 $ 15,503.3 $ 13,298.4 $ 10,833.7
Financial Services Revenues 1,262.9 1,191.3 950.8 759.0 562.6
Total Revenues $ 14,972.5 $ 15,221.7 $16,454.1 $ 14,057.4 $ 11,396.3
Net Income $ 1,017.9 $ 1,227.3 $ 1,496.0 $ 1,133.2 $ 906.8
Net Income Per Share:
Basic 2.79 3.31 3.99 2.93 2.31
Diluted 2.78 3.29 3.97 2.92 2.29
Cash Dividends Declared Per Share .82 1.65 1.84 1.28 1.22
Total Assets:
Truck and Other 6,219.4 6,599.9 6,296.2 5,359.5 5,247.9
Financial Services 10,030.4 10,710.3 9,811.2 8,355.9 6,980.1
Truck and Other Long‑Term Debt 19.3 23.6 20.2 20.2 27.8
Financial Services Debt 7,465.5 7,852.2 7,259.8 6,226.1 4,788.6
Stockholders’ Equity 4,846.7 5,013.1 4,456.2 3,901.1 3,762.4
s e l e c t e d f i n a n c i a l d a t a
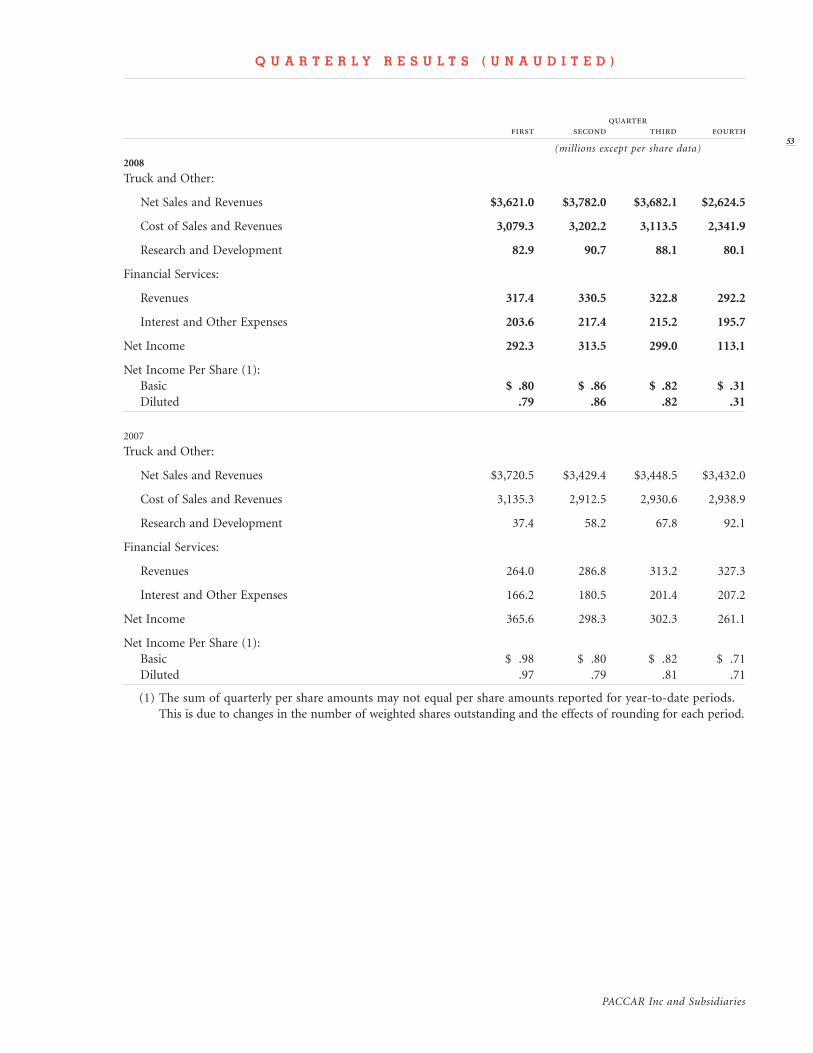
PACCAR Inc and Subsidiaries
quarter first second third fourth
(millions except per share data)
2008
Truck and Other:
Net Sales and Revenues $3,621.0 $3,782.0 $3,682.1 $2,624.5
Cost of Sales and Revenues 3,079.3 3,202.2 3,113.5 2,341.9
Research and Development 82.9 90.7 88.1 80.1
Financial Services:
Revenues 317.4 330.5 322.8 292.2
Interest and Other Expenses 203.6 217.4 215.2 195.7
Net Income 292.3 313.5 299.0 113.1
Net Income Per Share (1): Basic $ .80 $ .86 $ .82 $ .31 Diluted .79 .86 .82 .31
2007
Truck and Other:
Net Sales and Revenues $3,720.5 $3,429.4 $3,448.5 $3,432.0
Cost of Sales and Revenues 3,135.3 2,912.5 2,930.6 2,938.9
Research and Development 37.4 58.2 67.8 92.1
Financial Services:
Revenues 264.0 286.8 313.2 327.3
Interest and Other Expenses 166.2 180.5 201.4 207.2
Net Income 365.6 298.3 302.3 261.1
Net Income Per Share (1): Basic $ .98 $ .80 $ .82 $ .71 Diluted .97 .79 .81 .71
(1) The sum of quarterly per share amounts may not equal per share amounts reported for year-to-date periods. This is due to changes in the number of weighted shares outstanding and the effects of rounding for each period.
q u a r t e r l y r e s u l t s ( u n a u d i t e d )
53
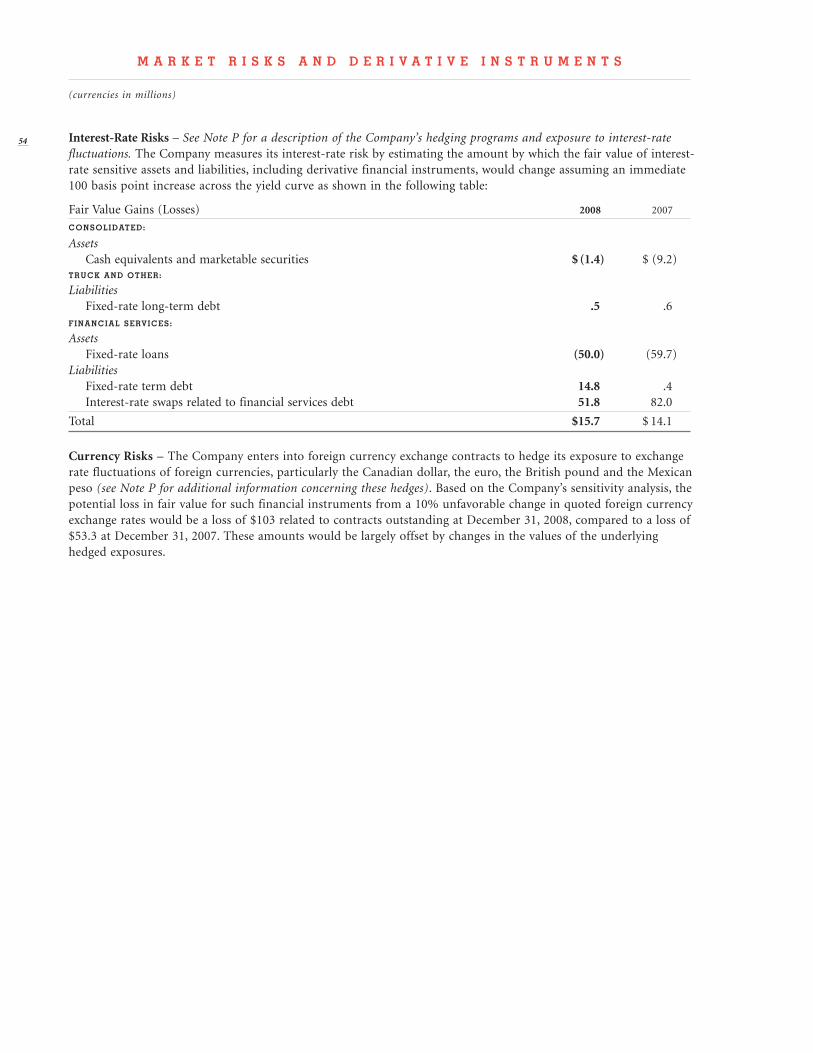
54 Interest-Rate Risks – See Note P for a description of the Company’s hedging programs and exposure to interest-rate fluctuations. The Company measures its interest-rate risk by estimating the amount by which the fair value of interest-rate sensitive assets and liabilities, including derivative financial instruments, would change assuming an immediate 100 basis point increase across the yield curve as shown in the following table:
Fair Value Gains (Losses) 2008 2007
consolidated:
Assets Cash equivalents and marketable securities $ (1.4) $ (9.2)truck and other:
Liabilities Fixed-rate long-term debt .5 .6Financial serVices:
Assets Fixed-rate loans (50.0) (59.7)Liabilities Fixed-rate term debt 14.8 .4 Interest-rate swaps related to financial services debt 51.8 82.0
Total $ 15.7 $ 14.1
Currency Risks – The Company enters into foreign currency exchange contracts to hedge its exposure to exchange rate fluctuations of foreign currencies, particularly the Canadian dollar, the euro, the British pound and the Mexican peso (see Note P for additional information concerning these hedges). Based on the Company’s sensitivity analysis, the potential loss in fair value for such financial instruments from a 10% unfavorable change in quoted foreign currency exchange rates would be a loss of $103 related to contracts outstanding at December 31, 2008, compared to a loss of $53.3 at December 31, 2007. These amounts would be largely offset by changes in the values of the underlying hedged exposures.
m a r k e t r i s k s a n d d e r i V a t i V e i n s t r u m e n t s
(currencies in millions)
PACCAR Inc and Subsidiaries
55
d i r e c t o r s
Mark C. PigottChairman and Chief Executive OfficerPACCAR Inc (3)
Alison J. CarnwathChairman MF Global Ltd. (2, 4)
John M. Fluke, Jr.ChairmanFluke Capital Management, L.P. (1, 4)
Kirk S. HachigianChairman and Chief Executive OfficerCooper Industries (2)
Stephen F. PageRetired Vice Chairman and Chief Financial OfficerUnited Technologies Corporation (1, 4)
Robert T. ParryRetired President and Chief Executive OfficerFederal Reserve Bank of San Francisco (2)
James C. PigottPresidentPigott Enterprises, Inc. (3, 4)
Thomas E. PlimptonVice ChairmanPACCAR Inc
William G. Reed, Jr.Retired ChairmanSimpson Investment Company (1, 3)
Gregory M. E. SpierkelChief Executive OfficerIngram Micro Inc. (2)
Warren R. StaleyRetired Chairman and Chief Executive OfficerCargill Inc. (4)
Charles R. WilliamsonRetired Chairman and Chief Executive OfficerUnocal Corporation (1, 2)
o f f i c e r s
Mark C. PigottChairman and Chief Executive Officer
Thomas E. PlimptonVice Chairman
James G. CardilloPresident
Daniel D. SobicExecutive Vice President
Ronald E. ArmstrongSenior Vice President
Robert J. ChristensenSenior Vice President
David C. AndersonVice President and General Counsel
Richard E. Bangert, IIVice President
Michael T. BarkleyVice President and Controller
Richard T. GormanVice President
Aad L. GoudriaanVice President
Timothy M. HenebryVice President
William D. JacksonVice President
William R. KozekVice President
Jack K. LeVierVice President
Thomas A. LundahlVice President
Helene N. MawyerVice President
George E. West, Jr.Vice President
Robin E. EastonTreasurer
Janice M. D’AmatoSecretary
c o m m i t t e e s o f t h e b o a r d
( 1 ) a u d i t c o m m i t t e e
( 2 ) c o m p e n s at i o n c o m m i t t e e
( 3 ) e x e c u t i v e c o m m i t t e e
( 4 ) n o m i n at i n g a n d g o v e r n a n c e c o m m i t t e e
o f f i c e r s a n d d i r e c t o r s
56 t r u c k s
Kenworth Truck CompanyDivision Headquarters:10630 N.E. 38th PlaceKirkland, Washington 98033
Factories:Chillicothe, OhioRenton, Washington
Peterbilt Motors CompanyDivision Headquarters:1700 Woodbrook StreetDenton, Texas 76205
Factories:Denton, TexasMadison, Tennessee
PACCAR of Canada Ltd.Markborough Place I6711 Mississauga Road N. Mississauga, OntarioL5N 4J8 Canada
Factory:Ste-Thérèse, Quebec
Canadian Kenworth CompanyDivision Headquarters:Markborough Place I6711 Mississauga Road N.Mississauga, OntarioL5N 4J8 Canada
Peterbilt of CanadaDivision Headquarters:Markborough Place I6711 Mississauga Road N. Mississauga, OntarioL5N 4J8 Canada
DAF Trucks N.V.Hugo van der Goeslaan 1P.O. Box 900655600 PT EindhovenThe Netherlands
Factories:Eindhoven, The NetherlandsWesterlo, Belgium
Leyland Trucks Ltd.Croston RoadLeyland, PrestonLancs PR26 6LZUnited Kingdom
Factory:Leyland, Lancashire
Kenworth Méxicana, S.A. de C.V.Calzada Gustavo Vildósola Castro 2000Mexicali, Baja California Mexico
Factory:Mexicali, Baja California
PACCARAustralia Pty. Ltd.Kenworth TrucksDivision Headquarters:64 Canterbury RoadBayswater, Victoria 3153 Australia
Factory:Bayswater, Victoria
t r u c k p a r t s a n d s u p p l i e s
PACCAR Engine Company1000 PACCAR DriveColumbus, Mississippi 39701
PACCAR PartsDivision Headquarters:750 Houser Way N.Renton, Washington 98055
DynacraftDivision Headquarters:650 Milwaukee Avenue N.Algona, Washington 98001
w i n c h e s
PACCAR Winch DivisionDivision Headquarters:800 E. Dallas StreetBroken Arrow, Oklahoma 74012 Factories:Broken Arrow, OklahomaOkmulgee, Oklahoma
p r o d u c t t e s t i n g , r e s e a r c h a n d d e v e l o p m e n t
PACCAR Technical CenterDivision Headquarters:12479 Farm to Market RoadMount Vernon, Washington 98273
DAF Trucks Test CenterWeverspad 25491 RL St. OedenrodeThe Netherlands
p a c c a r F i n a n c i a l s e r v i c e s g r o u p
PACCAR Financial Corp.PACCAR Building777 106th Avenue N.E.Bellevue, Washington 98004
PACCAR Financial Europe B.V.Hugo van der Goeslaan 1P.O. Box 900655600 PT EindhovenThe Netherlands
PACCAR Capital México S.A. de C.V.Calzada Gustavo Vildósola Castro 2000Mexicali, Baja California Mexico
PacLease Méxicana S.A. de C.V.Calzada Gustavo Vildósola Castro 2000Mexicali, Baja California Mexico
PACCAR Financial Services Ltd.Markborough Place I6711 Mississauga Road N. Mississauga, OntarioL5N 4J8 Canada
PACCAR Financial Pty. Ltd.64 Canterbury RoadBayswater, Victoria 3153Australia
PACCAR Leasing CompanyDivision of PACCAR Financial Corp.PACCAR Building777 106th Avenue N.E.Bellevue, Washington 98004
e x p o r t s a l e s
PACCAR InternationalDivision Headquarters:PACCAR Building777 106th Avenue N.E.Bellevue, Washington 98004
Offices:Beijing, Shanghai, People’s Republic of ChinaJakarta, IndonesiaManama, BahrainMiami, Florida
d i v i s i o n s a n d s u b s i d i a r i e s
S T A T E M E N T O F C O M P A N Y B U S I N E S SS T O C K H O L D E R S ’ I N F O R M A T I O N
Corporate OfficesPACCAR Building777 106th Avenue N.E.Bellevue, Washington98004
Mailing AddressP.O. Box 1518Bellevue, Washington98009
Telephone425.468.7400
Facsimile425.468.8216
Web sitewww.paccar.com
AeroCab, AERODYNE, Air Leaf, Braden, Carco, ComfortClass, DAF, Gearmatic, Kenmex, Kenworth, Kenworth Clean Power, Leyland, PACCAR, PACCAR MX, PACCAR PX, PacLease, PacTrac, Peterbilt, PX-6, PX-8, TRP, UltraCab and Unibilt are trademarks owned by PACCAR Inc and its subsidiaries.
Independent AuditorsErnst & Young LLPSeattle, Washington
SEC Form 10-KPACCAR’s annual report to the Securities and Exchange Commission will be furnished to stockholders on request to the Corporate Secretary, PACCAR Inc, P.O. Box 1518, Bellevue, Washington 98009. It is also available online at www.paccar.com/investors/investor_resources.asp, under SEC Filings.
Annual Stockholders’MeetingApril 28, 2009, 10:30 a.m. Meydenbauer Center11100 N.E. Sixth StreetBellevue, Washington98004
An Equal Opportunity Employer
This report was printed on recycled paper.
Stock Transfer and Dividend Dispersing AgentWells Fargo Bank Minnesota, N.A.Shareowner ServicesP.O. Box 64854St. Paul, Minnesota 55164-0854800.468.9716www.wellsfargo.com/shareownerservices
PACCAR’s transfer agent maintains the company’s shareholder records, issues stock certificates and distributes dividends and IRS Form 1099. Requests concerning these matters should be directed to Wells Fargo.
Online Delivery of Annual Report and Proxy StatementPACCAR’s 2008 Annual Report and the 2009 Proxy Statement are available on PACCAR’s Web site at www.paccar.com/2008annualmeeting/
Stockholders who hold PACCAR stock in street name may inquire of their bank or broker about the availability of electronic delivery of annual meeting documents.
Financial Highlights
Message to Shareholders
6 PACCAR Operations
Financial Charts
3 Stockholder Return Performance Graph
4 Management’s Discussion and Analysis
3 Consolidated Statements of Income
3 Consolidated Balance Sheets
34 Consolidated Statements of Cash Flows
35 Consolidated Statements
of Stockholders’ Equity
36 Consolidated Statements
of Comprehensive Income
36 Notes to Consolidated Financial Statements
50 Management’s Report on Internal Control
Over Financial Reporting
50 Report of Independent Registered Public
Accounting Firm on the Company’s
Consolidated Financial Statements
5 Report of Independent Registered Public
Accounting Firm on the Company’s
Internal Controls
5 Selected Financial Data
5 Common Stock Market Prices and Dividends
53 Quarterly Results
54 Market Risks and Derivative Instruments
55 Officers and Directors
56 Divisions and Subsidiaries
CONTENTS
PACCAR is a global technology company that manufactures Class 8 commercial
vehicles sold around the world under the Kenworth, Peterbilt and DAF nameplates.
The company competes in the North American Class 5-7 market with its medium-
duty models assembled in North America and sold under the Peterbilt and Kenworth
nameplates. The company also manufactures Class 4-7 trucks in the United
Kingdom for sale throughout Europe, the Middle East, Australia and Africa under
the DAF nameplate. PACCAR distributes aftermarket truck parts to its dealers
through a worldwide network of Parts Distribution Centers. Finance and leasing
subsidiaries facilitate the sale of PACCAR products in many countries worldwide.
Significant company assets are employed in financial services activities. PACCAR
manufactures and markets industrial winches under the Braden, Gearmatic and
Carco nameplates. PACCAR maintains exceptionally high standards of quality for
all of its products: they are well engineered, are highly customized for specific
applications and sell in the premium segments of their markets, where they have a
reputation for superior performance and pride of ownership.

2 0 0 8 a n n u a l r e p o r t