Embed Size (px)
Citation preview
PA QUARTERLY WORKSTATSEMPLOYMENT • WAGES • NEW HIRES
PA Quarterly WorkStats highlights and discusses data on jobs, industries, and workforce dynamics for both the state and select substate areas. Information herein is based on the most current quarterly labor market information produced in the commonwealth. Additional details and historical information are available at workstats.dli.pa.gov.
For additional information and resources, please contact:Center for Workforce Information & Analysis (CWIA)
1-877-493-3282 | [email protected] | workstats.dli.pa.gov
3rd Quarter 2017 Big Numbers
271,800 Total New Hires
5,813,000 Statewide Employment
Note: Gray arrows indicate whether there was an increase or decrease from the previous quarter.
JAN FEB MAR
APR MAY JUN
SEPAUGJUL
OCT NOV DEC
2018
Which industry sector had the largest employment growth in PA over the previous year? ----- Page 2
What Pennsylvania industries experienced significant growth over the year? ----- Page 4
Learn more about Beverage and Tobacco Product Manufacturing in Pennsylvania. ----- Page 7
Snapshots of New Hires activity throughout the commonwealth. ----- Pages 8 & 9
What are Hi-Growth and Hi-Decline Industries? ----- Back Page
Sector Highlights: Healthcare and Social Assistance
Beverage and Tobacco Product Manufacturing
QUARTERLY CENSUS OF EMPLOYMENT & WAGESSTATEWIDE INDUSTRY SECTOR DATA
2
2nd QUARTER 2018 EDITION • 3rd QUARTER 2017 (INITIAL) DATA
NAICS Industry Description3rd Quarter 2017 Employment Change
Establishments Employment Avg. Weekly Wage 1 Year Ago 5 Years Ago
Goods-Producing Industries
11 Agriculture, Forestry, Fishing, and Hunting 2,268 26,079 $654 (214) 1,908
21 Mining, Quarrying, and Oil & Gas Extraction 1,286 26,709 $1,548 3,126 (9,276)
23 Construction 29,045 271,426 $1,228 12,008 26,152
31-33 Manufacturing 14,489 564,826 $1,132 4,223 (6,351)
Service-Providing Industries
22 Utilities 1,373 35,138 $1,718 (214) 2,346
42 Wholesale Trade 24,664 220,114 $1,443 (522) (9,038)
44-45 Retail Trade 41,725 626,670 $540 (10,450) (8,794)
48-49 Transportation and Warehousing 11,085 288,903 $915 8,799 39,426
51 Information 4,817 86,924 $1,445 (2,006) (6,963)
52 Finance and Insurance 18,364 261,947 $1,549 4,253 6,059
53 Real Estate and Rental & Leasing 10,423 65,249 $1,033 692 5,223
54 Professional & Technical Services 40,620 357,239 $1,670 2,700 35,334
55 Management of Companies & Enterprises 4,257 136,803 $2,090 1,061 6,709
56 Administration & Waste Services 18,135 320,705 $671 1,432 26,656
61 Educational Services 8,973 440,320 $1,114 4,110 3,924
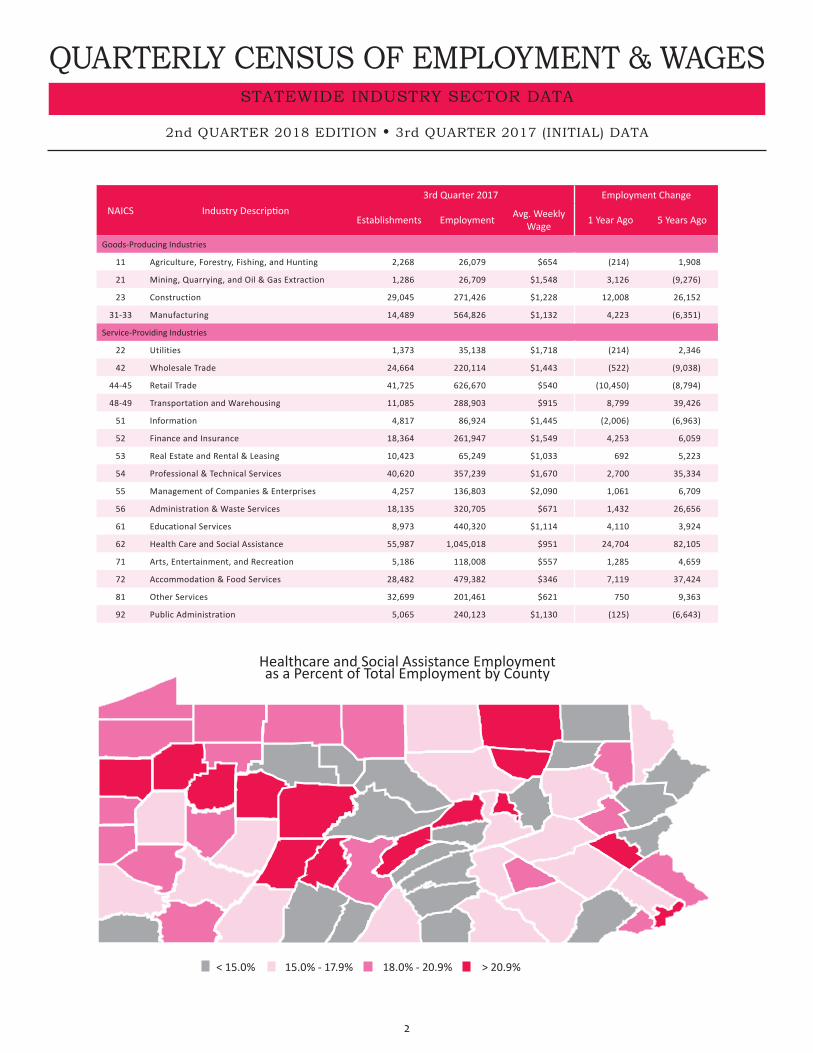
62 Health Care and Social Assistance 55,987 1,045,018 $951 24,704 82,105
71 Arts, Entertainment, and Recreation 5,186 118,008 $557 1,285 4,659
72 Accommodation & Food Services 28,482 479,382 $346 7,119 37,424
81 Other Services 32,699 201,461 $621 750 9,363
92 Public Administration 5,065 240,123 $1,130 (125) (6,643)
< 15.0% 15.0% - 17.9% 18.0% - 20.9% > 20.9%
Healthcare and Social Assistance Employment as a Percent of Total Employment by County

QUARTERLY CENSUS OF EMPLOYMENT & WAGESCOUNTY LEVEL DATA
3
2nd QUARTER 2018 EDITION • 3rd QUARTER 2017 (INITIAL) DATA
County 3Q 2017Employment
Change from 3Q 2016
County 3Q 2017Employment
Change from 3Q 2016
VolumePercent
VolumePercent
Value Rank Value Rank
Adams 35,404 534 1.53% 16 Lackawanna 97,874 515 0.53% 38
Allegheny 697,513 6,394 0.93% 26 Lancaster 238,945 2,919 1.24% 20
Armstrong 16,261 7 0.04% 46 Lawrence 27,999 (214) (0.76%) 59
Beaver 51,754 616 1.20% 21 Lebanon 49,284 340 0.69% 33
Bedford 15,541 140 0.91% 27 Lehigh 189,510 2,423 1.30% 19
Berks 170,678 587 0.35% 44 Luzerne 144,997 1,503 1.05% 23
Blair 58,783 (187) (0.32%) 51 Lycoming 51,170 308 0.61% 35
Bradford 23,141 (57) (0.25%) 50 McKean 15,111 (29) (0.19%) 49
Bucks 263,679 3,523 1.35% 18 Mercer 46,871 (248) (0.53%) 55
Butler 85,447 397 0.47% 42 Mifflin 15,659 141 0.91% 28
Cambria 51,120 (1,094) (2.10%) 65 Monroe 57,021 946 1.69% 12
Cameron 1,939 (9) (0.46%) 54 Montgomery 494,360 8,417 1.73% 11
Carbon 16,423 (443) (2.63%) 67 Montour 15,713 304 1.97% 8
Centre 70,507 1,115 1.61% 14 Northampton 114,143 1,789 1.59% 15
Chester 249,341 1,308 0.53% 39 Northumberland 28,749 154 0.54% 37
Clarion 13,177 (146) (1.10%) 60 Perry 7,702 31 0.40% 43
Clearfield 29,794 298 1.01% 24 Philadelphia 671,463 7,075 1.06% 22
Clinton 12,920 92 0.72% 31 Pike 12,312 213 1.76% 9
Columbia 24,720 (108) (0.43%) 53 Potter 5,363 32 0.60% 36
Crawford 30,250 (666) (2.15%) 66 Schuylkill 49,127 (586) (1.18%) 61
Cumberland 133,317 1,111 0.84% 30 Snyder 16,357 114 0.70% 32
Dauphin 184,386 2,524 1.39% 17 Somerset 23,843 116 0.49% 40
Delaware 221,433 3,826 1.76% 10 Sullivan 1,680 (24) (1.41%) 62
Elk 14,932 6 0.04% 47 Susquehanna 9,283 226 2.50% 5
Erie 122,181 (880) (0.72%) 58 Tioga 12,486 (89) (0.71%) 57
Fayette 39,452 8 0.02% 48 Union 17,979 546 3.13% 2
Forest 2,021 (37) (1.80%) 63 Venango 18,038 (64) (0.35%) 52
Franklin 58,150 574 1.00% 25 Warren 14,347 (81) (0.56%) 56
Fulton 4,953 125 2.59% 4 Washington 87,855 1,905 2.22% 7
Greene 12,756 (259) (1.99%) 64 Wayne 16,002 364 2.33% 6
Huntingdon 12,790 211 1.68% 13 Westmoreland 133,757 631 0.47% 41
Indiana 29,408 200 0.68% 34 Wyoming 9,784 19 0.19% 45
Jefferson 15,635 419 2.75% 3 York 177,586 1,531 0.87% 29
Juniata 6,742 373 5.86% 1

INDUSTRIES OF INTERESTGROWING INDUSTRIES
4
2nd QUARTER 2018 EDITION • 3rd QUARTER 2017 (INITIAL) DATA
INDUSTRY DETAIL HIGHLIGHTSSupport activities for mining had the largest over-the-year percentage increase in employment among the growing IOI, despite sustaining decreases in the number of employers and establishments. Annual employment in this sector peaked in 2014 and then fell through 2016. The large volume increase in 2017 retraces some of the losses in the two prior years. The decrease in employers and establishments is most likely due to the “deaths” of some smaller employers over the year.Among the listed growing IOI, individual and family services had the largest over-the-year employment volume increase, but was in the upper middle of the pack in percentage terms due to also having the largest employment among them. The vast majority (over 85%) of its employment gains were in services for the elderly and persons with disabilities.Overall, there were 28 four-digit growing IOI of which seven were Hi-Growth. Goods-producing industries accounted for almost half of the growing IOI (13), but only two of the Hi-Growth industries, which were both from mining. Five of the growing IOI were from the transportation and warehousing sector and another five were from manufacturing. In addition to the two Hi-Growth IOI from mining, two were from financial activities, two from health care and social assistance and one from the transportation and warehousing sector.A Location Quotient (LQ) of 1.00 implies that the industry’s share of employment in PA’s equals that of the nation. The LQs of the listed growing IOI ranged from a low of 0.45 (activities related to credit intermediation) to a high of 3.20 (sugar and confectionery product manufacturing). Of the 18 industries listed, nine were less concentrated than the U.S. while eight had an LQ ranging from 0.82 to 1.20. Of the seven Hi-Growth IOI, only two (freight transportation arrangement and support activities for mining) were less concentrated than the U.S.An LQ greater than two indicates that PA’s employment percentage in this industry was more than twice that of the nation. Among the 18 industry groups listed as growing IOI, sugar and confectionery product manufacturing, coal mining, and warehousing and storage were the only three with LQs more than 2.00 (3.20, 2.45, and 2.07 respectively).
Industry Code Industry Description
3rd Quarter 2017 Change from 3rd Quarter 2016
Employment Employment Percent Employers Establish-ments
2131 Support activities for mining 12,094 3,149 35.2% -44 -54
2371 Utility system construction 25,937 6,485 33.3% 25 31
4812 Nonscheduled air transportation 1,104 210 23.5% -5 -6
7115 Independent artists, writers, and performers 1,417 266 23.1% 49 49
5223 Activities related to credit intermediation 5,542 491 9.7% 17 28
3121 Beverage manufacturing 10,095 830 9.0% 44 45
2121 Coal mining 5,112 415 8.8% -3 3
6241 Individual and family services 146,689 11,550 8.5% 761 789
3362 Motor vehicle body and trailer manufacturing 6,560 496 8.2% 3 4
6216 Home health care services 61,645 4,513 7.9% 51 65
6116 Other schools and instruction 13,858 937 7.3% 66 71
4931 Warehousing and storage 86,891 5,375 6.6% 5 17
5324 Machinery and equipment rental and leasing 6,746 404 6.4% -1 6
5239 Other financial investment activities 33,570 1,918 6.1% 117 134
4881 Support activities for air transportation 6,188 347 5.9% 1 1
2362 Nonresidential building construction 30,906 1,541 5.2% 52 51
4885 Freight transportation arrangement 5,675 282 5.2% 3 3
3113 Sugar and confectionery product manufacturing 9,820 483 5.2% 1 2
* Industries appearing in bold are considered Hi-Growth, meaning they have had employment gain in at least four consecutive quarters.
Growing Industries of Interest (IOI) are identified by year-over-year employment growth of at least five percent and a net employment gain of at least 25. The top 18 industries with employment growth of at least 200 are displayed below and ranked by percent growth.
Industry Code
3rd Quarter 2017U.S. Employment
U.S. Location Quotient
2131 304,210 0.96
2371 522,083 1.20
4812 43,921 0.57
7115 49,773 0.71
5223 309,265 0.45
3121 262,454 0.96
2121 51,466 2.45
6241 2,559,779 1.41
3362 156,919 1.04
6216 1,412,401 1.06
6116 417,803 0.82
4931 1,026,959 2.07
5324 155,711 1.07
5239 472,880 1.76
4881 257,484 0.59
2362 809,172 0.95
4885 216,742 0.64
3113 75,150 3.20

INDUSTRIES OF INTERESTDECLINING INDUSTRIES
5
2nd QUARTER 2018 EDITION • 3rd QUARTER 2017 (INITIAL) DATA
INDUSTRY DETAIL HIGHLIGHTSPennsylvania’s overall economy continues to grow, even as some sectors struggle. In a dynamic economy, there will usually be some industries that grow (even when the overall economy is shrinking), while others decline (even when the overall economy is growing). The manufacturing sector, which has been struggling, had five industry groups that were growing IOI, but was more represented in the declining IOI. However, the relatively small number of declining IOI is a sign that the economy continues to improve. There were only 18 industry groups that satisfied the criteria for declining IOI, of which six were classified as Hi-Decline industries. The declining IOI were strongly concentrated in goods-producing industries (12 out of 18). Manufacturing alone accounted for 10 declining IOI and four of the Hi-Decline industries. In addition to the previously mentioned weakness within the manufacturing sector, the information sector also exhibited continuing weakness. Three industry groups in that sector were declining IOI and two of them were Hi-Decline IOI. The three largest volume decreases in employment were in professional and similar organizations; newspaper, book, and directory publishers; and sporting goods and musical instrument stores. However, because these industries had the three largest employment complements among the declining IOI, their percentage declines did not rank as high. The LQs of the listed declining industries were more varied than those of the growing industries, ranging from a low of 0.33 (oilseed and grain farming) to 5.63 (railroad rolling stock manufacturing). The top five LQs among the 18 declining industries were the only ones greater than one, and only two of them exceeded 1.14. Both of those were Hi-Decline industries. The economic consequences of concentration in declining industries is likely to be felt more acutely at a sub-state level, rather than at the state level, particularly when it is sustained over a longer period.
Industry Code Industry Description
3rd Quarter 2017 Change from 3rd Quarter 2016
Employment Employment Percent Employers Establish-ments
3151 Apparel knitting mills 188 -30 -13.8% -1 -1
2379 Other heavy construction 2,551 -404 -13.7% 5 4
5121 Motion picture and video industries 6,976 -979 -12.3% 9 10
3122 Tobacco manufacturing 532 -68 -11.3% -1 -1
3346 Magnetic media manufacturing and reproducing 1,000 -107 -9.7% 0 0
3351 Electric lighting equipment manufacturing 1,784 -190 -9.6% -1 -1
3336 Turbine and power transmission equipment mfg. 2,431 -257 -9.6% -1 -2
3365 Railroad rolling stock manufacturing 4,869 -498 -9.3% 1 3
3159 Accessories and other apparel manufacturing 500 -50 -9.1% -2 -2
8139 Professional and similar organizations 17,506 -1,724 -9.0% -5 -5
5111 Newspaper, book, and directory publishers 15,676 -1,402 -8.2% 19 15
3221 Pulp, paper, and paperboard mills 2,995 -260 -8.0% 0 4
4511 Sporting goods and musical instrument stores 18,447 -1,265 -6.4% -16 -41
5179 Other telecommunications 1,250 -79 -5.9% -4 -3
1111 Oilseed and grain farming 763 -43 -5.3% 7 7
3363 Motor vehicle parts manufacturing 8,097 -452 -5.3% 1 8
5322 Consumer goods rental 5,187 -283 -5.2% -7 -60
3152 Cut and sew apparel manufacturing 3,226 -171 -5.0% 1 0
* Industries appearing in bold are considered Hi-Decline, meaning they have had employment loss in at least four consecutive quarters.
Declining IOI are identified by year-over-year employment decline of at least five percent and a net employment loss of at least 25. The bottom 18 industries with employment decline of at least 30 are displayed below and ranked by percent decline.
Industry Code
3rd Quarter 2017U.S. Employment
U.S. Location Quotient
3151 11,189 0.42
2379 113,912 0.56
5121 413,634 0.46
3122 11,869 1.13
3346 14,371 1.75
3351 48,144 0.93
3336 96,919 0.63
3365 21,652 5.63
3159 12,314 1.00
8139 438,334 1.03
5111 344,652 1.14
3221 98,535 0.76
4511 500,556 0.92
5179 794,61 0.39
1111 58,551 0.33
3363 584,778 0.34
5322 160,797 0.82

INDUSTRIES OF INTERESTSELECT LOCAL HIGHLIGHTS
6
2nd QUARTER 2018 EDITION • 3rd QUARTER 2018 (INITIAL) DATA
Central WDA
Southwest Corner WDA
Westmoreland-Fayette Counties WDA
Tri-County WDA
North Central WDA
1-year Employment Change
-400 -320 -240 -160 -80 0
Three Rivers WDA
Montgomery County WDA
Philadelphia County WDA
Bucks County WDA
Central WDA
1-year Employment Change
-200 -160 -120 -80 -40 0
Montgomery County WDA
Chester County WDA
Luzerne-Schuylkill Counties WDA
Berks County WDA
Pocono Counties WDA
1-year Employment Change
0 400 800 1200 1600 2000
Philadelphia County WDA
Montgomery County WDA
Bucks County WDA
Delaware County WDA
Chester County WDA
1-year Employment Change
2131 - Support Activities for Mining 3231 - Printing and Related Support Activities
4511 - Sporting Goods and Musical Instrument Stores6216 - Home Health Care Services
Local HIGHlIGHTSThe five Workforce Development Areas (WDAs) with the greatest volume increase of employment in support activities for mining accounted for more than two-thirds of the statewide increase. The volume increase in employment of the Central WDA equaled that of the Southwest Corner WDA, but the Central WDA had the largest percentage increase in employment (72.2 percent) due to its much smaller base employment. Support activities for mining was a Hi-Growth IOI in the top four WDAs depicted above.
Employment in home health care services increased over the year in nine WDAs, and was a Hi-Growth industry in three of them. The three WDAs that were Hi-Growth were also the top three with the greatest volume increase depicted graphically above. The Philadelphia County, Montgomery County, and Bucks County WDAs also were the top three in terms of percentage increases in employment over the year, with the Philadelphia County and Bucks County WDAs increasing by almost 23 percent, while employment increased by less than half that percentage in the Montgomery County WDA.
Printing and related support activities was not considered a declining IOI at the state level because employment in those industries did not decline by five percent statewide. However, it was classified as a declining IOI in the five WDAs depicted above and as a Hi-Decline IOI in the Luzerne-Schuylkill Counties WDA. The Pocono Counties WDA, which had the smallest volume decrease in employment, had the largest percentage decrease (-16.8 percent). Among WDAs with disclosable data, the Three Rivers WDA which had the largest volume decrease in employment in sporting goods and musical instrument stores, also sustained the largest percentage decrease (-12.4 percent). Overall, there were 10 WDAs for which this industry group was a declining IOI. However, in none of them was it a Hi-Decline IOI.
*Due to confidentiality restrictions, data for some WDAs may be suppressed. All data depicted graphically and in the verbiage relating to WDAs refer only to those WDAs with disclosable data. A more comprehensive list of the industries of interest in Pennsylvania is available at www.workstats.dli.pa.gov, Products A to Z, Industries of Interest.
0 120 240 360 480 600

SECTOR OF INTERESTSECTOR HIGHLIGHT
7
2nd QUARTER 2018 EDITION • 3rd QUARTER 2017 (INITIAL) DATA
0 < 0.50 0.50 - 1.00 1.01 - 1.50 > 1.50
National Location Quotient (LQ) in Beverage and Tobacco Product Manufacturing Industries
Top Beverage and Tobacco Product Manufacturing Industriesby County
0 < 1.00 1.00 - 2.00 2.01 - 3.00 > 3.00
National LQ of Beverage and Tobacco Product Manufacturing Industries
BEVERaGE aND ToBacco PRoDUcT MaNUFacTURINGHIGHlIGHTS1
The beverage and tobacco product manufacturing subsector is an element in the manufacturing sector. The industry group, beverage manufacturing, includes three types of establish-ments: (1) those that manufacture nonalcoholic beverages; (2) those that manufacture alcoholic beverages through the fermentation process (including brandy even though it is distilled); and (3) those that produce distilled alcoholic bever-ages. Ice manufacturing, while not a beverage, is included with nonalcoholic beverage manufacturing because it uses the same production process as water purification.
The industry group, tobacco manufacturing, includes two types of establishments: (1) those engaged in redrying and stemming tobacco and, (2) those that manufacture tobacco products, such as cigarettes and cigars. In Pennsylvania, beverage manufacturing is a much more important industry group in terms of employment than tobacco manufacturing. Further, the number of breweries and wineries has been in-creasing within the state.
Despite only 25 of Pennsylvania’s 67 counties having a higher proportion of workers in this subsector than the national average (LQ > 1.0), 44 counties have a higher proportion of workers than the national average in their dominant industry, of which wineries were 25 of them. While LQs of the domi-nant industry tend to be higher than the LQs for the subsec-tor across the counties, there is a strong correlation between them as evidenced by the top and bottom maps.
Wineries (25) and breweries (18) are the two dominant indus-tries in the state within this subsector. Wineries tend to be located along the central and western parts of the Northern Tier, in south central Pennsylvania and along the western part of the Southern Tier. Breweries tend to be located in the south western, south eastern and northeastern to central parts of the state. Bottled water manufacturing was the dominant in-dustry in eight counties, four of which were in the central part of the state. There were only two counties where the dominant industry in this subsector was tobacco manufacturing, one with ice manufacturing, and no county whose dominant indus-try was distilleries. There are eight counties for which there is no employment for this subsector.
__________1This analysis is based on Quarterly Census of Employment & Wages (QCEW) data which only include establishments and employment covered under Unemployment Compensation (UC) tax law. Therefore, the data may not be representative of industries where many business entities are sole propri-etorships or are otherwise exempt from UC tax.
Ice Manufacturing
Wineries
No NAICS 312 Employment
Bottled Water Manufacturing
Soft Drink Manufacturing
Tobacco Manufacturing
Breweries

NEW HIRESOVER-THE-YEAR COMPARISON
8
Industry SectorNew Hires Change From 3Q 2016 Change From 3Q 2012
3Q 2017 Percent of Employment Volume Percent Volume Percent
Total New Hires 271,770 4.7% 5,900 2.2% 52,950 24.2%
Goods-Producing Industries
Agriculture, Forestry, Fishing, and Hunting 2,520 9.6% (40) (1.5%) (70) (2.5%)
Mining, Quarrying, and Oil & Gas Extraction 1,070 4.0% 400 59.4% (30) (2.8%)
Construction 19,480 7.2% 1,620 9.1% 2,680 16.0%
Manufacturing 20,120 3.6% 2,040 11.3% 2,990 17.5%
Service-Providing Industries
Wholesale Trade 8,710 4.0% 370 4.4% 1,150 15.3%
Retail Trade 16,480 2.6% 1,370 9.1% 3,140 23.6%
Transportation and Warehousing 7,690 2.7% 1,100 16.7% 1,820 31.0%
Utilities 220 0.6% 50 26.1% (370) (62.6%)
Information 2,990 3.4% 540 22.1% 950 46.7%
Finance and Insurance 4,390 1.7% (2,670) (37.8%) 740 20.4%
Real Estate and Rental & Leasing 2,560 3.9% 140 5.7% 420 19.7%
Professional & Technical Services 14,290 4.0% 70 0.5% (1,600) (10.1%)
Management of Companies & Enterprises 4,110 3.0% (670) (14.1%) 2,050 99.5%
Administrative & Waste Services 35,320 11.0% (5,090) (12.6%) 8,670 32.5%
Educational Services 24,780 5.6% (650) (2.6%) 6,680 36.9%
Health Care and Social Assistance 40,850 3.9% 5,620 15.9% 10,000 32.4%
Arts, Entertainment, and Recreation 11,220 9.5% 760 7.2% 2,070 22.6%
Accommodation & Food Services 43,110 9.0% 2,240 5.5% 9,910 29.9%
Other Services 9,340 4.6% (1,210) (11.5%) 1,180 14.5%
Public Administration 2,530 1.1% (80) (3.2%) 560 28.3%
* Establishment level data which includes only New Hires matched to wages. Unclassified data distributed among industry sectors. All data rounded.
2nd QUARTER 2018 EDITION • 3rd QUARTER 2017 (INITIAL) DATA
Change from one year ago:
Statewide: Thirteen industry sectors experienced growth in new hires and seven experienced declines. The three sectors experiencing the greatest growth were health care and social assistance; accommodation & food services; and manufacturing. The three sectors experiencing the greatest declines were other services; finance and insurance; and administrative & waste services.
Western Map Area: Five WDAs experienced growth in new hires and one experienced a decline. Thirteen industry sectors experienced growth in new hires and seven experienced declines. The three sectors experiencing the greatest growth were manufacturing; construction; and mining, quarrying, and oil & gas extraction. The three sectors experiencing the greatest declines were accommodation & food services; health care and social assistance; and finance and insurance.
Central Map Area: Four WDAs experienced growth in new hires and one experienced a decline. Eight industry sectors experienced growth in new hires and 12 experienced declines. The three sectors experiencing the greatest growth were administrative & waste services; transportation and warehousing; and retail trade. The three sectors experiencing the greatest declines were health care and social assistance; professional & technical services; and other services.
Eastern Map Area: Nine WDAs experienced growth in new hires and two experienced declines. Twelve industry sectors experienced growth in new hires and eight experienced declines. The three sectors experiencing the greatest growth were health care and social assistance; accommodation & food services; and manufacturing. The three sectors experiencing the greatest declines were educational services; finance and insurance; and administrative & waste services.
NEW HIRESFIVE-YEAR COMPARISON
9
2nd QUARTER 2018 EDITION • 3rd QUARTER 2017 (INITIAL) DATA
Western WDAs:New Hires Change 3Q 2016 Change 3Q 2012
3Q 2017 Percent of Emp.
Volume Percent Volume Percent
Northwest 7,260 3.6% (650) (8.2%) (760) (9.5%)
Southwest Corner 8,170 5.2% 780 10.6% 1,100 15.6%
Three Rivers 34,940 4.8% 810 2.4% 3,120 9.8%
Tri-County 6,150 4.6% 1,180 23.7% 560 10.1%
West Central 3,760 4.9% 100 2.6% 860 29.6%
Westmoreland-Fayette Counties 6,930 3.9% 340 5.2% 960 16.1%
Central WDAs:New Hires Change 3Q 2016 Change 3Q 2012
3Q 2017 Percent of Emp.
Volume Percent Volume Percent
Central 9,000 3.5% 70 0.8% 1,200 15.3%
North Central 2,700 3.2% 70 2.8% 340 14.4%
Northern Tier 2,390 4.2% 70 3.0% 110 4.6%
South Central 24,300 3.6% (390) (1.6%) 3,260 15.5%
Southern Alleghenies 5,480 3.2% 420 8.2% 370 7.2%
Eastern WDAs:New Hires Change 3Q 2016 Change 3Q 2012
3Q 2017 Percent of Emp.
Volume Percent Volume Percent
Berks County 16,160 9.2% 580 3.7% 9,280 134.9%
Bucks County 15,570 5.7% 1,670 12.0% 5,520 54.9%
Chester County 11,840 4.6% 50 0.4% 2,450 26.1%
Delaware County 12,500 5.5% 290 2.4% 2,680 27.4%
Lackawanna County 3,990 4.0% 200 5.2% 580 17.0%
Lancaster County 10,410 4.2% (2,940) (22.0%) 2,970 40.0%
Lehigh Valley 16,100 5.2% 940 6.2% 3,710 29.9%
Luzerne-Schuylkill Counties 7,880 4.0% (400) (4.8%) 1,920 32.2%
Montgomery County 23,560 4.6% 680 3.0% 4,550 24.0%
Philadelphia County 36,200 5.3% 1,400 4.0% 6,210 20.7%
Pocono Counties 6,480 6.3% 640 10.9% 1,960 43.2%
*Establishment Level Data which includes only New Hires matched to wages. Unclassified data distributed among industry sectors. All data rounded.
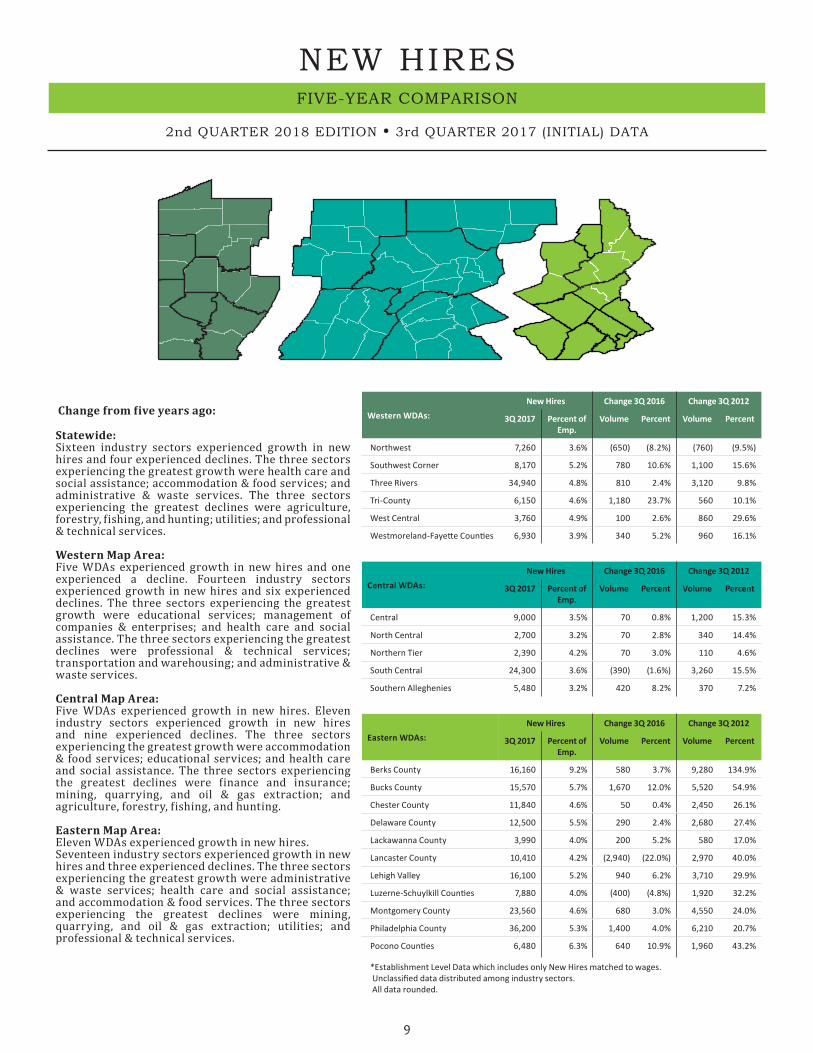
Change from five years ago:
Statewide:Sixteen industry sectors experienced growth in new hires and four experienced declines. The three sectors experiencing the greatest growth were health care and social assistance; accommodation & food services; and administrative & waste services. The three sectors experiencing the greatest declines were agriculture, forestry, fishing, and hunting; utilities; and professional & technical services. Western Map Area:Five WDAs experienced growth in new hires and one experienced a decline. Fourteen industry sectors experienced growth in new hires and six experienced declines. The three sectors experiencing the greatest growth were educational services; management of companies & enterprises; and health care and social assistance. The three sectors experiencing the greatest declines were professional & technical services; transportation and warehousing; and administrative & waste services. Central Map Area:Five WDAs experienced growth in new hires. Eleven industry sectors experienced growth in new hires and nine experienced declines. The three sectors experiencing the greatest growth were accommodation & food services; educational services; and health care and social assistance. The three sectors experiencing the greatest declines were finance and insurance; mining, quarrying, and oil & gas extraction; and agriculture, forestry, fishing, and hunting.
Eastern Map Area: Eleven WDAs experienced growth in new hires. Seventeen industry sectors experienced growth in new hires and three experienced declines. The three sectors experiencing the greatest growth were administrative & waste services; health care and social assistance; and accommodation & food services. The three sectors experiencing the greatest declines were mining, quarrying, and oil & gas extraction; utilities; and professional & technical services.

BEHIND THE DATADEFINITIONS • SOURCES • WEB RESOURCES
CWIA-18 04-18
Auxiliary aids and services are available upon request to individuals with disabilities.Equal Opportunity Employer/Program
For additional information and resources, please contact:Center for Workforce Information & Analysis (CWIA)
1-877-493-3282 | [email protected] | workstats.dli.pa.gov
QUARTERLY CENSUS OF EMPLOYMENT & WAGES
The Quarterly Census of Employment and Wages (QCEW ) Program produces a comprehensive tabulation of employment and wage information for workers covered by Pennsylvania’s Unemployment Compensation (UC) law and Federal workers covered by the Unemployment Compensation for Federal Employees (UCFE) program. Data are reported by establishment, where possible, and classif ied by industry under the North American Industry Classif ication System (NAICS) and by county. An employer establishment represents a single economic unit such as a mine, factory or store engaged in one, or predominantly one activity. An employer represents a business entity and may consist of one or more establishments.
Employment data under the QCEW program represent the number of covered workers who worked during, or received pay for, the pay period including the 12th of the month. Excluded are members of the armed forces, the self-employed, proprietors, domestic workers, unpaid family workers, and railroad workers. Wages represent total compensation paid during the calendar quarter, regardless of when services were performed. Included in wages are pay for vacation and other paid leave, bonuses, stock options, t ips, the cash value of meals and lodging. The QCEW program does provide partial information on agricultural industries and employees in private households. Average Weekly Wages (reported quarterly) are derived by dividing total wages reported by average employment and then dividing the quotient by 13 weeks per quarter.
NEW HIRES
New Hires by industry data represent labor churn (growth or decline), based on information submitted by employers (since January 1, 1998) to the Pennsylvania New Hire Reporting Program. Intended to locate non-custodial parents who owe court-ordered child support, the data (when aggregated by industry) may also be used to show where and in what economic sectors of the economy growth or decline is occurring over time. Labor churn may be defined as the net monthly employment change resulting from both job creation (as indicated through hiring), and job destruction (as indicated through separations, in the form of layoffs or quits). Note that the new hire information contained herein represent mainly Pennsylvania-based employment, are not disclosable at the microdata level of individual employers or new hire employees, and represent trends in hiring by industry, not counts of new jobs.
LOCATION QUOTIENT
The Location Quotient (LQ) is a ratio of the employment share of an industry in a particular area to the employment share in a reference area (herein, the United States, unless otherwise indicated), both calculated from QCEW data. The LQ allows for comparison of how concentrated an industry’s employment in an area is to that of the country overall and by extension, to other areas. If an LQ is equal to one, then the industry has the same share of its local area employment as it does in the reference area; an LQ greater than one indicates an industry with a greater share of the local area employment (more concentrated) than is the case in the reference area; and an LQ less than one indicates a local industry with a lesser share (less concentrated) than that of the reference area. Under certain conditions including a strong correlation of industry outputs to employment, values of LQ may give an indication of which industries are importing that good or service (less than one) or exporting (greater than one) it .
INDUSTRIES OF INTEREST
Industries which, at the state level, experience at least f ive percent year-over-year employment growth/decline accompanied by an employment growth/decline of at least 25 are considered growing/declining Industries of Interest (IOI). When in addition, the industry experiences four consecutive quarters of employment growth or decline, it is termed a Hi-Growth or Hi-Decline industry. Non-economic coding changes could lead to falsely identifying an industry as an IOI when it isn’t , or not identifying it as one when in fact it is. Therefore, the employment changes used to identify IOI are calculated from QCEW data after adjusting for non-economic coding changes. Data on non-economic coding changes does not exist on the national level. Therefore, all comparisons of Pennsylvania industries to their national counterparts e.g. Sector Highlight, must use unadjusted QCEW data. Thus, the IOI are an adjusted QCEW dataset .