Embed Size (px)
Citation preview
PA RESOURCES
Annual Report 2015
PA RESOURCES ANNUAL REPORT 2015 2
CONTENT BOARD OF DIRECTORS´ REPORT 2015 3
Company development 3
The group´s business activities 3
Key events by region 5
Financial summary 6
Risks and uncertainties 9
Subsequent events 11
Board of Directors 12
Proposed distribution of earnings 12
FINANCIAL REPORTS 13
Group
5 year summary 13
Key ratio definition 13
Income statement 14
Statement of comprehensive income 14
Statement of financial position (Non-going concern) 15
Statement of financial position (Going concern) 16
Statement of changes in equity 17
Statement of cash flow statement 18
Parent company
Income statement 19
Statement of comprehensive income 19
Statement of financial position (Non-going concern) 20
Statement of financial position (Going concern) 21
Statement of changes in equity 22
Statement of cash flow statement 23
Group and Parent company
Notes 24
BOARD ASSURANCE 62
AUDITOR´S REPORT 63

PA RESOURCES ANNUAL REPORT 2015 3
BOARD OF DIRECTORS` REPORT 2015 PA Resources AB (publ), corporate identity number 556488-2180
COMPANY DEVELOPMENT
Following the failure of the Azurite field in the Republic of Congo to deliver the expected production
levels during 2011-2013 PA Resources has been burdened with an unsustainably high level of debt.
Subsequent capital raises and refinancing have been aimed towards reducing the debt burden and
supplying the necessary capital for the company to invest in its development portfolio for future
production and cash flows. In 2013 and 2014 the company entered into farm-out agreements for its
key development assets in order to raise cash and reduce its investment needs. The drop in oil price,
which commenced during the summer of 2014, together with Enquest’s reversal of the Tunisia farm-
out in January 2015 resulted in a situation where the company was unable to service its debts.
Between October 2014 and March 2015 PA Resources negotiated a potential refinancing plan
together with its major creditors and shareholders. Following lack of progress in the discussions the
company filed for corporate reorganisation on the 26 March 2015. The reorganisation process is
described in more detail below. In parallel with the reorganisation process the board of directors
initiated a strategic review process which was completed in November 2015 also described in more
detail below. Following the corporate reorganisation and the strategic review the company still
stands without long-term financing and has decided to sell its assets. As a result the board of
directors has concluded that the company’s financial statements can no longer be prepared under
the assumption of a going concern.
THE GROUP’S BUSINESS ACTIVITIES
Production and Sales
During the year, oil was produced from five fields of which three were located in Tunisia – where the
Didon field is the largest – and the Aseng and Diega fields in Equatorial Guinea. The fields in
Equatorial Guinea contributed to the production during the first quarter after which the ownership
was transferred to Gunvor and deconsolidated from PA Resources (see Enforcement of RBL-security).
Total production of oil amounted to 613,300 barrels (1,147,000) which is an average of 1,700 barrels
per day on a working interest basis (3,100). In total 640,500 barrels of oil (964,400) was sold during
2015 to an average price of USD 53 per barrel (96).
Loss of control subsidiary
On 7 April 2015 Gunvor exercised its security under the terms of the RBL-loan to take over the shares
in Osborne Resources Ltd. Osborne Resources Ltd held PA Resources interest in Block I in Equatorial
Guinea including the producing fields Aseng and Alen. Following the transaction PA Resources no
longer has any interests in Equatorial Guinea. The transaction resulted in a net capital gain of SEK 285
million. On the same day as Gunvor exercised its security, Gunvor also petitioned for bankruptcy in
PA Resources AB. Gunvor recalled the petition on 15 April 2015.
Employees
The average number of employees was 107 (121), of these 90 (99) were men and 17 (22) were
women. See more in Note 10, Employees, salaries and other remuneration.
Remuneration to group management
Remuneration of the CEO and other group management is comprised of fixed salary, variable
remuneration, other benefits and pensions as detailed in Note 11, Remuneration and other benefits;
PA RESOURCES ANNUAL REPORT 2015 4
Board of Directors and Group Management of the Parent Company. The guidelines for remuneration
of management were adopted by the 2015 Annual General Meeting.
Disputes
At the time of the annual report there are no material disputes between PA Resources and other
parties.
Delistings
PA Resources AB’s share has been listed on the Nasdaq Stockholm exchange since 2006. As part of
the agreements with the major creditors signed under the corporate reorganisation the company
agreed to seek a delisting when appropriate. On the 23 November 2015 the application for delisting
was filed and the last day for trading was 15 January 2016. As an event after the closing date PA
Resources delisted its SEK denominated bond also listed in the Nasdaq Stockholm exchange. Last day
of trading was 1 February 2016 and application to delist was submitted 25 January 2016. For more
information see Note 28, Significant events after the closing date.
Corporate Reorganisation
The 26 March 2015 PA Resources AB filed for corporate reorganisation at the Stockholm District
Court in accordance with the company reorganisation act (1996:764). The application was approved
the 27 march 2015. Lars Söderqvist, lawyer at Hökerberg & Söderqvist KB was appointed as
administrator of the reorganisation by the court. On 15 April 2015 a creditors meeting was held
following which the court allowed the reorganisation to continue until 29 June 2015. On 25 June
2015 PA Resources AB filed a petition to extend the corporate reorganisation. On 9 July the
Stockholm District approved the petition extending the corporate reorganisation by a further three
months until 28 September 2015. On 9 September 2015 PA Resources published the reorganisation
plan prepared by the company and the administrator. At the same time a request for composition
proceedings was handed in to the Stockholm District Court which subsequently set the date to the 2
October 2015. On the 29 September 2015 the holders of both the SEK- and NOK-denominated bonds
voted to adopt the proposed composition plan subject to subsequent approval by the court. On 2
October 2015 a qualified majority of creditors voted for the proposed composition plan which was
also adopted by the court. PA Resources also submitted a request for termination of the
reorganisation which was approved and as the composition became final and binding on the 24
October 2015 the corporate reorganisation was terminated.
The composition plan, approved by the creditors and adopted by the Stockholm District Court, split
the creditors into three groups. The first group are the individual creditors with claims below SEK
100,000 which are to receive full payment of their claims by the 26 March 2016. The second group;
creditors with claims exceeding SEK 100,000 and without agreements with the company, are entitled
to repayment of SEK 100,000 and 25% of their claim exceeding SEK 100,000 by the 26 March 2016.
The total amount due to these two groups of creditors amounts to approximately SEK 3 million. The
third group consists of a number of major creditors including the bondholders, Gunvor Group and
Murphy Oil Corporation. These creditors have, through bilateral agreements with the company,
agreed to receive repayment of their claims over a longer period of time from the company’s
available cash flow as defined by the composition plan. Any outstanding claims on the company still
not repaid by the 27 December 2017 and exceeding the book value of the company’s assets at that
time, will be converted to equity through an offset issue. The creditors with outstanding claims at
this time will, irrespective of the value of the claims, receive 95% of the company’s share capital after
the conversion.

PA RESOURCES ANNUAL REPORT 2015 5
Strategic Review Process
During the second quarter the board of directors initiated a review process to explore the company’s
strategic options going forward. The process included evaluating three main options, securing long
term funding of the group, exploring the possibility of a corporate transaction/M&A and as a third
option the divestment of business areas or individual assets. The review process was managed by an
internal project office which prepared the necessary marketing documents and materials. The review
was finalised in November 2015 concluding that a sale of the company’s assets was the only viable
alternative and the board instructed the management to proceed with a sale. See more under
Subsequent events.
Financial statements prepared as a non-going concern
The company has since the middle of 2014 been working to secure long-term financing for the
company’s operations and development projects. Following the corporate reorganisation and the
strategic review the company still stands without long-term financing and has decided to sell its
assets. As a result the board of directors has concluded that the company’s financial statements can
no longer be prepared under the assumption of a going concern. The consequences of the changes in
accounting principles are outlined in Note 2, Accounting principles etc.
KEY EVENTS BY REGION
West Africa
Block I, including PA Resources interest in the Aseng and Alen producing fields as well as the Diega
discovery, in Equatorial Guinea was deconsolidated as per 31 March 2015 following Gunvor Group’s
decision to enforce its security under the terms of the Reserve Based Lending (RBL) facility.
Preparations were made for the drilling of the Baobab Marine-1 exploration well on the Mer
Profonde Sud licence in the Republic of Congo (Brazzaville). Drilling took place during the first quarter
of 2016.
North Africa
A cost cutting program was implemented on the Didon field reducing operating expenditure by over
20% compared to 2014.
A revised development plan for the Zarat field was submitted to La Direction de L’Energie (DGE) on
24 July 2015. The Development plan was the result of two years of work conducted by a joint PA
Resources and L’Enterprise Tunisienne d’Activites Petrolieres (ETAP) team.
The infrastructure upgrade program on the DST fields continued and included a well work over on
the Douleb field, the conversion of a producer to an injector well.
Force Majeur was declared on the Makhtar and Jelma exploration licenses in July 2015 as a result of
the adjacent mountain areas being declared a military zone.
The North Sea
On the 12/06 license in Denmark the drilling of the Lille John-2 appraisal well was completed with oil
encountered in the Miocene sandstone reservoir as expected. A drill stem test flowed at rates of up
to 1,400 barrels per day of 35○ API oil. The results of the well were evaluated and incorporated in an
updated development concept including both the Lille John and Border Tuck discoveries under the
name “Robin Hood”. The license partnership is targeting a 2016 declaration of commerciality in line
with license requirements.

PA RESOURCES ANNUAL REPORT 2015 6
FINANCIAL SUMMARY
One-off items
There have been a number of significant transactions affecting PA Resources in 2015, thus the 2015
year-end report include several non-recurring and non-cash, one-off items. These items are
described below and in Note 4, Segment information.
Jan-Dec
SEK 000,000s 2015 Accounted for in Income Statement
Profit for the period 779
Whereof one-off items
Final computation terminated farm out agreement 124 Other income
Reversed provisions 89 Other income
Enforcement of the RBL security 285 Capital gain
Market valuation E&E and O&G assets -1,969 Impairment losses
Exchange losses (net) -21 Other financial items (negative)
Expensed interest-bearing debt -42 Other financial items (negative)
Recognised fair value in connection with the composition plan 2,061 Other financial items (positive)
Revaluation tax provision 38 Income tax
Reversed deferred taxes in connection with market valuation of E&E and O&G assets
444 Income tax
Profit for the period excluding one-off items -230
Revenue and gross profit
Revenue amounted to SEK 242 million (603) and decreased as result of the deconsolidation of Aseng
and Alen, and lower sales price compared with the corresponding period a year ago. Revenue was
positively impacted by currency effects from the strengthened USD. Production costs including direct
production taxes of SEK -6 million (-10) amounted to SEK -184 million (-187) and decreased mainly as
a result of the RBL enforcement counteracted by the terminated farm-out agreement. Depletion of
oil and gas assets amounted to SEK -40 million (-195) and decreased mainly as a result of the book
values relating to the Didon field being impaired in the fourth quarter 2014 and of the RBL
enforcement. Gross profit amounted to SEK 17 million (222).
EBITDA and operating profit
EBITDA amounted to SEK 425 million (-481) and the EBITDA margin was 176 (-80) percent. EBITDA
was positively impacted by other income of SEK 222 million (46) mainly effects from provisions and
final computation of the impact of the terminated farm-out agreement. EBITDA was also positively
impacted by a capital gain of SEK 285 million (0) from enforcement of the RBL security by Gunvor
Group. Impairment losses amounted to SEK -1,969 million (-1,991) and is a result from assessed
market valuation of PA Resources exploration and evaluation assets and its oil and gas properties
including abandonment costs. For more information, see note 14, Exploration and evaluation assets
and Oil and gas properties. Operating profit amounted to SEK -1,590 million (-2,667).
PA RESOURCES ANNUAL REPORT 2015 7
Net financial items, tax and profit for the period
Net financial items for the Group amounted to SEK 1,864 million (-365) for the period. Interest
expense was SEK -102 million (-256). Other financial expenses amounted to SEK -74 million (-25) and
was negatively affected by expensed interest-bearing debt of SEK -42 million (0). Currency effects on
net financial items amounted to SEK -21 million (-87). Other financial income amounted to SEK 2,061
million (0) and is entirely attributable to the recognised fair value of interest-bearing loans and
borrowings and other liabilities in connection with the composition plan. Adjusted for currency
effects and other financial income, net financial items amounted to SEK -175 million (-278). Reported
tax amounted to SEK 504 million (74) and paid tax amounted to SEK -18 million (-165). Reported tax
including a reversal of deferred tax liabilities amounted to SEK 444 million in connection with market
valuation of Exploration and evaluation assets as well as Oil and gas assets. 2014 included SEK 137
million from reversal of deferred taxes with respect to impaired fixed assets. Profit for the period
amounted to SEK 779 million (-2,957).
Enforcement of RBL security
As per 7 April Gunvor Group, PA Resources´ largest creditor and shareholder demanded repayment
of amounts due under the RBL facility. PA Resources also received notice that Gunvor Group had
taken action to enforce its security under the RBL, shares in its wholly-owned subsidiary, Osborne
Resources Ltd. Osborne owns interests in Equatorial Guinea, the producing Aseng and Alen fields,
and the Block I exploration interest. The effect of this enforcement action is that Osborne is no
longer a subsidiary of PA Resources and has become a subsidiary of Gunvor Group.
As a result of the enforcement Osborne´s balance sheet was deconsolidated as per 31 March 2015.
Group´s profit and loss on a row by row basis includes revenue and expenses from Osborne for
January to March. Further to the enforcement the RBL facility including accrued interest is to be
considered repaid in full and the transaction resulted in a net capital gain of SEK 285 million.
Cash Flow and investments
The Group’s operating cash flow for the period was SEK -86 million (-108). Cash flow from investing
activities for the period amounted to SEK -40 million (-101). Cash flow from financing activities
amounted to SEK 41 million (-55).
Financial Position
As per 31 December 2015 the book value of the Group’s net borrowings was SEK 32 million,
compared to SEK 2,468 million at year-end 2014. Net borrowings decreased mainly as a result of the
recognised fair value of the interest-bearing debt followed the agreed composition plan in the third
quarter. For more information, see note 19, Interest-bearing loans and borrowings. The decrease is
also a result of the enforced RBL security. The facility, including accrued interest, of approximately
SEK 762 (USD 88.4 million) was considered repaid in the first quarter 2015. PA Resources
shareholder´s equity amounted to SEK -12 million compared to SEK -810 million at year-end 2014 and
increased mainly from the recognised fair value of the existing interest-bearing debt followed the
agreed composition plan, negatively counteracted by asset market valuation. Equity also increased
from the capital gain as a result of the enforced RBL security. Cash and cash equivalents amounted to
SEK 67 million compared with SEK 148 million at year-end 2014.
PA RESOURCES ANNUAL REPORT 2015 8
Financing
PA Resources reached during the second quarter an agreement with its major creditors to provide
the company with funding. The funding which PA Resources secured during the reorganization
enables the Group to borrow money through the issue of Reorganisation Notes with a principal
amount up to 15 MUSD in aggregate. The reorganization Notes have a subscription price of 50% of
their face value, which means that the maximum amount of funds that can be received is 7,5 MUSD.
For more information, see note 19, Interest-bearing loans and borrowings.
Parent Company
Operating profit amounted to SEK -42 million (-199). Net financial items for the period amounted to
SEK 1,181 million (-2,459), and included a capital gain of SEK 427 million from the enforcement of the
RBL security. Net financial items was negatively affected by a net impairment charge of SEK 955
million (1,125) for receivables from subsidiaries and of SEK 195 million (1,730) for shares in
subsidiaries as a result of a market valuation in PA Resources´ Exploration- and evaluation assets as
well as Oil- and gas assets. The finance net was positively affected by the recognised fair value of
liabilities to an amount of SEK 1,909 million (0). Previous year included SEK 232 million from a
dividend received from affiliates.
Equity amounted to SEK 11 million compared to SEK -1,128 million at year-end 2014 and increased
mainly from the other financial income as a result of the recognised fair value of liabilities and the
gain from the enforced RBL security. The share capital as per 31 December 2015 was distributed
among 113,167,992 shares. In connection with the annual general meetings on 28 July 2015, the
decision was to reduce the share capital to SEK 11,316,799.20 for covering of losses. It was further
decided at the extraordinary general meeting on 27 October 2015, to reduce the share capital to SEK
800,000 for covering of losses. Both reductions were made without redemption of shares. New share
quota value is SEK 800,000 / 113,167,992.
Balance Sheet for Liquidation Purposes
Total shareholders’ equity in the parent company amounted to SEK -1,128 million at year-end 2014,
which was less than one-half of the registered share capital of SEK 1,415 million. As a consequence,
the company’s board of directors resolved to prepare a balance sheet for liquidation purposes. The
balance sheet showed, after adjustments, that shareholders’ equity was still less than one-half of the
registered share capital. At an Extraordinary General Meeting held on 27 February 2015 the
shareholders resolved, as recommended by the board, that PA Resources would not be liquidated,
but carry on its business. The Companies Act stipulates that a new general meeting of shareholders
shall be held within eight months at which the shareholders shall resolve on the issue of liquidation
once again. In conjunction with the new general meeting the board of directors shall prepare a new
balance sheet for liquidation purposes. If this new balance sheet does not show that the company’s
shareholder’s equity has been restored and amounts to at least the registered share capital then the
company is required to go into liquidation. At the Extra General Meeting held on the 27 October
2015, PA Resources´ board of directors presented a new balance sheet for liquidation purposes per
30 September 2015 in which the equity had been restored and as a result the meeting voted to
continue operations.

PA RESOURCES ANNUAL REPORT 2015 9
RISKS AND UNCERTAINTIES
Operational Risks
Varying production levels
PA Resources produces at a limited number of fields. This means that natural decline in production
and production disruptions at individual wells or facilities can have a negative impact on total
production levels and revenue. In conjunction with work on producing oil fields, production levels
may be subject temporarily to negative impact.
Fluctuations in the price of oil and gas
The world market price of oil and gas fluctuates from day to day and is influenced by a wealth of
factors outside of PA Resources’ control, including the global economic trend, government and
central bank measures, geopolitical unrest, weather, availability of oil, investment costs and access to
alternative energy sources. In the long term, demand for oil and gas can also be influenced by the
climate debate and the endeavour to reduce carbon emissions to the atmosphere. Major price
fluctuations are negative since lower revenues and increased uncertainty impact the size of
investments.
PA Resources was impacted by the effect of falling oil prices during 2015 as the Brent benchmark fell
by almost 30% from USD 51.8 per barrel in January to USD 36.5 at the end of December.
Natural disasters
PA Resources’ existing or future production facilities may be impacted by natural disasters. Should
such an event occur, existing oil production may be negatively affected or even cease. Natural
disasters can have a devastating effect on the activities of the company, wiping out large values. In
addition, natural disasters can mean a stop in production with accompanying major costs for
restoring production as well as a period with no or partial sales revenue.
Accidents, damage & delays
The Group may also suffer accidents and damage to facilities, environmental damage or personal
injuries. For example, fires, explosions, blowouts, accidental leaks and shipping accidents can occur.
Delays can arise due to bad weather, poorly performed work by external partners, changes in
government requirements and delayed deliveries of equipment.
Geological risks
All estimations of oil and gas reserves and resources involve a certain degree of uncertainty. The risk
exists that the estimated volumes will not accord with reality. The probability of discoveries of oil or
gas varies. If a well proves to be dry, there will be no return on the investment. Even if an oil
discovery is made, the qualities of the bedrock may prevent production.
Shared Ownership and partnership
PA Resources has shared ownership in several licences in partnership with other companies. In a
partnership, it may be difficult to influence how operations on the licence are conducted, especially
where PA Resources isn’t the operator. If a partner doesn’t meet its obligations, PA Resources may,
among other things, risk losing its rights or income, or be forced to take on obligations or costs to
cover that partner’s obligations.
PA Resources was financially impacted by Enquest’s decision to pull out of the farm-out deal in
Tunisia in January 2015.

PA RESOURCES ANNUAL REPORT 2015 10
Financial Risks
Financing and Liquidity Risks
PA Resources is in need of refinancing for maintenance, development and exploration of the Group’s
licences and discoveries. In addition, the Group needs a liquidity reserve for the management of
current payment obligations in operating activities, planned investments and amortisations.
Refinancing risk is defined as the risk that financing or refinancing is troublesome or costly to secure.
PA Resources’ business activities are capital intensive. Field exploration and development requires
access to financing as a supplement to cash flow from operations. The ability to make investments
may be impaired if the cash flow were to be insufficient or external sources of capital limited. If the
Group is unable to meet its amortisation or interest payments fall due and unable to renegotiate or
refinance the loans there is a risk of a new issue of shares. If a new issue of shares cannot be
performed the company could become subject to a reconstruction process or be placed into
receivership.
PA Resources´ strategy according to completed review process is to sale the company´s assets in
order to repay outstanding debt to its creditors in accordance with agreed composition plan. If the
transactions cannot be completed and thus PA Resources cannot repay debt to its creditors in
accordance with the composition plan there is a risk that the company is placed into receivership. For
more information, see Subsequent events.
Other Financial Risk
Through its operations, PA Resources is exposed to the majority of financial risks, including interest
risk, credit risk and currency risk as well as transaction risk and translation risk. Read more in Note
26, Financial risk.
Political Risks
Political and economic instability and corruption
PA Resources conducts business activities in countries where corruption exists and a substantial level
of risk exists in respect of political instability. The concept, political instability, comprises financial
vulnerability and vulnerability to unrest. Unrest, political and economic instability in society, can
hinder the company from conducting business, cause production interruptions, delays and pose a
threat to safety among other items.
Negative Changes to fiscal terms
PA Resources’ operations are affected by the applicable tax rules of each country in which the Group
operates. Tax often comprises various combinations of royalties, discounts on oil produced, income
tax, investment subsidies, stamp duty and capital gains tax. Oil producing developing countries have
had a tendency to raise these taxes in pace with rises in oil prices, which can negatively impact
earnings and cash flow.

PA RESOURCES ANNUAL REPORT 2015 11
SUBSEQUENT EVENTS
PA Resources delist its share
PA Resources share´s last day of trading at Nasdaq Stockholm was 15 January 2016. The decision
notified by Nasdaq was based on PA Resources application to delist submitted 20 November 2015.
PA Resources delist its SEK denominated bond
PA Resources SEK denominated bond´s last day of trading at Nasdaq Stockholm was 1 February 2016.
The decision notified by Nasdaq was based on PA Resources application to delist submitted 25
January 2016.
Drilling Results on Baobab Marine-1 Well at Mer Profonde Sud
During February 2016 final results came from the Baobab Marine-1 commitment well drilled in the
Mer Profonde Sud Block offshore the Republic of Congo. Although good quality sands were present,
no hydrocarbons were encountered, suggesting lack of communication with the known oil source.
PA Resources divests its North Sea portfolio
As per 5 February 2016 PA Resources signed an agreement with Petrogas E&P regarding the sale of
its affiliates PA Resources UK Ltd and PA Resources Denmark ApS including the Danish license 12/06
which holds the Broder Tuck and Lille John discoveries, as well as its exploration licences in the UK,
Germany and the Netherlands. PA Resources completed the transaction with Petrogas E&P
announced as per 24 March 2016 and payment for the transaction has been received. Included in the
transaction is also a highly uncertain and contingent consideration based on future oil price
development. The consideration is not included in the 2015 valuation of PA Resources' net assets.
PA Resources divests its North Africa portfolio
As per 9 May 2016 PA Resources AB announced that its wholly owned subsidiaries, PA Resources
Tunisia Limited, Hydrocarbures Tunisie Didon Limited, Hydrocarbures Didon Jersey Limited and
Hydrocarbures Tunisie Corporation, executed a sale and purchase agreement with ETAP, The
Tunisian national oil company, to sell their entire licence interests onshore and offshore Tunisia, to
ETAP. The transaction is expected to complete within the next month.
Use of proceeds from divested assets
Followed above divestments PA Resources will have no assets left. The proceeds from the sale will be
used to repay creditors in accordance with the reorganisation plan adopted in October 2015. As per
release date of this annual report category B** has been repaid in full while category A* has agreed
to delay part of payment until completion of the North Africa transaction, but is expected to
ultimately receive full payment. Category C *** are expected to receive a significantly lower
proportion than its nominal values. The liabilities are thus recognised at the values expected to be
paid. Given that the transaction in North Africa completes there will also be sufficient funds to
implement the solvent wind down, which given above is the Board´s intention to suggest for the
shareholders.
* Category A (Reorganisation notes) is described in detail in section 8.4.3.1 and 6.7 of the Reorganisation Plan.
** Category B (Creditors with principal claims below 100 000 SEK as well as above 100 000 SEK without specific agreement) is described in
detail in sections 8.4.3.1, 8.2 and 8.3 of the Reorganisation Plan. Category B does not include bondholders as explained in section 6.4.
*** Category C (Creditors above 100 000 SEK with specific agreements) is described in detail in section 8.4 in the Reorganisation plan.
PA RESOURCES ANNUAL REPORT 2015 12
BOARD OF DIRECTORS
The Board of Directors in PA Resources AB as per signing of the Annual report:
Catharina Nystedt-Ringborg (Director as of 27 October 2015)
Mark McAllister
Paul Waern (Chairman as of 28 July 2015)
The Board of Directors in PA Resources AB during 2015/2016:
Garrett Soden (Director from 27 October 2015 until 2 February 2016)
Jérôme Schurink (Chairman and director until 11 April 2015)
Nils Björkman (Director until 28 July 2015)
Philippe Probst (Director until 28 July 2015)
Philippe R. Ziegler (Director until 28 July 2015)
Tomas Hedström (Director from 28 July until 27 October 2015)
PROPOSED DISTRIBUTION OF EARNINGS
The Board of Directors proposes that the Non-restricted equity of the Parent company of SEK
9,987,000 including the Profit for the year of SEK 1,139,271,000 to be carried forward.
PA RESOURCES ANNUAL REPORT 2015 13
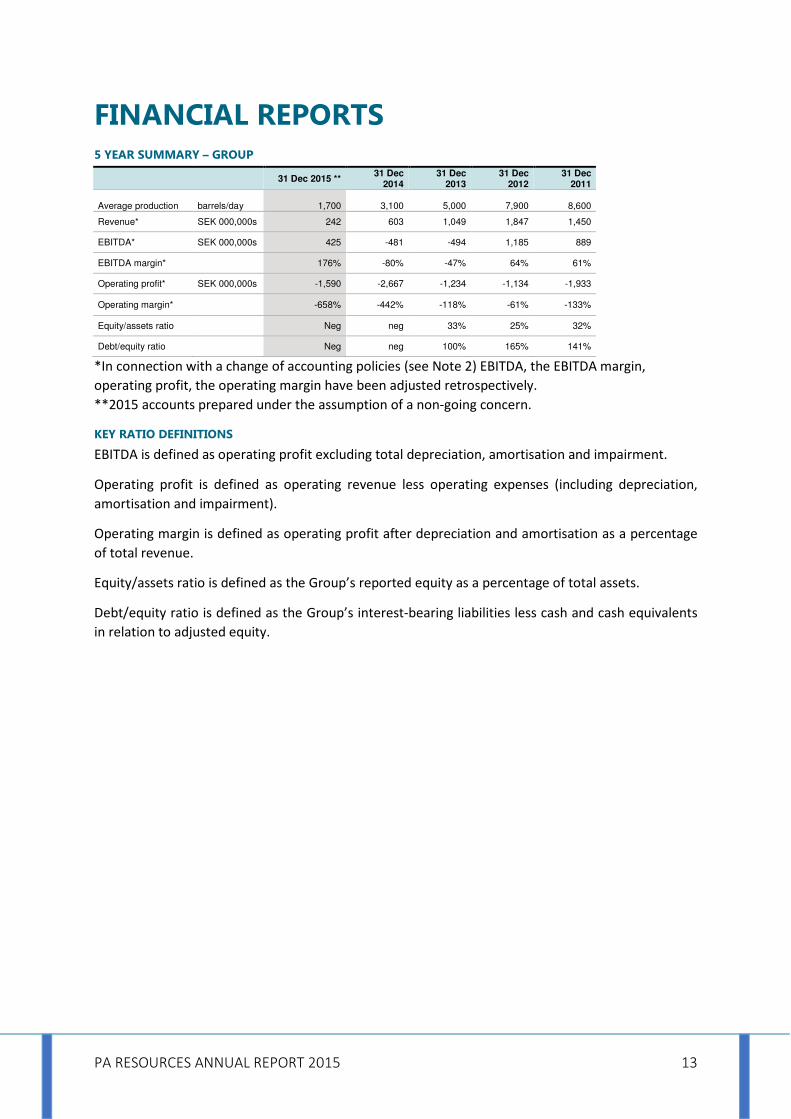
FINANCIAL REPORTS 5 YEAR SUMMARY – GROUP
31 Dec 2015 ** 31 Dec
2014 31 Dec
2013 31 Dec
2012 31 Dec
2011
Average production barrels/day 1,700 3,100 5,000 7,900 8,600
Revenue* SEK 000,000s 242 603 1,049 1,847 1,450
EBITDA* SEK 000,000s 425 -481 -494 1,185 889
EBITDA margin* 176% -80% -47% 64% 61%
Operating profit* SEK 000,000s -1,590 -2,667 -1,234 -1,134 -1,933
Operating margin* -658% -442% -118% -61% -133%
Equity/assets ratio Neg neg 33% 25% 32%
Debt/equity ratio Neg neg 100% 165% 141%
*In connection with a change of accounting policies (see Note 2) EBITDA, the EBITDA margin,
operating profit, the operating margin have been adjusted retrospectively.
**2015 accounts prepared under the assumption of a non-going concern.
KEY RATIO DEFINITIONS
EBITDA is defined as operating profit excluding total depreciation, amortisation and impairment.
Operating profit is defined as operating revenue less operating expenses (including depreciation,
amortisation and impairment).
Operating margin is defined as operating profit after depreciation and amortisation as a percentage
of total revenue.
Equity/assets ratio is defined as the Group’s reported equity as a percentage of total assets.
Debt/equity ratio is defined as the Group’s interest-bearing liabilities less cash and cash equivalents
in relation to adjusted equity.

PA RESOURCES ANNUAL REPORT 2015 14
INCOME STATEMENT – GROUP
SEK 000,000s Notes 2015 * 2014
Revenue 2 242 603
Production costs 2, 5 -184 -187
Depletion oil and gas properties 2, 14 -40 -195
Gross profit 2 17 222
Other income 4 222 46
Capital gain 4 285 -
Termination farm-out agreement 4 - -826
Impairment losses 14, 15, 16 -1,969 -1,991
General, administration and depreciation expenses 6, 7, 8, 9, 10, 11 -145 -118
Operating profit 2 -1,590 -2,667
Financial income 12 2,061 3
Financial expenses 12 -197 -368
Total financial items 1,864 -365
Profit before tax 275 -3,032
Income tax 2, 13 504 74
Profit for the period 779 -2,957
Profit for the year and earnings per share are attributable to owners of the parent.
STATEMENT OF COMPREHENSIVE INCOME – GROUP
Jan-Dec Jan-Dec
SEK 000,000s Notes 2015 * 2014
Profit for the year 779 -2,957
Other comprehensive income
Items that may be reclassified into profit or loss
Exchange differences during the period 101 353
Items reclassified into profit or loss
Accumulated exchange differences reclassified into profit and loss
-81 -
Other comprehensive income for the year 20 353
Total comprehensive income for the year 799 -2,605
Total comprehensive income is attributable to the owners of the parent.
*2015 accounts prepared under the assumption of a non-going concern.

PA RESOURCES ANNUAL REPORT 2015 15
STATEMENT OF FINANCIAL POSITION – GROUP (NON-GOING CONCERN)
31 Dec
SEK 000,000s Notes 2015
ASSETS
Exploration and evaluation assets & Oil and gas properties 14, 16 140
Machinery and equipment 15 4
Financial assets 22 1
Deferred tax assets 13 9
Inventory 17 40
Accounts receivable and other receivables 18 50
Tax assets 13 13
Cash and cash equivalents 67
TOTAL CURRENT ASSETS 324
EQUITY
Equity attributable to owners of the parent
Share capital 1
Other capital contributions 6,464
Reserves -706
Retained earnings and profit for the year -5,770
TOTAL EQUITY -12
LIABILITIES
Provisions 20 98
Deferred tax liabilities 13 -
Tax liabilities 13 29
Interest-bearing loans and borrowings 19 99
Accounts payable and other liabilities 21 111
TOTAL CURRENT LIABILITIES 336
TOTAL EQUITY AND CURRENT LIABILITIES 324
PLEDGED ASSETS 24 46
CONTINGENT LIABILITIES 24 -
PA RESOURCES ANNUAL REPORT 2015 16
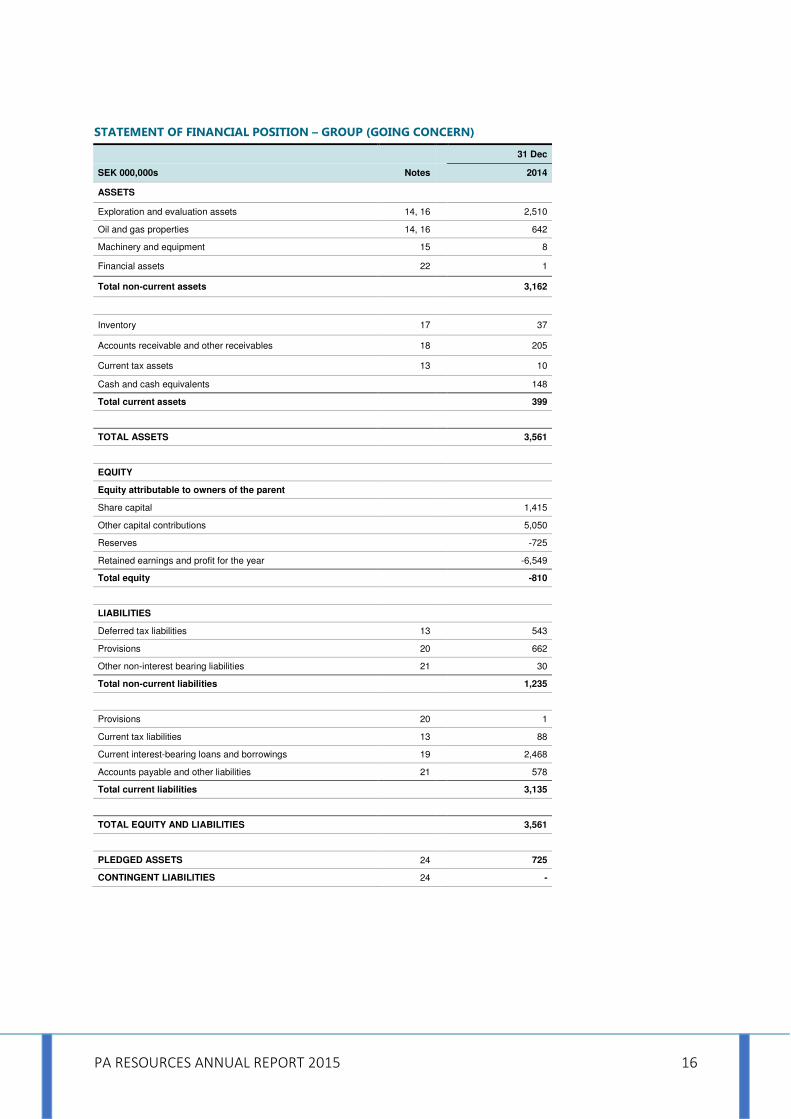
STATEMENT OF FINANCIAL POSITION – GROUP (GOING CONCERN)
31 Dec
SEK 000,000s Notes 2014
ASSETS
Exploration and evaluation assets 14, 16 2,510
Oil and gas properties 14, 16 642
Machinery and equipment 15 8
Financial assets 22 1
Total non-current assets 3,162
Inventory 17 37
Accounts receivable and other receivables 18 205
Current tax assets 13 10
Cash and cash equivalents 148
Total current assets 399
TOTAL ASSETS 3,561
EQUITY
Equity attributable to owners of the parent
Share capital 1,415
Other capital contributions 5,050
Reserves -725
Retained earnings and profit for the year -6,549
Total equity -810
LIABILITIES
Deferred tax liabilities 13 543
Provisions 20 662
Other non-interest bearing liabilities 21 30
Total non-current liabilities 1,235
Provisions 20 1
Current tax liabilities 13 88
Current interest-bearing loans and borrowings 19 2,468
Accounts payable and other liabilities 21 578
Total current liabilities 3,135
TOTAL EQUITY AND LIABILITIES 3,561
PLEDGED ASSETS 24 725
CONTINGENT LIABILITIES 24 -

PA RESOURCES ANNUAL REPORT 2015 17
STATEMENT OF CHANGES IN EQUITY – GROUP
Equity attributable to owners of the parent
SEK 000,000s Notes Share capital Other capital contribution Reserves
Retained earnings and profit for the
year Total
Balance at 1 January 2014 1,415 5,050 -1,078 -3,592 1,795
Total comprehensive income for the period
353 -2,957 -2,605
Closing balance at 31 december 2014 1,415 5,050 -725 -6,549 -810
Balance at 1 January 2015 1,415 5,050 -725 -6,549 -810
Total comprehensive income for the period 20 779 799
Transactions with shareholders
Reduction share capital -1,414 1,414 -
Closing balance at 31 december 2015 1 6,464 -706 -5,770 -12
The share capital as per 31 December 2015 was distributed among 113,167,992 shares. In connection
with the annual general meetings on 28 July 2015, the decision was to reduce the share capital to
SEK 11,316,799.20 for covering of losses. It was further decided at the extraordinary general meeting
on 27 October 2015, to reduce the share capital to SEK 800,000 for covering of losses. Both
reductions were made without redemption of shares. New share quota value is SEK 800,000 /
113,167,992. No dividend was decided on for the 2014 financial year or previous financial years. The
Board of Directors proposes to the Annual General Meeting that no dividend be paid for the 2015
financial year. Reserves pertain to effects from translation of operations in foreign currency.
PA RESOURCES ANNUAL REPORT 2015 18
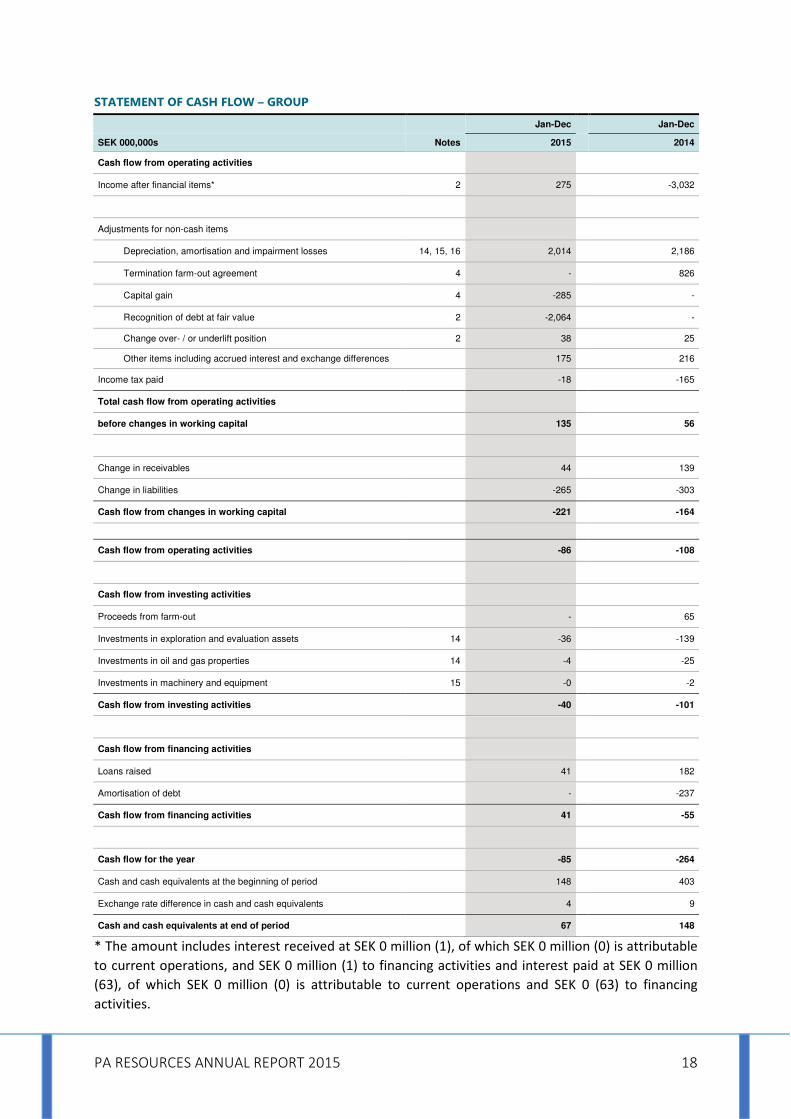
STATEMENT OF CASH FLOW – GROUP
Jan-Dec Jan-Dec
SEK 000,000s Notes 2015 2014
Cash flow from operating activities
Income after financial items* 2 275 -3,032
Adjustments for non-cash items
Depreciation, amortisation and impairment losses 14, 15, 16 2,014 2,186
Termination farm-out agreement 4 - 826
Capital gain 4 -285 -
Recognition of debt at fair value 2 -2,064 -
Change over- / or underlift position 2 38 25
Other items including accrued interest and exchange differences 175 216
Income tax paid -18 -165
Total cash flow from operating activities
before changes in working capital 135 56
Change in receivables 44 139
Change in liabilities -265 -303
Cash flow from changes in working capital -221 -164
Cash flow from operating activities -86 -108
Cash flow from investing activities
Proceeds from farm-out - 65
Investments in exploration and evaluation assets 14 -36 -139
Investments in oil and gas properties 14 -4 -25
Investments in machinery and equipment 15 -0 -2
Cash flow from investing activities -40 -101
Cash flow from financing activities
Loans raised 41 182
Amortisation of debt - -237
Cash flow from financing activities 41 -55
Cash flow for the year -85 -264
Cash and cash equivalents at the beginning of period 148 403
Exchange rate difference in cash and cash equivalents 4 9
Cash and cash equivalents at end of period 67 148
* The amount includes interest received at SEK 0 million (1), of which SEK 0 million (0) is attributable
to current operations, and SEK 0 million (1) to financing activities and interest paid at SEK 0 million
(63), of which SEK 0 million (0) is attributable to current operations and SEK 0 (63) to financing
activities.

PA RESOURCES ANNUAL REPORT 2015 19
INCOME STATEMENT – PARENT COMPANY
Jan-Dec Jan-Dec
SEK 000,000s Notes 2015 * 2014
Other income 4 42 15
Termination farm-out agreement 4 - -168
General, administration and depreciation expenses 6, 7, 8, 9, 10, 11 -84 -47
Operating profit -42 -199
Result from participations in Group companies 25 -723 -2,623
Financial income and similar 12 2,061 460
Financial expenses and similar 12 -157 -297
Total financial items 1,181 -2,459
Profit before tax 1,139 -2,659
Income tax 13 - 0
Profit for the year 1,139 -2,658
STATEMENT OF COMPREHENSIVE INCOME – PARENT COMPANY
Jan-Dec Jan-Dec
SEK 000,000s Notes 2015 2014
Profit for the year 1,139 -2,658
Other comprehensive income
Total items that may be reclassified into profit or loss - -
Total comprehensive income for the year 1,139 -2,658
*2015 accounts prepared under the assumption of a non-going concern.
PA RESOURCES ANNUAL REPORT 2015 20
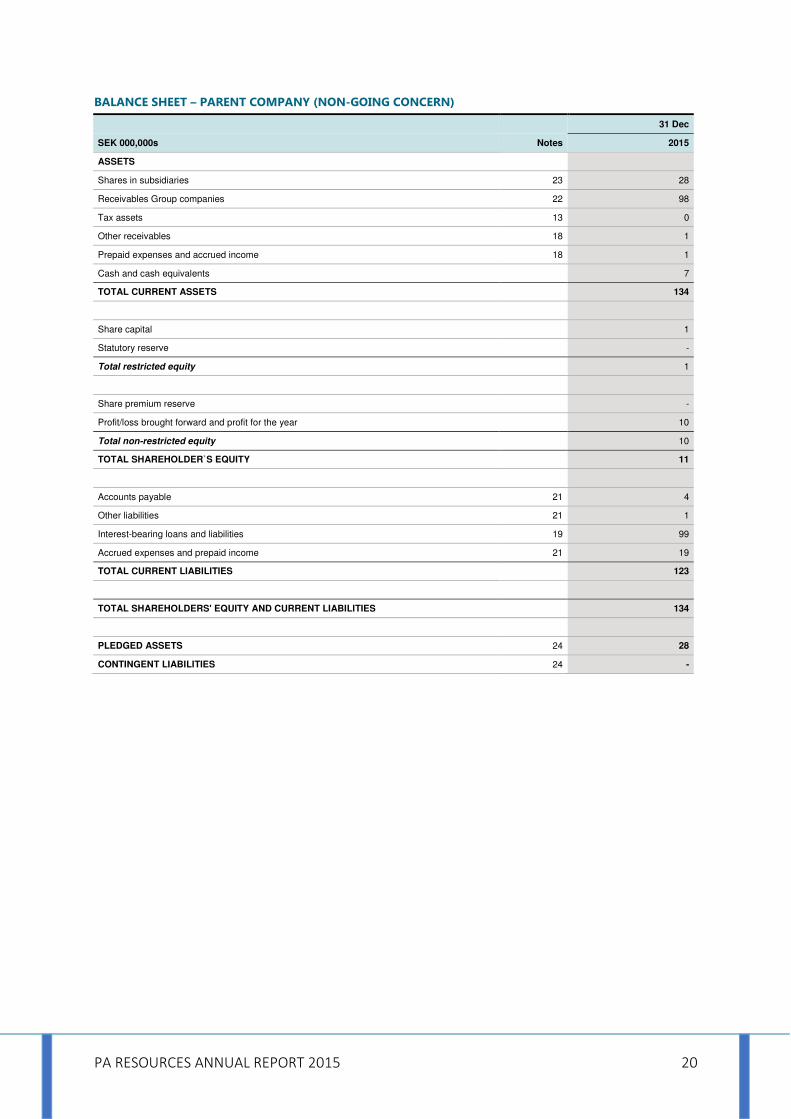
BALANCE SHEET – PARENT COMPANY (NON-GOING CONCERN)
31 Dec
SEK 000,000s Notes 2015
ASSETS
Shares in subsidiaries 23 28
Receivables Group companies 22 98
Tax assets 13 0
Other receivables 18 1
Prepaid expenses and accrued income 18 1
Cash and cash equivalents 7
TOTAL CURRENT ASSETS 134
Share capital 1
Statutory reserve -
Total restricted equity 1
Share premium reserve -
Profit/loss brought forward and profit for the year 10
Total non-restricted equity 10
TOTAL SHAREHOLDER`S EQUITY 11
Accounts payable 21 4
Other liabilities 21 1
Interest-bearing loans and liabilities 19 99
Accrued expenses and prepaid income 21 19
TOTAL CURRENT LIABILITIES 123
TOTAL SHAREHOLDERS' EQUITY AND CURRENT LIABILITIES 134
PLEDGED ASSETS 24 28
CONTINGENT LIABILITIES 24 -

PA RESOURCES ANNUAL REPORT 2015 21
BALANCE SHEET – PARENT COMPANY (GOING CONCERN)
31 Dec
SEK 000,000s Notes 2014
ASSETS
Shares in subsidiaries 23 241
Receivables Group companies 22 808
Total non-current assets 1,050
Current tax assets 13 0
Other receivables 18 2
Prepaid expenses and accrued income 18 1
Cash and cash equivalents 88
Total current assets 92
TOTAL ASSETS 1,141
SHAREHOLDERS' EQUITY
Share capital 1,415
Statutory reserve 115
Total restricted equity 1,530
Share premium reserve -
Profit/loss brought forward and profit for the year -2,658
Total non-restricted equity -2,658
Total shareholders' equity -1,128
LIABILITIES
Liabilities Group companies 22 22
Accounts payable 21 1
Other liabilities 21 0
Current interest-bearing loans and liabilities 19 2,191
Accrued expenses and prepaid income 21 56
Total current liabilities 2,270
TOTAL SHAREHOLDERS' EQUITY AND LIABILITIES 1,141
PLEDGED ASSETS 24 18
CONTINGENT LIABILITIES 24 -

PA RESOURCES ANNUAL REPORT 2015 22
STATEMENT OF CHANGES IN EQUITY – PARENT COMPANY
Restricted equity Non-restricted equity
SEK 000,000s Notes Share capital Statutory Reserve
Other capital contribution
Retained earnings
Profit for the year Total
Balance at 1 January 2014 1,415 985 2,888 -1,199 -2,559 1,530
Transfer of previous year´s result -870 -2,888 1,199 2,559 -
Total comprehensive income for the year -2,658 -2,658
Closing balance at 31 December 2014 1,415 115 - - -2,658 -1,128
Balance at 1 January 2015 1,415 115 - - -2,658 -1,128
Transfer of previous year´s result -115 -2,543 2,658 -0
Total comprehensive income for the period
1,139 1,139
Transactions with shareholders
Reduction share capital -1,414 1,414 -
Closing balance at 31 December 2015 1 - - -1,130 1,139 11

PA RESOURCES ANNUAL REPORT 2015 23
STATEMENT OF CASH FLOW – PARENT COMPANY
Jan-Dec Jan-Dec
SEK 000,000s Notes 2015 2014
Cash flow from operating activities
Income after financial items* 1,139 -2,659
Adjustments for non-cash items
Termination farm-out agreement 4 - 168
Impaiment losses participations in Group companies 25 195 1,730
Impaiment losses Intercompany receivables 25 955 1,125
Capital gain -427 -
Recognition of debt at fair value -1,912 -
Dividend recieved - -232
Other items including accrued interests and exchange gains and losses (net)
-79 -167
Income tax paid - -
Total cash flow from operating activities
before changes in working capital -129 -35
Change in receivables 9 -22
Change in liabilities 59 -40
Cash flow from changes in working capital 68 -62
Cash flow from operating activities -61 -97
Cash flow from investing activities
Loans given to subsidiaries -61 -123
Cash flow from investing activities -61 -123
Cash flow from financing activities
Loans raised 41 182
Amortisation of debt - -237
Cash flow from financing activities 41 -55
Cash flow for the year -81 -275
Cash and cash equivalents at the beginning of period 88 363
Cash and cash equivalents at end of the year 7 88
* The amount includes interest received at SEK 0 million (1), of which SEK 0 million (0) is attributable
to current operations, and SEK 0 million (1) to financing activities and interest paid at SEK 0 million
(49), of which SEK 0 million (0) is attributable to current operations and SEK 0 million (49) to financing
activities.
PA RESOURCES ANNUAL REPORT 2015 24
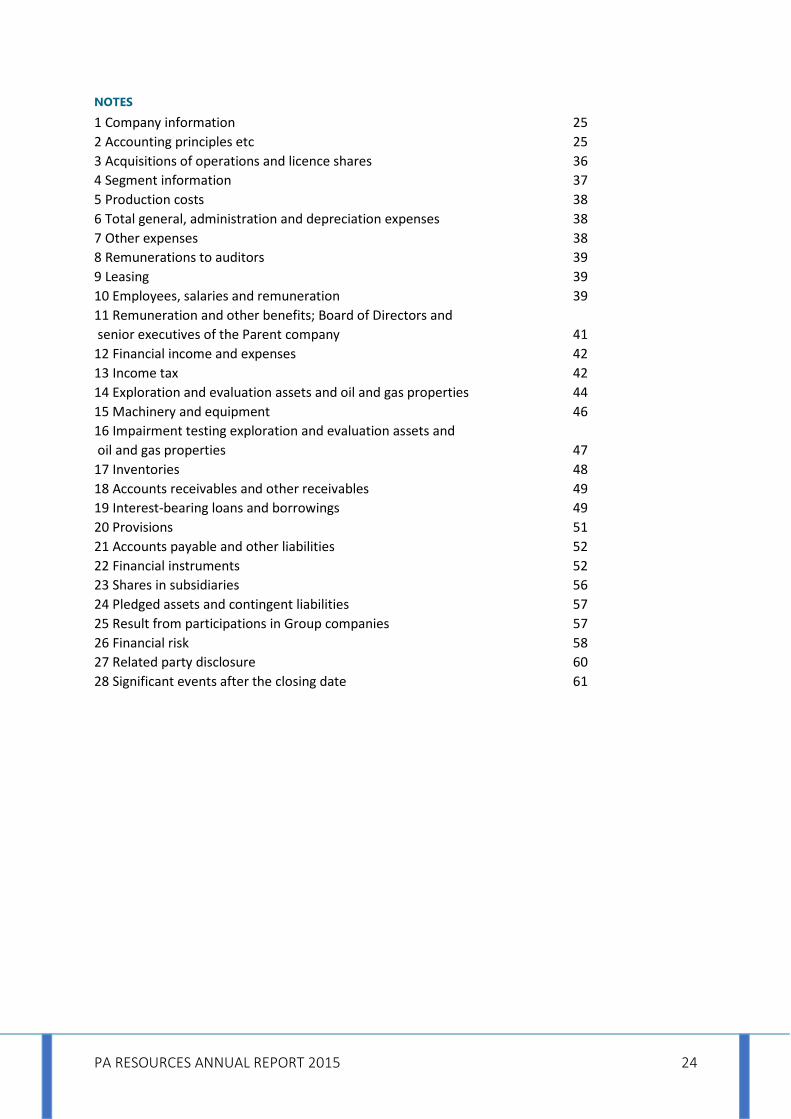
NOTES
1 Company information 25
2 Accounting principles etc 25
3 Acquisitions of operations and licence shares 36
4 Segment information 37
5 Production costs 38
6 Total general, administration and depreciation expenses 38
7 Other expenses 38
8 Remunerations to auditors 39
9 Leasing 39
10 Employees, salaries and remuneration 39
11 Remuneration and other benefits; Board of Directors and
senior executives of the Parent company 41
12 Financial income and expenses 42
13 Income tax 42
14 Exploration and evaluation assets and oil and gas properties 44
15 Machinery and equipment 46
16 Impairment testing exploration and evaluation assets and
oil and gas properties 47
17 Inventories 48
18 Accounts receivables and other receivables 49
19 Interest-bearing loans and borrowings 49
20 Provisions 51
21 Accounts payable and other liabilities 52
22 Financial instruments 52
23 Shares in subsidiaries 56
24 Pledged assets and contingent liabilities 57
25 Result from participations in Group companies 57
26 Financial risk 58
27 Related party disclosure 60
28 Significant events after the closing date 61

PA RESOURCES ANNUAL REPORT 2015 25
NOTE 1 COMPANY INFORMATION
The Parent company PA Resources AB (publ) is a Swedish limited company domiciled in Stockholm
(corporate identity number 556488-2180). The Group’s business consists of either that itself or in
collaboration with others pursue prospecting business, extract oil and gas and own and administer,
which includes buying and selling, concessions, stocks and shares in companies who pursue
prospecting- and extracting business and be engaged in other activities thereto. The Parent
company’s functional currency, and the currency in which the accounts are presented, is Swedish
kronor (SEK). This annual report and the consolidated accounts of PA Resources AB (publ) for the
year ending 31 December 2015 were approved for publication by the Board of Directors on 9 June
2016 and will be submitted for adoption at the Annual General Meeting on 30 June 2016.
NOTE 2 ACCOUNTING PRINCIPLES ETC
Note 2.1 Description of significant accounting prinNote 2.1 Description of significant accounting prinNote 2.1 Description of significant accounting prinNote 2.1 Description of significant accounting principlesciplesciplesciples
The sections within this Annual Report which are classified as formal financial reports according to
IFRS are:
• the consolidated Income Statement, Statement of Comprehensive Income, Statement of Financial
Position, Statement of Changes in Equity and Statement of Cash Flows
• the Parent company’s Income Statement, Statement of Comprehensive Income, Balance Sheet,
Statement of Changes in Equity and Statement of Cash Flows
• the notes to the financial reports
Non-going concern
The company has since the middle of 2014 been working to secure long-term financing for the
company’s operations and development projects. Following the corporate reorganisation and the
strategic review the company still stands without long-term financing and has decided to sell its
assets. As a result the board of directors has concluded that the company’s financial statements,
effective 31 December 2015, can no longer be prepared under the assumption of a going concern.
Following the decision to prepare the accounts without the assumption of a going concern PA
Resources values its exploration and evaluation assets and its oil and gas properties including
abandonment costs at the lowest of either carrying value or fair value less cost to sell (FVLCS).
Market valuation of the assets are based on sales values net of transaction costs. Provision for
abandonment earlier accounted for as provision are, as a consequence of not applying going
concern, now included net in evaluation and exploration assets & oil and gas properties. Further,
according to the strategic review process described under Board of Director´s report, the conclusion
is to sale all of the company´s assets and in such case IFRS 5 is not applicable. PA Resources AB
accounts for its participations in group companies in accordance with what is expected to be
obtained through the sale, net.
As per 2 October, 2015 a qualified majority of the company’s creditors choose to support the
proposed composition plan put forward by PA Resources AB and the administrator at the
composition proceedings at the Stockholm District Court. Following the decision of the board to
prepare the Annual report in accordance with a non-going concern, PA Resources, effective 31
December, 2015 has derecognised its interest-bearing loans and borrowings accounted for at
amortised cost and thereafter recognised its interest-bearing loans and borrowings at fair value and
in accordance with the terms of the adopted composition plan.

PA RESOURCES ANNUAL REPORT 2015 26
The PA Resources group´s and parent company´s financial statements are as per December 31, 2015
prepared on a non-going concern basis, whereas all earlier periods are prepared under the
assumption of a going concern. As a result of the non-going concern assumption all non-current
assets and liabilities have been reclassified to current assets and liabilities in both the PA Resources
group´s and parent company´s statement of financial position ending 31 December 2015. The
changed assumption does not impact the net result or the cash flow statement in any of the previous
or current periods. No retrospective changes have been made.
Basis for preparation of the financial statements
Except for what is described above under “Non-going concern”, the consolidated financial
statements are based on historical acquisition costs except in the case of financial instruments, which
could be reported at fair value. Group´s outstanding under- / overlift positions of hydrocarbons are
valued at the balance sheet date and recognised as if the positions have been sold. Valuations are
performed either with Brent spot price at the balance sheet date taking eventual discount or
premium into consideration or with prevailing contract prices. Unless otherwise indicated, all
amounts are reported in thousands of Swedish kronor (SEK million).
Statement of conformity with regulations applied
The consolidated financial statements and the financial statements for the Parent company have
been prepared in accordance with International Financial Reporting Standards (IFRS) including
interpretation statements issued by the International Financial Reporting Interpretations Committee
(IFRIC ) and in accordance with Swedish laws. Since the Parent company is a company within the EU,
only IFRS adopted by the EU are applied. In addition, the Annual Accounts Act and the Swedish
Financial Reporting Board’s recommendation RFR 1, Supplementary Accounting Rules for the Group
have been applied. The financial statements for the Parent company have been prepared applying
recommendation RFR 2, Accounting for Legal Entities, statements from the Swedish Financial
Reporting Board and the Annual Accounts Act.
Consolidated financial statements
Basis of consolidation
The consolidated financial statements encompass the Parent company and its subsidiaries. The
financial reports for the Parent company and the subsidiaries included in the consolidated financial
statements cover the same period and have been prepared in accordance with the same accounting
principles as applied for the Group.
All intra-group transactions and accounts, as well as gains and losses on transactions between Group
companies are eliminated entirely.
A subsidiary or its assets and liabilities are included in the consolidated financial statements from the
acquisition date, which is the day a controlling influence in the subsidiary arises, and are included in
the consolidated financial statements until the day the controlling influence ceases. Controlling
influence means the right to formulate the subsidiary’s operational and financial strategies with a
view to obtaining financial benefits.
Acquisitions of operations are reported in the consolidated financial statements using the purchase
method of accounting. The purchase method of accounting means, among other things, that the
acquisition cost of the shares is distributed to the assets, commitments taken over and liabilities
acquired at the acquisition date based on their fair values at the time. If the acquisition cost exceeds
the fair value of the acquired company’s net assets, the excess value is first allocated to acquired oil
and gas properties and thereafter, any difference is recognised as goodwill. If the acquisition cost is

PA RESOURCES ANNUAL REPORT 2015 27
lower than the fair value of the acquired company’s net assets, the difference is reported directly in
the income statement.
Segment reporting
Followed that PA Resources´ share is delisted, the company is no longer obliged to apply IFRS 8.
Further PA Resources´ group management has changed its way of analysing and monitoring the
company´s performance, the internal reporting, effective 31 December 2015, is made and monitored
by the management in form of one single segment containing all of PA Resources´ assets. Earlier
segment structure based on geographical regions is no longer valid from an IFRS 8 perspective.
Therefore PA Resources no longer show its Income statement and Balance sheet compiled per
geographical regions.
Translation of foreign currency
Functional currency and reporting currency
The functional currency of each unit within the Group is determined by reference to the economic
environment in which the units carry on their respective operations. Monetary receivables and
liabilities in each subsidiary that are expressed in foreign currencies are translated into the functional
currency at the exchange rate in force on the balance sheet date. All translation differences are
reported in the income statement. The Group continuously analyses circumstances that could
indicate a change in the functional currency from local currency to USD in the Group’s subsidiaries.
Translation of foreign operations
The consolidated financial statements of PA Resources are presented in Swedish kronor (SEK), which
is the Parent company’s functional and reporting currency.
Assets and liabilities in other functional currencies are translated into SEK at the exchange rate
effective on the balance sheet date. Income statements are translated at the average exchange rate
for the year. Translation differences arising on the translation of foreign operations are reported
directly against equity in the statement of comprehensive income.
Exchange rates
The following exchange rates were used in the preparation of the financial statements:
Closing day rate 31 Dec 2015
Average rate Jan-Dec 2015
Closing day rate 31 Dec 2014
Average rate Jan-Dec 2014
1 EUR in SEK 9.14 9.36 9.52 9.10
1 USD in SEK 8.35 8.44 7.81 6.86
1 TND in SEK 4.15 4.30 4.19 4.04
1 NOK in SEK 0.96 1.05 1.05 1.09
1 GBP in SEK 12.38 12.90 12.14 11.29
1 DKK in SEK 1.22 1.25 1.28 1.22
New accounting policy – Exchange gains/losses
PA Resources decided in the first quarter 2015 to change accounting policy for exchange gains/losses
earlier presented in operating profit now in net financial items. The changed accounting policy does
not impact the net result in any of the previous and current periods. It did not either impact the split
between operating- and non-operating result. Even though the previously applied policy, as
presented in the income statement were in full compliance with IFRS, the assessment is now that the
new presentation and changed policy provide a better presentation and more relevant information
for the reader. PA Resources is doing this on a voluntary basis and there are no historical errors. PA

PA RESOURCES ANNUAL REPORT 2015 28
Resources has changed the accounting policies in accordance with IAS 8 - Accounting Policies,
Changes in Accounting Estimates and Errors.
Revenue recognition
Group revenue primarily refers to revenue from sales of oil. Revenue is based on sales which are
primarily managed by yearly contracts signed with a small number of major international oil and gas
companies in which oil sold is priced at the applicable world market price less any discounts and plus
any premiums due to the quality of the oil and gas equivalents. Pricing occurs during a
predetermined time period prior to and following the day on which physical delivery is made from
vendor to vendee. Interest income is recognized in accordance with the effective rate method and
primarily refers to interest income from cash and cash equivalents and receivables. The majority of
the Parent company’s revenue is made up of sales of services to other companies within the Group.
Production costs (Direct production taxes)
Current license terms for some producing oil fields require direct production taxes (royalties) to be
paid.
Remunerations to employees, Board of Directors and senior executives
Short-term remunerations
Salaries, other remuneration and benefits as well as social security contributions are reported as
personnel expenses in the income statement when they arise.
Post-employment remunerations
Pension costs for defined-contribution plans are reported as personnel expenses in the income
statement. The defined-contribution plans are the only pension schemes in place within PA
Resources. More information regarding the expenses during the financial year is provided in Note 10,
Employees, salaries and other remuneration.
Recognition of exploration and evaluation assets as well as oil and gas properties
Except for what is described above under Non-going concern, Expenditures for exploration and
evaluation of oil and gas properties are reported according to the Full Cost Method. All costs
attributable to exploration, drilling and evaluation of such interests are capitalised in full. The
expenditures are accumulated separately for each licence right and the capitalisation of exploration
and evaluation assets, or alternatively oil and gas properties depends on the development phase that
has been reached.
The balance sheet item exploration and evaluation assets refer to acquired licence/concession rights
and other capitalised exploration and evaluation expenditure.
When PA Resources appraises and assesses an exploration permit as profitable a plan for
development is applied for. On receiving the plan for development, the asset is reclassified under oil
and gas properties and, in conjunction with reclassification, the assets are tested for any possible
need for impairment, for the purpose of ascertaining their value. If the asset is relinquished to the
government authorities or is assessed as unprofitable, the asset is expensed by PA Resources
through recognition as an impairment loss in profit or loss.
The balance sheet item, oil and gas properties, refers both to reclassified exploration and evaluation
assets as well as capitalised development expenses. Depreciation commences for the actual asset in
conjunction with the start of production. Assets are regularly tested for any possible need for

PA RESOURCES ANNUAL REPORT 2015 29
impairment and where a need is identified, the asset is expensed through recognition as an
impairment loss in profit or loss.
Joint arrangements
PA Resources has interests in licences in the North Africa, West Africa and the North Sea and
recognises investments in joint operations (exploration and evaluation assets as well as oil and gas
properties) by reporting its share of related expenses, assets, liabilities and cash flows under the
respective items in the Group’s financial statements. For those licences that are not deemed to be a
joint arrangement under the definition in IFRS 11 because there is no joint control, PA Resources
recognises its share of related expenses, assets, liabilities and cash flows on a line-by-line-basis in the
financial statements in accordance with applicable IFRS.
Farm-out accounting
Farm-outs are accounted for in accordance with the principles of IFRS 6 with respect to exploration
and evaluation assets. PA Resources recognises cash payments received directly against the asset
and retains the recorded portion of the asset less any cash received. This entails that no revenue is
recognised in connection with the farm-out unless the cash received exceeds the book value of the
farmed out asset. No entries at the transaction date are made regarding any future payments. In
case where a farm-out pertains to PA Resources’ oil and gas assets, accounting is performed in
accordance with IAS 16. Accordingly, PA Resources derecognises the carrying amount of the asset
attributable to the proportion farmed out and recognises any future payments on the balance sheet.
After recording any cash received as part of the transaction, a gain or loss is recognised in the income
statement. After the completed transaction, PA Resources tests its cash generating units for
impairment. Impairment losses are charged to the income statement.
Depletion oil and gas properties
Depletion of oil and gas properties commences in conjunction with the start of production and are
calculated using the Unit of Production Method and are depleted in line with the year’s production in
relation to the estimated total proven and probable reserves of oil and gas. Technical installations
and equipment are linear depreciated over the assets’ expected useful life. The estimated useful life
is ten years for technical installations and five years for equipment.
Recognition of machinery and equipment
Machinery and equipment is valued at cost after a deduction for accumulated depreciation and any
impairment losses. Linear depreciation is applied over the assets’ expected useful life. The estimated
useful life for machinery and equipment is 3–5 years.
Impairment losses
Except for what is described above under Non-going concern, PA Resources regularly assesses its
exploration and evaluation assets as well as its oil and gas properties for any need for impairment.
This is performed in conjunction with each balance sheet date or if there are events or changes in
circumstances that indicate that carrying values of assets may not be recoverable.
Such indicators include changes in the Group’s business plans, relinquished licences, changes in raw
materials prices leading to lower revenues and, for oil and gas properties, downward revisions of
estimated reserve quantities.
Testing for impairment losses is performed for each cash generating unit, which corresponds to
licence right, production sharing agreement or equivalent owned by PA Resources. A cash generating
unit thus usually corresponds to each acquired asset in each country in which PA Resources carries
on exploration and development operations. Impairment testing means that the balance sheet item
PA RESOURCES ANNUAL REPORT 2015 30
amount for each cash generating unit is compared to the recoverable amount for the assets, which is
the higher of the fair value of the assets less sales expenses and the value in use. The value in use of
the assets is based on the present value of future cash flows discounted by weighted average cost of
capital (WACC ); see also Note 16 Impairment testing exploration and evaluation assets and oil and
gas properties. An impairment loss is recorded when an asset’s or a cash generating unit’s recorded
value exceeds the value in use. Impairment losses are charged to the income statement.
Reversal of impairment losses
At least once every year an assessment is made as to whether there are any indications that
impairment losses reported previously are no longer justified or have reduced in extent. If such
indications exist, a new calculation of the recoverable amount is made. A previously recognised
impairment loss is reversed only to the extent that the asset’s reported value after reversal does not
exceed the reported value the asset would have had if the impairment loss had never been
recognised.
If this is the case, the book value of the asset is increased to its recoverable amount. After a reversal
the depreciation charge is adjusted in future periods to distribute the asset’s revised book value over
its expected remaining useful life.
Inventory
Outstanding inventory consist of other supplies and materials and is valued at the lower of cost and
net realizable value. When assessing obsolescence of inventory items, consideration is given to the
age of the inventory, the material and the rate of turnover. Any impairment of the inventory affects
operating profit.
Under- or overlift positions of hydrocarbons
PA Resources’ under- or overlift position of hydrocarbons is reported as if they had been sold at the
balance sheet date. Valuation is performed either based on the Brent spot price at the respective
balance sheet date taking any discounts or premiums into consideration, or according to the
prevailing contract price. An underlift position is included in Accounts receivable and other
receivables, while an overlift position is included in Accounts payable and other liabilities. A change
in the under- or overlift position is reflected in the income statement as Revenue.
Financial instruments
PA Resources’ financial instrument assets comprise accounts receivable and other receivables, other
financial non-current assets and cash and cash equivalents.
The assets can, on occasion, also comprise derivatives for which hedging has been performed by the
Group with respect to matching the interest-bearing liability to the corresponding asset’s currency
risk. Financial instrument liabilities comprise interest-bearing loans and borrowings and the short-
term portion thereof, derivatives, for which hedging has been performed, as well as accounts
payable and other liabilities.
Recognition and derecognition in the balance sheet
PA Resources reports a financial asset or a financial liability in the balance sheet when the company
becomes a party to the instrument’s contractual terms. The company derecognises a financial
liability or part thereof when the obligation stated in the relevant contract is fulfilled or otherwise
terminated.
PA Resources currently reports all its financial instruments gross, but net reporting is possible where
there is a legal right of offset. Recognition and Derecognition in the balance sheet are reported on
PA RESOURCES ANNUAL REPORT 2015 31
the transaction date, which is the day on which PA Resources undertakes to acquire or sell the
financial instrument in question.
Classification by means of measurement
Initial measurement
PA Resources initially recognises its financial instruments at fair value plus a supplement for directly
attributable transaction expenses, usually the transaction price. This principle is applied to all
financial instruments apart from those in the category financial assets or liabilities carried at fair
value through profit or loss, which are recognised at fair value excluding transaction expenses.
Except for what is described above under Non-going concern, this category comprises only
derivatives.
PA Resources classifies its financial instruments in the following categories based on the purpose for
which the instrument was acquired. This classification generally forms a basis for how the financial
instrument is measured after it is first reported. On each closing date the company tests all its
financial assets for impairment, apart from those in the category financial assets or liabilities carried
at fair value through profit or loss.
In the Parent company the same measurement principles are applied, subject to the restrictions
contained in Chapter 4 § 14 of the Swedish Annual Accounts Act; at present these restrictions result
in no differences between the Parent company and the Group.
After initial recognition, the company’s financial instruments are reported as described below.
Subsequent measurement
Financial assets measured at fair value through profit or loss
In this category PA Resources classifies derivatives with a positive fair value as a separate
subcategory. These are continually measured at fair value with changes in value through profit or
loss. At present PA Resources has no hedging instruments that are identified as effective, and instead
reports all its positive derivatives in this subcategory. PA Resources held no assets or liabilities under
this category at year-end or at the end of the preceding year.
Loans and receivables
PA Resources classifies mainly receivables generated by the company in its operations in this
category, but acquired receivables can also be included. At present it contains deposits for leased
drilling equipment, accounts receivable, receivables from partners, accrued interest income, accrued
income from oil inventories and cash and cash equivalents. These are measured at amortised cost,
using the effective interest method established at the time of acquisition.
Where accounts receivable are concerned, provision for impairment is made if there is objective
evidence that the Group will not receive the amount due according to the original terms of the
receivables. Impairment of accounts receivable is reported in the operating result.
Available-for-sale financial assets
PA Resources sees this category as a residual category containing long-term assets not classified in
any other category. For the current year, as well as for the comparative period, there are no assets in
this category.
The assets are measured at fair value directly through other comprehensive income, except where
impairment is applied. No impairment was applied during the year and any change in value is
recognised in other comprehensive income.
PA RESOURCES ANNUAL REPORT 2015 32
Financial liabilities measured at fair value through profit or loss
In this category PA Resources classifies derivatives with a negative fair value as a separate
subcategory. These are continually measured at fair value with changes in value through profit or
loss. At present PA Resources has no hedging instruments that are identified as effective, and instead
reports all its negative derivatives in this subcategory. Except for what is described above under Non-
going concern, PA Resources held no assets or liabilities under this category at year-end or at the end
of the preceding year.
Other financial liabilities
Except for what is described above under Non-going concern, PA Resources includes in this category
Interest-bearing loans and borrowings, which are measured at amortised cost using the effective
interest method which is the category’s main assessment method. Within this category, secured
loans can be measured at fair value. However, at present there are no loans that are secured. The
company also places in this category accounts payable, the short-term portion of interest-bearing
loans and borrowings as well as other financial liabilities such as liabilities to partners as well as
accrued interest expenses and accrued exploitation and drilling expenses.
Compound financial instruments
A compound financial instrument contains both a liability component and an equity component,
which are each classified separately. PA Resources reports its convertible debentures in this way,
with the liability component reported under Interest-bearing loans and borrowings within the
category Other financial liabilities.
Measurement of fair value
PA Resources bases the fair value of financial instruments depending on available market data at
time of valuation. Data are categorised into three categories; Level 1: quoted prices in active
markets. Level 2: valuation based on observable market data. Level 3: valuation techniques incorpor-
ating information other than observable market data. The reported value – after any impairment – of
accounts receivable and accounts payable is assumed to equate to their fair value, since these entries
are short-term in nature.
Embedded derivatives
An embedded derivative is a contract with derivative-like properties, but which forms part of another
contract. An embedded derivative is to be distinguished from the host contract and recognised as a
separate derivative where the economic properties and risks are not closely related to those of the
host contract. PA Resources holds embedded derivatives in its bond loans, known as call options,
which means that the company can call for early redemption at a value in excess of the nominal
amount. However, these are considered to be closely related, and as a result they are not reported
separately.
Borrowing costs
Borrowing costs are capitalised when these refer to the purchase, construction or production of
assets which necessarily take considerable time to complete for their intended use or sale.
Capitalisation only takes place if it is assessed that this will involve probable economic advantage.
Interest on loans referring to the acquisition and development of oil and gas properties, for which
the borrowing costs can be included in the acquisition value, is capitalised during the period of time
necessary to finalise the work and complete the asset for its intended use. Capitalisation of interest
expenditures is begun when an acquisition is made and when investment and development costs
arise, either in the oil and gas properties where the Group is operator or as allocated through
PA RESOURCES ANNUAL REPORT 2015 33
invoices from operators of oil and gas properties in which the Group is a partner. The interest is
capitalized throughout the development phase until the asset is finally ready to start production.
Other loan expenses are distributed over the terms of the loans using the effective interest method.
Provisions
Except for what is described above under Non-going concern, provisions are reported in the balance
sheet where there is a formal or informal commitment as a result of an event that has occurred and
it is likely that an outflow of resources will be required in order to settle the commitment and the
amount can be reliable estimated. The amount is discounted to present value in those cases where
the time effect in each provision is significant.
In some oil fields, where the Group has an obligation to contribute to, for example restoration of the
environment, dismantling, removal, clean-up and similar actions around the drilling sites both
onshore and offshore, provisions are reported based on the present values of the expenses expected
to be required to discharge the obligations, using estimated cash flows. The discount rate used
considers the time value of money and the risk specifically attributable to the provision, as assessed
by the market. Provisions for asset retirement obligations are revised on a continual basis depending
on future changes in estimated cash flows, the discount rate and risks attributable to the provision.
An obligation arises either at the time when an oil field is acquired or when the Group starts to utilise
these and as a counterpart to the provision an asset is recorded as one part of the Group’s total oil
and gas properties. The asset is depreciated over the life of the oil field based on the oil field’s
production.
Income tax
Income tax consists of current tax and deferred tax. Income taxes are recorded in the income
statement when they refer to income statement items. Income taxes referring to items in other
comprehensive income are recorded in total other comprehensive income and recorded directly
against equity when the underlying transaction is recorded directly against equity.
Current tax
Current tax is tax that is to be paid or received for the current year, applying the tax rates and the tax
legislation used and in force on the balance sheet date.
This includes adjustment of current tax attributable to previous periods. Current tax receivables and
liabilities for current and prior periods are valued at the amount expected to be recovered from or
paid to the tax authorities. Taxes on oil production are paid in accordance with local legal and fiscal
terms in each country and these terms can vary within each country depending on which oil field
they relate to. The tax is calculated on taxable profit for each individual oil field at the current local
tax rates. Current tax receivables and liabilities attributable to each company are reported net in the
balance sheet.
Deferred tax
Deferred tax is calculated based on temporary differences between the fiscal and book values of
assets and liabilities. Deferred tax assets are recognised for all deductible temporary differences,
carry-forward of unused tax credits and unused tax losses, to the extent that it is probable that
taxable profit will exist against which the deductible temporary differences and the carry-forward of
unused tax losses can be utilised. However, if the deferred income tax arises from initial recognition
of an asset or liability in a transaction other than a business combination that at the time of the
transaction affects neither accounting nor taxable profit nor loss, it is not recognised.
PA RESOURCES ANNUAL REPORT 2015 34
The recorded values of deferred tax assets are tested as of each balance sheet date and reduced if
there is no longer a probability that there will be sufficient taxable profit to utilise the deferred tax
assets against.
Deferred tax assets and liabilities are measured at tax rates that are expected to apply to the period
when the asset is realised or the liability is settled, based on tax rates and tax laws that have been
enacted or exist in practice at the balance sheet date. Deferred tax assets and liabilities are reported
net in the balance sheet provided that the tax payment will be made at the net amount.
Leasing as lessee
The Group’s lease agreements where all risks and benefits associated with the ownership do not
accrue to the Group are classified as operating leases. The Group has only assets that are reported as
operating leases. Lease payments are recorded as costs in the income statement and are distributed
linearly over the term of the agreement. See Note 9 Leasing.
Cash flow statement
The cash flow statement shows cash receipts and cash payments and the indirect method has been
used. In addition to cash and bank balances, short-term deposits with an original term of less than
three months are classified as cash and cash equivalents, exposed to insignificant in fluctuations in
value.
Contingent liabilities
A contingent liability is recognised when there is a possible obligation relating to past events, the
existence of which is confirmed only by the occurrence or non-occurrence of one or more uncertain
future events not wholly within the control of the enterprise, or when there is an obligation which is
not recognised as a liability or a provision because it is unlikely that an outflow of resources will be
required to settle the obligation.
Parent company’s accounting principles
The Swedish Financial Reporting Board’s recommendation RFR 2, Accounting for Legal Entities, was
applied in the preparation of the Parent company’s financial statements. With the exception of those
cases stated below, the Parent company applies the same accounting principles as the Group. In the
Parent company, shares in subsidiaries are reported at acquisition value with a deduction for
possible impairment losses. Also in the Parent company, shareholders’ contributions to subsidiaries
are recorded as an increase in the value of the shares in the subsidiary on the grounds of increased
value within the subsidiary.
These shareholders’ contributions are eliminated against the subsidiaries’ equity in the consolidated
financial statements.
Note 2.2 ChangesNote 2.2 ChangesNote 2.2 ChangesNote 2.2 Changes, , , , amendments and interpretations amendments and interpretations amendments and interpretations amendments and interpretations in accounting principles and disclosuresin accounting principles and disclosuresin accounting principles and disclosuresin accounting principles and disclosures
The same accounting principles have been applied in this Annual Report as in the Annual Report for
the financial year 2014, except for the changes specified above as well as the Annual improvements
to IFRS Improvements Cycles 2010-2012 and 2011-2013. The adoption of these amendments did not
have any impact on the consolidated financial statements of the Group. Furthermore, the
assumption of applying non-going concern meant changes described above.
During the year the Group did not apply in advance any new or amended standards and
interpretations from IFRIC adopted by the EU. The comments below pertain only to the standars,
amendments and interpretations that have not yet entered into force, but are deemed to be relevant
for PA Resources.

PA RESOURCES ANNUAL REPORT 2015 35
IFRS 9 Financial instruments, the standard addresses the classification, measurement and recognition
of financial assets and financial liabilities. Effective from 1 January 2018.
IFRS 15 Revenue from contract with customers, the standard addresses revenue recognition and
establishes principles for reporting useful information to users of financial statements. Effective from
1 January 2018.
IFRS 16 Leases, this standard will replace IAS 17 “Leases” and requires assets and liabilities arising
from all leases, with some exceptions, to be recognised on the balance sheet. Effective from 1
January 2019.
Note 2.4 Critical accounting principles,Note 2.4 Critical accounting principles,Note 2.4 Critical accounting principles,Note 2.4 Critical accounting principles, estimates and assumptionsestimates and assumptionsestimates and assumptionsestimates and assumptions
In the course of preparing the financial statements, the management of PA Resources has to make
estimates and assumptions that will affect recorded asset and liability items as well as revenue and
expense items. Uncertainties in estimates and assumptions could have an effect on reported values
of assets, liabilities and consolidated results. Estimates and assumptions are reviewed regularly on
the basis of historical experience and other factors, including expectations of future events. The main
estimates and assumptions are shown below:
Estimates and assumptions of oil and gas reserves
Accounting for oil and gas discoveries is subject to accounting rules that are unique to the oil and gas
industry. The accounting principles and areas which require the most significant estimates and
assumptions when preparing the consolidated financial statements relate to oil and natural gas
accounting, including estimates of and assumptions concerning reserves. The valuation of oil and gas
properties is based on estimates and assumptions concerning both proven and probable oil reserves
at the time of acquisition of the oil fields and the expected oil that can be produced yearly. Estimates
and assumptions of proven and probable oil reserves are performed with the aid of third party
valuations and reserves are adjusted annually in the light of the volume of oil and gas produced as
well as new discoveries made during the year. However, there is always a certain amount of
uncertainty surrounding the valuations performed, and should there be any new estimates and
assumptions showing a decrease in oil reserves or if the oil production does not encounter
potentially economically profitable oil and gas quantities there is a significant risk that the recorded
oil and gas properties for specific wells will have to be impaired. This is assessed in impairment
testing.
The results of third-party appraisals are analysed and an assessment performed of any discrepancies
identified between estimated proven and probable oil and gas reserves compared with Group
internal appraisals. Assessments are performed by the management in respect of how the appraisals
are utilised.
Impairment testing of exploration and evaluation assets as well as oil and gas properties as well as
assumptions concerning provisions for asset retirement obligations
Following the decision to prepare the accounts without the assumption of a going concern PA
Resources values its exploration and evaluation assets and its oil and gas properties including
abandonment costs at the lowest of either carrying value or fair value less cost to sell (FVLCS).
Market valuation of the assets are based on sales values net of transaction costs. Included in the
North Sea transaction is also a highly uncertain and contingent consideration based on future oilprice
development. The consideration is not included in the 2015 valuation of PA Resources' net assets.
Provision for abandonment earlier accounted for as provision are, as a consequence of not applying
going concern, now included net in evaluation and exploration assets & oil and gas properties.
Further, according to the strategic review process described under Board of Director´s report, the
PA RESOURCES ANNUAL REPORT 2015 36
conclusion is to sale all of the company´s assets and in such case IFRS 5 is not applicable. PA
Resources AB accounts for its participations in group companies in accordance with what is expected
to be obtained through the sale, net.
For information on the reported values of total exploration and evaluation assets as well as oil and
gas properties on the balance sheet date refer to Note 14 Exploration and evaluation assets as well
as oil and gas properties and Note 16 Impairment testing of exploration and evaluation assets as well
as oil and gas properties.
Estimation of and assumptions concerning taxes
In order to determine current tax receivables and liabilities and capitalisation of provisions for
deferred tax assets and liabilities, significant estimates and assumptions have to be made by the
management. This process includes analyzing the tax result of each of the legal entities in which PA
Resources conducts its business. The process includes analysing exposure to current tax and
establishing temporary differences that arise because certain assets and liabilities are valued in
different ways in the financial statements and in the income declarations.
The management also has to assess the probability that deferred tax assets can be realised against
future taxable revenues as well as repayments of accrued exploration expenses. The actual outcome
could differ from these assessments, for example depending on future changes in business
conditions and investment decisions, currently unknown changes in fiscal legislation or as a result of
the final examination by tax authorities or courts of law of tax declarations submitted. For
information on the reported values of total current tax and total deferred tax receivables and tax
liabilities on the balance sheet date refer to Note 13 Income tax.
Note 2.5 Significant judgments in the application of the Group’s accounting principles
Subsidiaries’ assets and liabilities in foreign currencies as at the balance sheet date are translated
from the functional currency of the unit concerned into the Group’s reporting currency (SEK). The
company assesses annually whether the subsidiaries’ functional currency is affected by any changes
in the local economic environments in which the subsidiaries conduct their business. During the
current financial year, none of PA Resources units changed its functional currency. PA Resources
applies non-going concern, for more information, see 2.1 Description of significant accounting
principles.
NOTE 3 ACQUISITIONS OF OPERATIONS AND LICENSE SHARES
During the 2015 and 2014 financial years no acquisitions or divestments were made of companies or
of shares in companies. In 2015 Gunvor exercised its security under the terms of the RBL-loan to take
over the shares in Osborne Resources Ltd. Osborne Resources Ltd held PA Resources` interest in
Block I in Equatorial Guinea including the producing fields Asend and Alen. Following the
enforcement PA Resources no longer has any interest in Equatorial Guinea.
In 2015, PA Resources was awarded Block 21/24 in UK´s 28th Licensing Round.
At year-end 2014 the farm out agreements of 70 percent interest in each of the Didon field and Zarat
license were terminated. Further to the termination, PA Resources accounts for the legal entity
Hydrocarbures Tunisie Didon Ltd, holding 70 percent of the Didon field. As a result, PA Resources
Group is the sole holder of the Didon field as well as the Zarat licence.
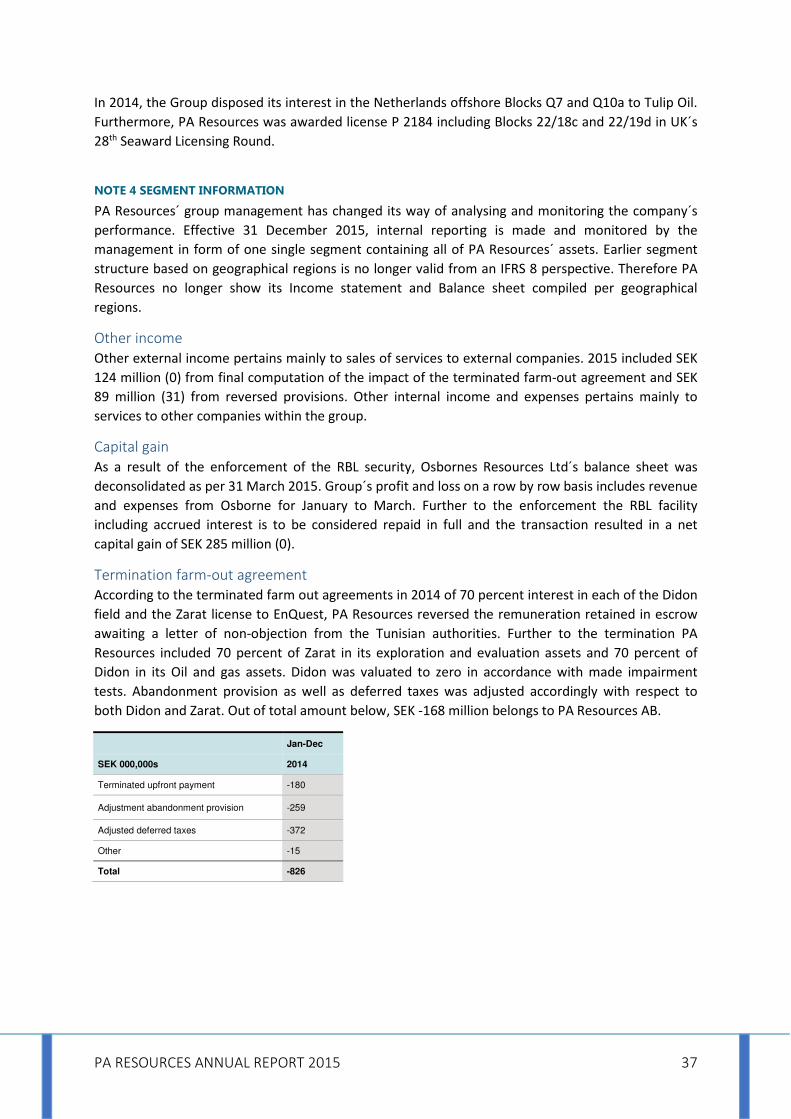
PA RESOURCES ANNUAL REPORT 2015 37
In 2014, the Group disposed its interest in the Netherlands offshore Blocks Q7 and Q10a to Tulip Oil.
Furthermore, PA Resources was awarded license P 2184 including Blocks 22/18c and 22/19d in UK´s
28th Seaward Licensing Round.
NOTE 4 SEGMENT INFORMATION
PA Resources´ group management has changed its way of analysing and monitoring the company´s
performance. Effective 31 December 2015, internal reporting is made and monitored by the
management in form of one single segment containing all of PA Resources´ assets. Earlier segment
structure based on geographical regions is no longer valid from an IFRS 8 perspective. Therefore PA
Resources no longer show its Income statement and Balance sheet compiled per geographical
regions.
Other income
Other external income pertains mainly to sales of services to external companies. 2015 included SEK
124 million (0) from final computation of the impact of the terminated farm-out agreement and SEK
89 million (31) from reversed provisions. Other internal income and expenses pertains mainly to
services to other companies within the group.
Capital gain
As a result of the enforcement of the RBL security, Osbornes Resources Ltd´s balance sheet was
deconsolidated as per 31 March 2015. Group´s profit and loss on a row by row basis includes revenue
and expenses from Osborne for January to March. Further to the enforcement the RBL facility
including accrued interest is to be considered repaid in full and the transaction resulted in a net
capital gain of SEK 285 million (0).
Termination farm-out agreement
According to the terminated farm out agreements in 2014 of 70 percent interest in each of the Didon
field and the Zarat license to EnQuest, PA Resources reversed the remuneration retained in escrow
awaiting a letter of non-objection from the Tunisian authorities. Further to the termination PA
Resources included 70 percent of Zarat in its exploration and evaluation assets and 70 percent of
Didon in its Oil and gas assets. Didon was valuated to zero in accordance with made impairment
tests. Abandonment provision as well as deferred taxes was adjusted accordingly with respect to
both Didon and Zarat. Out of total amount below, SEK -168 million belongs to PA Resources AB.
Jan-Dec
SEK 000,000s 2014
Terminated upfront payment -180
Adjustment abandonment provision -259
Adjusted deferred taxes -372
Other -15
Total -826

PA RESOURCES ANNUAL REPORT 2015 38
NOTE 5 PRODUCTION COSTS
The parent company has no production costs.
Group
Jan-Dec Jan-Dec
SEK 000,000s 2015 2014
Cost of operations -178 -176
Direct production taxes -6 -10
Total production costs -184 -187
NOTE 6 G&A
Group Parent
Jan-Dec Jan-Dec Jan-Dec Jan-Dec
SEK 000,000s Notes 2015 2014 2015 2014
Other external expenses 7, 8, 9 -65 -51 -74 -30
Other internal expenses 7 - - - -1
Personnel expenses 10, 11 -75 -66 -10 -16
Depreciation machinery and equipment 16 -2 -1 - -
Impairment losses machinery and equipment 16 -3 - - -
Total general, administration and depreciation expenses
-145 -118 -84 -47
NOTE 7 OTHER EXPENSES
Group Parent
Jan-Dec Jan-Dec Jan-Dec Jan-Dec
SEK 000,000s 2015 2014 2015 2014
External consultants -81 -29
-68 -24
Rent & Office -14 -13
-5 -5
Travel expenses -2 -3
-1 -1
License related expenses -5 -22
- -1
Activated work - own account 44 28
- 1
Other internal expenses - -
- -1
Exchange gain/loss - -
- -
Other -8 -12 - -1
Total other expenses -65 -51 -74 -31
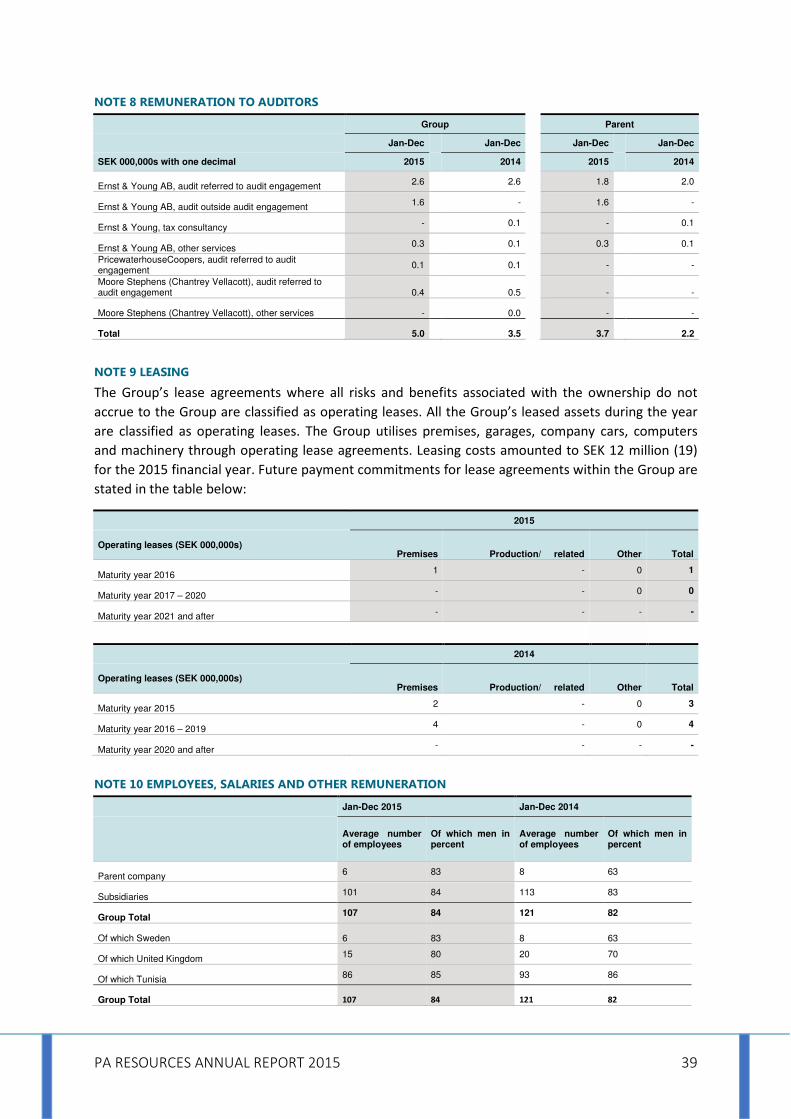
PA RESOURCES ANNUAL REPORT 2015 39
NOTE 8 REMUNERATION TO AUDITORS
Group Parent
Jan-Dec Jan-Dec Jan-Dec Jan-Dec
SEK 000,000s with one decimal 2015 2014 2015 2014
Ernst & Young AB, audit referred to audit engagement 2.6 2.6
1.8 2.0
Ernst & Young AB, audit outside audit engagement 1.6 -
1.6 -
Ernst & Young, tax consultancy - 0.1
- 0.1
Ernst & Young AB, other services 0.3 0.1
0.3 0.1
PricewaterhouseCoopers, audit referred to audit engagement
0.1 0.1
- -
Moore Stephens (Chantrey Vellacott), audit referred to audit engagement 0.4 0.5 - -
Moore Stephens (Chantrey Vellacott), other services - 0.0 - -
Total 5.0 3.5 3.7 2.2
NOTE 9 LEASING
The Group’s lease agreements where all risks and benefits associated with the ownership do not
accrue to the Group are classified as operating leases. All the Group’s leased assets during the year
are classified as operating leases. The Group utilises premises, garages, company cars, computers
and machinery through operating lease agreements. Leasing costs amounted to SEK 12 million (19)
for the 2015 financial year. Future payment commitments for lease agreements within the Group are
stated in the table below:
2015
Operating leases (SEK 000,000s) Premises Production/ related Other Total
Maturity year 2016 1 - 0 1
Maturity year 2017 – 2020 - - 0 0
Maturity year 2021 and after - - - -
2014
Operating leases (SEK 000,000s) Premises Production/ related Other Total
Maturity year 2015 2 - 0 3
Maturity year 2016 – 2019 4 - 0 4
Maturity year 2020 and after - - - -
NOTE 10 EMPLOYEES, SALARIES AND OTHER REMUNERATION
Jan-Dec 2015 Jan-Dec 2014
Average number of employees
Of which men in percent
Average number of employees
Of which men in percent
Parent company 6 83 8 63
Subsidiaries 101 84 113 83
Group Total 107 84 121 82
Of which Sweden 6 83 8 63
Of which United Kingdom 15 80 20 70
Of which Tunisia 86 85 93 86
Group Total 107 84 121 82
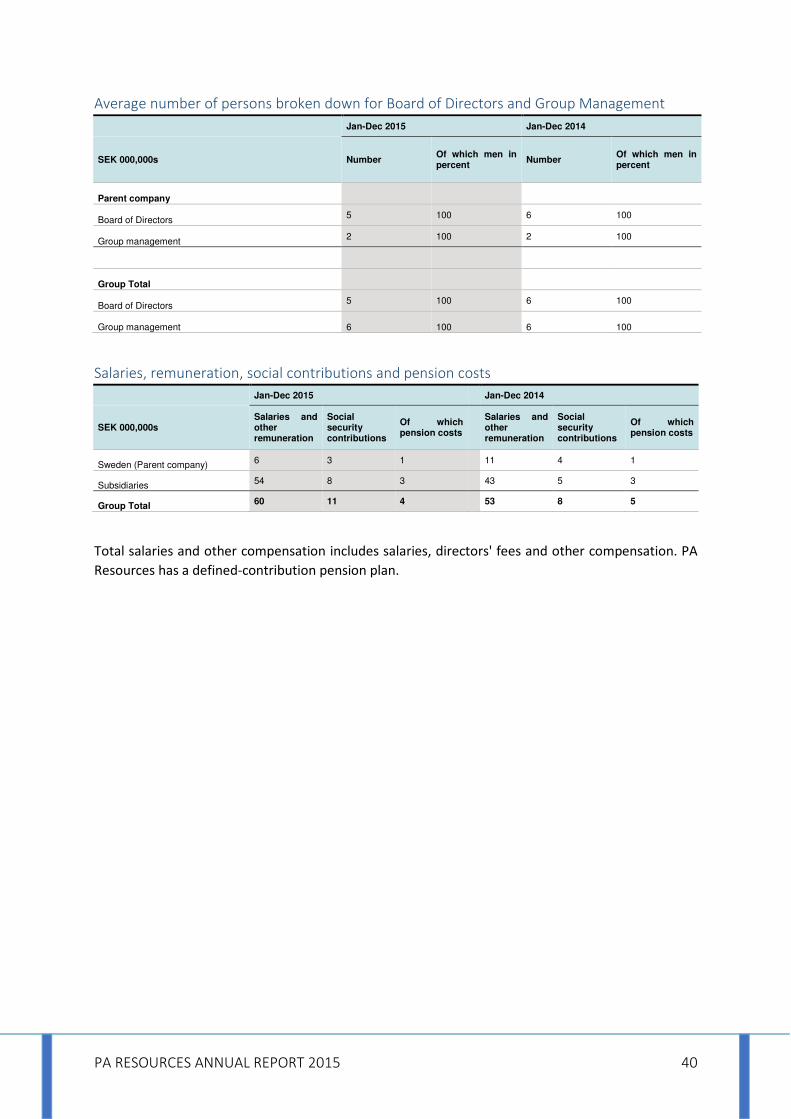
PA RESOURCES ANNUAL REPORT 2015 40
Average number of persons broken down for Board of Directors and Group Management
Jan-Dec 2015 Jan-Dec 2014
SEK 000,000s Number Of which men in percent
Number Of which men in percent
Parent company
Board of Directors 5 100 6 100
Group management 2 100 2 100
Group Total
Board of Directors 5 100 6 100
Group management 6 100 6 100
Salaries, remuneration, social contributions and pension costs
Jan-Dec 2015 Jan-Dec 2014
SEK 000,000s Salaries and other remuneration
Social security contributions
Of which pension costs
Salaries and other remuneration
Social security contributions
Of which pension costs
Sweden (Parent company) 6 3 1 11 4 1
Subsidiaries 54 8 3 43 5 3
Group Total 60 11 4 53 8 5
Total salaries and other compensation includes salaries, directors' fees and other compensation. PA
Resources has a defined-contribution pension plan.

PA RESOURCES ANNUAL REPORT 2015 41
NOTE 11 REMUNERATION AND OTHER BENEFITS; BOARD OF DIRECTORS OF THE PARENT COMPANY AND
SENIOR EXECUTIVES OF THE GROUP
Jan-Dec 2015
SEK 000,000s with one decimal Salary/
Board fees Remunerations Other benefits Pension costs
Other remunerations
Total
Jérôme Schurink (Former Chairman of the Board)
0.1 - -
- - 0.1
Nils Björkman (Board member) 0.1 -
- - - 0.1
Paul Waern (Chairman of the Board) 0.5
- - - - 0.5
Philippe Probst (Board member) 0.1
- - - - 0.1
Philippe Ziegler (Board member) 0.1
- - - - 0.1
Mark McAllister (President & CEO) 3.7 - 0.1 0.6 - 4.3
Other Group Management 14.3 - 0.2 1.5 0.1 16.2
Jan-Dec 2014
SEK 000,000s with one decimal Salary/
Board fees Remunerations Other benefits Pension costs
Other remunerations
Total
Sven A. Olsson (Former Chairman of the Board)
0.1 - -
- - 0.1
Jérôme Schurink (Chairman of the Board) 0.4 -
- - - 0.4
Nils Björkman (Board member) 0.3 -
- - - 0.3
Paul Waern (Board member) 0.3
- - - - 0.3
Philippe Probst (Board member) 0.3
- - - 0.0 0.3
Philippe Ziegler (Board member) 0.3
- - - - 0.3
Mark McAllister (President & CEO) 3.4 - 0.1 0.5 - 3.9
Other Group Management 12.9 - 0.2 1.4 4.2 18.8
The CEO had a base salary of GBP 0.3 million (0.3), approximately SEK 3.7 million, in 2015. Other
Group Management consists of five persons. All pension costs for CEO and the management team
are defined contribution based. Other benefits relates to company car benefits or compensation for
company cars.
The long term incentive programs introduced for 2014 was cancelled early 2015. No payments were
made under the program and there is no outstanding liability arising from this program. The short
term incentive program extended by the board in 2014 from 12 months to 18 months, i.e. to include
also the second quarter 2015, was cancelled as well in 2015. No payments were made under the
program and there is no outstanding liability arising from this program. At the Extra General Meeting
held 27 October 2015 it was decided to approve the Board´s proposal to introduce a Management
Incentive program. The incentive program is part of the reorganisation plan, presented to PA
Resources´ creditors and is also a presumption to conclude the reorganisation of the company.
Compensation to board members 2015 represent 75 percent of board fees as decided by the Annual
General Meeting 2015 and 25 percent of the fees decided by the Annual General Meeting 2014. The
CEO receives no board fee.

PA RESOURCES ANNUAL REPORT 2015 42
NOTE 12 FINANCIAL INCOME AND EXPENSES
Exchange gains and losses are reported net in the income statement for the Group and Parent
company. Other financial items within Total financial income for year 2015 are entirely attributable
to the recognised fair value of interest-bearing loans and borrowings and other liabilities in
connection with the composition plan.
Group Parent
Jan-Dec Jan-Dec Jan-Dec Jan-Dec
SEK 000,000s 2015 2014 2015 2014
Interest income 1 3 124 103
Exchange gains - - 29 324
Other financial items 2,061 0 1,909 34
Total financial income (net) 2,061 3 2,061 460
Interest expense -102 -256 -96 -236
Exchange losses -21 -87 - -
Other financial items -74 -25 -61 -61
Total financial expenses (net) -197 -368 -157 -297
Of the year´s total financial income in the Parent company, SEK 123 million (952) refers to income
from Group companies.
Of the year´s total financial expenses in the Parent company, SEK 0 million (580) refers to expenses
from Group companies.
NOTE 13 INCOME TAX
The tax charge for the years 2015 and 2014 pertains to the components reported in the tables below.
The tables also show deferred tax assets and liabilities as at 31 December 2015 and 2014. The Group
operates in a number of countries and tax systems that have different corporate tax rates to those in
Sweden. The corporate tax rates within the Group vary between 22 percent and 75 percent.
Group Parent
Jan-Dec Jan-Dec Jan-Dec Jan-Dec
Current income tax (SEK 000,000s) 2015 2014 2015 2014
Current income tax relating to:
Current income tax
Current income tax for the year -4 -92 - -
Adjustment of income tax prior year - 10 - -
-4 -82 - -
Deferred income tax
Origin and reversal of temporary differences 470 160 0 0
Adjustment of deferred income tax prior year 38 -3 - -
508 156 0 0
Total income tax reported in the income statement 504 74 0 0

PA RESOURCES ANNUAL REPORT 2015 43
Group Parent
Jan-Dec Jan-Dec Jan-Dec Jan-Dec
Reconciliation of effective income tax (SEK 000,000s) 2015 2014 2015 2014
Profit before tax 275 -3,032 1,139 -2,659
Income tax expense according to applicable tax rate 22.0 percent (22.0 percent) in Sweden
-61 667 -251 585
Adjustment for tax conditions and tax rates in other countries 335 446 - -
Tax effect Termination farm-out agreement Tunisia 17 -366 - -37
Non-deductible income statement items tax effect -16 -1,272 -263 -670
Non-taxable income statement items 108 1,251 - 82
Tax effect RBL enforcement 90 - 94 -
Tax effect Fair valuation debt 453 - 420
Temporary differences and deficiencies for which deferred income tax has not been accounted for
-339
-620 -
-
De-recognition deferred tax assets in prior year -122 -92 - -
Non-recognized deferred tax asstes on current year's loss - 53 - 40
Adjustment of income tax prior year 38 7 - -
Other 0 0 - -
Total income tax 504 74 0 0
Group balance
sheet Group income
statement
Parent balance sheet
Parent income statement
31 Dec 31 Dec Jan-Dec
Jan-Dec
31 Dec 31 Dec Jan-Dec
Jan-Dec
Deferred tax liabilities (net) (SEK 000,000s)
2015 2014 2015 2014
2015 2014 2015 2014
Deferred tax referred to participating interests in oil fields
- 535 453 200
- - - -
Deferred tax referred to oil sales 0
2 2 15
- - - -
Deferred tax referred to convertible bond - - - 0
- - - 0
Tax losses carry forward -15 -0 15 -81
- - - -
Deferred tax on other temporary differences
6 6 - 21
- - - -
Total deferred tax liabilities (net) -9 543
- -
Deferred tax income, net
470
156
-
-
0
Deferred tax expenses, net
Accumulated losses carried forward in the Group amounted to SEK 2,039 million (1,909), and in the
Parent company to SEK 320 million (736).

PA RESOURCES ANNUAL REPORT 2015 44
NOTE 14 EXPLORATION AND EVALUATION ASSETS AND OIL AND GAS PROPERTIES
Group Group
SEK 000,000s Exploration and
evaluation assets Oil and gas properties
Exploration and evaluation assets & Oil and gas
properties
At 1 January 2014 4,760 5,337 -
Investments 139 25 -
Termination farm-out agreement 15 2,589 -
Disposals -141 -3,790 -
Reclassifications -70 92 -
Exchange rate differences 913 1,061 -
At 31 December 2014 5,616 5,514 -
Investments - - 40
Disposals - - -1,320
Reclassifications -5,616 -5,514 11,130
Exchange rate differences - - 642
At 31 December 2015 - - 10,491
Depreciation, amortisation and write-downs
At 1 January 2014 -1,109 -4,643 -
Termination farm-out agreement - -2,589 -
Depreciation charge for the year - -195 -
Write-downs for the year -1,701 -290 -
Disposals 129 3,790 -
Reclassifications - -1 -
Exchange rate differences -424 -946 -
At 31 December 2014 -3,105 -4,872 -
Revaluation asset retirement obligations - - -546
Depreciation charge for the year - - -40
Write-downs for the year - - -1,969
Disposals - - 615
Reclassifications 3,105 4,872 -7,977
Exchange rate differences - - -434
At 31 December 2015 - - -10,352
Net book value:
At 31 December 2014 2,510 642 -
At 31 December 2015 - - 140
Following the decision to prepare the accounts without the assumption of a going concern PA
Resources values its exploration and evaluation assets and its oil and gas properties including
abandonment costs at the lowest of either carrying value or fair value less cost to sell (FVLCS), see
note 2 Accounting principles etc. Exploration and evaluation assets as well as oil and gas properties
have been combined into one category named exploration and evaluation assets & oil and gas
properties. Provision for abandonment earlier accounted for as provisions are, as a consequence of

PA RESOURCES ANNUAL REPORT 2015 45
not applying going concern, now included net in evaluation and exploration and evaluation assets &
oil and gas properties.
Assessed market valuation, see Note 16 Impairment testing exploration and evaluation assets & oil
and gas properties, impacted income statement with net SEK -1,969 million accounted for as
impairment losses.
The preceding year´s impairment losses in exploration and evaluation assets as well as in oil and gas
properties, totalling SEK 1,991 million was attributable to; impairment test due to significant fall in
current and expected oil prices of SEK 1,957 million. Other impairment losses recognised in 2014
totalling SEK 34 million pertain to the disposal of Q7/Q10a in the North Sea region of SEK 18 million
and to a write-down of SEK 16 million in the North Africa region.
In 2014 a receivable of SEK 22 million was reclassified from accounts receivable and other receivables
to exploration and evaluation assets. The accounting effect from the terminated farm-out agreement
in Tunisia was a net increase of SEK 2 million in exploration and evaluation assets and SEK 0 million in
oil and gas properties.
For more information, see Note 16 Impairment testing of exploration and evaluation assets & oil and
gas properties. During the year as well as for the preceding year no borrowing costs have been
capitalized. The Parent company has no exploration and evaluation and evaluation assets & oil and
gas properties.
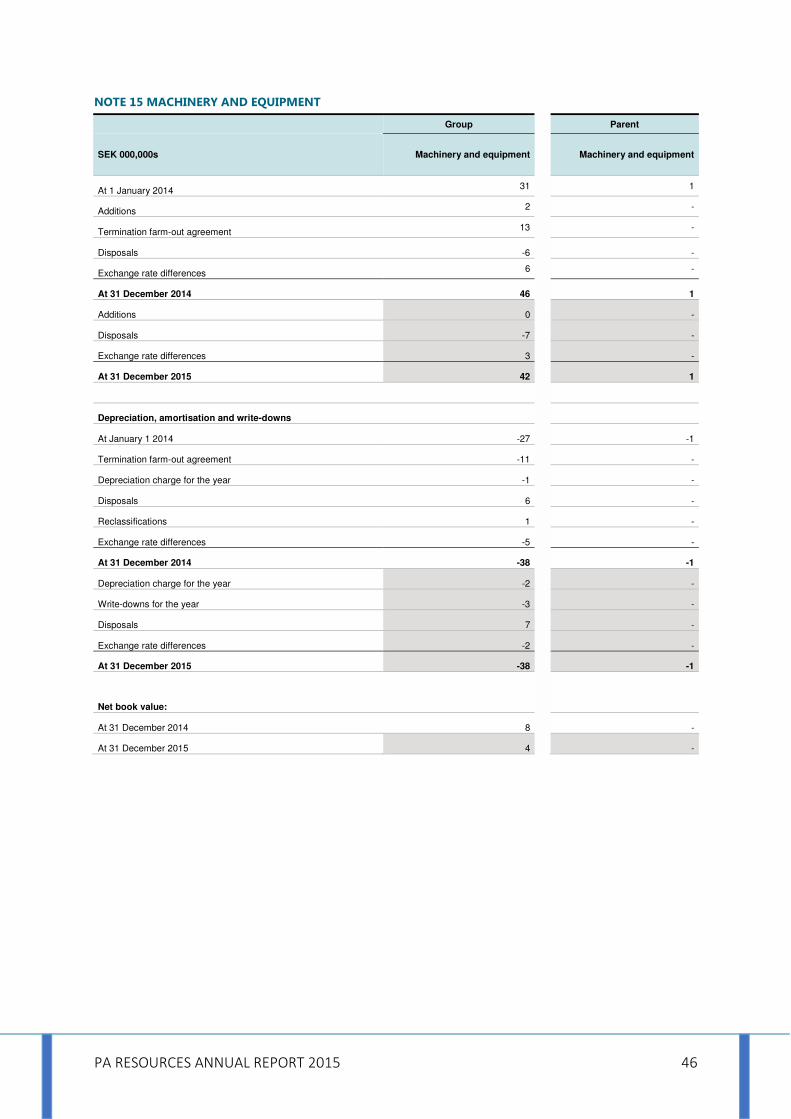
PA RESOURCES ANNUAL REPORT 2015 46
NOTE 15 MACHINERY AND EQUIPMENT
Group Parent
SEK 000,000s Machinery and equipment Machinery and equipment
At 1 January 2014 31 1
Additions 2 -
Termination farm-out agreement 13 -
Disposals -6 -
Exchange rate differences 6 -
At 31 December 2014 46 1
Additions 0 -
Disposals -7 -
Exchange rate differences 3 -
At 31 December 2015 42 1
Depreciation, amortisation and write-downs
At January 1 2014 -27 -1
Termination farm-out agreement -11 -
Depreciation charge for the year -1 -
Disposals 6 -
Reclassifications 1 -
Exchange rate differences -5 -
At 31 December 2014 -38 -1
Depreciation charge for the year -2 -
Write-downs for the year -3 -
Disposals 7 -
Exchange rate differences -2 -
At 31 December 2015 -38 -1
Net book value:
At 31 December 2014 8 -
At 31 December 2015 4 -

PA RESOURCES ANNUAL REPORT 2015 47
NOTE 16 IMPAIRMENT TESTING EXPLORATION AND EVALUATION ASSETS AND OIL AND GAS PROPERTIES
Financial year 2015 (Non-going concern)
Following the decision to prepare the accounts without the assumption of a going concern PA
Resources values its exploration and evaluation assets and its oil and gas properties including
abandonment costs at the lowest of either carrying value or fair value less cost to sell (FVLCS), see
note 2 Accounting principles etc. Exploration and evaluation assets as well as oil and gas properties
have been combined into one category named exploration and evaluation assets & oil and gas
properties. Provision for abandonment earlier accounted for as provisions are, as a consequence of
not applying going concern, now included net in evaluation and exploration and evaluation assets &
oil and gas properties.
Market valuation of the assets are based on sales values net of transaction costs and impacted
income statement with net SEK -1,969 million accounted for as impairment losses.
Financial year 2014 (Going concern)
The cash generating units correspond to licence rights, production sharing agreements or equivalents
owned by PA Resources. A cash generating unit thus usually corresponds to each acquired asset in
each country in which PA Resources carries on exploration and production operations.
A period of use from 2015 through 2044 has been utilised for assessment of the value-in-use per
cash generating unit.
The method of testing for impairment of assets in production is to calculate the present value of
future estimated cash flows which are compared to the book values. The main variables used are as
follows:
• Discount rate before tax, interval of 9.0%–11.0%
• Tax rate: 40%–75%
• Royalty rate: 2%–16%
• Oil price is expressed in the forward price curve for oil with an opening price of USD 55 per barrel
of oil, which thereafter increases to USD 68 per barrel of oil. From 2018 onwards, a 2.5% price
inflation is applied.
• Forecast period: Estimated cash flows based on management expectations for the period 2015-
2044.
Each of the company’s core assets are evaluated by applying the most current knowledge of
production profile estimates, operating cost profiles, investment costs and macroeconomic factors in
a Discounted Cash Flow model, taking in to account the fiscal terms of each individual licence. For
less mature assets, in certain cases, valuations are based on a price multiple for risked estimated
volumes in place.
Discounted cash flows or multiple valuations generate asset values that are put in relation to current
carrying amounts (book values), whereby an assessment is made whether any impairment is
required.
The assumptions used for both methods have been based partly on historical experience of previous
years’ impairment testing processes and partly on external sources in the form of technical data,
industry information, third party valuations, etc. The book values for exploration and evaluation

PA RESOURCES ANNUAL REPORT 2015 48
assets as well as oil and gas properties per operating segment for which impairment testing was
performed are shown below.
The large impairment needs are due to the revaluation of the Company’s assets based on a
significantly lower oil price outlook following the steep decline during the second half of 2014.
Exploration and evaluation assets as well as oil and gas properties per operating segment for
impairment testing
31 Dec 2014
SEK 000,000s North Africa
West Africa North Sea Other Total
Non-current assets for write-down assessment
2,734 1,878 531 - 5,143
Write-downs for the year -1,084 -819 -88 - -1,991
Total (net) 1,651 1,059 442 - 3,152
See Note 14, Exploration and evaluation assets and oil and gas properties, for information about
impairment losses for 2014. Impairment tests on other assets showed that the calculated value-in-
use per cash generating unit was higher than the book value.
NOTE 17 INVENTORIES
Group
SEK 000,000s 31 Dec 2015 31 Dec 2014
At 1 of January 41 15
Acquired on acquisition - 24
Purchase - -
Used in production - -1
Exchange differences -1 3
At 31 December before adjustment for obsolescence 40 41
Provisions for obsolescence - -4
At 31 December 40 37
The Parent company has no inventory.

PA RESOURCES ANNUAL REPORT 2015 49
NOTE 18 ACCOUNTS RECEIVABLE AND OTHER RECEIVABLES
Group Parent
SEK 000,000s 31 Dec 2015 31 Dec 2014 31 Dec 2015 31 Dec 2014
Accounts receivable non-interest bearing 4 32 - -
Receivables against other related parties 2 17 - -
Other current receivables 27 85 1 2
Prepaid insurance premium 4 0
- 0
Prepaid leasing fees - - - -
Prepaid rent 1 1 0 0
Accrued interest income - 1 - 1
Prepaid license costs 0 0 - -
Other prepaid expenses and accrued income 1 16 0 0
Accrued income over/- or underlift position 10 53 - -
Total accounts receivable and other receivables 50 205 1 4
Accounts receivable are not interest-bearing and are generally due for payment within 30–60 days.
Other receivables and accrued income are generally due in 15–90 days.
NOTE 19 INTEREST-BEARING LOANS AND BORROWINGS
As per 2 October, 2015 a qualified majority of the company’s creditors choose to support the
proposed composition plan put forward by PA Resources AB and the administrator at the
composition proceedings at the Stockholm District Court. Following the decision of the board to
prepare the Annual report in accordance with a non-going concern, PA Resources, effective 31
December, 2015 has derecognised its interest-bearing loans and borrowings accounted for at
amortised cost and thereafter recognised its interest-bearing loans and borrowings at fair value and
in accordance with the terms of the adopted composition plan. Total amount accounted for as
Current interest-bearing loans and borrowings in accordance with the composition plan, as per 31
December 2015, amounted to SEK 99 million. For more information, see Note 2 Accounting principles
etc.
Reorganisation notes
PA Resources reached during the second quarter an agreement with its major creditors to provide
the company with funding. The funding, which PA Resources secured during the reorganisation
enables the Group to borrow money through the issue of Reorganisation Notes for a principal
amount up to 15 MUSD in aggregate. The Reorganisation Notes have a subscription price of 50% of
their face value, which means that the maximum amount of funds that can be received is 7.5 MUSD.
The Reorganisation Notes are issuable in tranches, with the issue of each tranche being subject to
the satisfaction of certain conditions. As per 31 December 2015, Reoganisation Notes with an
aggregate principal amount of 10 MUSD have been issued. The Reorganisation Notes bear an interest
at a rate of 5% per year on its face value, compounded monthly. The Reorganisation Notes have
priority over PA Resources´ existing interest-bearing loans and borrowings.
Working capital facility
On 31 March 2014, PA Resources agreed with its main shareholder, Gunvor S.A., to interim financing
via a working capital facility of maximum USD 50 million. Per 31 December 2015, USD 28 million (28)
had been drawn on this facility. The Group has pledged the shares of one of its Tunisian subsidiaries,
in which some of the Group´s assets are held, as security for the facility.

PA RESOURCES ANNUAL REPORT 2015 50
Followed the agreed composition plan, the WCF security cash flow will be distributed as follows:
(i) amounts up to and including 10 MUSD: 25% goes to Gunvor and 75% goes to PA Resources for
further distribution according to the composition plan,
(ii) amounts in excess of 10 MUSD up to and including 28 MUSD: 100% goes to Gunvor,
(iii) amounts in excess of 28 MUSD: 100% goes to PA Resources for further distribution according to
the composition plan.
Also in accordance with the composition plan an interest rate shall be payable of 3% a year, as from
27 March 2015, until payment is made. According to the composition plan interest is subordinate to
the principal amount, i.e. interest is paid from Available cash flow after that the principal has been
paid in full. Outstanding claims for principal and accrued interest shall be converted to shares in PAR
no later than 27 December 2017.
Bond loans
PA Resources has two bond loans: NOK 675 million (675) nominal and SEK 750 million (750) nominal.
Both bonds are issued by the Parent company and both are unsecured. The NOK is not listed on any
exchange, whereas the SEK bond is listed on Nasdaq Stockholm, though delisted at 1 February 2016.
For more information see Note 28, Significant events after the closing date. Followed the agreed
composition plan interest shall be payable in accordance with the plan at a rate of 3% a year, as from
27 March 2015, until payment is made. According to the composition plan interest is subordinate to
the principal amount, i.e. interest is paid from Available cash flow after that the principal has been
paid in full. Outstanding claims for principal and accrued interest shall be converted to shares in PAR
no later than 27 December 2017. In accordance with the agreed composition plan all Financial
covenants earlier attached to both the SEK- and NOK bonds were removed.
Reserve based lending facility
As per 7 April Gunvor Group, PA Resources´ largest creditor and shareholder demanded repayment
of amounts due under the RBL facility. PA Resources also received notice that Gunvor Group had
taken action to enforce its security under the RBL, shares in its wholly-owned subsidiary, Osborne
Resources Ltd. Osborne owns interests in Equatorial Guinea, the producing Aseng and Alen fields,
and the Block I exploration interest. The effect of this enforcement action is that Osborne is no
longer a subsidiary of PA Resources and has become a subsidiary of Gunvor Group. For more
information, see Board of Director´s report.
Amortised interest-bearing loans and borrowings
During 2015 no interest-bearing loans and borrowings was amortised. During 2014 PA Resources
repaid the remaining SEK 93 million of the convertible bond loan. In addition, NOK 135 million was
amortised according to plan on an amortising bond loan with an original nominal value of NOK 900
million.
Overdraft facilities
Neither the Group nor the Parent company has any overdraft facilities as per 31 December 2015
(2014).

PA RESOURCES ANNUAL REPORT 2015 51
Current interest-bearing loans and borrowings as per 31 December 2014.
Group Parent
SEK 000,000s 31 Dec 2014 31 Dec 2014
Current Interest-bearing loans and borrowings
Bond 675 MNOK nominal 684 684
Bond 750 MSEK nominal 737 737
Working capital facility 28 MUSD 219 219
Reserved based lending facility 84.5 MUSD 660 391
Deferred interest payments 168 160
Total 2,468 2,191
NOTE 20 PROVISIONS
SEK 000,000s 1 jan 2015
Acquired Utilized Time
Value Paid
Exchange difference
Revaluated
Group as per 31 Dec
2015
Whereof short-
term
Whereof referred to
Parent company
Asset retirement obligation costs
535 - - 13 - -2 -546 - - -
Tax related provisions 118 - - - - 7 -38 87 - -
Other provisions 10 - - - - 1 0 11 1 -
Total 663 - - 13 - 5 -583 98 1 -
Asset retirement obligation costs
191 295 - 9 - 40 - 535 - -
Tax related provisions 51 - - - - 10 57 118 - -
Other provisions 10 - -1 - - 2 0 10 1 -
Total 252 295 -1 9 - 52 57 663 1 -
Asset retirement obligations
Asset retirement obligations are up to year-end 2014 reported as provisions based on the present
value of the costs which are expected to be required to fulfill the obligation, using the estimated cash
flows. The discount rate used takes into account the time value of money and the risk specifically
relating to the liability, as assessed by the market. Reported asset retirement obligations relate to the
Group’s oil and gas properties in region North and West Africa. Main part of the outflow for asset
retirement obligations is expected to occur in the first half of 2020. Acquired asset retirement
obligation for 2014 in the above table origins from the terminated farm out agreement.
Revaluated asset retirement obligation for 2015 entirely origins from a reclassification to exploration
and evaluation assets & oil and gas properties, as a consequence of not applying going concern. For
more information, see Note 2, Accounting principles etc.
Tax-related provisions
As at 31 December 2015, tax-related provisions amounted to SEK 87 million (118) and relate to
estimated income tax costs and tax surcharges attributable to subsidiaries in region North and West
Africa. The sum reserved was reported as an income tax expense in the income statement and as a
provision in the balance sheet.

PA RESOURCES ANNUAL REPORT 2015 52
NOTE 21 ACCOUNTS PAYABLE AND OTHER LIABILITIES
Group Parent
SEK 000,000s 31 Dec 2015 31 Dec 2014 31 Dec 2015 31 Dec 2014
Accounts payable non-interest bearing 9 100 4 1
Liabilities Group companies - - - 22
Liabilities against other related parties 12 8 - -
Other current liabilities 24 112 1 0
Accrued vacations pay 0 1
0 1
Accrued interest expenses 0 48 0 48
Accrued operating and drilling costs 53 46 - -
Other accrued expenses and prepaid income 12 262 19 7
Total accounts payable and other liabilities 111 578 24 79
Accounts payable and other short-term liabilities are not interest-bearing, have a short expected
term and are recognised at the nominal amount with no discounting. Accounts payable usually fall
due within 30 days and other short-term liabilities within a year.
NOTE 22 FINANCIAL INSTRUMENTS
Financial assets and liabilities by valuation category – Group
SEK 000,000s Loans end
receivables
Other financial liabilities
Financial liabilities at
fair value
Total carrying amount
Fair value Level
Fair value*
2015
Financial assets
Current assets
Other financial assets 1 - - 1 1 Level 3
Accounts receivable and other receivables 16 - - 16 16 **
Cash and cash equivalents 67 - - 67 67 **
Total 84 - - 84 84
Financial liabilities
Current liablities
Current interest bearings loans and liabilities - - 99 99 99 ***
Accounts payable and other liabilities - 74 - 74 74 **
Total - 74 99 173 173

PA RESOURCES ANNUAL REPORT 2015 53
Loans end receivables
Other financial liabilities
Financial liabilities at
fair value
Total carrying amount
Fair value Level
Fair value*
2014
Financial assets
Non-current assets
Other financial assets 1 - - 1 1 Level 3
Total 1 - - 1 1
Current assets
Accounts receivable and other receivables 102 - - 102 102 **
Cash and cash equivalents 148 - - 148 148 **
Total 250 - - 250 250
Financial liabilities
Non-current liabilities
Interest bearings loans and borrowings - - - - - Level 2
Other non-interest bearing liabilities - 30 - 30 30 **
Total - 30 - 30 30
Current liablities
Current interest bearings loans and liabilities - 2,468 - 2,468 1,441
Level 1/2
Accounts payable and other liabilities - 202 - 202 202 **
Total - 2,670 - 2,670 1,643
* For a definition of the levels in the fair value hierarchy that fair value is attributable to, see Note 2
Accounting principles etc, section ”Financial instruments, Fair value measurement.”
** For these items, book value is considered to approximate fair value.
*** Interest-bearing loans and borrowings are accounted for at fair value and in accordance with the
agreed composition plan, see Note 2 Accounting principles etc.
Financial assets comprise deposits for leased drilling equipment. Accounts receivable and receivables
from partners are not discounted due to their short term. Accrued interest income and accrued oil
income are also included. Cash and cash equivalents comprise liquid funds.
Non-current liabilities and current liabilities comprise long- and short-term interest-bearing loans and
borrowings. Accounts payable and payables to partners are not interest-bearing and are not
discounted due to their short term. Accrued interest expense and accrued exploitation and drilling
expenses are also included.
Valuation method for fair value
For 2014 fair value of the Group’s interest-bearing borrowings and loans was determined using DCF
method by using discount rate that reflects the issuers borrowing rate as at the end of the reporting
period. For 2015, see above.

PA RESOURCES ANNUAL REPORT 2015 54
Financial assets and liabilities by valuation category – Parent company
SEK 000,000s Loans end
receivables
Other financial liabilities
Financial liabilities at
fair value
Total carrying amount
Fair value Level
Fair value*
2015
Financial assets
Current assets
Receivables Group companies 98 - - 98 98 Level 3
Cash and cash equivalents 7 - - 7 7 **
Total 104 - - 104 104
Financial liabilities
Current liablities
Account payables - 4 - 4 4 **
Current interest bearings loans and liabilities - - 99 99 99 ***
Accrued expenses and prepaid oncome - 0 - 0 0 **
Total - 4 99 103 103
2014
Financial assets
Non-current assets
Receivables Group companies 808 - - 808 808 Level 3
Total 808 - - 808 808
Current assets
Prepaid expenses and accrued income 1 - - 1 1 **
Cash and cash equivalents 88 - - 88 88 **
Total 88 - - 88 88
Financial liabilities
Current liablities
Liabilities Group companies - 22 - 22 22 Level 3
Account payables - 1 - 1 1 **
Current interest bearings loans and liabilities - 2,191 - 2,191 1,164 Level 2
Accrued expenses and prepaid income - 48 - 48 48 **
Total - 2,262 - 2,262 1,235
* For a definition of the levels in the fair value hierarchy that fair value is attributable to, see Note 2,
Accounting policies, section ”Financial instruments, Fair value measurement.”
** For these items, the book value is considered to approximate fair value.
*** Interest-bearing loans and borrowings are accounted for at fair value and in accordance with the
agreed composition plan, see Note 2 Accounting principles etc.
Financial assets comprise interest-bearing receivables from Group companies. Receivables from
partners are not discounted due to their short term. Accrued interest income is also included. Cash
and cash equivalents comprise liquid funds.
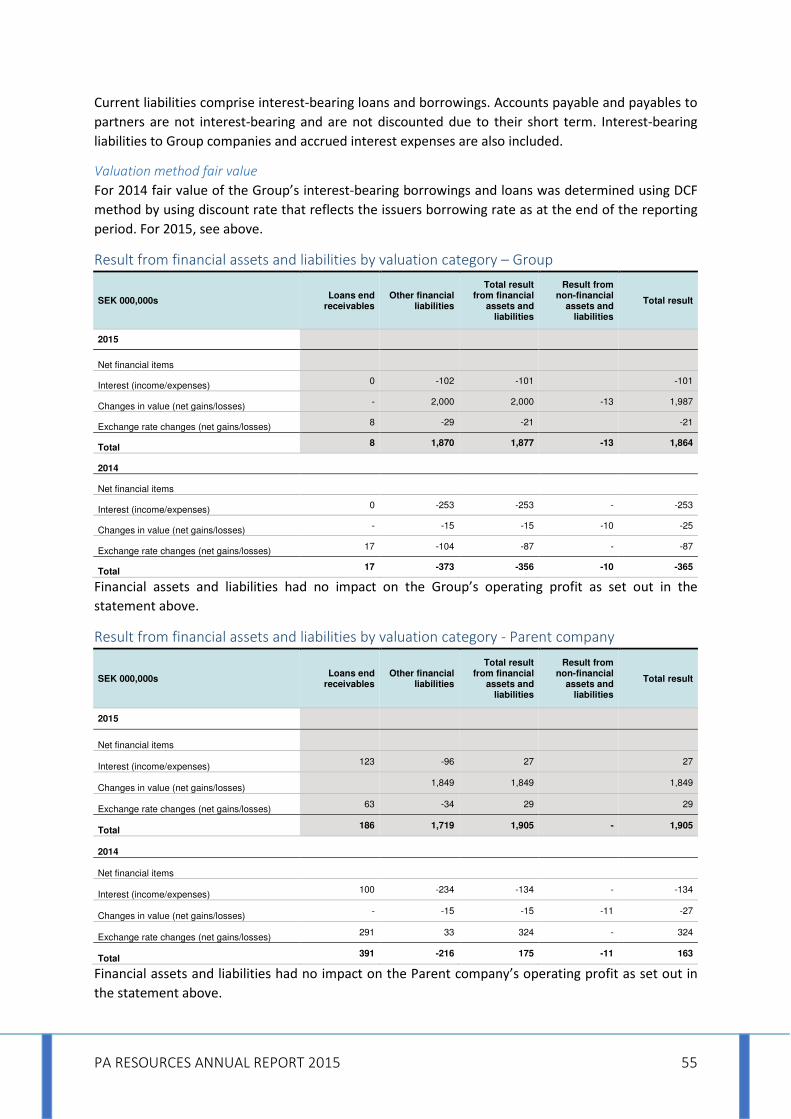
PA RESOURCES ANNUAL REPORT 2015 55
Current liabilities comprise interest-bearing loans and borrowings. Accounts payable and payables to
partners are not interest-bearing and are not discounted due to their short term. Interest-bearing
liabilities to Group companies and accrued interest expenses are also included.
Valuation method fair value
For 2014 fair value of the Group’s interest-bearing borrowings and loans was determined using DCF
method by using discount rate that reflects the issuers borrowing rate as at the end of the reporting
period. For 2015, see above.
Result from financial assets and liabilities by valuation category – Group
SEK 000,000s Loans end
receivables Other financial
liabilities
Total result from financial
assets and liabilities
Result from non-financial
assets and liabilities
Total result
2015
Net financial items
Interest (income/expenses) 0 -102 -101 -101
Changes in value (net gains/losses) - 2,000 2,000 -13 1,987
Exchange rate changes (net gains/losses) 8 -29 -21 -21
Total 8 1,870 1,877 -13 1,864
2014
Net financial items
Interest (income/expenses) 0 -253 -253 - -253
Changes in value (net gains/losses) - -15 -15 -10 -25
Exchange rate changes (net gains/losses) 17 -104 -87 - -87
Total 17 -373 -356 -10 -365
Financial assets and liabilities had no impact on the Group’s operating profit as set out in the
statement above.
Result from financial assets and liabilities by valuation category - Parent company
SEK 000,000s Loans end
receivables Other financial
liabilities
Total result from financial
assets and liabilities
Result from non-financial
assets and liabilities
Total result
2015
Net financial items
Interest (income/expenses) 123 -96 27 27
Changes in value (net gains/losses) 1,849 1,849 1,849
Exchange rate changes (net gains/losses) 63 -34 29 29
Total 186 1,719 1,905 - 1,905
2014
Net financial items
Interest (income/expenses) 100 -234 -134 - -134
Changes in value (net gains/losses) - -15 -15 -11 -27
Exchange rate changes (net gains/losses) 291 33 324 - 324
Total 391 -216 175 -11 163
Financial assets and liabilities had no impact on the Parent company’s operating profit as set out in
the statement above.

PA RESOURCES ANNUAL REPORT 2015 56
NOTE 23 SHARES IN SUBSIDIARIES
The Parent company’s shares in the respective segments/region are categorised below.
As a result of the enforcement of the RBL security, Osborne Resources Ltd´s balance sheet as well as
PA Resources AB´s shares in the company was deconsolidated as per 31 March 2015.
Subsidiary
Corporate identity number Domicile Legal entity Currency Share of equity
Book value in parent
company (SEK 000,000s)
Segment North Africa
Hydrocarbures Tunisie Didon Ltd
C61581 Malta Limited
company EUR 100 0
Hydrocarbures Tunisie El Bibane Ltd
54230F Jersey Limited
company GBP 100 0
Hydrocarbures Tunisie Corp 79423B Bahamas Limited
company USD 100 0
PA Resources Overseas Ltd 3,313,969 Great Britain Limited
company GBP 100 0
PA Resources Tunisia Pty Ltd
002410102 Australia Limited
company AUD 100
Segment West Africa
PA Energy Congo Ltd 1,015,422 Br. Virgin
Islands Limited
company USD 100 0
Pa Resources Congo Sa 09 B 846 Republic of
Congo Limited
company CFA 100
Segment North Sea
PA Resources Denmark ApS 31080037 Denmark Limited
company DKK 100 0
PA Resources UK Ltd 5152884 Great Britain Limited
company GBP 100 28
PA Resources North Sea Ltd
5470844 Great Britain Limited
company GBP 100
PA resources E&P Services LTD
07824915 Great Britain Limited
company GBP 100 0
Total 28
Parent company acquisitions in shares in subsidiaries.
Parent company acquisitions in shares in subsidiaries (SEK 000,000s)
At 1 January 2015 acquisition cost 241
Capital contribution -
Enforcement of RBL security -18
Impairment losses -195
Reversed impairment losses -
At 31 December 2015 acquisition cost 28

PA RESOURCES ANNUAL REPORT 2015 57
Note 24 Pledged assets and contingent liabilities
Group Parent
SEK 000,000s 31 Dec 2015 31 Dec 2014 31 Dec 2015 31 Dec 2014
Shares in subsidiaries 100 725 28 18
Total pledged assets 100 725 28 18
Total contingent liabilities - - - -
As per 31 December 2015, pledged assets amounted to SEK 100 million for the Group and SEK 28
million for the parent company. The decrease compared to year-end 2014 is associated with lower
assets values as a result of the changed valuation principles. The decrease is also related to the
enforcement of the RBL security and transfer of shares in Osborne Resources Ltd to Gunvor Group.
The contingent liability amounted to SEK 0 million for both Group and the parent company. Total
pledged assets and contingent liabilities for the Group and the parent company as per 31 December
2015 compared with 31 December 2014 is shown in the table above. Liabilities with pledged
collateral see Note 19, Interest-bearing loans and borrowings.
Note 25 Result from participations in Group companies
2015 the Parent company wrote down intra-Group receivables amounting to net SEK -955 million
and shares in subsidiaries of SEK -195 million as a result of market valuation in PA Resources´
Exploration and evaluation assets & Oil and gas properties. Result from participations in group
companies includes a capital gain of SEK 427 million from the enforcement of the RBL security.
During 2014 the Parent company wrote down intra-Group receivables amounting to SEK 1,125
million and shares in subsidiaries of SEK 1,730 million mainly due to the impairment loss from the
significant fall in oil prices and the terminated farm out agreement in Tunisia. The Parent company
received dividend from subsidiaries totalling SEK 232 million.
Parent
Jan-Dec Jan-Dec
SEK 000,000s 2015 2014
Impairment losses Intercompany receivables -955 -1,125
Impairment losses participations in Group companies -195 -1,730
Dividend received -
232
Enforcement RBL security 427 -
Result from participations in Group companies -723 -2,623

PA RESOURCES ANNUAL REPORT 2015 58
NOTE 26 FINANCIAL RISK
In its operations, PA Resources is exposed to various types of financial risk. Financial risk arises when
refinancing and credit risks as well as changes in interest rates and exchange rates affect the Group’s
operating profit, cash flow and value. Financial risk is managed and controlled in accordance with the
strategy adopted by the company’s Board of Directors.
Financing and Liquidity risk
PA Resources’ operations require funding for maintenance, development and exploration of the
Group’s licenses and assets. Refinancing risk is defined as the risk that financing or refinancing is
troublesome or costly to secure. At the start of 2015 PA Resources was unable to service its debts
and as a result came to an agreement with its creditors to defer payments while exploring
refinancing options. The failure to reach a refinancing solution resulted in the board of directors
applying for financial reorganisation. The Group’s total outstanding interest-bearing loans and
borrowings amounted to SEK 99 million (2,468) on 31 December 2015. For more information, see
Note 19, Interest-bearing loans and borrowings.
Fall due profile on PA Resources Group financial liabilities
31 Dec 2015 31 Dec 2014
SEK 000,000s < 1 year 1-2 years 2-5 years >5 years < 1 year 1-2 years 2-5 years >5 years
Interest-bearing loans and borrowings 99 - - - 1,434 1,394 - -
Accounts payable and other liabilities 111 - - - 100 - - -
Total 210 - - - 1,534 1,394 - -
The table above shows for current period values recognised at fair value and in accordance with the
composition plan. For previous period the table shows future undiscounted cash flows. The variable
interest rate on liabilities are as per 31 December 2014 are assumed until maturity.
Non-going concern
Effective December 31, 2015 the board of PA Resources adopted the assumption of a non-going
concern in preparing the Annual report. The decision was based on the absence of agreed financing
for 2016 and beyond, for. For more information, see Note 2, Accounting principles etc.
Oil price risk
The price of oil and gas is set in the world market and to a significant extent is dependent on various
factors that the Group is unable to affect. Oil and gas prices have fluctuated substantially over the
last few years and many indicators point to continuing volatility in the future. In 2015, PA Resources
conducted no hedging of its production and, at year-end, PA Resources held no financial derivatives
for hedging oil prices. Under the assumption of constant 2015 production, 613 (1,147) kbbl and that
the average USD/SEK exchange rate for the year of 8.44 (6.86) remains the same, a movement in the
oil price of USD 10 per barrel has a positive/negative effect on the Group’s revenues of SEK 52 million
(79).
Interest rate risk
Interest rate risk is the risk of market interest rates moving in such a manner that PA Resources’ net
interest expense is negatively affected. The effect of a change in interest rates on the Group’s
operating profit depends on the loans and the investments fixed term and on the proportions of
variable and fixed interest rates. Normally, the interest rates of interest-bearing liabilities vary from
fixed interest to 3-month interest rates. Followed the agreement with creditors to defer payments

PA RESOURCES ANNUAL REPORT 2015 59
including interest as well as the approved and adopted composition plan, no interests have been
paid during the 2015.
Foreign currency risk
PA Resources is exposed to fluctuations in the foreign exchange markets, as fluctuations in exchange
rates can negatively affect operating profit, cash flow and equity. The majority of PA Resources’
assets are attributable to international oil and gas discoveries valued in USD and which generate
revenues in USD. The Group can hedge these assets naturally by borrowing in USD. The Group has
not utilized any currency swap contracts in current or previous year.
Transaction risk
Transaction exposure arises in cash flow when invoicing or the costs of invoiced goods and services
are not in local currency. The majority of PA Resources’ revenues and expenses are in USD - the
former from the sale of oil and gas in the international market, and the latter through operating
costs, rental costs, etc. Discrepancies - mainly pertaining to costs in local currencies in the Group’s
subsidiaries - affect the Group’s operating profit. Expected or budgeted flows are not hedged at
present.
Translation risk
Exchange rate changes affect PA Resources in conjunction with the translation of the income
statements of foreign subsidiaries to SEK, as the Group’s operating profit is affected and when net
assets in foreign subsidiaries are translated to SEK which can negatively affect the Group’s equity. PA
Resources does not hedge its translation exposure, and fluctuating foreign exchange rates could
negatively affect the operating profit and financial position of the Group.
Credit risk
Credit risks in financial operations
Credit risk exposure arises from the investment of cash and cash equivalents and from counterparty
risk attributable to trading in derivatives. PA Resources strives to establish ISDA agreements with its
counterparties in transactions with derivatives, which means that if a counterparty enters into
liquidation, liabilities are offset against assets. At the balance sheet date, 31 December 2015, cash
and cash equivalents and financial investments amounted to SEK 67 million (148).
Credit risks in operations
PA Resources is also exposed to the risk of not receiving payment from customers for deliveries of oil
and gas. The Group normally delivers oil in large quantities in liftings, whereby a tanker load,
depending on the oilfield, corresponding to between 60,000 and 950,000 barrels, is delivered against
payment within 15–45 days. These deliveries are made only to a small number of recognised
creditworthy parties, primarily major international oil and gas companies and traders. The Group’s
deliveries are governed by annual contracts, and Group policy is to check the creditworthiness of all
customers who wish to do business on credit. In addition, receivable balances are monitored on an
ongoing basis, with the result that the Group’s exposure to bad debts is minor. In past years the
Group has had only very few minor bad debt losses, and had none whatsoever during the past year.
Given its customer structure and past experience, the Group has assessed that credit insurance need
not be taken out.

PA RESOURCES ANNUAL REPORT 2015 60
Below is an analysis of the Group’s total outstanding accounts receivable and other receivables over
time as per balance sheet date, along with provisions for bad debts. As at 31 December 2015, total
provisions for bad debts amounted to SEK 1 million (1).
Group
SEK 000,000s 2015 2014
Receivables past due but not recognised as impairment losses:
Total exposure Fair value
Total exposure
Fair value
Not overdue 45 45 204 204
past due < 30 days 0 0 - -
past due 30 - 60 days 1 1 0 0
past due 60 - 90 days 3 3 - -
past due 90 - 120 days - - - -
past due > 120 days 1 1 1 1
Total 50 50 205 205
Group
Provisions for bad debts (SEK 000,000s) 2015 2014
Ingoing balance amount as per 1 January -1 -1
Reversed provisions 0 -
Exchange differences -0 0
Total provisions as per 31 December -1 -1
NOTE 27 RELATED PARTY DISCLOSURE
Transactions entered into between the Group, independently of one another, and related parties “at
arm’s length” are described below:
Related party transactions between the Parent company PA Resources AB and its subsidiaries and
between the subsidiaries themselves relate both to third party costs which are invoiced on in full
without any surcharge and to general costs and payroll costs in the home country which are invoiced
on the basis of established Transfer Pricing Agreements within the Group. Investments in subsidiaries
are primarily financed via external borrowing by the Parent company. Outstanding loans between
the Parent company and subsidiaries are regulated on the basis of established Transfer Pricing
Agreements and loan agreements within the Group. For information on the Group companies and
the Parent company’s shareholding in subsidiaries refer to Note 23, Shares in subsidiaries.
Gunvor Group´s ownership in PA Resources was 29.7 percent as per 31 December 2015. The
company serves as an off-taker of crude oil and PA Resources has a Working capital facility with the
company, see note 19, Interest-bearing loans and borrowings. The trading of crude oil and the terms
of the Working capital facility is in accordance with market conditions.
During the financial year the usual directors’ fees as resolved by the Annual General Meeting were
paid to the Board. In addition, Board members were reimbursed for expenses. For further
information on salaries, directors’ fees, pension expenses, sharebased remuneration and other
benefits to related parties refer to Note 11, Remuneration and other benefits: Board of Directors and
senior executives of the Parent company.

PA RESOURCES ANNUAL REPORT 2015 61
NOTE 28 SIGNIFICANT EVENTS AFTER THE CLOSING DATE
PA Resources delist its share
PA Resources share´s last day of trading at Nasdaq Stockholm was 15 January 2016. The decision
notified by Nasdaq was based on PA Resources application to delist submitted 20 November 2015.
PA Resources delist its SEK denominated bond
PA Resources SEK denominated bond´s last day of trading at Nasdaq Stockholm was 1 February 2016.
The decision notified by Nasdaq was based on PA Resources application to delist submitted 25
January 2016.
Drilling Results on Baobab Marine-1 Well at Mer Profonde Sud
During February 2016 final results came from the Baobab Marine-1 commitment well drilled in the
Mer Profonde Sud Block offshore the Republic of Congo. Although good quality sands were present,
no hydrocarbons were encountered, suggesting lack of communication with the known oil source.
PA Resources divests its North Sea portfolio
As per 5 February 2016 PA Resources signed an agreement with Petrogas E&P regarding the sale of
its affiliates PA Resources UK Ltd and PA Resources Denmark ApS including the Danish license 12/06
which holds the Broder Tuck and Lille John discoveries, as well as its exploration licences in the UK,
Germany and the Netherlands. PA Resources completed the transaction with Petrogas E&P
announced as per 24 March 2016 and payment for the transaction has been received. Included in the
transaction is also a highly uncertain and contingent consideration based on future oilprice
development. The consideration is not included in the 2015 valuation of PA Resources' net assets.
PA Resources divests its North Africa portfolio
As per 9 May 2016 PA Resources AB announced that its wholly owned subsidiaries, PA Resources
Tunisia Limited, Hydrocarbures Tunisie Didon Limited, Hydrocarbures Didon Jersey Limited and
Hydrocarbures Tunisie Corporation, executed a sale and purchase agreement with ETAP, The
Tunisian national oil company, to sell their entire licence interests onshore and offshore Tunisia, to
ETAP. The transaction is expected to complete within the next month.
Use of proceeds from divested assets
Followed above divestments PA Resources will have no assets left. The proceeds from the sale will be
used to repay creditors in accordance with the reorganisation plan adopted in October 2015. As per
release date of this annual report category B** has been repaid in full while category A* has agreed
to delay part of payment until completion of the North Africa transaction, but is expected to
ultimately receive full payment. Category C *** are expected to receive a significantly lower
proportion than its nominal values. The liabilities are thus recognised at the values expected to be
paid. Given that the transaction in North Africa completes there will also be sufficient funds to
implement the solvent wind down, which given above is the Board´s intention to suggest for the
shareholders.
* Category A (Reorganisation notes) is described in detail in section 8.4.3.1 and 6.7 of the Reorganisation Plan.
** Category B (Creditors with principal claims below 100 000 SEK as well as above 100 000 SEK without specific agreement) is described in
detail in sections 8.4.3.1, 8.2 and 8.3 of the Reorganisation Plan. Category B does not include bondholders as explained in section 6.4.
*** Category C (Creditors above 100 000 SEK with specific agreements) is described in detail in section 8.4 in the Reorganisation plan.

PA RESOURCES ANNUAL REPORT 2015 62
BOARD ASSURANCE The Board of Directors and President & CEO declare that the consolidated financial statements have
been prepared in accordance with International Financial Reporting Standards (IFRS), as adopted by
the EU, and give a true and fair view of the Group’s financial position and results of operations. The
Annual Report has been prepared in accordance with generally accepted accounting principles and
gives a true and fair view of the Parent company’s financial position and results of operations. The
statutory Administration Report of the Group and the Parent company provides a fair review of the
Group’s and the Parent company’s operations, financial position and results of operations and
describes material risks and uncertainties facing the Parent company and the companies included in
the Group.
Stockholm 9 June 2016
Paul Waern
Chairman of the Board
Catharina Nystedt-Ringborg Mark McAllister
Board member President & CEO
Our audit opinion, which was issued on June 9, 2016, is modified.
We have neither recommended nor not recommended that the income statement and balance sheet
for the parent company and the group are adopted.
Ernst & Young AB
Björn Ohlsson
Authorised Public Accountant

PA RESOURCES ANNUAL REPORT 2015 63
AUDITOR´S REPORT