Embed Size (px)
DESCRIPTION
p.76 3/31: Chapter 15, 16 Cover Page. Big Idea: 15 : Key Concepts 2. Big Idea: 16: Key Concepts 1. 2. 3. QUIZ. Ch. 15,16,8. p.77 3/31: Chapter 15, 16 & 8: Calendar. p.78 3/31: Video Facts. List 5 different relationships between organisms described in video: - PowerPoint PPT Presentation
Citation preview

Presentation Slide # 1
p.763/31: Chapter 15, 16 Cover Page
Big Idea: 15:
Key Concepts
2.
Big Idea: 16:
Key Concepts
1.
2.
3.

Presentation Slide # 2
p.773/31: Chapter 15, 16 & 8: Calendar
Mon. Tues. Wed. Thurs. Fri.
31 Doyle
p. 76-77,81
Cover and vocab
1 Sedey
p. 78-80
p. 1-4 Plant Controlled Experiment
2 Doyle
p. 83-84
Notes 15-2
S-R 15-2
3 Sedey
p. 82, 85
5 Quiz Questions
Lab: Good Buddies
4 Doyle
p. 86-87
Notes 16-1
7 Sedey
p. 1-4
Lab Report: Plants
8 Doyle
p. 90-91
Notes-16-3
9 Sedey
p. 88-89 Notes 16-2
Lab: Share Resources
Lab Report Plant Data
10 Doyle
p.93Notes 8.1-3
11 Sedey
p. 92
Quiz Review
Plant Data
14 Doyle 15 SedeyWork on Plant Lab Report
p. 94-95“Find Nemo
Plant Data
16 DoyleWork on Plant Lab Report
17 Sedey
p. 96-97Chapter 8 Investigation
Finish Nemo
Plant Data
18 DoyleWork on Plant Lab Report
21 Sedey
p. 98
Wolf Pack
p. 99-101
Debate
Plant Data
22 DoyleWork on Plant Lab Report
23 Sedey
p. 99-101
Debate
Plant Data
24 Doyle
???
25
NO SCHOOL
Ch. 15,16,8

Presentation Slide # 3
p.783/31: Video Facts
List 5 different relationships between organisms described in video:
_____________ + _____________ = ____________
_____________ + _____________ = ____________
_____________ + _____________ = ____________
_____________ + _____________ = ____________
_____________ + _____________ = ____________

Presentation Slide # 4
p.793/31: Final Exam Results

Presentation Slide # 5
p.804/1: CD Cover Design
Design a CD cover that describes/uses the 8 vocabulary words on p. 93

Presentation Slide # 6
p.814/1: Vocabulary 15-2
Word (+,√,-) Definition
___ Predator
___ Prey
__ Competition
___ Cooperation
___ Symbiosis
___ Mutualism
___ Commensalism
___ Parasitism
An animal that eats another
The struggle between individuals or different populations for a limited resource
An interaction in which organisms work in a way that benefits them all
Close relationship between individuals of two different species
An interaction between two species that benefits both
A relationships between two species in which on species benefits while the other is not affected
Relationship between two species in which one species benefits and the other is harmed
An animal that is eaten by a predator

Presentation Slide # 7
p.824/2: Good Buddies Information
1. Organisms in your pair:
2. Why do they live together?
3. What advantage/disadvantage do they provide to one another?
4. What would happen if one buddy was not there?
5. What type of symbiotic relationship do your organisms have?

Presentation Slide # 8
p.834/2: Notes 15-2
1. Predator/prey:
Ex: Wolf eating deer (Prey on sick or injured)
2. Competition:
Ex: Plant complete for light, water and soil
3. Cooperation:
Ex: Killer whales cooperate when they hunt
4. Mutualism: (+, +)
Ex: Bees use nectar, flower is pollinated
5. Commensalism: (+, 0)
Ex: Moss grows on the trunk of a tree to get more light, tree is not affected.
6. Parasitism: (+, -)
Ex: Tapeworm lives inside human, Human does not get nutrients needed to survive.

Presentation Slide # 9
p.844/3: Section Review 15-2 p. 525 (#1-6)
1. Name two ways in which members of the same species interact.
2. In what ways do members of different species interact?
3. Give an example of each type of symbiotic relationship.
Mutualism:
Commensalism:Parasitism:
4. Give an example of how one population has affected another.
5. Explain how symbiotic relationships are similar to and different from predator-prey.

Presentation Slide # 10
• 1.
• 2.
• 3.
• 4.
• 5.
p.85: 4/3 Write 5 questions from Sec. 15.2 that could be used on a clicker quiz.

Presentation Slide # 11
p.864/7: SR 16-1 (#1)
1. Identify four pressures placed on an ecosystem by an increasing human population.
1.
2.
3.
4.

Presentation Slide # 12
p.874/7: Notes 16-1
Human Population is growing and it causes:
1. Pressures of waste disposal
2. Pressures on resources:• Water, food, wood, stone, metal and minerals• 3% of Earth’s water is freshwater, 2/3 is ice • 1/5 of the population uses more than ½ of the
world’s resources
3. Pressures on Urban Growth:• High population density increases pressure• Large number of people in an area changes
the landscape.
4. Pressures of Expanding land Use:• Suburban Development: Building homes,
malls & new roads in areas around cities.• Natural Habitats are destroyed• Loss of productive farmland (less food
produced locally)• Increases the need for cars which decreases
air quality

Presentation Slide # 13
p.884/8: Explore: Sharing Resources/ Acrostic Activity
What did you think?• Did you get a fair share of your group’s objects?
• How does the number of people in each group affect the outcome?
• Was the job made easier when trading occurred across groups?
B
I
O
D
I
V
E
R
S
I
T
Y

Presentation Slide # 14
p.894/8: Notes 16-2
Renewable: Can be used over again.• Ex: Trees, Energy from sunlight, water
Nonrenewable: Can not be replaced• Ex: coal & natural gas (fossil fuels)
Pollutant: • Makes air, water, land harmful for life.
Biodiversity:• Variety of life is destroyed by pollution
1. Air Quality:• Motor Vehicles, factories power plants, cid
Rain
2. Water Quality:• Chemicals drain off from farms and landfills
3. Removing Habitat• Deforestation
4. Changing the Habitat• Invasive Species: New species that competes
with native species for resources

Presentation Slide # 15
p.904/9: Create a study guide for upcoming quiz covering 15.2, 16.1, 16.2, and 16.3

Presentation Slide # 16
p.914/9: Notes 16-3
Conservation: The process of saving or protecting a natural resource
1. Local Efforts:
– Taking action in your own community
2. Federal Efforts
– Clean Air Act, Endangered Species Act
– Government works with scientists to write laws
3. Sustainable Practices
– Conservation Tillage: Cuts soil erosion
– Cutting Selectively: Reduces erosion and encourages rapid re-growth
– Geothermal Power: Uses heat of molten rock in Earth’s interior
– Hydropower: From Falling water
– Wind: Energy of moving air into electricity
– Solar Energy: Used to generate electricity
4. Reducing Waste and Pollution
– Carpooling
– Home: Thermostat, insulation
– Recycling
Presentation Slide # 17
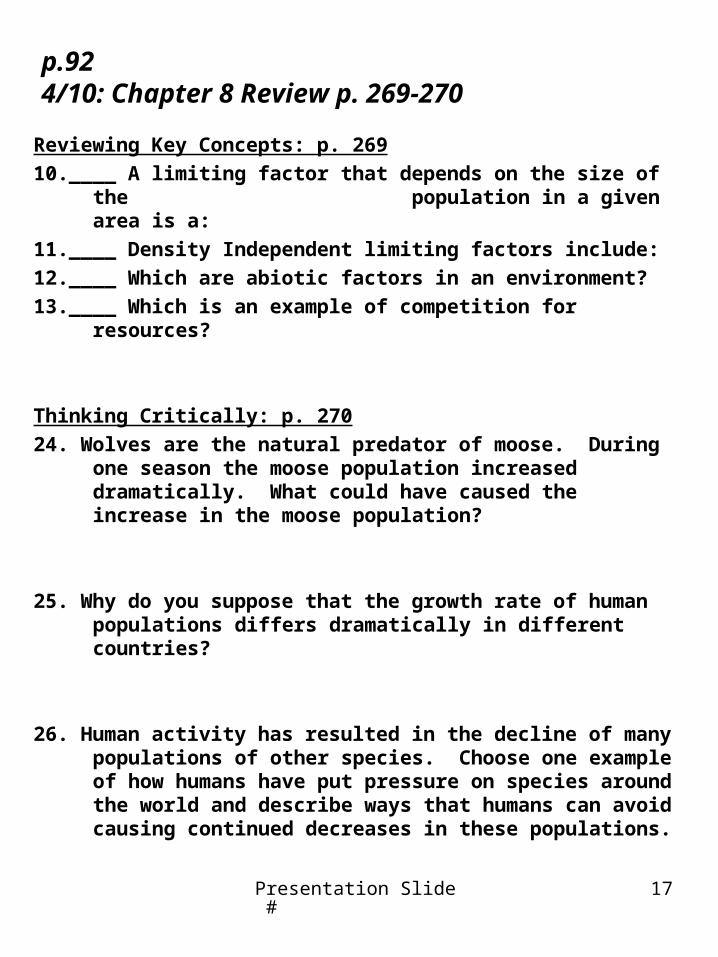
p.924/10: Chapter 8 Review p. 269-270
Reviewing Key Concepts: p. 269
10.____ A limiting factor that depends on the size of the population in a given area is a:
11.____ Density Independent limiting factors include:
12.____ Which are abiotic factors in an environment?
13.____ Which is an example of competition for resources?
Thinking Critically: p. 270
24. Wolves are the natural predator of moose. During one season the moose population increased dramatically. What could have caused the increase in the moose population?
25. Why do you suppose that the growth rate of human populations differs dramatically in different countries?
26. Human activity has resulted in the decline of many populations of other species. Choose one example of how humans have put pressure on species around the world and describe ways that humans can avoid causing continued decreases in these populations.
Presentation Slide # 18
p.934/10: Notes Chapter 8
Limiting Factors:
The factor that prevents the continuing growth of a population in an ecosystem
1. Density Dependent: Ex: Competition, disease
2. Density Independent: Ex: weather, fire
Human Populations are growing because:
– Able to expand habitat to many climates
– Technology
– Availability of resources
– Lack of predators
– Survival of offspring to reproduce
Human Population growth affects the environment
– Introduction of New Species
Ex: Zebra Mussels in MN lakes
– Pollution
Ex: Waste from factories, farming
– Over-fishing
Ex: Lobster & Tuna numbers are low
– Habitat Destruction
Ex: Deforestation, Draining wetlands

Presentation Slide # 19
p.944/14-4/18: Finding Nemo Video Guide
1. List 2 biotic and abiotic factors of a coral reef ecosystem?Biotic Abiotic
______________ ______________ ______________ ______________
2. Give an example of a population from a coral reef ecosystem. ______________ 3. What vocabulary word describes all of the biotic and abiotic factors that make up where Marlin and Nemo live? ______________
4. Give an example of each of the following types of relationships:
Predator/Prey __________________________Commensalism _________________________Competition ____________________________
5. Identify some limiting factors that could affect the ecosystem where Marlin and Nemo live. ___________________________ ___________________________ ___________________________

Presentation Slide # 20
p.954/14-4/18: Nemo
7. Construct a food chain using at least three different organisms from the movie.
6. What is the habitat and niche of this Angler Fish? __________________________ __________________________ __________________________
8. What would happen if the sea level dropped and exposed the coral reef where Nemo lives? _____________________________________ _____________________________________
9. List three different movie characters and their most important adaptation.
Character Adaptation ____________ ____________ ____________ ____________ ____________ ____________

Presentation Slide # 21
p.964/18: Chapter Investigation
Conclude:
1. What effects does increasing human population growth have on forests?
2. Was the forest always shrinking?
3. How does this investigation help you to answer your questions about resource management?
4. What aspects of this investigation fail to model the natural habitat?
5. What other renewable resources need sustainable management?

Presentation Slide # 22
p.974/18: Chapter Investigation
Question: How can people meet the ongoing human demand for wood without using all the trees?
Observe and analyze:
Min Start New Harvest End
1 120 +4 -1
2 +4 -2
3 +4 -4
4 +4 -8
5 +4 -16
6 +4 -32
7 +4 -64
Presentation Slide # 23
p.984/21: Wolf Pack Activity
My Wolf Pack’s Survival Percent: __________
Limiting Factors that affect Wolf Populations
1.
2.
3.
4.
5.
Pressures that human populations have placed on wolf populations:
1.
2.
3.
4.
5.

Presentation Slide # 24
p.994/21: Ecology Debate Information

Presentation Slide # 25
p.1004/22-4/23: Ecology Debate
Presentation Slide # 26
p.1014/22-4/23: Ecology Debate
Presentation Slide # 27
Background Information:
Purpose:
Hypothesis:
p.1 Plant Experiment

Presentation Slide # 28
Variable:All constants:
All Materials:
Procedure:
p. 2 Plant Experiment

Presentation Slide # 29
p. 3 Plant Experiment
Data Collection
DateControl Variable
NotesLength Mass Length Mass
4/7
4/9
4/11
4/14
4/16
4/18
4/21
4/23

Presentation Slide # 30
p. 4 Plant Experiment
Conclusion:


![MARINE ROLLER SHUTTER DOOR TECHNICAL SPECIFICATIONS · MARINE ROLLER SHUTTER DOOR Parosha international BV t +31 [0] 58 76 76 290 f +31 [0] 6 53 14 83 43 e info@parosha.com i TECHNICAL](https://img.pdfslide.us/doc/110x75/5f6e5fdba6631c549c2dcc79/marine-roller-shutter-door-technical-marine-roller-shutter-door-parosha-international.jpg)