Embed Size (px)
Citation preview

Centre Number Candidate Number
Write your name hereSurname Other names
Total Marks
Turn over
Paper Reference
P44788A©2015 Pearson Education Ltd.
6/6/6/
*P44788A0120*
Mathematics BUnit 1: Statistics and Probability (Calculator)
Higher Tier
Thursday 21 May 2015 – MorningTime: 1 hour 15 minutes 5MB1H/01
You must have: Ruler graduated in centimetres and millimetres, protractor, pair of compasses, pen, HB pencil, eraser, calculator. Tracing paper may be used.
Instructions Use black ink or ball-point pen. Fill in the boxes at the top of this page with your name,
centre number and candidate number. Answer all questions. Answer the questions in the spaces provided
– there may be more space than you need. Calculators may be used.
If your calculator does not have a button, take the value of to be 3.142 unless the question instructs otherwise.
Information The total mark for this paper is 60 The marks for each question are shown in brackets
– use this as a guide as to how much time to spend on each question. Questions labelled with an asterisk (*) are ones where the quality of your
written communication will be assessed.
Advice Read each question carefully before you start to answer it. Keep an eye on the time. Try to answer every question. Check your answers if you have time at the end.
Pearson
Edexcel GCSE

2
*P44788A0220*
GCSE Mathematics 2MB01
Formulae: Higher Tier
You must not write on this formulae page.Anything you write on this formulae page will gain NO credit.
Volume of prism = area of cross section × length Area of trapezium = 12
(a + b)h
Volume of sphere = 43
3 Volume of cone = 13
2h
Surface area of sphere = 4 2 Curved surface area of cone =
In any triangle ABC The Quadratic Equation The solutions of ax2 + bx + c = 0
where a 0, are given by
xb b ac
a=
− ± −( )2 42
Sine Rule aA
bB
cCsin sin sin
= =
Cosine Rule a2 = b2 + c2 – 2bc cos A
Area of triangle = 12
ab sin C
length
sectioncross
b
a
h
rl
r
h
C
ab
c BA

3
*P44788A0320* Turn over
Answer ALL questions.
Write your answers in the spaces provided.
You must write down all stages in your working.
1 Milly has a biased coin.
When she throws the coin once, the probability of getting heads is 0.2
(a) Write down the probability of getting tails.
.. . . . . . . . . . . . . . . . . . . . . . . . . . . . . . . . . . . . . . . . . . .
(1)
Milly throws the coin 200 times.
(b) Work out an estimate for the number of times she gets heads.
.. . . . . . . . . . . . . . . . . . . . . . . . . . . . . . . . . . . . . . . . . .
(2)
(Total for Question 1 is 3 marks)

4
*P44788A0420*
2 Bill wants to compare the heights of pine trees growing in sandy soil with the heights of pine trees growing in clay soil.
The scatter diagram gives some information about the heights and the ages of some pine trees.
(a) Describe the relationship between the height of pine trees and the age of pine trees growing in sandy soil.
. . . . . . . . . . . . . . . . . . . . . . . . . . . . . . . . . . . . . . . . . . . . . . . . . . . . . . . . . . . . . . . . . . . . . . . . . . . . . . . . . . . . . . . . . . . . . . . . . . . . . . . . . . . . . . . . . . . . . . . . . . . . . . . . . . . . . . . . . . . . . . . . . . . . . . . . . . . . . . . . . . . . . . . . . . . . . . . . . . . . . . . . . . . . . . . . . . . . . . . . . . . . . . . . . . . . . . . . . . . . . . . . . . . . . . . . . . . . . . . . . .
(1)
A pine tree growing in clay soil is 18 years old.
(b) Find an estimate for the height of this tree.
.. . . . . . . . . . . . . . . . . . . . . . . . . . . . . . . . . . . . . . . . . .m(1)
A pine tree is growing in sandy soil.
(c) Work out an estimate for how much the height of this tree increases in a year.
.. . . . . . . . . . . . . . . . . . . . . . . . . . . . . . . . . . . . . . . . . .m(2)
5 10 15 20 25 3000
10
20
30
40
50
60
Height in m
Age in years
Key: × sandy soil clay soil

5
*P44788A0520* Turn over
(d) Compare the rate of increase of the height of trees growing in clay soil with the rate of increase of the height of trees growing in sandy soil.
. . . . . . . . . . . . . . . . . . . . . . . . . . . . . . . . . . . . . . . . . . . . . . . . . . . . . . . . . . . . . . . . . . . . . . . . . . . . . . . . . . . . . . . . . . . . . . . . . . . . . . . . . . . . . . . . . . . . . . . . . . . . . . . . . . . . . . . . . . . . . . . . . . . . . . . . . . . . . . . . . . . . . . . . . . . . . . . . . . . . . . . . . . . . . . . . . . . . . . . . . . . . . . . . . . . . . . . . . . . . . . . . . . . . . . . . . . . . . . . . . .
. . . . . . . . . . . . . . . . . . . . . . . . . . . . . . . . . . . . . . . . . . . . . . . . . . . . . . . . . . . . . . . . . . . . . . . . . . . . . . . . . . . . . . . . . . . . . . . . . . . . . . . . . . . . . . . . . . . . . . . . . . . . . . . . . . . . . . . . . . . . . . . . . . . . . . . . . . . . . . . . . . . . . . . . . . . . . . . . . . . . . . . . . . . . . . . . . . . . . . . . . . . . . . . . . . . . . . . . . . . . . . . . . . . . . . . . . . . . . . . . . . .
(2)
(Total for Question 2 is 6 marks)

6
*P44788A0620*
3 Julian wants to find out whether people in his town like to buy food from the market. He wants to carry out a survey. He is going to ask people as they leave the market.
This is not a good way of collecting information.
(a) Give a reason why.
.. . . . . . . . . . . . . . . . . . . . . . . . . . . . . . . . . . . . . . . . . . . . . . . . . . . . . . . . . . . . . . . . . . . . . . . . . . . . . . . . . . . . . . . . . . . . . . . . . . . . . . . . . . . . . . . . . . . . . . . . . . . . . . . . . . . . . . . . . . . . . . . . . . . . . . . . . . . . . . . . . . . . . . . . . . . . . . . . . . . . . . . . . . . . . . . . . . . . . . . . . . . . . . . . . . . . . . . . . . . . . . . . . . . . . . . . . . . . . . . . .
. . . . . . . . . . . . . . . . . . . . . . . . . . . . . . . . . . . . . . . . . . . . . . . . . . . . . . . . . . . . . . . . . . . . . . . . . . . . . . . . . . . . . . . . . . . . . . . . . . . . . . . . . . . . . . . . . . . . . . . . . . . . . . . . . . . . . . . . . . . . . . . . . . . . . . . . . . . . . . . . . . . . . . . . . . . . . . . . . . . . . . . . . . . . . . . . . . . . . . . . . . . . . . . . . . . . . . . . . . . . . . . . . . . . . . . . . . . . . . . . . .
(1)
Julian also wants to know what people think about the price of food from the market.
He uses this question on a questionnaire.
Food from the market is very cheap. Do you agree?
(b) Write down one thing wrong with this question.
.. . . . . . . . . . . . . . . . . . . . . . . . . . . . . . . . . . . . . . . . . . . . . . . . . . . . . . . . . . . . . . . . . . . . . . . . . . . . . . . . . . . . . . . . . . . . . . . . . . . . . . . . . . . . . . . . . . . . . . . . . . . . . . . . . . . . . . . . . . . . . . . . . . . . . . . . . . . . . . . . . . . . . . . . . . . . . . . . . . . . . . . . . . . . . . . . . . . . . . . . . . . . . . . . . . . . . . . . . . . . . . . . . . . . . . . . . . . . . . . . .
(1)
Yes No Do not know

7
*P44788A0720* Turn over
Julian also wants to know how far people travel to buy food from the market.
(c) Design a suitable question for Julian to use on his questionnaire.
(2)
(Total for Question 3 is 4 marks)
4 The length of a field is 54 metres correct to the nearest metre.
(a) Write down the least possible length of the field.
.. . . . . . . . . . . . . . . . . . . . . . . . . . . . . . . . . . . . . . . . . .m(1)
(b) Write down the greatest possible length of the field.
.. . . . . . . . . . . . . . . . . . . . . . . . . . . . . . . . . . . . . . . . . .m(1)
(Total for Question 4 is 2 marks)

8
*P44788A0820*
5 Kevin wants to get the ferry to Ireland.
A ferry crossing costs
£125 on Saturdays £109 on Mondays
Kevin has a voucher for 15% off the cost of a ferry crossing on Mondays.
Kevin can go on Saturday without using the voucher or on Monday using the voucher.
What is the difference in the cost of the ferry crossing if Kevin goes on Monday rather than on Saturday?
£ ... . . . . . . . . . . . . . . . . . . . . . . . . . . . . . . . . . . . . . . . . .
(Total for Question 5 is 3 marks)

9
*P44788A0920* Turn over
6 Stephen plays in a basketball team.
The list shows the numbers of points Stephen scored in 15 games of basketball this year.
26 14 33 8 21 18 20 9 17 22 21 18 22 30 25
(a) Show this information in an ordered stem and leaf diagram.
(3)
Last year the ratio of the number of games Stephen’s team won to the number of games Stephen’s team did not win was 5 : 4
Last year Stephen’s team played 36 games.
(b) Work out the number of games Stephen’s team won last year.
.. . . . . . . . . . . . . . . . . . . . . . . . . . . . . . . . . . . . . . . . . . .
(2)
(Total for Question 6 is 5 marks)

10
*P44788A01020*
7 The table gives information about the numbers of badges gained by the younger girls in a Guide group.
Number of badges Frequency
0 2
1 8
2 4
3 3
4 5
5 3
(a) Write down the mode.
.. . . . . . . . . . . . . . . . . . . . . . . . . . . . . . . . . . . . . . . . . . . .
(1)
(b) Work out the mean number of badges gained by these girls.
.. . . . . . . . . . . . . . . . . . . . . . . . . . . . . . . . . . . . . . . . . . . .
(3)
There are 15 older girls in the Guide group. The mean number of badges gained by these 15 older girls is 4.4
(c) Work out the mean number of badges gained by all the girls in the Guide group.
.. . . . . . . . . . . . . . . . . . . . . . . . . . . . . . . . . . . . . . . . . . . .
(3)
(Total for Question 7 is 7 marks)

11
*P44788A01120* Turn over
8 Anya has £40 000 to invest. She is going to invest in a scheme from either the building society or the bank.
Scheme
Building Society Invest £40 000 in an account at 3% per annum compound interest for 2 years.
Bank Invest £40 000 in a bond that pays £2550 interest at the end of 2 years.
Anya wants to invest in the scheme that gives the most interest.
Which scheme should Anya invest in?
(Total for Question 8 is 4 marks)
*

12
*P44788A01220*
9 The cumulative frequency graph gives information about the times, in minutes, 140 girls revised for an exam.
(a) Find an estimate for the median.
.. . . . . . . . . . . . . . . . . . . . . . . . . . . . . . . . . . . . . . . . . . . . minutes(1)
(b) Find an estimate for the number of girls who revised for more than 30 minutes.
.. . . . . . . . . . . . . . . . . . . . . . . . . . . . . . . . . . . . . . . . . . .
(2)
Time in minutes10 20 30 40 50 60 70 80 90 1000
0
20
40
60
80
100
120
140
160
Cumulativefrequency

13
*P44788A01320* Turn over
The box plot gives information about the times, in minutes, 140 boys revised for the same exam.
The lower quartile for the times the girls revised is 22 minutes. The upper quartile for the times the girls revised is 56 minutes.
*(c) Compare the distribution of the times the girls revised with the distribution of the times the boys revised.
(4)
(Total for Question 9 is 7 marks)
0 10 20 30 40 50 60 70 80 90 100Time (minutes)

14
*P44788A01420*
10 (a) Explain what is meant by a stratified sample.
.. . . . . . . . . . . . . . . . . . . . . . . . . . . . . . . . . . . . . . . . . . . . . . . . . . . . . . . . . . . . . . . . . . . . . . . . . . . . . . . . . . . . . . . . . . . . . . . . . . . . . . . . . . . . . . . . . . . . . . . . . . . . . . . . . . . . . . . . . . . . . . . . . . . . . . . . . . . . . . . . . . . . . . . . . . . . . . . . . . . . . . . . . . . . . . . . . . . . . . . . . . . . . . . . . . . . . . . . . . . . . . . . . . . . . . . . . . . . . . . . .
. . . . . . . . . . . . . . . . . . . . . . . . . . . . . . . . . . . . . . . . . . . . . . . . . . . . . . . . . . . . . . . . . . . . . . . . . . . . . . . . . . . . . . . . . . . . . . . . . . . . . . . . . . . . . . . . . . . . . . . . . . . . . . . . . . . . . . . . . . . . . . . . . . . . . . . . . . . . . . . . . . . . . . . . . . . . . . . . . . . . . . . . . . . . . . . . . . . . . . . . . . . . . . . . . . . . . . . . . . . . . . . . . . . . . . . . . . . . . . . . . .
. . . . . . . . . . . . . . . . . . . . . . . . . . . . . . . . . . . . . . . . . . . . . . . . . . . . . . . . . . . . . . . . . . . . . . . . . . . . . . . . . . . . . . . . . . . . . . . . . . . . . . . . . . . . . . . . . . . . . . . . . . . . . . . . . . . . . . . . . . . . . . . . . . . . . . . . . . . . . . . . . . . . . . . . . . . . . . . . . . . . . . . . . . . . . . . . . . . . . . . . . . . . . . . . . . . . . . . . . . . . . . . . . . . . . . . . . . . . . . . . . .
(1)
The table gives some information about the number of people at a fitness centre one day.
Gender
Age(years) Male Female
Under 40 45 78
40 and over 73 25
Mr Ellory wants to give a questionnaire to some of these people. He takes a sample of 60 people stratified by age and gender.
(b) Work out the number of males aged 40 and over that should be in the sample.
.. . . . . . . . . . . . . . . . . . . . . . . . . . . . . . . . . . . . . . . . . . . .
(2)
(Total for Question 10 is 3 marks)

15
*P44788A01520* Turn over
11 Here are some graphs that show relationships.
A curve or line of best fit has been drawn on each graph.
The equation of each graph is one of the equations in the following list.
Give the equation of each graph.
Graph A. . . . . . . . . . . . . . . . . . . . . . . . . . . . . . . . . . . . . . . . . . . . . . . . . . . . . . . . . . . . . . . . . . . . . . . . . . . . . . . . . . . . . . . .
Graph B. . . . . . . . . . . . . . . . . . . . . . . . . . . . . . . . . . . . . . . . . . . . . . . . . . . . . . . . . . . . . . . . . . . . . . . . . . . . . . . . . . . . . . . .
Graph C. . . . . . . . . . . . . . . . . . . . . . . . . . . . . . . . . . . . . . . . . . . . . . . . . . . . . . . . . . . . . . . . . . . . . . . . . . . . . . . . . . . . . . . .
(Total for Question 11 is 3 marks)
y x y = 2x y = 2x y = 8x x2 y = 3x2
Graph A x
y
Graph B x
y
Graph C x
y
O
O
O

16
*P44788A01620*
12 There are 8 counters in a box. The letter A is on 6 of the counters. The letter B is on the other 2 counters.
Sally takes at random a counter from the box. She keeps the counter.
Then Tina takes at random a counter from the box.
(a) Complete the probability tree diagram.
(3)
Sally Tina
68 A
B….

17
*P44788A01720* Turn over
(b) Work out the probability that both Sally and Tina take a counter with the letter A on it.
. . . . . . . . . . . . . . . . . . . . . . . . . . . . . . . . . . . . . . . . . . . . .
(2)
(c) Work out the probability that at least one counter with the letter A on it is taken.
.. . . . . . . . . . . . . . . . . . . . . . . . . . . . . . . . . . . . . . . . . . . .
(3)
(Total for Question 12 is 8 marks)
18
*P44788A01820*
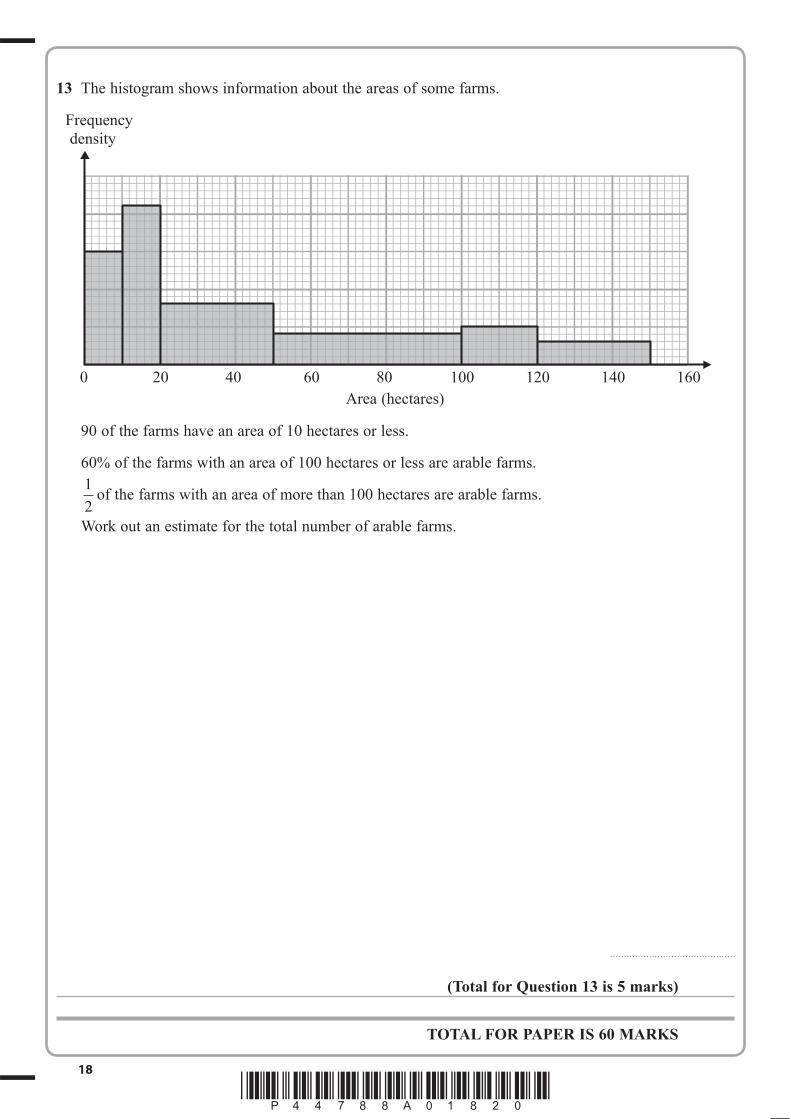
13 The histogram shows information about the areas of some farms.
90 of the farms have an area of 10 hectares or less.
60% of the farms with an area of 100 hectares or less are arable farms.
12
of the farms with an area of more than 100 hectares are arable farms.
Work out an estimate for the total number of arable farms.
.. . . . . . . . . . . . . . . . . . . . . . . . . . . . . . . . . . . . . . . . . . . .
(Total for Question 13 is 5 marks)
TOTAL FOR PAPER IS 60 MARKS
Frequency density
0 20 40 60 80 100 120 140 160Area (hectares)

19
*P44788A01920*
BLANK PAGE

20
*P44788A02020*
BLANK PAGE


![LoadEvaluationandStructuralLoad Evaluation and Structural ...mvdpanel.net/adjuntosTextos/cz47hroew7iqkp/699/korea.pdf0 10 203040 5060 0 Displacement [mm] Section Up-outboard Section](https://img.pdfslide.us/doc/110x75/5fead74be7cb7d437e298095/loadevaluationandstructuralload-evaluation-and-structural-0-10-203040-5060-0.jpg)