Embed Size (px)
Citation preview

p38-MK2 signaling axis regulates RNA metabolism
after UV light-induced DNA damage
Borisova et al.

Supplementary Figure 1
a
d
−6 −4 −2 0 2 4 6
0.0
1.0
2.0
3.0
log2(UV/control)
−log
10(F
DR
)
−6 −4 −2 0 2 4 6
−6−4
−20
24
6
log2(UV/control 1)
log 2(U
V/co
ntro
l 2)
r 0.82n 10448
−6 −4 −2 0 2 4 6
−6−4
−20
24
6
log2(UV + p38i/control 1)
log 2(U
V +
p38i
/con
trol
2)
r 0.81n 10437
−6 −4 −2 0 2 4 6
0.0
1.0
2.0
3.0
log2(UV + p38i/UV)
−log
10(F
DR
)
e
f g h
40
60
80
100
0 10 20 30 40
Cel
l via
biili
ty (%
)
UV (J/m2)
Untreated
p38 inhibition
***
c
b
−6−4
−20
24
6
log 2(p
38si
RN
A+U
V/U
V) 3e−58
p38i
-inse
nsiti
ve p
hosh
osite
s
p38i
-sen
sitiv
eph
osph
osite
s
UVATMiATRiDNA-PKcsip38i
- + + + + +- - + - - -- - - + - -- - - - + -- - - - - +
01234
Nor
mal
ized
pM
K2 le
vels
pMK2 (T334)
pp38 (T180/Y182)
p38
Vinculin
UV (J/m2,1h recovery)- 10 20 40 80
53 -
41 -
41 -
130 -
pChk2 (T68)
pChk1 (S345)
Vinculin
pMK2 (T334)
UV (40 J/m2,1h recovery)
ATMiATRiDNA-PKcsip38i
- + + + + +- - + - - -- - - + - -- - - - + -- - - - - +
53 -
70 -
41 -
130 -

Supplementary Figure 1: Proteome-wide identification of p38-dependent phosphorylation
sites
a. U2OS cells were treated with increasing doses of UV light (10 - 80 J/m2) and left to recover
for 1 hour. Total cell lysates were resolved on SDS-PAGE and activation of p38 was monitored
with phospho-specific antibodies.
b. U2OS cells were pretreated for 1 hour with ATM inhibitor (KU-55933, 10 µM), ATR inhibitor
(VE-821, 1 µM), DNA-PKcs inhibitor (KU-57788, 10 µM) or p38 inhibitor (SB 203580, 10
µM) and then irradiated with UV light (40 J/m2, 1 hour recovery). Total cell lysates were
resolved on SDS-PAGE and blotted with the indicated antibodies (left). The bar plot shows
the mean and standard deviation of normalized pMK2 levels quantified from three replicate
experiments (right).
c. Cell viability was measured for mock-treated U2OS cells and cells irradiated with different
doses of UV light without and with 1 hour pretreatment with the p38 inhibitor. The plot shows
the mean and standard deviation of the results obtained in three biological replicate
experiments, each performed in three technical replicates. Two-sided Student’s t-test was used
to assess the significance (*** p value < 0.001).
d. Scatter plot shows the logarithmized SILAC ratios UV/control of quantified phosphorylation
sites in replicate experiments. The color-coding indicates the density. The Spearman’s rank
correlation was calculated to determine the experimental reproducibility.
e. Scatter plot shows the logarithmized SILAC ratios UV + p38i/control of quantified
phosphorylation sites in replicate experiments.
f. Identification of significantly regulated phosphorylation sites after p38 inhibition from two
replicate experiments using the limma algorithm. P value < 0.01 was used as cut-off to
determine phosphorylation sites that significantly increase after UV light.
g. Identification of significantly regulated phosphorylation sites after p38 inhibition from two
replicate experiments was done using the limma algorithm. P value < 0.01 was used as cut-off
to determine downregulated phosphorylation sites after p38 inhibition.
h. The box plot shows the SILAC ratio of p38i-insensitive sites and p38i-sensitive sites quantified
after transient knockdown of p38. Box plot represents the 25th to 75th quartiles with the
horizontal line representing the median value.

Supplementary Figure 2a b
−6 −4 −2 0 2 4 6
0.0
1.0
2.0
3.0
log2(UV + MK2/3/5i/UV)
−log
10(F
DR
) LightArg0/Lys0
MediumArg6/Lys4
HeavyArg10/Lys8
UV
Inhibitor
SILAC
+ +
p38DMSO DMSO
Transfection Emptyvector
Flag-Strep14-3-3
Flag-Strep14-3-3
+

Supplementary Figure 2: Phosphorylation by p38-MK2 induces 14-3-3 binding to cellular
proteins
a. Identification of significantly regulated phosphorylation sites after MK2/3/5 inhibition from
two replicate experiments was done using the limma algorithm. P value < 0.05 was used as
cut-off to determine downregulated phosphorylation sites after p38 or MK2/3/5 inhibition.
b. Schematic representation of the strategy used to identify UV light-induced, p38-dependent 14-
3-3 interaction partners. SILAC-labeled U2OS cells transfected with Flag-Strep-14-3-3 were
mock-treated, irradiated with UV light (40 J/m2, 1 hour recovery) or pretreated with the p38
inhibitor and irradiated with UV light. 14-3-3 and its binding partners were enriched using
StrepTactin sepharose, digested in-gel into peptides and peptide samples were analyzed by LC-
MS/MS.

Supplementary Figure 3a
b
PHC2
METTL18
SLC4A1AP
TROVE2
HP1BP3
CCDC82
LSM14A
AASDHPPT
RALYRBM6
HNRNPLL
DDX47CPSF1
ENAH
ACIN1NKAP
TCEAL3
TSEN34
MON1A
PRKRIR
TNKS1BP1
CHAMP1
ZNF281
MATR3 (2)
THRAP3
NASPARL2BP
RNF181SCAF11
FOXK2
ATE1
LMNA
METTL3
NPM3
TJP1
ENSA
TDP1
LUC7L3
POLD1
PRKDC
PMS2HNRNPF
RFC1
DHX9
MLH1RAD1
FANCI
EIF4EBP1CHEK1
TOPBP1
DBF4
PPM1G
CREBBP
BRD8
SNIP1
HMGA1
SRRM2
EP400
GINS2
KIF2C
SMC1A
NBNNUP107
SMC3
NCAPD2
BUB1
MCM6
UTP14A
HEATR1
UBE4BNIFK
NSFL1C TUBA1B
MAGED2TUBA1C
TBCB
RSF1
BPTFTUBA4A
NSMCE4A
RNF20
PSMD4RPP38
POP1
POP4
UBQLN1
Number of upregulated sites
1 2
Proteins with UV-upregulated sites
GO molecular function
GO cellular component
GO biological process
−3 −2 −1 0 1 2 3 4
510
1520
2530
log2(enrichment)
−log
10(q
)
nucleoplasm
poly(A) RNA binding
cytoplasm gene expressionintegral component
of membranemitotic cell cycle
nucleus cellular component disassembly involved in execution phase of apoptosiscytosolmembrane DNA damage checkpointDNA repair
programmed cell deathextracellularregion
chromatin bindingapoptotic processmRNA splicing, via spliceosome
nucleotide binding

Supplementary Figure 3: Analysis of UV light-induced phosphorylation sites
a. GO terms significantly enriched among proteins with UV light-induced phosphorylation sites.
The dot plot shows significantly overrepresented GO terms associated with proteins containing
UV light-induced phosphorylation sites compared to proteins containing non-regulated sites.
The significance of the enrichment of a specific term was determined using Fisher’s exact test.
P values were corrected for multiple hypotheses testing using the Benjamini and Hochberg
FDR.
b. Analysis of functional associations among proteins with UV light-induced S/TQ
phosphorylation sites. Functional interactions were obtained from the STRING database and
visualized using Cytoscape. Proteins with S/TQ sites not involved in functional interactions
are indicated on the right.

Supplementary Figure 4a
b
UV (40 J/m2, 1h recovery)
p38i - - +
Input
- + +
HEK293T RPE-1
Ponceau (14-3-3)
NELFE
pMK2 (T334)
pp38 (T180/Y182)
NELFE
Vinculin
Input
- - +
- + +
14-3-3 pull down 14-3-3 pull down
HaCaT
Input
- - + - + +
14-3-3 pull down
41 -
53 -
41 -41 -
53 -
130 -
Input
GST-14-3-3 pull down
NELFE
Ponceau (14-3-3)
NELFE
pMK2 (T334)
Vinculin
- UV H2O2
41 -
53 -
41 -
130 -
41 -

Supplementary Figure 4: MK2-dependent phosphorylation of NELFE promotes its binding
to 14-3-3
a. Validation of interaction between NELFE and 14-3-3 in HaCaT, HEK293T and RPE-1 cells.
Total cell extracts from differentially treated cells were incubated with the recombinant GST-
14-3-3. Enriched proteins were resolved by SDS-PAGE and subjected to western blotting.
b. NELFE interacts with 14-3-3 after oxidative stress induced by treatment with H2O2 for 1 hour.
Total cell extracts from differentially treated U2OS cells were incubated with the recombinant
GST-14-3-3. Enriched proteins were resolved by SDS-PAGE and subjected to western
blotting.

Supplementary Figure 5a
αDαC
αC αDR19
E92
Y85
M88
E92
R19
M88
Y85αB αA
αB
αA
C
N
N
C
E
F
HG
AB
D C I
E
F
H G
A B
DCI R19
R19E92
E92
- S I
y₁₂*
b₂Sphy₁₁
b₃A
y₁₀
b₄*D
y₉
b₅D
y₈
b₆*D
y₇
b₇L
y₆
b₈Q
y₅
b₉*E
y₄
b₁₀*S
y₃
b₁₁*S
y₂
b₁₂*R
y₁
-
m/z
y₁-NH₃158.0924
a₂173.1285
y₁175.119
b₂-H₂O183.1128
b₂201.1234
y₂-NH₃245.1244
y₂262.151
b₃*270.1448
b₄-H₂O323.1714
b₄*341.1819
y₃349.183
b₃368.1217
b₅-H₂O438.1983
b₅*456.2089
y₄-H₂O460.215
y₄-NH₃461.1991
y₄478.2256
y₉²⁺532.7282
b₆-H₂O553.2253
b₅554.1858
b₆*571.2358
y₅-H₂O588.2736
y₅-NH₃589.2576
y₅606.2842
b₇-H₂O668.2522
b₇*686.2628
y₆-H₂O701.3577
y₆-NH₃702.3417
y₆719.3682
b₈-H₂O781.3363
b₇784.2397
b₈*799.3468
y₇-H₂O816.3846
y₇-NH₃817.3686
y₇834.3952
b₈897.3237
b₉-H₂O909.3949
b₉*927.4054
y₈-H₂O931.4116
y₈-NH₃932.3956
y₈949.4221
b₁₀-H₂O1038.437
b₁₀-NH₃1039.421
y₉-H₂O1046.439
y₉-NH₃1047.423
b₁₀*1056.448
y₉1064.449
y₁₀-H₂O1117.476
b₁₁-H₂O1125.469
y₁₀1135.486
b₁₁*1143.48
y₁₁-H₂O1186.497
y₁₁-NH₃1187.481
y₁₁*1204.508
b₁₂*1230.512
y₁₂-H₂O1299.581
y₁₁1302.485
y₁₂*1317.592
050
100
100 200 300 400 500 600 700 800 900 1000 1100 1200 1300 1400 1500
Rel
ativ
e in
tens
ity (%
)
NELFE pS115m/z 751.8
H. sapiens 100 EKGPVPTFQPFQR---SISADDDLQ-ESSRRPQRKSLYESF 136 M. mulatta 100 EKGPVPTFQPFQR---SISADDDLQ-ESSRRPQRKSLYESF 136P. troglodytes 100 EKGPVPTFQPFQR---SISADDDLQ-ESSRHPQRKSLYESF 136F. catus 100 EKGPVPTFQPFQR---SISADDDLQ-ESSRRPQRKSLYESF 136B. taurus 100 EKGPVPTFQPFQR---SVSADDDLQ-ESSRRPQRKSLYESF 136R. norvegicus 118 EKGPVPTFQPFQR---SMSADEDLQ-EPSRRPQRKSLYESF 154M. musculus 100 EKGPVPTFQPFQR---SMSADEDLQ-EPSRRPQRKSLYESF 136M. domestica 100 EKGPAPTFQPFQR---SISADDDLQ-ESSRRPQRKSLYESF 136T. rubripes 100 EKGPVPAFLPFQR---SVSADDE-P-ESAKRVHRKSLYESF 135D. rerio 100 EKGPAPAFLPFQR---SVSTDEE-PpDSAKRIHRKSLYESF 136X. tropicalis 100 DKGPVPSFQPFQR---SVSVDEE-QaESSRRSQRKSLYESF 136D. melanogaster 96 SETTVASYQPFsstQNDVAQETIISeIIKEEPRRQNLYQHF 136
NELFE (95-140 aa)
c
Phosphorylation site
Occ
upan
cy (%
)
0
20
40
60
80
100 ControlMK2 in vitro assay
S49 S51 S115 S251
b
d e

Supplementary Figure 5: NELFE phosphorylation by MK2 promotes its binding to 14-3-3
a. Mass spectrometric fragment ion scan of the peptide corresponding to phosphorylated serine
115 in NELFE.
b. Purified MK2 can phosphorylate immunoprecipitated NELFE on S51, S115 and S251 in vitro.
c. Conservation of the NELFE peptide sequence corresponding to serine 115 across evolution.
d. Structure of the 14-3-3 epsilon homo dimer in cartoon representation (Yellow and Cyan).
e. Topology diagrams of the 14-3-3 epsilon. Topology diagrams were prepared with TopDraw.
Supplementary Figure 6a b
Ratio M/L 2
Ratio H/L 2
Ratio H/M 2
Ratio M/L 3
Ratio H/L 3
Ratio H/M 3
0.71
0.64
0.6
0.59
0.54
0.51
0.68
0.62
0.58
Rat
io M
/L 1
Rat
io H
/L 1
Rat
io H
/M 1
Rat
io M
/L 2
Rat
io H
/L 2
Rat
io H
/M 2
LightArg0/Lys0
MediumArg6/Lys4
HeavyArg10/Lys8
UV
Inhibitor
SILAC
+ +
p38DMSODMSO
Chromatin proteome analysis
c ed
0
0.5
1
Unt
reat
ed UV
p38i
+ U
V
NELFE
MCM7
Ponceau
Chromatin (HaCaT)
UV (40 J/m2,1h recovery)
p38i
- + +
- - +
41 -
70 -
NELFE
MCM7
Ponceau
UV (20 J/m², recovery (h))0 1 8 24 48 72
Total cell lysate
41 -
70 -NELFE
MCM7
Ponceau
UV (40 J/m2,1h recovery)
p38i
- + +
- - +
Total cell lysate
41 -
70 -
Nor
mal
ized
NEL
FE le
vels

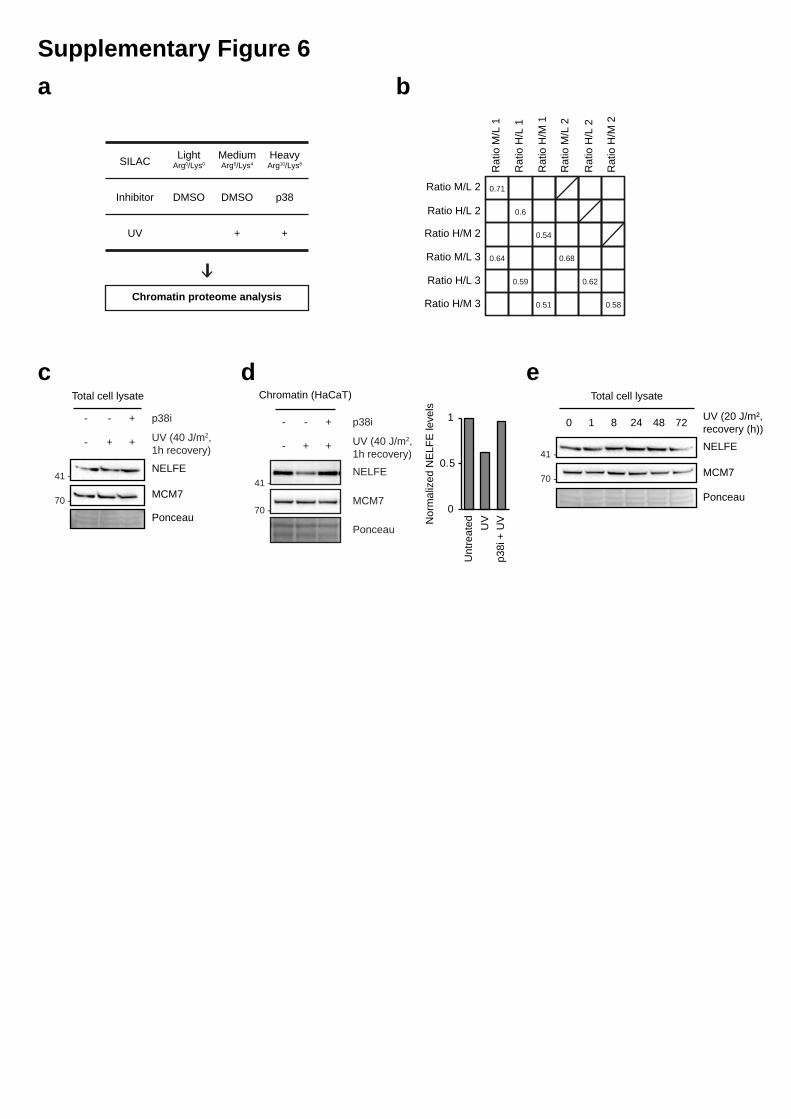
Supplementary Figure 6: Protein dynamics on chromatin after UV light
a. Schematic representation of the strategy used to identify UV light-induced, p38-dependent
change in the chromatin proteome. SILAC-labeled U2OS cells were mock-treated, irradiated
with UV light (40 J/m2, 1 hour recovery) or pretreated with the p38 inhibitor and irradiated
with UV light. Chromatin-associated proteins were extracted from cells, digested in-gel into
peptides and peptide samples were analyzed by LC-MS/MS.
b. The Spearman’s rank correlation was calculated to determine the experimental reproducibility.
c. Total cell lysates of U2OS cells were resolved by SDS-PAGE and proteins were detected with
the indicated antibodies.
d. NELFE dissociates from chromatin in a p38-dependent manner after UV light in HaCaT cells.
Chromatin protein fractions from differentially treated cells were resolved by SDS-PAGE and
subjected to western blotting with the indicated antibodies.
e. U2OS cells were exposed to UV light and left to recover for different time points. Total cell
lysates were resolved by SDS-PAGE and proteins were detected with the indicated antibodies.

Supplementary Figure 7a b
c
e
1000 3000
RN
A p
ol II
occ
upan
cy
bp-300
TSS Downstream
Pol II release ratio (PRR) =Downstream
TSSPO
LR2A
POLR
2B
POLR
2C
POLR
2D
POLR
2E
POLR
2G
POLR
2H
POLR
2I
POLR
2J
0
1
2
8.1e
−02
1.6e
−01
2.6e
−01
9.9e
−01
1.6e
−02
1.7e
−01
4.3e
−01
3.7e
−01
1.4e
−01
d
Untreated UV Untreated UV
RNA pol IIChIP-seq
GRO-seq(Williamson et al.)
RN
A po
l II r
elea
se ra
tio (P
RR
)
-4
0
4
8
2626 150470.8%
61929.1%
RNA pol II/NELFE targets
RNA pol II targetswith PRR up
4037 4130 2768
RNA pol IItargets
(U2OS)
NELFEtargets (HeLa)(Stadelmayer et al.)
chromosome organizationDNA recombination
protein localization to cytoplasmic stress granulecellular macromolecule catabolic process
DNA replication−independent nucleosome organizationchromatin silencing at rDNA
CENP−A containing chromatin organizationprotein heterotetramerization
protein modification by small protein conjugation or removalcentromere complex assembly
histone exchangenon−recombinational repair
gene silencing by RNADNA methylation on cytosine
histone H4−K20 demethylationdouble−strand break repair via nonhomologous end joining
RNA splicingRNA processing
DNA replication−dependent nucleosome organizationtelomere organization
negative regulation of hematopoietic progenitor cell differentiationtelomere maintenance
mRNA metabolic process
Fold enrichment
0.0 1.0 2.0
9.2e−028.4e−02
8.3e−025.4e−02
5.1e−024.2e−02
2.2e−022.0e−02
1.7e−021.5e−021.5e−02
1.2e−021.1e−02
7.8e−035.8e−03
5.4e−031.4e−03
9.5e−046.7e−04
6.2e−045.8e−04
2.5e−046.5e−05
fPhosphoproteomics - UV light increases phosphorylation of 538 sites
- 138 sites are phosphorylated in a p38-dependent manner- MK2/3 act downstream of p38 in response to UV light- RBPs, including NELFE, are phosphorylated by p38-MK2
Interactome analysis - 14-3-3 dimers bind to proteins phosphorylated by MK2- NELFE binds to 14-3-3 after UV light
Biochemistry / X-ray crystallography
- NELFE and 14-3-3 interact directly in a UV light- and p38-dependent manner
RNA pol II ChIP-seq - UV light leads to RNA pol II elongation
Chromatin proteome - DDR proteins are recruited to and excluded from chromatin after UV light- RBPs dissociate from chromatin in a p38-dependent manner
UV/untreatedp38i + UV/untreated
log 2(m
ean
SILA
C ra
tio)

Supplementary Figure 7: UV light exposure leads to transcriptional elongation
a. The bar plot shows the levels of RNA pol II subunits on chromatin quantified in untreated
U2OS cells and after UV light by SILAC-based quantitative MS. The error bars show the mean
and standard deviation of SILAC ratios quantified from three replicate experiments. Two sided
Student’s t test was used to assess the significance.
b. Schematic representation of the approach for the RNA pol II release ratio (PRR) calculation.
c. Comparison of PRRs calculated in untreated and UV light treated U2OS cells from two RNA
pol II ChiP-seq replicate experiments with PRRs calculated from GRO-seq data from the study
by Williamson et al. The lower and upper hinges represent the first and third quartiles (25th
and 75th percentiles, respectively). The line in the center of the box corresponds to the median
of the data range.
d. GO terms significantly enriched among genes with UV light-upregulated PRR. The bar plot
shows significantly overrepresented GO terms associated with genes containing upregulated
PRR compared to all RNA pol II bound genes. The significance of the enrichment of a specific
term was determined using a hypergeometric test. P values were corrected for multiple
hypotheses testing using the Benjamini and Hochberg FDR.
e. NELFE target genes were extracted from the study by Stadelmayer et al. and overlapped with
genes displaying significantly increased PRRs after UV light exposure determined by RNA
pol II ChiP-seq. 70.8% of genes with increased PRR were found to be targets of NELFE in
HeLa cells.
f. A schematic overview of the methods and findings reported in this study.

Figure 1b
pChk1 (S345)
Vinculin
70 -
53 -
41 -
235 -
130 -
93 -
170 -
pChk2 (T68)
70 -
53 -
pp38 (T180/Y182)
53 -
41 -
30 -
Ponceau
53 -
41 -
30 -
Figure 1a
pp38 (T180/Y182)
pJNK1 (T183/Y185)
pChk1 (S345)
Ponceau
70 -
53 -
41 -
41 -
41 -
53 -
53 -
30 -
30 -
Supplementary Figure 8
pMK2 (T334)
Figure 4b
53 -41 -
30 -
Ponceau
NELFE
NELFE
53 -41 -
30 -
53 -41 -
70 -
FLAG M2
53 -41 -
30 -
Figure 4c
p38NELFE pulldown
MK2
NELFE input
GST (14-3-3)
pChk1 (S345)
Ponceau
53-
41-
70-
53-
41-
70-
Figure 4d
pChk1 (S345)
14-3-3 motif
GFP (NELFE) input
GFP (NELFE) pulldown
Ponceau
53-
41-
70-
53-
41-
70-
53-
41-
70-
70-
53-
93-
Vinculin
pMK2 (T334)
Figure 4e
53 -
41 -
53 -
41 -
53 -
41 -
53 -
41 -
235 -170 -130 -
235 -170 -130 -

Figure 4f
NELFE pulldown
Ponceau pulldown
pp38 (T180/Y182)
pMK2 (T334)
NELFE input
Ponceau input
- 53
- 41
- 70
- 53
- 41
- 70
- 53
- 41
- 70
53-
41-
70-
Vinculin
- 235- 170- 130
- 93
Figure 4g
NELFE pulldown
Ponceau pulldown
NELFE input
XPC
CSB
pp38 (T180/Y182)
Vinculin
pChk1 (S345)
53 -
41 -
70 -
53 -
41 -
70 -
53 -
41 -
70 -
235 -170 -130 -
93 -
235 -170 -130 -
93 -
235 -170 -130 -
93 -
53 -
41 -
70 -
Ponceau
GFP (NELFE)
GFP (NELFE)
93 -
70 -
53 -
41 -
93 -
70 -
53 -
41 -
GST (14-3-3)
70 -
53 -
41 -
pChk1 (S345)
53 -
41 -
Figure 5c
Ponceau
14-3-3 (pan)
53 -
41 -
30 -22 -18 -
53 -
41 -
30 -22 -18 -
53 -
41 -
30 -22 -18 -
14-3-3 (pan)
Figure 5g

Figure 6d
53 -
41 -
41 -
30 -
93 -
70 -
Ponceau
PCNA
NELF-E
MCM7
Ponceau
MCM7
NELFE
53 -
41 -
93 -
70 -
Figure 6e
p38
pMK2 (T334)pp38(T180/Y182)
Vinculin235 -
130 -
93 -
170 -
53 -
41 -
53 -
41 -
30 -
53 -
41 -
pMK2 (T334)
Figure S1a
Vinculin
pMK2
pChk2 (T68)
pChk1 (S345)
Ponceau
53 -
41 -
70 -
53 -
41 -
70 -
53 -
41 -
70 -
93 -
170 -130 -
Figure S1b
Figure S4a
NELFE pulldown
GST (14-3-3)
pMK2 (T334)
pp38 (T180/Y182)
NELFE input
Vinculin
130 -
93 -
41 -
53 -
53 -
41 -
53 -
41 -
53 -
41 -
53 -
Ponceau
HaCaT
NELFE pulldown
Ponceau (14-3-3)
pMK2 (T334)
pp38 (T180/Y182)
NELFE input
Vinculin
Ponceau
RPE-1
130 -
93 -
41 -
53 -
53 -
41 -
53 -
41 -
53 -
41 -
NELFE pulldown
Ponceau (14-3-3)
pMK2 (T334)
pp38 (T180/Y182)
NELFE input
Vinculin
Ponceau
HEK293T
130 -
93 -
41 -
53 -
53 -
41 -
53 -
41 -
53 -
41 -
Figure S4b
NELFE pulldown
Ponceau (14-3-3)
NELFE input
41 -
53 -
53 -
41 -
53 -
pMK2 (T334)
41 -
53 -
Vinculin
130 -
93 -
Figure S6c and S6d
Ponceau
41 -
53 -
70 -93 -
MCM7
NELFE
Figure S6e
93 -
70 -
53 -
41 -
Ponceau
MCM7
NELFE

Supplementary Figure 8: Uncropped scans of all western blots

Supplementary Table 1
List of siRNAs used in this study
Gene name Sequence 5’-3’
p38 gaagcucuccagaccauuu
MK2 ccgaaaucaugaagagcau
MK3 ccaaagauguugugaggaa
MK5 ggagaaagacgcagugcuu
NELFE 1 cagccaagguggugucaaa
NELFE 3’UTR acacugagguggaagcuuac
XPC gcaaauggcuucuaucgaa
CSB ccactgattacgagataca
Supplementary Table 2
List of oligos used in this study
Construct Sequence 5’-3’
NELFE S49/51A gacaggctgctctgctagtgcgcgtttgacaccac
NELFE S115A gtcatcatcagcagctatgctcctctggaacgg
NELFE S251A ccgttcagggaatgcatccgacctgcgga

Supplementary Table 3
Crystallization data collection and refinement statistics. Values in parentheses are for the highest
resolution shell.
14-3-3/NELFE Data collection statistics Beamline SLS PX III Wavelength (Å) 1.000 Space Group C 2 2 21 Unit Cell (Å) a = 79.29, b = 81.19, c = 81.05
α =90.00, β = 90.00, γ = 90.00 Resolution (Å) 46.47 - 2.70
(2.85 - 2.70) Observed reflections 97555 (14510) Unique reflections 7463 (1059) Redundancy 13.1 (13.7) Completeness (%) 100.0 (100.0) Rmerge 0.126 (0.821) <I/I> 18.4 (3.5) Refinement statistics Reflections in test set 757 Rcryst 17.2 Rfree 24.1 Number of groups Protein residues 234 Ions and ligand atoms 0 Water 4 Wilson B-factor 50.55 RMSD from ideal geometry
Bond length (Å) 0.012 Bond angles (°) 1.493 Ramachandran Plot Statistics
In Favoured Regions (%) 224 (97.39) In Allowed Regions (%) 6 (2.61) Outliers (%) 0 (0.00)

Supplementary Table 4
List of antibodies used in this study
Protein name Product number Origin Dilution
GFP sc-9996 Santa Cruz 1:2000
FLAG F1804 Sigma 1:2000
pp38 (T180/Y182) 9216 CST 1:1000
p38 8690 CST 1:1000
pMK2 (T334) 3007 CST 1:1000
pJNK 9255 CST 1:1000
pCHEK2 (T68) 2661 CST 1:1000
pCHEK1 (S345) 2344 CST 1:1000
Vinculin V9264 Sigma 1:1000
NELFE ABE48 Millipore 1:1000
14-3-3 (pan) 8312 CST 1:1000
POLR2A sc-899 Santa Cruz ChIP
pCTD (S2) 13499 CST 1:1000
XPC 14768 CST 1:1000
CSB sc-398022 Santa Cruz 1:1000
GST sc-138 Santa Cruz 1:2000
PCNA sc-56 Santa Cruz 1:1000
MCM7 3735 CST 1:1000
MCM6 sc-9843 Santa Cruz 1:1000
p14-3-3 motif 9601 CST 1:1000