Embed Size (px)
Citation preview

1
�–� data of (acetic acid + water) at� = (412.6, 443.2, 483.2) K
Luis A. Román-Ramírez, Gary A. Leeke*
School of Chemical Engineering, University of Birmingham, Edgbaston, BirminghamB15 2TT, UK.
*School of Water, Energy and Environment, Cranfield University, Cranfield,Bedfordshire, MK43 0AL
Abstract
Experimental �–� data were measured for the (acetic acid + water) system at the
temperatures of (412.6, 443.2 and 483.2) K between the pressures of 196 kPa and
1902 kPa over the entire range of concentrations. Experiments were carried out in a
static-analytical equipment with quantitative analysis by GC. The experimental data
were correlated with the Perturbed-Chain Statistical Associating Fluid Theory
considering two association sites for acetic acid and four association sites for water.
Keywords
Vapour liquid equilibria, Acetic acid, Water, PC-SAFT
* Corresponding author. Tel.: (+44) 0121 414 5351. E-mail address: [email protected].

2
1 Introduction
Acetic acid and its derivatives are used in several industries making it one of the major
worldwide commodity chemicals. The global demand for acetic acid in 2013 was
around 10.5 Mt and it is projected to reach 15.5 Mt by 2020 with a market revenue of
12,190 million USD [1,2]. More than 65% of the acetic acid produced in the world ends
in the form of polymers, mainly as derivatives of vinyl acetate and cellulose acetate
[3]. Other usages include the production of pharmaceuticals (e.g. acetyl salicylic acid)
[4], as a reaction solvent of purified terephtalic acid (PTA) for further production of
polyethylene terephthalate (PET) [3], and in the food industry, as an acidulant,
preservative and flavouring agent [5]. Its most common household usage is in the form
of vinegar and as a chemical descaler.
In the two main industrial production processes of acetic acid (oxidation of
hydrocarbons and methanol carbonylation [3,6]), water is removed from the crude
stream normally by distillation. These, and other processes involving acetic acid
aqueous mixtures, require therefore, accurate knowledge of the properties of the
phases at equilibrium.
Experimental vapour–liquid equilibria (VLE) data for the system (acetic acid + water)
are the most readily available of the carboxylic acids; more than 60 different articles
were found in the open literature. The oldest work seems to date back to 1921 [7] while
the most recent one to 2012 [8]. Most of the available data are isobaric, the majority
are made at sub- and atmospheric conditions. Wichterle, et al. [9,10] and Gmehling
and Onken [11] have compiled most of these work. None of the available literature, to
our knowledge, have reported azeotropic behaviour of the mixture.
Most of the isothermal data available are at temperatures below 373 K, a temperature
below the normal boiling point of acetic acid (391.05 K), mainly because of the
corrosive nature of the compounds; the common apparatus for these kind of
measurements is made of glass. Special alloys are required to handle the increasing
corrosive conditions encountered at higher temperatures. An exemption to the low
temperature data is that of Freeman and Wilson [12,13] who presented �–�–� data at

3
� = (372.77, 412.57, 462.06 and 502.86) K and pressures ranging from 56 kPa to
2778 kPa.
In this work, new pressure-composition (�–�) data were measured at � = (412.6,
443.2 and 483.2) K. The isotherm at 412.6 K from Freeman and Wilson [12] is used
for comparison of the new data. Experimental measurements were undertaken using
a static-analytical method with sampling of the liquid phase. Concentrations were
determined by Gas-Chromatography analysis.
On the other hand, use of a reliable thermodynamic model is necessary for
engineering design purposes. In general, use of thermodynamic models in the form of
equations of state (EoS) is preferred since these are applicable at a wider range of
pressures and since all properties can be derived from the same model. In the case
of (acetic acid + water) mixtures, the complex phase behaviour due to molecular
interactions such as association must be accounted for in the chosen thermodynamic
model.
The Perturbed-Chain Statistical Associating Fluid Theory (PC-SAFT) [14,15] EoS was
selected in this work to model the experimental data since it has been developed to
handle association interactions explicitly. In the PC-SAFT framework, the association
scheme for the molecules involved has to be defined, for which the classification of
Huang and Radosz [16] is commonly used. Based on previous studies [15,17-19] it
was decided in this work to model acetic acid with the 2B association scheme, while
water with the 4C association scheme. Pure component parameters were refitted in
each case. Additionally, the EoS results were compared with those obtained from the
UNIQUAC-HOC [20,21] activity coefficient model, where appropriate.
2 Experimental
2.1 Materials
Table 1 summarizes the chemical compounds used in the experiments as well as their
corresponding purities. Gas-Chromatography (GC) analysis of the purchased acetic
acid revealed two main peaks, one corresponding to the carboxylic acid while the other

4
to water in accordance with its hydrophilic characteristics. A third small peak
accounting for 0.028% of the mass sample was an unidentified impurity which was
considered to be part of the water content. Chemicals were used without further
purification and were only subjected to a degassing process as described in Section
2.3.
Table 1. Chemical compounds.
Chemicalname
CASnumber
SourceMole
fractionpurity
Analysismethod
aceticacid
64-19-7Sigma-Aldrich
0.9901 GCa
water 7732-18-5Sigma-Aldrich
1 -
a Gas-Chromatography.
2.2 Experimental apparatus and uncertainties
The experimental apparatus is described in detail in a previous publication [22]. It
consisted mainly of a modified high-pressure vessel made of Hastelloy C (Parr 4575
series) serving as the equilibrium cell with a volume of 250 mL and approximately 17
mm wall thickness; an air-bath (Applied Separations, model Spe-ed SFC) serving as
the temperature control environment; a digital pressure gauge (Keller-Druck, model
Lex1), range 0 to 2,000 kPa with ±1 kPa accuracy according to manufacturer’s
calibration certificate; T-type thermocouples: one located inside, one at the side and
one outside of the equilibrium cell; a thermocouple data logger (Pico Technology,
model TC-08) for monitoring and recording temperature; a vacuum pump (KNF
Neuberger Edwards, model Laboport PM 13196-840.3); a Hastelloy C internal stirrer;
a high-pressure liquid pump (Jasco, model PU-1586) and a GC (Agilent Technologies,
model 6850) for quantitative analysis.
The thermocouples were calibrated by comparing measured saturated temperatures
of water from � = 301 K to � = 487 K against data from NIST [23]. The equilibrium
cell temperature was controlled to within 0.1 K. Combined standard uncertainties in
temperature, ��(�), after calibration, control and resolution were ��(�) = 0.1 K.

5
Combined standard uncertainties in pressure, ��(�), after considering calibration,
repeatability and pressure drop during sampling were estimated as ��(�) = 1 kPa.
The GC was equipped with a TCD detector and a packed column 3 ft x 1/8” SS
Porapak N 80/100 mesh. GC operating conditions were: inlet temperature: 503 K;
oven temperature: 423 K, column flow: 40 mL/min (1 min), 60 mL/min (4 min) at 10
mL/min; detector temperature: 473 K; carrier gas: Helium CP grade (BOC, certified
purity ≥ 0.99999 mole fraction). 0.2 μL volume samples were injected with an
autosampler. The GC calibration procedure of Raal and Mühlbauer [24] for liquid
sample injections was adopted in this work. A linear relationship of area ratio vs. mass
fraction ratio was obtained from the low to the high acetic acid concentration regions.
Uncertainties in composition are presented for each experimental point in Section 4.
2.3 Procedure
The experimental procedure has been described previously [22,25] and is briefly
summarized as follows: the equilibrium cell was cleaned thoroughly before each
experimental run and subjected to a pressure test with compressed nitrogen. Acetic
acid and water were degassed for 1 h in an ultrasonic bath. A mixture of the
compounds was loaded into the equilibrium cell and the system was vacuumed down
between � = 1.5 kPa and � = 2.0 kPa at room temperature. The desired equilibrium
temperature was reached by increasing or decreasing the air bath temperature. The
system was allowed to reach equilibrium state under constant stirring, which was
assumed when temperature and pressure did not vary within ±0.05 K and ±0.5 kPa,
respectively, for at least 5 min. A minimum of five samples (20 μL each) of the liquid
phase were withdrawn and collected in 250 μL vial inserts. Pressure was increased by
adding water into the cell by means of the liquid-pump in order to stablish a new
experimental point.
6
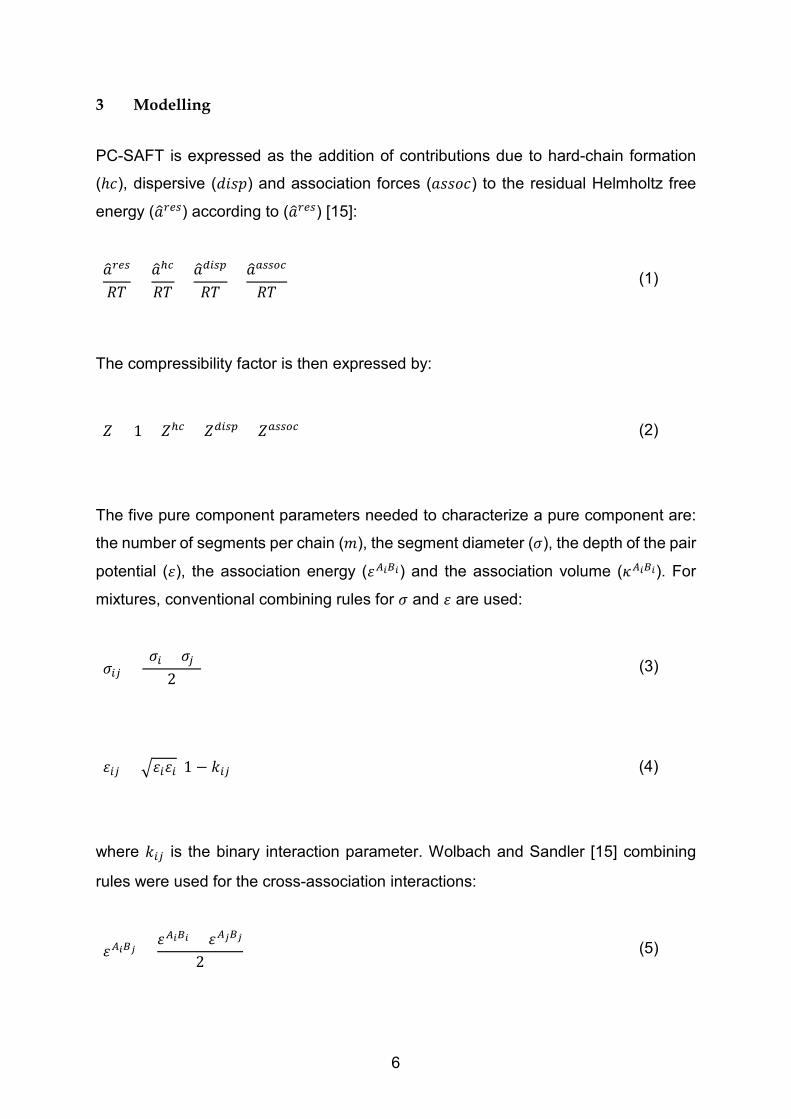
3 Modelling
PC-SAFT is expressed as the addition of contributions due to hard-chain formation
(ℎ�), dispersive (����) and association forces (�����) to the residual Helmholtz free
energy (�����) according to (�����) [15]:
�����
��=����
��+������
��+�������
��(1)
The compressibility factor is then expressed by:
� = 1 + ��� + ����� + ������ (2)
The five pure component parameters needed to characterize a pure component are:
the number of segments per chain (�), the segment diameter (�), the depth of the pair
potential (�), the association energy (�����) and the association volume (�����). For
mixtures, conventional combining rules for � and � are used:
��� =(�� + ��)
2(3)
��� = �����(1 − ���) (4)
where ��� is the binary interaction parameter. Wolbach and Sandler [15] combining
rules were used for the cross-association interactions:
����� =����� + �����
2(5)
7
����� = ����������� ������
(�� + ��)/2�
�
(6)
Pure component parameters were obtained by fitting vapour pressure (��) and liquid
density (��) data simultaneously with the procedure described in a previous
publication [22], with the following objective function:
�� = � ����,���� − ��,�
����
��,���� �
�
���,���� − ��,�
����
��,���� �
�
��
���
(7)
where ��� and ���� stand for an experimental and a calculated property, respectively;
and � is the number of experimental points used in the optimization.
The optimum ��� was obtained by regressing the experimental bubble point pressures
(�) with Eq. (8) as the objective function:
�� = � ������ − ��
����
����� �
��
���
(8)
4 Results and Discussion
4.1 Experimental
The experimental �–� data obtained at � = (412.6, 443.2 and 483.2) K as well as the
uncertainties in composition are shown in Table 2. Relative errors in the measured
water vapour pressures against reference data from NIST [23] were: 0.07, 0.12, and
0.40% at � = (412.6, 443.2 and 483.2) K, respectively.
A yellow-greenish colour liquid remained at the end of the experimental runs
evidencing corrosion. A more intense colour was observed at the maximum run
temperature of 483.2 K for a concentrated mixture of organic acid, for which a 0.01%
iron content was determined by spectrophotometry. Othmer, et al. [26] have shown in
8
their studies of (acetic acid + water) in a Type SS-316 still that a presence of 2%
content gave no interference to the phase behaviour when testing a 85 wt.% acetic
acid solution at � = 503 K and � = 2.17 MPa.
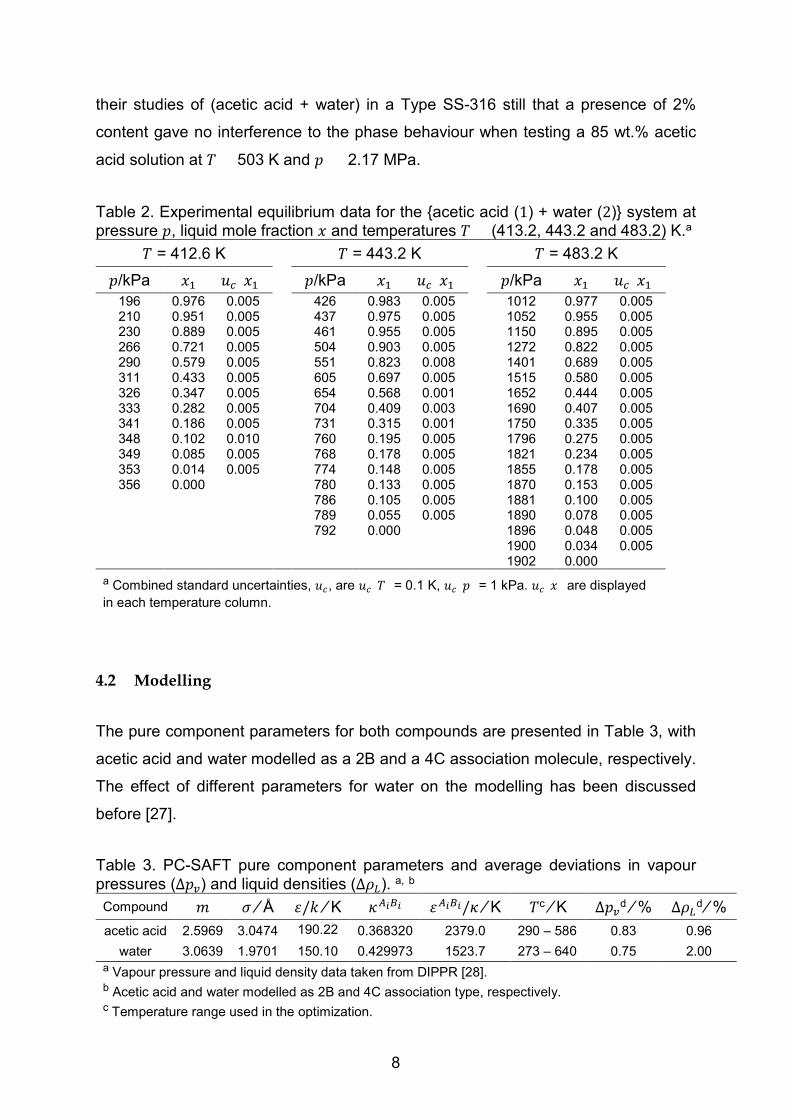
Table 2. Experimental equilibrium data for the {acetic acid (1) + water (2)} system atpressure �, liquid mole fraction � and temperatures � = (413.2, 443.2 and 483.2) K.a
� = 412.6 K � = 443.2 K � = 483.2 K
�/kPa �� ��(��) �/kPa �� ��(��) �/kPa �� ��(��)
196 0.976 0.005 426 0.983 0.005 1012 0.977 0.005210 0.951 0.005 437 0.975 0.005 1052 0.955 0.005230 0.889 0.005 461 0.955 0.005 1150 0.895 0.005266 0.721 0.005 504 0.903 0.005 1272 0.822 0.005290 0.579 0.005 551 0.823 0.008 1401 0.689 0.005311 0.433 0.005 605 0.697 0.005 1515 0.580 0.005326 0.347 0.005 654 0.568 0.001 1652 0.444 0.005333 0.282 0.005 704 0.409 0.003 1690 0.407 0.005341 0.186 0.005 731 0.315 0.001 1750 0.335 0.005348 0.102 0.010 760 0.195 0.005 1796 0.275 0.005349 0.085 0.005 768 0.178 0.005 1821 0.234 0.005353 0.014 0.005 774 0.148 0.005 1855 0.178 0.005356 0.000 780 0.133 0.005 1870 0.153 0.005
786 0.105 0.005 1881 0.100 0.005789 0.055 0.005 1890 0.078 0.005792 0.000 1896 0.048 0.005
1900 0.034 0.0051902 0.000
a Combined standard uncertainties, ��, are ��(�) = 0.1 K, ��(�) = 1 kPa. ��(�) are displayed
in each temperature column.
4.2 Modelling
The pure component parameters for both compounds are presented in Table 3, with
acetic acid and water modelled as a 2B and a 4C association molecule, respectively.
The effect of different parameters for water on the modelling has been discussed
before [27].
Table 3. PC-SAFT pure component parameters and average deviations in vapourpressures (��) and liquid densities (��).
a, b
Compound � � ⁄ Å �/� ⁄ K ����� �����/� ⁄ K �c ⁄ K Δ��d ⁄ % Δ��
d ⁄ %
acetic acid 2.5969 3.0474 190.22 0.368320 2379.0 290 – 586 0.83 0.96
water 3.0639 1.9701 150.10 0.429973 1523.7 273 – 640 0.75 2.00a Vapour pressure and liquid density data taken from DIPPR [28].b Acetic acid and water modelled as 2B and 4C association type, respectively.c Temperature range used in the optimization.

9
d � =���
�∑ �
����������
������
��� , for � either �� or ��.
The adjusted ��� were -0.0099, -0.0012 and -0.0016 for the (412.6, 443.2 and 483.2)
K isotherms, respectively. These values are one order of magnitude lower than the
ones reported in previous publications [18,19].
Figure 1 shows a comparison of the new data against those of the literature values of
Freeman and Wilson [12] at � = 412.6 K. Both data sources for the liquid compositions
agree relatively well. It is necessary, however, to point out some aspects of the
literature values. They exhibit a maximum pressure of � = 359 kPa in the dilute acetic
acid region after which the pressure decreases sharply, reaching a water vapour
pressure of 350.2 kPa. There is no obvious reason for this maximum to happen. It is
likely that repeatability was not easy to achieve because of thermal and composition
gradients not eliminated due to the lack of stirring. It is reasonable to assume that
deviations in pressure must be larger than the reported ones since the stated vapour
pressure of water at 412.6 K gives a relative error of 1.6% (NIST data as reference) in
contrast to that of 0.07% of this work. One can conclude that the experimental values
of the liquid compositions obtained in the present work are more reliable than those
reported by the previous authors, although the accuracy reported in the literature is
actually lower (��(��) = 0.001 vs. an average of ��(��) = 0.005 in this work).
Figure 1 also presents the modelling results with PC-SAFT, and as a comparison,
modelling with the UNIQUAC [20] activity coefficient coupled with the Hayden-
O’Connell term [21] (UNIQUAC-HOC), which considers the non-idealities of the
vapour phase of organic acids, is presented as well. The following default pure
compound and binary interaction parameters were used in the UNIQUAC-HOC model:
association parameter (�) = 4.5, 1.7 and 2.5 for the acetic acid, water and cross-
interactions, respectively; ��� = 0.7446, ��� = 0.0042, ��� =-615.264 and ��� =
196.899. As can be seen, in general the liquid phase concentrations are better
correlated by PC-SAFT, even in the dilute acetic acid region (Figure 2) with the
exception of the concentrations of �� < 0.014.
10
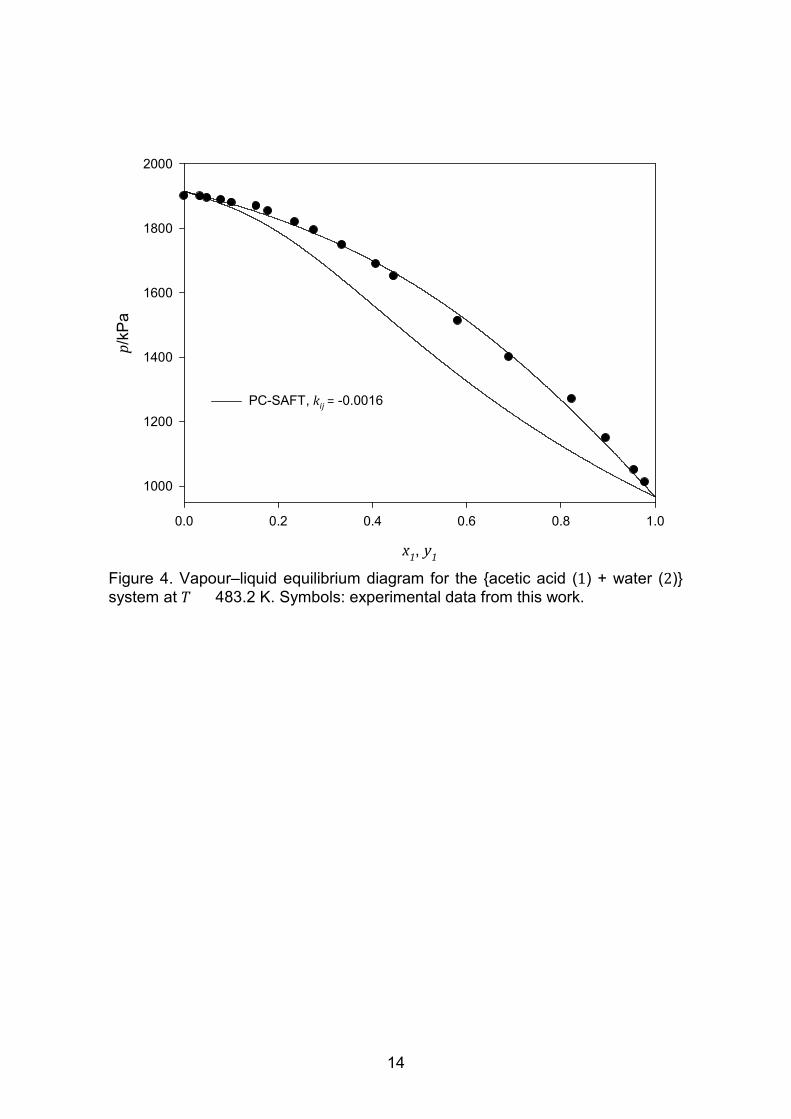
The isotherms at 443.2 K and 483.2 K are presented in Figures 3 and 4, respectively.
It can be observed that PC-SAFT can correlate satisfactorily the bubble pressures at
both temperatures.
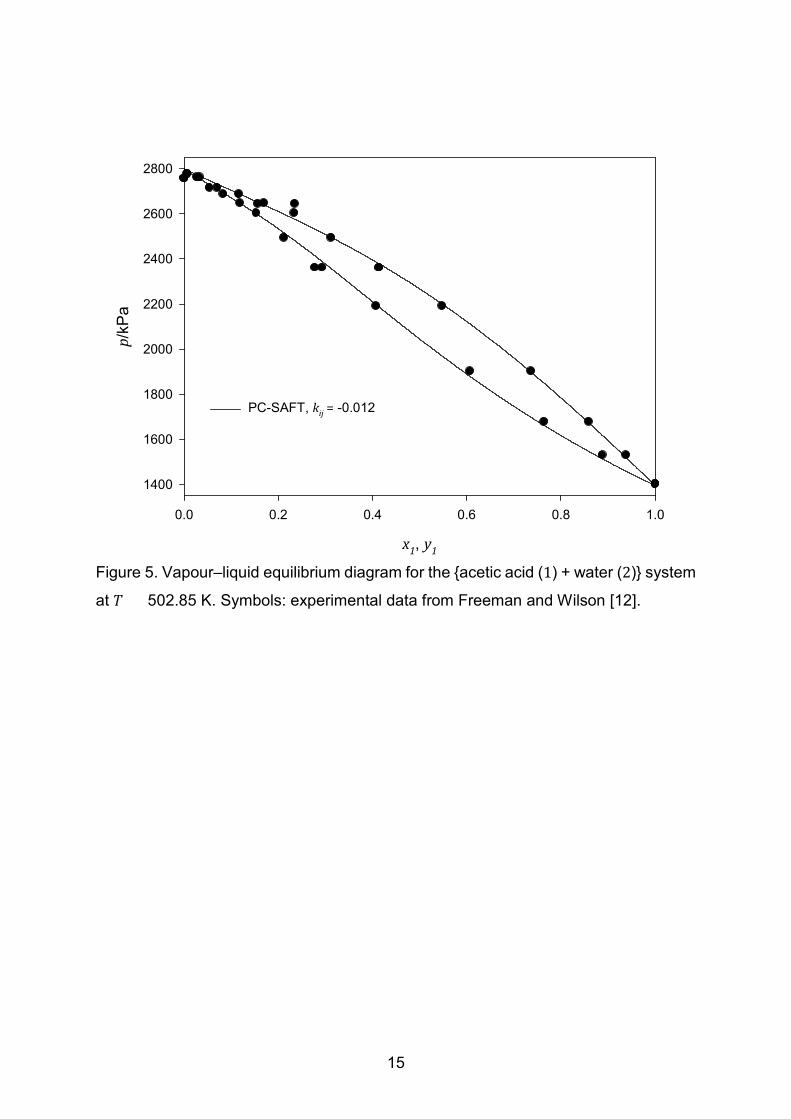
As an additional plot, the isotherm reported by Freeman and Wilson [12] at � = 502.85
K is presented in Figure 5. PC-SAFT is able to model accurately the compositions of
both phases with ��� = -0.012.

11
Figure 1. Vapour–liquid equilibrium diagram for the {acetic acid (1) + water (2)} systemat � = 412.6 K. Experimental data: (x) Freeman and Wilson [12]; (●) this work.
x1, y1
0.0 0.2 0.4 0.6 0.8 1.0
p/k
Pa
180
200
220
240
260
280
300
320
340
360
PC-SAFT, kij = -0.0099
UNIQUAC-HOC

12
x1, y1
0.00 0.05 0.10 0.15 0.20 0.25 0.30
p/k
Pa
310
320
330
340
350
360
PC-SAFT, kij = -0.0099
UNIQUAC-HOC
Figure 2. Vapour–liquid equilibrium diagram for the {acetic acid (1) + water (2)}system in the �� =(0 to 0.3) region at � = 412.6 K. Experimental data: (x)Freeman and Wilson [12]; (●) this work.

13
Figure 3. Vapour–liquid equilibrium diagram for the {acetic acid (1) + water (2)}system at � = 443.2 K. Symbols: experimental data from this work.
x1, y1
0.0 0.2 0.4 0.6 0.8 1.0
p/k
Pa
400
500
600
700
800
PC-SAFT, kij = -0.0012
UNIQUAC-HOC
14
x1, y1
0.0 0.2 0.4 0.6 0.8 1.0
p/k
Pa
1000
1200
1400
1600
1800
2000
PC-SAFT, kij = -0.0016
Figure 4. Vapour–liquid equilibrium diagram for the {acetic acid (1) + water (2)}system at � = 483.2 K. Symbols: experimental data from this work.
15
Figure 5. Vapour–liquid equilibrium diagram for the {acetic acid (1) + water (2)} system
at � = 502.85 K. Symbols: experimental data from Freeman and Wilson [12].
x1, y1
0.0 0.2 0.4 0.6 0.8 1.0
p/k
Pa
1400
1600
1800
2000
2200
2400
2600
2800
PC-SAFT, kij = -0.012
16
5 Conclusions
Experimental pressures and liquid phase compositions were measured for the (acetic
acid + water) system at the temperatures of (412.6, 443.2 and 483.2) K. PC-SAFT,
with water modelled as a 2B and acetic acid as a 4C association molecule, was able
to correlate satisfactorily the experimental data including high-pressure data. New
pure component parameters for acetic acid and water are presented for the
corresponding association schemes.
Acknowledgments
L.A. Román-Ramírez gratefully acknowledges the National Council for Science and
Technology (CONACyT) of Mexico for their financial support through a PhD fellowship.
The authors would like to thank the technical assistance of Mr Robert W. Sharpe in
setting up the experimental equipment.
17
References
[1] Grand View Research Acetic Acid Market Analysis and Segment Forecasts to 2020.http://www.grandviewresearch.com/industry-analysis/acetic-acid-market (7 August 2014).
[2] Companies and Markets.com Acetic Acid Global Market to 2020.http://www.companiesandmarkets.com/Market/Chemicals/Market-Research/Acetic-Acid-Global-Market-to-2020/RPT1134064?aCode=b665b089-afc2-4102-9abd-a47c38e3ae3c (30July 2014).
[3] Cheung, H.; Tanke, R. S.; Torrence, G. P., Acetic Acid. In Ullmann's Encyclopedia ofIndustrial Chemistry [online]; Wiley-VCH: 2011; pp. 209-237.http://dx.doi.org/10.1002/14356007.a01_045.pub2 (30 July 2014).
[4] Burdick, D. L.; Leffler, W. L., Petrochemicals in Nontechnical Language. In [online]; 3rd ed.;PennWell: 2001; pp. 256-261.http://app.knovel.com/hotlink/toc/id:kpPNTLE002/petrochemicals-in-nontechnical/petrochemicals-in-nontechnical (30 July 2014).
[5] Stratford, M., Traditional Preservatives - Organic Acids. In Encyclopedia of FoodMicrobiology [online]; Elsevier: 2000; Vol. 1-3, pp. 1729-1737.http://app.knovel.com/hotlink/toc/id:kpEFMV0004/encyclopedia-food-microbiology/encyclopedia-food-microbiology (01 August 2014).
[6] Chiusoli, G. P.; Maitlis, P. M., Metal-Catalysis in Industrial Organic Processes. In [online];Royal Society of Chemistry: 2006; pp. 119-120.http://app.knovel.com/hotlink/toc/id:kpMCIOP001/metal-catalysis-in-industrial/metal-catalysis-in-industrial (July 2014).
[7] Pascal, P.; Dupuy, E.; Garnier, M., Study of Binary and Ternary Mixtures Found in theManufacture of Synthetic Acetic Acid. Bull. Soc. Chim. Fr. 1921, 29, 9-21.
[8] Xin, H.; Wang, X.; Li, J. Q., Isobaric Vapor–Liquid Equilibria for the System ContainingAcetic Acid at 101.3 kPa. Advanced Materials Research 2012, 560-561, 79-85.
[9] Wichterle, I.; Linek, J.; Hála, E., Vapor–Liquid Equilibrium Data Bibliography. Elsevier:Amsterdam, 1973.
[10] Wichterle, I.; Linek, J.; Hála, E., Vapor–Liquid Equilibrium Data Bibliography: Supplement.Elsevier: Amsterdam, 1976.
[11] Gmehling, J.; Onken, U., Vapor–Liquid Equilibrium Data Collection: Aqueous–OrganicSystems. Chemistry Data Series. DECHEMA: Frankfurt, Germany, 1977; Vol. 1. Part 1.
[12] Freeman, J. R.; Wilson, G. M., High Temperature Vapor–Liquid EquilibriumMeasurements on Acetic Acid/Water Mixtures. In AIChE Symposium Series 244, Benson, M.S.; Zudkevitch, D., Eds. American Institute of Chemical Engineers: New York, 1985; Vol. 81,pp 14-25.

18
[13] Freeman, J. R.; Wilson, G. M., High Temperature PVT Properties of Acetic Acid/WaterMixtures. In AIChE Symposium Series 244, Benson, M. S.; Zudkevitch, D., Eds. AmericanInstitute of Chemical Engineers: New York, 1985; Vol. 81, pp 1-13.
[14] Gross, J.; Sadowski, G., Perturbed-Chain SAFT: An Equation of State Based on aPerturbation Theory for Chain Molecules. Ind. Eng. Chem. Res. 2001, 40, 1244-1260.
[15] Gross, J.; Sadowski, G., Application of the Perturbed-Chain SAFT Equation of State toAssociating Systems. Ind. Eng. Chem. Res. 2002, 41, 5510-5515.http://dx.doi.org/10.1021/ie010954d.
[16] Huang, S. H.; Radosz, M., Equation of State for Small, Large, Polydisperse, andAssociating Molecules. Ind. Eng. Chem. Res. 1990, 29, 2284-2294.
[17] Kouskoumvekaki, I. A.; Krooshof, G. J. P.; Michelsen, M. L.; Kontogeorgis, G. M.,Application of the Simplified PC-SAFT Equation of State to the Vapor–Liquid Equilibria ofBinary and Ternary Mixtures of Polyamide 6 with Several Solvents. Ind. Eng. Chem. Res.2004, 43, 826-834. http://dx.doi.org/10.1021/ie034082m.
[18] Chen, Y.; Afef, A.; Fabrice, M.; Roland, S.; Jeday, M. R., Thermodynamic Modeling ofMixtures Containing Carboxylic Acids Using the PC-SAFT Equation of State. Ind. Eng. Chem.Res. 2012, 51, 13846-13852. http://dx.doi.org/10.1021/ie301930q.
[19] Janecek, J.; Paricaud, P., Influence of Cyclic Dimer Formation on the Phase Behavior ofCarboxylic Acids. II. Cross-Associating Systems. J. Phys. Chem. B 2013, 117, 9430-9438.http://dx.doi.org/10.1021/jp4012125.
[20] Abrams, D. S.; Prausnitz, J. M., Statistical Thermodynamics of Liquid Mixtures: A NewExpression for Excess Gibbs Energy of Partly or Completely Miscible Systems. AlChE J. 1975,21, 116-128. http://dx.doi.org/10.1002/aic.690210115.
[21] Hayden, J. G.; O'Connell, J. P., A Generalized Method for Predicting Second VirialCoefficients. Industrial and Engineering Chemistry Process Design and Development 1975,14, 209-216. http://dx.doi.org/10.1021/i260055a003.
[22] Román-Ramírez, L. A. Vapour – Liquid Equilibria of Acetic Acid + Water and PropanoicAcid + Water: Experimental Measurement and Thermodynamic Modelling. PhD, TheUniversity of Birmingham, Birmingham, United Kingdom, 2015.
[23] NIST. Chemistry Webbook. NIST Standard Reference Database 69. [online];http://webbook.nist.gov/chemistry/ (October 2012).
[24] Raal, J. D.; Mühlbauer, A. L., Phase Equilibria: Measurement and Computation. Taylor &Francis: Washington D.C., USA, 1998.
[25] Román-Ramírez, L. A.; García-Sánchez, F.; Santos, R. C. D.; Leeke, G. A., Vapour–Liquid Equilibrium of Propanoic Acid + Water at 423.2, 453.2 and 483.2 K from 1.87 to 19.38bar. Experimental and Modelling with PR, CPA, PC-SAFT and PCP-SAFT. Fluid PhaseEquilib. 2015, 388, 151-159. http://dx.doi.org/10.1016/j.fluid.2015.01.004.
19
[26] Othmer, D. F.; Silvis, S. J.; Spiel, A., Composition of Vapors from Boiling Binary Solutions.Pressure Equilibrium Still for Studying Water–Acetic Acid System. Ind. Eng. Chem. 1952, 44,1864-1872. http://dx.doi.org/10.1021/ie50512a041.
[27] Liang, X.; Tsivintzelis, I.; Kontogeorgis, G. M., Modeling Water Containing Systems withthe Simplified PC-SAFT and CPA Equations of State. Ind. Eng. Chem. Res. 2014, 53, 14493-14507. http://dx.doi.org/10.1021/ie501993y.
[28] DIPPR, 801 Database. Data Compilation of Pure Compound Properties. AIChE: 2012.

20
x, y acetic acid
0.0 0.2 0.4 0.6 0.8 1.0
p/k
Pa
500
1000
1500
2000
T = 412.6 K
T = 443.2 K
T = 483.2 K
for Table of Contents use only.�–� data of (acetic acid + water) at � = (412.6, 443.2, 483.2) K.
Luis A. Román-Ramírez
Gary A. Leeke