Embed Size (px)
Citation preview
Hands-On LabExploratory Testing using Microsoft Test Manager 2013Lab version: 12.0.30723.00 Update 3
Last updated: 8/1/2014
CONTENTS
OVERVIEW................................................................................................................................................. 3
EXERCISE 1: EXPLORATORY TESTING INTRODUCTION.....................................................................4
Overview
In this lab, you will learn about the exploratory testing capabilities provided in Microsoft Test Manager 2013. You will learn about how exploratory testing (also called XT, or agile testing) has become a first-class experience in the toolset. This allows a tester to more flexibly test the underlying software without relying solely on formal test cases. Meanwhile, Microsoft Test Manager will continue to capture rich diagnostics about the application being tested which can be delivered to the development team if a bug is discovered. You’ll also learn about some of the other fit-and-finish features in Microsoft Test Manager, such as the ability to use rich text when authoring test cases.
Prerequisites
In order to complete this lab you will need the Visual Studio 2013 virtual machine provided by Microsoft. For more information on acquiring and using this virtual machine, please see this blog post.
About the Fabrikam Fiber Scenario
This set of hands-on-labs uses a fictional company, Fabrikam Fiber, as a backdrop to the scenarios you are learning about. Fabrikam Fiber provides cable television and related services to the United States. They are growing rapidly and have embraced Windows Azure to scale their customer-facing web site directly to end-users to allow them to self-service tickets and track technicians. They also use an on-premises ASP.NET MVC application for their customer service representatives to administer customer orders.
In this set of hands-on labs, you will take part in a number of scenarios that involve the development and testing team at Fabrikam Fiber. The team, which consists of 8-10 people, has decided to use Visual Studio application lifecycle management tools to manage their source code, run their builds, test their web sites, and plan and track the project.
Change log
For Update 3:
Screenshot updates as necessary, other minor edits
Exercises
This hands-on lab includes the following exercises:
1. Exploratory Testing Introduction
Estimated time to complete this lab: 30 minutes.
Exercise 1: Exploratory Testing Introduction
In this exercise, you will learn about some of the exploratory testing capabilities of Microsoft Test Manager 2013 that make exploratory testing easier on the software tester.
1. Log in as Adam (VSALM\Adam). All user passwords are P2ssw0rd.
2. Launch Microsoft Test Manager from the taskbar. Microsoft Test Manager allows testers to work with test plans, author and organize manual test cases, execute test cases, file bugs, and post results back to Team Foundation Server.
3. Connect to the FabrikamFiber team project. You may need to press the Home button and the Change Project button to get to the team project selection window.
Figure 1Connecting to the FabrikamFiber team project
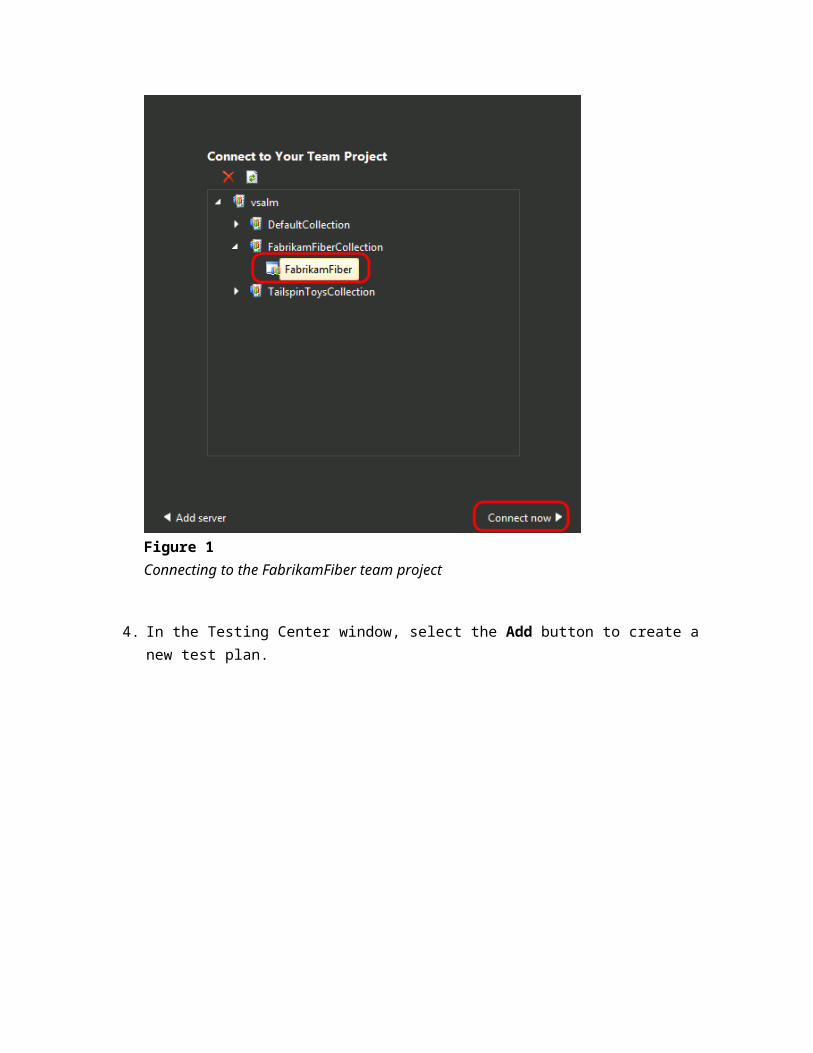
4. In the Testing Center window, select the Add button to create a new test plan.
Figure 2Adding a new test plan
5. Enter “Exploratory Testing” as the name of the new plan and then select the Add button.
Figure 3Adding a new test plan
6. Select the Select Plan button to open it.
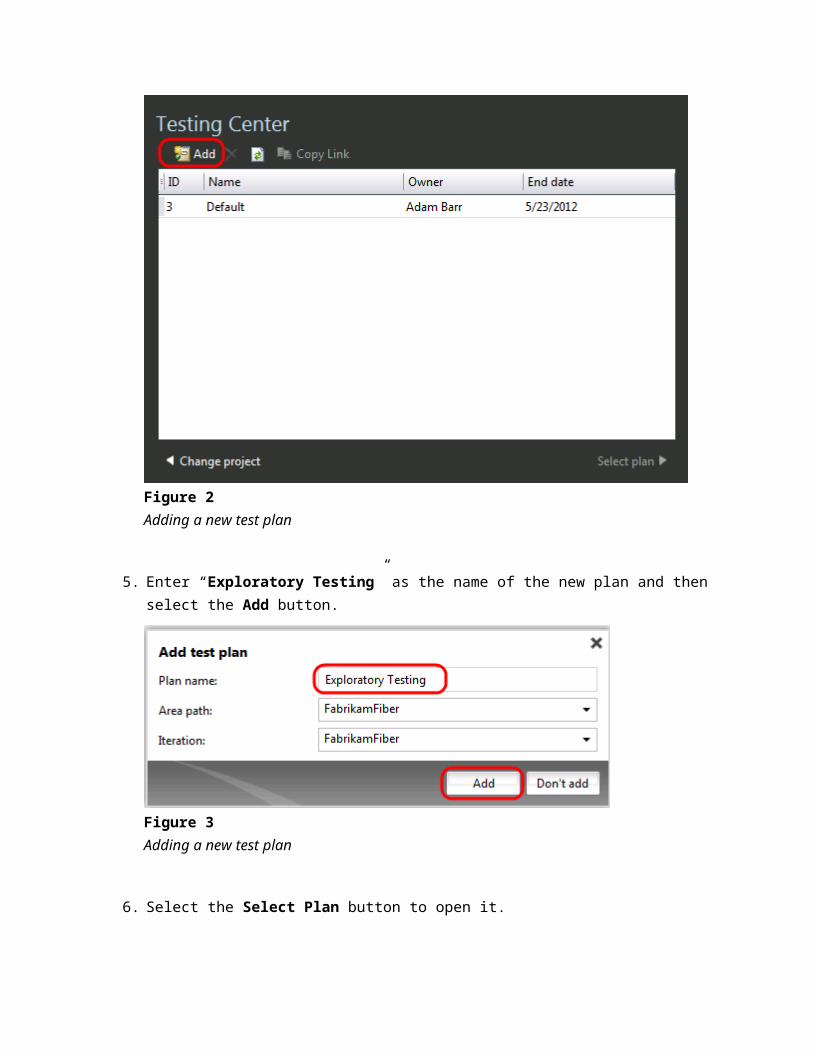
Figure 4Opening the new exploratory testing plan
7. You should now be in the Testing Center and connected to the Exploratory Testing test plan.
Figure 5Testing Center showing exploratory testing plan
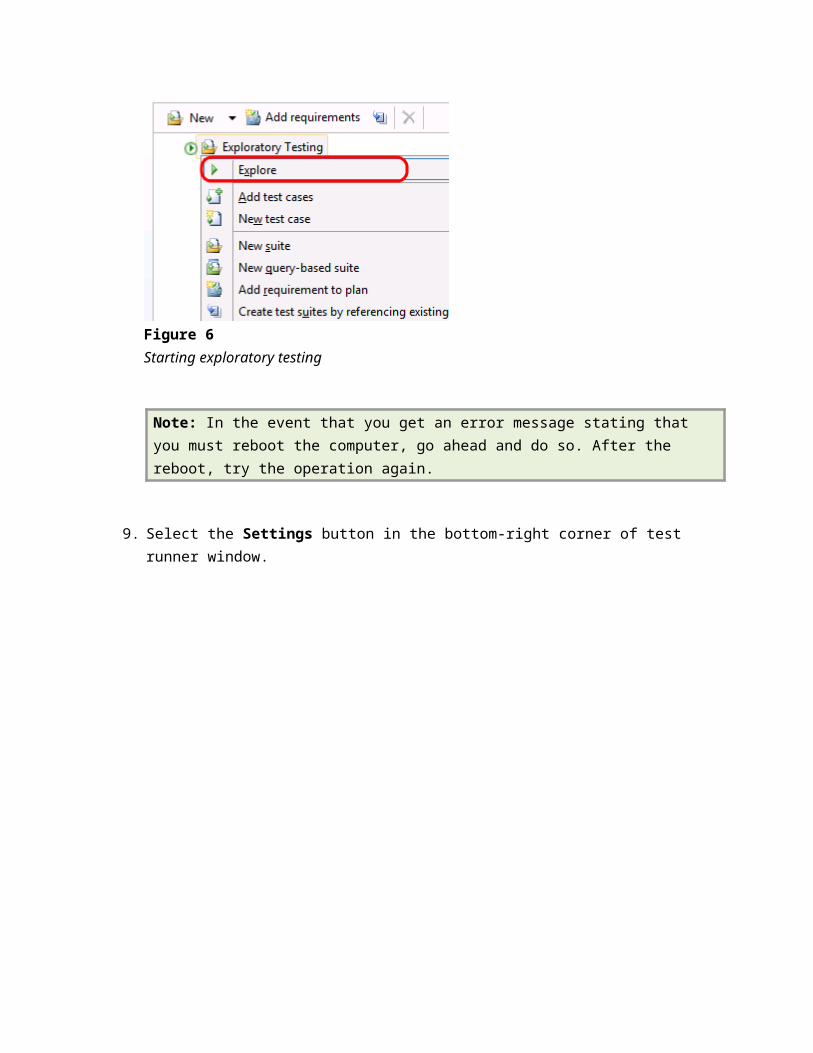
8. Right-click on the Exploratory Testing test plan node and select the Explore option from the context menu.
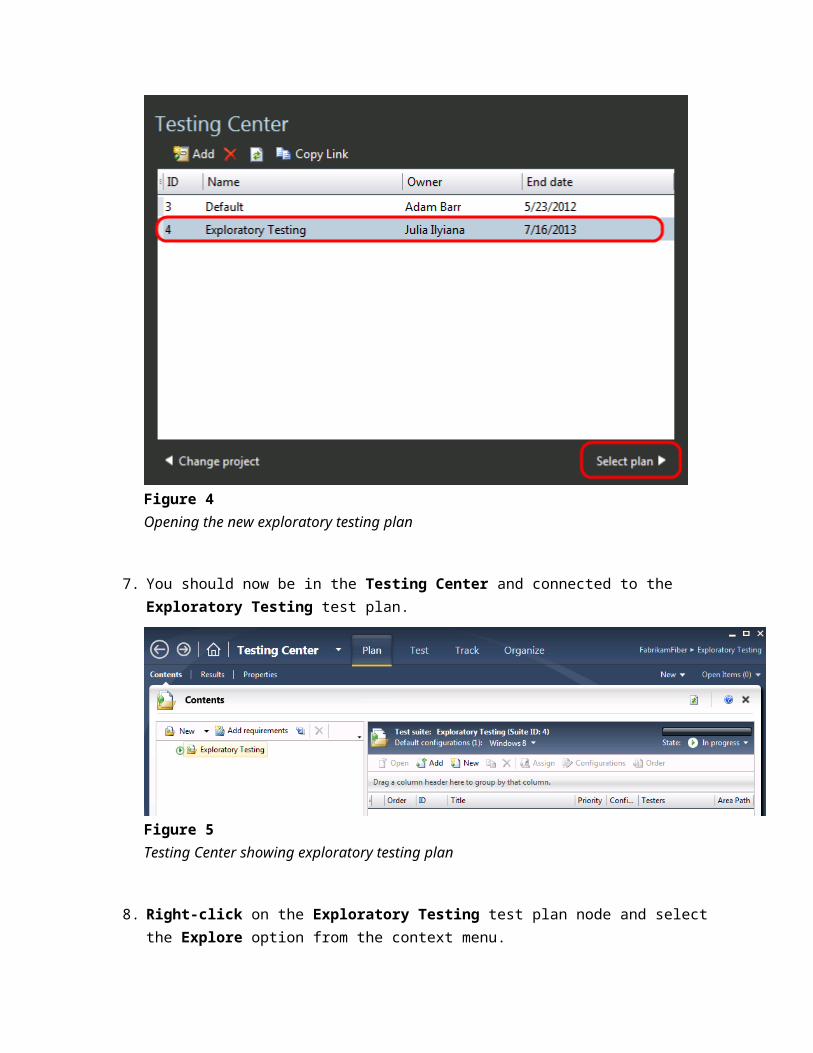
Figure 6Starting exploratory testing
Note: In the event that you get an error message stating that you must reboot the computer, go ahead and do so. After the reboot, try the operation again.
9. Select the Settings button in the bottom-right corner of test runner window.
Figure 7
Location of test runner settings button
10. Note that we can modify screenshot settings and select an audio recording device here. Since this virtual machine does not support audio, we will not attempt to make a selection. Select the Escape key to continue.
Figure 8Viewing current settings
11. Select the green Start button to start an exploratory testing session.
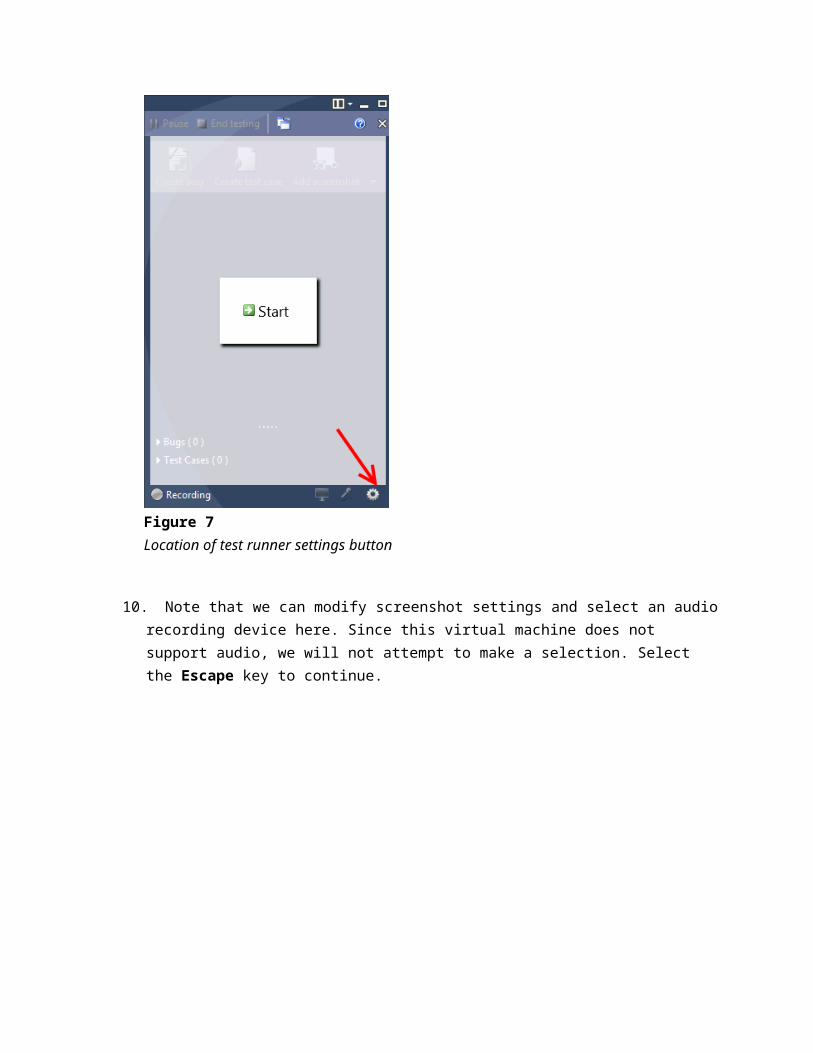
Figure 9Starting the test runner for exploratory testing
12. Launch Internet Explorer and load the Fabrikam Fiber intranet portal by clicking on the FF Intranet link in the favorites bar. You should now see the dashboard page.
Figure 10Launching the Fabrikam Fiber intranet portal
13. Select the Tickets menu link of the Fabrikam Fiber intranet portal site to view all the service tickets.
Figure 11Navigating to Tickets screen
14. Select one of the service ticket links to view the details.
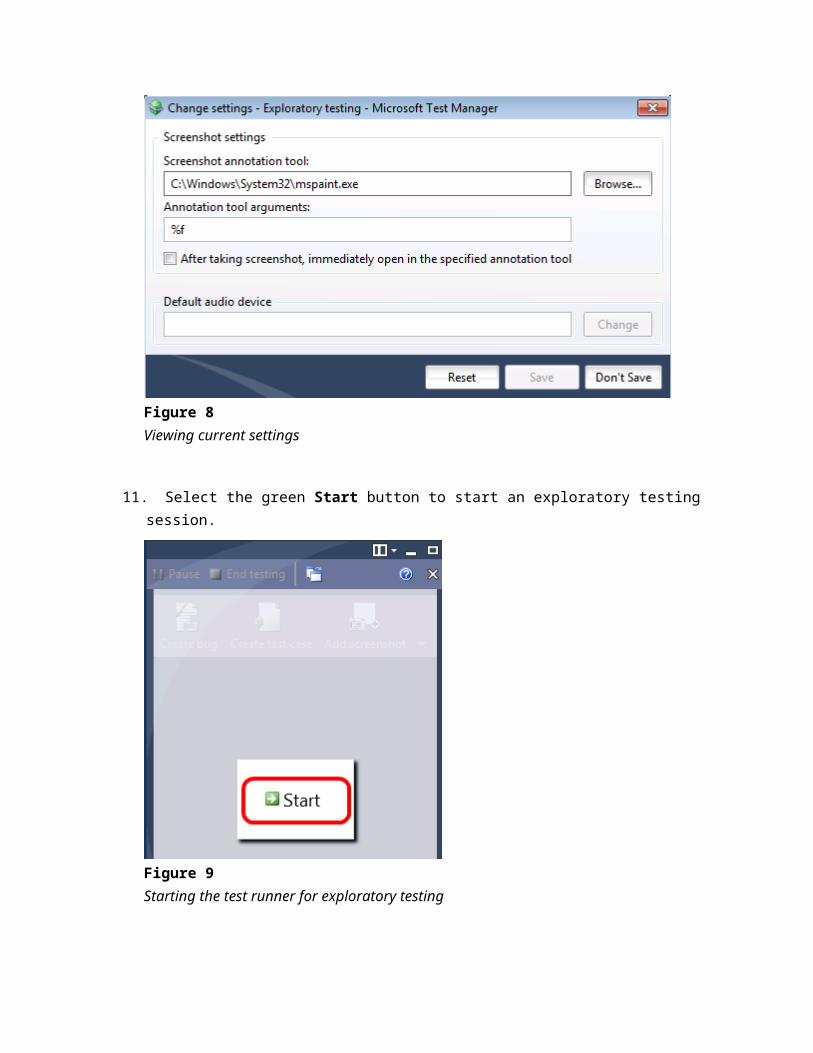
Figure 12Selecting a service ticket to view details
15. Note that the Created By and Assigned To fields currently show appropriate values.
Figure 13Viewing service ticket details
16. Select the Edit link near the bottom of the ticket details page (you may need to scroll down).
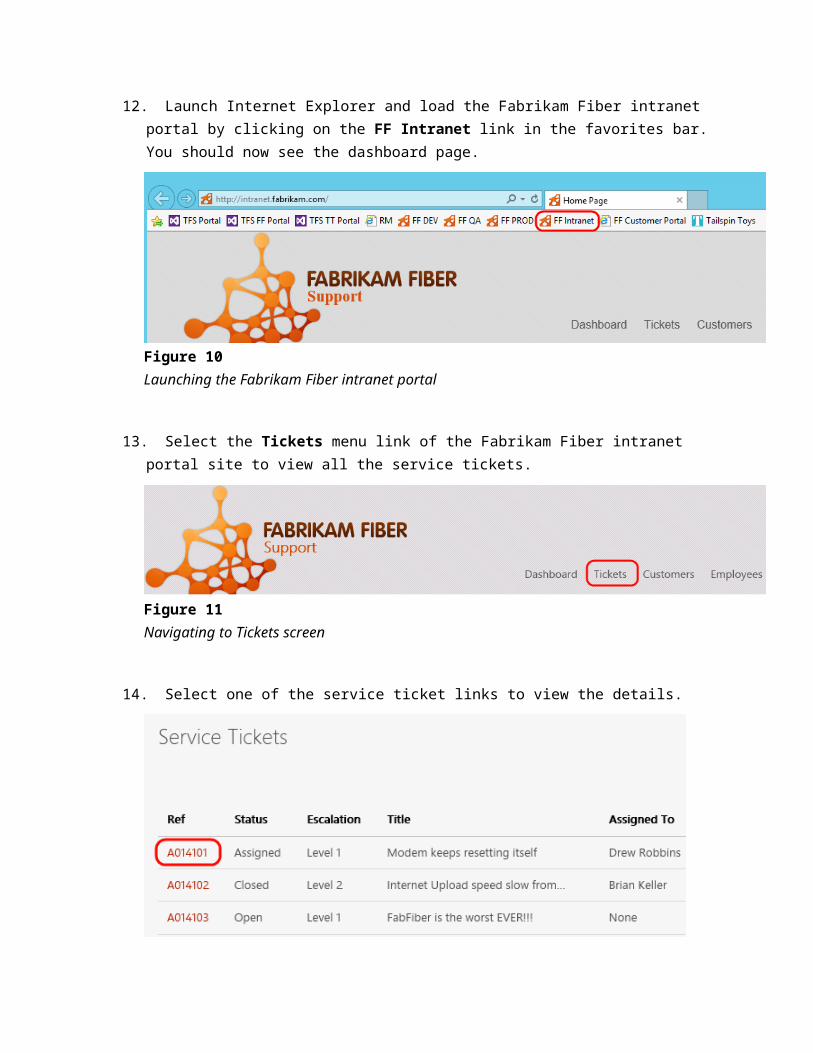
Figure 14Editing a service ticket
17. Note that the Created By property still shows an appropriate value.
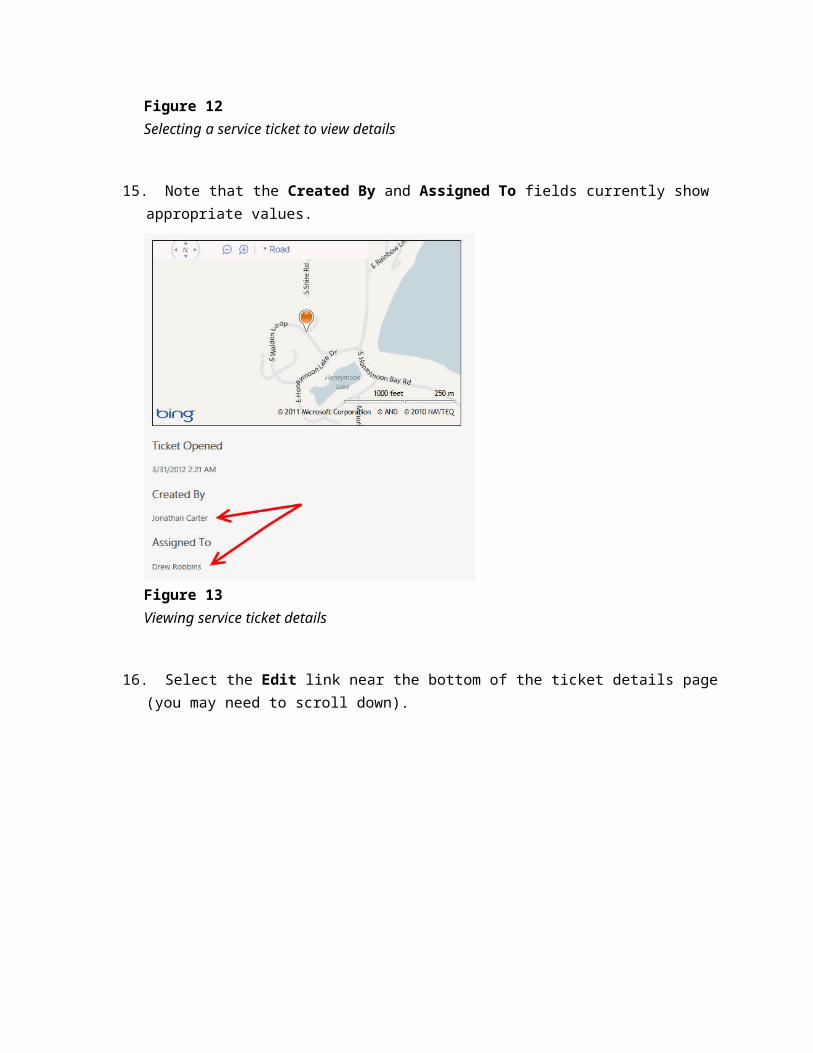
Figure 15Edit page for service ticket
18. Select the Save button. As expected, Created By and Assigned To properties are still the same as they were before.
Figure 16Saving ticket details
19. Select the Delete button to delete the ticket.
Figure 17Deleting a service ticket
20. In the Delete confirmation page, note that the Created By and Assigned To properties are now set to None, which is not what we were expecting. In the comments box of the test runner, enter the text “CreatedBy and AssignedTo are blank when viewing Delete confirmation page.” Press the Enter key twice to leave room for a screenshot.
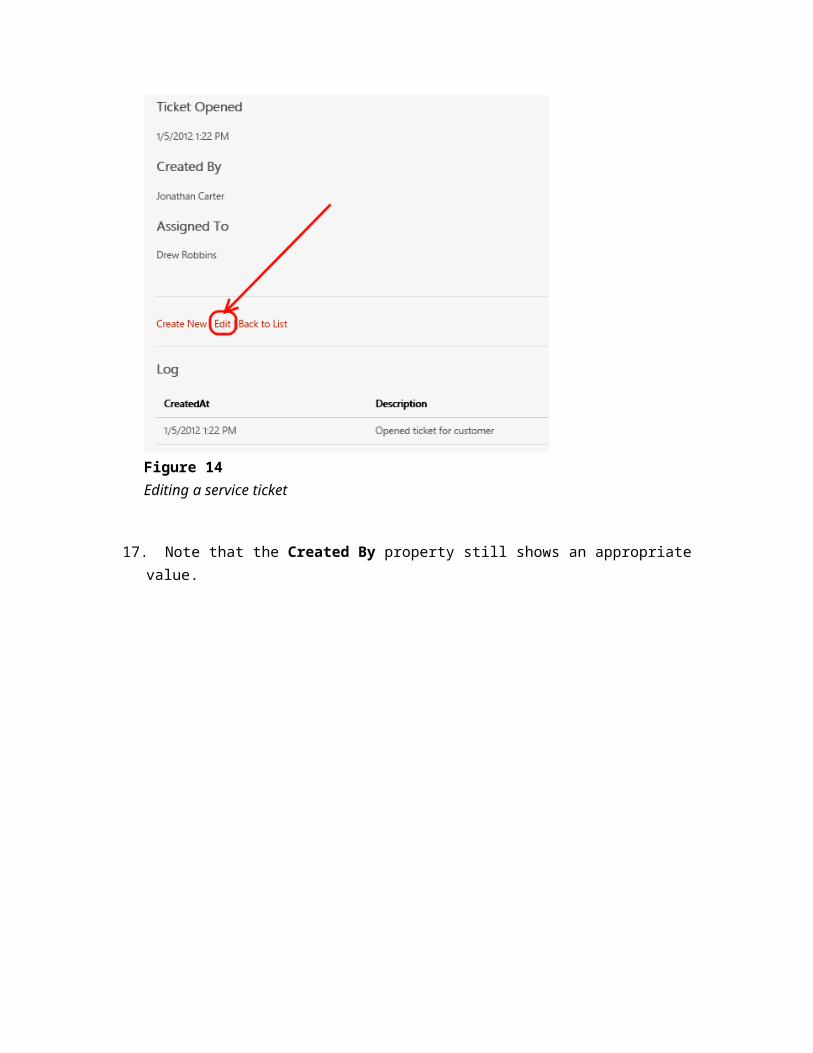
Figure 18Delete confirmation page showing unexpected values
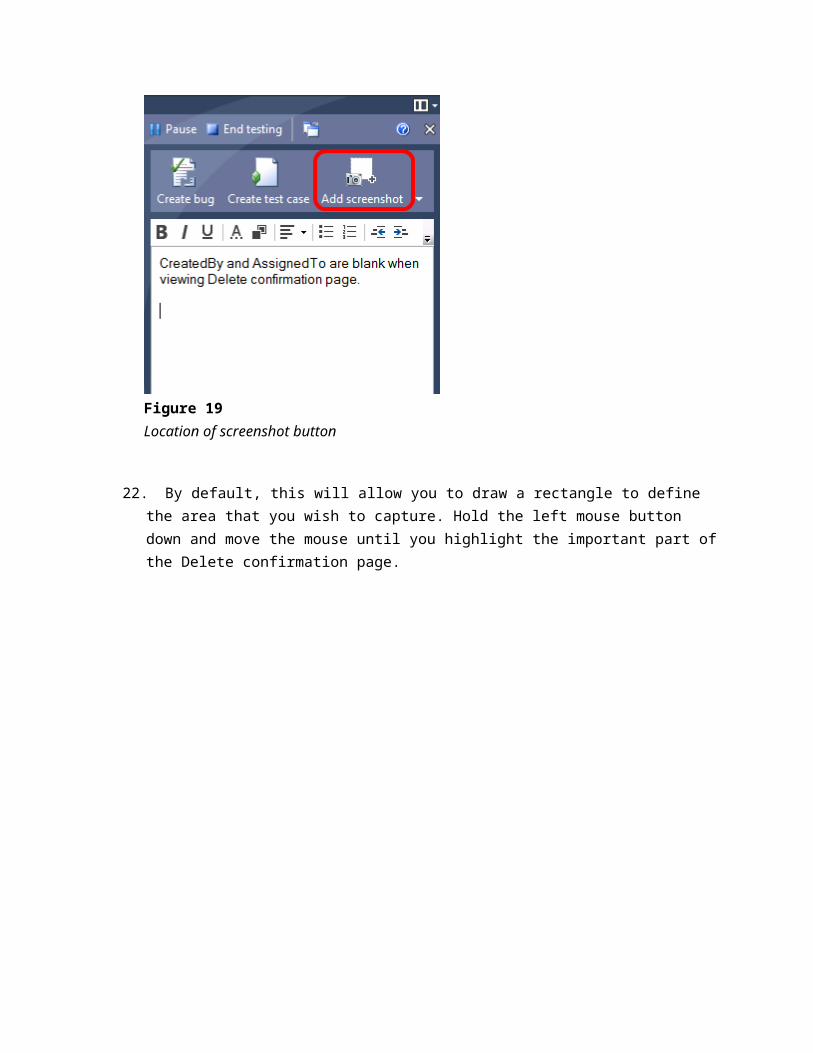
21. Select the Add Screenshot button to add a screenshot of the Delete confirmation page to provide some context.
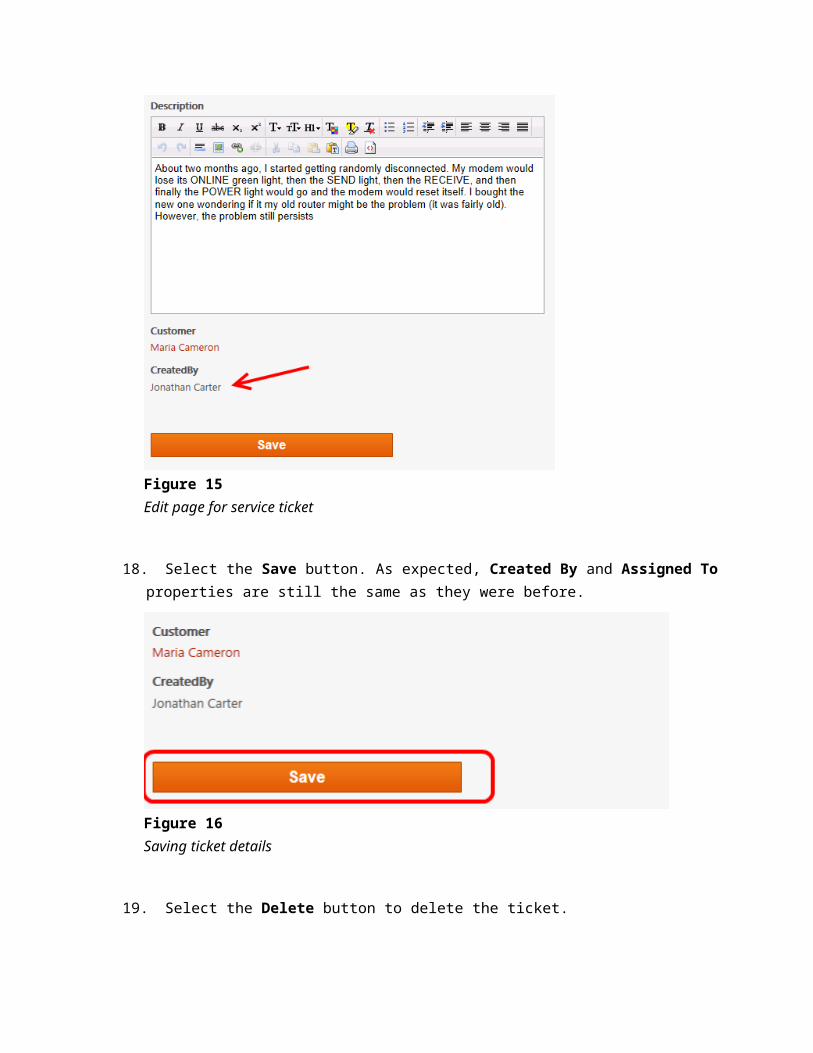
Figure 19Location of screenshot button
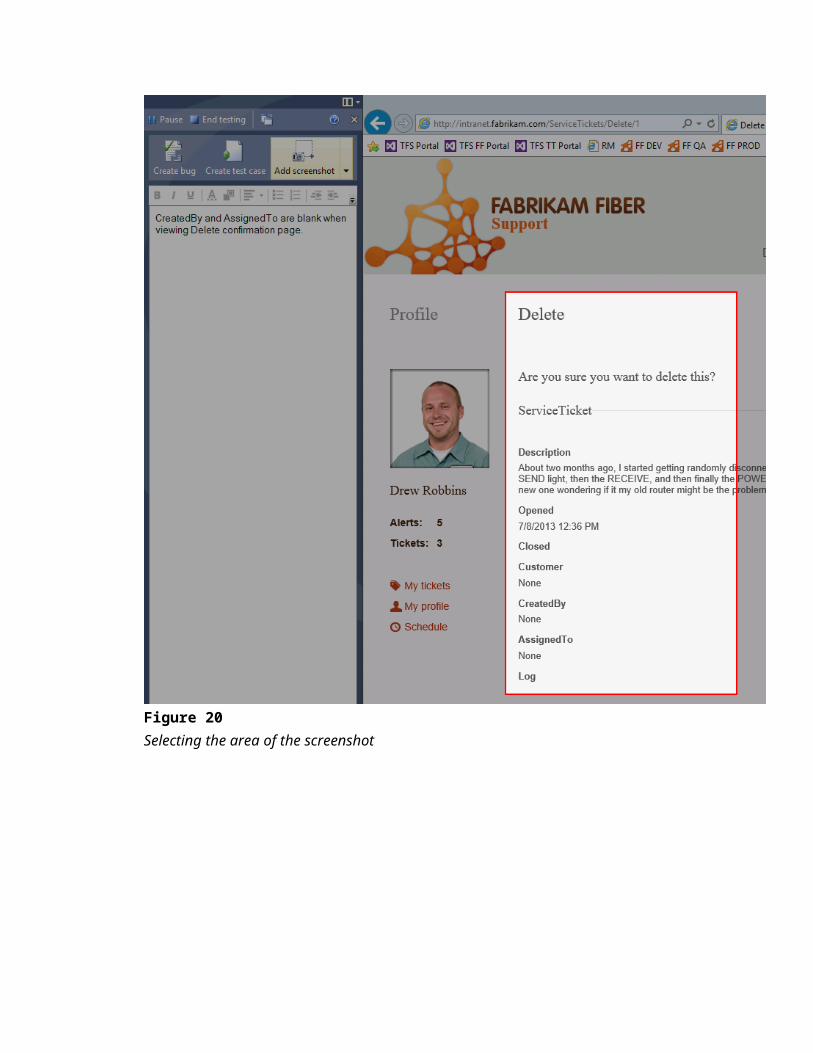
22. By default, this will allow you to draw a rectangle to define the area that you wish to capture. Hold the left mouse button down and move the mouse until you highlight the important part of the Delete confirmation page.

Figure 20Selecting the area of the screenshot
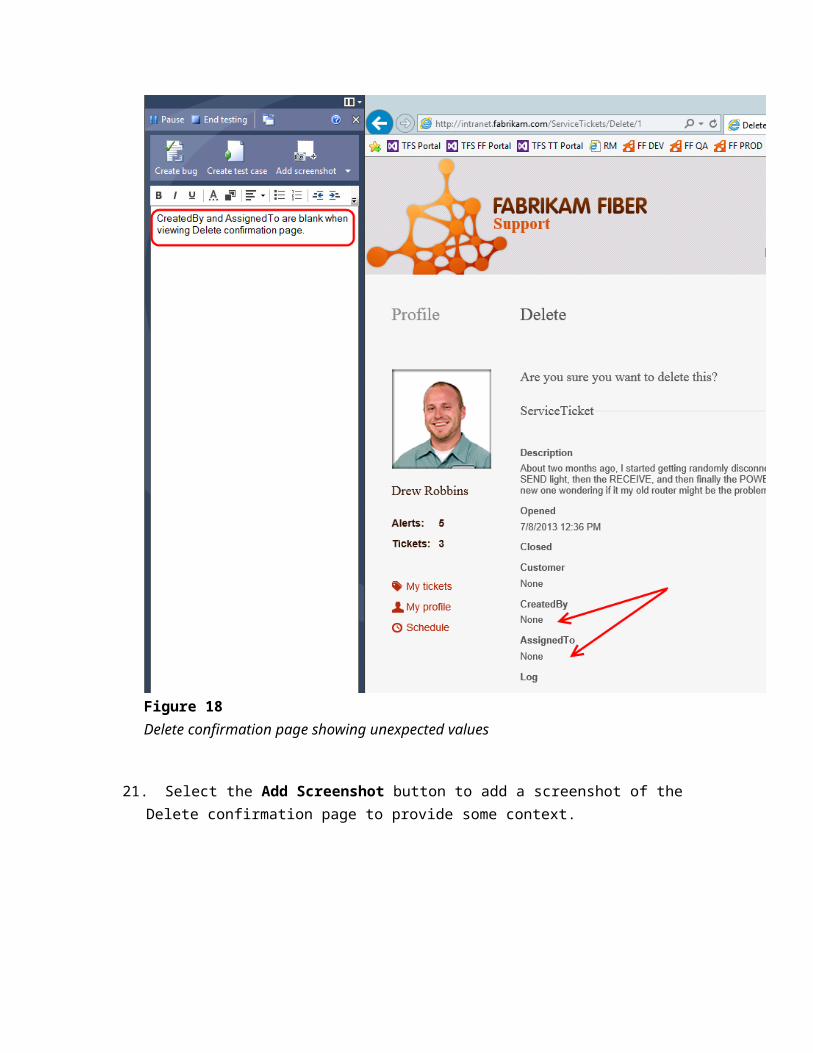
Figure 21Test runner window showing inserted screenshot
Note: You can double-click on the screen capture to edit it in a paint program to provide additional annotation if desired. By default, MS Paint is used, but you can use your tool of choice by configuring this in the settings dialog that you saw at the beginning of this exercise.
23. Select the Create Bug button to file a new bug.
Figure 22Creating a new bug
24. For the title, enter “CreatedBy and AssignedTo are blank when viewing Delete confirmation page” and assign the bug to Julia Ilyiana. Note that your observations, repro steps and diagnostic data are automatically included. Select the Save and Create Test button to finish filing the new bug.
Figure 23Creating a new bug as the result of exploratory testing
25. In the New Test Case window, enter a title of “Confirm that AssignedTo and CreatedBy fields appear on Delete confirmation page.”
26. In the Steps section of the New Test Case window, locate the row that starts with “Click ‘Delete’ link” and add the following text in the Expected Result column:
AssignedTo and CreatedBy fields should have appropriate values when viewing Delete confirmation page
Figure 24Adding notes to the Expected Result column for a step
27. Note that the steps section of the test case also has rich text capability. Feel free to experiment with this capability.
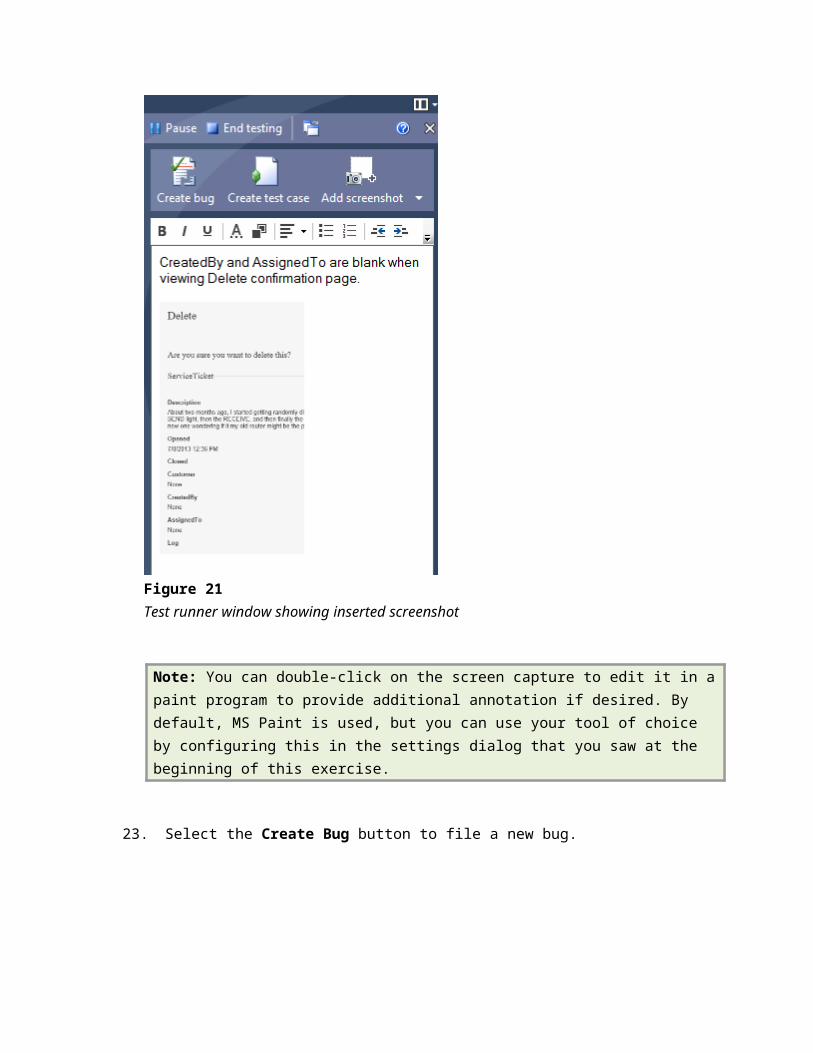
Figure 25Test case steps now have rich text capability
28. Select the Save and Close button.
Figure 26Save and close the new test case
29. After the new test case is saved, we are automatically returned to our exploratory testing task and can continue looking for more bugs. Let’s start by clearing out the observations from the previous bug that we just saved. Press Ctrl+A and then the Delete key.
30. In the Internet Explorer window, select the Dashboard menu link.
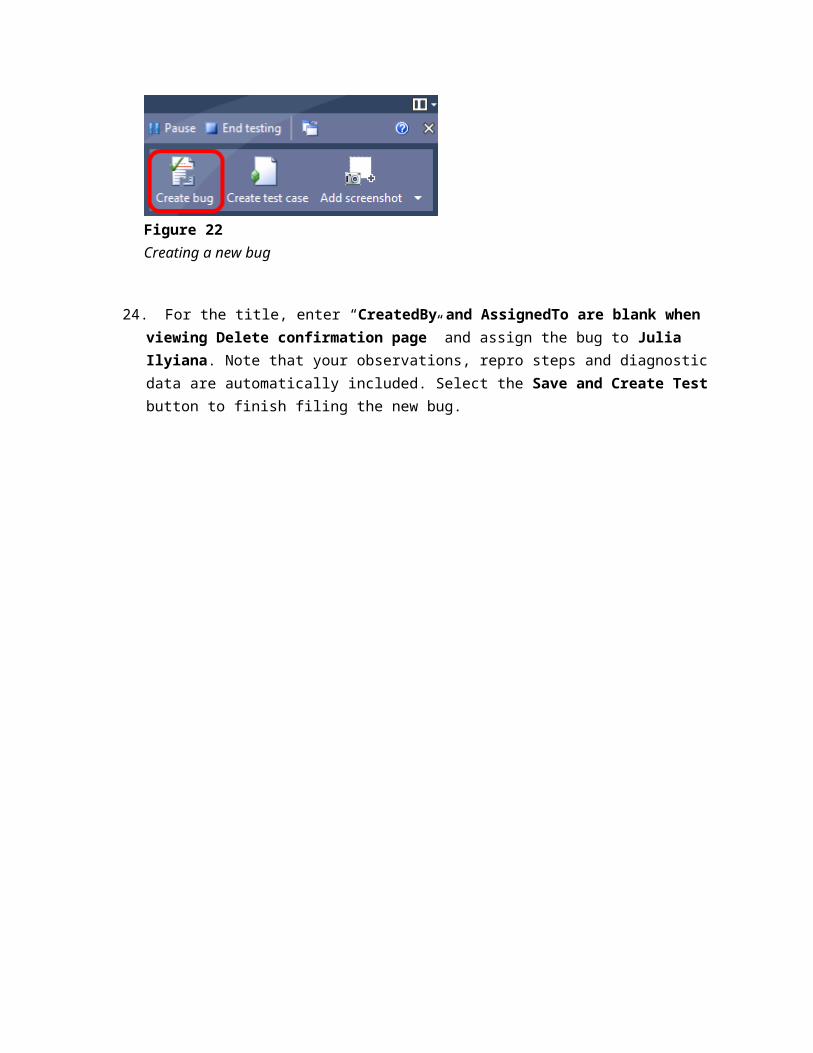
Figure 27Navigating to the dashboard
31. Select one of the service ticket links to view the details.
Figure 28Selecting a service ticket to view details
32. Select the Escalate button (you may need to scroll to the right).
Figure 29Escalating a service ticket
33. The result of the attempt to escalate the service ticket is a HTTP 404 server error.
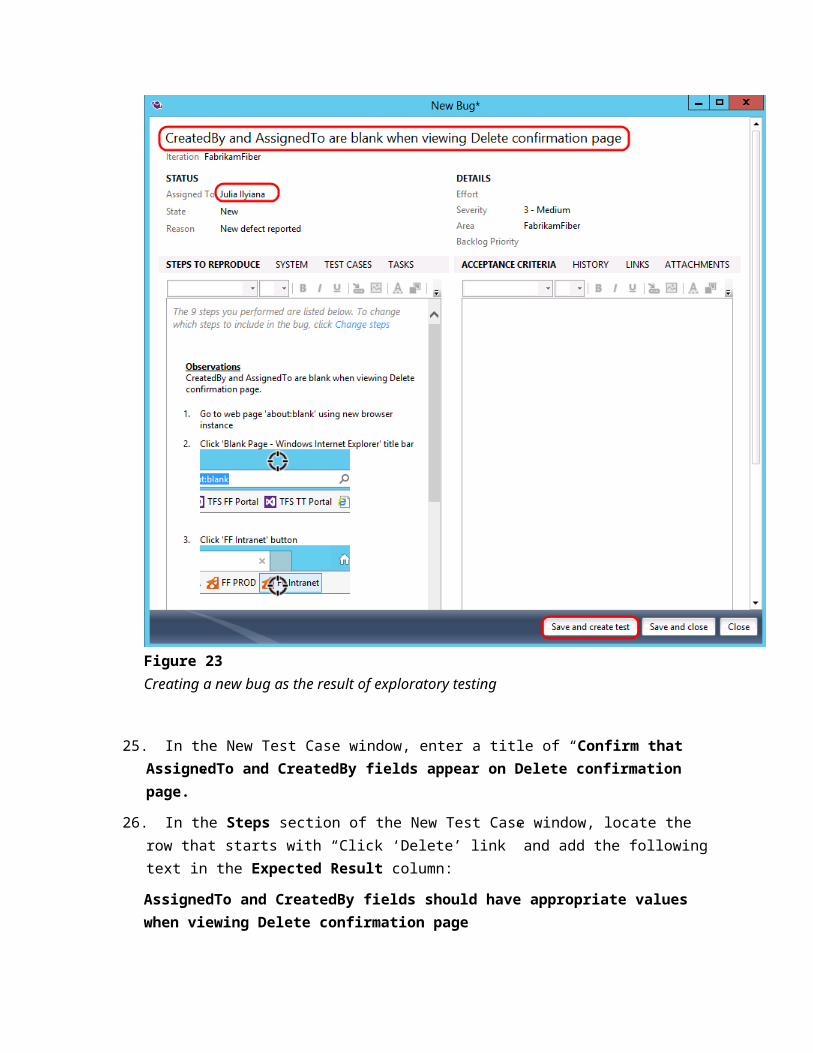
Figure 30Escalating the service ticket results in an error
34. Select the Create Bug button to file a new bug.
Figure 31Creating a new bug
35. For the title of the bug, enter “Escalate service ticket results in a HTTP 404” and assign it to Julia Ilyiana.
Figure 32Creating a new bug as the result of exploratory testing
36. In the Steps To Reproduce section of the new bug, note that there is a link that allows you to easily scope the repro steps. Select the Change Steps link.
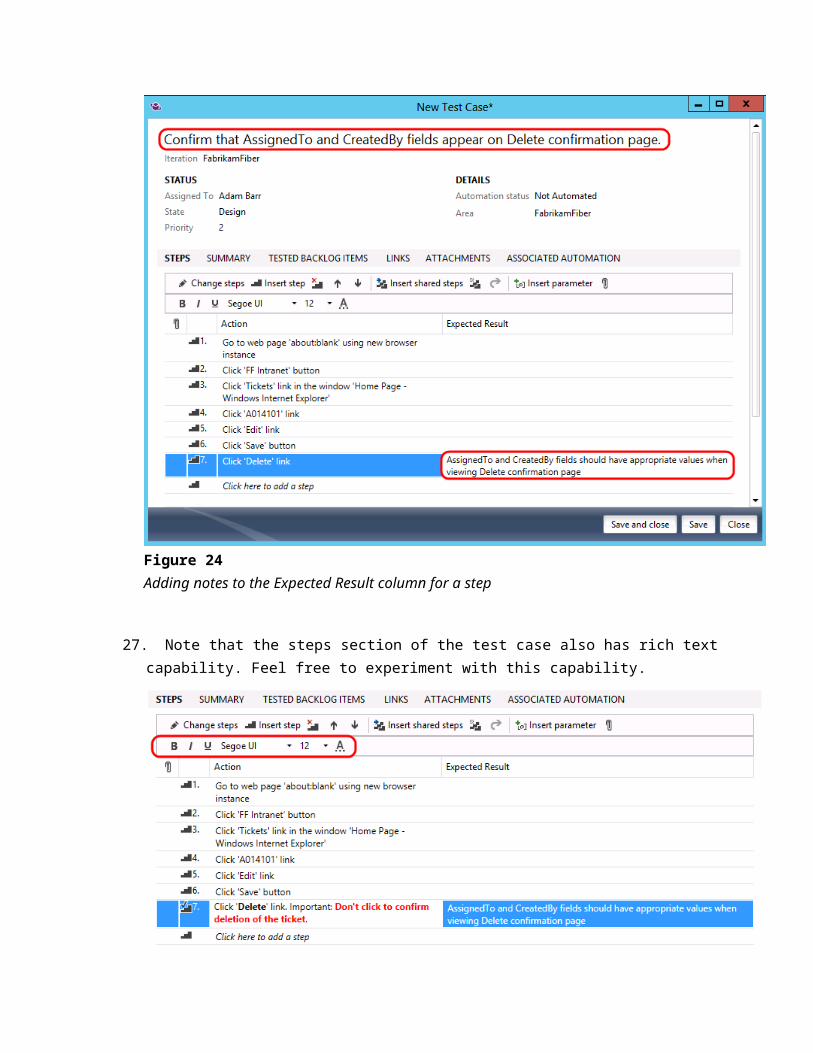
Figure 33Changing the scope of the repro steps
37. In the Change Steps window, click and drag with the mouse to highlight the steps starting with the click you made on the Dashboard link all the way to the click on the Escalate link. This represents the recent actions taken to reproduce the error we just saw. Click the Select button to continue.
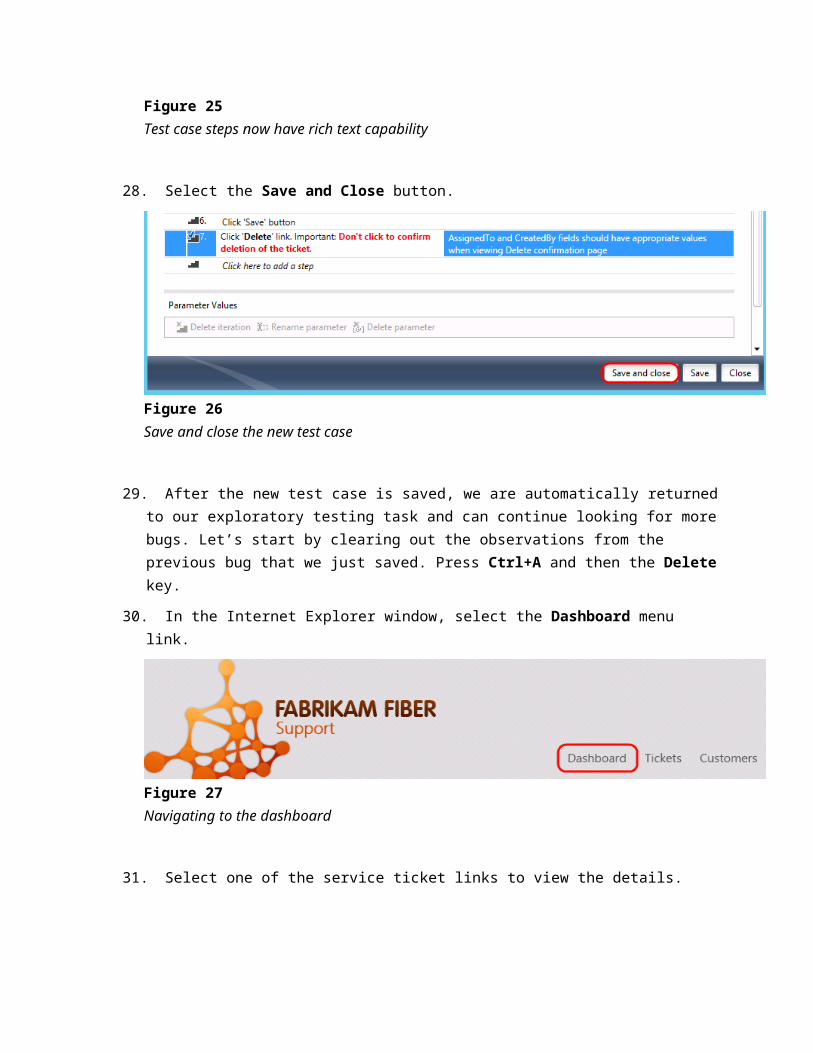
Figure 34Selecting the repro steps
Note: Your steps may look slightly different from those shown in the screenshots in this lab.
38. Select the Save and Create Test button.
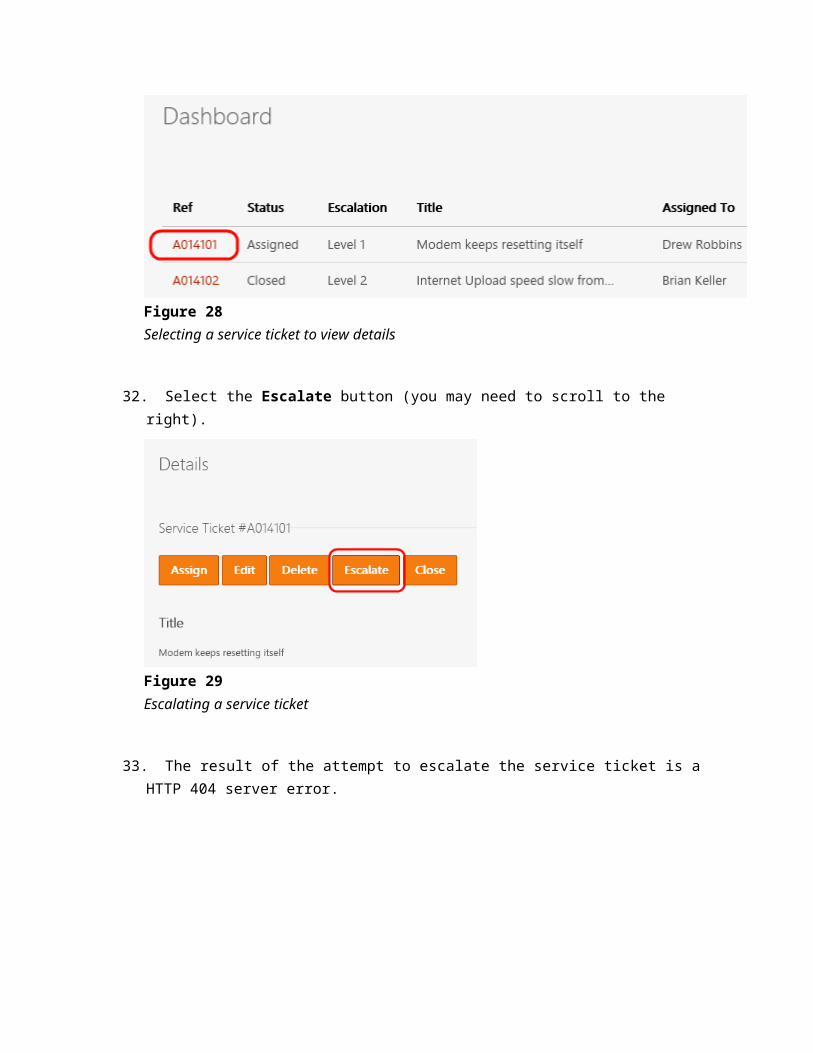
Figure 35Creating a new bug as the result of exploratory testing
39. In the New Test Case window, enter a title of “Ensure that ticket escalation page works” and then select the Save and Close button.
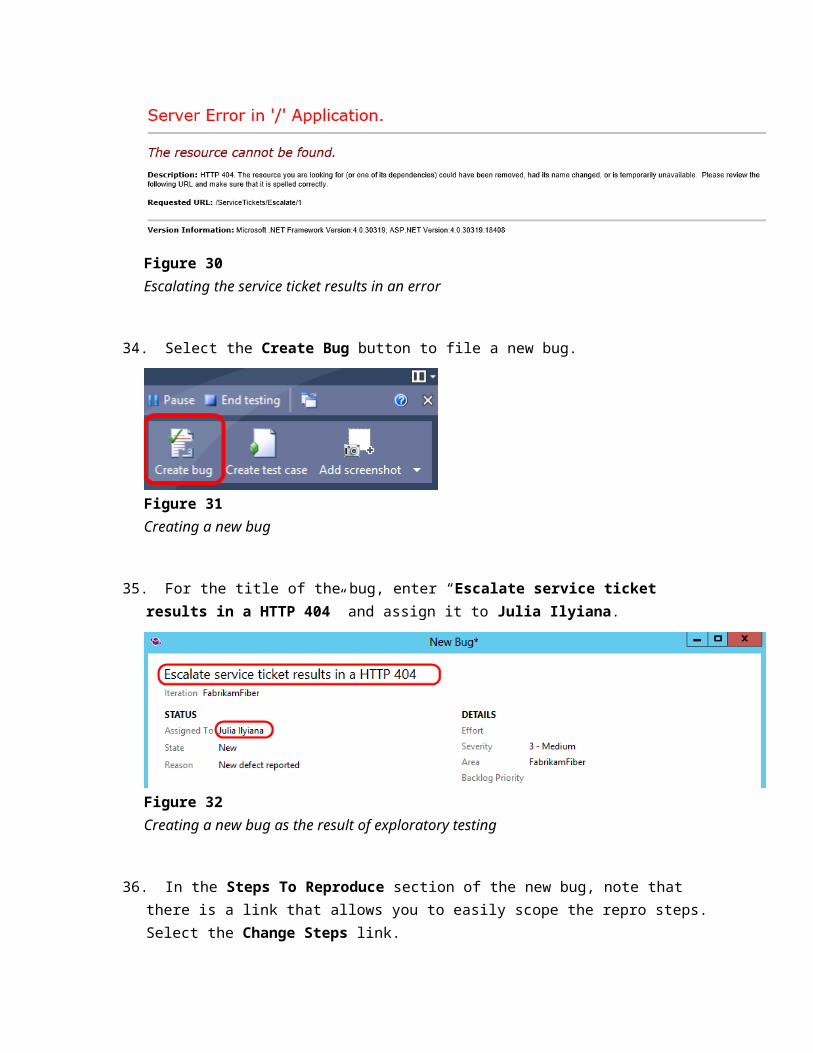
Figure 36Save and close the new test case
40. Select the End Testing button in the test runner window.
Figure 37End the exploratory testing session
41. In the session summary window for the exploratory test, select the Save and Close button to return to the Plan tab of the Testing Center.
Figure 38Save and close the exploratory testing session
42. Note that there are now two formal test cases that are part of the Exploratory Testing suite. By formally capturing these test cases, we can ensure that we test for them in the future. This enables us to use a blend of approaches, both exploratory testing and formal testing, to improve our overall application quality.
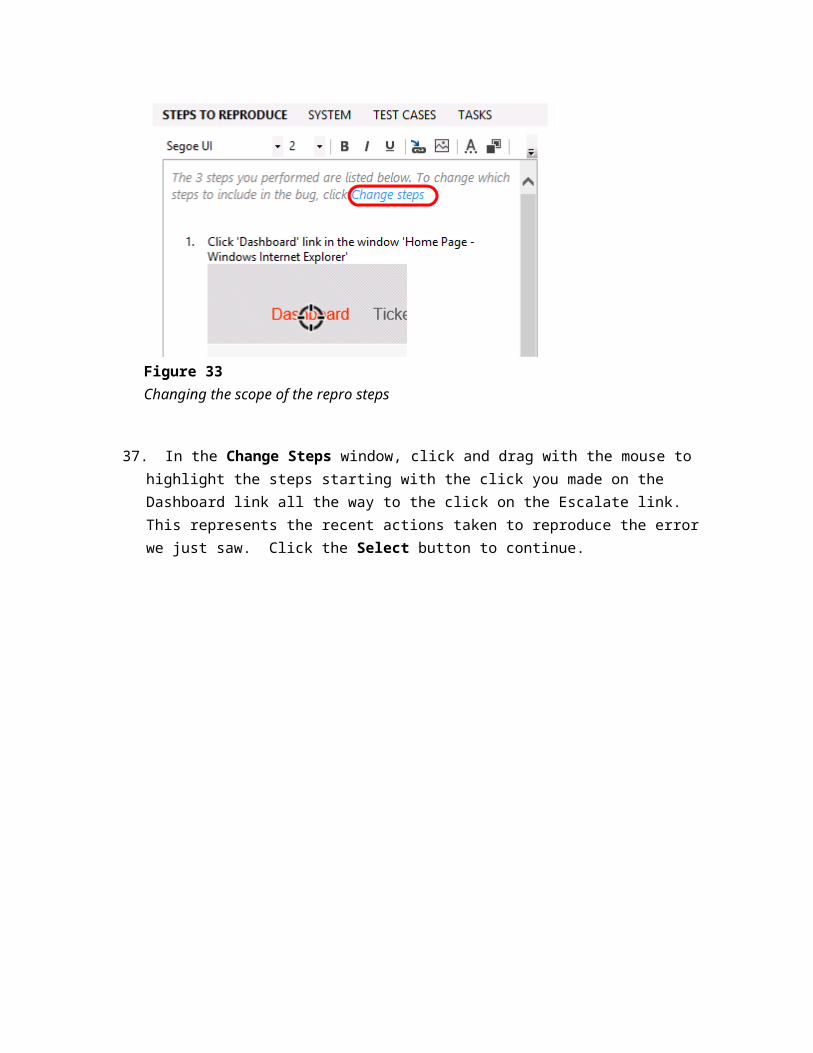
Figure 39Formal test cases were created as part of the exploratory testing session
To give feedback please write to [email protected]
Copyright © 2023 by Microsoft Corporation. All rights reserved.