Embed Size (px)
Citation preview
P-Wave Body Surface Isointegral Maps in Children and in Young
Adults
K. KOZLÍKOVÁ
Institute of Medical Physics and Biophysics, Faculty of Medicine, Comenius University,
Bratislava, Slovakia
Running title:
P-Wave Isointegral Maps
Summary
Only limited data are available on body surface potential distribution during atrial
activation. The aim of this study was to establish the distributions and analyze chosen
quantitative parameters of atrial isointegral maps recorded using a limited 24-lead
system in a young healthy population. A total of 166 subjects underwent a procedure of
body surface potential mapping. Isointegral maps during the P wave were constructed
and qualitatively and quantitatively evaluated. Three types of atrial activation in
individual maps were found according to the different shape of the zero isointegral line
and to mutual positions of extrema. The most frequently occurring type resembled the
group mean maps and was in good agreement with published data obtained from full
lead systems. The highest extrema were found in the young men group, while,
surprisingly, the lowest values in the young women group. All minima and the majority
of maxima were recorded outside the ranges of standard chest leads. The usefulness of
1
the limited lead system to record isointegral P-wave maps was shown and new data
were presented that can be useful in noninvasive evaluation of atrial pathologies.
Keywords
Eletrocardiography • Body-surface mapping • Heart atria
Introduction
Electrocardiographic body-surface mapping is a noninvasive method that can
show the spatial distribution of body surface potentials using numerous leads on a
patient’s front and back chest, permitting more complete visualization of cardiac
electrical activity and, in this way, providing three-dimensional details on the
electrocardiogram similar to those obtained with an invasive method. The rationale
behind body surface mapping is an extension of additional lead ECG. The output from
body surface mapping can be displayed in the form of a set of single leads or, more
usually, in the form of a (flat) map.
The P wave in the surface ECG represents atrial electrical activation and may be
altered in certain pathological conditions sometimes relatively unexpected (Sleiman et
al. 2000; Szlejf et al. 2002). As the research on body surface potential mapping
concerned predominantly the ventricular excitation process, there is still only limited
data available documenting body surface potential distribution during atrial electric
events. This is mainly devoted to isopotential maps (Taccardi 1966; Mirvis 1980;
Kawano et al. 1983; Ishihara et al. 1987; Popperová et al. 1988; Kalka et al. 1996).
Lesser papers have been published that deal with body surface isointegral P wave maps
2

under normal conditions, in chronic pulmonary emphysema, during pacing or in atrial
fibrillation (Mirvis 1980; Ikeda et al. 1985; SippensGroenewegen et al. 1998; 2000;
2004). All mentioned papers describe P wave maps recorded by full lead systems using
62, 80, 87, and 150 leads. The existence of limited data concerning body surface
mapping of atrial activation may be also due to the fact that P-waves have relatively
small amplitudes and can be easily distorted by the noise. This can be at least partially
avoided by using isointegral maps as they can stress small changes lasting a longer time.
The aim of this study was to establish the distributions and selected quantitative
parameters of the atrial isointegral maps recorded using a limited 24-lead system in the
young healthy population to support a prospective usefulness of the noninvasive
registrations of surface maps in atrial arrhythmias and other pathologies.
Methods
A total of 88 normal females and 78 normal males with no history of
cardiovascular disease and normal electrocardiographic and echocardiographic findings
were studied (Kozlíková and Martinka 2004). They were divided into 6 groups
according to their age and sex: group F1 – 17 girls (aged 9.8 ± 0.3 years (y)), group F2 –
25 girls (13.5 ± 0.4 y), group F3 – 46 women (18.5 ± 0.4 y), group M1 – 15 boys (aged
9.7 ± 0.3 y), group M2 – 25 boys (13.6 ± 0.4 y), group M3 – 46 men (18.6 ± 0.4 y). All
had normal blood pressure at the date of measurement (systolic: 118 ± 14 mmHg;
diastolic: 70 ± 10 mmHg).
Body-surface mapping was done with the ProCardio mapping system (Rosík et al.
1997) using the 24-lead system after Barr depicted from the full grid of 10 rows × 15
columns (Barr et al. 1971). Data were recorded in supine position during normal
3

breathing (expiration). The onset and the offset of each P wave were established using
the root mean square signal from 24 unipolar chest leads with Wilson’s central terminal
as reference and using the TP segment as a zero baseline (Kozlíková 1990; Kozlíková
and Martinka 2004). A time integral in each measured lead represents the area between
the zero baseline and the electrocardiographic curve during the chosen time interval.
The integrals are displayed in the form of isointegral maps where the isointegral lines
connect equal values. Single-beat isointegral maps were constructed for each subject
and mean group maps were calculated.
Values of single-beat P-wave isointegral maps extrema (maximum, minimum,
peak-to-peak = maximum – minimum) and their positions were analyzed (Kozlíková
1990). All group data are presented either as mean ± standard deviation or median and
95 % confidence interval. Statistical evaluation was done using unpaired two-tailed
Student’s t-test and analysis of variance for means of normally distributed data;
otherwise, medians were compared using the Mann-Whitney test or the Kruskal-Wallis
test (Statgraphics® PLUS, 1997). A value of p < 0.05 was considered statistically
significant. Frequencies of map types were statistically evaluated using χ-square test
(contingency tables).
Results
Individual single beat maps revealed prevalent smooth dipolar distribution of
positive and negative time integrals. The patterns could be divided into 3 main types:
A, B, and C (Fig. 1; Table 1). Their frequencies differed significantly in the studied
groups (χ-square applied to all 6 groups: p < 0.05).
Type A occurred in about 38 % of maps, mainly in males. It was characterised by
4
almost horizontal zero isointegral lines separating the negativities covering continuously
the upper chest and the positivities covering continuously the lower chest. The line
connecting the maximum and the minimum was approximately vertical or oblique.
Type B occurred in about 45 % of maps, mainly in females. It was characterised
by oblique zero isointegral lines separating the negativities covering the upper right
chest and the positivities covering the lower right chest but also reaching the left
shoulder. The line connecting the maximum and the minimum was oblique.
Type C occurred in about 17 % of maps. It was characterized by almost vertical
zero isointegral lines separating the negativities covering the right chest and always
reaching the bottom margin of the map and the positivities covering the left chest. The
line connecting the maximum and the minimum was approximately horizontal or
oblique.
Group mean maps revealed smooth distributions of negative time integrals
(Fig. 2). They covered the upper parts of the chest, mainly its right side. Minimum in
mean maps was always located parasternally right at the clavicular level.
Zero isointegral lines separating the positivity and the negativity roughly
resembled a sinus curve.
Positive time integrals covered the lower parts of the chest and they reached the
left shoulder resembling the type B in individual maps. They revealed two maxima in
five of the six studied groups. The primary maximum of groups F2, M1, M2, and M3
was located to the left of the lower part of sternum, while the secondary maximum was
located in the area of the left axilla and was almost at the same value (80 % to 100 % of
the primary maximum). In the youngest girls (group F1) the primary maximum was
located in the area of the left axilla and the secondary one to the left of the lower part of
5

sternum. There was only one maximum in the left of the lower part of sternum in the
young women group (F3).
The existence of two maxima in mean maps can be explained by the position of
maxima in the single-beat maps (Fig. 3). They covered mainly the left anterior chest
with two dominant positions corresponding to the positions of maxima in mean maps.
Only 9 out of 166 maxima were located in other positions (3 of 9 on the right lower
chest and 6 of 9 on the back along the spine). The only statistically significant
difference concerning the position of maxima was found between the youngest and the
oldest male groups M1 and M3. The youngest boys had their maxima shifted more to
the left approximately to the left medioclavicular line, while the group M3 maxima were
positioned mainly to the left of the sternum (p < 0.05).
Minima in single beat maps were located mainly parasternally right at the
clavicular level (56 % of all cases) or around the right shoulder. Only in two cases their
position overlapped with that of the maxima (Fig. 3). The only significant difference
concerning the position of minima was found between the groups M2 and M3. In the
young men group, the minimum was closer to sternum (p < 0.05).
Although the positions of individual maxima partially overlapped with positions
of the standard chest leads, the majority of maxima as well as all minima were recorded
outside their areas.
The highest extrema (minima treated in their absolute values) were found in the
young men (group M3), while the lowest in the young women (group F3, the “flattest”
maps; Fig. 4). Medians with corresponding 95 % confidence intervals for maxima were
5.0 mV.ms (4.7 mV.ms; 5.9 mV.ms) versus 3.7 mV.ms (3.0 mV.ms; 4.1 mV.ms),
p < 0.001; for minima –4.5 mV.ms (–4.9 mV.ms; –3.7 mV.ms) versus –2.7 mV.ms
6

(–3.1 mV.ms; –2.3 mV.ms), p < 0.001; for peak-to-peak values 9.6 mV.ms (8.5 mV.ms;
11.6 mV.ms) versus 6.4 mV.ms (5.6 mV.ms; 7.2 mV.ms), p < 0.001. There were no
significant differences concerning any extreme values between different sexes in the
two younger groups. Maxima increased with increasing age in males with the only
significant difference between the group M3 and the group M1 (3.7 mV.ms
(3.2 mV.ms; 4.3 mV.ms), p < 0.01). There were no statistically significant differences
between female groups.
Although the minima became deeper with increasing age of males, no statistically
significant differences were found opposite to females. The minima in the oldest group
F3 differed significantly from the minima of both younger groups F2 (–4.1 mV.ms
(–4.7 mV.ms; –2.7 mV.ms), p < 0.01) and F1 (–4.0 mV.ms (–4.5 mV.ms; –3.0 mV.ms),
p < 0.01).
Peak-to-peak values behaved similarly to the maxima but no statistically
significant differences were found between different age groups.
Discussion
Three types of body-surface time-integral distributions in isointegral P-waves
were found. Unfortunately, there are few papers dealing with body-surface isointegral
maps of P wave in healthy population so that it is almost impossible to obtain reliable
comparisons. Nevertheless, our data were in good agreement with those published
earlier although different race and different age groups have to be taken into account.
The individual isointegral P-wave map published by Mirvis (1980) resembled the
type B in this paper although a different lead system (150 leads) and different display
was used (the cylinder was cut along the spine).
7
Group mean maps published by Ikeda et al. (1985) were recoded in 20 males aged
35 to 51 years using 87 leads. The body surface distribution of time integrals in the
published mean map was similar to that of the M3 group except for the number and the
position of maximum. The single maximum of published maps was located in the
position of the secondary maximum of group M3. There was no statistical difference
concerning the group mean values of maxima and minima (published:
4.52 ± 1.18 mV.ms and -4.31 ± 1.08 mV.ms versus group M3: 5.35 ± 1.62 mV.ms and
-4.52 ± 1.64 mV.ms, respectively).
The majority of maxima and all minima were recorded outside the range of
standard chest leads and even outside the exact positions of leads in the used limited
lead system. This explains why body surface mapping can give additional information
also in the relatively low-amplitude potentials, such as with the P-waves.
The highest values of extrema in the M3 group could be at least partially
explained by the significantly longer P-waves in this group (87 ± 9 ms) against groups
F3 (80 ± 12 ms, p < 0.005), M1 (74 ± 8 ms, p < 0.001), and M2 (81 ± 11 ms, p < 0.05).
The lowest values of extrema in the F3 group remain unclear as there was no
correlation either with P-wave duration or with chest geometry or body shape. There
was no significant difference in chest circumferences between groups F3 and F2
(87 ± 5 cm versus 83 ± 10 cm). There was no significant difference in body mass index
between group F3 and groups F2 (21.4 ± 2.3 kg⋅m–2 versus 20.3 ± 3.3 kg⋅m–2) and M3
(22.0 ± 1.9 kg⋅m–2).
The two marked locations of maxima in single beat maps as well as in mean maps
could be explained by dominant electrical activity of either the right atrium (maximum
to the left of the lower part of sternum) or the left atrium (maximum in the area of the
8

left axilla). Whether this is due to increased dimension or changed position of the atria
or any other reason, remains unclear and needs further, specially designed, studies.
Ignoring the heart and chest geometry, the obtained 3 types of isointegral P-wave
maps (Fig. 1) were visually compared with those obtained during atrial pacing by
SippensGroenewegen et al. (1998). Type A resembled the maps paced from the right
atrium close to the right atrial appendage, type B resembled the maps paced from the
right atrium close to the superior vena cava, and type C resembled the map paced from
the right atrium close to the crista terminalis and the trabeculated right atrium. Solving
the problem whether the three found types of atrial activation are connected with
different positions of the pacemaker or are a consequence of geometrical differences,
needs future, specially designed, studies.
Nevertheless, the usefulness of the limited lead system to record P wave maps
comparable with those obtained with full lead systems was shown and new data were
presented.
References BARR RC, SPACH MS, HERMAN-GIDDENS GS. Selection of the number and
positions of measuring locations for electrocardiography. IEEE Trans.
Biomed. Eng. 18: 125–138, 1971.
IKEDA K, KUBOTA I, YASUI S. Effects of lung volume on body surface
electrocardiogram. Isointegral analysis of body surface maps in patients with
chronic pulmonary emphysema. Jpn Circ J 49: 284–291, 1985.
ISHIHARA H, TUCHIYA S, HOSAKI J, KAWANO S, SAWANOBORI T,
HIRAOKA M. The isopotential body surface atrial maps in healthy children
of different age groups. Jpn Circ J 51: 520–526, 1987.
9
KALKA D, JAGIELSKI J, BANASIAK W, SOBIESZCZANSKA MA,
TELICHOWSKI A, FUGLEWICZ A, PIEROG M, PONIKOWSKI P,
JAGIELSKI D, KALKA-GEBALA R, GAJKOWSKI E. Use of body surface
heart potential mapping for registration of electrical phenomena in the atrium
(in Polish). Pol Arch Med Wewn 96: 234–241, 1996.
KAWANO S, SAWANOBORI T., HIRAOKA M. Human body surface mapping
during atrial depoalrization in normal and diseased subjects. J Electrocardiol
16: 151–159, 1983.
KOZLÍKOVÁ K. Body surface integral maps, their characteristics and methods of
quantitative analysis (in Slovak). Bratisl Lek listy 91: 815–823, 1990.
KOZLÍKOVÁ K, MARTINKA J. Age and sex variability of initial parts of the QRS
complex displayed in isointegral maps of young people. Acta Medica (Hradec
Králové) 47: 317–321, 2004.
MIRVIS DM. Body surface distribution of electrical potential during atrial
depolarization and repolarization. Circulation 62: 167–173, 1980.
POPPEROVÁ E, SABOLOVÁ K, MACO M, KOZLÍKOVÁ K, PETRÁŠOVÁ H,
WOLFOVÁ A, NOVOTNÁ T. Two types of atrial activation in adolescents
(in Slovak). Bratisl Lek Listy 89: 766–769 1988.
ROSÍK V, TYŠLER M, TURZOVÁ M. Portable device of for ECG mapping. In:
Proceedings of International Conference of Measurement, FROLLO I,
PLAČKOVÁ A (eds), SAV, Bratislava, 1997, pp 367–370.
SIPPENSGROENEWEGEN A, PEETERS HA, JESSURUM ER, LINNEBANK AC,
DE MEDINA EOR, LESH MD, VAN HEMEL NM. Body surface mapping
during pacing at multiple sites in the human atrium. P-wave morphology of
10

ectopic atrial activation. Circulation 97: 369–380, 1998.
SIPPENSGROENEWEGEN A, LESH MD, ROITHINGER FX, ELLIS WS, STEINER
PR, SAXON LA, LEE RJ, SCHEINMAN MM. Body surface mapping of
counterclockwise and clockwise typical atrial flutter: A comparative analysis
with endocardial activation sequence mapping. J Am Coll Cardiol 35: 1276–
1287, 2000.
SIPPENSGROENEWEGEN A, NATALE A, MARROUCHE NF, BASH D, CHENG J.
Potential role of body surface ECG mapping for localization of atrial
fibrillation trigger sites. J Electrocardiol 37 (Suppl): 47–52, 2004.
SLEIMAN O, MURÍN J, KOZLÍKOVÁ K. Is atrial fibrillation an adaptive mechanism
of heart failure? Exp Clin Cardiol 5: 1–4, 2000.
Statgraphics® PLUS, version 3 for Windows. User manual. Rockville: Manugistics,
Inc., 1997, 738 pp.
SZLEJF C, RAYS J, GEBARA OCE, VIEIRA NW, PIERRI H, NUSSBACHER A,
SERRO-AZZUL JB, SAMESINA N, PASTORE CA, WAJNGARTEN M.
Relation between the behaviors of P-wave and QT dispersions in elderly
patients with heart failure. Arq Bras Cardiol 79: 497–499, 2002..
TACCARDI B. Body surface distribution of equipotential lines during atrial
depolarization and ventricular repolarization. Circul Res 19: 865–878, 1966.
Author for correspondence
Katarina Kozlíková, Institute of Medical Physics and Biophysics, Faculty of Medicine
Comenius University, Sasinkova 2, 813 72 Bratislava, Slovakia; e-mail:
11
Acknowledgments
This study was in part supported by grants VEGA 1/4271/07 and KEGA
3/4088/06 offered by the Slovak Ministry of Education.
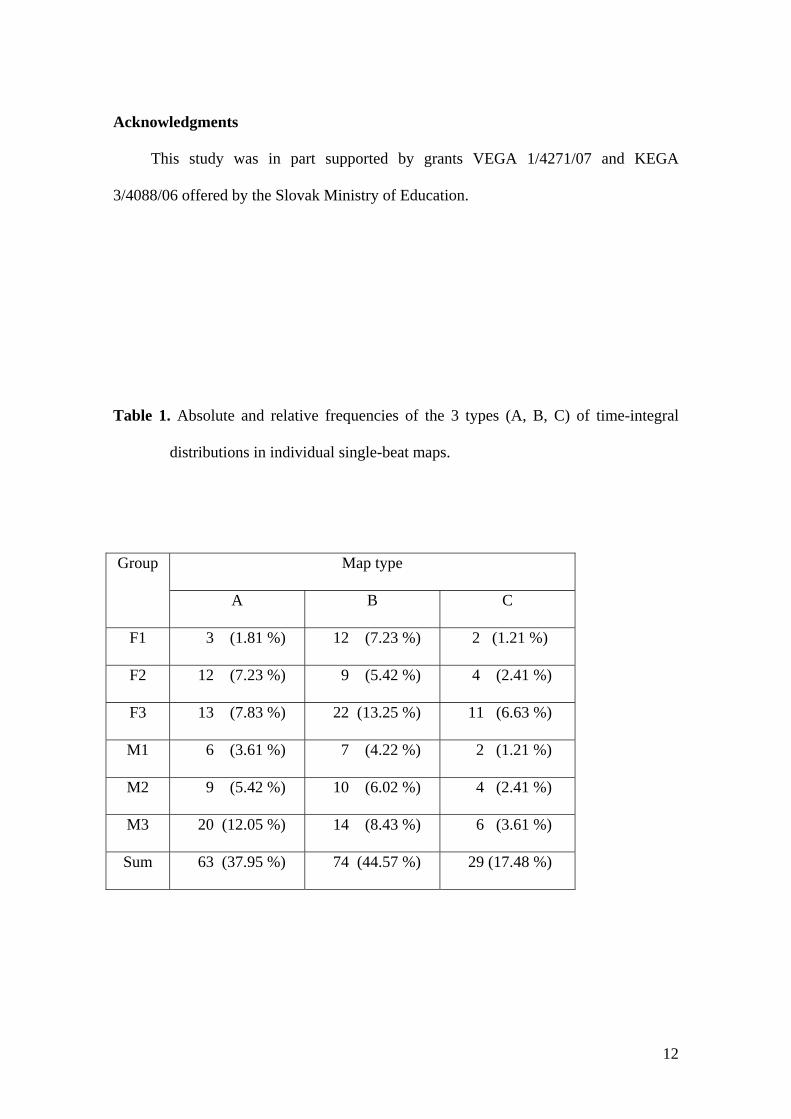
Table 1. Absolute and relative frequencies of the 3 types (A, B, C) of time-integral
distributions in individual single-beat maps.
Map type Group
A B C
F1 3 (1.81 %) 12 (7.23 %) 2 (1.21 %)
F2 12 (7.23 %) 9 (5.42 %) 4 (2.41 %)
F3 13 (7.83 %) 22 (13.25 %) 11 (6.63 %)
M1 6 (3.61 %) 7 (4.22 %) 2 (1.21 %)
M2 9 (5.42 %) 10 (6.02 %) 4 (2.41 %)
M3 20 (12.05 %) 14 (8.43 %) 6 (3.61 %)
Sum 63 (37.95 %) 74 (44.57 %) 29 (17.48 %)
12

Fig. 1. Three main types of time integral distributions occurring in individual P-wave
isointegral maps of all analyzed groups. Each map is represented as an unrolled cylinder
cut along the right mid-axillary line. The left and the right halves correspond to the front
and the back of the chest, respectively. The increment between isointegral lines is linear
and equals 1 mV.ms. The zero line is bolder. Plus and minus signs depict the location of
maximum and minimum, respectively. Their values are given over each map together
with the reference lead (II). The type A was found in group M3, types B and C in group
F3. All maps display smooth bipolar distributions.
Fig. 2. Mean P-wave isointegral maps of all analyzed groups.
Fig. 3. Positions of P-wave maxima and minima in single-beat maps of all analyzed
groups. The short vertical lines in the map depict the position of sternum and the left
mid-axillary line. Approximate positions of standard chest leads are also marked.
Frequency means the appearance of either maximum or minimum (or both) compared to
all 166 maps.
Fig. 4. Medians with 95 % confidence intervals of isointegral P-wave extreme values
of all analyzed groups.
13
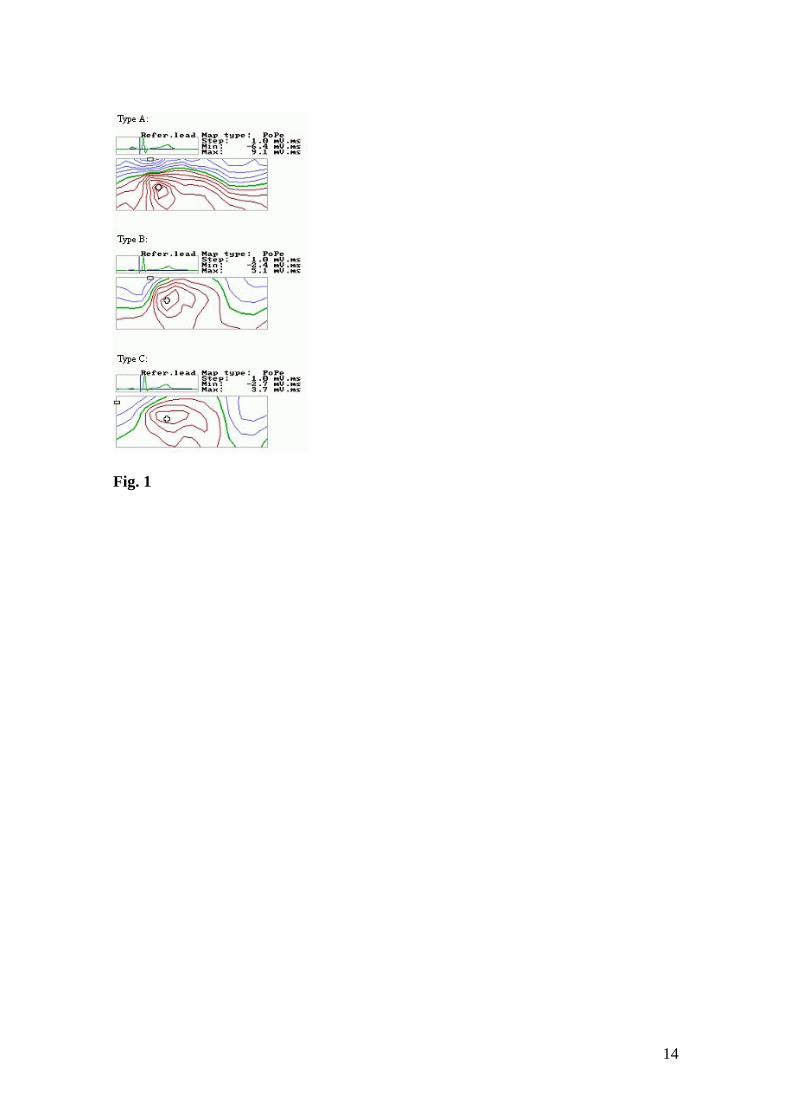
Fig. 1
14
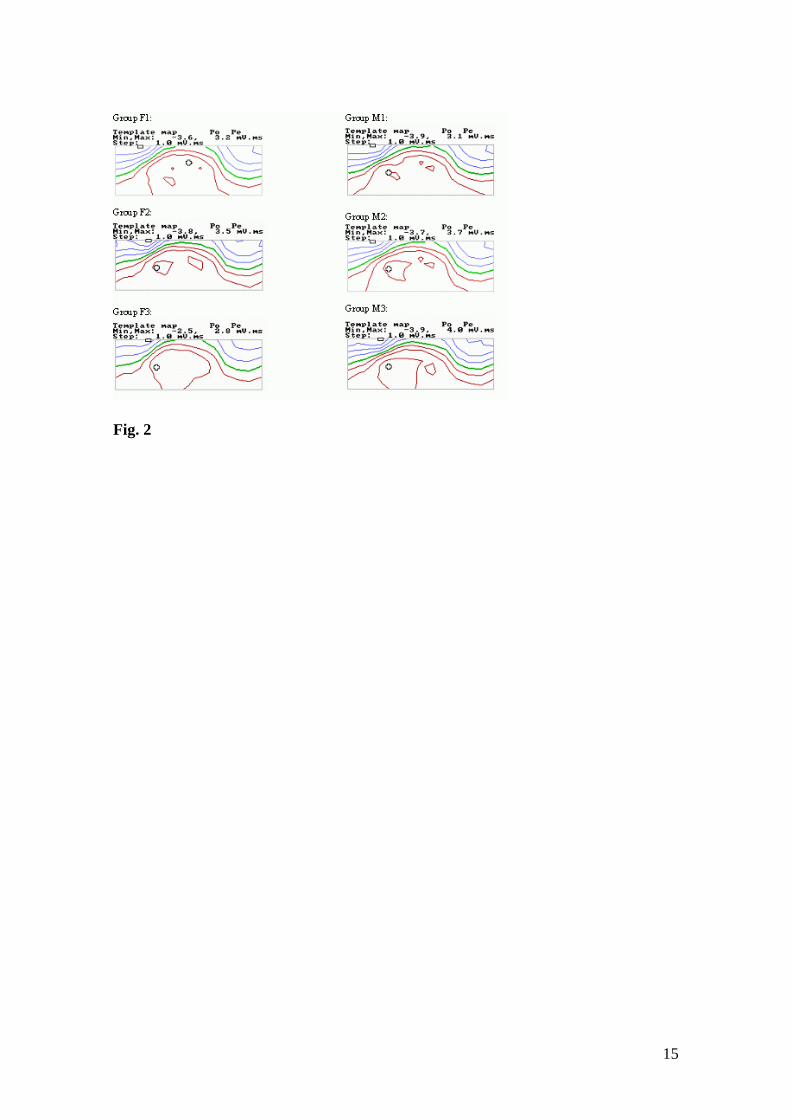
Fig. 2
15
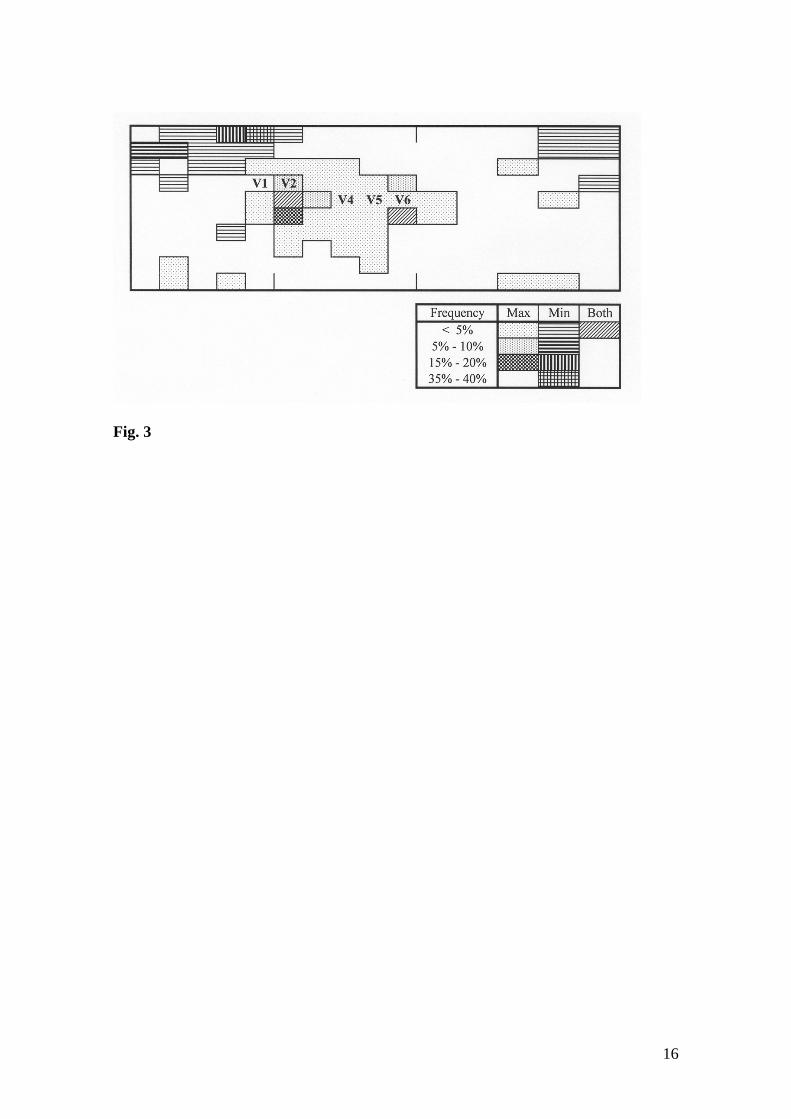
Fig. 3
16

Fig. 4
17


![Laplacian - ISBEM · electrocardiogram and recent developments of body surface Laplacian mapping, ... negative surface Laplacian of the body surface potential [3,9]](https://img.pdfslide.us/doc/110x75/5b6781f77f8b9af77c8b6336/laplacian-electrocardiogram-and-recent-developments-of-body-surface-laplacian.jpg)