Embed Size (px)
Citation preview

PA RT I I
Opportunity


45
CHAPTER 3
Growth, Inequality,and Poverty
A s countries become richer, on average the in-cidence of income poverty falls. Other indicators ofwell-being, such as average levels of education andhealth, tend to improve as well. For these reasons,economic growth is a powerful force for poverty re-duction. This observation is not the end of the story,for it raises the questions of what causes economicgrowth and why countries with similar rates of eco-nomic growth can have very different rates of povertyreduction.
Until the mid-18th century improvements in liv-ing standards worldwide were barely perceptible. Mostsocieties were resigned to poverty as an inescapable factof life.1 As late as 1820 per capita incomes were quitesimilar around the world—and very low, rangingfrom around $500 in China and South Asia to$1,000–1,500 in the richest countries of Europe.2
Roughly three-quarters of the world’s people livedon less than $1 a day.3
The onset of modern economic developmentopened the possibility that growth could significantlyimprove the living standards of poor people—andeveryone else. Over the next two centuries per capitaincomes in the richest countries of Europe increased
more than tenfold in real terms, in China more thanfourfold, and in South Asia threefold. The conse-quences for poverty have been dramatic. In the richcountries of Europe the fraction of the population liv-ing on less than $1 a day has fallen to nil. In China,where growth was slower, less than 20 percent of thepopulation now lives on less than $1 a day. In SouthAsia, where growth was slower still, around 40 per-cent of the population does. Today roughly a fifth ofthe world’s people fall below this austere incomethreshold.
But differences in rates of economic growth, andin the rates at which that growth translates intopoverty reduction, are not the consequence of sim-ple choices. Countries do not choose to have slowgrowth or to undergo painful crises. Nor do they sim-ply choose how equitable growth will be. Instead, thepatterns of growth, the changes in the distributionof income and opportunities, and the rates of povertyreduction reflect a complex set of interactions amongthe policies, institutions, history, and geography ofcountries. Understanding the forces underlying coun-tries’ disparate growth experiences, and the mecha-nisms through which this growth has reached poor
people, is essential for formulating poverty reductionstrategies.
This chapter takes up these issues in turn. It first doc-uments the strong links between economic growth andthe income and nonincome dimensions of poverty. Itnext turns to the policies and institutions that under-pin growth and provide the basis for poverty reduction.It recognizes that there are substantial deviations fromthese general relationships reflecting the wide diversityof country experience—and that these deviations reflecta further set of interrelationships between distribu-tional outcomes, policies, and institutions. It thereforediscusses how cross-country differences in the poverty-growth nexus are a consequence of initial inequalitiesin the distribution of income and opportunities—and of changes in the distribution of income thatoccur with growth. These inequalities themselves reflectan array of factors, which in turn have consequences foreconomic growth. Last, the chapter explores the inter-actions between growth and two nonincome dimensionsof poverty—health and education.
Economic growth and povertyreduction
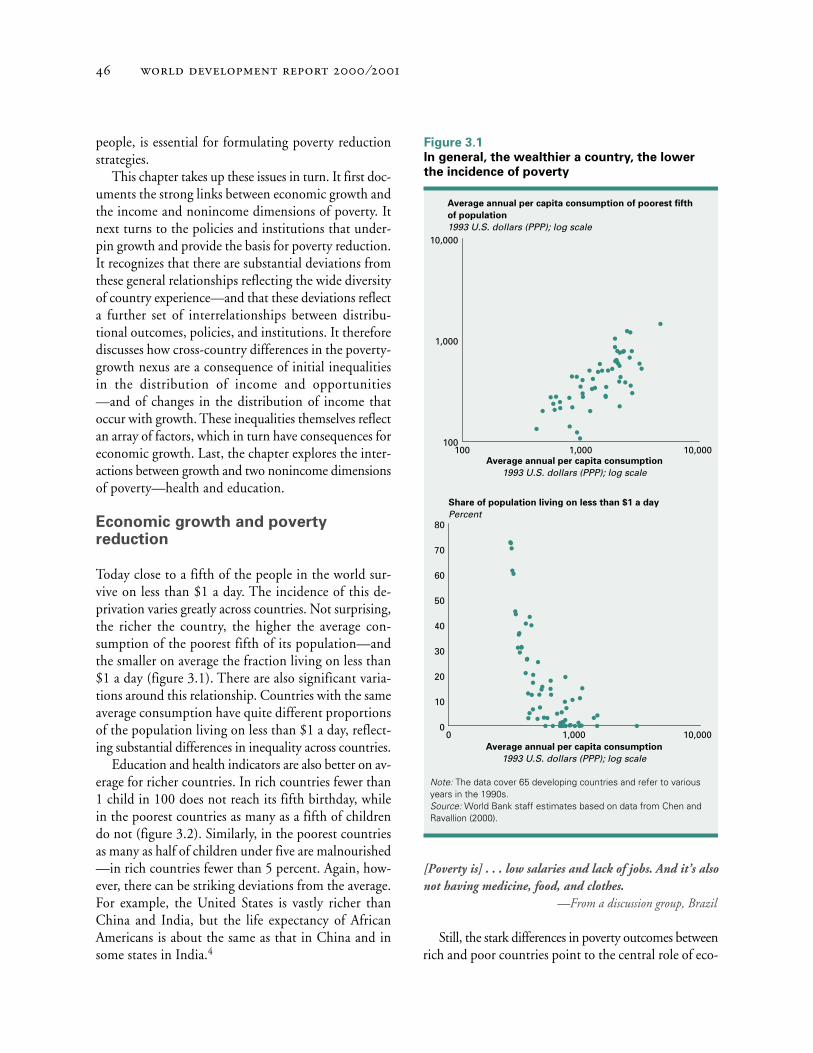
Today close to a fifth of the people in the world sur-vive on less than $1 a day. The incidence of this de-privation varies greatly across countries. Not surprising,the richer the country, the higher the average con-sumption of the poorest fifth of its population—andthe smaller on average the fraction living on less than$1 a day (figure 3.1). There are also significant varia-tions around this relationship. Countries with the sameaverage consumption have quite different proportionsof the population living on less than $1 a day, reflect-ing substantial differences in inequality across countries.
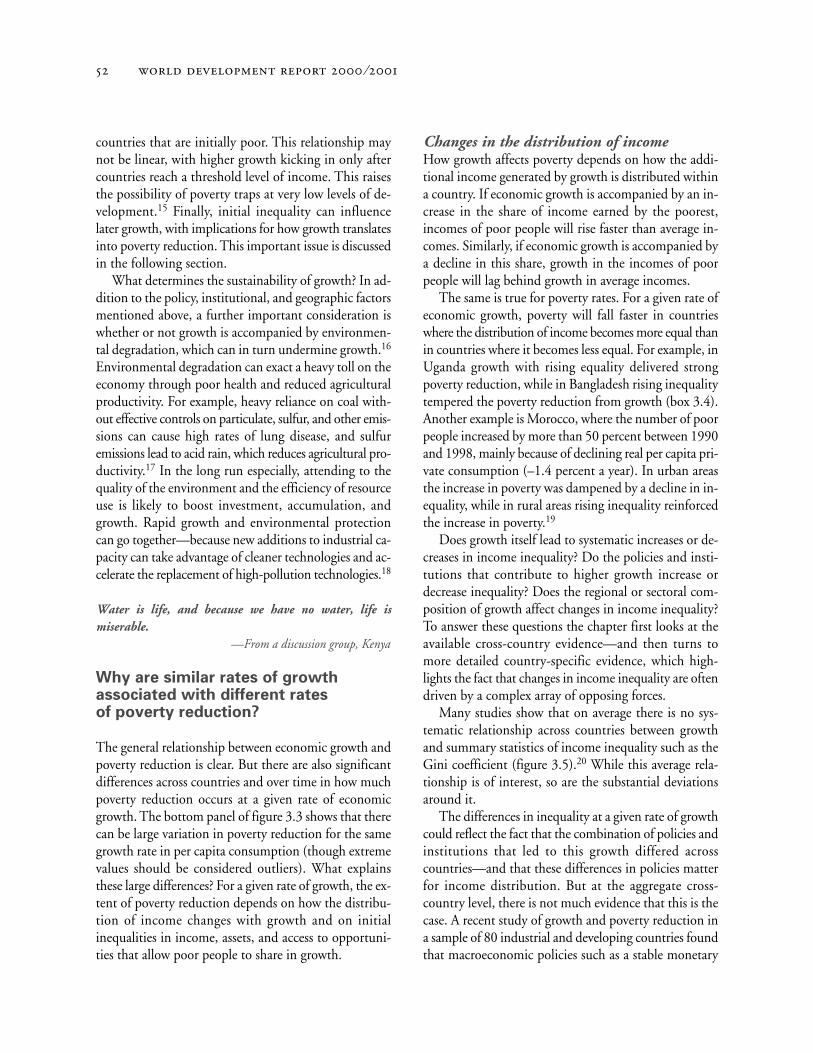
Education and health indicators are also better on av-erage for richer countries. In rich countries fewer than1 child in 100 does not reach its fifth birthday, whilein the poorest countries as many as a fifth of childrendo not (figure 3.2). Similarly, in the poorest countriesas many as half of children under five are malnourished—in rich countries fewer than 5 percent. Again, how-ever, there can be striking deviations from the average.For example, the United States is vastly richer thanChina and India, but the life expectancy of AfricanAmericans is about the same as that in China and insome states in India.4
[Poverty is] . . . low salaries and lack of jobs. And it’s alsonot having medicine, food, and clothes.
—From a discussion group, Brazil
Still, the stark differences in poverty outcomes betweenrich and poor countries point to the central role of eco-
⁄
Figure 3.1
In general, the wealthier a country, the lower
the incidence of poverty
Average annual per capita consumption of poorest fifth
of population
1993 U.S. dollars (PPP); log scale
Average annual per capita consumption
1993 U.S. dollars (PPP); log scale
Share of population living on less than $1 a day
Percent
Average annual per capita consumption
1993 U.S. dollars (PPP); log scale
0 1,000 10,0000
10
20
30
40
50
60
70
80
Note: The data cover 65 developing countries and refer to various years in the 1990s.Source: World Bank staff estimates based on data from Chen and Ravallion (2000).
100 1,000 10,000100
1,000
10,000

, ,
nomic development in poverty reduction. These differ-ences generally reflect cross-country differences in eco-nomic growth over the very long run. But the benefitsof growth in reducing income poverty can also be seenover shorter periods. Chapter 1 discusses the highlyvariable evolution of income poverty across countries inthe past two decades. Differences in economic growthacross countries account for much of this variation: asin the very long run, growth in the 1980s and 1990s wasa powerful force for reducing income poverty. On aver-age, growth in the consumption of the poorest fifth ofthe population tracked economic growth one-for-one overthis period (figure 3.3). In the vast majority of casesgrowth led to rising consumption in the poorest fifth ofthe population, while economic decline led to fallingconsumption.
The pattern is similar for the share of people living onless than $1 a day. On average, every additional per-centage point of growth in average household con-sumption reduces that share by about 2 percent. Althoughthe deviations from this average relationship show thatin some countries growth is associated with much morepoverty reduction than in others, the relationship high-lights the importance of economic growth for improv-ing the incomes of poor people and for moving peopleout of poverty. Conversely, low or negative growth re-
sulting from the collapse of the state, natural disaster, war,or economic crisis can have a devastating impact on poorpeople.
As chapter 1 shows, national poverty figures hide muchvariation in outcomes within countries. But just as cross-country differences in economic growth do much to ex-
Figure 3.2
Health indicators improve as incomes rise
Under-five mortality rate, 1995
Per 1,000 live births
Per capita GDP, 1995
U.S. dollars (PPP); log scale
100 1,000 10,0000
50
100
150
200
250
300
Source: World Bank data.
Figure 3.3
Poverty trends tracked growth trends in the
1980s and 1990s
Average annual growth in per capita consumption of
poorest fifth of population
Percent
Average annual growth in per capita consumption
Percent
–40 –30 –20 –10 0 10 20 30 40–40
–30
–20
–10
0
10
20
30
40
Average annual growth in share of population living on
less than $1 a day
Percent
Average annual growth in per capita consumption
Percent
Note: The data cover 65 developing countries.Source: World Bank staff estimates based on data from Chen and Ravallion (2000).
–80
–60
–40
–20
0
20
40
60
80
–40 –30 –20 –10 0 10 20 30 40

⁄
plain cross-country differences in poverty outcomes, re-gional and subregional growth does much to explain sub-national poverty outcomes. World regions, countries, andprovinces within countries have grown at very differentrates (figure 3.4). Where growth has occurred, it has been
an important source of poverty reduction, and where ithas not, poverty has often stagnated. Understanding whycountries and regions have had such disparate growth ex-periences, and how this growth reaches poor people, is es-sential for formulating poverty reduction strategies.
– 5 –4 –3 – 2 –1 0 1 2 3 4 5–10
–5
0
5
10
15
20
Figure 3.4
Economic growth was a force for poverty reduction in the 1980s and 1990s . . .
Average annual change in incidence of poverty
Percent
Average annual growth in per capita GDP
PercentAverage annual growth in per capita GDP
Percent
–5 0 5 10–12
–8
–4
0
4
8
12
Note: The incidence of poverty is the share of the population living on less than $1 a day.Source: Top left panel, World Bank data; top right panel, World Bank 1998f; bottom two panels, World Bank 2000o.
–5 0 5 10–25
–20
–15
–10
5
0
5
. . . across regions of the world . . .
Average annual change in incidence of poverty
Percent
. . . across countries in East Asia . . .
Europe andCentral Asia
Latin America andthe Caribbean
Middle East and North Africa
South AsiaSub-SaharanAfrica
East Asiaand Pacific
Average annual change in incidence of poverty
Percent
Average annual growth in per capita consumption
Percent
–3 –2 –1 0 1 2 3 4 5–12
–10
–8
–6
–4
–2
0
2
4
. . . across regions in the Philippines . . .
Mongolia Philippines
China
Malaysia
Thailand
Lao PDR Vietnam
Indonesia
Caraga Region
Central LuzonCentral Mindanao
IlocosBicol
Laguna
RomblonMarinduque
Mindoro Oriental
Batangas
AuroraCentral Visayas
NorthernMindanao
SouthernMindanao
Metro Manila
Cordillera Administrative
Region
Southern LuzonWesternVisayas
AutonomousRegion in Muslim Mindanao
CagayanWestern Mindanao
Average annual change in incidence of poverty
Percent
Average annual growth in per capita consumption
Percent
. . . and across provinces in southern Luzon
Eastern Visayas
Cavite
Palawan
Quezon
MindoroOccidental

, ,
What drives economic growth?
Understanding the policies and institutions that leadto sustained and sustainable economic growth is a firststep in developing strategies for improving the lot ofpoor people. Wide divergences in growth reflect the out-come of interactions among countries’ initial conditions,their institutions, their policy choices, the externalshocks they receive, and no small measure of goodluck.
There is evidence that growth depends on educationand life expectancy, particularly at lower incomes.5 Forexample, it has been shown that female literacy and girls’education are good for overall economic growth.6 Thereis also some evidence that rapid population growth isnegatively associated with per capita GDP growth andthat the changing age structure of the population canalso affect growth (box 3.1).7
Some economic policies—such as openness to inter-national trade, sound monetary and fiscal policies (re-flected in moderate budget deficits and the absence of highinflation), a well-developed financial system, and a mod-erately sized government—are also strongly conducive toeconomic growth.8 Aid can boost growth if such policiesare in place, but not if they are absent.9 Both domesticand external shocks matter as well. Not surprising, wars,civil unrest, and natural disasters all lower growth rates(box 3.2). Less dramatically, so do macroeconomic volatil-ity, adverse terms of trade shocks, and slower growthamong trading partners.10 Poorly sequenced and badlyimplemented reforms can lead to sudden reversals incapital flows or other macroeconomic disruptions, alsoslowing growth (chapter 4). These collapses in growth canbe particularly devastating for poor people, who haveweaker support mechanisms and generally lead a moreprecarious life than the better-off (chapter 9).
Box 3.1
Population, growth, and poverty
Many studies have documented that as countries become richer,both fertility and mortality decline on average, with reductions inmortality typically preceding reductions in fertility.1 The interac-tions between this demographic transition and economic devel-opment are complex. They have fueled heated debate at least since1798, when Thomas Malthus argued that since “food is neces-sary to the existence of man” and “the passion between the sexesis necessary and will remain nearly in its present state” (1985,p. 70), population growth would inevitably lead to an imbalancebetween people and available resources.
Malthus’s grim prediction on the effects of population growthon economic development failed to materialize—since the turnof the 19th century the world’s population has increased morethan fivefold, and thanks to improvements in technology of allkinds, per capita incomes have increased by even greater multi-ples. The links between demographic change and developmentare more subtle than this. Two issues are noteworthy: the effectsof changes in the age structure of the population induced by thisdemographic transition, and the links between investments inhealth and education, growth, and demographic outcomes.
First, in many countries sharp declines in fertility have beenfollowed by sharp increases in the working-age share of the pop-ulation. In some countries, notably in East Asia, the increase inthe number of workers per capita was accompanied by fastergrowth in GDP per capita.2 These countries’ success in tapping
the potential of a growing workforce was due to a variety of fac-tors, including strong educational attainment and a supportive pol-icy and institutional environment. In other regions of the world,notably Latin America, a similar change in the composition of thepopulation occurred without a comparable growth benefit. Thisfailure is disappointing since the demographic “bonus” of a largerworkforce is temporary and is followed by a period of higher oldage dependency rates that place greater demands on the socialsecurity institutions that provide support for the elderly.
Second, there is evidence that better education is associ-ated with higher contraceptive use and lower fertility.3 This evi-dence may reflect a variety of mechanisms. More educationexpands economic opportunities for women and so can raise theopportunity cost of having more children (Becker 1960). Infant mor-tality is often lower in families in which women are better edu-cated, and so fewer births are required to achieve a desirednumber of children. And better education can improve the ef-fectiveness of contraceptive use. Investments in improving poorpeople’s access to education and health can therefore have a dou-ble impact. These investments have been shown to improvegrowth and reduce poverty directly. To the extent that they areassociated with lower fertility and population growth, they can alsocontribute to a virtuous circle of improved maternal health and bet-ter investment in children’s health and education, which reinforcethese gains.
1. See Livi-Bacci (1997) for a historical survey and Birdsall (forthcoming) for a modern review of the literature on demography and economics.2. For example, Young (1995) provides a careful assessment of the contribution of a growing labor force and greater participation rates to the rapidgrowth in per capita GDP observed in four Asian economies.3. Schultz (1994) provides cross-country evidence on the links between female education and fertility. See Feyisetan and Ainsworth (1996) for micro-economic evidence on education and contraceptive use and Ainsworth, Beegle, and Nyamete (1996) on education and fertility. Pritchett and Summers(1994) provide a more cautious assessment of the magnitude of the effect of contraceptive availability on fertility.

⁄
Institutional factors are also important for growth. Forexample, there is evidence that strong rule of law and theabsence of corruption contribute to growth—by pro-viding a fair, rule-based environment in which firms andhouseholds can invest and grow.11 Strong institutions canalso have powerful indirect benefits. For example, adjustingto adverse shocks often requires painful but necessarychanges in domestic economic policies. In countrieswhere conflicts between competing interests are pro-nounced, and the institutions to resolve these conflictsare weak, recovery from shocks is often slower than it iswhere these institutions are strong.12
Similarly, there is growing evidence that ethnic frag-mentation has adverse effects on growth. Ethnically frag-mented countries and regions within countries tend to
provide fewer—and poorer quality—public goods, es-pecially education. Such areas are also more prone to vi-olent ethnic conflict. Institutions that guarantee minorityrights and provide opportunities to resolve conflicts havebeen shown to offset the side effects of polarized societies(chapter 7).13
Other exogenous factors, such as geography and ini-tial incomes, matter as well. There is some evidence thatgeographic characteristics affect growth—for example,a remote or landlocked location acts as a drag ongrowth.14 On average, initially poor countries havegrown more slowly than rich countries, so that the gapbetween rich and poor countries has widened (box 3.3).However, there is strong evidence that, controlling forsome of the factors mentioned above, growth is faster in
Conflict is overwhelmingly concentrated in poor countries
Share of incidents of civil war and strife, 1990–95
Percent
Source: USAID, OFDA 1999.
0
20
40
60
80
100
High-incomecountries
Developingcountries
Sub-SaharanAfrica
South AsiaMiddle Eastand
North Africa
Latin Americaand the
Caribbean
Europeand
Central Asia
East Asiaand
Pacific
Box 3.2
How war devastates poor people
Wars are devastating wherever they occur. Since they occur disproportionately in poor countries, the devastation falls dis-proportionately on the world’s poor people (see figure). More warsare now civil. During 1987–97 more than 85 percent of conflictswere fought within national borders (14 were in Africa, 14 inAsia, 1 in Europe). Tragically, 90 percent of war deaths are notmilitary (Pottebaum 1999). In Cambodia 1.7 million people diedin 20 years of fighting and political mass murder—among them,most of the country’s doctors, lawyers, and teachers. Civilian vic-tims are also singled out because of their ethnic identity: asmany as 800,000 Tutsis and moderate Hutus were killed by ex-tremist Hutus in Rwanda in 1994.
Nor are children exempt, for they are often recruited to fight.Children lucky enough to survive a conflict bear deep psycholog-ical scars. They also pay a heavy price for their abandoned school-ing in permanently diminished economic opportunities.
Wars cripple economies by destroying physical, human,and social capital—reducing investment, diverting public spend-ing from productive activities, and driving highly skilled work-ers to emigrate. In civil war a country’s per capita output fallsan average of more than 2 percent a year relative to what itwould have been without conflict. In more severe and protractedwars, the economic and human costs are even greater (Collier1999b).

, ,
Box 3.3
Divergence and worldwide income inequality
Widening gaps between rich and poor countries account for much of the increase in worldwide income inequality across individuals over the past 40 years
Note: The left panel refers to population-weighted averages of per capita GDP in the indicated groups, based on a sample of 123 countries with complete data on per capita GDP over the period 1960–95. China is excluded from the poorest 20 in 1960. The Theil index is a measure of income inequality; higher values indicate higher inequality.Source: Summers and Heston 1991; World Bank data; Bourguignon and Morrisson 1999; Milanovic 1999.
Per capita GDP
1985 U.S. dollars (PPP) Theil index
0
5,000
10,000
15,000
20,000
199519600
0.25
0.50
0.75
1.00
20001950190018501800
Bourguignon and Morrisson 1999
Milanovic 1999
Poorest20 countries
Richest20 countries
Income inequality among individuals
Given the importance of growth for poverty reduction, the failureof growth to take root in some of the poorest countries with thehighest incidence of poverty is particularly disappointing. Onesymptom of this failure is the widening gap in average incomesbetween the richest and poorest countries. In 1960 per capita GDPin the richest 20 countries was 18 times that in the poorest 20 coun-tries. By 1995 this gap had widened to 37 times, a phenomenonoften referred to as divergence (see left-hand panel of figure).
Such figures indicate that income inequality between coun-tries has increased sharply over the past 40 years. What hashappened to worldwide inequality between individuals? Trendsin worldwide inequality between individuals reflect trends inboth inequality between countries and inequality between in-dividuals within countries. The contribution of inequality be-tween countries depends on differences in country growthperformance and country size: rapid growth in a few largeand initially poor countries can offset the disequalizing effectof slow growth in other poor countries. In China, for example,rapid growth from a very low base has helped a fifth of theworld’s population halve the gap in average per capita in-comes with the world as a whole, significantly reducing world-wide inequality between individuals. In contrast, the 20 poorestcountries in the world in 1960 accounted for only about 5 per-cent of the world’s population, and so their failure to grow, while
disappointing, contributed less to worldwide inequality be-tween individuals.
Income inequality within countries shows less pronouncedtrends: in some countries inequality has increased, while in oth-ers it has fallen. Recent studies have found that across countriesincreases and decreases in inequality are roughly equally likely(Deininger and Squire 1996b). Again, however, country size mat-ters: changes in inequality in populous countries such as China,India, or Indonesia will contribute more to changes in worldwideinequality between individuals than will changes occurring insmall countries.
Trends in worldwide income inequality between individualsreflect both these factors, with the between-country componenttypically more important than the within-country component. Inlight of the difficulties with measuring income described in chap-ter 1, it is not surprising that estimates of worldwide inequalitybetween individuals are subject to substantial margins of error.But available estimates indicate that there have been some in-creases in worldwide inequality between individuals in pastdecades (see right-hand panel of figure). While the size of theseincreases depends on the methodology used and the periodconsidered, the evidence suggests that the increases in world-wide inequality in recent years are small relative to the much largerincreases that occurred during the 19th century.
⁄
countries that are initially poor. This relationship maynot be linear, with higher growth kicking in only aftercountries reach a threshold level of income. This raisesthe possibility of poverty traps at very low levels of de-velopment.15 Finally, initial inequality can influencelater growth, with implications for how growth translatesinto poverty reduction. This important issue is discussedin the following section.
What determines the sustainability of growth? In ad-dition to the policy, institutional, and geographic factorsmentioned above, a further important consideration iswhether or not growth is accompanied by environmen-tal degradation, which can in turn undermine growth.16
Environmental degradation can exact a heavy toll on theeconomy through poor health and reduced agriculturalproductivity. For example, heavy reliance on coal with-out effective controls on particulate, sulfur, and other emis-sions can cause high rates of lung disease, and sulfuremissions lead to acid rain, which reduces agricultural pro-ductivity.17 In the long run especially, attending to thequality of the environment and the efficiency of resourceuse is likely to boost investment, accumulation, andgrowth. Rapid growth and environmental protectioncan go together—because new additions to industrial ca-pacity can take advantage of cleaner technologies and ac-celerate the replacement of high-pollution technologies.18
Water is life, and because we have no water, life ismiserable.
—From a discussion group, Kenya
Why are similar rates of growthassociated with different ratesof poverty reduction?
The general relationship between economic growth andpoverty reduction is clear. But there are also significantdifferences across countries and over time in how muchpoverty reduction occurs at a given rate of economicgrowth. The bottom panel of figure 3.3 shows that therecan be large variation in poverty reduction for the samegrowth rate in per capita consumption (though extremevalues should be considered outliers). What explainsthese large differences? For a given rate of growth, the ex-tent of poverty reduction depends on how the distribu-tion of income changes with growth and on initialinequalities in income, assets, and access to opportuni-ties that allow poor people to share in growth.
Changes in the distribution of incomeHow growth affects poverty depends on how the addi-tional income generated by growth is distributed withina country. If economic growth is accompanied by an in-crease in the share of income earned by the poorest,incomes of poor people will rise faster than average in-comes. Similarly, if economic growth is accompanied bya decline in this share, growth in the incomes of poorpeople will lag behind growth in average incomes.
The same is true for poverty rates. For a given rate ofeconomic growth, poverty will fall faster in countrieswhere the distribution of income becomes more equal thanin countries where it becomes less equal. For example, inUganda growth with rising equality delivered strongpoverty reduction, while in Bangladesh rising inequalitytempered the poverty reduction from growth (box 3.4).Another example is Morocco, where the number of poorpeople increased by more than 50 percent between 1990and 1998, mainly because of declining real per capita pri-vate consumption (–1.4 percent a year). In urban areasthe increase in poverty was dampened by a decline in in-equality, while in rural areas rising inequality reinforcedthe increase in poverty.19
Does growth itself lead to systematic increases or de-creases in income inequality? Do the policies and insti-tutions that contribute to higher growth increase ordecrease inequality? Does the regional or sectoral com-position of growth affect changes in income inequality?To answer these questions the chapter first looks at theavailable cross-country evidence—and then turns tomore detailed country-specific evidence, which high-lights the fact that changes in income inequality are oftendriven by a complex array of opposing forces.
Many studies show that on average there is no sys-tematic relationship across countries between growthand summary statistics of income inequality such as theGini coefficient (figure 3.5).20 While this average rela-tionship is of interest, so are the substantial deviationsaround it.
The differences in inequality at a given rate of growthcould reflect the fact that the combination of policies andinstitutions that led to this growth differed acrosscountries—and that these differences in policies matterfor income distribution. But at the aggregate cross-country level, there is not much evidence that this is thecase. A recent study of growth and poverty reduction ina sample of 80 industrial and developing countries foundthat macroeconomic policies such as a stable monetary

, ,
policy, openness to international trade, and a moderate-size government raise the incomes of poor people asmuch as average incomes.21 In other words, these poli-cies did not systematically affect income distribution.
Other policies, such as stabilization from highinflation, may even disproportionately favor poor peo-ple (chapter 9). And greater financial development fa-
vors growth and may lower income inequality by im-proving access to credit.22
When I retired, I had 20,000 rubles in my savingsaccount. . . . But what the government did with it—thegovernment we trusted with our money! They re-indexedsavings so that inflation ate it! That money is now notenough for bread and water.
—From a discussion group, Ukraine
Another possible explanation for the lack of associa-tion between growth and inequality is that countries withsimilar overall growth rates could experience very differ-ent changes in income distribution because of differencesin the regional and sectoral composition of growth. Ifgrowth bypasses poor regions and poor people cannot eas-ily migrate to regions where opportunities are expanding,growth can lead to rising inequality. If growth is concen-trated in sectors from which poor people are more likelyto derive their income, such as agriculture, growth can beassociated with declining income inequality.
In China much of the sharp increase in income in-equality between the mid-1980s and mid-1990s reflectsthe much swifter growth in urban areas relative to rural
Box 3.4
Inequality trends and poverty reduction
In Uganda growth with rising equality delivered
strong poverty reduction . . .
After decades of war and economic collapse, growth re-covered in Uganda in the 1990s, averaging more than 5 per-cent a year. In just six years (1992–98) the share of Ugandansin poverty fell from 56 percent to 44 percent. The benefitsof growth were shared by all income groups, by rural andurban households, and by nearly all economic sectors. Realper capita consumption rose for all deciles of the population,implying a reduction in poverty regardless of the poverty line.
Modest reductions in income inequality made growth es-pecially effective in reducing poverty, with the Gini coefficientfalling from 0.36 to 0.34 during the five years. Living standardsimproved more among poorer households. Consumption (peradult equivalent) rose 27 percent for the poorest decile, com-pared with 15 percent for households in the richest decile.Among cash crop producers—especially coffee farmers, ini-tially as poor as the average Ugandan—poverty fell morethan twice as fast as for the country as a whole.
. . . while in Bangladesh rising inequality tempered the
poverty reduction from growth
In Bangladesh per capita GDP grew at about 2 percent a yearduring the 1990s, and poverty declined quite slowly. Between1983 and 1996 the share of people in extreme poverty fellfrom 40.9 percent to 35.6 percent—and the share in mod-erate poverty from 58.5 percent to 53.1 percent. Ruralpoverty in particular remains very high.
Why the slow decline? Part of the answer lies in risinginequality, in both urban and rural sectors, especially be-tween 1992 and 1996, when the Gini coefficient rose from0.26 to 0.31. Depending on the poverty measure used, a fifthto a third of the potential poverty reduction from growth mayhave been lost because of higher inequality. If inequalityhad not increased, the poverty rate would have been about7–10 percentage points lower in 1995–96 than it actually was.
The higher inequality in Bangladesh does not imply thatgrowth should not be pursued. To the contrary, faster growthis needed to reduce poverty faster, because growth’s net ef-fect on poverty reduction is positive. Also required are effortsto limit rising inequality and to ensure that growth reachesrural areas, where many of the country’s poor people live.
Source: Appleton and others 1999; Wodon 1997, 1999, 2000c.
Average annual growth in per capita consumption
Percent
Figure 3.5
Inequality varied widely in the 1980s and 1990s
but showed no systematic association with growth
Average annual growth in Gini coefficient
Percent
–20 –10 0 10 20–60
–40
–20
0
20
Note: The data cover 65 developing countries.Source: World Bank staff estimates based on data from Chen and Ravallion (2000).

⁄
areas.23 India’s states tell a similar story of the importanceof rural growth in poverty reduction (box 3.5). So doesIndonesia.24 A study of 38 developing countries found thatthe variation in inequality reflects the abundance of arableland, the prevalence of smallholder farming, and the pro-ductivity of agriculture.25 These findings underscore theimportance of removing policy biases against agriculturefor generating more equitable growth (chapter 4).
Cross-country evidence can take us only so far in un-derstanding the factors underlying changes in the distri-bution of income that make growth more or less pro-poor.Careful country-specific analyses paint a more nuancedpicture, highlighting a complex set of reinforcing andcountervailing forces. These include changes in the dis-tribution of education, changes in the returns to educa-tion, labor market choices, and demographic changes (box3.6). Those changes are the result of:
■ Market forces, such as changes in the demand forlabor.
■ Policies, such as public investment in education. ■ Social forces, such as higher participation of women
in the labor force or changes in practices discriminatingagainst women and ethnic minorities.
■ Institutional forces, such as changes in legal restrictionson the ownership of property by women or ethnicgroups.Not every increase in income inequality should be seen
as a negative outcome. As economies develop, incomeinequality can rise because the labor force shifts from agri-culture to more productive activities. For example, ifwages are lower in agriculture than in industry and ser-vices and the labor force shifts toward those two sectors,many summary statistics, especially those sensitive tochanges at the bottom end of the income distribution,will show increases in inequality despite an overall de-cline in poverty. These trends should not be seen as neg-ative if: ■ The incomes at the bottom rise or at least do not fall.■ The development process expands opportunities for all.
Box 3.5
What makes growth pro-poor in India?
Consistent with cross-country evidence for developingcountries, consumption poverty in India has fallen with thegrowth in mean household consumption. Moreover, the re-gional and sectoral composition of growth affects the na-tional rate of poverty reduction, with far stronger responsesto rural economic growth than to urban. And within ruralareas growth in agriculture and services has been particu-larly effective in poverty reduction, while industrial growthhas not.
In rural India higher agricultural productivity is crucialfor pro-poor economic growth. Data spanning 1958–94show that higher real wages and higher farm yields raisedaverage living standards and did not affect income distrib-ution. The result: less absolute poverty.
The effectiveness of nonfarm growth in reducing povertyhas varied widely across states, reflecting systematic dif-ferences in initial conditions. In states with low farm pro-ductivity, low rural living standards relative to urban areas,and poor basic education, poor people were less able toparticipate in the growth of the nonfarm sector. The role ofinitial literacy is notable: more than half the difference betweenthe elasticity of poverty to nonfarm output for Bihar (thestate with the lowest elasticity in India) and that for Kerala(the highest) is attributable to Kerala’s substantially higher ini-tial literacy rate. Women’s literacy is a slightly more signifi-cant predictor of growth’s contribution to poverty reductionthan men’s literacy.
For poor people to participate fully in India’s economicgrowth, agriculture, infrastructure, and social spending (es-pecially in lagging rural areas) need to be higher priorities.
Source: Ravallion and Datt 1996, 1999.
Figure 3.6
Initial inequalities influence the pace of poverty
reduction
Average annual reduction in incidence of poverty
associated with 1 percent increase in average per capita
consumption
Percent
Initial Gini coefficient
Note: The data cover 65 developing countries in the 1980s and 1990s. The incidence of poverty is the share of the population living on less than $1 a day.Source: World Bank staff estimates based on the methodology of Ravallion (1997a) and data from Chen and Ravallion (2000).
0
0.5
1.0
1.5
2.0
2.5
3.0
0.60.40.2

, ,
■ The observed trends are not the result of dysfunctionalforces such as discrimination.
■ The number of poor people falls.
Initial inequality and poverty reductionEven when the distribution of income itself does notchange with growth, countries with similar rates of growthcan have very different poverty outcomes, depending ontheir initial inequality. Other things being the same, growthleads to less poverty reduction in unequal societies than inegalitarian ones. If poor people get a small share of exist-ing income and if inequality is unchanged, they will alsoget a small share of the new income generated by growth,muting the effects of growth on poverty. Evidence confirms
this: when initial inequality is low, growth reduces povertynearly twice as much as when inequality is high (figure 3.6).
Initial inequality in income is not the whole story—for inequality in other dimensions matters too. The sen-sitivity of poverty to growth depends a great deal oninitial inequality in poor people’s access to opportunitiesto share in this growth. If disparities in educational at-tainment mirror disparities in income, poor people maynot have the skills to find employment in dynamic andgrowing sectors of the economy. This effect is com-pounded by gender inequality in access to education(chapter 7). In addition, if fixed costs or overt policy bar-riers hinder movement from remote, rural, and eco-nomically depressed regions to more vibrant urban centers,
Box 3.6
Complex patterns of distributional change in three economies
Observed changes in the distribution of income reflect a complexarray of factors—among them, changes in the distribution of as-sets, changes in the returns to these assets, labor market choices,and demographics. Brazil, Mexico, and Taiwan, China, show howthese forces can reinforce and offset one another to result in in-equality that is respectively lowered, increased, and unchanged .
Brazil—inequality lowered
Income inequality declined in Brazil between 1976 and 1996, withthe Gini coefficient falling from 0.62 to 0.59. During the same pe-riod the returns to education became more unequal: both wage earn-ers and self-employed workers with more education saw largerincreases in earnings than their less-educated counterparts, evenafter controlling for age and gender. There were no changes in thereturns to experience and only small declines in the pay gap be-tween men and women, so overall earnings inequality increased.This disequalizing effect was more than offset by three factors: ■ The distribution of education became more equal.■ Average educational attainment rose from 3.8 to 5.9 years of
schooling, and higher levels of schooling (particularly for women)contributed to a noticeable reduction in family size, with the av-erage household falling from 4.3 to 3.5 members. Since fam-ily size fell more for poorer households, inequality fell.
■ Inequality in the returns to characteristics other than educationseems to have fallen, suggesting a reduction in labor marketsegmentation during 1976–96 and a possible decline in regionalinequalities.
Mexico—inequality increased
Mexico’s Gini coefficient rose sharply between 1984 and 1994,from 0.49 to 0.55. As in the previous two examples, changes inthe returns to education were a strongly disequalizing force. But
changes in the distribution of education did not offset this. Whileeducational attainment rose faster for the less educated, the re-turns to higher education were sufficiently high that the addi-tional earnings due to greater education disproportionately favoredthe more educated. Superimposed on this were important re-gional effects, with widening rural-urban real wage differences con-tributing substantially to inequality, despite some convergence ofurban and rural returns to education and experience.
Taiwan, China—inequality unchanged
Noted for its low and stable level of inequality, Taiwan, China, hashad a Gini coefficient of about 0.30 for the past 30 years. As in Brazil,this outcome reflects a variety of opposing forces. Despite a rapidincrease in their supply, more-educated workers saw larger increasesin earnings than less-educated workers. This was more than offsetby greater equality in the distribution of education and greater labormarket participation by women. The pattern of taxes and transferswas also equalizing, with the effect that the distribution of individ-ual income became more equal. Interestingly, however, income in-equality at the household level increased, as many of the new femaleentrants to the labor force came from initially better-off households.
• • •
These examples show that simple trends in summary measuresof income inequality can disguise major structural forces. Someof them, such as changes in the distribution of education, can beinfluenced by policy—though this takes time. Others, such aschanges in the returns to education, reflect primarily market forcesand are less amenable to direct policy interventions. And as Tai-wan, China, shows, tax and transfer policies can counter increasesin primary income inequality.
Source: For Brazil, Ferreira and Paes de Barros (1999b); for Mexico, Legovini, Bouillon, and Lustig (1999); and for Taiwan, China, Bourguignon, Fournier,and Gurgand (1998).

⁄
poor people will be less likely to take advantage of op-portunities to migrate (box 3.7).
They have always excluded us Mayas, they havediscriminated against us. They cut down the tree, butforgot to pull down the roots. That tree is now sprouting.
—From a discussion group, Guatemala
If social inequities—such as caste systems or discrim-ination against indigenous peoples—confine membersof disadvantaged groups to employment in stagnant sec-tors, poor people will benefit less from growth (chapter7). Or if ethnic discrimination in the marketplace leadsto different returns to the same level of education, growthwill be less effective in reducing poverty for the group dis-criminated against. A study in Latin America found thatin several countries differences in earnings between in-digenous and nonindigenous people cannot be explainedby differences in skills or experience, suggesting that dis-crimination in the labor market may be to blame.26 Theseresults bring to the fore the importance of eliminating so-cial barriers for women, ethnic minorities, and socially dis-advantaged groups in making growth broad based.
Initial inequality and growthHigh initial inequality reduces the poverty impact of agiven rate of economic growth. It can also underminepoverty reduction by lowering overall economic growth.Early thinking on the effects of inequality on growth sug-gested that greater inequality might be good for growth—for example, by redistributing income to the rich, whosave, from the poor, who do not. This view implied atradeoff—more growth could be bought for the price ofmore inequality, with ambiguous effects on poor people.
More recent thinking—and empirical evidence—weaken the case for such a tradeoff: lower inequality canincrease efficiency and economic growth through a va-riety of channels. Unequal societies are more prone to dif-ficulties in collective action, possibly reflected indysfunctional institutions, political instability, a propen-sity for populist redistributive policies, or greater volatil-ity in policies—all of which can lower growth. And to theextent that inequality in income or assets coexists withimperfect credit markets, poor people may be unable toinvest in their human and physical capital, with adverseconsequences for long-run growth.
The effects of inequality on growth have been sub-jected to considerable empirical scrutiny. Evidence on
the impact of inequality in assets—and genderinequality—is generally clearest. A recent study of sugarcooperatives in India found that those that are most un-equal (in land ownership among cooperative members)are the least productive.27 Various studies have alsofound an adverse effect of land inequality on growth.28
A study in China found that living in a high-inequalityarea reduced growth rates at the farm household level,controlling for a household’s human and physical cap-ital.29 Other studies have found evidence of a link be-tween education and gender inequality and growth.30
In contrast, evidence on the effect of initial income in-equality on subsequent growth is more mixed. Somestudies have found negative effects.31 Others have foundpositive effects.32 Still others have found different effectsover different ranges.33
These results open the possibility that policies to improvethe distribution of income and assets can have a doublebenefit—by increasing growth and by increasing the shareof growth that accrues to poor people. This is not to say thatevery pro-equity policy will have such desired effects. If thereduction in inequality comes at the expense of the otherfactors conducive to growth (discussed in the early part ofthis chapter), the gains from redistribution can vanish. Ex-
Box 3.7
Diversification and migration in rural China
For rural agricultural households in China, opportunities foroff-farm employment have been an important source ofgrowth in incomes. These opportunities can be equalizing ordisequalizing. To the extent that diversification into nonfarmemployment reflects a pull factor—higher returns off thefarm—diversification can be disequalizing as richer and better-educated workers take advantage of these opportunities. Tothe extent that diversification reflects a survival mechanismfor the poorest, it can be equalizing.
Evidence from four provinces in China suggests that thepull factor has been more important than the survival mech-anism, with access to nonfarm employment accounting fora rising share of income inequality in rural areas between 1985and 1990. Evidence also suggests that even the modest gap(by international standards) between female and male edu-cational attainment exacerbates these trends, with less-educated women less likely to find off-farm employment. Incontrast, migration has had equalizing effects on income. Sur-vey data from the four provinces show that private transfers(largely reflecting migrants’ remittances) have been an equal-izing force.
Source: World Bank 1997b.

, ,
propriation of assets on a grand scale can lead to politicalupheaval and violent conflict, undermining growth. Andsometimes attempts to redistribute income can reduce in-centives to save, invest, and work. But there are a numberof win-win possibilities (box 3.8). Policies should focus onbuilding up the human capital and physical assets of poorpeople by judiciously using the redistributive power ofgovernment spending and, for example, market-based andother forms of land reforms (chapter 5; box 5.12).
Economic growth and nonincomepoverty
Just as income poverty declines as average incomes in-crease, so does nonincome poverty, such as in health andeducation. Just as with income poverty, there are signif-icant deviations around these general relationships: coun-tries and regions with similar per capita incomes canhave quite different outcomes in nonincome poverty aswell. And just as with income poverty, these deviationsreflect a wide array of forces—including initial inequal-ity, the effectiveness of public interventions, and the levelof development. Conversely, there is strong evidencethat better health and education outcomes contribute tofaster economic growth.
Across countries, and across individuals within coun-tries, there are strong correlations between health and ed-ucation outcomes and incomes. Richer countries andricher individuals within countries have lower rates of mor-tality and malnutrition.34 Within and between coun-tries both the quantity and the quality of educationimprove with income—although quality is difficult tomeasure.35 Disparities in educational attainment alsodecline with income.
These strong correlations reflect reinforcing causaleffects from higher income to better health and educa-tion outcomes—and from better health and educationto higher income. For individuals, this is not surprising.Ill health and malnutrition reduce productivity and timespent working, effects that vary with the level of educa-tion. For example, a study of Brazilian men showed thatadult height was strongly associated with wages—and thatwages increased faster with height among individualswith some (as opposed to no) education.36 Conversely,individuals with higher incomes can better afford to in-vest in health and education.37 Many studies documentthe positive effects of parental education on children’shealth and education.
Similar patterns hold for countries, with positive ef-fects of higher per capita income on infant mortality.38
Box 3.8
Redistribution can be good for efficiency
Redistribution need not compromise efficiency and growth. In sev-eral instances redistributive policies can increase asset accumu-lation by poor people—while improving efficiency and growth. Afew recent studies illustrate the possibilities for win-win out-comes, further strengthening the case for redistribution.
Land reform is a classic example of a redistributive policy. Op-eration Barga, a tenancy reform in the Indian state of West Ben-gal in the late 1970s and early 1980s, is one of the few examplesof large-scale transfers of property rights not accompanied bymajor social upheaval. The operation was associated with an 18percent increase in agricultural output in the state (Banerjee,Gertler, and Ghatak 1998).
Redistribution can also be a source of efficiency gains if trans-fers to poor people improve their human capital. Public provisionof infrastructure targeted to poor people is an important example.Massive primary school construction (61,000 new schools built andstaffed in five years) under Indonesia’s INPRES (presidential in-structions) program, the main mechanism for redistributing the gainfrom the oil boom in Indonesia, substantially increased educationand income. The primary school graduation rate rose 12 percent,and male wages 5 percent (Duflo 2000b).
Universal policies (such as pricing of government services) canhave redistributive and efficiency effects as well. Abolishing sec-ondary school fees in Taiwan, China, in 1968 and introducingcompulsory education benefited poorer children more than richerchildren (Spohr 2000). It also substantially increased school attainment (0.4 year for males) and labor force participation, trans-lating into higher earnings (Clark and Hsieh 1999).
Direct income redistribution (through cash transfers) is rare indeveloping countries. A concern is that cash may not be spent inthe most efficiency-enhancing ways. In South Africa at the end ofapartheid, the small pension program was dramatically expandedfor the black population. In 1993 the pension amounted to twicethe median income for blacks in rural areas (Case and Deaton 1998).When the pension was received by the maternal grandmothersof girls, it had large effects on nutrition—halving the gap in heightbetween these girls and those of the same age in the United States(Duflo 2000a). Other studies have shown, however, that the pen-sion, when received by an elderly woman, also led to a reductionin prime-age male labor supply (Bertrand, Miller, and Mullainathan1999). The results suggest that cash transfers can—but maynot—lead to efficiency gains.

⁄
Other studies have documented the benefits of lowermortality for faster growth, with most of the growthpayoff at low levels of income.39 And we have already seenthe evidence that better education outcomes lead to fastergrowth.
Moreover, there is some evidence that these relation-ships are not linear, with stronger increases in health as-sociated with growth in poorer countries and regions.Fairly small differences in economic growth rates canthus have large impacts on human development out-comes in such countries. One study estimated that hadgrowth rates in the developing world (excluding Chinaand India) been as high in the 1980s as they were in the1960s and 1970s, 656,000 deaths could have been avertedduring the 1980s among children under five.40
These reinforcing effects from human development toeconomic development and back suggest the possibilityof vicious and virtuous circles. Poor countries and poorpeople can be locked in a vicious circle, as low humandevelopment diminishes economic opportunities, mak-ing it more difficult to invest in health and education. Incontrast, well-targeted public interventions in health andeducation can contribute to a virtuous circle of greatereconomic opportunities generating resources for furtherinvestments (chapter 5).
The considerable variations in country experiencearound these general relationships again reflect a com-bination of factors. One is inequality in income.41 We haveseen that the effects of income on health are most pro-nounced at low levels of income. This implies that thesame rate of economic growth can have very differenthealth and education outcomes, depending on the ini-tial distribution of income and on how that distributionchanges with growth. In particular, growth accompa-nied by a reduction in inequality is more likely to leadto better health outcomes.
Research has found evidence that the correlationacross countries between average health indicators andaverage income vanishes after controlling for differ-ences in the incidence of income poverty and in pub-lic spending.42 The same research has found thatcross-country differences in public health spendingmatter more to the health of the income-poor than toothers: the nonpoor are better able to protect theirhealth from lower public spending. These results sug-gest that growth improves average health attainmentsthrough its ability to reduce income poverty and per-mit more pro-poor social spending.
Nonincome inequalities matter as well. Discrimina-tion by gender and ethnicity—in the allocation of pub-lic spending for education and health or in the operationof education and health facilities—can lead to differ-ences in education and health achievements. Gender dis-parities in educational attainment are especiallypronounced in poor countries (figure 3.7). In the Indianstate of Kerala—which has a long history of equitable gen-der relations—education and mortality differ little betweenmen and women. But in such states as Uttar Pradesh—where gender discrimination is high—the female literacyrate is less than half the male rate and the female to maleratio in the population is a disturbing 87.9 to 100.43 Cross-country studies have also identified geographic factors,ethnic fragmentation, and especially female educationalattainment as important in explaining differences inhealth outcomes at a given income.44 Finally, the qual-ity and quantity of public spending matter as well, thoughthe size of the impact on poor people depends greatly onsupportive policies and institutions (chapter 5).
• • •
This chapter has shown the importance of growthfor poverty reduction, particularly for income and
Figure 3.7
Across countries, the ratio of female to male
literacy rises with per capita income
Ratio of female to male literacy rate
Average, 1990–98
Source: World Bank data.
Per capita GDP
1995 U.S. dollars (PPP); log scale
100 1,000 10,000
20
0
40
60
80
100
120

, ,
human development. It has also shown how low anddeclining inequality enhances the impact of growth onpoverty. Growth can be made more equitable by re-ducing inequality in access to assets and opportunities.This requires opening market opportunities to poor peo-
ple and building up their assets. It also requires mak-ing state institutions work better for poor people, re-moving social barriers, and supporting poor people’sorganizations. These issues are taken up in subsequentchapters.