Embed Size (px)
Citation preview

Submitted to the Journal of Neuroscience,
Behavioral/Systems Neuroscience Section,
Dr. Stephen G. Lisberger, Section Editor
Temporal structure in neuronal activityduring working memory in Macaque
parietal cortex
Bijan Pesaran1, John Pezaris2, Maneesh Sahani2, Partha P. Mitra3
and Richard A. Andersen2;4
1 Division of Physics, Mathematics
and Astronomy
California Institute of Technology
Pasadena, CA 91125
2 Computation and Neural
Systems Program
California Institute of Technology
Pasadena, CA 91125
3 Bell Laboratories
Lucent Technologies
Murray Hill, NJ 07974
4 Division of Biology
California Institute of Technology
Pasadena, CA 91125
Abbreviated Title: Temporal structure during working memory
Page Count: 42 (excluding �gures)
Figure Count: 17
Table Count: 0
Word Counts: Abstract, 249; Introduction, 484; Discussion, 1498
Acknowledgments: This work was supported by NIH grant EY05522-21, ONR grant N00014-94-
0412, the Keck Foundation, the Sloan Foundation, the ERC at Caltech, and the Workshop
for the Analysis of Neural Data (http://www.vis.caltech.edu/�WAND)
Please address correspondence to:
Richard A. Andersen
Division of Biology 216-76
California Institute of Technology
Pasadena, CA 91125
(626) 395-8336 (OÆce) (626) 795-2397 (Fax)
1

Pesaran et. al. 2
Abstract
A number of cortical structures are reported to have elevated single unit �ring rates
sustained throughout the memory period of a working memory task. How the nervous
system forms and maintains these memories is unknown but reverberating neuronal network
activity is thought to be important. We studied the temporal structure of single unit spike
activity and simultaneously-recorded local �eld potential (LFP) activity from area LIP in
the inferior parietal lobe of two awake macaques during a memory-saccade task. Using
multitaper techniques for spectral analysis we �nd elevated power in the gamma frequency
band (25{90 Hz) during working memory in spiking and LFP activity. The activity is
spatially tuned to the direction of the saccade and is evidence for memory �elds de�ned by
temporal structure that we term dynamic memory �elds. We �nd spiking and LFP activity
are coherent in the gamma band during working memory, with no consistent coherence
present during simple �xation. This suggests that spike activity during working memory
is correlated with synchronized extracellular currents that give rise to broad-band LFP
uctuations. Finally, we �nd modulations in LFP activity in the beta frequency band (15{
25 Hz) that may be related to movement execution and preparatory aspects of the task.
This suggests the temporal structure in the LFP at a single site in parietal cortex may
also be used to predict both the direction and time of a planned movement which could
accelerate the development of a cortical neural prosthesis.
Keywords: parietal, local �eld potential, gamma band, beta band, monkey, coherence.
Pesaran et. al. 3
Working memory is a brain system requiring the temporary storage and manipulation
of information necessary for cognition (Baddeley, 1992). The neurophysiological basis of
working memory is studied in non-human primates by recording activity during delayed
response tasks (Fuster, 1995). Cue-selective elevations in single unit mean �ring rates have
been recorded during the delay period in many brain areas during di�erent versions of
these tasks (Fuster and Jervey, 1982; Bruce and Goldberg, 1985; Gnadt and Andersen,
1988; Miyashita and Chang, 1988; Funahashi et al., 1989; Koch and Fuster, 1989; Miller
et al., 1996; Zhou and Fuster, 1996). Parietal cortex is important to spatial cognition
(Andersen, 1995) and spatially-tuned increases in �ring rate during working memory were
�rst reported in parietal cortex on the lateral bank of the intraparietal sulcus (area LIP)
(Gnadt and Andersen, 1988). In analogy to receptive �elds in the sensory system, such
activity can be said to form memory �elds (Funahashi et al., 1989) and is thought to
re ect the plan to make a movement (Mazzonni et al., 1996; Snyder et al., 1997; Batista
and Andersen, 2001). Converging evidence indicates memory �elds may be important to
understanding the neural basis of working memory (Goldman-Rakic, 1995).
Temporally correlated neuronal activity in the form of reverberations has long been
thought to be important to short-term memory (Lorente de No, 1938; Hebb, 1949; Amit,
1995) but measures of mean activity, such as the �ring rate, do not capture correlations
and measures of the variance, such as the spectrum, are required. If reverberant activity
is present in neuronal activity, temporal structure localized in frequency may also predict
planned saccades would be evidence for memory �elds of temporal structure, or dynamic
memory �elds. Dynamic memory �elds are de�ned by cue-selective changes in the temporal
structure of neuronal activity. The temporal structure of neuronal activity has been the
subject of great interest (Singer and Gray, 1995; Roskies, 1999) and work has related it to
perception (Eckhorn et al., 1988; Gray and Singer, 1989; Engel et al., 1990; Kreiter and
Singer, 1996; Cardoso de Oliveira et al., 1997; Friedman-Hill et al., 2000), attention (Fries
et al., 2001) and action (Rouguel et al., 1979; Sanes and Donoghue, 1993; Bressler et al.,
1993; Murthy and Fetz, 1996a; Murthy and Fetz, 1996b; Roelfsema et al., 1997; Donoghue

Pesaran et. al. 4
et al., 1998; Lebedev and Wise, 2000). Previous studies of neural activity during object
working memory have reported temporal structure in spike activity in monkeys (Nakamura
et al., 1992) and in EEG activity in humans (Tallon-Baudry et al., 1999). The presence
of temporal structure speci�c to a remembered movement plan would lend experimental
support to the idea that working memory, and potentially other cognitive processes, involves
reverberating neuronal activity.
We recorded spiking and local �eld potential (LFP) activity from two macaques dur-
ing a memory-saccade task using a single tetrode located in area LIP. Spike activity has
been previously examined in area LIP during this task (Gnadt and Andersen, 1988; Chafee
and Goldman-Rakic, 1998). Previous analysis of this data has investigated it for tempo-
ral structure. Pezaris et al. (1997) looked for oscillations using autocorrelation functions
but averaged over di�erent behavioral conditions and reported their absence. Pezaris et
al. (1999) showed structure in auto- and cross-covariation between spike trains without
establishing statistical signi�cance. LFP activity has not been previously studied in pari-
etal cortex during working memory. We use multitaper spectral analysis techniques, which
were important to our obtaining the present results, to investigate temporal structure in
spiking and LFP activity. We �nd signi�cant structure in the spectrum of spiking and LFP
activity and the coherency between them. These results are evidence for dynamic memory
�elds speci�c to both the direction and time of a planned movement and suggest temporal
structure in neuronal activity may re ect neural processing.
MATERIALS AND METHODS
Animal preparation
Recordings were made from two adult male Rhesus monkeys (Maccaca mulatta). Each ani-
mal was �tted with a stainless steel head post embedded in a dental acrylic head cap to �x
their head position, a scleral search coil to record eye position and a stainless steel record-
ing chamber over a craniotomy to gain access to the cortex. All surgical procedures and
Pesaran et. al. 5
animal care protocols were approved by the California Institute of Technology Institutional
Animal Care and Use Committee and were in accordance with National Institutes of Health
Guidelines.
Behavioral task
Recordings were made while animals performed a memory-saccade task (see Fig.1). Each
trial of this task began with the illumination of a central �xation light, to which the animal
saccaded. As long as the �xation light was present, the animal was required to maintain
�xation within a 2Æ circular window. After foveation was established for a background
period of 1 s, a location was cued by a light ashed for 100 ms at one of 8 �xed locations
evenly distributed on a circle, radius 10Æ. Following the location cue, the monkey had to
maintain �xation for a further period of 1000 ms, at the end of which the �xation light
was extinguished, and the animal was required to saccade to the remembered location.
To help the animal maintain saccadic accuracy, the cued location was reilluminated for a
minimum of 500 ms, often triggering a corrective saccade, and the animal was required
to hold �xation at the new location while the target remained on. On completion of a
successful trial, the animal was rewarded with a drop of water or juice. Cued locations
were randomly interleaved to collect between 10{15 successful trials for each location in
blocked fashion. Locations were cued with spots of light generated with a two-beam optical
bench from incandescent sources, and rear-projected onto a screen for viewing by mirror
galvanometers.
Electrophysiological recordings
Electrical activity was recorded from the behaving monkey using single tetrodes (Reece and
O'Keefe, 1989) adapted for use in the awake monkey preparation (Pezaris et al., 1997b).
This is extensively described by Pezaris (2000), and is brie y summarized here. Tetrodes,
made from 12�m tungsten wire (California Fine Wire, CA), were placed in a �ne guide tube
and positioned using a standard hydraulic microdrive (Fred Haer Corp, Brunswick, ME).

Pesaran et. al. 6
Neural signals were ampli�ed by a custom four-channel headstage ampli�er (gain of 100)
feeding a custom four-channel variable-gain preampli�er (gain of 1{5000 nominally set to
200 (Pezaris, 2000)) and anti-alias �lters (9-pole elliptical low-pass, fc = 10 kHz, Tucker-
Davis Technologies (TDT), Gainesville, FL) before being digitized with a four-channel
instrumentation-grade 16-bit analog to digital converter (fs = 20 kHz, also TDT). Digi-
tal data were then streamed to disk and written to CD-ROM. The polarity of the signal
was reversed to give positive-going spike activity. Continuous extracellular traces were pro-
cessed o�-line to extract and classify spike events and calculate the LFP. Figure 2 presents
the extracellular potential from a channel of the tetrode. Panel a) presents activity during
one trial and panel b) presents activity during the memory period on an expanded time
base.
Spike Sorting
Spike activity was extracted from the digitized recordings by an automated procedure which
identi�ed and sorted spike waveforms into clusters, each presumed to arise from a single
cell. The algorithm has been developed and described by Sahani et al. (1998) and in detail
by Sahani (1999) and is summarized here.
Prior to spike sorting, the recordings were bandpass �ltered (0.6{10 kHz). A statistical
model describing the distribution of spike shapes was then �tted to waveforms extracted
from 30 s of data, as described below. This model was used to classify spike events in the
rest of the recording.
First, candidate spike times were identi�ed by comparing the signal to a threshold of
3 times the root-mean-square (RMS) signal value on each channel. Spikes were accepted
when the trace i) crossed and remained above the threshold for at least 0.1 ms on at least
one channel; ii) crossed the threshold on the other channels either within 0.1 ms of this
time, or else not within 1 ms; iii) did not remain above threshold for longer than 1 ms; and
iv) did not cross the threshold again within 1 ms. These constraints reduced the number of
overlapped spike events in order to reduce bias in estimating the spike waveform model.

Pesaran et. al. 7
A 2.4 ms segment (48 samples per channel) of data was then extracted from all four
channels, centered on each identi�ed spike time. A (2 times RMS) thresholded center of
mass was calculated for each spike waveform, and the segment resampled by interpolation
to yield 24 samples per channel (1.2 ms), with the center of mass falling one-quarter of
the way into the waveform. The precision of this center of mass alignment was 4{8 times
the original sampling frequency. The di�erent channels were then concatenated to yield
96-dimensional event vectors.
The background noise covariance expected in these event vectors was estimated using
1.2 ms segments extracted from the recording at times when no threshold-crossing was seen.
The event vectors were then transformed to lie in a space where this noise covariance was
whitened, and a mixture of a single Gaussian and a uniform density �t to them. The princi-
pal eigenvectors of the covariance of the Gaussian provided robust estimates of the principal
components of the data in the noise-whitened space. Low-dimensional event vectors were
obtained by projecting each transformed event onto the four leading eigenvectors of the
Gaussian covariance.
Events were clustered by �tting a mixture of Gaussian distributions to the low-dimensional
event vectors. The covariance of each Gaussian was �xed at the identity matrix (since the
background noise is white in the transformed event space). A uniform component was in-
troduced in the mixture to reduce the e�ect of outliers. The �t was performed using the
Relaxation Expectation-Maximization algorithm (Sahani, 1999; see also Ueda and Nakano
1994) which helped to avoid problems of local minima. The number of Gaussian components
was determined by cascading model selection (Sahani, 1999).
Each Gaussian component in the mixture was taken to represent the distribution of
spikes expected from a single cell, and events were assigned to cells according to a maximum
a posteriori rule. The autocorrelogram of spikes assigned to each cluster was checked to
ensure that no violations of the biophysical refractory period (<1 ms) were seen. To ensure
that the clustering was robustly determined, the segment of data used to �t the model was
varied and only models that were consistent for all segments were included in the database.

Pesaran et. al. 8
Data analysis
The collected data are spiking activity (a point process) and the LFP (a continuous valued
time series) making this a hybrid data set. The nature of structure in spiking activity
can be ambiguous and diÆcult to identify when it is analyzed as a simple point process
(Rosenberg et al., 1989). Fortunately, this problem can be addressed by viewing neuronal
activity as a hybrid process and investigating the components for correlations. Spectral
analysis provides a uni�ed framework for the characterization of correlations in hybrid
processes and we use multitaper methods of spectral estimation developed by Thomson
(1982) to construct estimators for all spectral quantities (see Appendix). These estimates
are presented and evaluated in Percival and Walden (1993) and are applied to a wide range
of neural data in Mitra and Pesaran (1999). Correlation function measures such as the auto-
and cross-correlation function characterize the same statistical structure in time series as
spectra and cross-spectra, however, as we discuss in a later section, spectral estimates o�er
signi�cant advantages over their time domain counterparts, the principal one being their
ability to resolve features better with less data.
Spikes were binned at 1 ms time resolution to give spike trains. LFP time series were
calculated from the extracellular recording on one tetrode channel by lowpass �ltering the
signal at 250 Hz (Thomson, 1994). LFP records were inspected for evidence of artifactual
power at 60 Hz and its harmonics by the presence of sharp spectral lines at those frequencies.
An artifact was present in some recordings during periods of low signal strength but had
little power and its in uence could not be detected in subsequent data analysis. When
correlating spiking and LFP activity we were concerned about spikes leaking through the
�lter into the LFP. We took two steps to reduce those artifacts. First, we estimated the
LFP from the channel of the tetrode that had the smallest spike amplitude. Second, we
subtracted a mean spike waveform from the extracellular recording at each spike time before
�ltering.
Mean Responses: The mean response of spike activity, the peri-stimulus time histogram

Pesaran et. al. 9
(PSTH), was calculated by counting the number of spikes per 1 ms bin and averaging across
trials for each saccade direction aligned to the location cue onset, followed by smoothing
with a Gaussian kernel, (� = 10 ms). The mean LFP response was calculated by averaging
the amplitude of the LFP across trials for each saccade direction aligned to the location cue
onset. This was then smoothed with a Gaussian kernel, (� = 10 ms). The mean response
was also calculated by aligning to the time of the saccade before averaging (Barash et al.,
1991) with little change in the results.
Spectral analysis: Spectral analysis is the study of time series in the frequency domain
and characterizes temporal organization. The spectrum is the Fourier transform of the
auto-correlation function and therefore contains equivalent information about the process.
The frequency domain is preferred over the time domain for many reasons, an important one
being that nearby points in time are highly correlated while neighboring points in frequency
are almost independent. The use of data tapers makes estimates of the spectrum even
less susceptible than the auto-correlation function to such problems of statistical bias and
variance (Brillinger, 1978) and therefore more suitable for investigating temporal structure
in experimental data.
We use multitaper methods for spectral estimation which employ special data tapers
called prolate spheroidal functions (also known as Slepian functions). These form an or-
thogonal basis set which is maximally concentrated in a frequency bandwidth, W , for a
speci�ed duration in time, T (Slepian and Pollack, 1961). In addition to being maximally
concentrated in frequency and time, there are many Slepian functions for a given choice of
T and W , and they are orthogonal to each other. Speci�cally, there are K functions that
are concentrated where K = 2p� 1, and p = TW , the time-bandwidth product. The use of
multiple Slepian functions as data tapers results in multitaper estimates having minimum
bias and variance properties. Working in the multitaper framework also o�ers practical
advantages for data analysis as the amount of smoothing in frequency and time is explicitly
controlled. Mathematical details of the multitaper techniques used to estimate the spectral
quantities are presented in the Appendix.

Pesaran et. al. 10
Three periods during the trial were investigated: baseline, working memory and perisac-
cadic. The baseline period extended 750{250 ms before the onset of the location cue. The
working memory period extended 450{950 ms following the o�set of the location cue. The
perisaccadic period extended 250 ms either side of the saccade. Baseline activity was es-
timated by pooling activity from all successful trials. Working memory and perisaccadic
activity were estimated by pooling activity from successful trials according to saccade di-
rection.
Two saccade directions of interest were de�ned for spiking and LFP activity, preferred
and anti-preferred (opposite to preferred). The preferred direction of spike activity was
the direction that elicited the maximum �ring rate during the period from the o�set of
the location cue to the o�set of the �xation light. The preferred direction of the LFP
was de�ned as the direction with the greatest gamma band (25{90 Hz) power during the
same period. In this study, multiple cells recorded at the same site had the same preferred
direction and the preferred direction of spiking and LFP activity were in alignment in all
recordings. Activity from di�erent locations was aligned to the preferred direction before
estimating population quantities.
Time-frequency representations of the activity were calculated on a 500 ms window that
was stepped by 50 ms between estimates through the trial with the time index aligned to
the center of the analysis window. As a control, window size was varied from 200{750 ms
with no signi�cant change in the results. Time-frequency representations were estimated
by averaging trials aligned in time to the location cue.
Spike spectrum: The spike spectrum was estimated on a 500 ms window using 9 Slepian
data tapers with time-bandwidth product 2p = 10 giving a frequency resolution of �10 Hz.
The result was then smoothed with a lag window with the same bandwidth for visualization
purposes (Percival andWalden, 1993). The spike spectrum was estimated for each cell giving
the single cell estimate. Spike activity from each cell was aligned according to preferred
direction and averaged for each saccade direction across all cells in each monkey to give the
population average. We normalized the spectrum by dividing by the mean �ring rate to

Pesaran et. al. 11
give the rate-normalized spectrum when comparing across cells or periods of the task.
Spike spectrum signi�cance levels were computed from estimates of the variance using
a jackknife over tapers and trials. (Thomson and Chave, 1991; Efron and Tibshirani, 1993)
and were used to test the hypothesis that the spectrum was non-uniform.
Interspike Interval Histogram: The interspike interval (ISI) histogram of spike activ-
ity was estimated using spike trains binned at 1 ms then smoothed by a 10 ms Gaussian
kernel.
Interval spectrum: The interval spectrum of spike activity was estimated by calculating
the spectrum of a sequence of 10 or more consecutive intervals between spikes. Three Slepian
data tapers with time-bandwidth product 2p = 4 were used. The result was then smoothed
with a lag window with the same bandwidth. The interval spectrum was not computed if
a sequence of 10 consecutive intervals in the window was not available (i.e. the �ring rate
was less than 20 Hz).
LFP spectrum: The LFP spectrum was estimated on a 500 ms window using 5 Slepian
data tapers with time-bandwidth product 2p = 5 giving a frequency resolution of �5 Hz.
The result was then smoothed with a lag window of the same bandwidth for visualization.
The spectrum of LFP activity was estimated for each recording giving the single site esti-
mate. LFP activity from each site was aligned according to preferred direction and averaged
for each saccade direction across all sites in each monkey to give the population average.
LFP spectrum signi�cance levels were estimated with multitaper methods using the
jackknife, as for the spike spectrum, and used to test the hypothesis that the LFP spectrum
was di�erent in one period of the trial compared with another.
Spike-field coherency: The coherency, C(f), is a complex quantity that is a function
of frequency for a given window in time and measures the degree of predictability of one
process using a linear function of the other (Brillinger, 1975; Rosenberg et al., 1989), or
phase coherence. Here we use a hybrid version of the coherency for point process and

Pesaran et. al. 12
ordinary time series data to measure the relation between spiking and LFP activity.
The magnitude of the coherency lies between zero and one and is called the coherence.
Coherence indicates the strength of a linear relationship between di�erent processes. The
coherency is used in preference to the cross-correlation function to measure the relation
between two processes. The cross-correlation function is typically normalized by the zero
lag estimates of the autocorrelation function. This is ad-hoc since it depends on the bin
size used to estimate the zero lag autocorrelation. In contrast, the coherency is normalized
independently for each frequency band by dividing by the spectrum of each process. This
normalization means changes in coherence are not a result of changes in �ring rate and
allows the coherency to be meaningfully averaged across di�erent pairs of time series.
Spike-�eld coherency was estimated on a 500 ms window using 9 Slepian data tapers
with time-bandwidth product 2p = 10 giving a frequency resolution of �10 Hz. Identi�ed
spike activity was suppressed in the extracellular potential before estimating the LFP by
subtracting a 2 ms mean spike waveform aligned to the event time. The spike sorting sta-
bility criterion described above insured the e�ectiveness of this suppression. The coherency
was estimated for each cell giving the single cell estimate. Spike-�eld coherency estimates
were aligned according to preferred direction and the complex coherency values averaged to
give the population coherency. Signi�cance levels were estimated with multitaper methods
using the jackknife, analogously to the spectrum.
Spike-triggered Average (STA) Potential: The relation between spike activity and
the extracellular potential was assessed with the use of a STA of the raw data during baseline
and working memory prior to a saccade in the preferred direction for that cell. Segments of
the raw voltage trace 200 ms long centered on the spike were extracted. Spike waveforms
were suppressed by subtracting a 2 ms mean spike shape waveform. The traces were then
averaged to give the STA potential. The STA potential provided a measure of association
between spike activity and the extracellular potential in the time domain. Since any residual
spike energy would be visible as a sharp (< 1 ms) uctuation in the spike-triggered potential
at zero time, this allowed an assessment of the spike suppression procedure. 95% con�dence

Pesaran et. al. 13
intervals were calculated by estimating the standard error of the mean and were used to
test the hypothesis that the STA potential was non-zero.
Phase Histogram: The LFP was �ltered into the gamma frequency band (25{90 Hz)
using a 100 ms digital �lter constructed from 6 Slepian functions (NW = 3.5). This gave
a complex-valued series. The phase of this signal was sampled at spike times during the
baseline and working memory and pooled from the preferred direction during working mem-
ory, and from all trial conditions during baseline then, �nally, pooled across all cells in the
study. These phases are the frequency domain version of the STA potential. The histogram
of phases between baseline and working memory provided a control for the coherency as
estimation of the histograms was not limited to spikes from a particular cell. A one-sample
Kolmogorov-Smirnov (K-S) test was used to determine signi�cance level for deviations of
the phase histogram during working memory or baseline from a uniform distribution. A
two-sample K-S test was used to determine the signi�cance level for deviations of the phase
histogram during working memory from baseline (Rao, 1965).
RESULTS
The database for this study contained 16 cells recorded at 16 sites in one monkey and activity
from 24 cells recorded at 18 sites in another monkey. The LFP was extracted from all these
recordings (16 sites in one monkey, 18 sites in the second). Since we were primarily interested
in memory period activity, a subjective evaluation was made during data collection to make
recordings when tuned memory activity was present in multiunit activity. Subsequently,
during o�-line analysis, recordings were further selected for containing at least one clearly
and stably isolated cell, using criteria described in the Methods section above.
Mean spike and LFP responses
Mean spike activity in area LIP during memory-guided saccades has been characterized
in previous reports (Gnadt and Andersen, 1988; Barash et al., 1991). We found 28 of 40

Pesaran et. al. 14
neurons (70%) had signi�cant memory period activity (p < 0:05).
The upper panel of Figure 3 a) presents line plots of the spike rate in the preferred
and anti-preferred directions for a typical cell with memory activity. The PSTH is shown
across trial conditions in a 2D plot in the lower panel. The upper panel of part b) shows
the mean LFP response for the same site in line plots for the preferred and anti-preferred
directions. This was calculated by averaging the amplitude of the LFP across trials to the
same direction. The response across trial directions is shown in a 2D plot in the lower panel.
Increases in the mean LFP are spatially tuned during and just after the location cue like
those in the �ring rate but spatially tuned memory activity is not. Broad tuning of the
mean LFP is present across saccade directions peri- and post-saccadically is not observed
in spike activity which may be related to the updating of movement �elds following the
saccade. There is also a suppression in the mean LFP response following the saccade that
is spatially tuned. These features are seen in recordings from all sites in area LIP in both
monkeys and are evidence for behaviorally-locked responses in the LFP at low frequency.
Temporal structure in spike activity
Increases in the mean �ring rate of cells during working memory tasks have been cited as
evidence for memory �elds that predict saccades to a remembered location in space (Gnadt
and Andersen, 1988; Funahashi et al., 1989). Temporal structure in spike activity may
also predict saccades to remembered spatial locations which would be evidence for memory
�elds of temporal structure, or dynamic memory �elds. Here, we de�ne dynamic memory
�elds in spike activity by changes in the shape of the spectrum during working memory.
In contrast, memory �elds described by the mean �ring rate are de�ned by changes in the
high-frequency limit, or level, of the spectrum, not the shape. Other measures of temporal
structure constructed from an interval representation will be discussed below.
Figure 4 presents spectral analysis of spike activity from a typical cell with memory
activity. Panel a) shows the results during the baseline. The level of the spectrum is equal
to its mean �ring rate and the spectrum of a Poisson process with the same mean rate

Pesaran et. al. 15
would fall on this line. The measured activity is not signi�cantly di�erent from Poisson
except at low (< 10 Hz) frequencies where it is suppressed.
Figure 4 panel b) shows the results of the analysis of activity during working memory
from the same cell. The spectrum during working memory is signi�cantly di�erent from a
Poisson process. There is a signi�cant peak in the spectrum in the gamma band at 50 Hz.
The spectrum during working memory is also strongly suppressed at low frequency (0{10
Hz). These two features indicate the cell �res spikes at regular intervals during working
memory. The �gure is annotated with the peak of the spectrum in the gamma band (25{90
Hz), S , the value of the spectrum at 0 Hz, S0, and the mean �ring rate �.
We combine these features into a spectral shape parameter, ÆS, that is used to quantify
the degree of temporal structure in the spike spectrum across a population of recordings.
ÆS =S � S0
�
This measure is related to the derivative of the spectrum and quanti�es deviations of the
spectrum from a Poisson process that are local in frequency. Importantly, since ÆS is
explicitly normalized by the level of the spectrum it is a dimensionless number and is not
biased by the mean �ring rate.
Figure 5 panel a) presents results during baseline and panel b) presents results during
working memory. The top panel shows the population average spectrum in each case. 95%
con�dence intervals shown by dashed lines indicate that deviations from the Poisson level
are signi�cant during working memory across the population and not during baseline. The
lower panels of �gure 5 present the distribution of the spectral shape parameter pooled
across all cells in the database.
The central vertical panel shows the distribution of spectral shape for baseline and
working memory activity across the data set. These distributions were unimodal, but
somewhat skew so we used the median as a measure of central tendency, displayed as a

Pesaran et. al. 16
notch in the boxplot for each condition. Robust 95% con�dence intervals for this estimate
are shown by the extent of the notch about the median. Similar boxplot displays present
population data in later �gures.
The median spectral shape during the baseline is small indicating that baseline activity
contains little temporal structure. In contrast, the distribution of spectral shape during
working memory is signi�cantly larger (p < 0.05). This is consistent with the population
average spectrum and shows that working memory activity in area LIP contains signi�cant
temporal structure not present during the baseline.
The individual plots of the spectrum during baseline reveal little temporal structure
except for a small amount of suppression at low frequencies (0{10 Hz). In contrast, those
during during working memory reveal signi�cant temporal structure with a peak in the
gamma frequency band (25{90 Hz) and sharp suppression at low frequencies (0{10 Hz)
across the distribution.
Analysis of temporal structure in non-preferred directions suggests dynamic memory
�elds are aligned to the same spatial location as �elds de�ned by the mean �ring rate.
Under the present experimental design, equal numbers of trials are performed for each cue
direction, resulting in data from the non-preferred directions having fewer spikes available for
analysis. Since resolving temporal structure in spiking requires more spikes than estimating
the mean �ring rate, it is diÆcult to estimate how the spectrum changes with the rate in
these data. Figure 10 below, presents the distribution of spectral shape for each direction
across the population and demonstrates this problem.
We estimated the spectrogram of spike activity during trials to the preferred direction
to see how temporal structure is organized during the trial. Figure 6 panel a) presents the
results for a typical cell and panel b) after averaging across the population of cells. The
spectrogram, shown in the upper panels, is dominated by changes in the rate. To compare
temporal structure between time intervals with di�erent �ring rates, we present an estimates
of the rate-normalized spectrogram in the lower panels. The rate-normalized spectrogram
suggests the temporal structure during working memory is not a visual response to the
Pesaran et. al. 17
location cue since it begins after the o�set of the location cue and extends through the
saccade.
Additional analyses not presented here show that the shape of the spectrum given by
the frequency at the gamma band peak is relatively constant across the population of cells
in both monkeys and is not correlated with the the mean �ring rate. This is evidence the
spike activity is not well modelled by a simple integrate-and-�re model with uncorrelated
inputs. The mean �ring rate of the cell is, however, correlated with the strength of the
spectral suppression and its width in frequency.
These data contradict the commonly held assumption of independent spike arrival times
and are evidence for the presence of signi�cant temporal structure that is modulated by
the behavioral state of the monkey. During the baseline, the probability of the cell �ring
is completely random and can be modelled as a Poisson process. In contrast, the activity
during working memory shows detailed temporal structure. The probability of the cell �ring
is suppressed for a period around each spike and then enhanced to give increased power in
a broad, gamma frequency band (25{90 Hz).
Interval analysis of spike activity
The sequence of time intervals between consecutive spikes, or interspike intervals (ISIs)
forms a representation of spike activity, the interval representation, that is complementary
to the sequence of spike arrival times, or counting representation, that we have considered
so far. Activity from a Poisson process, which has no temporal structure, has the following
interval properties: i) the ISI distribution falls exponentially with the length of the interval
and ii) the sequence of ISIs is uncorrelated. A renewal process, which can contain tem-
poral structure, generalizes the interval properties of the Poisson process by allowing the
ISI distribution to take any form. (Cox and Lewis, 1966). As the sequence of ISIs in a
renewal process is assumed to be uncorrelated, the process is completely described by its
ISI distribution. We were interested to know whether a renewal process could fully explain
the temporal structure we observe or if correlations between ISIs are present that would
Pesaran et. al. 18
lead to additional temporal structure.
Figure 7 presents ISI distributions of spike activity for a sample cell. Panel a) shows
the ISI histogram during baseline and panel b) during working memory. A clear change
in activity can be seen between the two plots. ISIs during the baseline are exponentially
distributed with a small rate while the ISI histogram during memory is bimodal: Intervals
are either very short, < 3 ms, ie bursts, or center around 10{20 ms. Similar ISI histograms
have been previously reported in macaque area MT (Bair et al., 1994) and in the visual
cortex of the cat (Gray and McCormick, 1996).
To determine whether there is additional temporal structure in the activity due to
correlations between ISIs, we tested the renewal process assumption. We characterized
dependencies between intervals with the spectrum of the sequence of ISIs, or interval spec-
trum, which is known to be a powerful test for a renewal process (Cox and Lewis, 1966).
The interval spectrum is analogous to the serial-order correlation function, but is a more
sensitive test that has not been previously presented for neuronal spiking activity.
Figure 7 panel c) presents the interval spectrum for memory activity from the sample
cell on a log scale (solid) accompanied by 95% con�dence intervals (dashed). The dotted line
presents a uniform spectrum for comparison. The interval spectrum does contain signi�cant
structure with increasing energy at shorter lags. This means neighboring intervals are anti-
correlated: short intervals are likely to follow long ones, and long intervals are likely to
follow short ones. These observations are further evidence that during working memory, in
addition to being non-Poisson, spiking activity in area LIP is also non-renewal and contains
spikes and bursts that are temporally patterned in a broad gamma frequency band.
Temporal structure in LFP activity
LFP activity is generated by extracellular currents that are thought to be related to synaptic
activity in a local population of cells (Mitzdorf, 1985). Previous studies have reported that
temporal structure is present in LFP activity in cats (Gray and Singer, 1989) and macaques
(Eckhorn et al., 1993; Kreiter and Singer, 1996). If the temporal structure we observe in
Pesaran et. al. 19
spiking during working memory is a result of synchronized synaptic activity it may also be
present in the LFP.
Figure 8 presents the LFP spectrum at a single site for trials to the preferred direction.
Panel a) presents the results during working memory (solid) and baseline (dashed). Al-
though most of the power in the LFP is below 30 Hz, working memory activity above 30
Hz is elevated compared to baseline and peaked in the gamma frequency band (25{90 Hz).
Panel b) presents the relative power of the spectrum between working memory and baseline
formed by dividing the spectrum during working memory by the spectrum during baseline.
Temporal structure in LFP activity changes between working memory and baseline in a
gamma band, but not at low frequencies.
The signi�cant di�erence in power in the gamma band (25{90 Hz) is also present in
a population average of the spectrum. Figure 9 panel a) presents the population average
spectrum during the baseline and panel b) during working memory in the preferred direction.
The con�dence intervals do not overlap in the gamma band (25{90 Hz) indicating the
di�erence in power is signi�cant across the population.
In �gure 9 we also compared the relative power between working memory and baseline
at low frequency (0{10 Hz) and at the peak in the gamma band (25{90 Hz) across the data
set. Panel c) shows boxplots of the distribution in each frequency band. The distribution
of relative power at low frequency (0{10 Hz) is not di�erent from 1, while the distribution
of relative power in the gamma band (25{90 Hz) is signi�cantly greater than 1. Panel d)
presents the relative power across the distribution.
We tested the hypothesis that power in the LFP in the gamma frequency band (25{90
Hz) was greater in the preferred direction during working memory compared to baseline
against the null hypothesis that there was no di�erence. Gamma band LFP power was
signi�cantly greater (p < 0:05) in the preferred direction during working memory than
baseline in 27 of 34 (82%) of sites recorded from.
The increase in LFP power in a gamma band during working memory is evidence for
dynamic memory �elds similar to those seen in spike activity, presented above. We were

Pesaran et. al. 20
interested to determine how these memory �elds were spatially tuned. Figure 10 presents
tuning curves for a) the mean �ring rate; b) gamma band LFP power; c) spike spectral
shape and d) low frequency LFP power across a population of recordings pooled across
both monkeys. The mean �ring rate and LFP gamma band activity (25{90 Hz) show clear
tuning. The spike spectral shape shows some tuning, but it is not well resolved since the
�ring rate was low in non-preferred directions. LFP activity at low frequencies (0{10 Hz)
does not show signi�cant spatial tuning. This shows spatial tuning in the LFP is local in
frequency and not due to an overall increase in power.
We tested the hypothesis that gamma band LFP power was greater during working
memory in the preferred direction compared to the anti-preferred direction against the
null hypothesis that there was no di�erence. Gamma band (25{90 Hz) LFP power during
working memory was signi�cantly greater (p < 0:05) in the preferred direction compared to
the anti-preferred direction at 28 of 34 (85%) sites recorded from.
Figure 11 shows spectrograms for LFP activity averaged during trials to the preferred
and anti-preferred directions. In the preferred direction, the increase in gamma band power
is sustained during the memory period through the saccade for a single site and across the
population. In addition to dynamic memory �elds the LFP contains di�erent task-related
activity in the beta frequency band (15{25 Hz). This activity does not show simple spatial
tuning, but is modulated during the trial.
Figure 12 shows LFP power in the gamma and beta frequency bands over time. Ele-
vations in gamma band power are clearly seen and extend through the saccade, similar to
the elevations of gamma band power in spiking activity. Activity in the beta band is mod-
ulated during working memory and perisaccadically. Immediately after the location cue,
beta band power is suppressed and it then increases toward the end of the memory period.
Beta band activity is also suppressed perisaccadically during saccades to all directions and
this is present in activity at a single site and a population average. We tested the hypothesis
that peri-saccadic activity in the beta frequency band (15{25 Hz) is suppressed compared
to working memory against the null hypothesis that there was no di�erence. Beta band

Pesaran et. al. 21
activity was signi�cantly suppressed (p < 0:05) at 34 of 34 (100%) sites recorded from.
These observations are evidence for temporal structure in the LFP in multiple frequency
bands. Activity in the gamma frequency band is spatially tuned while activity in the beta
frequency band is dynamically modulated during the task.
Coherency between spiking and LFP activity
We report temporal structure in the gamma frequency band (25{90 Hz) that is present in
both spiking and LFP activity during working memory. If spike activity is being driven
by synchronized synaptic activity and these currents are also measured in LFP activity the
processes may be coherent. We investigated this possibility by studying the extracellular
potential centered on spikes and by calculating the coherency between spiking and LFP
activity during baseline and working memory. A study of spike-�eld coherency may also
provide useful information about the nature of non-Poisson temporal structure in spike
trains.
We �rst estimated the STA potential. The mean potential in a 200 ms window was
calculated conditional on spike times during working memory and compared against baseline
at a single site. Figure 13 panel a) shows the STA potential during the baseline period and
panel b) shows it during working memory. The STA during working memory shows an
oscillatory component in the average that is absent from the baseline indicating that the
phase of the potential in that frequency band is coherent with spike activity. However, this
structure remains just below signi�cance across much of the window although it is clearly
present. This suggests that error bars constructed in the time domain are not suitable to
detect signals localized in frequency and that frequency-domain techniques may describe
this activity more clearly.
We present two ways to test for correlated activity that is localized in frequency. In
the �rst, we estimate the coherency between spiking and LFP activity. In the second, we
study a frequency domain version of the STA potential. We �lter the STA potential in the
gamma frequency band (25{90 Hz) and compare the histogram of the phase at spike times

Pesaran et. al. 22
between baseline and working memory pooled across all cells in this study.
Figure 14 shows the coherence between a cell and the simultaneously recorded LFP.
Panel a) shows activity during baseline and panel b) activity during working memory.
There is no signi�cant spike-�eld coherence during the baseline whereas a sharp increase
in the spike-�eld coherence exceeds 99% con�dence intervals in the gamma frequency band
during working memory.
We calculated the coherency for the 40 cells in this study during saccades to the preferred
direction and compared the distribution of coherence in the gamma band between the
baseline and working memory. Figure 15 presents the results. The central panel shows
the distribution of gamma band coherence during working memory is signi�cantly larger
(p < 0:05) than during baseline across the population. The left panel shows no signi�cant
structure is observed during baseline; in contrast, the right panel shows there is signi�cant
coherence during working memory.
A comparison of activity between multiple cells and the LFP recorded at the same site
was not possible as there were only two pairs of simultaneously recorded cells with elevations
in �ring rate during working memory in this study.
Figure 16 presents the coherence against time and frequency during saccades to the
preferred direction. Panel a) shows the results at a single site and panel b) shows the
population average. An increase in gamma band coherence is seen after the location cue
and during the memory period. When the coherence is signi�cant the phase of the coherency
is shown by an arrow and is approximately zero radians indicating the cell �res on or just
before the peak of the LFP oscillation (according our convention for the LFP). The phase
of the coherency during working memory is relatively constant across the gamma band so
spike and LFP activity do not lag each other in time. These observations are evidence for
sustained phase-locking between the spiking and the LFP during working memory. The
population average shows the increase in gamma band coherency between the LFP and
spiking is signi�cant (p < 0:01). Therefore spiking locks to gamma band temporal structure
in the LFP during working memory with the same preferred phase in all recordings from

Pesaran et. al. 23
area LIP in this study.
Con�dence intervals for the estimates of spike-�eld coherency are sensitive to the total
number of spikes available, so these measures are less sensitive to coherency during baseline
than working memory. We applied a test for spike-�eld coherency that had the same
statistical power during the baseline and working memory. This is a frequency-domain
version of the STA potential that could be pooled across recordings (see Methods). Figure 17
shows the normalized histogram of this spike-triggered gamma band phase during working
memory (solid) and the baseline (dashed). The distribution during working memory is
signi�cantly di�erent from uniform (p < 0:01 K-S test: N=6192) as well as signi�cantly
di�erent from baseline (p < 0:01 K-S test: N=6192) while the distribution during baseline
is not signi�cantly di�erent from uniform (p < 0:01 K-S test: N=6192). Consequently,
there is no evidence of gamma-band phase-locking between spiking and LFP activity in the
gamma band during the baseline.
The presence of signi�cant gamma band coherence between spiking and LFP activity
has consequences for models of spike activity during working memory. It shows spiking
during working memory cannot be modelled as a renewal process which is in agreement
with results of the interval analysis presented above.
DISCUSSION
This study investigates the relation of neuronal dynamics to working memory by examining
temporal structure within and between spiking and LFP activity in area LIP of macaque
parietal cortex during a memory-saccade task. We begin by discussing a methodological
issue and then focus on the three principal �ndings of this work: i) spike activity contains
temporal structure during working memory and not simple �xation which is evidence for
dynamic memory �elds; ii) LFP activity reveals spatially tuned dynamic memory �elds in
the gamma band (25{90 Hz) but not at low frequencies (0{10 Hz); and iii) dynamic memory
�elds in spiking and LFP activity are coherent in the gamma band with the same phase

Pesaran et. al. 24
across LIP. This means spike activity contains temporal structure that is local in frequency.
Results from the LFP suggest this activity is synchronized across large populations of
neurons.
General methodological issue: Time and frequency
The presence of temporal structure in neural activity is of much interest (Singer and Gray,
1995) and previous work in our lab has investigated it in these data using correlation
function measures (Pezaris et al., 1997a; Pezaris et al., 1999). Correlation functions are
often estimated in the time domain to detect temporal structure but have long been known
to su�er serious problems of estimation bias and variance which are exacerbated in the
context of a behaving animal (for a review see Jarvis and Mitra (2001)). These problems
cannot be addressed by pooling observations across a large period of time with di�erent
associated behaviors during the experiment as this leads to violation of the stationarity
assumption and potential misinterpretation of the data.
Here we resolve signi�cant temporal structure in neuronal activity in parietal cortex
using spectral analysis. Spectral quantities are estimated in the frequency domain and
while the corresponding population quantities are mathematically equivalent to correlation
functions their estimates have superior statistical properties. Importantly, the problems
of estimation bias and variance can be controlled by using multitaper spectral analysis
methods (Thomson, 1982; Percival and Walden, 1993). Multitaper estimates form a general
class that subsume conventional estimates such as lag window and overlap-add estimates
(Walden, 2000). Other advantages of working in the frequency domain are that i) weak
non-stationarity only manifests itself in the spectrum at low frequencies; ii) nearby points
in frequency are statistically independent resulting in local error bars for the estimates;
and iii) the problem of the normalization of the cross-correlation function can be addressed
by using the coherency which is dimensionless. In general, the advantages of multitaper
methods for spectral analysis are most pronounced when dealing with short segments of
possibly nonstationary data. Such problems are particularly severe when studying neuronal

Pesaran et. al. 25
activity in a behaving animal.
Understanding the temporal structure in spike activity
Our �ndings show spike activity during working memory is not well modelled by a Poisson
or renewal process and contains temporal structure local in frequency. This contradicts
commonly held assumptions about the independence of spiking activity (Shadlen and New-
some, 1994). Mathematically, spike activity can be modelled as a point process composed of
discrete events in time (action potentials). Point processes are described either as a series of
event times (a counting process) or as a series of time intervals between events (an interval
process). These representations are equivalent and complimentary (Daley and Vere-Jones,
1988).
The simplest counting process is the Poisson process which is often used to model
random spiking activity. This process is parameterized by a rate: the average number of
events occurring during a given interval (Cox and Lewis, 1966). Since the probability of
an event occurring at a given time is not dependent on activity before that time, there
is no temporal structure in a Poisson process. The spectrum measures dependencies in
the temporal ordering of events in a random process. A Poisson process has a at or
white spectrum so spike spectra with signi�cant deviations from uniformity are evidence of
temporal structure. If suppression is also present in the spectrum, a Poisson process with
a stochastic, time-varying rate cannot describe the activity either (Brillinger, 1978).
Spike activity that is non-Poisson is often modelled using a renewal process. A renewal
process is completely described by its ISI histogram therefore the temporal structure in
a renewal process is determined by the rate of each interval and does not extend beyond
neighboring pairs of events. We used the interval spectrum, which is sensitive to the ordering
of intervals in time, to test whether spiking activity is a renewal process. Since the interval
spectrum is not white, the underlying process cannot be modelled as renewal.
Our analysis of the spike spectrum shows that during working memory there is temporal
structure due to a combination of spectral suppression and a gamma band spectral peak.

Pesaran et. al. 26
Using the interval spectrum we show that the ISIs are not independent. There is temporal
structure due to correations between intervals and the activity cannot be modelled by a
renewal process. The signi�cant spike-�eld coherency con�rms this and shows that during
periods of elevated �ring the temporal correlations are local in frequency and cannot be
described by the rate of speci�c intervals, ie bursts. The role of temporal structure in
neural coding has been controversial (Roskies, 1999). These results are clear evidence
that temporal structure in spiking activity is modulated during behavior and organized in
dynamic memory �elds that may re ect neural processing.
Temporal structure in the LFP
Our results indicate gamma band LFP activity is also organized in dynamic memory �elds
during working memory. The tuning of temporal structure in spike activity was not well
resolved in some cue directions but by analyzing the LFP we were able to study temporal
structure in all directions. This illustrates the improved statistical power of LFP activity
compared with spike activity when the �ring rate is low. The presence of dynamic memory
�elds in the LFP is evidence of synchronized activity in large populations of neurons. This is
supported by the results of spike-�eld coherence and suggests the LFP re ects the columnar
organization of area LIP (Blatt et al., 1990).
Two other aspects of LFP activity related to the task were also interesting. Firstly, the
tuning of the LFP mean response broadens peri- and post-saccadically. The signi�cance
of this is not known, but it may be related to signals to update the eye �elds in area LIP
following the saccade (Gnadt and Andersen, 1988; Duhamel et al., 1992; Batista et al.,
1999; Snyder et al., 1999). Secondly, the LFP has additional temporal structure in the beta
frequency band that could be related to movement execution and preparatory aspects of
the task. These results indicate temporal structure in the LFP in parietal cortex contains
a variety of speci�c information about the direction and time of planned movements.
Parietal cortex is implicated in higher cognitive function and spiking activity in various
parietal areas codes for movement plans (Andersen, 1995; Bracewell et al., 1996; Snyder
Pesaran et. al. 27
et al., 1997). There is interest in decoding cortical signals for a neural prosthesis but
acquiring spiking activity with chronically implanted electrodes remains a challenge (Shenoy
et al., 1999). Since the LFP is easier to acquire than spiking, our �ndings suggest that
decoding the temporal structure in LFP activity could accelerate the development of this
application.
Coherent gamma band activity during working memory
We �nd that during working memory the coherency between spiking and LFP activity is
signi�cant in the gamma band. Spikes exhibit phase locking to the LFP and preferentially
�re at the peak of a broad-band LFP oscillation throughout the memory period and this
temporal structure is not present during simple �xation. While we have observed coherent
activity during working memory it is important to note such activity need not be speci�c to
working memory. Area LIP is activated by a number of other oculomotor tasks that require
spatial cognition (Colby and Goldberg, 1999) and coherent gamma band activity could be
present during those tasks.
Our �nding of correlations in a broad gamma frequency band modulated by behavior
complements recent reports of gamma band activity during attention in the monkey (Fries
et al., 2001) and working memory in human EEG (Tallon-Baudry et al., 1998; Tallon-Baudry
et al., 1999). These and other studies suggest that, in addition to providing important
statistical advantages, investigating correlations between spikes and LFP activity may help
bridge the gap between potentially related results showing modulated temporal structure
in EEG activity in humans and single unit activity in non-human primates (Tallon-Baudry
and Bertrand, 1999).
Appendix
Here we present multitaper methods of spectral analysis used in this paper. These methods
were introduced in (Thomson, 1982) and have been successfully applied to neurobiological
Pesaran et. al. 28
data in recent work (Mitra and Pesaran, 1999; Prechtl et al., 1997; Cacciatore et al., 1999;
Mitra et al., 1997). Multitaper methods involve the use of multiple data tapers for spectral
estimation. A segment of data is multiplied by a data taper before Fourier transformation.
A variety of tapers can be used, but an optimal family of orthogonal tapers is given by the
prolate spheroidal functions or Slepian functions. These are parameterized by their length
in time, T , and their bandwidth in frequency, W (Slepian and Pollack, 1961). For choice of
T and W , up to K = 2TW � 1 tapers are concentrated in frequency and suitable for use in
spectral estimation.
The ordinary continuous-valued time series and point processes are considered in this
work form a hybrid data set and spectral analysis provides a uni�ed framework for their
analysis. For the ordinary time series consider a continuous-valued process that has been
sampled in time, xt; t = 1; : : : ; N . The basic quantity for further analysis is the windowed
Fourier transform, ~xk(f):
~xk(f) =NX1
wk(t)xte�2�ift (1)
where wk(t) (k = 1; 2; : : : ;K) are K orthogonal taper functions.
For the counting representation of a point process consider a sequence of event times
f�jg; j = 1; : : : ; N in the interval [0; T ]. The quantity for further analysis is also the win-
dowed Fourier transform, also denoted by ~xk(f):
~xk(f) =NXj=1
wk(�j)e�2�if�j
�N(T )
T~wk(f) (2)
where ~wk(f) is the Fourier transform of the data taper and N(T ) is the total number
of spikes in the interval. The analysis of the interval representation of a point process
proceeds by analyzing the intervals between spike event times as a continuous process.
When averaging over trials we introduce an additional index, i, denoting trial number,
~xk;i(f).
When dealing with either point or continuous processes, the multitaper estimates for

Pesaran et. al. 29
the spectrum Sx(f), cross-spectrum Syx(f) and coherency Cyx(f) are given by
Sx(f) =1
K
KX
k=1
j~xk(f)j2 (3)
Syx(f) =1
K
KX
k=1
~yk(f)~x�
k(f) (4)
Cyx(f) =Syx(f)q
Sx(f)Sy(f)(5)
The auto- and cross-correlation functions can be obtained by inverse Fourier transform-
ing the spectrum and cross-spectrum.

Pesaran et. al. 30
References
Amit, D. (1995). The hebbian paradigm reintegrated: local reverberations as internal
representation. Behav. Brain Sci., 18:617{626.
Andersen, R. (1995). Encoding of intention and spatial location in the posterior parietal
cortex. Cerebral Cortex, 5(5):457{469.
Baddeley, A. (1992). Working memory. Science, 255:556{559.
Bair, W., Koch, C., Newsome, W., and Britten, K. (1994). Power spectrum analysis of
bursting cells in area mt in the behaving monkey. J. Neurosci., 14(5):2870{2892.
Barash, S., Bracewell, R., Fogassi, L., Gnadt, J., and Andersen, R. (1991). Saccade-related
activity in the lateral intraparietal area .1. temporal properties - comparison with area
7a. J. Neurophysiol., 66:1095{1108.
Batista, A. and Andersen, R. (2001). The parietal reach region codes the next planned
movement in a sequential reach task. J. Neurophys., 85(2):539{544.
Batista, A., Buneo, C., Snyder, L., and Andersen, R. (1999). Reach plans in eye-centered
coordinates. Science, 285(5425):257{260.
Blatt, G., Andersen, R., and Stoner, G. (1990). Visual receptive-�eld organization and
cortico-cortical connections of the lateral intraparietal area (area lip) in the macaque.
J. Comp. Neurol., 299:421{445.
Bracewell, R., Mazzonni, P., Barash, S., and Andersen, R. (1996). Motor intention activity
in the macaque's lateral intraparietal area .2. changes of motor plan. J. Neurophysiol.,
76:1457{1464.
Bressler, S., Coppola, R., and Nakamura, R. (1993). Episodic multiregional cortical coher-
ence at multiple frequencies during visual task-performance. Nature, 366:153{156.
Pesaran et. al. 31
Brillinger, D. (1975). Time series data analysis and theory. Holt, Rinehart and Winston,
Inc:New York.
Brillinger, D. (1978). Developments in Statistics, volume 1, pages 33{129. Academic Press
Inc.
Bruce, C. and Goldberg, M. (1985). Primate frontal eye �elds. i. single neurons discharging
before saccades. J. Neurophysiol., 53:603{635.
Cacciatore, T., Brodfuehrer, P., Gonzalez, J., Jiang, T., Adams, S., Tsien, R., Kristan, W.,
and Kleinfeld, D. (1999). Identi�cation of neural circuits by imaging coherent electrical
activity with fret-based dyes. Neuron, 23(3):449{459.
Cardoso de Oliveira, S., Thiele, A., and Ho�mann, K. (1997). Synchronization of neuronal
activity during stimulus expectation in a direction discrimination task. J. Neurosci.,
17:9248{9260.
Chafee, M. and Goldman-Rakic, P. (1998). Matching patterns of activity in primate pre-
frontal area 8a and parietal area 7ip neurons during a spatial working memory task. J.
Neurophysiol., 79(6):2919{2940.
Colby, C. and Goldberg, M. (1999). Space and attention in parietal cortex. Ann. Rev.
Neurosci., 22:319{349.
Cox, D. and Lewis, P. (1966). The statistical analysis of series of events. Chapman and
Hall:London.
Daley, D. and Vere-Jones, D. (1988). An introduction to the theory of point processes.
Springer-Verlag:New York.
Donoghue, J., Sanes, J., Hatsopoulos, N., and Gaal, G. (1998). Neural discharge and local
�eld potential oscillations in primate motor cortex during voluntary movements. J.
Neurophysiol., 79(1):159{173.
Pesaran et. al. 32
Duhamel, J., Colby, C., and Goldberg, M. (1992). The updating of the representation of
visual space in parietal cortex by intended eye-movements. Science, 255(5040):90{92.
Eckhorn, R., Bauer, R., Jordan, W., Brosch, M., Kruse, W., Munk, M., and Reitboeck, H.
(1988). Coherent oscillations - a mechanism of feature linking in the visual cortex -
multiple electrode and correlation analyses in the cat. Biol. Cybern., 60(2):121{130.
Eckhorn, R., Frien, A., Bauer, R., Woelbern, T., and Kehr, H. (1993). High-frequency (60-90
hz) oscillations in primary visual-cortex of awake monkey. Neuroreport, 4(3):243{246.
Efron, B. and Tibshirani, T. (1993). An introduction to the bootstrap. Chapman and
Hall:New York.
Engel, A., Konig, P., Gray, C., and Singer, W. (1990). Stimulus-dependent neuronal oscilla-
tions in cat visual-cortex - intercolumnar interaction as determined by cross-correlation
analysis. Eur. J. Neurosci., 2:588{606.
Friedman-Hill, S., Maldonado, P., and Gray, C. (2000). Dynamics of striate cortical activity
in the alert macaque: I incidence and stimulus-dependence of gamma-band neuronal
oscillations. Cerebral Cortex, 10:1105{1116.
Fries, P., Reynolds, J., Rorie, A., and Desimone, R. (2001). Modulation of oscillatory
neuronal synchronization by selective visual attention. Science, 291:1560{1563.
Funahashi, S., Bruce, C., and Goldman-Rakic, P. (1989). Mnemonic coding of visual space
in the monkey's dorsolateral prefrontal cortex. J. Neurophysiol., 61:331{349.
Fuster, J. (1995). Memory in cerebral cortex: An empirical approach to neural networks in
the human and nonhuman brain. MIT Press:Cambridge, MA.
Fuster, J. and Jervey, J. (1982). Neuronal �ring in the inferotemporal cortex of the monkey
in a visual memory task. J. Neurosci., 2(3):361{375.
Gnadt, J. and Andersen, R. (1988). Memory related motor planning activity in posterior
parietal cortex of macaque. Exp. Brain Res., 70:216{220.

Pesaran et. al. 33
Goldman-Rakic, P. (1995). Cellular basis of working memory. Neuron, 14(3):477{485.
Gray, C. and McCormick, D. (1996). Chattering cells: Super�cial pyramidal neurons
contributing to the generation of synchronous oscillations in visual cortex. Science,
274:109{113.
Gray, C. and Singer, W. (1989). Stimulus-speci�c neuronal oscillations in orientation
columns of cat visual cortex. Proc. Natl. Acad. Sci. USA, 86(5):1698{1702.
Hebb, D. (1949). Organization of Behavior. Wiley:New York.
Jarvis, M. and Mitra, P. (2001). Sampling properties of the spectrum and coherency of
sequences action potentials. Neural Comput., 13:717{749.
Koch, K. and Fuster, J. (1989). Unit-activity in monkey parietal cortex related to haptic
perception and temporary memory. Exp. Brain Res., 76(2):292{306.
Kreiter, A. and Singer, W. (1996). Stimulus-dependent synchronization of neuronal re-
sponses in the visual cortex of the awake macaque monkey. J. Neurosci., 16(7):2381{
2396.
Lebedev, M. and Wise, S. (2000). Oscillations in the premotor cortex: single-unit activity
from awake, behaving monkeys. Exp. Brain Res., 130:195{215.
Lorente de No, R. (1938). Physiology of the nervous system, chapter Cerebral cortex archi-
tecture, intracortical connections, motor projections, pages 291{339. Oxford University
Press, Oxford.
Mazzonni, P., Bracewell, R., Barash, S., and Andersen, R. (1996). Motor intention activity
in the macaque's lateral intraparietal area .1. dissociation of motor plan from sensory
memory. J. Neurophysiol., 76:1439{1456.
Miller, E., Erickson, C., and Desimone, R. (1996). Neural mechanisms of visual working
memory in prefrontal cortex of the macaque. J. Neurosci., 16:5154{5167.
Pesaran et. al. 34
Mitra, P., Ogawa, S., Hu, X., and Ugurbil, K. (1997). The nature of spatiotemporal changes
in cerebral hemodynamics as manifested in functional magnetic resonance imaging.
Mag. Res. Med., 37:511{518.
Mitra, P. and Pesaran, B. (1999). Analysis of dynamic brain imaging data. Biophys. J.,
76:691{708.
Mitzdorf, U. (1985). Current source-density method and application in cat cerebral cortex:
investigation of evoked potentials and eeg phenomena. Physiological Rev., 65:37{100.
Miyashita, Y. and Chang, H. (1988). Neuronal correlate of pictorial short-term memory in
the primate temporal cortex. Nature, 331:68{70.
Murthy, V. and Fetz, E. (1996a). Oscillatory activity in sensorimotor cortex of awake
monkeys: Synchronization of local �eld potentials and relation to behavior. J. Neuro-
physiol., 76(6):3949{3967.
Murthy, V. and Fetz, E. (1996b). Synchronization of neurons during local �eld potential
oscillations in sensorimotor cortex of awake monkeys. J. Neurophysiol., 76(6):3968{
3982.
Nakamura, K., Mikami, A., and Kubota, K. (1992). Oscillatory neuronal-activity related
to visual short-term-memory in monkey temporal pole. Neuroreport, 3(1):117{120.
Percival, D. and Walden, A. (1993). Spectral analysis for physical applications. Cambridge
University Press, Cambridge, UK.
Pezaris, J. (2000). Local circuitry in LIP. PhD thesis, California Institute of Technology.
Pezaris, J., Sahani, M., and Andersen, R. (1997a). Extracellular recording from adjacent
neurons: Ii. correlations in macaque parietal cortex. In Soc. Neurosci. Abs., volume 23.
Pezaris, J., Sahani, M., and Andersen, R. (1997b). Tetrodes for monkeys. In Bower, J.,
editor, Computational Neuroscience. Plenum Press:New York.

Pesaran et. al. 35
Pezaris, J., Sahani, M., and Andersen, R. (1999). Response-locked changes in auto- and
cross-covariations in parietal cortex. Neurocomp., 26-27:471{476.
Prechtl, J., Cohen, L., Pesaran, B., Mitra, P., and Kleinfeld, D. (1997). Visual stimuli induce
waves of electrical activity in turtle cortex. Proc. Natl. Acad. Sci. USA, 94(14):7621{
7626.
Rao, C. (1965). Linear Statistical Inference and its Applications. Wiley:New York.
Reece, M. and O'Keefe, J. (1989). The tetrode: An improved technique for multi-unit
extracellular recording. In Soc. Neurosci. Abs., volume 15.
Roelfsema, P., Engel, A., Konig, P., and Singer, W. (1997). Visuomotor integration is asso-
ciated with zero time-lag synchronization among cortical areas. Nature, 385(6612):157{
161.
Rosenberg, J., Amjad, A., Breeze, P., Brillinger, D., and Halliday, D. (1989). The fourier
approach to the indenti�cation of functional coupling between neuronal spike trains.
Prog. Biophys. Molec. Biol., 53:1{31.
Roskies, A. (1999). The binding problem. Neuron, 24:7{9.
Rouguel, A., Bouyer, J., Dedet, L., and Debray, O. (1979). Fast somato-parietal rhythms
during combined focal attention and immobility in baboon and squirrel monkey. Elec-
tro. Clin. Neurophysiol., 46:310{319.
Sahani, M. (1999). Latent variable models for neural data analysis. PhD thesis, California
Institute of Technology.
Sahani, M., Pezaris, J., and Andersen, R. (1998). On the separation of signals from neigh-
boring cells in tetrode recordings. In Jordan, M., Kearns, M., and Solla, S., editors,
Advances in Neural Information Processing Systems 10. MIT Press:Cambridge, MA.
Sanes, J. and Donoghue, J. (1993). Oscillations in local-�eld potentials of the primate motor
cortex during voluntary movement. Proc. Natl. Acad. Sci. USA, 90:4470{4474.

Pesaran et. al. 36
Shadlen, M. and Newsome, W. (1994). Noise, neural codes and cortical organization. Curr.
Opin. Neurobiol., 4:569{579.
Shenoy, K., Kureshi, S., Meeker, D., Gillikin, B., Batista, A., Buneo, C., Cao, S., Burdick,
J., and Andersen, R. (1999). Toward prosthetic systems controlled by parietal cortex.
In Soc. Neurosci. Abs., volume 25.
Singer, W. and Gray, C. (1995). Visual feature integration and the temporal correlation
hypothesis. Ann. Rev. Neurosci., 18:555{586.
Slepian, D. and Pollack, H. (1961). Prolate spheroidal wavefunctions. fourier analysis and
uncertainty i. Bell Sys. Tech. J., 40:43{63.
Snyder, L., Batista, A., and Andersen, R. (1997). Coding of intention in the posterior
parietal cortex. Nature, 386(6621):167{170.
Snyder, L., Batista, A., and Andersen, R. (1999). Saccade-related activity in the parietal
reach region. J Neurophysiol, 83(2):1099{1102.
Tallon-Baudry, C. and Bertrand, O. (1999). Oscillatory gamma activity in humans and its
role in object representation. Trends Cog. Sci., 3(4):151{162.
Tallon-Baudry, C., Bertrand, O., Peronnet, F., and Pernier, J. (1998). Induced gamma-band
activity during the delay of a visual short-term memory task in humans. J. Neurosci.,
18(11):4244{4254.
Tallon-Baudry, C., Kreiter, A., and Bertrand, O. (1999). Sustained and transient oscillatory
responses in the gamma and beta bands in a visual short-term memory task in humans.
Vis. Neurosci., 16(3):449{459.
Thomson, D. (1982). Spectrum estimation and harmonic analysis. Proc. IEEE, 70:1055{
1096.
Thomson, D. (1994). Projection �lters for data analysis. In Proc. Seventh IEEE SP Work.
Stat. Sig. and Array Proc., pages 39{42, Quebec, Canada.
Pesaran et. al. 37
Thomson, D. J. and Chave, A. D. (1991). Advances in Spectrum Analysis and Array Pro-
cessing, volume 1, pages 58{113. Prentice Hall.
Ueda, N. and Nakano, R. (1994). Mixture density estimation via em algorithm with deter-
ministic annealing. Proc. IEEE: Neural networks and signal processing, 69:69{77.
Walden, A. (2000). A uni�ed view of multitaper multivariate spectral estimation.
Biometrika, 87(4):767{788.
Zhou, Y. and Fuster, J. (1996). Mnemonic neuronal activity in somatosensory cortex. Proc.
Natl. Acad. Sci. USA, 93(19):10533{10537.

Pesaran et. al. 38
Figure Captions
Figure 1. The memory-saccade task The monkey performs a memory-saccade to one
of eight saccade directions. a) The trial begins with the illumination of a �xation light at
the center of the screen. The monkey saccades to the �xation light and maintains �xation
for one second, which determines the baseline period. b) A location is then cued at one of
eight points by a ash of light for 100ms and extinguished. c) The monkey must maintain
�xation for a further second at which point d) the �xation light is extinguished and the
monkey performs a saccade to the remembered location cue. When the saccade is completed
and the monkeys eye position is within 2Æ of the target, e) it reilluminates and the monkey
is rewarded with a drop of juice. A small corrective saccade follows the reillumination of the
location cue. There is a short (2{3 s) intertrial interval before the �xation light reilluminates
signalling the start of a new trial.
Figure 2. Extracellular potential a) One channel of broad-band (1 Hz {10 kHz) tetrode
data sampled at 20 kHz shown for a memory-saccade trial during a saccade to the preferred
direction. The polarity of the potential is reversed. b) The data in panel a) viewed on an
expanded time base during working memory from 0.6{1.1 s.
Figure 3. Spike and LFP mean responses Line and 2D plots showing the mean
response of spike and LFP activity averaged across saccades in each direction.
a) Upper panel: Line plots of spike mean response in preferred (solid) and anti-preferred
(dashed) directions. Lower panel: 2D plot of the PSTH averaged across trials aligned to
the initial target onset as a function of cue direction. b) Upper panel: Line plot of the LFP
mean response in the preferred (solid) and anti-preferred (dashed) directions. Lower panel:
2D plot of the LFP mean response averaged across trials aligned to the initial target onset
as a function of cue direction. Time is on the x axis and for 2D plots, direction is on the y
axis aligned to the preferred direction at 0 deg.
Figure 4. Spike spectrum single cell Line plots showing the spectrum of spike activity

Pesaran et. al. 39
for a single cell averaged during baseline and working memory.
a) Line plot of the spectrum during the baseline period (solid) with 95% error bars (dashed)
estimated with a jackknife across tapers and trials. The high-frequency limit is shown by
the dotted line. b) Line plot of the spectrum during working memory. Three features are
indicated: 1) The value of the spectrum at low frequencies S0; 2) the value at the peak in
the gamma band S and 3) the mean �ring rate, �. These measures are combined to give
a measure of the spectral shape in the gamma band, ÆS (see main text).
Figure 5. Spike spectrum population data A comparison of spectral structure in
spike activity during baseline and working memory across a population of recordings.
Central panel: Boxplots showing the spectral shape for spike activity, ÆS, during working
memory in the preferred direction compared to the baseline, pooled across a population
of recordings from both monkeys. ÆS is unimodal and the distributions are skew so the
median is used as a measure of central tendency, shown at center of the boxplot for each
condition. Robust 95% con�dence intervals for this estimate are shown by the extent of the
notch.
Side panels: Line plots showing the rate-normalized spectrum out to 200 Hz during baseline
(left) and working memory (right). Individual plots of spectra in the upper, median and
lower quartiles are shown, as well as the population average spectrum for baseline and
working memory activity. Arrows indicate the approximate loation of each spectrum in the
distribution. The high-frequency limit is shown by dotted, horizontal line at 1.
Figure 6. Spike spectrograms 2D plots showing the spectrum of spike activity in the
preferred direction with and without rate normalization for a single cell and a population
average across both monkeys.
a) Upper panel: 2D plot of the spectrogram for a single cell. Lower panel: 2D plot of
the spectrogram for a single cell normalized by the rate. b) Upper panel: 2D plot of the
Pesaran et. al. 40
population average spectrogram. Lower panel: 2D plot of the population average spectro-
gram normalized by the rate. Time is on the x axis, frequency on the y axis and power is
color-coded on a linear scale.
Figure 7. Interval properties of spike activity
Characterization of the interval properties of spike activity from a sample cell.
a) The ISI histogram during the baseline. b) The ISI histogram during working memory. c)
The interval spectrum for memory activity (solid) with 95% con�dence intervals (dashed).
The dotted horizontal line shows the spectrum of a renewal process for comparison.
Figure 8. LFP spectrum single site Line plots showing the spectrum of LFP activity
averaged during baseline and working memory.
a) Line plot of the spectrum during baseline (dashed) and working memory (solid) on a
log scale at a single site. The bar indicates the extent of 95% error bars for the spectrum
estimated with a jackknife across tapers and trials. b) Line plot of the ratio of LFP spectrum
during working memory and baseline on a linear scale at a single site. Arrows highlight the
power at low frequency (0{10 Hz) and in the gamma band (25{90 Hz).
Figure 9. LFP spectrum population data Comparison of changes in relative power
between baseline and memory activity in the LFP across a population of recordings.
a) LFP spectrum averaged across a population of sites recorded in 2 monkeys Average
spectrum during baseline with 95% con�dence intervals. b) Average LFP spectrum during
working memory in the preferred direction with 95% con�dence intervals. c) The left panel
shows boxplots showing low frequency (0{10 Hz) and gamma band (25{90 Hz) power in the
LFP during working memory in the preferred direction relative to baseline pooled across a
population of recordings from both monkeys. The right panel shows line plots of the ratio of
power during working memory to baseline against frequency out to 200 Hz. Plots of spectra
in the upper, median and lower quartiles are shown and asterisks mark their approximate

Pesaran et. al. 41
position on the boxplot. The center of the notch marks the median and the extent of the
notch gives con�dence intervals for this estimate.
Figure 10. Tuning of spiking and LFP activity Boxplots showing the tuning of
spectral measures of spiking and LFP activity during the memory period relative to the
baseline pooled across a population of recordings in both monkeys.
a) Tuning curve with boxplots showing mean �ring rate across the population. b) Tuning
curve with boxplots showing relative power in the gamma band (25{90 Hz) across the
population. c) Tuning curve with boxplots of spike spectral shape, ÆS, across the population.
d) Tuning curve with boxplots showing relative power at low frequency (0{10 Hz) across
the population.
Figure 11. LFP spectrograms Spectrograms of LFP activity averaged across trials
during saccades to either the preferred or anti-preferred direction.
a) 2D plot of the spectrogram in the preferred direction at a single site. b) 2D plot of the
spectrogram in the anti-preferred direction at a single site. c) 2D plot of the spectrogram
in the preferred direction averaged across a population of recordings from both monkeys.
d) 2D plot of the spectrogram in the anti-preferred direction averaged across a population
of recordings from both monkeys. In each panel, time is on the x axis, frequency is on the
y axis and power is color-coded on a log scale.
Figure 12. LFP power in gamma and beta frequency bands Power in the LFP in
the gamma (25{90 Hz) and beta (15{25 Hz) frequency bands during trials with saccades to
the preferred directions. Power in each frequency band is normalized by the level during
baseline.
a) Gamma band (solid) and beta band (dashed) activity from a single site. b) Population
average gamma band (solid) and beta band (dashed) activity from two monkeys.
Figure 13. Spike-triggered potential Spike-triggered average potential for activity
Pesaran et. al. 42
from a single cell at a single site during baseline and working memory for saccades to the
preferred direction.
a) Spike-triggered average potential during the baseline. b) Spike-triggered average potential
during working memory.
Figure 14. Spike-�eld coherence single site Coherency between spiking and LFP
activity at a single site.
a) Line plot of spike-�eld coherence during the baseline. b) Line plot of spike-�eld coherence
during working memory. Dashed lines show 99% con�dence intervals.
Figure 15. Spike-�eld coherence population data Comparison of spike-�eld coher-
ence during baseline and working memory across a population of recordings in two monkeys.
Central panel: Boxplots showing spike-�eld coherence during working memory in the pre-
ferred direction compared to the baseline pooled across a population of recordings from
both monkeys.
Side panels: Line plots showing spike-�eld coherence out to 200 Hz during baseline (left)
and working memory (right). Individual plots of coherence in the upper, median and lower
quartiles are shown and asterisks mark their approximate position on the boxplot.
Figure 16. Spike-�eld time-frequency coherency Coherency of spiking and LFP
activity across time.
a) Coherency at a single site in the preferred direction. b) Coherency in the population
average in the preferred direction. Time is on the x axis and frequency on the y axis. The
coherence is color-coded on a linear scale. Arrows denote the phase where the coherence is
signi�cant (p < 0:01).
Figure 17. Phase histogram The distribution of the phase of the gamma band (25{90
Hz) activity in the LFP at spike times for all cells in the data set during saccades to their

Pesaran et. al. 43
preferred direction. Working memory (solid) and baseline (dashed) period distributions are
compared.

Figure 1
Cue Fixation
Saccade
CA EB D
44
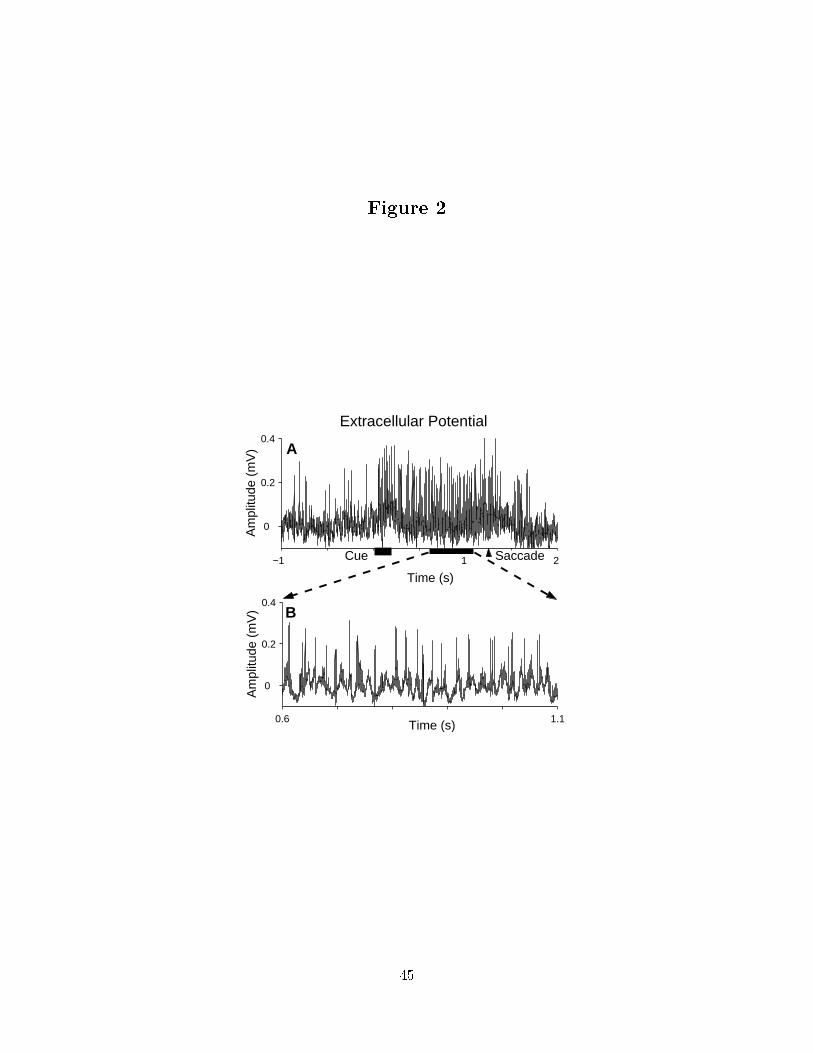
Figure 2
−1 1 2
0.4
0.2
0 Am
plitu
de (
mV
)
Time (s)
0.6 1.1
0.4
0.2
0
Am
plitu
de (
mV
)
Time (s)
Extracellular Potential
Cue Saccade
B
A
45
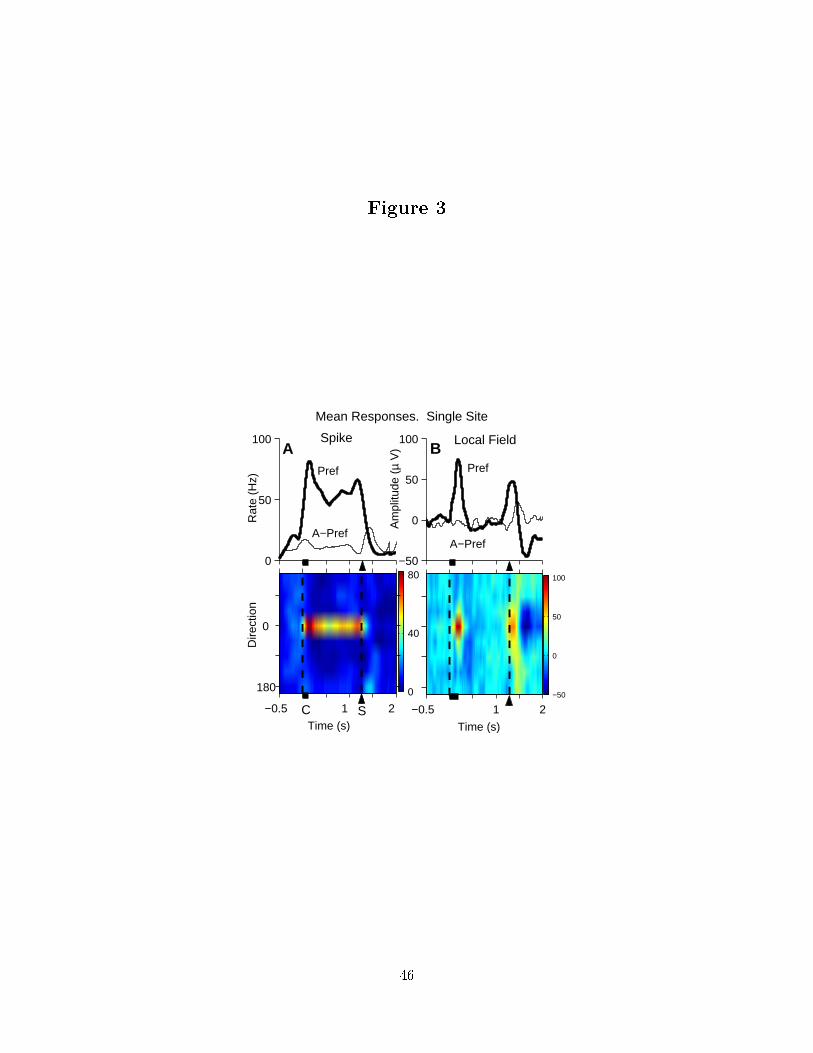
Figure 3
0
40
80
Time (s)
Dire
ctio
n
−0.5 1 2
0
50
100
Rat
e (H
z)
Spike
−50
0
50
100
Am
plitu
de (
µ V
)
Local Field
Time (s)
−0.5 1 2−50
0
50
100
A Pref Pref
A−Pref A−Pref
S
0
180
C
B
Mean Responses. Single Site
46
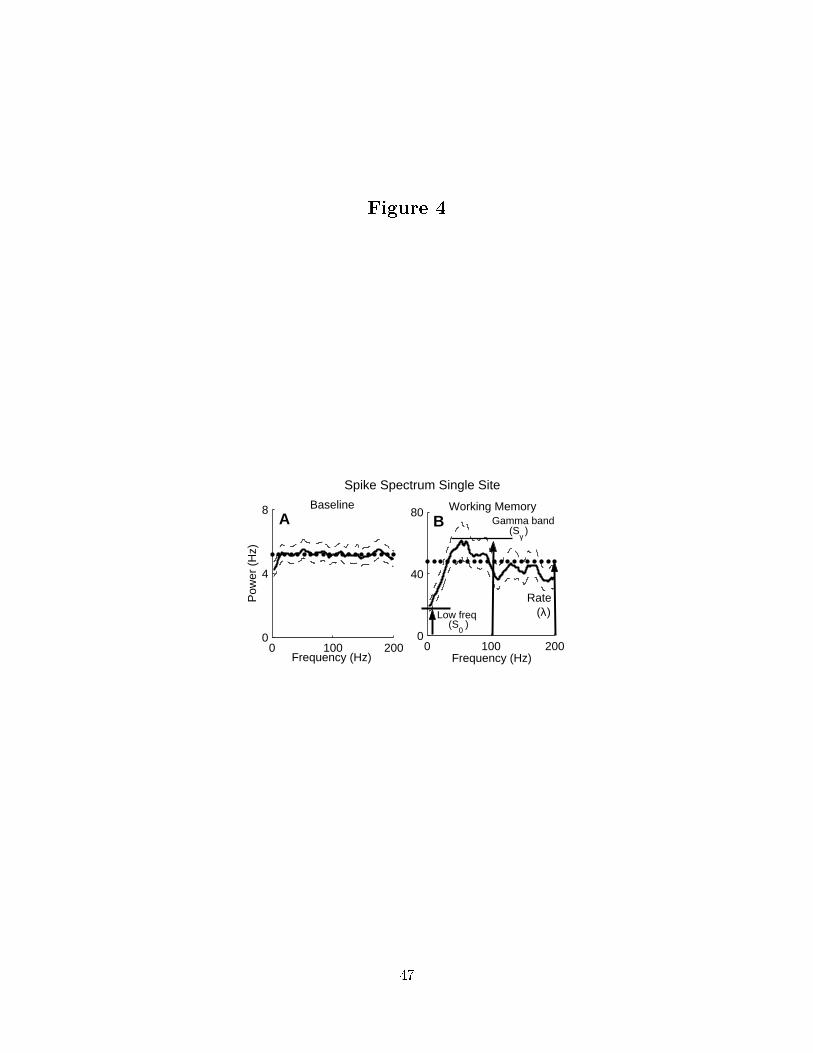
Figure 4
0 100 2000
4
8
Pow
er (
Hz)
Baseline
Frequency (Hz)0 100 200
0
40
80
Frequency (Hz)
Working MemoryA Gamma band
(Sγ )
Spike Spectrum Single Site
Low freq (S
0 )
Rate (λ)
B
47

Figure 5
0 100 2000
1.5
Frequency (Hz)
0 100 2000
0.5
1
1.5
Rel
ativ
e P
ower
0
0.5
1
1.5
Nor
mal
ized
Pow
er
Baseline
0
0.5
1
1.5Working Memory
Population Average
Baseline
Spectral Shape
WorkingMemory
Lower Quartile
A
Population Average
B
0.5
0 Median
Upper Quartile
Frequency (Hz)
Upper Quartile
Median
Lower Quartile
Spike Spectrum. Population Data
48
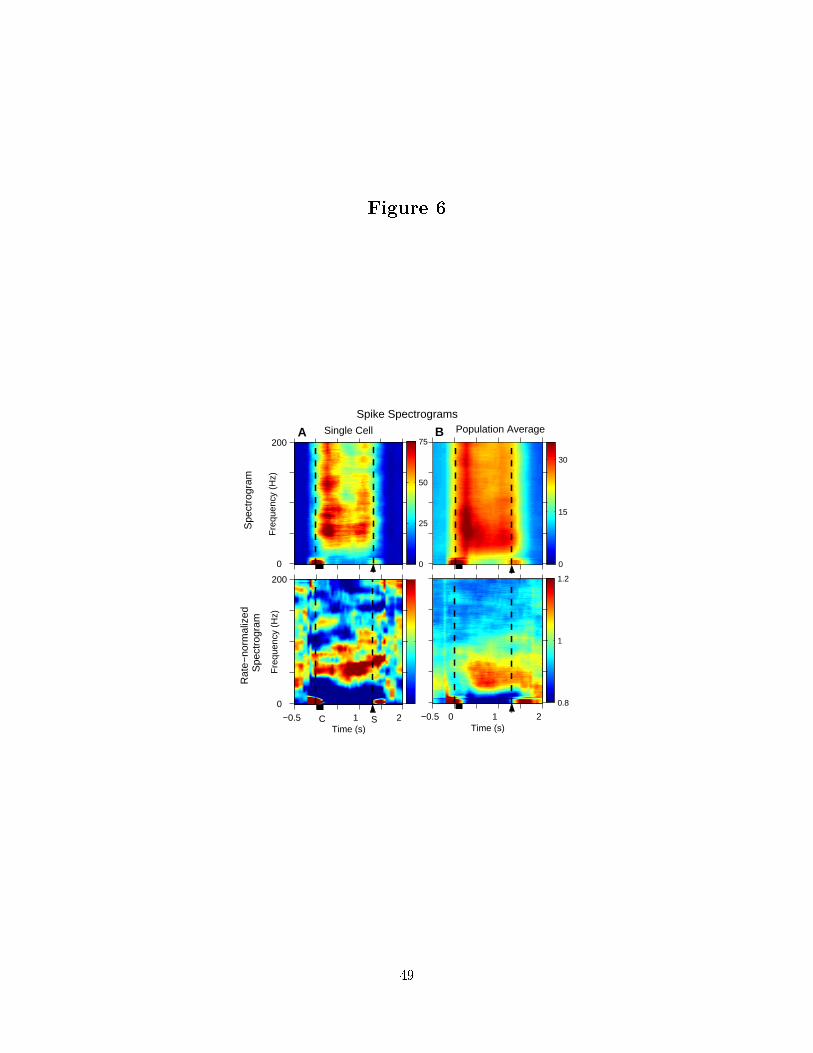
Figure 6
0
25
50
75
Fre
quen
cy (
Hz)
Single Cell200
0
Fre
quen
cy (
Hz)
Time (s)−0.5 1 2
200
0
0
15
30
Population Average
0.8
1
1.2
Time (s)−0.5 0 1 2
Spike Spectrograms
Spe
ctro
gram
Rat
e−no
rmal
ized
Spe
ctro
gram
A B
C S
49

Figure 7
0 50 1000
0.05
0.1
Interval (ms)
Pro
babi
lity
ISIH Baseline
0 50 100Interval (ms)
ISIH Working Memory
0 0.25 0.517.5
18
18.5
19
19.5Interval spectrum
Log
Pow
er
(arb
uni
ts)
Inverse Lag
A B C
50

Figure 8
0 1000
1
Frequency (Hz)
Rel
ativ
e P
ower
Ratio of Working MemorySpectrum to Baseline
0 10010
3
104
105
Log
Pow
er (µ
V2 /H
z)
Single Site
Frequency (Hz)
Gamma band
B
WorkingMemory
Baseline
A
LFP Spectrum
Low freq.
51

Figure 9
0
0.5
1
1.5
2
2.5
Rel
ativ
e P
ower
0 100 2000
1
2
Ratio of LFP Spectrum duringWorking Memory to Baseline
0 100 20010
4
105
106
Baseline
Frequency (Hz)
Pow
er (µ
V2 /H
z)
0 100 20010
4
105
106
Working Memory
Frequency (Hz)
Upper Quartile
A
Rel
ativ
e P
ower
Low freq Gamma Frequency (Hz)
Lower Quartile
Median
Population Average
Population Average
LFP Spectrum Population Data
B
C
52
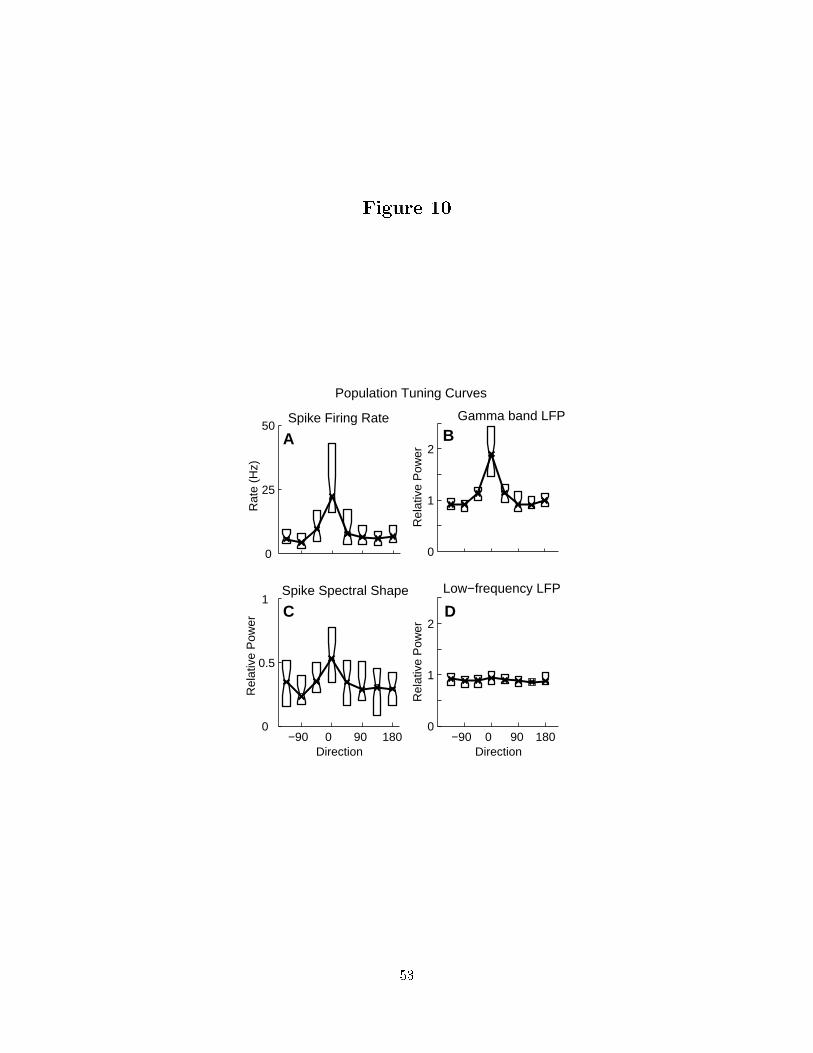
Figure 10
0
25
50
Rat
e (H
z)
Spike Firing Rate
−90 0 90 1800
0.5
1
Rel
ativ
e P
ower
Direction
Spike Spectral Shape
Population Tuning Curves
−90 0 90 1800
1
2
Low−frequency LFP
Direction
Rel
ativ
e P
ower
0
1
2
R
elat
ive
Pow
erGamma band LFP
A B
C D
53

Figure 11F
requ
ency
(H
z)
Preferred200
150
100
50
0
Fre
quen
cy (
Hz)
Time (s)−0.5 1 2
200
150
100
50
0
Anti−preferred
1e4
1e5
Time (s) 1 2
LFP Spectrograms
A
Pop
ulat
ion
Ave
rage
Sin
gle
Site
C S 0
B
C D
54

Figure 12
−0.5 2 0
1
2
3
Rel
ativ
e P
ower
Single Site
−0.5 2 0
1
2
3 Population Average
Time (s)
Gamma and Beta band power
Gamma
Beta
Gamma
Beta
Time (s)
B
SCC S
A
55

Figure 13
−100 −50 0 50 100
20
10
0
−10
−20
Am
plitu
de (
µ V
)
−100 −50 0 50 100
20
10
0
−10
−20
Am
plitu
de (
µ V
)
Time (ms)
Spike−triggered Average Potential
Baseline
WorkingMemory
A
B
56

Figure 14
0 100 2000
0.5
Coh
eren
ce
Baseline
Frequency (Hz)0 100 200
0
0.25
0.5
Frequency (Hz)
Working Memory
Gamma band (25−90 Hz)
A B
Spike−Field Coherence Single Site
57
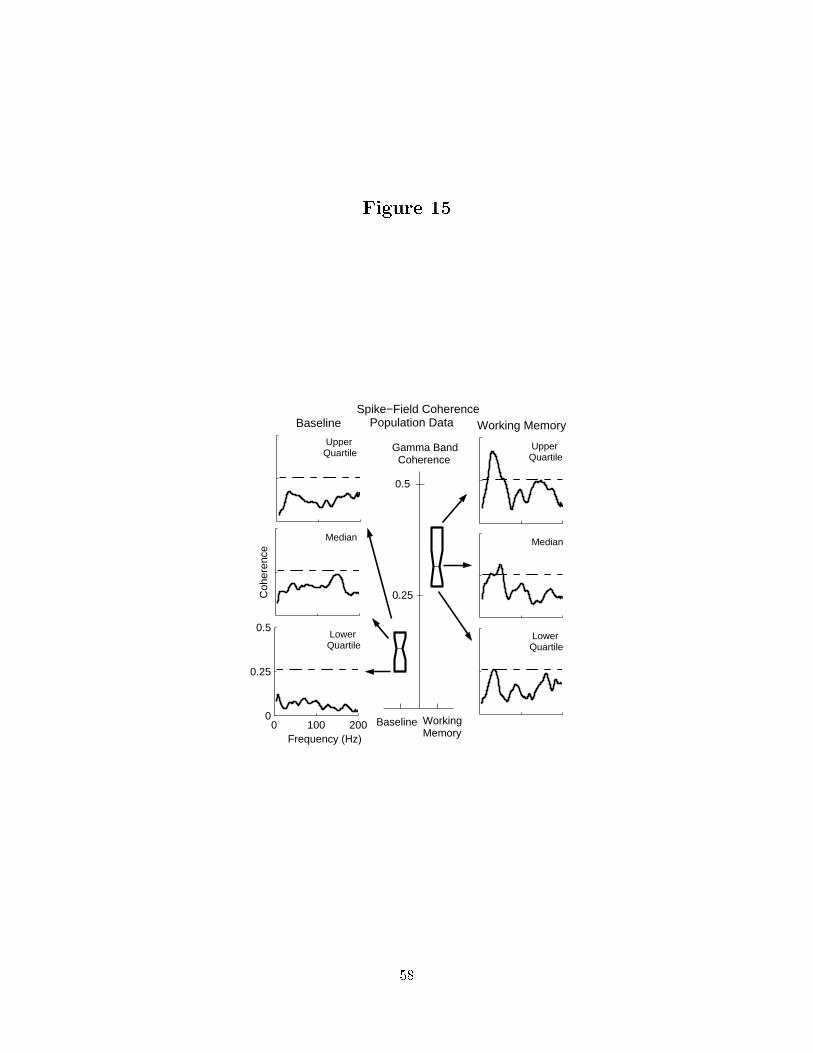
Figure 15
Baseline
Coh
eren
ce
0 100 2000
0.25
0.5
Working MemorySpike−Field Coherence
Population Data
0.5
Frequency (Hz)
Upper Quartile Gamma Band
Coherence
0.25
Baseline WorkingMemory
Lower Quartile
Median
Upper Quartile
Median
Lower Quartile
58

Figure 16
0
0.25
0.5
0
50
100
Fre
quen
cy (
Hz)
Single Site
0
0.1
0.22
−0.5 0.5 1 2 0
50
100
Time (s)
Fre
quen
cy (
Hz)
Population Average
Spike−field CoherencyA
C S
B
59
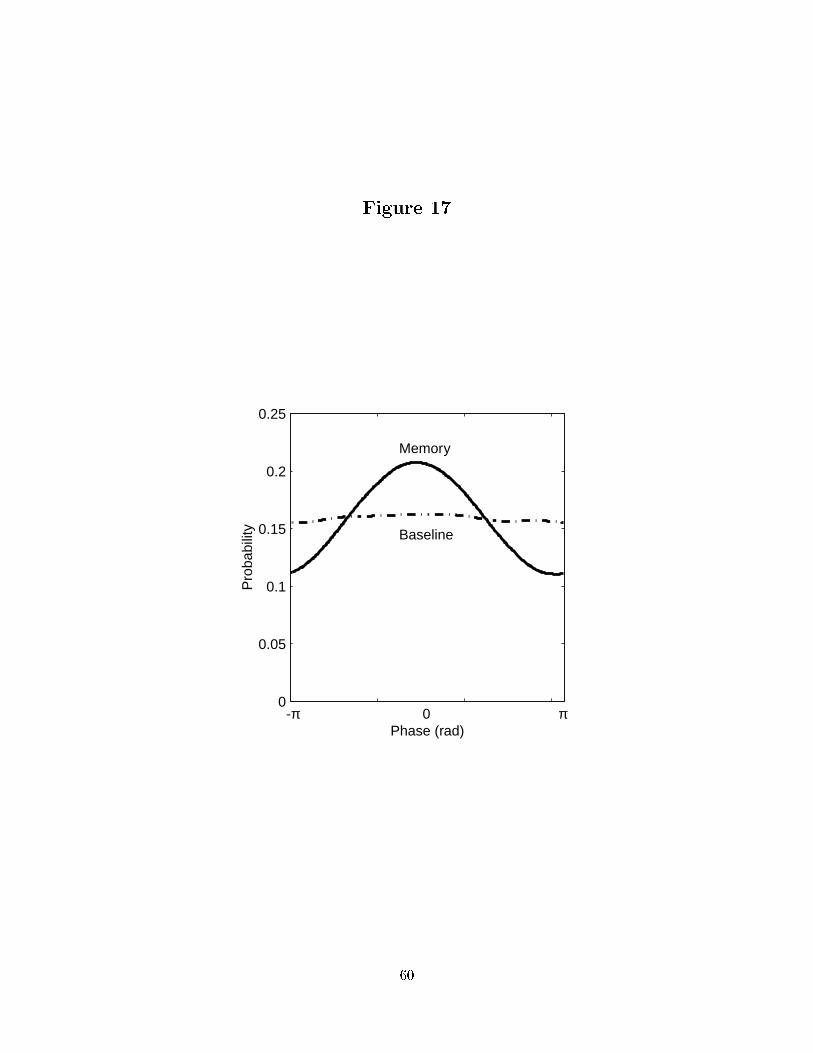
Figure 17
-π 0 π0
0.05
0.1
0.15
0.2
0.25
Phase (rad)
Memory
Baseline
Pro
babi
lity
60
![arxiv.org · arXiv:0906.0184v1 [math-ph] 31 May 2009 Geometry of the Motion Ideal Fluids and Rigid Bo dies S. G. Ra jeev ∗ June 1, 2009 Departmen t of Ph ysics and Astronom y Departmen](https://img.pdfslide.us/doc/110x75/603fe85cebfa4c4b5c2e33f9/arxivorg-arxiv09060184v1-math-ph-31-may-2009-geometry-of-the-motion-ideal-fluids.jpg)


![arXiv:0704.3702v1 [cond-mat.stat-mech] 27 Apr 2007medicinaycomplejidad.org/pdf/redes/mecestred.pdf · 2013. 3. 24. · 2007, at F acult y of Ph ysics, Astronom y and Applied Computer](https://img.pdfslide.us/doc/110x75/61033bafa613c542396746a0/arxiv07043702v1-cond-matstat-mech-27-apr-2007-2013-3-24-2007-at-f-acult.jpg)