Embed Size (px)
Citation preview
P-ERK
Total ERK
Mel888CHL1 WM793
0 10 50 0 10 50 0 10 50 BRAFi(nmol/L)
Supplemental Figure 2: Other surface molecules unaffected
ns
PD-L1
ns
MCSP
DMSO
BRAFi
Supplemental Figure 1: Validation of MAPK pathway inhibition
ns
HLA-DR
*
HLA A,B,C
MFI
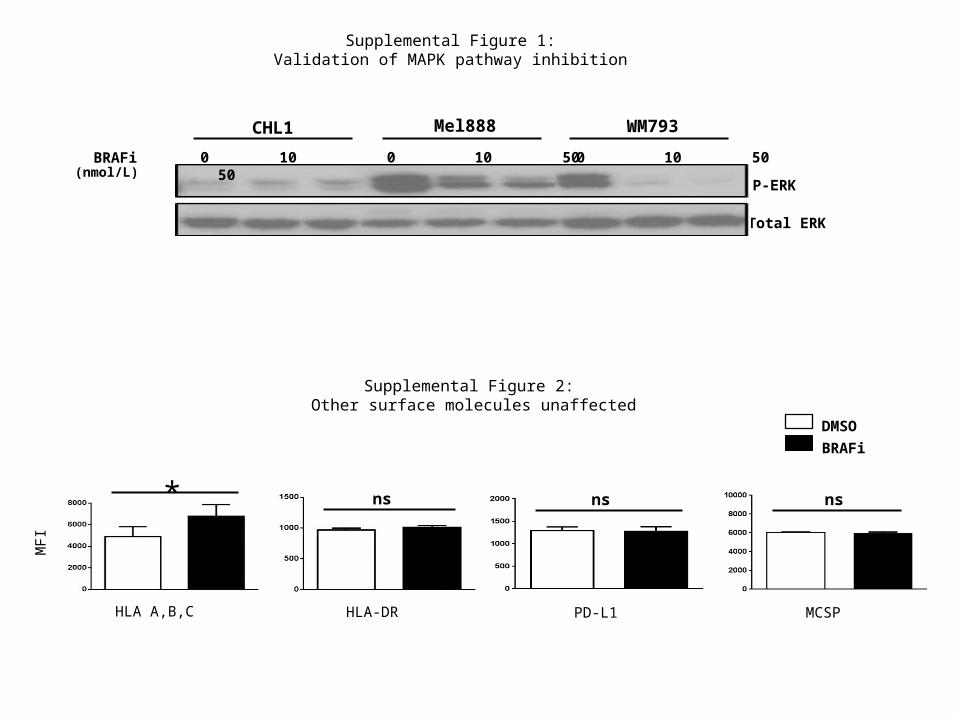
Total ERK
P-ERK
WT BRAFi
DTail0 10 50
0 10 50 0 10 50
0 10 50(nmol/L)
Y320A
Supplemental Figure 3. Phospho-ERK expression levels following inhibition treatment
Transduced Mel888 cells
S335A BRAFi(nmol/L)
P-ERK
Total ERK
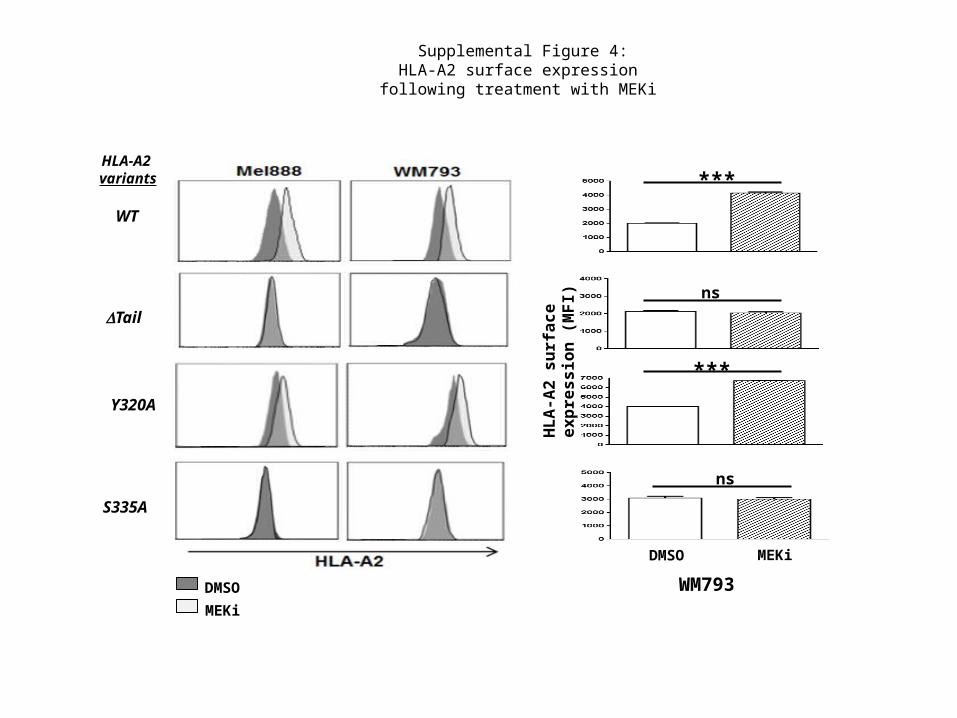
***
***
ns
ns
HL
A-A
2 s
urf
ac
e e
xp
res
sio
n
(MF
I)
Supplemental Figure 4:HLA-A2 surface expression
following treatment with MEKi
HLA-A2 variants
DTail
WT
S335A
Y320A
DMSO
MEKi
DMSO MEKi
WM793
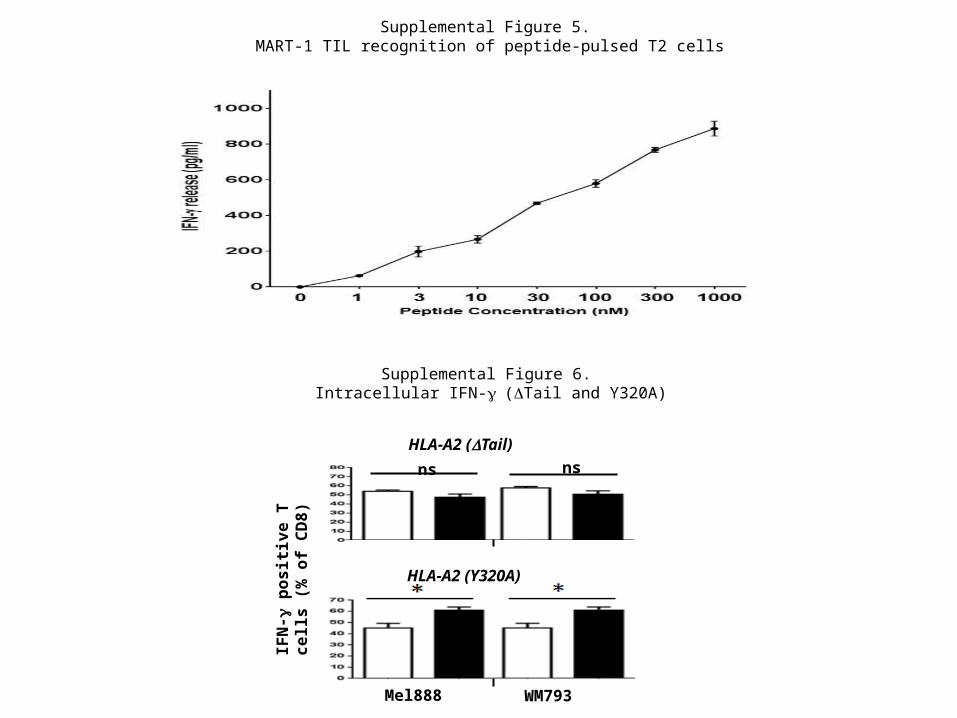
Supplemental Figure 6. Intracellular IFN- g (DTail and Y320A)
IFN
-g p
os
itiv
e T
ce
lls
(%
o
f C
D8
)
HLA-A2 (DTail)
HLA-A2 (Y320A)
Mel888 WM793
Supplemental Figure 5. MART-1 TIL recognition of peptide-pulsed T2 cells
ns ns
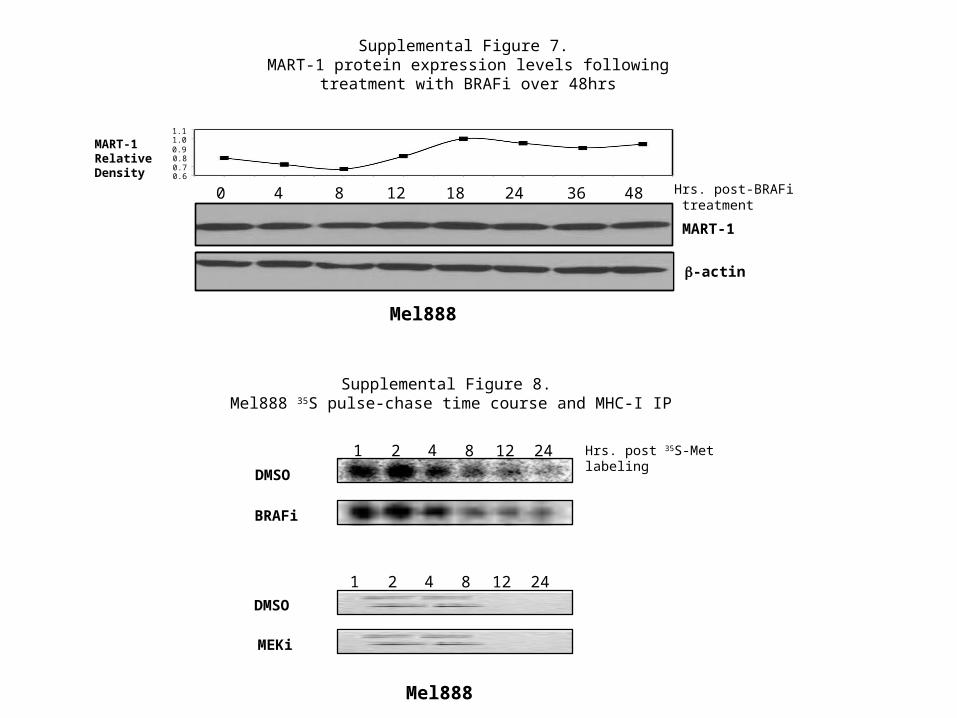
0 4 8 12 48362418
MART-1
b-actin
Supplemental Figure 7. MART-1 protein expression levels following treatment with
BRAFi over 48hrs
Mel888
Hrs. post-BRAFi treatment
Supplemental Figure 8. Mel888 35S pulse-chase time course and MHC-I IP
BRAFi
DMSO
MEKi
DMSO
1 242 4 128 Hrs. post 35S-Met labeling
Mel888
1 242 4 128
0.70.6
0.80.91.01.1
MART-1Relative Density


![Feliks Aret and Erk Reimnitz]](https://img.pdfslide.us/doc/110x75/6250121c52ec7931240ea117/feliks-aret-and-erk-reimnitz.jpg)