Embed Size (px)
Citation preview
P and T Wave Detection inElectrocardiogram (ECG) Signals
Chao Lin
Seminar SC, June 2011
1 / 53P and T Wave Detection in Electrocardiogram (ECG) Signals
N
Outline
1 Context
2 Literature review
3 The proposed Bayesian methodProblem formulationBayesian modelBlock Gibbs samplerSimulation results
4 Application: TWA detection
5 Conclusion and future works
6 Appendix
2 / 53P and T Wave Detection in Electrocardiogram (ECG) Signals
N
Context
Outline
1 Context
2 Literature review
3 The proposed Bayesian methodProblem formulationBayesian modelBlock Gibbs samplerSimulation results
4 Application: TWA detection
5 Conclusion and future works
6 Appendix
3 / 53P and T Wave Detection in Electrocardiogram (ECG) Signals
N
Context
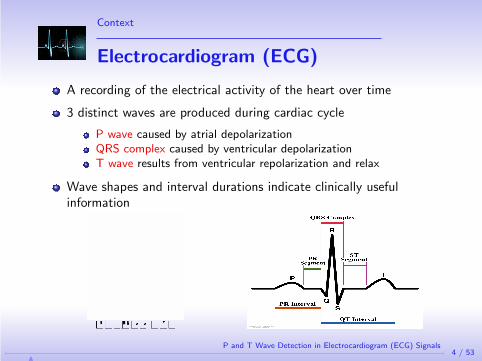
Electrocardiogram (ECG)
A recording of the electrical activity of the heart over time
3 distinct waves are produced during cardiac cycle
P wave caused by atrial depolarizationQRS complex caused by ventricular depolarizationT wave results from ventricular repolarization and relax
Wave shapes and interval durations indicate clinically usefulinformation
4 / 53P and T Wave Detection in Electrocardiogram (ECG) Signals
N
Context
ECG delineation
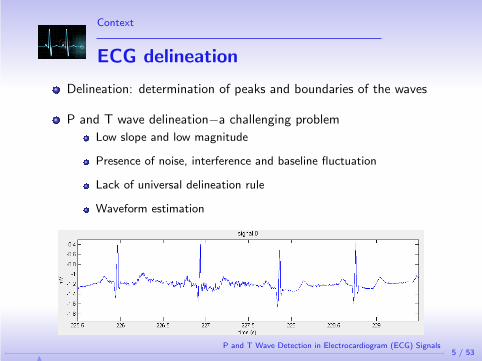
Delineation: determination of peaks and boundaries of the waves
P and T wave delineation−a challenging problem
Low slope and low magnitude
Presence of noise, interference and baseline fluctuation
Lack of universal delineation rule
Waveform estimation
5 / 53P and T Wave Detection in Electrocardiogram (ECG) Signals
N
Literature review
Outline
1 Context
2 Literature review
3 The proposed Bayesian methodProblem formulationBayesian modelBlock Gibbs samplerSimulation results
4 Application: TWA detection
5 Conclusion and future works
6 Appendix
6 / 53P and T Wave Detection in Electrocardiogram (ECG) Signals
N
Literature review
Existing methods
Filtering techniques: nested median filtering, adaptive filtering,low-pass differentiation (LPD)
7 / 53P and T Wave Detection in Electrocardiogram (ECG) Signals
N
Literature review
Existing methods
Filtering techniques: nested median filtering, adaptive filtering,low-pass differentiation (LPD)
Basis expansions: Fourier transform, discrete cosine transform,wavelet transform (WT)
7 / 53P and T Wave Detection in Electrocardiogram (ECG) Signals
N
Literature review
Existing methods
Filtering techniques: nested median filtering, adaptive filtering,low-pass differentiation (LPD)
Basis expansions: Fourier transform, discrete cosine transform,wavelet transform (WT)
Classification and pattern recognition: fuzzy theory, hidden Markovmodels, pattern grammar
Bayesian inference: extended Kalman filter
7 / 53P and T Wave Detection in Electrocardiogram (ECG) Signals
N
Literature review
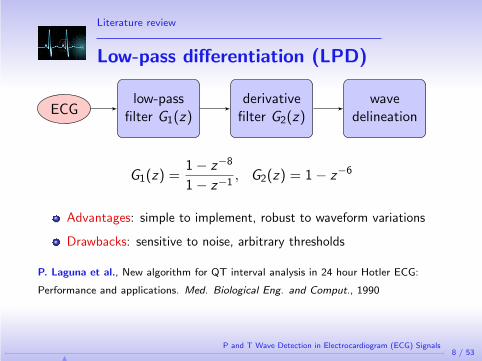
Low-pass differentiation (LPD)
low-passfilter G1(z)ECG
derivativefilter G2(z)
wavedelineation
G1(z) =1 − z−8
1 − z−1, G2(z) = 1 − z−6
Advantages: simple to implement, robust to waveform variations
Drawbacks: sensitive to noise, arbitrary thresholds
P. Laguna et al., New algorithm for QT interval analysis in 24 hour Hotler ECG:
Performance and applications. Med. Biological Eng. and Comput., 1990
8 / 53P and T Wave Detection in Electrocardiogram (ECG) Signals
N
Literature review
Low-pass differentiation (LPD)
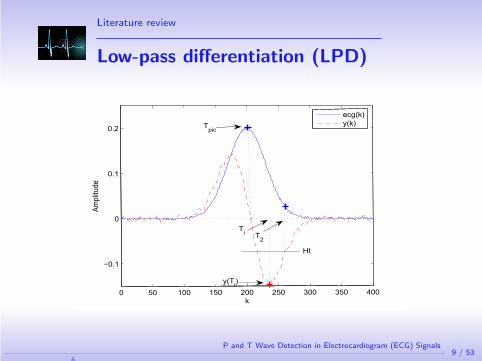
0 50 100 150 200 250 300 350 400
−0.1
0
0.1
0.2
k
Amplitude
ecg(k)
y(k)Tpic
Ti
T2
Ht
y(Ti)
9 / 53P and T Wave Detection in Electrocardiogram (ECG) Signals
N
Literature review
Low-pass differentiation (LPD)
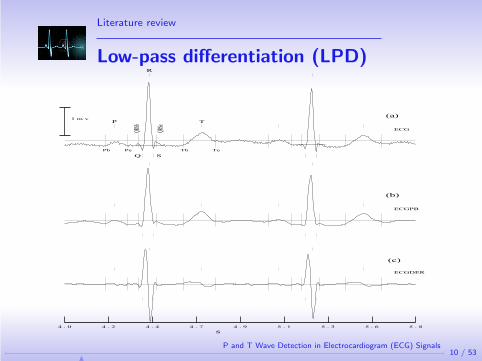
s 4 . 0 4 . 2 4 . 4 4 . 7 4 . 9 5 . 1 5 . 3 5 . 6 5 . 8
ECGDER
(c)
(b)
ECGPB
(a)
ECG
1 m v
R
Pb
P
Pe
QRSb
Q SQRSe
Tb
T
Te
10 / 53P and T Wave Detection in Electrocardiogram (ECG) Signals
N
Literature review
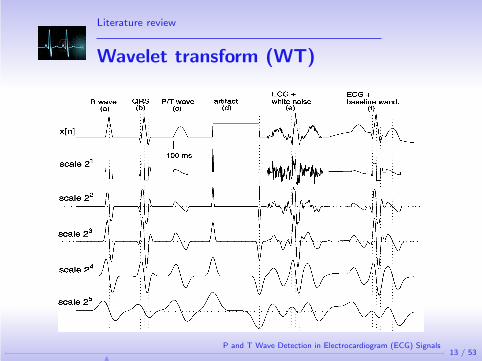
Wavelet transform (WT)
preprocessingECGwavelet
transform
wavedelineation
WT of a signal x (t):
Wax(b) =1√a
∫ +∞
−∞
x (t)ψ
(t − b
a
)dt, a > 0
Discretization of the dilatation factor a = 2k and the translationparameter b = 2k l to form a discrete wavelet transform (DWT):
ψk,l(t) = 2−k/2ψ(2−kt − l), k , l ∈ Z+
11 / 53P and T Wave Detection in Electrocardiogram (ECG) Signals
N
Literature review
Wavelet transform (WT)
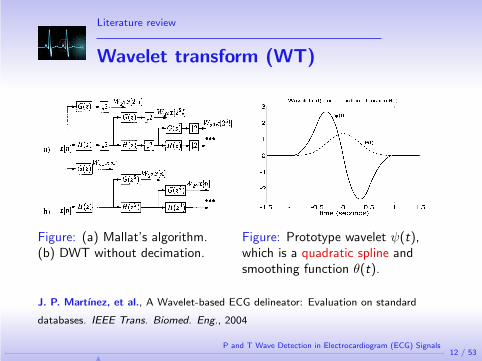
Figure: (a) Mallat’s algorithm.(b) DWT without decimation.
Figure: Prototype wavelet ψ(t),which is a quadratic spline andsmoothing function θ(t).
J. P. Martınez, et al., A Wavelet-based ECG delineator: Evaluation on standard
databases. IEEE Trans. Biomed. Eng., 2004
12 / 53P and T Wave Detection in Electrocardiogram (ECG) Signals
N
Literature review
Wavelet transform (WT)
13 / 53P and T Wave Detection in Electrocardiogram (ECG) Signals
N
Literature review
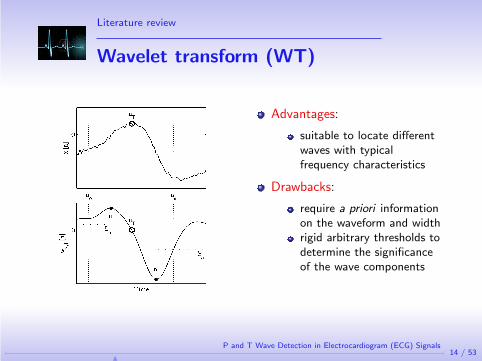
Wavelet transform (WT)
Advantages:
suitable to locate differentwaves with typicalfrequency characteristics
Drawbacks:
require a priori informationon the waveform and widthrigid arbitrary thresholds todetermine the significanceof the wave components
14 / 53P and T Wave Detection in Electrocardiogram (ECG) Signals
N
Literature review
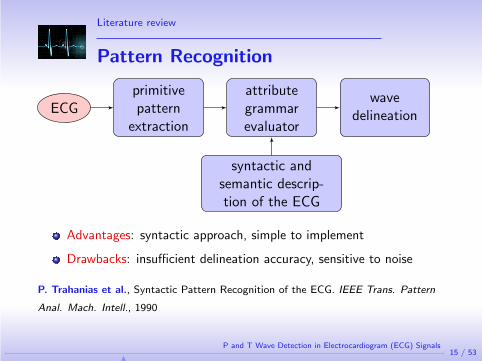
Pattern Recognition
primitivepattern
extractionECG
attributegrammarevaluator
syntactic andsemantic descrip-tion of the ECG
wavedelineation
Advantages: syntactic approach, simple to implement
Drawbacks: insufficient delineation accuracy, sensitive to noise
P. Trahanias et al., Syntactic Pattern Recognition of the ECG. IEEE Trans. Pattern
Anal. Mach. Intell., 1990
15 / 53P and T Wave Detection in Electrocardiogram (ECG) Signals
N
Literature review
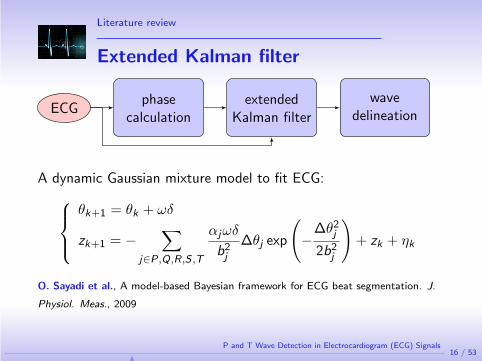
Extended Kalman filter
phasecalculation
ECGextended
Kalman filter
wavedelineation
A dynamic Gaussian mixture model to fit ECG:
θk+1 = θk + ωδ
zk+1 = −∑
j∈P,Q,R,S ,T
αjωδ
b2j
∆θj exp
(−
∆θ2j
2b2j
)+ zk + ηk
O. Sayadi et al., A model-based Bayesian framework for ECG beat segmentation. J.
Physiol. Meas., 2009
16 / 53P and T Wave Detection in Electrocardiogram (ECG) Signals
N
Literature review
Extended Kalman filter
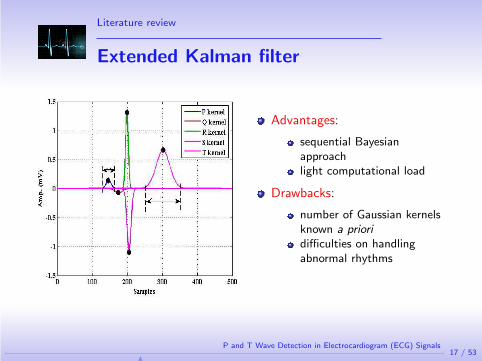
Advantages:
sequential Bayesianapproachlight computational load
Drawbacks:
number of Gaussian kernelsknown a priori
difficulties on handlingabnormal rhythms
17 / 53P and T Wave Detection in Electrocardiogram (ECG) Signals
N
The proposed Bayesian method
Outline
1 Context
2 Literature review
3 The proposed Bayesian methodProblem formulationBayesian modelBlock Gibbs samplerSimulation results
4 Application: TWA detection
5 Conclusion and future works
6 Appendix
18 / 53P and T Wave Detection in Electrocardiogram (ECG) Signals
N
The proposed Bayesian method
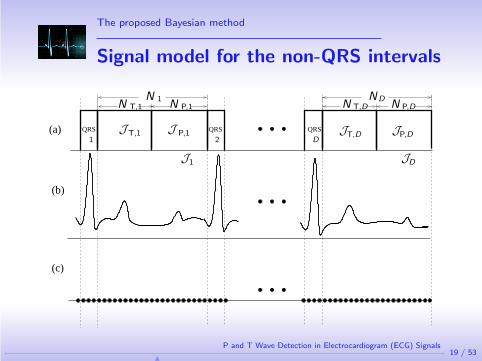
Signal model for the non-QRS intervals
(c)
(b)
(a) QRS QRS QRS
N NNNN
N
J JJ
JJ
JD
D
D
P,DT,D
P,DT,D
1
1
1
P,1T,1
P,1T,1
2
19 / 53P and T Wave Detection in Electrocardiogram (ECG) Signals
N
The proposed Bayesian method
Signal model for the non-QRS intervals
P
ECG Signal T−wave
Local baseline P−wave
(c)
(b)
(a) QRS QRS QRS
PT T
N NNNN
N
J JJ
JJ
J
aa
a
a
bb bb
D
D
D
P,DT,D
P,DT,D
1
1
1
P,1T,1
P,1T,1
2
T,i
T,i
T,m
T,m
P,j
P,j
P,n
P,n=1=1 =1=1
19 / 53P and T Wave Detection in Electrocardiogram (ECG) Signals
N
The proposed Bayesian method
Signal model for the non-QRS intervals
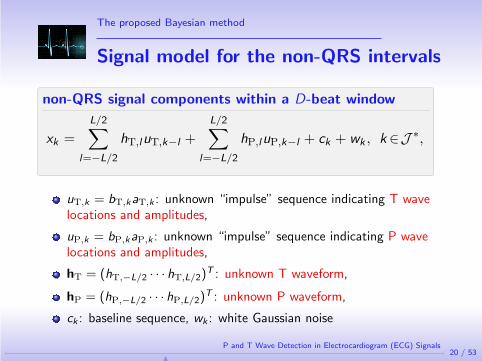
non-QRS signal components within a D-beat window
xk =
L/2∑
l=−L/2
hT,luT,k−l +
L/2∑
l=−L/2
hP,luP,k−l + ck + wk , k∈J ∗,
uT,k = bT,kaT,k : unknown “impulse” sequence indicating T wavelocations and amplitudes,
uP,k = bP,kaP,k : unknown “impulse” sequence indicating P wavelocations and amplitudes,
hT = (hT,−L/2 · · · hT,L/2)T : unknown T waveform,
hP = (hP,−L/2 · · · hP,L/2)T : unknown P waveform,
ck : baseline sequence, wk : white Gaussian noise
20 / 53P and T Wave Detection in Electrocardiogram (ECG) Signals
N
The proposed Bayesian method
Signal model for the non-QRS intervals
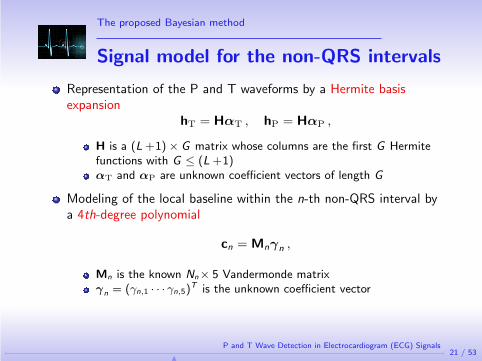
Representation of the P and T waveforms by a Hermite basisexpansion
hT = HαT , hP = HαP ,
H is a (L +1) × G matrix whose columns are the first G Hermitefunctions with G ≤ (L +1)αT and αP are unknown coefficient vectors of length G
Modeling of the local baseline within the n-th non-QRS interval bya 4th-degree polynomial
cn = Mnγn ,
Mn is the known Nn× 5 Vandermonde matrixγn = (γn,1 · · · γn,5)
T is the unknown coefficient vector
21 / 53P and T Wave Detection in Electrocardiogram (ECG) Signals
N
The proposed Bayesian method
Signal model for the non-QRS intervals
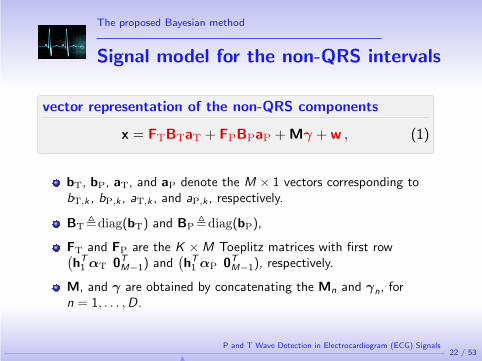
vector representation of the non-QRS components
x = FTBTaT + FPBPaP + Mγ + w , (1)
bT, bP, aT, and aP denote the M × 1 vectors corresponding tobT,k , bP,k , aT,k , and aP,k , respectively.
BT ,diag(bT) and BP ,diag(bP),
FT and FP are the K × M Toeplitz matrices with first row(hT
1 αT 0TM−1) and
(hT
1 αP 0TM−1), respectively.
M, and γ are obtained by concatenating the Mn and γn, forn = 1, . . . ,D.
22 / 53P and T Wave Detection in Electrocardiogram (ECG) Signals
N
The proposed Bayesian method
Model parameters
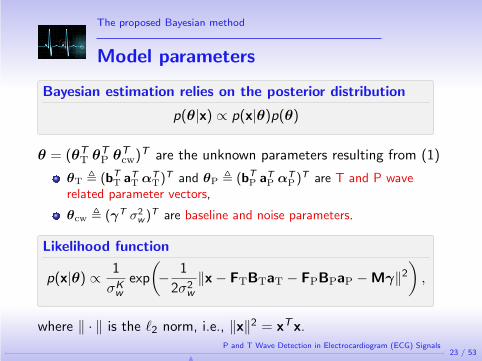
Bayesian estimation relies on the posterior distribution
p(θ|x) ∝ p(x|θ)p(θ)
θ = (θTT θT
P θTcw)T are the unknown parameters resulting from (1)
θT , (bTT aT
T αTT)T and θP , (bT
P aTP αT
P)T are T and P waverelated parameter vectors,
θcw , (γT σ2w )T are baseline and noise parameters.
Likelihood function
p(x|θ) ∝ 1
σKw
exp
(− 1
2σ2w
‖x − FTBTaT − FPBPaP − Mγ‖2
),
where ‖ · ‖ is the ℓ2 norm, i.e., ‖x‖2 = xTx.
23 / 53P and T Wave Detection in Electrocardiogram (ECG) Signals
N
The proposed Bayesian method
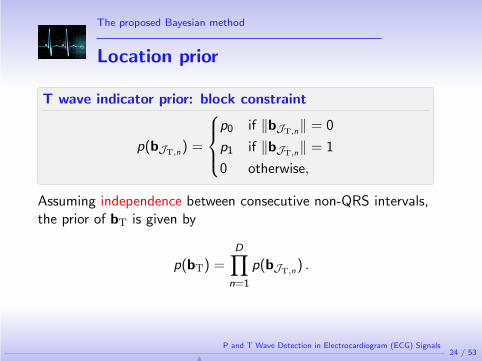
Location prior
T wave indicator prior: block constraint
p(bJT,n) =
p0 if ‖bJT,n‖ = 0
p1 if ‖bJT,n‖ = 1
0 otherwise,
Assuming independence between consecutive non-QRS intervals,the prior of bT is given by
p(bT) =D∏
n=1
p(bJT,n) .
24 / 53P and T Wave Detection in Electrocardiogram (ECG) Signals
N
The proposed Bayesian method
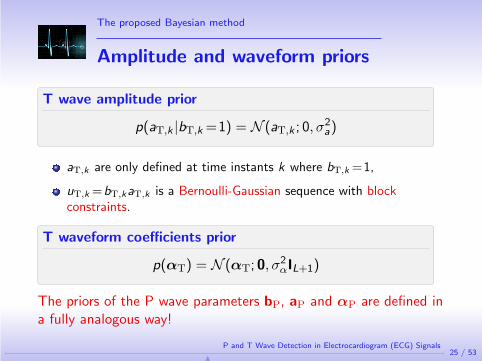
Amplitude and waveform priors
T wave amplitude prior
p(aT,k |bT,k =1) = N (aT,k ; 0, σ2a)
aT,k are only defined at time instants k where bT,k =1,
uT,k =bT,kaT,k is a Bernoulli-Gaussian sequence with blockconstraints.
T waveform coefficients prior
p(αT) = N (αT; 0, σ2αIL+1)
The priors of the P wave parameters bP, aP and αP are defined ina fully analogous way!
25 / 53P and T Wave Detection in Electrocardiogram (ECG) Signals
N
The proposed Bayesian method
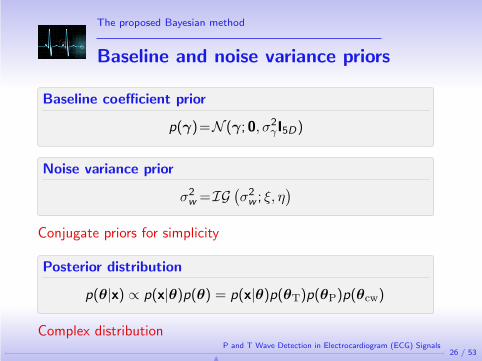
Baseline and noise variance priors
Baseline coefficient prior
p(γ)=N (γ; 0, σ2γI5D)
Noise variance prior
σ2w =IG
(σ2
w ; ξ, η)
Conjugate priors for simplicity
Posterior distribution
p(θ|x) ∝ p(x|θ)p(θ) = p(x|θ)p(θT)p(θP)p(θcw)
Complex distribution
26 / 53P and T Wave Detection in Electrocardiogram (ECG) Signals
N
The proposed Bayesian method
Block Gibbs sampler
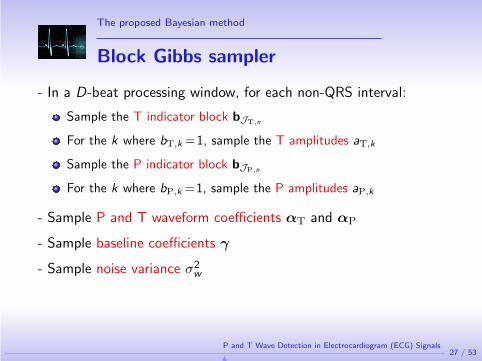
- In a D-beat processing window, for each non-QRS interval:
Sample the T indicator block bJT,n
For the k where bT,k =1, sample the T amplitudes aT,k
Sample the P indicator block bJP,n
For the k where bP,k =1, sample the P amplitudes aP,k
- Sample P and T waveform coefficients αT and αP
- Sample baseline coefficients γ
- Sample noise variance σ2w
27 / 53P and T Wave Detection in Electrocardiogram (ECG) Signals
N
The proposed Bayesian method
Simulation parameters
Preprocessing: QRS complexes detection using the algorithm ofPan et al. (IEEE Trans. Biomed. Eng., 1985),
Processing window length: D = 10,
For each estimation, the 40 first iterations are disregarded (burn-inperiod) and 60 iterations are used to compute the estimates.
Real ECG datasets from the QT database.
Computation time: 8 seconds to run 100 iterations on a 10-beatECG block (Matlab implementation).
C. Lin et al., P and T wave delineation in ECG signals using a Bayesian approach and
a partially collapsed Gibbs sampler, IEEE Trans. Biomed. Eng., 2010
C. Lin et al., P and T wave delineation and waveform estimation in ECG signals using
a block Gibbs sampler, IEEE ICASSP, 2011
28 / 53P and T Wave Detection in Electrocardiogram (ECG) Signals
N
The proposed Bayesian method
Typical examples
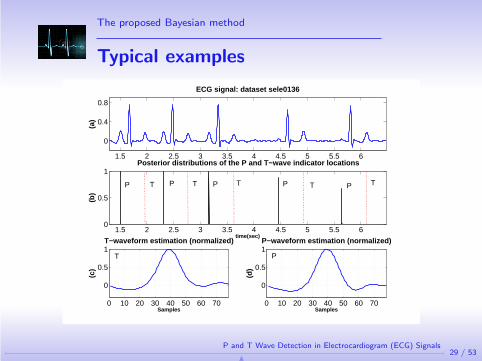
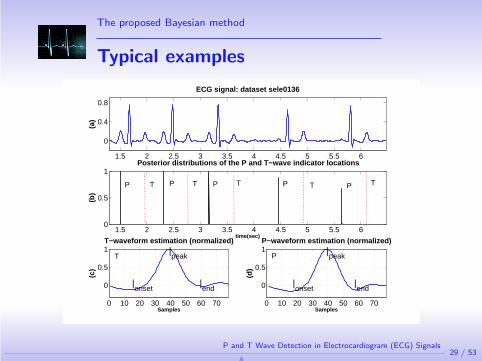
1.5 2 2.5 3 3.5 4 4.5 5 5.5 6
0
0.4
0.8
ECG signal: dataset sele0136(a
)
1.5 2 2.5 3 3.5 4 4.5 5 5.5 60
0.5
1
time(sec)
(b)
Posterior distributions of the P and T−wave indicator locations
0 10 20 30 40 50 60 70
0
0.5
1T−waveform estimation (normalized)
Samples
(c)
0 10 20 30 40 50 60 70
0
0.5
1P−waveform estimation (normalized)
Samples
(d)
29 / 53P and T Wave Detection in Electrocardiogram (ECG) Signals
N
The proposed Bayesian method
Typical examples
1.5 2 2.5 3 3.5 4 4.5 5 5.5 6
0
0.4
0.8
ECG signal: dataset sele0136(a
)
1.5 2 2.5 3 3.5 4 4.5 5 5.5 60
0.5
1
time(sec)
(b)
Posterior distributions of the P and T−wave indicator locations
0 10 20 30 40 50 60 70
0
0.5
1T−waveform estimation (normalized)
Samples
(c)
0 10 20 30 40 50 60 70
0
0.5
1P−waveform estimation (normalized)
Samples
(d)
T
T
PTPPP PT T T
P
29 / 53P and T Wave Detection in Electrocardiogram (ECG) Signals
N
The proposed Bayesian method
Typical examples
1.5 2 2.5 3 3.5 4 4.5 5 5.5 6
0
0.4
0.8
ECG signal: dataset sele0136(a
)
1.5 2 2.5 3 3.5 4 4.5 5 5.5 60
0.5
1
time(sec)
(b)
Posterior distributions of the P and T−wave indicator locations
0 10 20 30 40 50 60 70
0
0.5
1T−waveform estimation (normalized)
Samples
(c)
|peak
|onset
|end
0 10 20 30 40 50 60 70
0
0.5
1P−waveform estimation (normalized)
Samples
(d)
|peak
|onset
|end
T
T
PTPPP PT T T
P
29 / 53P and T Wave Detection in Electrocardiogram (ECG) Signals
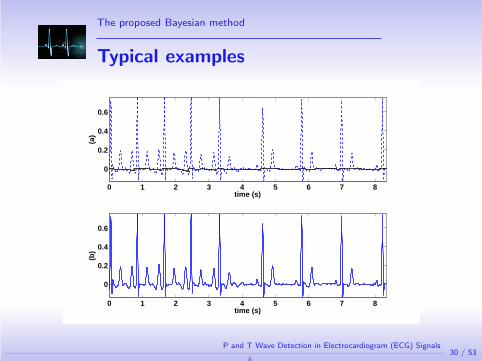
N
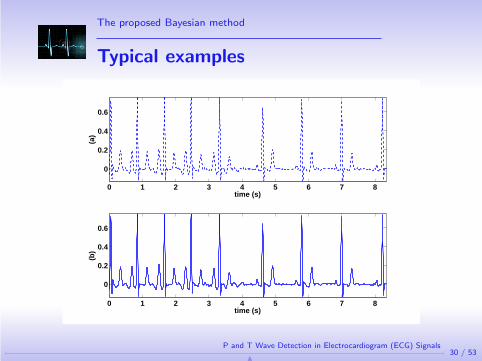
The proposed Bayesian method
Typical examples
0 1 2 3 4 5 6 7 8
0
0.2
0.4
0.6
(a)
time (s)
0 1 2 3 4 5 6 7 8
0
0.2
0.4
0.6
(b)
time (s)
30 / 53P and T Wave Detection in Electrocardiogram (ECG) Signals
N
The proposed Bayesian method
Typical examples
0 1 2 3 4 5 6 7 8
0
0.2
0.4
0.6
(a)
time (s)
0 1 2 3 4 5 6 7 8
0
0.2
0.4
0.6
(b)
time (s)
30 / 53P and T Wave Detection in Electrocardiogram (ECG) Signals
N
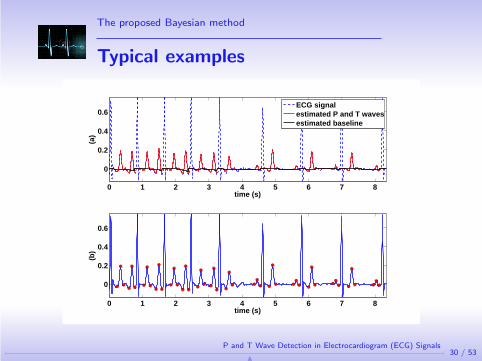
The proposed Bayesian method
Typical examples
0 1 2 3 4 5 6 7 8
0
0.2
0.4
0.6
(a)
time (s)
ECG signalestimated P and T wavesestimated baseline
0 1 2 3 4 5 6 7 8
0
0.2
0.4
0.6
(b)
time (s)
30 / 53P and T Wave Detection in Electrocardiogram (ECG) Signals
N
The proposed Bayesian method
Typical examples
0 1 2 3 4 5 6 7 8
0
0.2
0.4
0.6
(a)
time (s)
ECG signalestimated P and T wavesestimated baseline
0 1 2 3 4 5 6 7 8
0
0.2
0.4
0.6
(b)
time (s)
30 / 53P and T Wave Detection in Electrocardiogram (ECG) Signals
N
The proposed Bayesian method
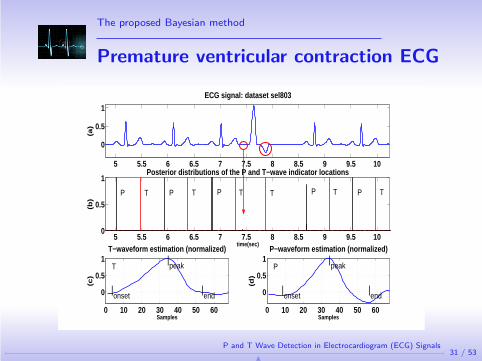
Premature ventricular contraction ECG
5 5.5 6 6.5 7 7.5 8 8.5 9 9.5 10
0
0.5
1
ECG signal: dataset sel803(a
)
5 5.5 6 6.5 7 7.5 8 8.5 9 9.5 100
0.5
1
time(sec)
(b)
Posterior distributions of the P and T−wave indicator locations
0 10 20 30 40 50 60
0
0.5
1T−waveform estimation (normalized)
Samples
(c)
|peak
|onset
|end
0 10 20 30 40 50 60
0
0.5
1P−waveform estimation (normalized)
Samples
(d)
|peak
|onset
|end
P P P P PT T T T T T
T P
31 / 53P and T Wave Detection in Electrocardiogram (ECG) Signals
N
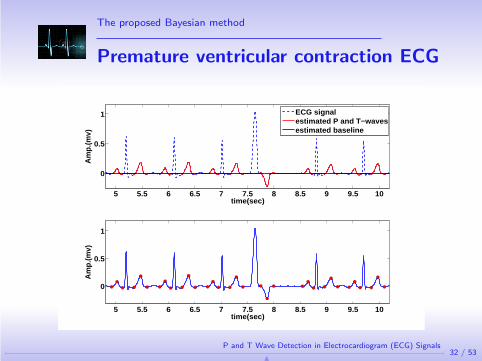
The proposed Bayesian method
Premature ventricular contraction ECG
5 5.5 6 6.5 7 7.5 8 8.5 9 9.5 10
0
0.5
1
Am
p.(m
v)
time(sec)
ECG signalestimated P and T−wavesestimated baseline
5 5.5 6 6.5 7 7.5 8 8.5 9 9.5 10
0
0.5
1
Am
p.(m
v)
time(sec)
32 / 53P and T Wave Detection in Electrocardiogram (ECG) Signals
N
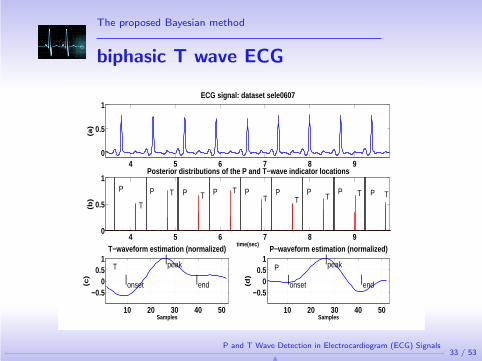
The proposed Bayesian method
biphasic T wave ECG
4 5 6 7 8 90
0.5
1ECG signal: dataset sele0607
(a)
4 5 6 7 8 90
0.5
1
time(sec)
(b)
Posterior distributions of the P and T−wave indicator locations
10 20 30 40 50
−0.50
0.51
T−waveform estimation (normalized)
Samples
(c)
|peak
|onset
|end
10 20 30 40 50
−0.50
0.51
P−waveform estimation (normalized)
Samples
(d)
|peak
|onset
|end
P
P
T
T T
T
TT T T T TP P P P P P P P
33 / 53P and T Wave Detection in Electrocardiogram (ECG) Signals
N
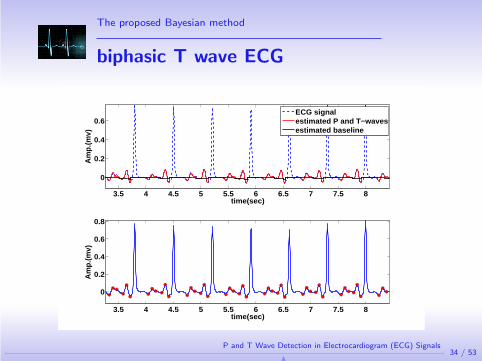
The proposed Bayesian method
biphasic T wave ECG
3.5 4 4.5 5 5.5 6 6.5 7 7.5 8
0
0.2
0.4
0.6
Am
p.(m
v)
time(sec)
ECG signalestimated P and T−wavesestimated baseline
3.5 4 4.5 5 5.5 6 6.5 7 7.5 8
0
0.2
0.4
0.6
0.8
Am
p.(m
v)
time(sec)
34 / 53P and T Wave Detection in Electrocardiogram (ECG) Signals
N
The proposed Bayesian method
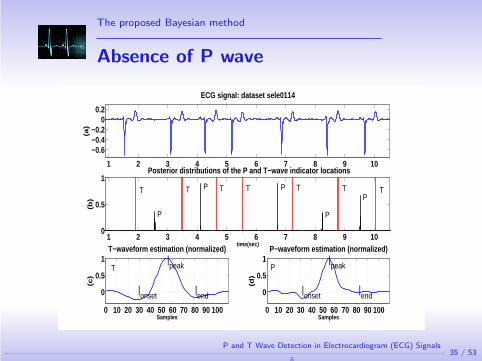
Absence of P wave
1 2 3 4 5 6 7 8 9 10
−0.6−0.4−0.2
00.2
ECG signal: dataset sele0114(a
)
1 2 3 4 5 6 7 8 9 100
0.5
1
time(sec)
(b)
Posterior distributions of the P and T−wave indicator locations
0 10 20 30 40 50 60 70 80 90 100
0
0.5
1T−waveform estimation (normalized)
Samples
(c)
|peak
|onset
|end
0 10 20 30 40 50 60 70 80 90 100
0
0.5
1P−waveform estimation (normalized)
Samples
(d)
|peak
|onset
|end
P
P P
P
PT T T T T T T
T P
35 / 53P and T Wave Detection in Electrocardiogram (ECG) Signals
N
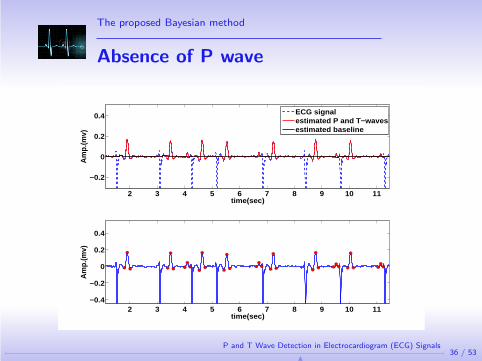
The proposed Bayesian method
Absence of P wave
2 3 4 5 6 7 8 9 10 11
−0.2
0
0.2
0.4
Am
p.(m
v)
time(sec)
ECG signalestimated P and T−wavesestimated baseline
2 3 4 5 6 7 8 9 10 11−0.4
−0.2
0
0.2
0.4
Am
p.(m
v)
time(sec)
36 / 53P and T Wave Detection in Electrocardiogram (ECG) Signals
N
The proposed Bayesian method
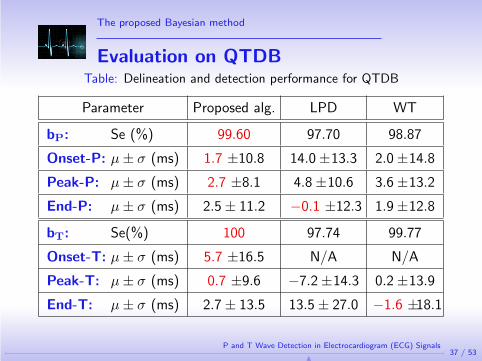
Evaluation on QTDBTable: Delineation and detection performance for QTDB
Parameter Proposed alg. LPD WT
bP: Se (%) 99.60 97.70 98.87
Onset-P: µ± σ (ms) 1.7 ±10.8 14.0 ±13.3 2.0 ±14.8
Peak-P: µ± σ (ms) 2.7 ±8.1 4.8 ±10.6 3.6 ±13.2
End-P: µ± σ (ms) 2.5 ± 11.2 −0.1 ±12.3 1.9 ±12.8
bT: Se(%) 100 97.74 99.77
Onset-T: µ± σ (ms) 5.7 ±16.5 N/A N/A
Peak-T: µ± σ (ms) 0.7 ±9.6 −7.2 ±14.3 0.2 ±13.9
End-T: µ± σ (ms) 2.7 ± 13.5 13.5 ± 27.0 −1.6 ±18.1
37 / 53P and T Wave Detection in Electrocardiogram (ECG) Signals
N
Application: TWA detection
Outline
1 Context
2 Literature review
3 The proposed Bayesian methodProblem formulationBayesian modelBlock Gibbs samplerSimulation results
4 Application: TWA detection
5 Conclusion and future works
6 Appendix
38 / 53P and T Wave Detection in Electrocardiogram (ECG) Signals
N
Application: TWA detection
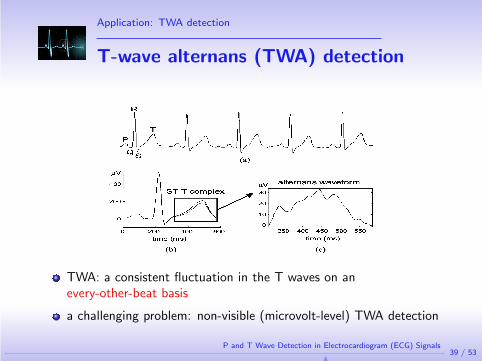
T-wave alternans (TWA) detection
TWA: a consistent fluctuation in the T waves on anevery-other-beat basis
a challenging problem: non-visible (microvolt-level) TWA detection
39 / 53P and T Wave Detection in Electrocardiogram (ECG) Signals
N
Application: TWA detection
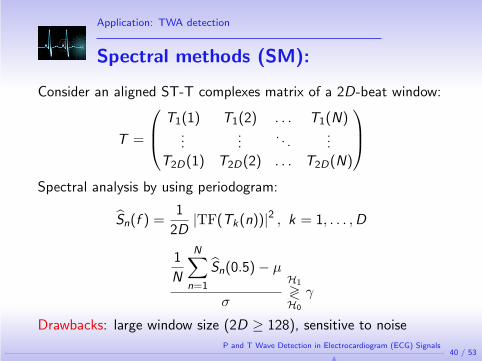
Spectral methods (SM):
Consider an aligned ST-T complexes matrix of a 2D-beat window:
T =
T1(1) T1(2) . . . T1(N)
......
. . ....
T2D(1) T2D(2) . . . T2D(N)
Spectral analysis by using periodogram:
Sn(f ) =1
2D|TF(Tk(n))|2 , k = 1, . . . ,D
1
N
N∑
n=1
Sn(0.5) − µ
σ
H1
≷H0
γ
Drawbacks: large window size (2D ≥ 128), sensitive to noise
40 / 53P and T Wave Detection in Electrocardiogram (ECG) Signals
N
Application: TWA detection
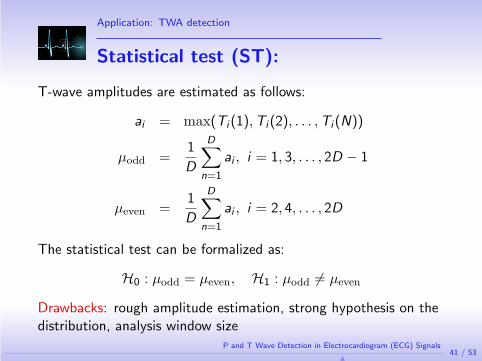
Statistical test (ST):
T-wave amplitudes are estimated as follows:
ai = max(Ti (1),Ti (2), . . . ,Ti (N))
µodd =1
D
D∑
n=1
ai , i = 1, 3, . . . , 2D − 1
µeven =1
D
D∑
n=1
ai , i = 2, 4, . . . , 2D
The statistical test can be formalized as:
H0 : µodd = µeven, H1 : µodd 6= µeven
Drawbacks: rough amplitude estimation, strong hypothesis on thedistribution, analysis window size
41 / 53P and T Wave Detection in Electrocardiogram (ECG) Signals
N
Application: TWA detection
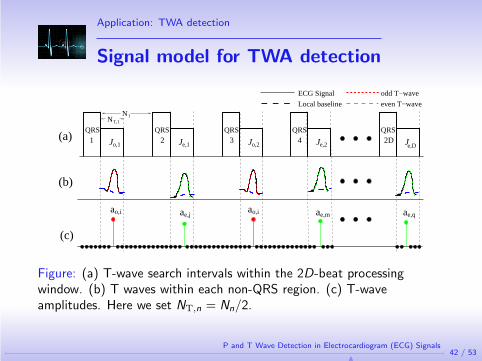
Signal model for TWA detection
2D
ECG Signal
Local baseline
odd T−wave
even T−wave
(c)
(a)QRS QRS QRS
J JJ
(b)
QRS
J
o,iae,ja o,ia
e,ma ae,q
N1
o,1 e,1 o,2 e,D
QRS
Je,2
NT,1
1 2 3 4
Figure: (a) T-wave search intervals within the 2D-beat processingwindow. (b) T waves within each non-QRS region. (c) T-waveamplitudes. Here we set NT,n = Nn/2.
42 / 53P and T Wave Detection in Electrocardiogram (ECG) Signals
N
Application: TWA detection
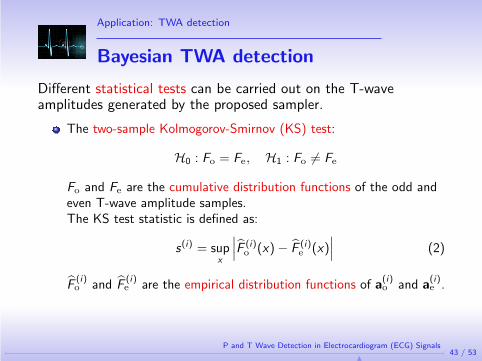
Bayesian TWA detection
Different statistical tests can be carried out on the T-waveamplitudes generated by the proposed sampler.
The two-sample Kolmogorov-Smirnov (KS) test:
H0 : Fo = Fe, H1 : Fo 6= Fe
Fo and Fe are the cumulative distribution functions of the odd andeven T-wave amplitude samples.The KS test statistic is defined as:
s(i) = supx
∣∣∣F (i)o (x) − F (i)
e (x)∣∣∣ (2)
F(i)o and F
(i)e are the empirical distribution functions of a
(i)o and a
(i)e .
43 / 53P and T Wave Detection in Electrocardiogram (ECG) Signals
N
Application: TWA detection
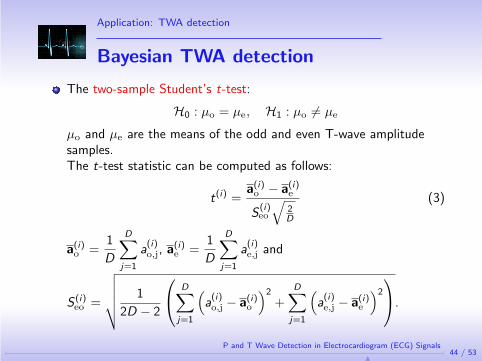
Bayesian TWA detection
The two-sample Student’s t-test:
H0 : µo = µe, H1 : µo 6= µe
µo and µe are the means of the odd and even T-wave amplitudesamples.The t-test statistic can be computed as follows:
t(i) =a(i)o − a(i)
e
S(i)eo
√2D
(3)
a(i)o =
1
D
D∑
j=1
a(i)o,j, a(i)
e =1
D
D∑
j=1
a(i)e,j and
S (i)eo =
√√√√√ 1
2D − 2
D∑
j=1
(a(i)o,j − a(i)
o
)2
+D∑
j=1
(a(i)e,j − a(i)
e
)2
.
44 / 53P and T Wave Detection in Electrocardiogram (ECG) Signals
N
Application: TWA detection
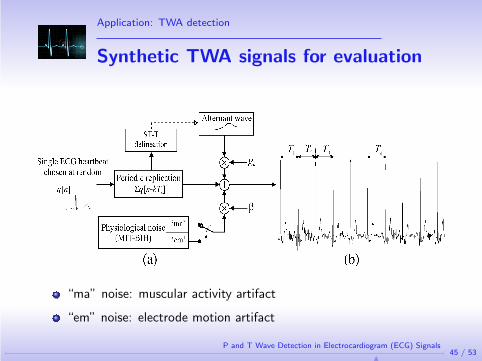
Synthetic TWA signals for evaluation
“ma” noise: muscular activity artifact
“em” noise: electrode motion artifact
45 / 53P and T Wave Detection in Electrocardiogram (ECG) Signals
N
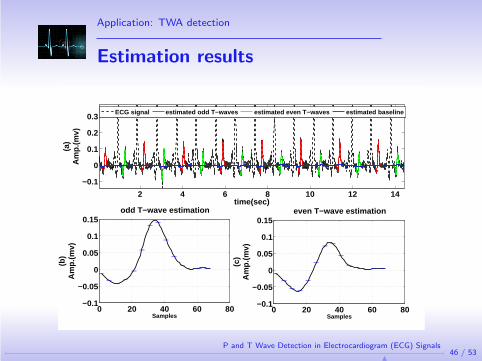
Application: TWA detection
Estimation results
2 4 6 8 10 12 14
−0.1
0
0.1
0.2
0.3
(a)
Am
p.(m
v)
time(sec)
ECG signal estimated odd T−waves estimated even T−waves estimated baseline
0 20 40 60 80−0.1
−0.05
0
0.05
0.1
0.15odd T−wave estimation
Samples
(b)
Am
p.(m
v)
0 20 40 60 80−0.1
−0.05
0
0.05
0.1
0.15even T−wave estimation
Samples
(c)
Am
p.(m
v)
46 / 53P and T Wave Detection in Electrocardiogram (ECG) Signals
N
Application: TWA detection
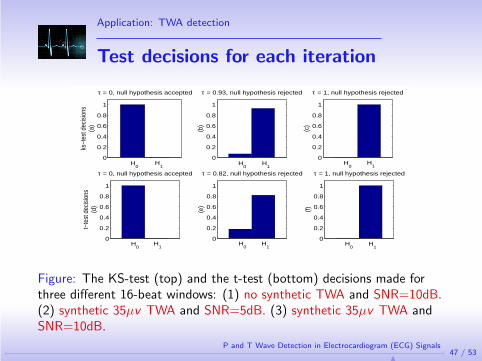
Test decisions for each iteration
0
0.2
0.4
0.6
0.8
1
ks−t
est d
ecis
ions
(a)
τ = 0, null hypothesis accepted
0
0.2
0.4
0.6
0.8
1
(b)
τ = 0.93, null hypothesis rejected
0
0.2
0.4
0.6
0.8
1
(c)
τ = 1, null hypothesis rejected
0
0.2
0.4
0.6
0.8
1
t−te
st d
ecis
ions
(d)
τ = 0, null hypothesis accepted
0
0.2
0.4
0.6
0.8
1
(e)
τ = 0.82, null hypothesis rejected
0
0.2
0.4
0.6
0.8
1
(f)
τ = 1, null hypothesis rejected
H0
H1
H0
H1
H1
H0
H1
H0
H1
H0
H1
H0
Figure: The KS-test (top) and the t-test (bottom) decisions made forthree different 16-beat windows: (1) no synthetic TWA and SNR=10dB.(2) synthetic 35µv TWA and SNR=5dB. (3) synthetic 35µv TWA andSNR=10dB.
47 / 53P and T Wave Detection in Electrocardiogram (ECG) Signals
N
Application: TWA detection
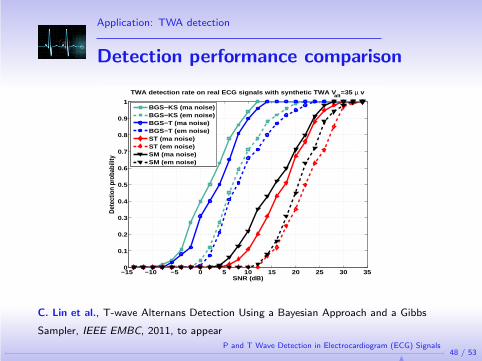
Detection performance comparison
−15 −10 −5 0 5 10 15 20 25 30 350
0.1
0.2
0.3
0.4
0.5
0.6
0.7
0.8
0.9
1
SNR (dB)
Det
ectio
n pr
obab
ility
TWA detection rate on real ECG signals with synthetic TWA Valt
=35 µ v
BGS−KS (ma noise)BGS−KS (em noise)BGS−T (ma noise)BGS−T (em noise)ST (ma noise)ST (em noise)SM (ma noise)SM (em noise)
C. Lin et al., T-wave Alternans Detection Using a Bayesian Approach and a Gibbs
Sampler, IEEE EMBC, 2011, to appear
48 / 53P and T Wave Detection in Electrocardiogram (ECG) Signals
N
Conclusion and future works
Outline
1 Context
2 Literature review
3 The proposed Bayesian methodProblem formulationBayesian modelBlock Gibbs samplerSimulation results
4 Application: TWA detection
5 Conclusion and future works
6 Appendix
49 / 53P and T Wave Detection in Electrocardiogram (ECG) Signals
N
Conclusion and future works
Conclusion and future works
Conclusion
A Bayesian model for the non-QRS intervals of ECG signals
Gibbs-type samplers for joint delineation and waveform estimationof P and T waves
Evaluation on the QTDB is promising
TWA detection: Bayesian test
Prospects
Exploitation of the waveform estimation, ex., arrhythmia detection
Beat-to-beat / sequential delineation
50 / 53P and T Wave Detection in Electrocardiogram (ECG) Signals
N
Thank you for your attention!
51 / 53P and T Wave Detection in Electrocardiogram (ECG) Signals
N
Appendix
Outline
1 Context
2 Literature review
3 The proposed Bayesian methodProblem formulationBayesian modelBlock Gibbs samplerSimulation results
4 Application: TWA detection
5 Conclusion and future works
6 Appendix
52 / 53P and T Wave Detection in Electrocardiogram (ECG) Signals
N
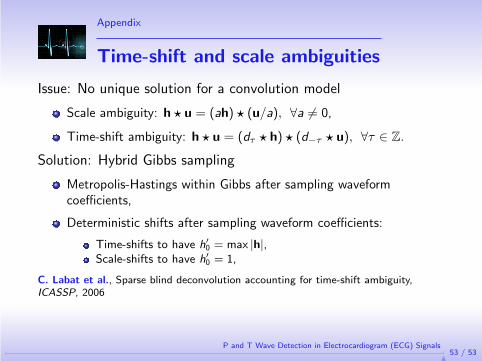
Appendix
Time-shift and scale ambiguities
Issue: No unique solution for a convolution model
Scale ambiguity: h ⋆ u = (ah) ⋆ (u/a), ∀a 6= 0,
Time-shift ambiguity: h ⋆ u = (dτ ⋆ h) ⋆ (d−τ ⋆ u), ∀τ ∈ Z.
Solution: Hybrid Gibbs sampling
Metropolis-Hastings within Gibbs after sampling waveformcoefficients,
Deterministic shifts after sampling waveform coefficients:
Time-shifts to have h′
0 = max |h|,Scale-shifts to have h′
0 = 1,
C. Labat et al., Sparse blind deconvolution accounting for time-shift ambiguity,ICASSP, 2006
53 / 53P and T Wave Detection in Electrocardiogram (ECG) Signals
N