Embed Size (px)
Citation preview
AGRICULTURAL SITUATION IN INDIA
APRIL, 2015
AGRICULTURAL SITUATION IN INDIA
GENERAL SURVEY OF AGRICULTURE
FARM SECTOR NEWS RELEASES
ARTICLES
Repayment Performance of Borrower andOverdues of Short Term Agricultural Creditin Bikaner Region of Rajasthan
Trends in Arrivals and Prices of Chickpea in Western Maharashtra
AGRO ECONOMIC RESEARCHProblems and Prospects of Oilseeds Production in India
COMMODITY REVIEWSFoodgrainsCommercial Crops
TRENDS IN AGRICULTURE : WAGES & PRICES
S2\d\330AGRI.cdr
Copies are available at:The Controller of Publications, Civil Lines, Delhi-110054
P. Agri. 21-04-2015600
PRINTED BY THE GENERAL MANAGER GOVERNMENT OF INDIA PRESS, MINTO ROAD, NEW DELHI-110002 AND PUBLISHED BY THE CONTROLLER OF PUBLICATIONS, DELHI-110054-2015
List of other Publications of the Directorate
ISSN 0002-167Regn. No. : 840
Periodicals
Agricultural Prices in India
Agricultural Wages in India
Cost of Cultivation of Principal Crops
District-wise Area and Production of Principal Crops in India
Year Book of Agro-Economic Research Studies
Land Use Statistics at a Glance
Farm Harvest Prices of Principal Crops in India
Agricultural Statistics at a Glance
Serv.3/e/Agriculture 2015/330AG Prem. (E)
Agricultural Situationin India
VOL. LXXII April, 2015 No. 1
CONTENTS
PAGES
GENERAL SURVEY OF AGRICULTURE 1
FARM SECTOR NEWS RELEASES 3
ARTICLES
1. Trends in Arrivals and Prices of 5Chickpea in Western Maharashtra—R.B. Naik, D.S. Navadkar and A.J. Amale
2. Repayment Performance of Borrower and 11Overdues of Short term AgriculturalCredit in Bikaner Region of Rajasthan—Raju Kumawat and Dr. N.K. Singh
AGRO-ECONOMIC RESEARCH
Problems and Prospects of Oilseeds Production in India— 17Centre for Management in Agriculture (CMA)Indian Institute of Management, Ahemedabad
COMMODITY REVIEWS
Foodgrains 23
Commercial Crops : 25
Oilseeds and Edible Oils 25
Fruits and Vegetables 25
Potato 25
Onion 25
Condiments and Spices 25
Raw Cotton 25
Raw Jute 25
Editorial Board
ChairmanSangeeta Verma
EditorP. C. Bodh
Economic OfficerProsenjit Das
Officials Associated in Preparation of thisPublication.
D. K. Gaur—Technical Asstt.S. K. Kaushal—Technical Asstt. (Printing)
Uma Rani—Technical Asstt. (Printing)V. M. Shobhana—P.A.
Yogeshwari Tailor—Asstt. Graph
Publication Division
DIRECTORATE OF ECONOMICS
AND STATISTICS
DEPARTMENT OF AGRICULTURE
AND CO-OPERATION
MINISTRY OF AGRICULTURE
GOVERNMENT OF INDIA
C-1, HUTMENTS, DALHOUSIE ROAD,NEW DELHI-110011PHONE : 23012669
SubscriptionInland Foreign
Single Copy : 40.00 £ 2.9 or $ 4.5Annual : 400.00 £ 29 or $ 45
Available fromThe Controller of Publications,
Ministry of Urban Development,Deptt. of Publications,
Publications Complex (Behind Old Secretariat),Civil Lines, Delhi-110 054.
Phone : 23817823, 23819689, 23813761,23813762, 23813764, 23813765
©Articles published in the Journal cannot bereproduced in any form without the permissionof Economic and Statistical Adviser.
Serv.3/e/Agriculture 2015/330AG Prem. (E)
STATISTICAL TABLESPAGES
Wages
1. Daily Agricultural Wages in Some States—Category-wise. 271.1. Daily Agricultural Wages in Some States—Operation-wise. 27
Prices
2. Wholesale Prices of Certain Important Agricultural Commodities 29and Animal Husbandry Products at Selected Centres in India.
3. Month-end Wholesale Prices of some Important Agricultural 32Commodities in International Market during the year 2015.
Crop Production
4. Sowing and Harvesting Operations Normally in Progress during 33May, 2015.
Abbreviations used
N.A. — Not Available.N.Q. — Not Quoted.N.T. — No Transactions.N.S. — No Supply/No Stock.R. — Revised.M.C. — Market Closed.N.R. — Not Reported.Neg. — Negligible.Kg. — Kilogram.Q. — Quintal.(P) — Provisional.Plus (+) indicates surplus or increase.Minus (–) indicates deficit or decrease.
The Journal is brought out by the Directorateof Economics and Statistics, Ministry ofAgriculture, it aims at presenting a factual andintegrated picture of the food and agriculturalsituation in india on month to month basis.The views expresssed, if any, are notnecessarily those of the Government of India.
NOTE TO CONTRIBUTORS
Articles on the State of Indian Agriculture andallied sectors are accepted for publication inthe Directorate of Economics & Statistics,Department of Agriculture & Cooperation’smonthly Journal “Agricultural Situation inIndia”. The Journal intends to provide a forumfor scholarly work and also to promotetechnical competence for research inagricultural and allied subjects. Good articlesin Hard Copy as well as Soft Copy in MSWord, not exceeding five thounsand words,may be sent in duplicate, typed in double spaceon one side of fullscape paper in Times NewRoman font size 12, addressed to the Editor,Publication Division, C-I, Hutments,Dalhousie Road, New Delhi 110011, alongwith a declaration by the author(s) that thearticle has neither been published norsubmitted for publication elsewhere. Theauthor(s)should furnish their e-mail address,Phone No. and their permanent address onlyon the forwarding letter so as to maintainanonymity of the author while seekingcomments of the referees on the suitability ofthe article for publication.
Although authors are solely responsible forthe factual accuracy and the opinion expressedin their articles, the Editorial Board of theJournal, reserves the right to edit, amend anddelete any portion of the article with a view tomaking it more presentable or to reject anyarticle, if not found suitable. Articles whichare not found suitable will not be returnedunless accompanied by a self-addressed andstamped envelope. No correspondence will beentertained on the articles rejected by theEditorial Board.
An honorarium of Rs. 2000 per article ofatleast 2000 words for the regular issue andRs. 2500 per article of at least 2500 words forthe Special/Annual issue is paid by theDirectorate of Economics & Statistics to theauthors of the articles accepted for the Journal.
April, 2015 1
SERVER3\E\AGRICULTURE 2015\330AGRI
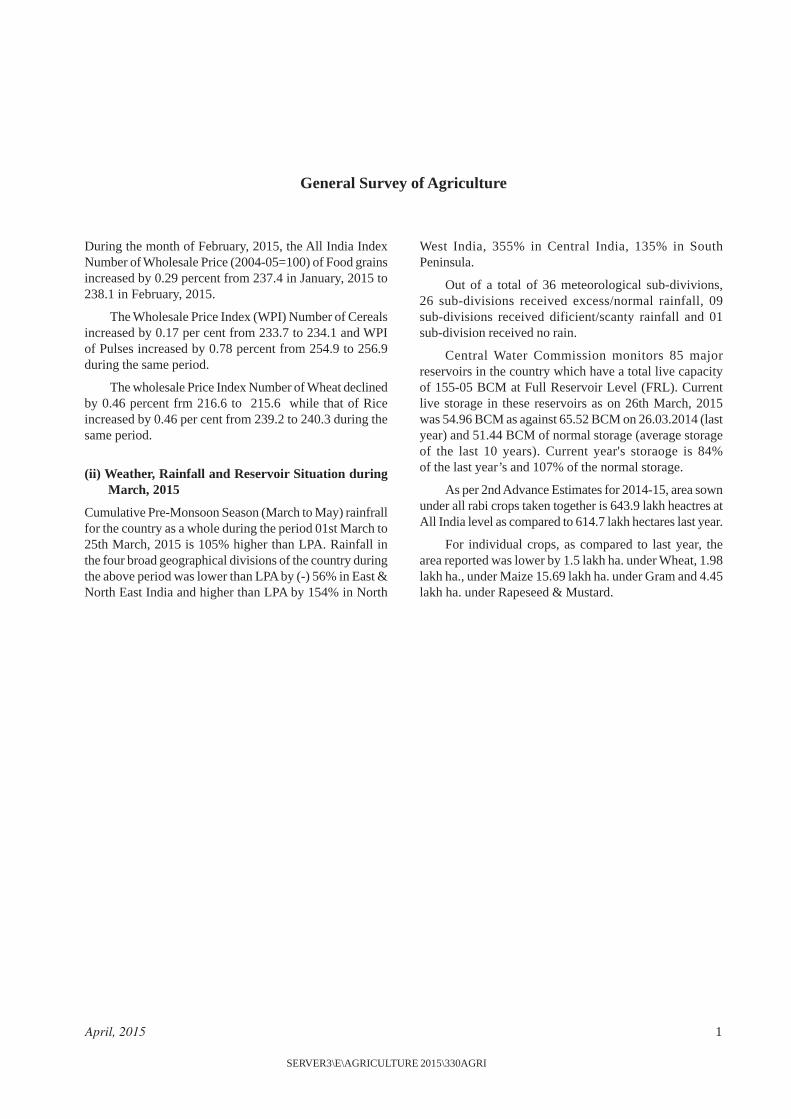
During the month of February, 2015, the All India IndexNumber of Wholesale Price (2004-05=100) of Food grainsincreased by 0.29 percent from 237.4 in January, 2015 to238.1 in February, 2015.
The Wholesale Price Index (WPI) Number of Cerealsincreased by 0.17 per cent from 233.7 to 234.1 and WPIof Pulses increased by 0.78 percent from 254.9 to 256.9during the same period.
The wholesale Price Index Number of Wheat declinedby 0.46 percent frm 216.6 to 215.6 while that of Riceincreased by 0.46 per cent from 239.2 to 240.3 during thesame period.
(ii) Weather, Rainfall and Reservoir Situation during March, 2015
Cumulative Pre-Monsoon Season (March to May) rainfrallfor the country as a whole during the period 01st March to25th March, 2015 is 105% higher than LPA. Rainfall inthe four broad geographical divisions of the country duringthe above period was lower than LPA by (-) 56% in East &North East India and higher than LPA by 154% in North
West India, 355% in Central India, 135% in SouthPeninsula.
Out of a total of 36 meteorological sub-divivions,26 sub-divisions received excess/normal rainfall, 09sub-divisions received dificient/scanty rainfall and 01sub-division received no rain.
Central Water Commission monitors 85 majorreservoirs in the country which have a total live capacityof 155-05 BCM at Full Reservoir Level (FRL). Currentlive storage in these reservoirs as on 26th March, 2015was 54.96 BCM as against 65.52 BCM on 26.03.2014 (lastyear) and 51.44 BCM of normal storage (average storageof the last 10 years). Current year's storaoge is 84%of the last year’s and 107% of the normal storage.
As per 2nd Advance Estimates for 2014-15, area sownunder all rabi crops taken together is 643.9 lakh heactres atAll India level as compared to 614.7 lakh hectares last year.
For individual crops, as compared to last year, thearea reported was lower by 1.5 lakh ha. under Wheat, 1.98lakh ha., under Maize 15.69 lakh ha. under Gram and 4.45lakh ha. under Rapeseed & Mustard.
General Survey of Agriculture
2 Agricultural Situation in India
SERVER3\E\AGRICULTURE 2015\330AGRI
NOTE TO CONTRIBUTORS
Articles on the State of Indian Agriculture and allied sectorsare accepted for publication in the Directorate of Economics &Statistics, Department of Agriculture & Cooperation’s monthlyJournal “Agricultural Situation in India”. The Journal intends toprovide a forum for scholarly work and also to promote technicalcompetence for research in agricultural and allied subjects. Goodarticles in Hard Copy as well as Soft Copy in MS Word, notexceeding five thounsand words, may be sent in duplicate, typedin double space on one side of fullscape paper in Times NewRoman font size 12, addressed to the Editor, Publication Division,C-I, Hutments, Dalhousie Road, New Delhi 110011, along witha declaration by the author(s) that the article has neither beenpublished nor submitted for publication elsewhere. Theauthor(s)should furnish their e-mail address, Phone No. and theirpermanent address only on the forwarding letter so as to maintainanonymity of the author while seeking comments of the refereeson the suitability of the article for publication.
Although authors are solely responsible for the factual accuracyand the opinion expressed in their articles, the Editorial Boardof the Journal, reserves the right to edit, amend and delete anyportion of the article with a view to making it more presentableor to reject any article, if not found suitable. Articles which arenot found suitable will not be returned unless accompanied by aself-addressed and stamped envelope. No correspondence willbe entertained on the articles rejected by the Editorial Board.
An honorarium of Rs. 2000 per article of atleast 2000 wordsfor the regular issue and Rs. 2500 per article of at least 2500words for the Special/Annual issue is paid by the Directorate ofEconomics & Statistics to the authors of the articles acceptedfor the Journal.
April, 2015 3
SERVER3\E\AGRICULTURE 2015\330AGRI
Radha Mohan Singh Emphasizes on the Importanceof Soil Health Management, Irrigation and OrganicFarming
Shri T R Zeliang, the Chief Minister of Nagaland, calledon the Union Agriculture Minister, Shri Radha MohanSingh in New Delhi on 27th March, 2015. It was a courtesycall. Various points discussed included establishment of aVeterinary College in Nagaland, employment opportunitiesand Infrastructure development. Union AgricultureMinister, Shri Rash Mohan Singh emphasised on theimportance of Soil Health Management, Irrigation andOrganic farming. Shri Singh informed Ministry ofAgriculture officials to form a committee and consult StateGovernment for doing a feasibility study on the setting upof the college.
Price Stabilisation Fund
The Department of Agriculture & Cooperation hasapproved the price Stabilisation Fund (PSF) as a CentralSector Scheme, with a corpus of Rs. 500 crores, to supportmarket interventions for price control of perishable agri-horticultural commodities. PSF will be used to advanceinterest free loan to State Governments and Central agenciesto support their working capital and other expenses onprocurement and distribution interventions for suchcommodities. For this purpose, the States will set up arevolving fund to which Centre and State will contributeequally (50:50). the ratio of Centre-State Contribution tothe State level corpus in respect of North East States willhowever be 75:25. The revolving fund is being mooted sothat requirements for all future interventions can be decidedand met with at the State level itself. Central Agencies will,however, set up their revolving fund entirely with theadvance from the Centre. Procurement of thesecommodities will be undertaken directly from farmers orfarmer's organizations at farm gate/mandi and madeavailable at a more reasonable price to the consumers.Intially the fund is proposed to be used for onion and potatoonly. Losses incurred, if any, in the operations will be sharedbetween the Central and the States. Detailed guidelines forthe scheme have now been approved and are available onthe departmental website.
Monetary Support to States to have Own CropInsurance Schemes
Keeping in view the requirements and agro-climaticconditions specific to each region, State Governments have
been given the flexibility to develop suitable products forconsideration and approval of the Central Government.
Central Government is providing monetary supportunder Crop Insurance Schemes in the form of premiumsubsidy between 40% to 75% in respect of ModifiedNational Agricultural Insurance Scheme, Weather BasedCrop Insurance Scheme and Coconut Palm InsuranceScheme. Under National Agricultural Insurance Scheme(NAIS), premium subsidy is provided to only small &marginal farmers up to 10% of the premium. Besides, underNAIS claims are paid by the Government over and abovethe premium amount. The benefit of premium subsidy andclaim payment is applicable to all insured farmers of allStates/UTs including the farmers of Vidarbha region.
Subsidy on Premium Paid for Crops
Ten per cent subsidy in premium is available to small andmarginal farmers under National Agricultural InsuranceScheme (NAIS). Under Modified National AgriculturalInsurance Scheme (MNAIS), Weather Based CropInsurance Scheme (WBCIS) and Coconut Palm InsuranceScheme (CPIS), the component schemes of 'National CropInsurance Programme' (NCIP), premium subsidy up to75%, 50% and 75% respectively is available to farmerswho have insured their crops, which is shared equallybetween Centre and State Governments. Under NAIS,claims beyond 100% of premium are paid by theGovernment & shared equally between Centre and StateGovernments. Under MNAIS, WBCIS and CPIS liabilityfor payment of claims rests with the insurance companies.
Details of funds released by Central Government asits share under various crop insurance shcmes during XIIFive Year Plan are as under:
Year Funds provided(Rs. in crore)
2012-13 1549.68
2013-14 2551.12
2014-15 (As on date) 2354.17
As per provisions of the Crop Insurance Schemes,demand for funds from the State Governments is notrequired. Subsidy in premium and claims, if any, asinformed by the insurance companies are worked out andpaid as per the provisions of the schemes.
Farm Sector News Releases
4 Agricultural Situation in India
SERVER3\E\AGRICULTURE 2015\330AGRI
Issuance of Soil Health Cards
'Soil Health Card' Scheme is launched in current year toassist State Govenments to issue soil health cards to allfarmers in the country. Soil health card will provideinformation to farmers on nutrient status of their soil alongwith recommendation on appropriate dosage of nutrientsto be applied for improving soil health and its fertility. Soilnutrient status will be assessed in all the 14 crore farmholdings regularly in a cycle of 3 years so that nutrientdeficiencies are identified and amendments applied.
Drought Management Policy
There is a Crop Weather Watch Group (CWWG)representing concerned Central Ministries/Departmentunder Department of Agriculture & Cooperation (DAC)which meets on regular basis to take stock of rainfall, weatherforecast, progress of sowing, crop health, level of water inthe major water reservoirs in the country, etc. The meetingof CWWG is corrdinated by the National Crop forecastingcentre (NCFC) under the Department of Agriculture &Cooperation. The information received on rainfall and itsforecast, water storage in reservoirs, pest control, inputsavailablility, crop sowing status and prices are shared amongthe members of the Group for formulating strategy to meetthe contingencies, if any. The findings of CWWG and IndiaMeteorological Department reports are also discussed bySecretary (A&C) with the Senior Officers and therequirements for agricultural and allied sector are assessedand appropriate actions taken by the Central Government.The State Governments are also advised suitably and theirefforts are supplemented from the Central resources,
whenever the situation warrants for immediate interventionfor mitigating the hardships of agricultural sector.
DAC is the nodal department of coordination of reliefefforts necessitated by drought. The Crisis ManagementGroup on drought headed by the Central Drought ReliefCommissioner reviews situation with the representativesof all the Line Department, as and when warranted. A CrisisManagement Plan in released annually to guide andformulate the Contingency Plan for all the sectors linkedwith the impact of drought to mitigate the impact of droughtsituation. State Governments are also advised to preparedistrict-wise contingency plans accordingly ContingencyPlan has been prepared in 580 districts.
In case of severe drought situation in the country, theNational Crisis Management Committee (NCMC) underthe Chairmanship of Cabinet Secretary also reviews thesituation and takes necessary decisions to mitigate thedrought situation. Separate Minister-level and Secretarylevel Committees are in place to tackle the situation.
Use of Modern Equipments in Fruits Production
The Government of India is implementing scheme ofMission for Integrated Development of Horticulture(MIDH) in all states and Union Territories, for thedevelopment of horticulture crops including fruit crops likemango, litchi and grapes and spice like saffron. Missionenvisages production and productivity enhancement ofhorticulture crops along with creation of infrastructure forpost harvest management and marketing by adopting acluster approach. the scheme also has provisions forcapacity building and skill upgradation of farmers throughtraining and demonstration of latest technologies.
April, 2015 5
SERVER3\E\AGRICULTURE 2015\330AGRI
Abstract
This paper attempts to study the arrivals and prices ofchickpea in Solapur district of Maharashtra. In Solapurdistrict, the area under gram (Chickpea) was 24.6 thousandha and production was 15.9 thousand tonnes. In view ofthis, there is a very vast scope in the processing industriesof pulses in Solapur district. Therefore, attempts have beenmade to study the trends in arrivals and prices of chickpeain Western Maharashtra. The time series data on monthlyarrivals and prices of chickpea were collected from thepurposively selected APMC, Barshi for the years from2001-02 to 2011-12 in order to compute the trends, growthrates and relationship between arrivals and prices. In APMCmarket of Barshi, the variance analysis of arrivals ofchickpea showed that the maximum variability was foundin chickpea during the year 2006-07 and minimum in theyear 2011-12. While in case of price variability of chickpea,
maximum occured during the year 2011-12 and minimumin the year 2008-09. The arrivals could not increase at thesimilar rate of prices during this period, which may be dueto decline in production and productivity of chickpea inthe study area. This situation could be improved by growingchickpea on irrigated land, providing subsidies, incentivesand quick services to the cultivators. For this purpose, HYVseeds, fertilizers, pesticides and irrigation facilities shouldbe provided to cultivators.
Introduction
National Scenario of Chickpea
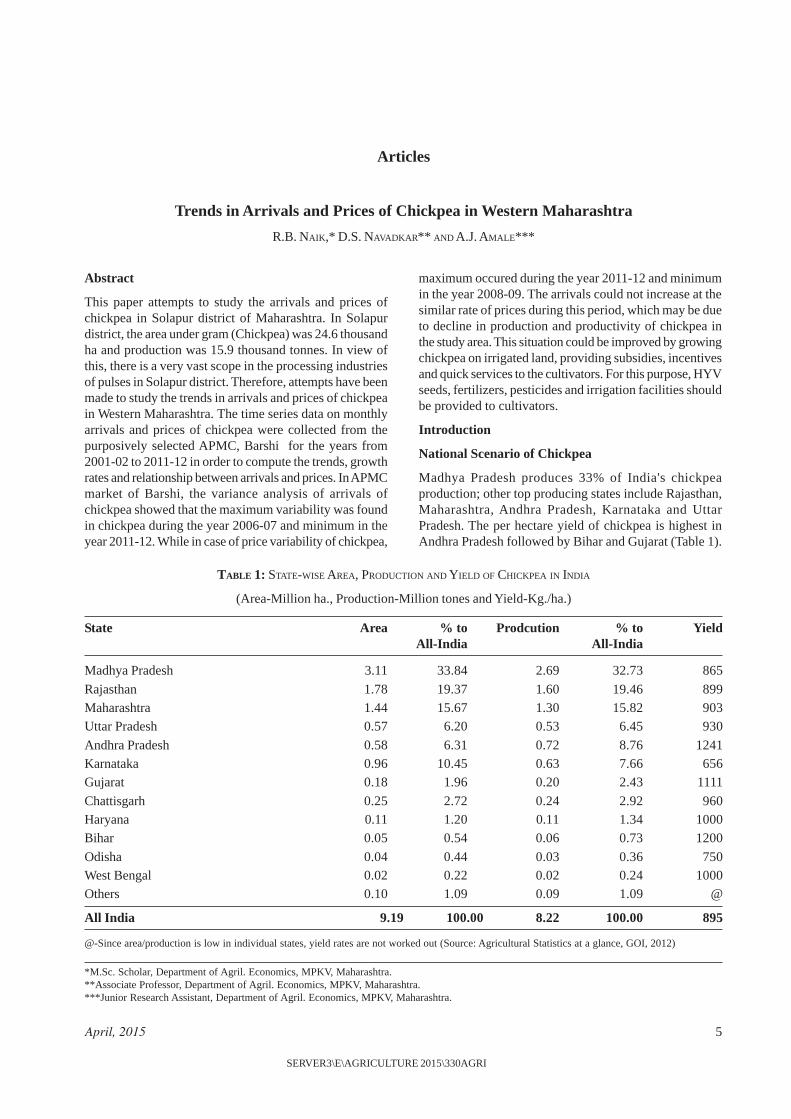
Madhya Pradesh produces 33% of India's chickpeaproduction; other top producing states include Rajasthan,Maharashtra, Andhra Pradesh, Karnataka and UttarPradesh. The per hectare yield of chickpea is highest inAndhra Pradesh followed by Bihar and Gujarat (Table 1).
*M.Sc. Scholar, Department of Agril. Economics, MPKV, Maharashtra.**Associate Professor, Department of Agril. Economics, MPKV, Maharashtra.***Junior Research Assistant, Department of Agril. Economics, MPKV, Maharashtra.
TABLE 1: STATE-WISE AREA, PRODUCTION AND YIELD OF CHICKPEA IN INDIA
(Area-Million ha., Production-Million tones and Yield-Kg./ha.)
State Area % to Prodcution % to YieldAll-India All-India
Madhya Pradesh 3.11 33.84 2.69 32.73 865
Rajasthan 1.78 19.37 1.60 19.46 899Maharashtra 1.44 15.67 1.30 15.82 903Uttar Pradesh 0.57 6.20 0.53 6.45 930
Andhra Pradesh 0.58 6.31 0.72 8.76 1241Karnataka 0.96 10.45 0.63 7.66 656Gujarat 0.18 1.96 0.20 2.43 1111
Chattisgarh 0.25 2.72 0.24 2.92 960Haryana 0.11 1.20 0.11 1.34 1000Bihar 0.05 0.54 0.06 0.73 1200
Odisha 0.04 0.44 0.03 0.36 750West Bengal 0.02 0.22 0.02 0.24 1000Others 0.10 1.09 0.09 1.09 @
All India 9.19 100.00 8.22 100.00 895
@-Since area/production is low in individual states, yield rates are not worked out (Source: Agricultural Statistics at a glance, GOI, 2012)
Articles
Trends in Arrivals and Prices of Chickpea in Western Maharashtra
R.B. NAIK,* D.S. NAVADKAR** AND A.J. AMALE***
6 Agricultural Situation in India
SERVER3\E\AGRICULTURE 2015\330AGRI
In Maharashtra, the area under the total pulses was3.38 million ha (2009-10), production 2.37 million tonnesand productivity 702 Kg ha-1, whereas, in India in 2009-10, 23.28 million ha area was under these pulses, with 14.66million tonnes production and 630 kg ha-1 productivity. TheMaharashtra state contributes to the 14.50 per cent of thetotal area and 14.66 per cent of the total production ofIndia.
In Solapur district, the area under gram (Chickpea)was 24600 ha and production 15900 thousand tonnes. Inview of this, there is a very vast scope in the processingindustries of pulses in Solapur district.
Methodolgy
The choice of Solapur district (Barshi tahsil) was purposivebecause of the fact that the dal mills of different capacitieshave been established in this area. The pulse processingactivities have been carried out on commercial basis by alarge number of dal mills in this area.
The Barshi town from Barshi tahsil was purposivelyselected since the majority of dal mills have been locatedand centered at the same town. The market has goodabsorption capacity for the produce that is reflected in theinstalled capacity of dall mills. For purchase of rawmaterial, the produce from Solapur district is shipped toother parts of the country. The data on general featuresand selected indicators of the agricultural economy of thestudy area were obtained from the official records of theDistrict Statistical Officer, Solapur and the Tahsildar,Barshi. The market level secondary data on monthly arrivalsand prices of pulses were collected from the official recordsof the Agricultural Produce Market Committee, Barshi forthe years 2001-02 to 2011-12.
The analytical procedure adopted for the presentinvestigation has been described below:
The time series data on monthly arrivals and prices ofchickpea collected from the sample market Barshi for the11 years from 2001-2002 to 2011-2012 were analyzed witha view to compute the trends, growth rates and relationshipheld therein between. The different estimates were obtainedby arranging the data separately at every point of analysis.Some basic measures of statistics were used to interpretthe results more effectively. The method adopted for thedata analysis is given below with further more explanation.
Where,
Y= Annual arrivals of chickpea in Qtls. (or)
Annual mean prices of chickpea in rupees (or)
Monthly arrivals of chickpea in Qtls. (or)
Monthly prices of chickpea in rupees per quintal
T = Time(s) in years
a = Constant(s)
b = Trend coefficient (s)
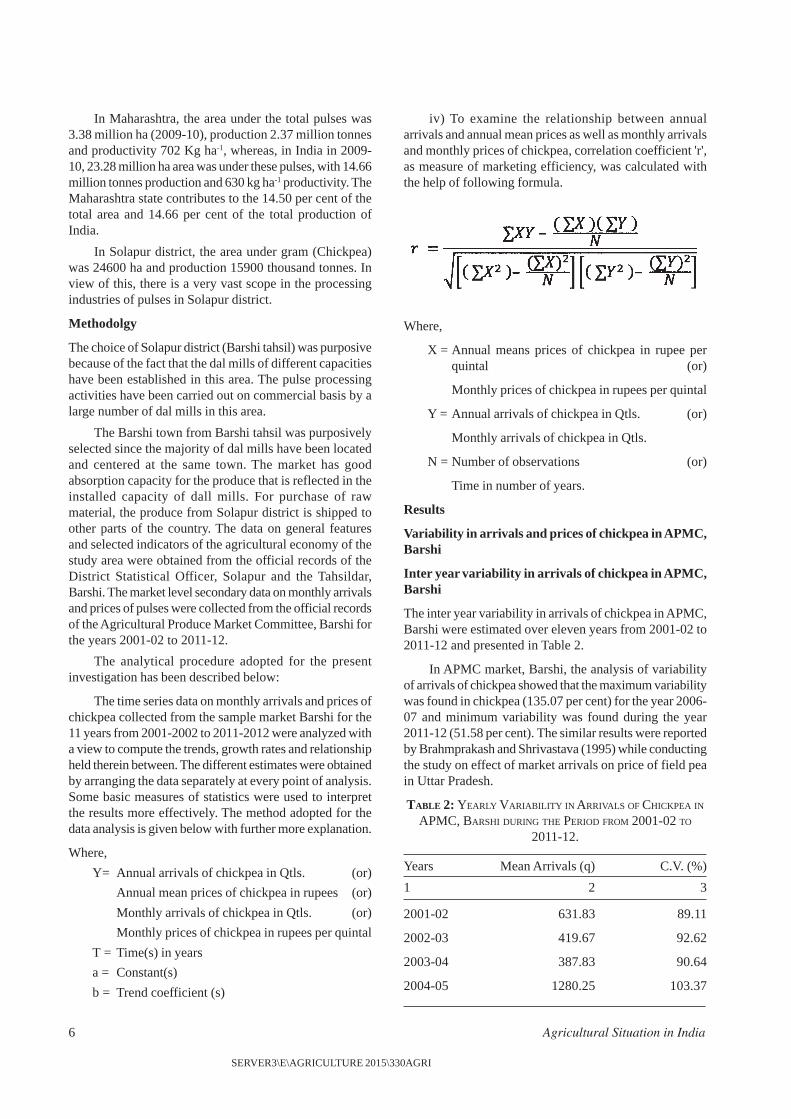
iv) To examine the relationship between annualarrivals and annual mean prices as well as monthly arrivalsand monthly prices of chickpea, correlation coefficient 'r',as measure of marketing efficiency, was calculated withthe help of following formula.
Where,
X = Annual means prices of chickpea in rupee perquintal (or)
Monthly prices of chickpea in rupees per quintal
Y = Annual arrivals of chickpea in Qtls. (or)
Monthly arrivals of chickpea in Qtls.
N = Number of observations (or)
Time in number of years.
Results
Variability in arrivals and prices of chickpea in APMC,Barshi
Inter year variability in arrivals of chickpea in APMC,Barshi
The inter year variability in arrivals of chickpea in APMC,Barshi were estimated over eleven years from 2001-02 to2011-12 and presented in Table 2.
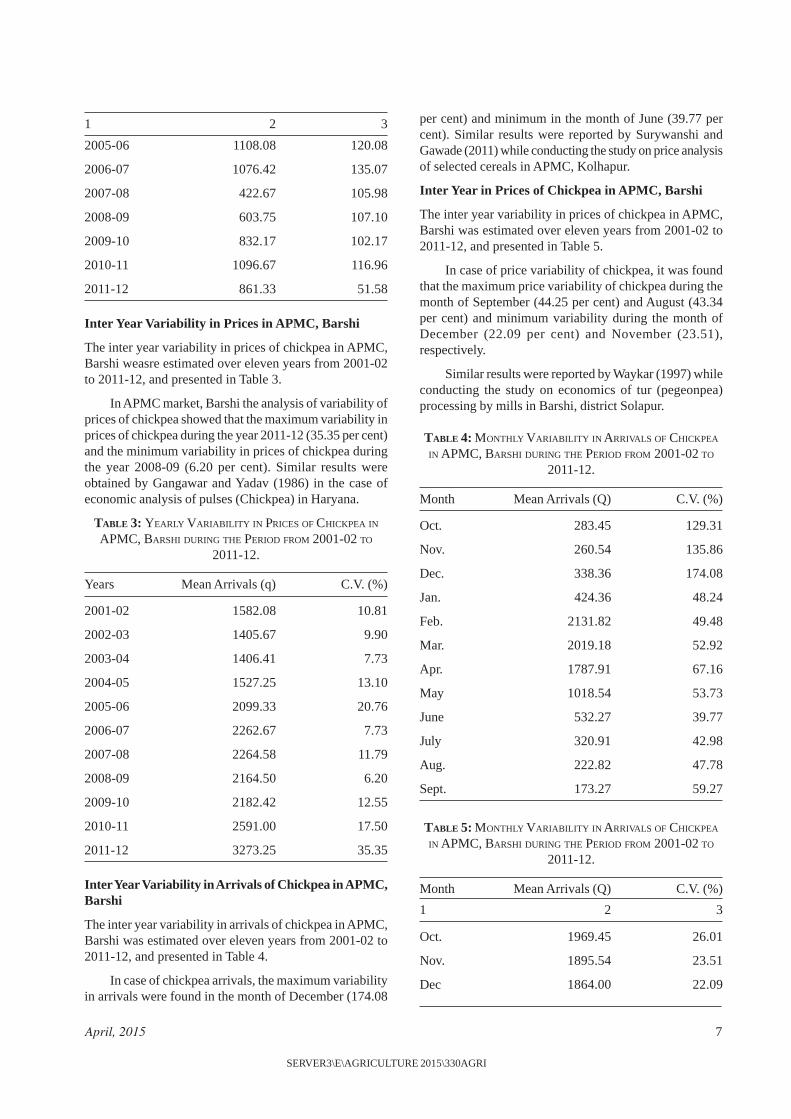
In APMC market, Barshi, the analysis of variabilityof arrivals of chickpea showed that the maximum variabilitywas found in chickpea (135.07 per cent) for the year 2006-07 and minimum variability was found during the year2011-12 (51.58 per cent). The similar results were reportedby Brahmprakash and Shrivastava (1995) while conductingthe study on effect of market arrivals on price of field peain Uttar Pradesh.
TABLE 2: YEARLY VARIABILITY IN ARRIVALS OF CHICKPEA INAPMC, BARSHI DURING THE PERIOD FROM 2001-02 TO
2011-12.
Years Mean Arrivals (q) C.V. (%)
1 2 3
2001-02 631.83 89.11
2002-03 419.67 92.62
2003-04 387.83 90.64
2004-05 1280.25 103.37
April, 2015 7
SERVER3\E\AGRICULTURE 2015\330AGRI
2005-06 1108.08 120.08
2006-07 1076.42 135.07
2007-08 422.67 105.98
2008-09 603.75 107.10
2009-10 832.17 102.17
2010-11 1096.67 116.96
2011-12 861.33 51.58
Inter Year Variability in Prices in APMC, Barshi
The inter year variability in prices of chickpea in APMC,Barshi weasre estimated over eleven years from 2001-02to 2011-12, and presented in Table 3.
In APMC market, Barshi the analysis of variability ofprices of chickpea showed that the maximum variability inprices of chickpea during the year 2011-12 (35.35 per cent)and the minimum variability in prices of chickpea duringthe year 2008-09 (6.20 per cent). Similar results wereobtained by Gangawar and Yadav (1986) in the case ofeconomic analysis of pulses (Chickpea) in Haryana.
TABLE 3: YEARLY VARIABILITY IN PRICES OF CHICKPEA INAPMC, BARSHI DURING THE PERIOD FROM 2001-02 TO
2011-12.
Years Mean Arrivals (q) C.V. (%)
2001-02 1582.08 10.81
2002-03 1405.67 9.90
2003-04 1406.41 7.73
2004-05 1527.25 13.10
2005-06 2099.33 20.76
2006-07 2262.67 7.73
2007-08 2264.58 11.79
2008-09 2164.50 6.20
2009-10 2182.42 12.55
2010-11 2591.00 17.50
2011-12 3273.25 35.35
Inter Year Variability in Arrivals of Chickpea in APMC,Barshi
The inter year variability in arrivals of chickpea in APMC,Barshi was estimated over eleven years from 2001-02 to2011-12, and presented in Table 4.
In case of chickpea arrivals, the maximum variabilityin arrivals were found in the month of December (174.08
per cent) and minimum in the month of June (39.77 percent). Similar results were reported by Surywanshi andGawade (2011) while conducting the study on price analysisof selected cereals in APMC, Kolhapur.
Inter Year in Prices of Chickpea in APMC, Barshi
The inter year variability in prices of chickpea in APMC,Barshi was estimated over eleven years from 2001-02 to2011-12, and presented in Table 5.
In case of price variability of chickpea, it was foundthat the maximum price variability of chickpea during themonth of September (44.25 per cent) and August (43.34per cent) and minimum variability during the month ofDecember (22.09 per cent) and November (23.51),respectively.
Similar results were reported by Waykar (1997) whileconducting the study on economics of tur (pegeonpea)processing by mills in Barshi, district Solapur.
TABLE 4: MONTHLY VARIABILITY IN ARRIVALS OF CHICKPEA
IN APMC, BARSHI DURING THE PERIOD FROM 2001-02 TO
2011-12.
Month Mean Arrivals (Q) C.V. (%)
Oct. 283.45 129.31
Nov. 260.54 135.86
Dec. 338.36 174.08
Jan. 424.36 48.24
Feb. 2131.82 49.48
Mar. 2019.18 52.92
Apr. 1787.91 67.16
May 1018.54 53.73
June 532.27 39.77
July 320.91 42.98
Aug. 222.82 47.78
Sept. 173.27 59.27
TABLE 5: MONTHLY VARIABILITY IN ARRIVALS OF CHICKPEA
IN APMC, BARSHI DURING THE PERIOD FROM 2001-02 TO
2011-12.
Month Mean Arrivals (Q) C.V. (%)
1 2 3
Oct. 1969.45 26.01
Nov. 1895.54 23.51
Dec 1864.00 22.09
1 2 3
8 Agricultural Situation in India
SERVER3\E\AGRICULTURE 2015\330AGRI
Jan. 1997.00 33.67
Feb. 2097.82 27.15
Mar. 2106.54 31.14
Apr. 2026.09 27.46
May 2139.82 30.46
June 1883.45 36.56
July 2264.27 38.26
Aug. 2263.91 43.34
Sept. 2320.27 44.25
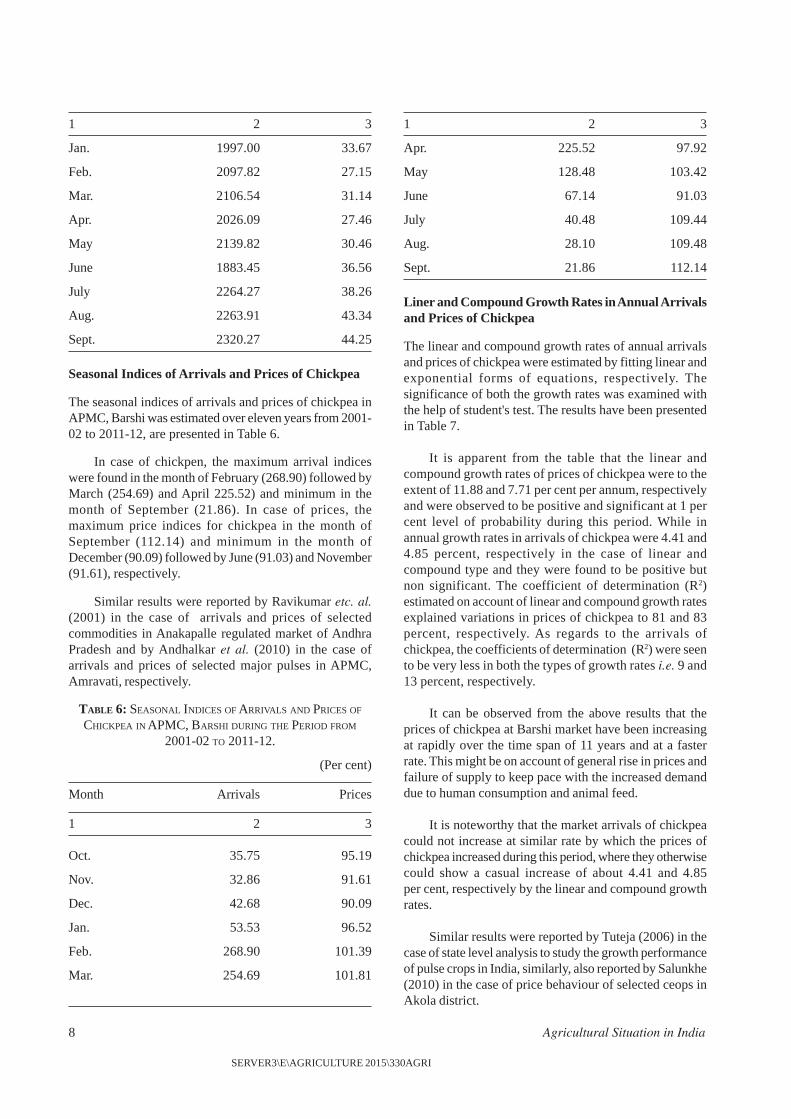
Seasonal Indices of Arrivals and Prices of Chickpea
The seasonal indices of arrivals and prices of chickpea inAPMC, Barshi was estimated over eleven years from 2001-02 to 2011-12, are presented in Table 6.
In case of chickpen, the maximum arrival indiceswere found in the month of February (268.90) followed byMarch (254.69) and April 225.52) and minimum in themonth of September (21.86). In case of prices, themaximum price indices for chickpea in the month ofSeptember (112.14) and minimum in the month ofDecember (90.09) followed by June (91.03) and November(91.61), respectively.
Similar results were reported by Ravikumar etc. al.(2001) in the case of arrivals and prices of selectedcommodities in Anakapalle regulated market of AndhraPradesh and by Andhalkar et al. (2010) in the case ofarrivals and prices of selected major pulses in APMC,Amravati, respectively.
TABLE 6: SEASONAL INDICES OF ARRIVALS AND PRICES OF
CHICKPEA IN APMC, BARSHI DURING THE PERIOD FROM
2001-02 TO 2011-12.
(Per cent)
Month Arrivals Prices
1 2 3
Oct. 35.75 95.19
Nov. 32.86 91.61
Dec. 42.68 90.09
Jan. 53.53 96.52
Feb. 268.90 101.39
Mar. 254.69 101.81
Apr. 225.52 97.92
May 128.48 103.42
June 67.14 91.03
July 40.48 109.44
Aug. 28.10 109.48
Sept. 21.86 112.14
Liner and Compound Growth Rates in Annual Arrivalsand Prices of Chickpea
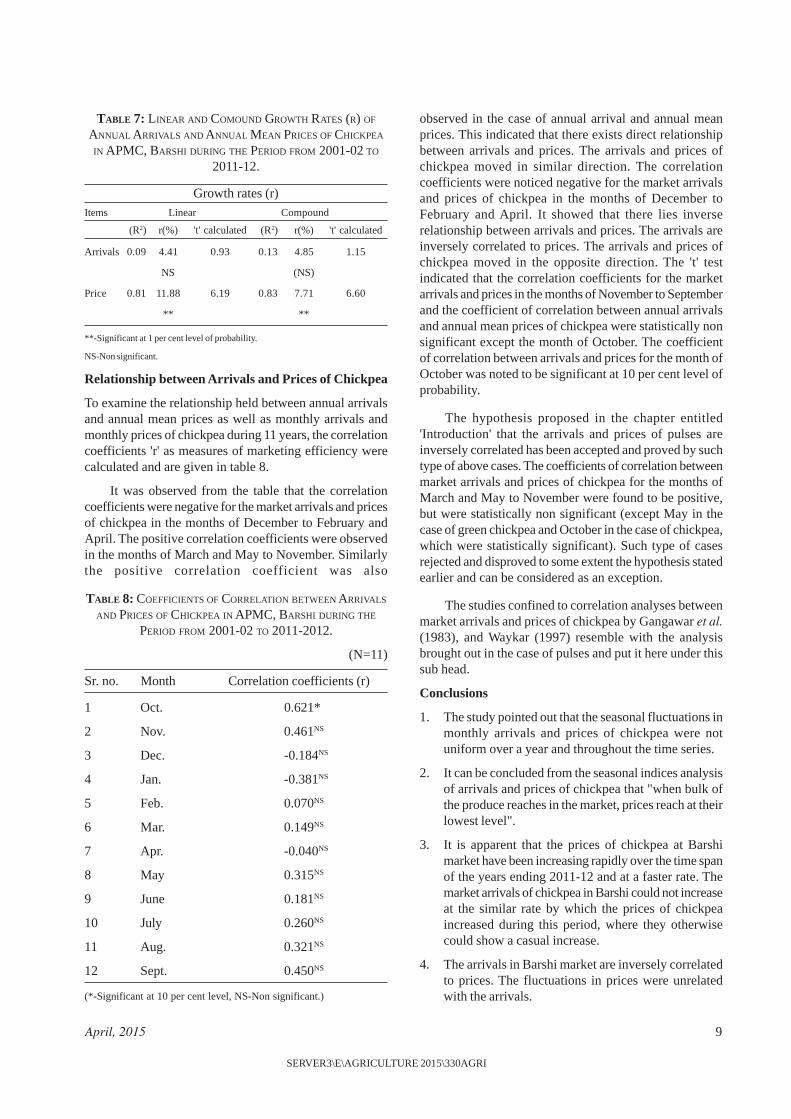
The linear and compound growth rates of annual arrivalsand prices of chickpea were estimated by fitting linear andexponential forms of equations, respectively. Thesignificance of both the growth rates was examined withthe help of student's test. The results have been presentedin Table 7.
It is apparent from the table that the linear andcompound growth rates of prices of chickpea were to theextent of 11.88 and 7.71 per cent per annum, respectivelyand were observed to be positive and significant at 1 percent level of probability during this period. While inannual growth rates in arrivals of chickpea were 4.41 and4.85 percent, respectively in the case of linear andcompound type and they were found to be positive butnon significant. The coefficient of determination (R2)estimated on account of linear and compound growth ratesexplained variations in prices of chickpea to 81 and 83percent, respectively. As regards to the arrivals ofchickpea, the coefficients of determination (R2) were seento be very less in both the types of growth rates i.e. 9 and13 percent, respectively.
It can be observed from the above results that theprices of chickpea at Barshi market have been increasingat rapidly over the time span of 11 years and at a fasterrate. This might be on account of general rise in prices andfailure of supply to keep pace with the increased demanddue to human consumption and animal feed.
It is noteworthy that the market arrivals of chickpeacould not increase at similar rate by which the prices ofchickpea increased during this period, where they otherwisecould show a casual increase of about 4.41 and 4.85per cent, respectively by the linear and compound growthrates.
Similar results were reported by Tuteja (2006) in thecase of state level analysis to study the growth performanceof pulse crops in India, similarly, also reported by Salunkhe(2010) in the case of price behaviour of selected ceops inAkola district.
1 2 3 1 2 3
April, 2015 9
SERVER3\E\AGRICULTURE 2015\330AGRI
TABLE 7: LINEAR AND COMOUND GROWTH RATES (R) OF
ANNUAL ARRIVALS AND ANNUAL MEAN PRICES OF CHICKPEA
IN APMC, BARSHI DURING THE PERIOD FROM 2001-02 TO
2011-12.
Growth rates (r)Items Linear Compound
(R2) r(%) 't' calculated (R2) r(%) 't' calculated
Arrivals 0.09 4.41 0.93 0.13 4.85 1.15
NS (NS)
Price 0.81 11.88 6.19 0.83 7.71 6.60
** **
**-Significant at 1 per cent level of probability.
NS-Non significant.
Relationship between Arrivals and Prices of Chickpea
To examine the relationship held between annual arrivalsand annual mean prices as well as monthly arrivals andmonthly prices of chickpea during 11 years, the correlationcoefficients 'r' as measures of marketing efficiency werecalculated and are given in table 8.
It was observed from the table that the correlationcoefficients were negative for the market arrivals and pricesof chickpea in the months of December to February andApril. The positive correlation coefficients were observedin the months of March and May to November. Similarlythe positive correlation coefficient was also
TABLE 8: COEFFICIENTS OF CORRELATION BETWEEN ARRIVALS
AND PRICES OF CHICKPEA IN APMC, BARSHI DURING THE
PERIOD FROM 2001-02 TO 2011-2012.
(N=11)
Sr. no. Month Correlation coefficients (r)
1 Oct. 0.621*
2 Nov. 0.461NS
3 Dec. -0.184NS
4 Jan. -0.381NS
5 Feb. 0.070NS
6 Mar. 0.149NS
7 Apr. -0.040NS
8 May 0.315NS
9 June 0.181NS
10 July 0.260NS
11 Aug. 0.321NS
12 Sept. 0.450NS
(*-Significant at 10 per cent level, NS-Non significant.)
observed in the case of annual arrival and annual meanprices. This indicated that there exists direct relationshipbetween arrivals and prices. The arrivals and prices ofchickpea moved in similar direction. The correlationcoefficients were noticed negative for the market arrivalsand prices of chickpea in the months of December toFebruary and April. It showed that there lies inverserelationship between arrivals and prices. The arrivals areinversely correlated to prices. The arrivals and prices ofchickpea moved in the opposite direction. The 't' testindicated that the correlation coefficients for the marketarrivals and prices in the months of November to Septemberand the coefficient of correlation between annual arrivalsand annual mean prices of chickpea were statistically nonsignificant except the month of October. The coefficientof correlation between arrivals and prices for the month ofOctober was noted to be significant at 10 per cent level ofprobability.
The hypothesis proposed in the chapter entitled'Introduction' that the arrivals and prices of pulses areinversely correlated has been accepted and proved by suchtype of above cases. The coefficients of correlation betweenmarket arrivals and prices of chickpea for the months ofMarch and May to November were found to be positive,but were statistically non significant (except May in thecase of green chickpea and October in the case of chickpea,which were statistically significant). Such type of casesrejected and disproved to some extent the hypothesis statedearlier and can be considered as an exception.
The studies confined to correlation analyses betweenmarket arrivals and prices of chickpea by Gangawar et al.(1983), and Waykar (1997) resemble with the analysisbrought out in the case of pulses and put it here under thissub head.
Conclusions
1. The study pointed out that the seasonal fluctuations inmonthly arrivals and prices of chickpea were notuniform over a year and throughout the time series.
2. It can be concluded from the seasonal indices analysisof arrivals and prices of chickpea that "when bulk ofthe produce reaches in the market, prices reach at theirlowest level".
3. It is apparent that the prices of chickpea at Barshimarket have been increasing rapidly over the time spanof the years ending 2011-12 and at a faster rate. Themarket arrivals of chickpea in Barshi could not increaseat the similar rate by which the prices of chickpeaincreased during this period, where they otherwisecould show a casual increase.
4. The arrivals in Barshi market are inversely correlatedto prices. The fluctuations in prices were unrelatedwith the arrivals.
10 Agricultural Situation in India
SERVER3\E\AGRICULTURE 2015\330AGRI
Andhalkar, G.K., D.H. Ulemale, N.P. Tayde and S.U.Mokhale (2010). Arrival and Prices of majorpulses in selected A.P.M.C's. in AmravatiDistrict, International Res. Journal of Agril.Econ. And Stat. 2(1)126.
Brahmaprakash and S. Shrivastava (1995). Effect of marketarrivals on price of field pea in Uttar Pradesh.Bihar Journal of Agriculture Marketing.3(3): 49-54.
Gangawar, A.C., K.N. Rai and Shri Niwas. (1983).Production and marketing of gram inHaryana. Publication of Deptt. of Agril.Ecom., HAU, Hisar. Research BulletinNo. 10, pp. 1—53.
Gangawar, A.C. and Ajit Yadav. (1986). Economic analysisof pulses (Chickpea) in Haryana state.Publication of Deptt. of Agril. Ecom. HAU,Hissar, Research Bulletin: 223—225.
Ravikumar, K.N., K. Sreelakshmi and V.T. Raju (2001):Trends in arrivals and prices of selectedcommodities in Anakapalle regulated marketof A.P. Agricultural Marketing, 43(4): 26—34.
Salunkhe, A.A. (2010). Price behavior and price forecastingof selected crop of Akola District, Unpub.M.Sc. (Agri.) Thesis submitted to Dr.P.D.K.V., Akola.
Suryawanshi, R. R. and B. B. Gawade (2011). Price analysisof selected cereals iun APMC, Kolhapur, AReport of research work done by theDepartment of Agricultural Economics,MPKV Rahuri, pp. 99—108.
Tuteja Usha (2006). Growth performance and acreageresponse of pulse crop: A State level analysis.Indian Journal of Agricultural Econ. 61(2):218—237.
Waykar, K.R. (1997). Economics of tur processing by millsin Barshi, District Solapur. AgriculturalEconomics Research Review 11(1): 88—90.
REFERENCES
April, 2015 11
SERVER3\E\AGRICULTURE 2015\330AGRI
Abstract
The present study was conducted in Bikaner region ofRajasthan. All the four district, viz. Srigaganagar,'Hanumangarh, Bikaner and Churu of Bikaner region wereselected for the present study. A lead bank from eachselected district was selected for financial analysis. Thirtyborrower and Thirty non-borrower farmers from eachselected district were chosen for collection of primary data.The analysis revealed that the repayment performance wasfound higher on small farmers in the study area. Therepayment performance was highest for the farmers ofSriganganagar and lowest for the farmers of Churu district.The overdues amount was estimated at `12989.84 for thefarmers of Sriganganagar district and ` 63647.57 for thefarmers of Churu district. In case of overdues, an increasingtrend was observed for the borrower farmer of all districtof Bikaner regions. Overall, the range of overdues by theborrower farmers of the study area varied from 13.54 to34.02 per cent.
Introduction
Agriculture has got a prime role in Indian economy. It holdsthe key to rapid economic development because of its siz,potentially and capacity to transform the entire outlook ofthe economy. The share of agriculture in GDP was 14.2per cent during 2011-12. This sector is the single largestemployer which provides employments to about 61 percentof India's work force. In order to meet the growing needsof the expanding population, it compelled to produce morethan 200 million tonnes of food grain per year.Modernization of traditional farming system is necessaryto improve agriculture productivity which is essential foreconomic growth of a developing nation like India. Inmodern system, agricultural credit is an important inputfor acquiring other farm inputs like HYV seeds, fertilizers,insecticides, pesticides, irrigation water etc., andinstitutional finance has a greater role to play in a countrylike India where the majority of the farmers are unable togenerate enough farm surpulses and re-invest due to theirlow level of income. Moreover, introduction of moderntechnology in agriculture has led to intensive use of inputs;resulting manifold increase in the requirement ofagricultural credit. Moreover, institutional credit plays animportant role to free the agricultural sector from their
growing depedence on unorgarnized sector. But therecovery of agricultural advances is a critical task.Repayment not only ensures recycling of public funds fordevelopment but also builds up confidence of the creditinstitutions in their group. The viability of effectiveperformance of the financial institutional can be judgedonly when they repay their loans as per repayment schedulesfixed by the credit agencies. Recovery performance is ameasure of operational efficiency and managerialcompetence of financial institutions. The problem of non-recovery of loan in a very serious problem for any publicsector credit institution and recovery of agriculturaladvances is a critical task. This makes it imperative to studythe repayment performance of borrower farmers and theiroverdues of short term credit.
Methodoly
The present study was conducted in Bikaner region ofRajastha. All four districts namely Sriganganagar,Hanumangarh, Bikanagr and Churu district of Bikanerregion were selected for the study. A lead bank of eachdistrict of Bikaner region was selected purposiverly forcollection of secondary data such as agricultural loanadvanced for various purposes, amount repaid andoverdues. The Oriental Bank of Commerce forSriganganagr, State Bank of Bikaner and Jaipur forHanumangarh and Bikaner districts and Bank of Churudistrict were selected.One tehsil from each district of theregion namely, Raisingnagar from Sriganganagar, Pillibanafrom Hanumangarh, Nokha from Bikaner and Sardarsaharfrom Churu district was selected on the basis of highestamount of agricultural loan was advanced to the farmers.Further, on the basis of highest amount of the loanadvanced, one branch of the selected lead bank was selectedfrom the selected tehsil, on the basis of highest amount ofthe agricultural loan advanced to the farmers, two villageswere selected from each selected branch of bank. Thus,total eight villages were selected from the entire region forfurther sampling in order to select the borrower farmers, acomprehensive list of all borrowers farmers of the selectedvillages collected from the records of the respective selectedbranch alongwith the advance made during the agriculturalyear 2011-12 (July 2011 to June 2012) was prepared andon the basis of their land holdings all the borrowers farmerswere categorized in three standard groups viz. small,
Repayment Performance of Borrower and Overdues of Short term Agricultural Credit inBikaner Region of Rajasthan
RAJU KUMAWAT* AND N.K. SINGH**
*Ph.D. Scholar and** Professor and Head, Department of Agricultural Economics, College of Agriculture, SKRAU, Bikaner.
12 Agricultural Situation in India
SERVER3\E\AGRICULTURE 2015\330AGRI
medium and large farms by using cumulative total method.The average size of land holding of each district of Bikanerregion was recorded as:
Sriganganar: Small (2.12 ha), medium (4.07 ha.) andlarge (7.35 ha.)
Hanumangarh: Small (1.57 ha.), medium (3.35 ha.)and large (9.11 ha.)
Bikaner: Small (3.80 ha.), medium (6.43 ha.) and(11.15ha.)
Churu: Small (4.21 ha.), medium (10.80 ha.) and large(21.30 ha.)
Thirty borrower farmers representing different sizegroups was selected randomly from two selected villagesof each branch in probability proportion to the total numberof borrower farmers available in each size group. Thus,total 120 borrower farmers from entire region of theBikaner were selected as sample. The data regardingrepayment of loan was collected from the respectivebranches of the bank from where laon was advanced to theborrower farmers upto June, 2014 and collected data wereanalysed by tabule method. The repayment performanceand extend of overdues were calculated as:
Amount repaidRepayment performance (%) = x 100
Amount due for repayment
Amount overdueExtent of overdues (%) = x 100
Amount due for repayment
Result and Discussion
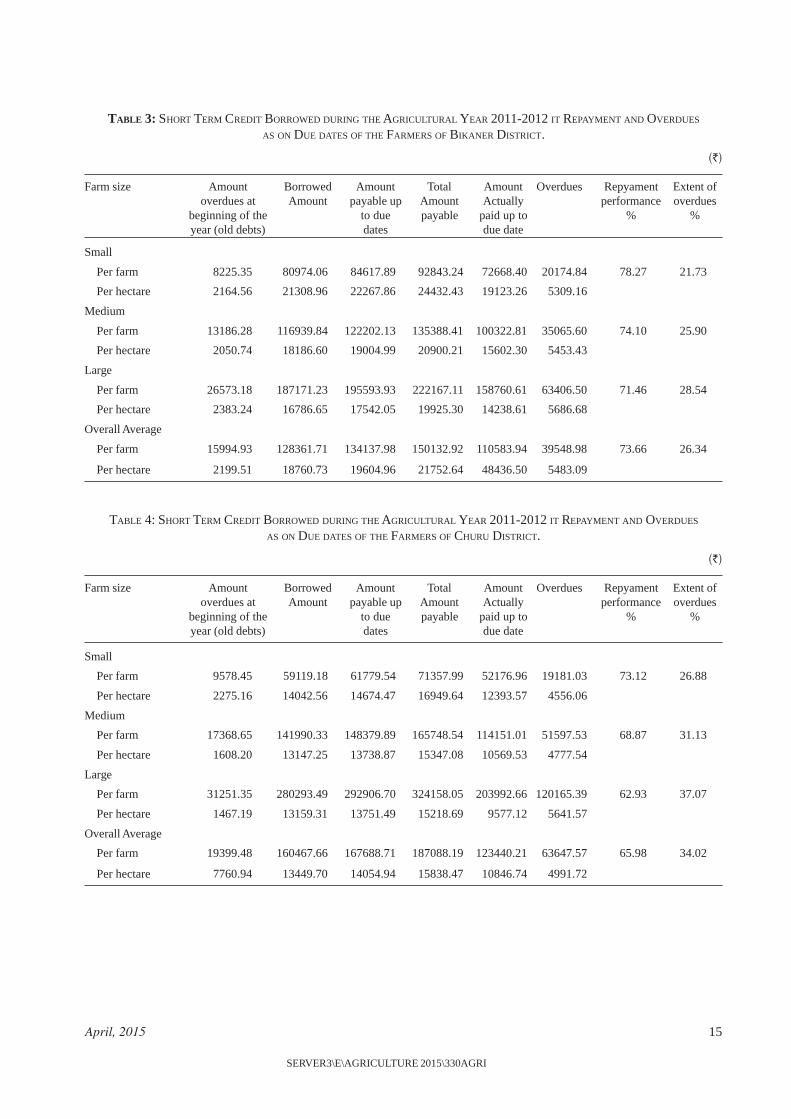
The repayment performance of the borrower farmers ofthe study area was measures in term of percent of amountrepaid repaid to the amount due for repayment in the givenperiod. The total amount of loan due for repayment includedthe old debt, principal amount and the interest. The payableamount of loan, unpaid amount up to the due date, wereconsidered as the amount of over dues. The extent of overdues was measured as the ratio of amount over dues to theamount of the loan due for repayment and expressed interm of percentage. Amount rapid up to the due date andamount overdues of the borrowed farmers were recordedfrom the selected branch of the bank for agriciltural year2011-12 and presented in table 1 to 4 (see appendix).
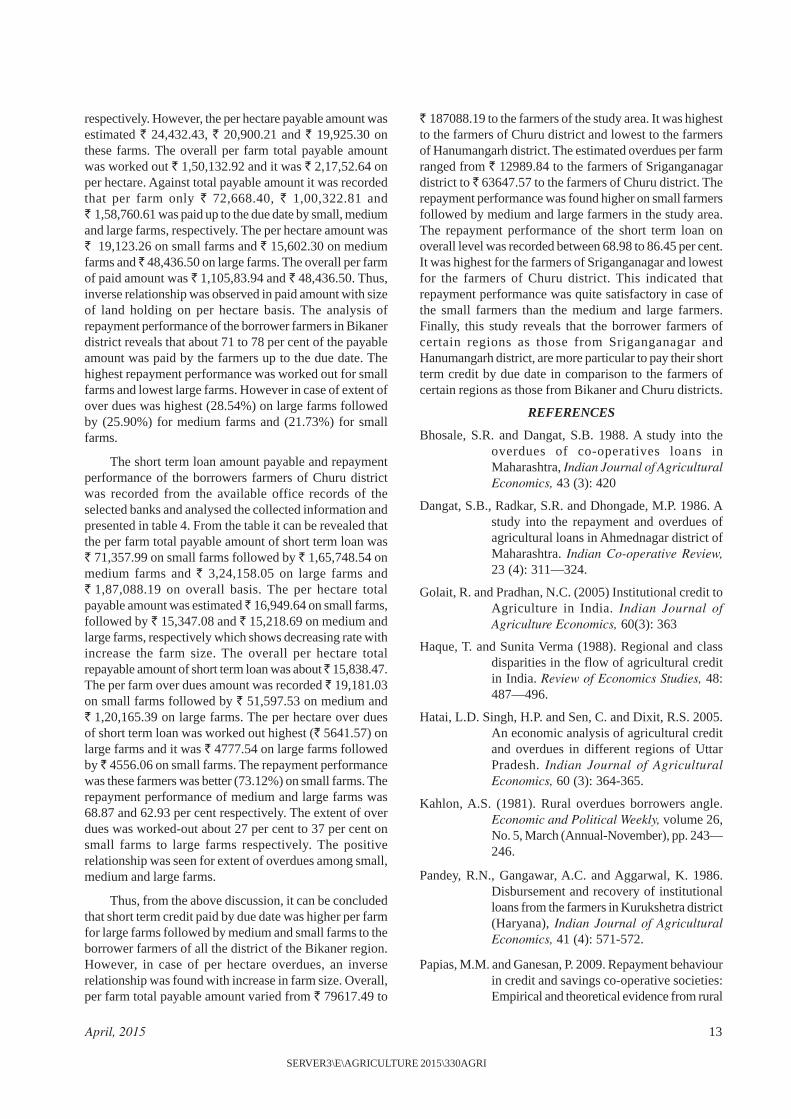
The amount of the short term loan to be payable, overdues and repayment performance of the borrower farmersof Sriganganagar district is presented in table 1. The totalper farm payable amount was highest ` 1,34,342.22 onlarge farmers and lowest (` 46,844.11) on small farmersand it was ` 72,178.29 on medium farmers. However, theper hectare payable amount was ` 18,277.85 on largefarmers and it was highest (` 22,096.27) on small farm
and this amount was ` 17,734.22 on medium farm. Theoverall per farm total repayable amount was ` 84,455.87and the per hectare, it was ` 19,369.44. This shows thattotal payable amount was positive associated with theincreasing the size of land holding. In case of over dues oftotal payable amount was also found positive relationshipwith increasing in size of land holding. The amount of overdues was ̀ 4,084.81 ̀ 9,722.43 and ̀ 25,162.30 on small,medium and large farms, respectively. The same trend wasalso observed on per hectare over dues amount. It wasvaried from ` 1,926.79 on small farms and ` 3,423.44 onlarge farms. The repayment performance of short term loanprovided to the farmers was 91.28 per cent on small farmsfollwed by 86.53 per cent on medium farms and 81.27 percent on large farms. This shows that the small farmers werevery particular in repayment of the short term loan with inthe stipulated period in comparison to medium and largefarms. The extent of over dues was work-out 8.72 per centon small farmers and 18.73 per cent on large farmers. Theextent of overdues on medium farms was 13.47 per cent.
The table 2 shows that the overall average per farmshort term credit repayable to the banks by the borrower ofHanumangarh district was ` 79,617.49 this included olddebt and amount taken during the year 2011-12 withinterest. Out of which ` 65,187.64 was repaid by due dateand reaming ̀ 14,429.84 stood as over dues. The per farmrepayable amount for small, medium and large farmers was` 32,445.93, 61378.56 and ̀ 1,45,027.98, respectively. Thepercentage of amout repaid (repayment performance) bythese farmers was estimated at 93.32 per cent, 89.12 and76.25 per cent, respectively. Obviously, the extent of overdues in per cent against these borrower farmers as 6.68,10.88 and 23.75 per cent in that order. The extent of overdues was positively associated with the increasing of sizeof holding. The per hectare average of short term creditrepayable by due date was worked-out ` 20,666.19,` 18,321.95 and ` 15,919.64 for small, medium and largefarms, respectively. As against this, the amount repaymentby these farmers was ` 19,285.69, ` 16,328.52 and` 12,138.72. The share of over dues for small, mediumand large farms borrower farmers was ̀ 1380.50, ̀ 1993.42and ` 3780.91. The overall per hectare average repayableamount of short term credit was ` 18,302.59 of which` 15,917.64 was repaid by due date and remaining` 2,384.94 was over dues. This shows that the similar trend(increasing trend with increasing the size of holding) wasof over dues on per hectare land holding as per farm overdues. The repayment performance decreasing with theincreasing in the size of holding of the farmers. Similarlythe extent of over dues was 6.68 per cent to 23.75 per centfrom small to large farms.
Table 3 reveals that the total per farm payable amountby due date of the borrower farmers selected in Bikanerdistrict was ` 92843.24 on small farms followed by` 1,35,388.41 and ̀ 2,22,167.11 on medium and large farm,
April, 2015 13
SERVER3\E\AGRICULTURE 2015\330AGRI
respectively. However, the per hectare payable amount wasestimated ` 24,432.43, ` 20,900.21 and ` 19,925.30 onthese farms. The overall per farm total payable amountwas worked out ` 1,50,132.92 and it was ` 2,17,52.64 onper hectare. Against total payable amount it was recordedthat per farm only ` 72,668.40, ` 1,00,322.81 and` 1,58,760.61 was paid up to the due date by small, mediumand large farms, respectively. The per hectare amount was` 19,123.26 on small farms and ` 15,602.30 on mediumfarms and ̀ 48,436.50 on large farms. The overall per farmof paid amount was ` 1,105,83.94 and ` 48,436.50. Thus,inverse relationship was observed in paid amount with sizeof land holding on per hectare basis. The analysis ofrepayment performance of the borrower farmers in Bikanerdistrict reveals that about 71 to 78 per cent of the payableamount was paid by the farmers up to the due date. Thehighest repayment performance was worked out for smallfarms and lowest large farms. However in case of extent ofover dues was highest (28.54%) on large farms followedby (25.90%) for medium farms and (21.73%) for smallfarms.
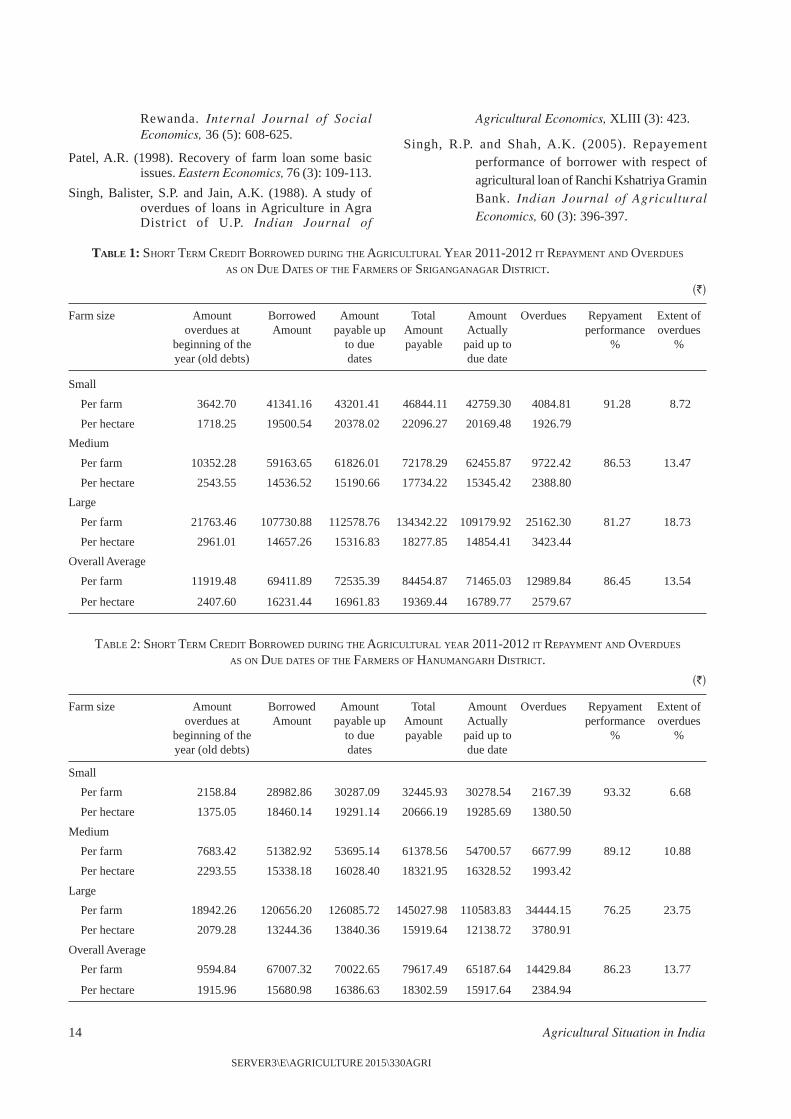
The short term loan amount payable and repaymentperformance of the borrowers farmers of Churu districtwas recorded from the available office records of theselected banks and analysed the collected information andpresented in table 4. From the table it can be revealed thatthe per farm total payable amount of short term loan was` 71,357.99 on small farms followed by ` 1,65,748.54 onmedium farms and ` 3,24,158.05 on large farms and` 1,87,088.19 on overall basis. The per hectare totalpayable amount was estimated ̀ 16,949.64 on small farms,followed by ` 15,347.08 and ` 15,218.69 on medium andlarge farms, respectively which shows decreasing rate withincrease the farm size. The overall per hectare totalrepayable amount of short term loan was about ̀ 15,838.47.The per farm over dues amount was recorded ` 19,181.03on small farms followed by ` 51,597.53 on medium and` 1,20,165.39 on large farms. The per hectare over duesof short term loan was worked out highest (` 5641.57) onlarge farms and it was ` 4777.54 on large farms followedby ̀ 4556.06 on small farms. The repayment performancewas these farmers was better (73.12%) on small farms. Therepayment performance of medium and large farms was68.87 and 62.93 per cent respectively. The extent of overdues was worked-out about 27 per cent to 37 per cent onsmall farms to large farms respectively. The positiverelationship was seen for extent of overdues among small,medium and large farms.
Thus, from the above discussion, it can be concludedthat short term credit paid by due date was higher per farmfor large farms followed by medium and small farms to theborrower farmers of all the district of the Bikaner region.However, in case of per hectare overdues, an inverserelationship was found with increase in farm size. Overall,per farm total payable amount varied from ` 79617.49 to
` 187088.19 to the farmers of the study area. It was highestto the farmers of Churu district and lowest to the farmersof Hanumangarh district. The estimated overdues per farmranged from ` 12989.84 to the farmers of Sriganganagardistrict to ̀ 63647.57 to the farmers of Churu district. Therepayment performance was found higher on small farmersfollowed by medium and large farmers in the study area.The repayment performance of the short term loan onoverall level was recorded between 68.98 to 86.45 per cent.It was highest for the farmers of Sriganganagar and lowestfor the farmers of Churu district. This indicated thatrepayment performance was quite satisfactory in case ofthe small farmers than the medium and large farmers.Finally, this study reveals that the borrower farmers ofcertain regions as those from Sriganganagar andHanumangarh district, are more particular to pay their shortterm credit by due date in comparison to the farmers ofcertain regions as those from Bikaner and Churu districts.
REFERENCES
Bhosale, S.R. and Dangat, S.B. 1988. A study into theoverdues of co-operatives loans inMaharashtra, Indian Journal of AgriculturalEconomics, 43 (3): 420
Dangat, S.B., Radkar, S.R. and Dhongade, M.P. 1986. Astudy into the repayment and overdues ofagricultural loans in Ahmednagar district ofMaharashtra. Indian Co-operative Review,23 (4): 311—324.
Golait, R. and Pradhan, N.C. (2005) Institutional credit toAgriculture in India. Indian Journal ofAgriculture Economics, 60(3): 363
Haque, T. and Sunita Verma (1988). Regional and classdisparities in the flow of agricultural creditin India. Review of Economics Studies, 48:487—496.
Hatai, L.D. Singh, H.P. and Sen, C. and Dixit, R.S. 2005.An economic analysis of agricultural creditand overdues in different regions of UttarPradesh. Indian Journal of AgriculturalEconomics, 60 (3): 364-365.
Kahlon, A.S. (1981). Rural overdues borrowers angle.Economic and Political Weekly, volume 26,No. 5, March (Annual-November), pp. 243—246.
Pandey, R.N., Gangawar, A.C. and Aggarwal, K. 1986.Disbursement and recovery of institutionalloans from the farmers in Kurukshetra district(Haryana), Indian Journal of AgriculturalEconomics, 41 (4): 571-572.
Papias, M.M. and Ganesan, P. 2009. Repayment behaviourin credit and savings co-operative societies:Empirical and theoretical evidence from rural
14 Agricultural Situation in India
SERVER3\E\AGRICULTURE 2015\330AGRI
Rewanda. Internal Journal of SocialEconomics, 36 (5): 608-625.
Patel, A.R. (1998). Recovery of farm loan some basicissues. Eastern Economics, 76 (3): 109-113.
Singh, Balister, S.P. and Jain, A.K. (1988). A study ofoverdues of loans in Agriculture in AgraDistrict of U.P. Indian Journal of
Agricultural Economics, XLIII (3): 423.
Singh, R.P. and Shah, A.K. (2005). Repayementperformance of borrower with respect ofagricultural loan of Ranchi Kshatriya GraminBank. Indian Journal of AgriculturalEconomics, 60 (3): 396-397.
TABLE 1: SHORT TERM CREDIT BORROWED DURING THE AGRICULTURAL YEAR 2011-2012 IT REPAYMENT AND OVERDUES
AS ON DUE DATES OF THE FARMERS OF SRIGANGANAGAR DISTRICT.
(`)
Farm size Amount Borrowed Amount Total Amount Overdues Repyament Extent ofoverdues at Amount payable up Amount Actually performance overdues
beginning of the to due payable paid up to % %year (old debts) dates due date
Small
Per farm 3642.70 41341.16 43201.41 46844.11 42759.30 4084.81 91.28 8.72
Per hectare 1718.25 19500.54 20378.02 22096.27 20169.48 1926.79
Medium
Per farm 10352.28 59163.65 61826.01 72178.29 62455.87 9722.42 86.53 13.47
Per hectare 2543.55 14536.52 15190.66 17734.22 15345.42 2388.80
Large
Per farm 21763.46 107730.88 112578.76 134342.22 109179.92 25162.30 81.27 18.73
Per hectare 2961.01 14657.26 15316.83 18277.85 14854.41 3423.44
Overall Average
Per farm 11919.48 69411.89 72535.39 84454.87 71465.03 12989.84 86.45 13.54
Per hectare 2407.60 16231.44 16961.83 19369.44 16789.77 2579.67
TABLE 2: SHORT TERM CREDIT BORROWED DURING THE AGRICULTURAL YEAR 2011-2012 IT REPAYMENT AND OVERDUES
AS ON DUE DATES OF THE FARMERS OF HANUMANGARH DISTRICT.
(`)
Farm size Amount Borrowed Amount Total Amount Overdues Repyament Extent ofoverdues at Amount payable up Amount Actually performance overdues
beginning of the to due payable paid up to % %year (old debts) dates due date
Small
Per farm 2158.84 28982.86 30287.09 32445.93 30278.54 2167.39 93.32 6.68
Per hectare 1375.05 18460.14 19291.14 20666.19 19285.69 1380.50
Medium
Per farm 7683.42 51382.92 53695.14 61378.56 54700.57 6677.99 89.12 10.88
Per hectare 2293.55 15338.18 16028.40 18321.95 16328.52 1993.42
Large
Per farm 18942.26 120656.20 126085.72 145027.98 110583.83 34444.15 76.25 23.75
Per hectare 2079.28 13244.36 13840.36 15919.64 12138.72 3780.91
Overall Average
Per farm 9594.84 67007.32 70022.65 79617.49 65187.64 14429.84 86.23 13.77
Per hectare 1915.96 15680.98 16386.63 18302.59 15917.64 2384.94
April, 2015 15
SERVER3\E\AGRICULTURE 2015\330AGRI
TABLE 3: SHORT TERM CREDIT BORROWED DURING THE AGRICULTURAL YEAR 2011-2012 IT REPAYMENT AND OVERDUES
AS ON DUE DATES OF THE FARMERS OF BIKANER DISTRICT.
(`)
Farm size Amount Borrowed Amount Total Amount Overdues Repyament Extent ofoverdues at Amount payable up Amount Actually performance overdues
beginning of the to due payable paid up to % %year (old debts) dates due date
Small
Per farm 8225.35 80974.06 84617.89 92843.24 72668.40 20174.84 78.27 21.73
Per hectare 2164.56 21308.96 22267.86 24432.43 19123.26 5309.16
Medium
Per farm 13186.28 116939.84 122202.13 135388.41 100322.81 35065.60 74.10 25.90
Per hectare 2050.74 18186.60 19004.99 20900.21 15602.30 5453.43
Large
Per farm 26573.18 187171.23 195593.93 222167.11 158760.61 63406.50 71.46 28.54
Per hectare 2383.24 16786.65 17542.05 19925.30 14238.61 5686.68
Overall Average
Per farm 15994.93 128361.71 134137.98 150132.92 110583.94 39548.98 73.66 26.34
Per hectare 2199.51 18760.73 19604.96 21752.64 48436.50 5483.09
TABLE 4: SHORT TERM CREDIT BORROWED DURING THE AGRICULTURAL YEAR 2011-2012 IT REPAYMENT AND OVERDUES
AS ON DUE DATES OF THE FARMERS OF CHURU DISTRICT.
(`)
Farm size Amount Borrowed Amount Total Amount Overdues Repyament Extent ofoverdues at Amount payable up Amount Actually performance overdues
beginning of the to due payable paid up to % %year (old debts) dates due date
Small
Per farm 9578.45 59119.18 61779.54 71357.99 52176.96 19181.03 73.12 26.88
Per hectare 2275.16 14042.56 14674.47 16949.64 12393.57 4556.06
Medium
Per farm 17368.65 141990.33 148379.89 165748.54 114151.01 51597.53 68.87 31.13
Per hectare 1608.20 13147.25 13738.87 15347.08 10569.53 4777.54
Large
Per farm 31251.35 280293.49 292906.70 324158.05 203992.66 120165.39 62.93 37.07
Per hectare 1467.19 13159.31 13751.49 15218.69 9577.12 5641.57
Overall Average
Per farm 19399.48 160467.66 167688.71 187088.19 123440.21 63647.57 65.98 34.02
Per hectare 7760.94 13449.70 14054.94 15838.47 10846.74 4991.72
16 Agricultural Situation in India
SERVER3\E\AGRICULTURE 2015\330AGRI
Advertise in
GOVERNMENT OF INDIAPUBLICATIONS
For Advertisement rates and other details contract :
MINISTRY OF URBAN DEVELOPMENTDEPARTMENT OF PUBLICATIONS,
CIVIL LINES, DELHI-110 054.
Phone Nos.:2381782323817640{
April, 2015 17
SERVER3\E\AGRICULTURE 2015\330AGRI
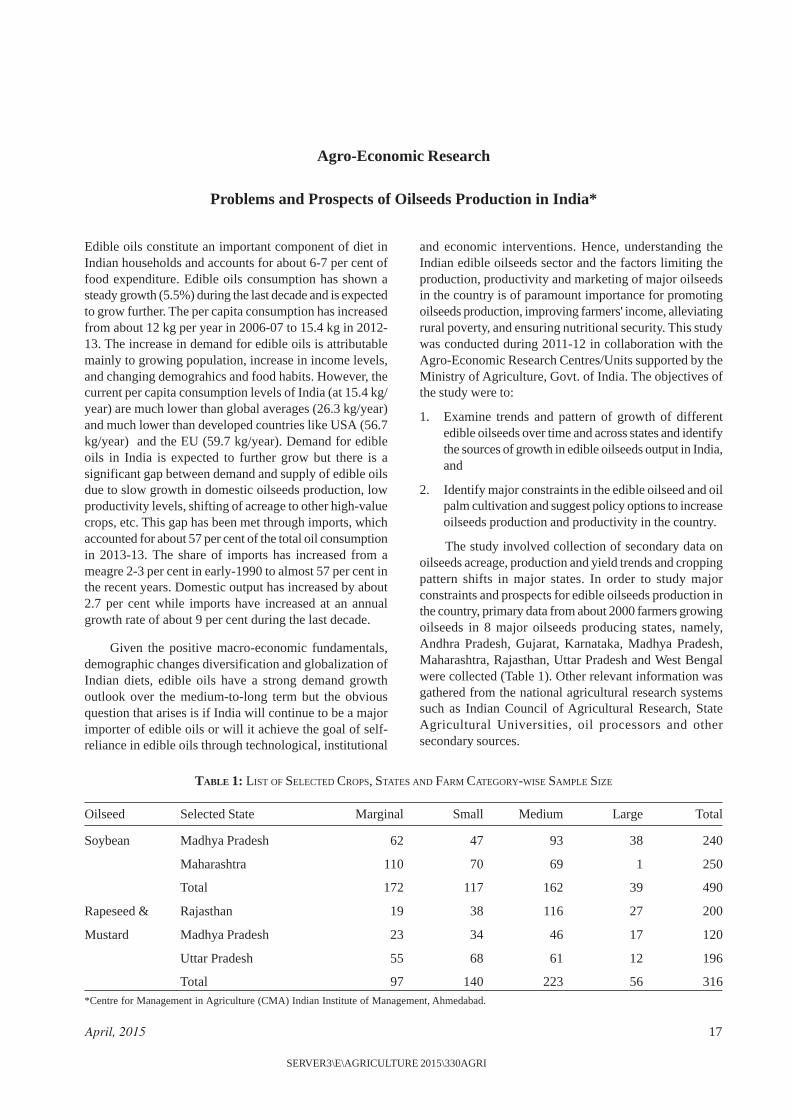
Edible oils constitute an important component of diet inIndian households and accounts for about 6-7 per cent offood expenditure. Edible oils consumption has shown asteady growth (5.5%) during the last decade and is expectedto grow further. The per capita consumption has increasedfrom about 12 kg per year in 2006-07 to 15.4 kg in 2012-13. The increase in demand for edible oils is attributablemainly to growing population, increase in income levels,and changing demograhics and food habits. However, thecurrent per capita consumption levels of India (at 15.4 kg/year) are much lower than global averages (26.3 kg/year)and much lower than developed countries like USA (56.7kg/year) and the EU (59.7 kg/year). Demand for edibleoils in India is expected to further grow but there is asignificant gap between demand and supply of edible oilsdue to slow growth in domestic oilseeds production, lowproductivity levels, shifting of acreage to other high-valuecrops, etc. This gap has been met through imports, whichaccounted for about 57 per cent of the total oil consumptionin 2013-13. The share of imports has increased from ameagre 2-3 per cent in early-1990 to almost 57 per cent inthe recent years. Domestic output has increased by about2.7 per cent while imports have increased at an annualgrowth rate of about 9 per cent during the last decade.
Given the positive macro-economic fundamentals,demographic changes diversification and globalization ofIndian diets, edible oils have a strong demand growthoutlook over the medium-to-long term but the obviousquestion that arises is if India will continue to be a majorimporter of edible oils or will it achieve the goal of self-reliance in edible oils through technological, institutional
and economic interventions. Hence, understanding theIndian edible oilseeds sector and the factors limiting theproduction, productivity and marketing of major oilseedsin the country is of paramount importance for promotingoilseeds production, improving farmers' income, alleviatingrural poverty, and ensuring nutritional security. This studywas conducted during 2011-12 in collaboration with theAgro-Economic Research Centres/Units supported by theMinistry of Agriculture, Govt. of India. The objectives ofthe study were to:
1. Examine trends and pattern of growth of differentedible oilseeds over time and across states and identifythe sources of growth in edible oilseeds output in India,and
2. Identify major constraints in the edible oilseed and oilpalm cultivation and suggest policy options to increaseoilseeds production and productivity in the country.
The study involved collection of secondary data onoilseeds acreage, production and yield trends and croppingpattern shifts in major states. In order to study majorconstraints and prospects for edible oilseeds production inthe country, primary data from about 2000 farmers growingoilseeds in 8 major oilseeds producing states, namely,Andhra Pradesh, Gujarat, Karnataka, Madhya Pradesh,Maharashtra, Rajasthan, Uttar Pradesh and West Bengalwere collected (Table 1). Other relevant information wasgathered from the national agricultural research systemssuch as Indian Council of Agricultural Research, StateAgricultural Universities, oil processors and othersecondary sources.
Agro-Economic Research
Problems and Prospects of Oilseeds Production in India*
TABLE 1: LIST OF SELECTED CROPS, STATES AND FARM CATEGORY-WISE SAMPLE SIZE
Oilseed Selected State Marginal Small Medium Large Total
Soybean Madhya Pradesh 62 47 93 38 240
Maharashtra 110 70 69 1 250
Total 172 117 162 39 490
Rapeseed & Rajasthan 19 38 116 27 200
Mustard Madhya Pradesh 23 34 46 17 120
Uttar Pradesh 55 68 61 12 196
Total 97 140 223 56 316*Centre for Management in Agriculture (CMA) Indian Institute of Management, Ahmedabad.
18 Agricultural Situation in India
SERVER3\E\AGRICULTURE 2015\330AGRI
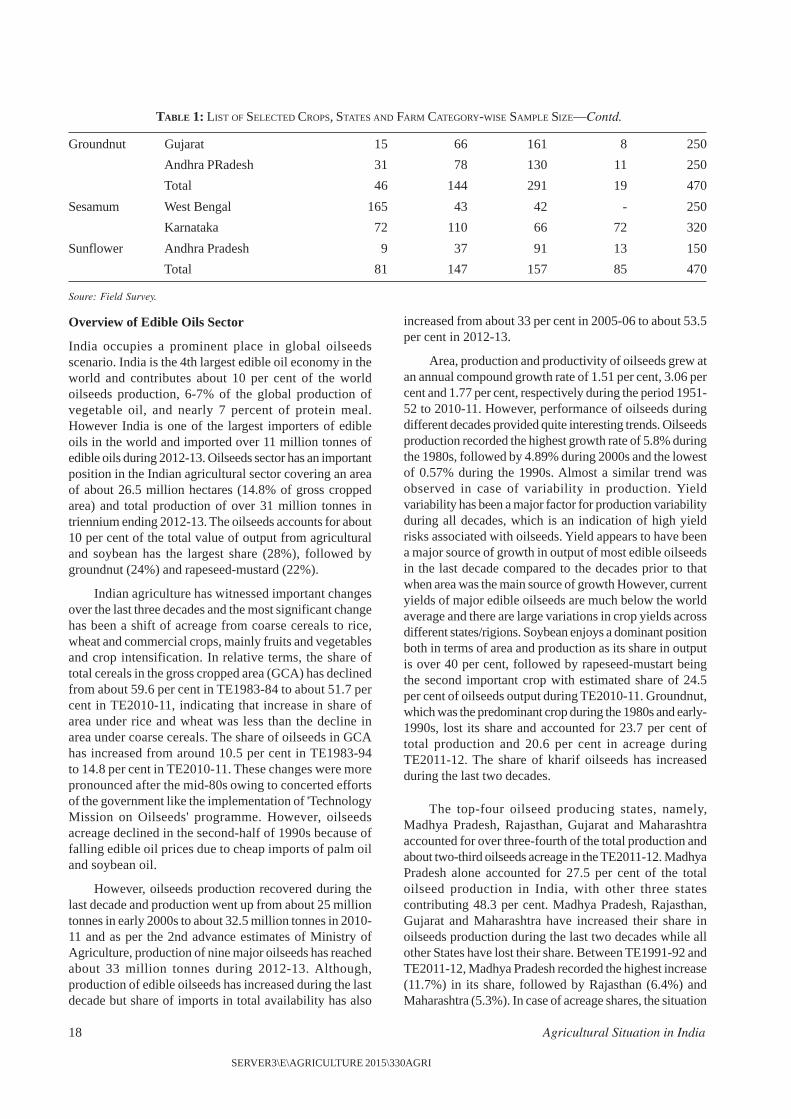
Groundnut Gujarat 15 66 161 8 250
Andhra PRadesh 31 78 130 11 250
Total 46 144 291 19 470
Sesamum West Bengal 165 43 42 - 250
Karnataka 72 110 66 72 320
Sunflower Andhra Pradesh 9 37 91 13 150
Total 81 147 157 85 470
Soure: Field Survey.
Overview of Edible Oils Sector
India occupies a prominent place in global oilseedsscenario. India is the 4th largest edible oil economy in theworld and contributes about 10 per cent of the worldoilseeds production, 6-7% of the global production ofvegetable oil, and nearly 7 percent of protein meal.However India is one of the largest importers of edibleoils in the world and imported over 11 million tonnes ofedible oils during 2012-13. Oilseeds sector has an importantposition in the Indian agricultural sector covering an areaof about 26.5 million hectares (14.8% of gross croppedarea) and total production of over 31 million tonnes intriennium ending 2012-13. The oilseeds accounts for about10 per cent of the total value of output from agriculturaland soybean has the largest share (28%), followed bygroundnut (24%) and rapeseed-mustard (22%).
Indian agriculture has witnessed important changesover the last three decades and the most significant changehas been a shift of acreage from coarse cereals to rice,wheat and commercial crops, mainly fruits and vegetablesand crop intensification. In relative terms, the share oftotal cereals in the gross cropped area (GCA) has declinedfrom about 59.6 per cent in TE1983-84 to about 51.7 percent in TE2010-11, indicating that increase in share ofarea under rice and wheat was less than the decline inarea under coarse cereals. The share of oilseeds in GCAhas increased from around 10.5 per cent in TE1983-94to 14.8 per cent in TE2010-11. These changes were morepronounced after the mid-80s owing to concerted effortsof the government like the implementation of 'TechnologyMission on Oilseeds' programme. However, oilseedsacreage declined in the second-half of 1990s because offalling edible oil prices due to cheap imports of palm oiland soybean oil.
However, oilseeds production recovered during thelast decade and production went up from about 25 milliontonnes in early 2000s to about 32.5 million tonnes in 2010-11 and as per the 2nd advance estimates of Ministry ofAgriculture, production of nine major oilseeds has reachedabout 33 million tonnes during 2012-13. Although,production of edible oilseeds has increased during the lastdecade but share of imports in total availability has also
increased from about 33 per cent in 2005-06 to about 53.5per cent in 2012-13.
Area, production and productivity of oilseeds grew atan annual compound growth rate of 1.51 per cent, 3.06 percent and 1.77 per cent, respectively during the period 1951-52 to 2010-11. However, performance of oilseeds duringdifferent decades provided quite interesting trends. Oilseedsproduction recorded the highest growth rate of 5.8% duringthe 1980s, followed by 4.89% during 2000s and the lowestof 0.57% during the 1990s. Almost a similar trend wasobserved in case of variability in production. Yieldvariability has been a major factor for production variabilityduring all decades, which is an indication of high yieldrisks associated with oilseeds. Yield appears to have beena major source of growth in output of most edible oilseedsin the last decade compared to the decades prior to thatwhen area was the main source of growth However, currentyields of major edible oilseeds are much below the worldaverage and there are large variations in crop yields acrossdifferent states/rigions. Soybean enjoys a dominant positionboth in terms of area and production as its share in outputis over 40 per cent, followed by rapeseed-mustart beingthe second important crop with estimated share of 24.5per cent of oilseeds output during TE2010-11. Groundnut,which was the predominant crop during the 1980s and early-1990s, lost its share and accounted for 23.7 per cent oftotal production and 20.6 per cent in acreage duringTE2011-12. The share of kharif oilseeds has increasedduring the last two decades.
The top-four oilseed producing states, namely,Madhya Pradesh, Rajasthan, Gujarat and Maharashtraaccounted for over three-fourth of the total production andabout two-third oilseeds acreage in the TE2011-12. MadhyaPradesh alone accounted for 27.5 per cent of the totaloilseed production in India, with other three statescontributing 48.3 per cent. Madhya Pradesh, Rajasthan,Gujarat and Maharashtra have increased their share inoilseeds production during the last two decades while allother States have lost their share. Between TE1991-92 andTE2011-12, Madhya Pradesh recorded the highest increase(11.7%) in its share, followed by Rajasthan (6.4%) andMaharashtra (5.3%). In case of acreage shares, the situation
TABLE 1: LIST OF SELECTED CROPS, STATES AND FARM CATEGORY-WISE SAMPLE SIZE—Contd.
April, 2015 19
SERVER3\E\AGRICULTURE 2015\330AGRI
is slightly different. Andhra Pradesh, which is the 5th largestproducer of oilseeds in the country, accounted for 12.9 percent acreage (second largest acrease) during TE1991-92,which declined to 8 per cent (5th position) during theTE2011-12. Madhya Pradesh gained share in area betweenTE1991-92 and TE2011-12 (from 16.4% to 27.6%). OtherStates like Rajasthan, Karnataka, Uttar Pradesh, TamilNadu, Odisha and Haryana lost their share in oilseedsacreage. Area expansion in Madhya Pradesh andMaharashtra has been primarily driven by soybeancultivation. Among the major states, Maharashtra,Rajasthan, Madhya Pradesh, Gujarat and West Bengalexhibited healthy growth rates in area, production andproductivity during 1991-2011. However, there are widevariations in performance of different states during differenttime periods.
Among the major oilseeds-producing states,Maharashtra, Rajasthan, Madhya Pradesh, Gujarat, WestBengal and Bihar had healthy growth rates in the productionduring 1991-2011. Only a few states like Gujarat,Maharashtra, Rajasthan and Bihar have increased theoilseeds production mainly through productivityimprovement. Other major producers Madhya Pradesh,West Bengal increased oilseeds production through bothincrease in area as well as productivity improvement butarea expansion was main contributor to increasedproduction. States like Tamil Nadu, Karnataka, AndhraPradesh, and Odisha recorded negative growth rates inoilseeds production during the last two decades.
On a regional basis, Indian oilseed production(soybean, sunflower and safflower), is highly concentrated.Soybean production is concentrated in three states, namely,Madhya Pradesh, Maharashtra and Rajasthan, accountingfor about 96 per cent of total production. Maharashtra andRajasthan has increased their share in production whileshare of Madhya Pradesh, the largest producer, has declinedduring the last two decades. Compared to soybean, the othermajor oilseeds are broadly distributed and grown in manystates. The main producers of rapeseed-mustard areRajasthan (48.1%), Madhya Pradesh (12.3%), Haryana(11.9%), Uttar Pradesh (10%), West Bengal (5.8%) andGujarat (4.8%). During the last three decades, share ofRajasthan in total production has increased significantlywhile Uttar Pradesh, which used to be the largest producer,has lost its share from 38 per cent in early-1980s to about10 per cent. About 85 per cent of groundnut production inconcentrated in five states, namely, Gujarat, AndhraPradesh, Tamil Nadu, Rajasthan and Karnataka. Gujaratand Rajasthan have increased their share in nationalproduction while all other major producers like AndhraPradesh, Tamil Nadu, Karnataka Maharashtra lost theirshare in total production during the last 2-3 decades.Groundnut area has been replaced by cotton due to
popularization of Bt cotton and higher income from Btcotton in Gujarat and Andhra Pradesh.
Karnataka is the largest producer of sunflower seedin the country and has maintained its leadership during thelast two decades. The other two major producer, AndhraPradesh (27.2%) and Maharashtra (14.6%) account for over40 per cent of the total production. Maharashtra has lostits share in sunflower production of other oilseeds,particularly soybeans, while Andhra Pradesh has increasedits share during the last three decades. Sesamum is grownin number of states but West Bengal and Rajasthan aremajor producers accounting for over 40 per cent of totalproduction in the country. Top five producers account forover 80 per cent of production.
Among major oilseeds, performance of soybean hasbeen much better than other oilseeds. Soybean productionrecorded the highest growth rate (6.47%), followed byrapeseed-mustard (1.68%) during the last two decades.Groundnut and sunflower production had a negative growthin production. However in terms of productivity, rapeseed-mustard has performed better than Soybean and Groundnut.Performance of oilseeds sector in general has improvedduring the last decade. Groundnut, with had negativegrowth in production (-2.26%) during the 1990s, recorded1.63 per cent growth rate in production during the lastdecade and it was primarily driven by yield improvement(2.92%) as groundnut acreage had negative growth rate(-1.2%). Similarly repeseed-mustard production alsoincreased at a faster rate (3.71%) and was driven by botharea expansion and yield improvements. Soybean witnessedthe highest growth rate in production (8.88%) among alloilseeds during the last decade but was slightly lower than1990s (9.85%). Soybean production has been mainly drivenby area expansion while yield improvement has beenmarginal. Therefore, efforts are needed to improve cropyields as scope for area expansion is limited. The aboveresults clearly show that oilseeds sector, which had poorperformane during the 1990s, has gained momentum duringthe last decade. To maintain the current pace of growth,there is a need to address technological, institutional andsocio-economic factors limiting oilseeds production in thecountry.
Factors Constraining Oilseeds Production
Given the rising demand for edible oils and increasingdependence on imports, there is a need to increase edibleoilseeds production in the country. However, there arecompeting demand for agricultural land from various cropsand scope for increasing area under oilseeds is very limited.Therefore, production of oilseeds can be increased only ifproductivity is improved significantly and farmers getremunerative and attractive prices, better market access,
20 Agricultural Situation in India
SERVER3\E\AGRICULTURE 2015\330AGRI
technology and other infrastructure facilities. However,oilseeds farmers face various constraints as most of oilseedcrops are grown under rainfed conditions and only about25 percent of area under oilseeds is irrigated. Several biotic,abiotic, technological, institutional, and socio-economicconstraints inhibit exploitation of the yield potential ofcrops and therefore these constraints need to be addressed.Therefore, for improving crop yields, the first point to beemphasized is the magnitude of the yield gap and its maincauses.
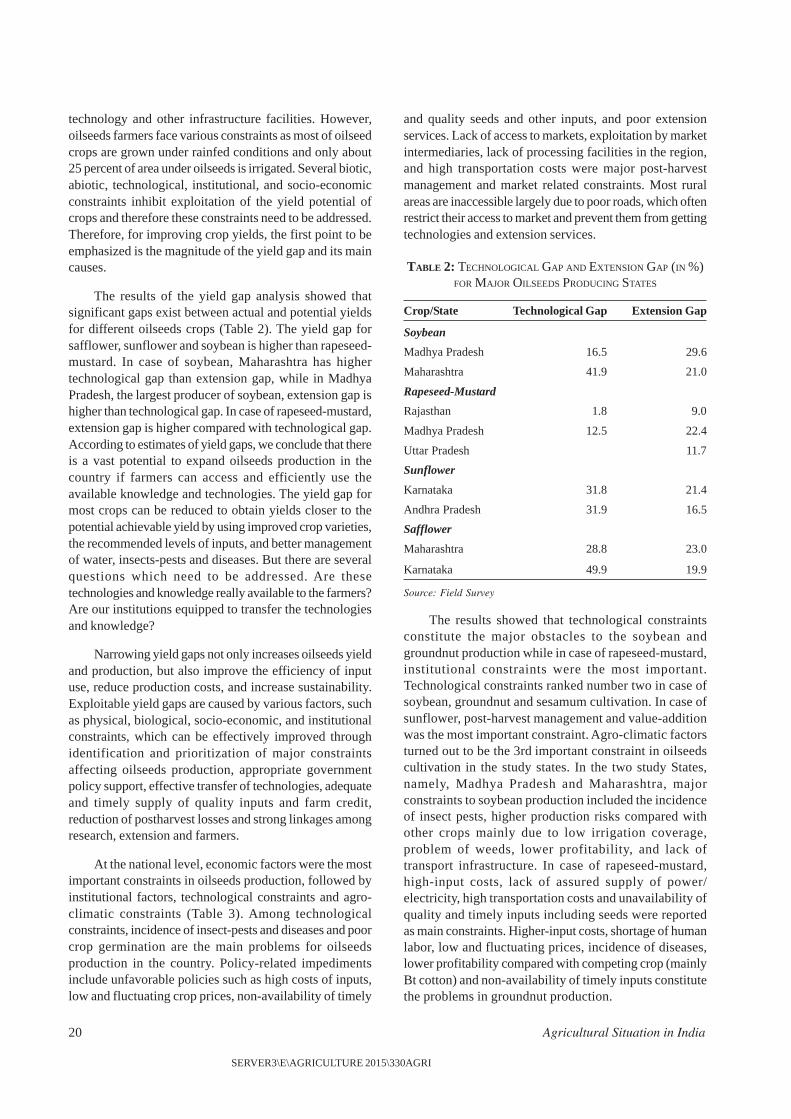
The results of the yield gap analysis showed thatsignificant gaps exist between actual and potential yieldsfor different oilseeds crops (Table 2). The yield gap forsafflower, sunflower and soybean is higher than rapeseed-mustard. In case of soybean, Maharashtra has highertechnological gap than extension gap, while in MadhyaPradesh, the largest producer of soybean, extension gap ishigher than technological gap. In case of rapeseed-mustard,extension gap is higher compared with technological gap.According to estimates of yield gaps, we conclude that thereis a vast potential to expand oilseeds production in thecountry if farmers can access and efficiently use theavailable knowledge and technologies. The yield gap formost crops can be reduced to obtain yields closer to thepotential achievable yield by using improved crop varieties,the recommended levels of inputs, and better managementof water, insects-pests and diseases. But there are severalquestions which need to be addressed. Are thesetechnologies and knowledge really available to the farmers?Are our institutions equipped to transfer the technologiesand knowledge?
Narrowing yield gaps not only increases oilseeds yieldand production, but also improve the efficiency of inputuse, reduce production costs, and increase sustainability.Exploitable yield gaps are caused by various factors, suchas physical, biological, socio-economic, and institutionalconstraints, which can be effectively improved throughidentification and prioritization of major constraintsaffecting oilseeds production, appropriate governmentpolicy support, effective transfer of technologies, adequateand timely supply of quality inputs and farm credit,reduction of postharvest losses and strong linkages amongresearch, extension and farmers.
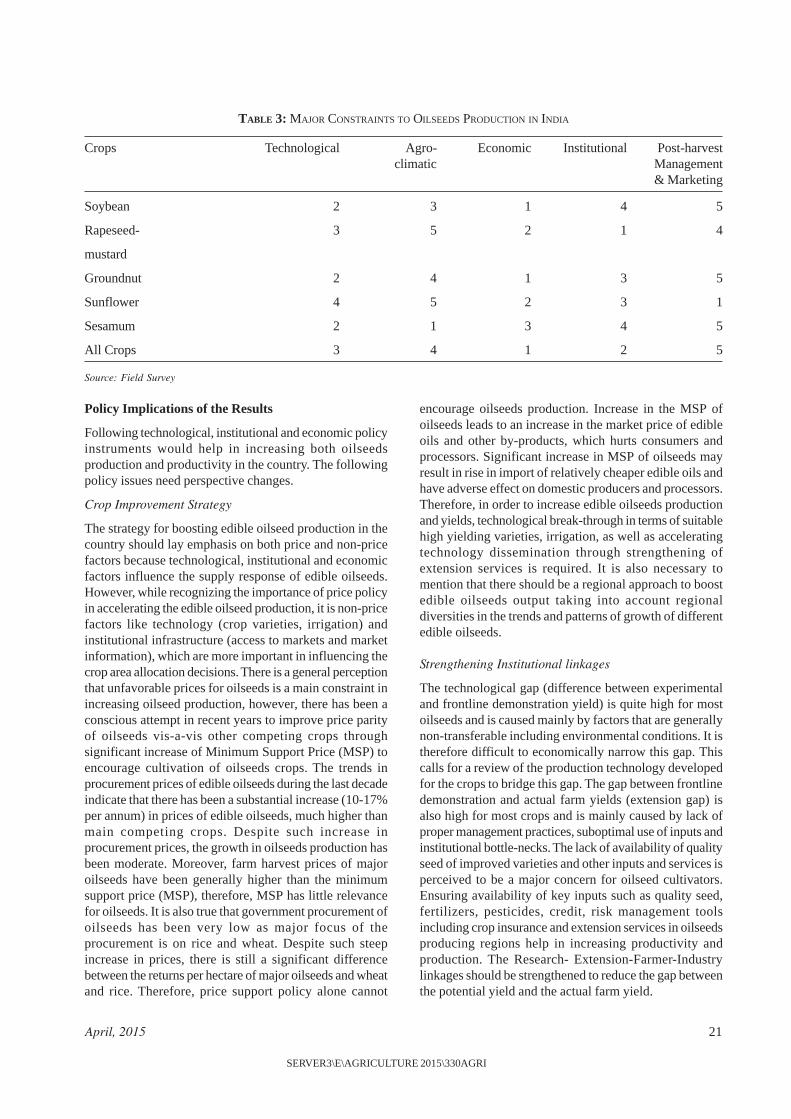
At the national level, economic factors were the mostimportant constraints in oilseeds production, followed byinstitutional factors, technological constraints and agro-climatic constraints (Table 3). Among technologicalconstraints, incidence of insect-pests and diseases and poorcrop germination are the main problems for oilseedsproduction in the country. Policy-related impedimentsinclude unfavorable policies such as high costs of inputs,low and fluctuating crop prices, non-availability of timely
and quality seeds and other inputs, and poor extensionservices. Lack of access to markets, exploitation by marketintermediaries, lack of processing facilities in the region,and high transportation costs were major post-harvestmanagement and market related constraints. Most ruralareas are inaccessible largely due to poor roads, which oftenrestrict their access to market and prevent them from gettingtechnologies and extension services.
TABLE 2: TECHNOLOGICAL GAP AND EXTENSION GAP (IN %)FOR MAJOR OILSEEDS PRODUCING STATES
Crop/State Technological Gap Extension Gap
Soybean
Madhya Pradesh 16.5 29.6
Maharashtra 41.9 21.0
Rapeseed-Mustard
Rajasthan 1.8 9.0
Madhya Pradesh 12.5 22.4
Uttar Pradesh 11.7
Sunflower
Karnataka 31.8 21.4
Andhra Pradesh 31.9 16.5
Safflower
Maharashtra 28.8 23.0
Karnataka 49.9 19.9
Source: Field Survey
The results showed that technological constraintsconstitute the major obstacles to the soybean andgroundnut production while in case of rapeseed-mustard,institutional constraints were the most important.Technological constraints ranked number two in case ofsoybean, groundnut and sesamum cultivation. In case ofsunflower, post-harvest management and value-additionwas the most important constraint. Agro-climatic factorsturned out to be the 3rd important constraint in oilseedscultivation in the study states. In the two study States,namely, Madhya Pradesh and Maharashtra, majorconstraints to soybean production included the incidenceof insect pests, higher production risks compared withother crops mainly due to low irrigation coverage,problem of weeds, lower profitability, and lack oftransport infrastructure. In case of rapeseed-mustard,high-input costs, lack of assured supply of power/electricity, high transportation costs and unavailability ofquality and timely inputs including seeds were reportedas main constraints. Higher-input costs, shortage of humanlabor, low and fluctuating prices, incidence of diseases,lower profitability compared with competing crop (mainlyBt cotton) and non-availability of timely inputs constitutethe problems in groundnut production.
April, 2015 21
SERVER3\E\AGRICULTURE 2015\330AGRI
TABLE 3: MAJOR CONSTRAINTS TO OILSEEDS PRODUCTION IN INDIA
Crops Technological Agro- Economic Institutional Post-harvestclimatic Management
& Marketing
Soybean 2 3 1 4 5
Rapeseed- 3 5 2 1 4
mustard
Groundnut 2 4 1 3 5
Sunflower 4 5 2 3 1
Sesamum 2 1 3 4 5
All Crops 3 4 1 2 5
Source: Field Survey
Policy Implications of the Results
Following technological, institutional and economic policyinstruments would help in increasing both oilseedsproduction and productivity in the country. The followingpolicy issues need perspective changes.
Crop Improvement Strategy
The strategy for boosting edible oilseed production in thecountry should lay emphasis on both price and non-pricefactors because technological, institutional and economicfactors influence the supply response of edible oilseeds.However, while recognizing the importance of price policyin accelerating the edible oilseed production, it is non-pricefactors like technology (crop varieties, irrigation) andinstitutional infrastructure (access to markets and marketinformation), which are more important in influencing thecrop area allocation decisions. There is a general perceptionthat unfavorable prices for oilseeds is a main constraint inincreasing oilseed production, however, there has been aconscious attempt in recent years to improve price parityof oilseeds vis-a-vis other competing crops throughsignificant increase of Minimum Support Price (MSP) toencourage cultivation of oilseeds crops. The trends inprocurement prices of edible oilseeds during the last decadeindicate that there has been a substantial increase (10-17%per annum) in prices of edible oilseeds, much higher thanmain competing crops. Despite such increase inprocurement prices, the growth in oilseeds production hasbeen moderate. Moreover, farm harvest prices of majoroilseeds have been generally higher than the minimumsupport price (MSP), therefore, MSP has little relevancefor oilseeds. It is also true that government procurement ofoilseeds has been very low as major focus of theprocurement is on rice and wheat. Despite such steepincrease in prices, there is still a significant differencebetween the returns per hectare of major oilseeds and wheatand rice. Therefore, price support policy alone cannot
encourage oilseeds production. Increase in the MSP ofoilseeds leads to an increase in the market price of edibleoils and other by-products, which hurts consumers andprocessors. Significant increase in MSP of oilseeds mayresult in rise in import of relatively cheaper edible oils andhave adverse effect on domestic producers and processors.Therefore, in order to increase edible oilseeds productionand yields, technological break-through in terms of suitablehigh yielding varieties, irrigation, as well as acceleratingtechnology dissemination through strengthening ofextension services is required. It is also necessary tomention that there should be a regional approach to boostedible oilseeds output taking into account regionaldiversities in the trends and patterns of growth of differentedible oilseeds.
Strengthening Institutional linkages
The technological gap (difference between experimentaland frontline demonstration yield) is quite high for mostoilseeds and is caused mainly by factors that are generallynon-transferable including environmental conditions. It istherefore difficult to economically narrow this gap. Thiscalls for a review of the production technology developedfor the crops to bridge this gap. The gap between frontlinedemonstration and actual farm yields (extension gap) isalso high for most crops and is mainly caused by lack ofproper management practices, suboptimal use of inputs andinstitutional bottle-necks. The lack of availability of qualityseed of improved varieties and other inputs and services isperceived to be a major concern for oilseed cultivators.Ensuring availability of key inputs such as quality seed,fertilizers, pesticides, credit, risk management toolsincluding crop insurance and extension services in oilseedsproducing regions help in increasing productivity andproduction. The Research- Extension-Farmer-Industrylinkages should be strengthened to reduce the gap betweenthe potential yield and the actual farm yield.
22 Agricultural Situation in India
SERVER3\E\AGRICULTURE 2015\330AGRI
One of the features of the oilseeds/edible oils trade isdominance of private trade and speculative activities intrading activities. The edible oilseed/oil prices are subjectedto wide seasonal fluctuations and price are generally lowafter the harvest of the crop and high during festival seasonsand benefit of price rise goes to the traders and act asdisincentive for the farmers. Historically, whenever therehas been a good crop, we have invariably witnessed distresssales by the farmers. The government allowed futurestrading in most oilseeds and oils from April 1999 (palmoil in 2005 and soy oil in 2001), which was expected toimprove price discovery and reduce seasonal fluctuationsin edible oilseed and oil prices but has not made anysignificant impact.
Trade-related Policy Initiatives
Over the last two decades, the world oilseed market haswitnessed significant trade and domestic policy reforms.Following the Uruguay Round, member countries replacednon-tariff barriers on imports and exports of oilseeds/oilsby tariffs and agreed to reduce domestic support and exportsubsidies to agricultural sector. However, a review of tradepolicies in the oilseed complex reveals a high degree ofgovernment trade-distorting interventions in majorproducing and trading countries. Indian edible oil sectorhas become more liberalized and transparent. The twomajor problems with the edible oil import duty structure inIndia are: low bound rate of duty (45%) on soybean oil,which has the 2nd largest share in edible oil imports andlow applied duty rates and high variability in import dutystructure with frequent changes in tariffs. First, bound rateof duty for soybean is 45 per cent, which is not sufficientto protect domestic producers/processors when worldprices are low (e.g. in the first half of last decade) as thereis considerable substitution among various oils based onprices on the demand side. Second, import duty on edibleoils has been very low since April 2008, when import tariff
on crude palm oil was reduced to zero and on refined palmand soybean oil to 7.5 per cent. This was marginallyincreased to 2.5 and 10 per cent, respectively from March2014. Low import duties on edible oils adversely affectthe oilseeds farmers. Moreover, high dependence on worldmarket for large quantity of oils is risky given the fact thatworld oilseeds production has high fluctuations due todependence on weather in major exporting countries anddemand in some importing countries may go up for non-edible purpose like bio-diesel. For example, over 2006-2012, the EU-27 countries increased their tctal use of palmoil by 40 per cent, from 4.5 to 6.4 million tonnes and about30 per cent was used for bio-diesel production. Accordingto the estimates, palm oil use has increased much morethan predicted and now stands at 20 per cent of the bio-diesel mix. Therefore there is a need to have consistenttrade policy which protects the interests of both producersand consumer but help in making India self-sufficient inedible oils in the long run.
The long-term strategy to make India self-sufficientin edible oilseeds/oils should focus on technology byevolving new location-specific high yielding varieties, morecoverage under assured irrigation and better water useefficiency, appropriate pricing incentives and trade policyand ensure timely availability of quality inputs such asfertilizers, pesticides, credit facilities, crop insurance andassured market access. Investment in research anddevelopment of oilseeds complex is a key element andshould be stepped up. The dissemination of technology isequally important and needs to be strengthened througheffective agricultural extension system. Extending oilseedcultivation to non-traditional areas and as mixed croppingsystem is worth considering. The potential of non-traditional edible oils like rice bran oil, corn oil, cottonseedoil, needs to be exploited to boost India's edible oil outputand reduce dependence of imports.
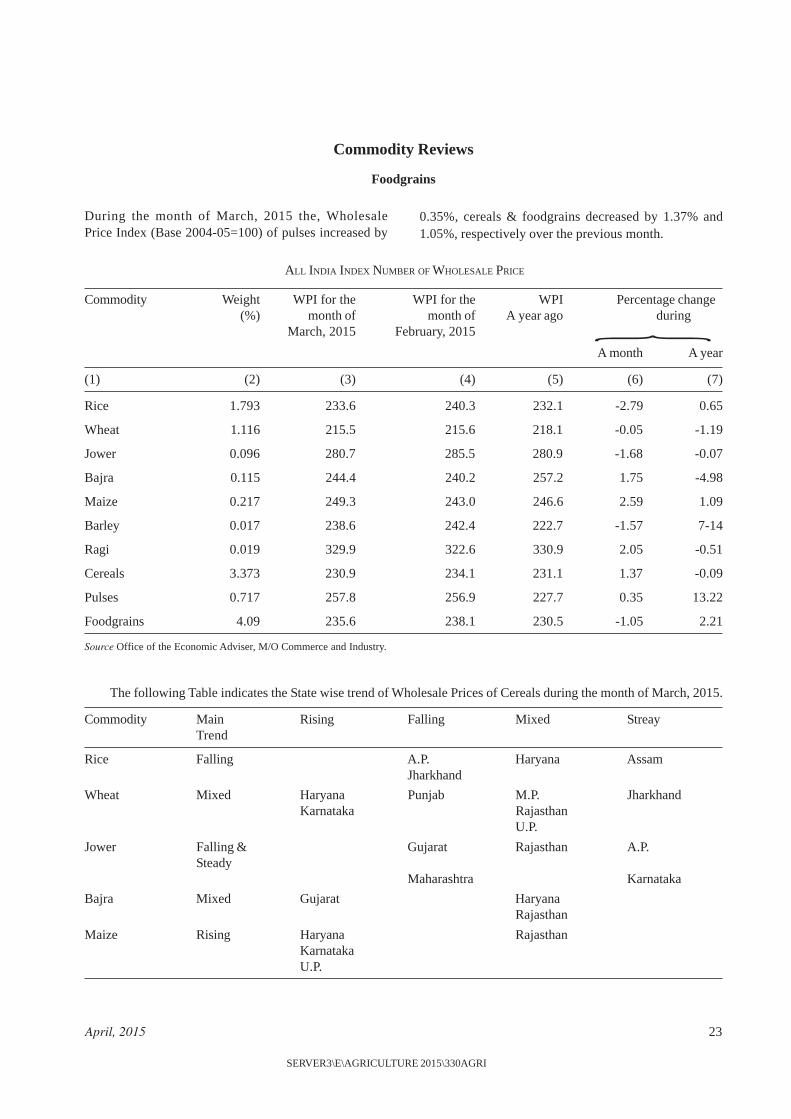
April, 2015 23
SERVER3\E\AGRICULTURE 2015\330AGRI
Commodity Reviews
Foodgrains
During the month of March, 2015 the, WholesalePrice Index (Base 2004-05=100) of pulses increased by
0.35%, cereals & foodgrains decreased by 1.37% and1.05%, respectively over the previous month.
ALL INDIA INDEX NUMBER OF WHOLESALE PRICE
Commodity Weight WPI for the WPI for the WPI Percentage change(%) month of month of A year ago during
March, 2015 February, 2015
A month A year
(1) (2) (3) (4) (5) (6) (7)
Rice 1.793 233.6 240.3 232.1 -2.79 0.65
Wheat 1.116 215.5 215.6 218.1 -0.05 -1.19
Jower 0.096 280.7 285.5 280.9 -1.68 -0.07
Bajra 0.115 244.4 240.2 257.2 1.75 -4.98
Maize 0.217 249.3 243.0 246.6 2.59 1.09
Barley 0.017 238.6 242.4 222.7 -1.57 7-14
Ragi 0.019 329.9 322.6 330.9 2.05 -0.51
Cereals 3.373 230.9 234.1 231.1 1.37 -0.09
Pulses 0.717 257.8 256.9 227.7 0.35 13.22
Foodgrains 4.09 235.6 238.1 230.5 -1.05 2.21
Source Office of the Economic Adviser, M/O Commerce and Industry.
The following Table indicates the State wise trend of Wholesale Prices of Cereals during the month of March, 2015.
Commodity Main Rising Falling Mixed StreayTrend
Rice Falling A.P. Haryana AssamJharkhand
Wheat Mixed Haryana Punjab M.P. JharkhandKarnataka Rajasthan
U.P.
Jower Falling & Gujarat Rajasthan A.P.Steady
Maharashtra Karnataka
Bajra Mixed Gujarat HaryanaRajasthan
Maize Rising Haryana RajasthanKarnatakaU.P.
}
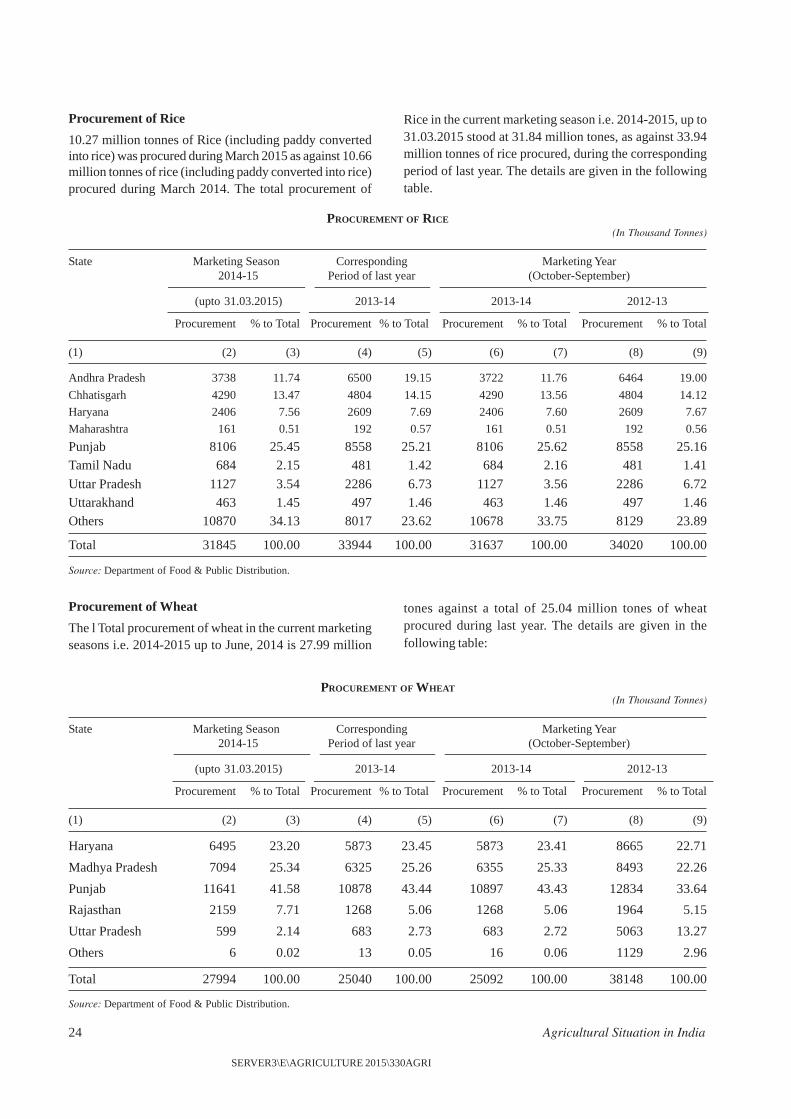
24 Agricultural Situation in India
SERVER3\E\AGRICULTURE 2015\330AGRI
PROCUREMENT OF RICE(In Thousand Tonnes)
State Marketing Season Corresponding Marketing Year2014-15 Period of last year (October-September)
(upto 31.03.2015) 2013-14 2013-14 2012-13
Procurement % to Total Procurement % to Total Procurement % to Total Procurement % to Total
(1) (2) (3) (4) (5) (6) (7) (8) (9)
Andhra Pradesh 3738 11.74 6500 19.15 3722 11.76 6464 19.00
Chhatisgarh 4290 13.47 4804 14.15 4290 13.56 4804 14.12
Haryana 2406 7.56 2609 7.69 2406 7.60 2609 7.67
Maharashtra 161 0.51 192 0.57 161 0.51 192 0.56
Punjab 8106 25.45 8558 25.21 8106 25.62 8558 25.16Tamil Nadu 684 2.15 481 1.42 684 2.16 481 1.41
Uttar Pradesh 1127 3.54 2286 6.73 1127 3.56 2286 6.72Uttarakhand 463 1.45 497 1.46 463 1.46 497 1.46Others 10870 34.13 8017 23.62 10678 33.75 8129 23.89
Total 31845 100.00 33944 100.00 31637 100.00 34020 100.00
Source: Department of Food & Public Distribution.
PROCUREMENT OF WHEAT(In Thousand Tonnes)
State Marketing Season Corresponding Marketing Year2014-15 Period of last year (October-September)
(upto 31.03.2015) 2013-14 2013-14 2012-13
Procurement % to Total Procurement % to Total Procurement % to Total Procurement % to Total
(1) (2) (3) (4) (5) (6) (7) (8) (9)
Haryana 6495 23.20 5873 23.45 5873 23.41 8665 22.71
Madhya Pradesh 7094 25.34 6325 25.26 6355 25.33 8493 22.26
Punjab 11641 41.58 10878 43.44 10897 43.43 12834 33.64
Rajasthan 2159 7.71 1268 5.06 1268 5.06 1964 5.15
Uttar Pradesh 599 2.14 683 2.73 683 2.72 5063 13.27
Others 6 0.02 13 0.05 16 0.06 1129 2.96
Total 27994 100.00 25040 100.00 25092 100.00 38148 100.00
Source: Department of Food & Public Distribution.
Procurement of Rice
10.27 million tonnes of Rice (including paddy convertedinto rice) was procured during March 2015 as against 10.66million tonnes of rice (including paddy converted into rice)procured during March 2014. The total procurement of
Rice in the current marketing season i.e. 2014-2015, up to31.03.2015 stood at 31.84 million tones, as against 33.94million tonnes of rice procured, during the correspondingperiod of last year. The details are given in the followingtable.
Procurement of Wheat
The l Total procurement of wheat in the current marketingseasons i.e. 2014-2015 up to June, 2014 is 27.99 million
tones against a total of 25.04 million tones of wheatprocured during last year. The details are given in thefollowing table:
April, 2015 25
SERVER3\E\AGRICULTURE 2015\330AGRI
Oilseeds & Edible Oils
The Wholesale Price Index (WPI) of nine major oilseedsas a group stood at 204.2 in March, 2015 showing anincrease of 0.5 percent over the previous month. However,it is lower by 1.9 percent over the previous year. The WPIof Cotton Seed (62.8 percent), Niger Seed (4.7 percent),Sunflower Seed (3.8 percent), Groundnut seed (3.4percent), Copra (1.5 percent) and Rape & Mustard Seed(0.4 percent) increased over the previous month. However,the WPI of Gingelly seed (4.3 percent) and Soyabean (1.0percent) decreased over the previous month. The WPI ofSafflower seed remained unchanged during the month.
The Wholesale Price Index (WPI) of Edible Oils as agroup stood at 145.4 in March, 2015 showing a decreaseof 0.2 percent and 0.5 percent over the previous monthand year, respectively. The WPI of Gingelly Oil (1.3percent), Soyabean Oil (1.2 percent), Cotton seed (0.5percent), Mustard Oil (0.1 percent) decreased over theprevious month. However, the WPI of Copra oil (1.0percent), Sunflower Oil (0.8 percent), and Groundnut Oil(0.6 percent) increased over the previous month.
Fruits & Vegetables
The Wholesale Price Index (WPI) of Fruits & Vegetableas a group stood at 232.0 in March, 2015 showing adecrease of 1.4 percent over the previous month. However,it is higher by 12.9 percent over the previous year.
Potato
The Wholesale Price Index (WPI) of Potato stood at 152.8
in March, 2015 showing a decrease of 7.5 percent and 14.2percent over the previous month and year, respectively.
Onion
The Wholesale Price Index (WPI) of Onion stood at 332.5in March, 2015 showing a decrease of 4.1 percent over theprevious month. However, it is higher by 42.3 percent overthe previous year.
Condiments & Spices
The Wholesale Price Index (WPI) of Condiments & Spices(Group) stood at 311.1 in March 2015 showing a decreaseof 1.0 percent over the previous month. However, it ishigher by 18.7 percent over the previous year. The WPI ofBlack Pepper and Chillies (Dry) decreased by 4.6 percentand 0.4 percent over the previous month, respectively.However, WPI of Turmeric increased by 0.6 percent overthe previous month.
Raw Cotton
The Wholesale Price Index (WPI) of Raw Cotton stood at178.3 in March, 2015 showing an increase of 1.1 percentover the previous month. However, it is lower by 24.6percent over the previous year.
Raw Jute
The Wholesale Price Index (WPI) of Raw Jute stood at308.9 in March, 2015 showing an increase of 0.3 percentand 14.4 percent over the previous month and year,respectively.
Commercial Crops
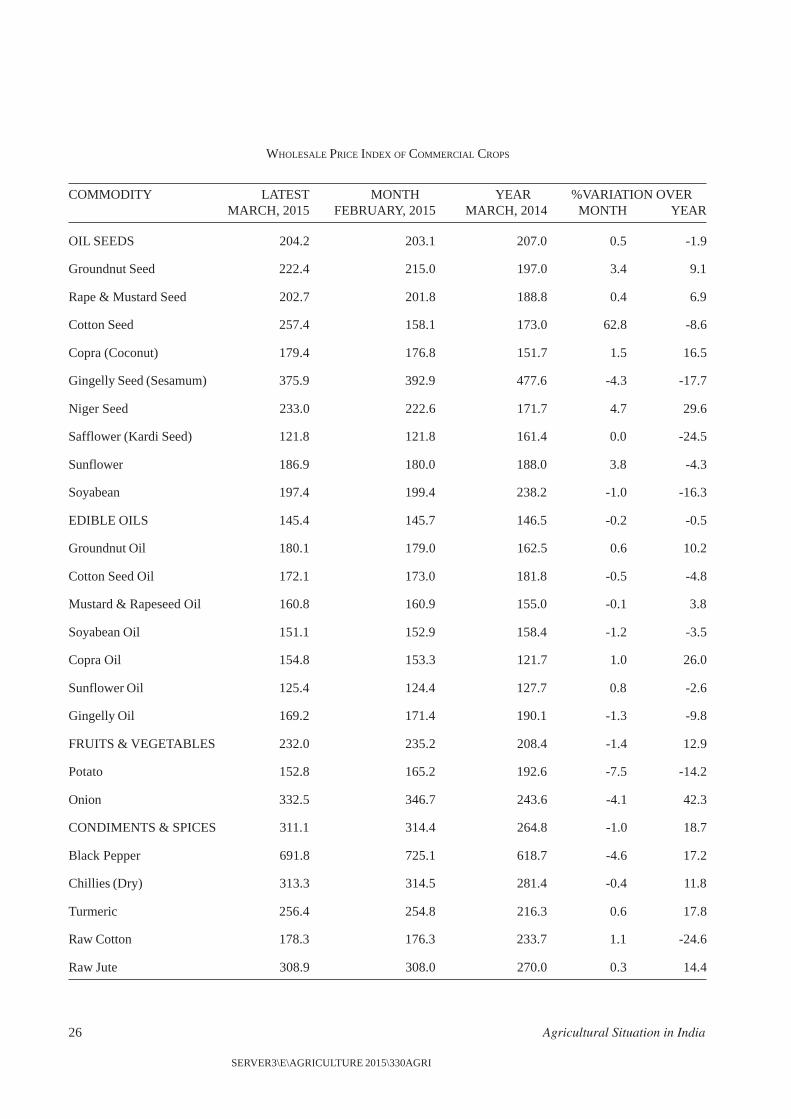
26 Agricultural Situation in India
SERVER3\E\AGRICULTURE 2015\330AGRI
COMMODITY LATEST MONTH YEAR %VARIATION OVERMARCH, 2015 FEBRUARY, 2015 MARCH, 2014 MONTH YEAR
OIL SEEDS 204.2 203.1 207.0 0.5 -1.9
Groundnut Seed 222.4 215.0 197.0 3.4 9.1
Rape & Mustard Seed 202.7 201.8 188.8 0.4 6.9
Cotton Seed 257.4 158.1 173.0 62.8 -8.6
Copra (Coconut) 179.4 176.8 151.7 1.5 16.5
Gingelly Seed (Sesamum) 375.9 392.9 477.6 -4.3 -17.7
Niger Seed 233.0 222.6 171.7 4.7 29.6
Safflower (Kardi Seed) 121.8 121.8 161.4 0.0 -24.5
Sunflower 186.9 180.0 188.0 3.8 -4.3
Soyabean 197.4 199.4 238.2 -1.0 -16.3
EDIBLE OILS 145.4 145.7 146.5 -0.2 -0.5
Groundnut Oil 180.1 179.0 162.5 0.6 10.2
Cotton Seed Oil 172.1 173.0 181.8 -0.5 -4.8
Mustard & Rapeseed Oil 160.8 160.9 155.0 -0.1 3.8
Soyabean Oil 151.1 152.9 158.4 -1.2 -3.5
Copra Oil 154.8 153.3 121.7 1.0 26.0
Sunflower Oil 125.4 124.4 127.7 0.8 -2.6
Gingelly Oil 169.2 171.4 190.1 -1.3 -9.8
FRUITS & VEGETABLES 232.0 235.2 208.4 -1.4 12.9
Potato 152.8 165.2 192.6 -7.5 -14.2
Onion 332.5 346.7 243.6 -4.1 42.3
CONDIMENTS & SPICES 311.1 314.4 264.8 -1.0 18.7
Black Pepper 691.8 725.1 618.7 -4.6 17.2
Chillies (Dry) 313.3 314.5 281.4 -0.4 11.8
Turmeric 256.4 254.8 216.3 0.6 17.8
Raw Cotton 178.3 176.3 233.7 1.1 -24.6
Raw Jute 308.9 308.0 270.0 0.3 14.4
WHOLESALE PRICE INDEX OF COMMERCIAL CROPS
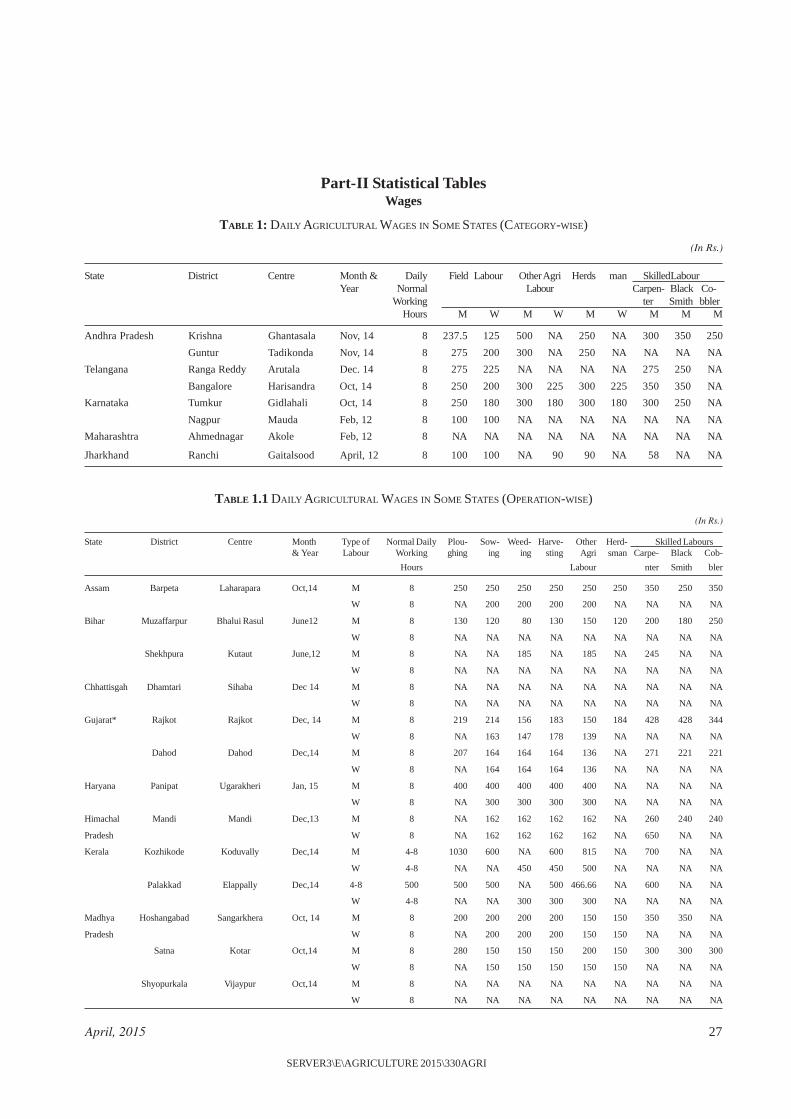
April, 2015 27
SERVER3\E\AGRICULTURE 2015\330AGRI
Part-II Statistical TablesWages
TABLE 1: DAILY AGRICULTURAL WAGES IN SOME STATES (CATEGORY-WISE)
(In Rs.)
State District Centre Month & Daily Field Labour Other Agri Herds man SkilledLabourYear Normal Labour Carpen- Black Co-
Working ter Smith bblerHours M W M W M W M M M
Andhra Pradesh Krishna Ghantasala Nov, 14 8 237.5 125 500 NA 250 NA 300 350 250
Guntur Tadikonda Nov, 14 8 275 200 300 NA 250 NA NA NA NA
Telangana Ranga Reddy Arutala Dec. 14 8 275 225 NA NA NA NA 275 250 NA
Bangalore Harisandra Oct, 14 8 250 200 300 225 300 225 350 350 NA
Karnataka Tumkur Gidlahali Oct, 14 8 250 180 300 180 300 180 300 250 NA
Nagpur Mauda Feb, 12 8 100 100 NA NA NA NA NA NA NA
Maharashtra Ahmednagar Akole Feb, 12 8 NA NA NA NA NA NA NA NA NA
Jharkhand Ranchi Gaitalsood April, 12 8 100 100 NA 90 90 NA 58 NA NA
TABLE 1.1 DAILY AGRICULTURAL WAGES IN SOME STATES (OPERATION-WISE)
(In Rs.)
State District Centre Month Type of Normal Daily Plou- Sow- Weed- Harve- Other Herd- Skilled Labours& Year Labour Working ghing ing ing sting Agri sman Carpe- Black Cob-
Hours Labour nter Smith bler
Assam Barpeta Laharapara Oct,14 M 8 250 250 250 250 250 250 350 250 350
W 8 NA 200 200 200 200 NA NA NA NA
Bihar Muzaffarpur Bhalui Rasul June12 M 8 130 120 80 130 150 120 200 180 250
W 8 NA NA NA NA NA NA NA NA NA
Shekhpura Kutaut June,12 M 8 NA NA 185 NA 185 NA 245 NA NA
W 8 NA NA NA NA NA NA NA NA NA
Chhattisgah Dhamtari Sihaba Dec 14 M 8 NA NA NA NA NA NA NA NA NA
W 8 NA NA NA NA NA NA NA NA NA
Gujarat* Rajkot Rajkot Dec, 14 M 8 219 214 156 183 150 184 428 428 344
W 8 NA 163 147 178 139 NA NA NA NA
Dahod Dahod Dec,14 M 8 207 164 164 164 136 NA 271 221 221
W 8 NA 164 164 164 136 NA NA NA NA
Haryana Panipat Ugarakheri Jan, 15 M 8 400 400 400 400 400 NA NA NA NA
W 8 NA 300 300 300 300 NA NA NA NA
Himachal Mandi Mandi Dec,13 M 8 NA 162 162 162 162 NA 260 240 240
Pradesh W 8 NA 162 162 162 162 NA 650 NA NA
Kerala Kozhikode Koduvally Dec,14 M 4-8 1030 600 NA 600 815 NA 700 NA NA
W 4-8 NA NA 450 450 500 NA NA NA NA
Palakkad Elappally Dec,14 4-8 500 500 500 NA 500 466.66 NA 600 NA NA
W 4-8 NA NA 300 300 300 NA NA NA NA
Madhya Hoshangabad Sangarkhera Oct, 14 M 8 200 200 200 200 150 150 350 350 NA
Pradesh W 8 NA 200 200 200 150 150 NA NA NA
Satna Kotar Oct,14 M 8 280 150 150 150 200 150 300 300 300
W 8 NA 150 150 150 150 150 NA NA NA
Shyopurkala Vijaypur Oct,14 M 8 NA NA NA NA NA NA NA NA NA
W 8 NA NA NA NA NA NA NA NA NA
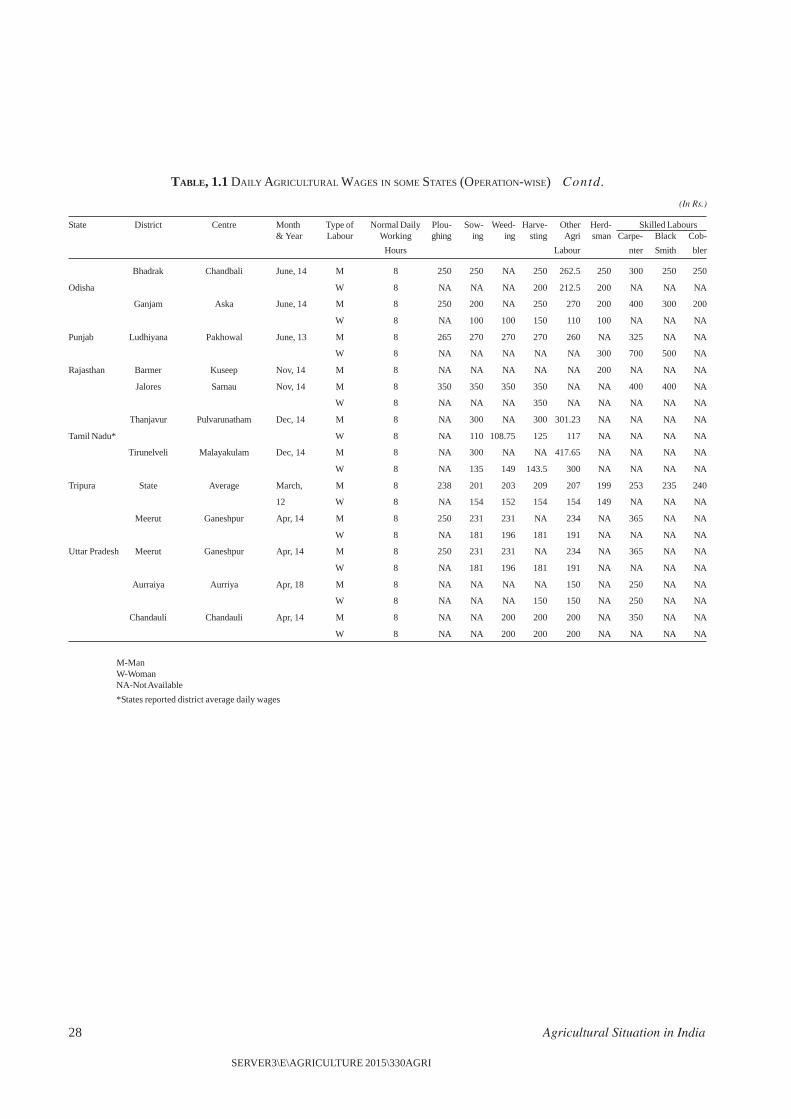
28 Agricultural Situation in India
SERVER3\E\AGRICULTURE 2015\330AGRI
TABLE, 1.1 DAILY AGRICULTURAL WAGES IN SOME STATES (OPERATION-WISE) — Contd.
(In Rs.)
State District Centre Month Type of Normal Daily Plou- Sow- Weed- Harve- Other Herd- Skilled Labours& Year Labour Working ghing ing ing sting Agri sman Carpe- Black Cob-
Hours Labour nter Smith bler
Bhadrak Chandbali June, 14 M 8 250 250 NA 250 262.5 250 300 250 250
Odisha W 8 NA NA NA 200 212.5 200 NA NA NA
Ganjam Aska June, 14 M 8 250 200 NA 250 270 200 400 300 200
W 8 NA 100 100 150 110 100 NA NA NA
Punjab Ludhiyana Pakhowal June, 13 M 8 265 270 270 270 260 NA 325 NA NA
W 8 NA NA NA NA NA 300 700 500 NA
Rajasthan Barmer Kuseep Nov, 14 M 8 NA NA NA NA NA 200 NA NA NA
Jalores Sarnau Nov, 14 M 8 350 350 350 350 NA NA 400 400 NA
W 8 NA NA NA 350 NA NA NA NA NA
Thanjavur Pulvarunatham Dec, 14 M 8 NA 300 NA 300 301.23 NA NA NA NA
Tamil Nadu* W 8 NA 110 108.75 125 117 NA NA NA NA
Tirunelveli Malayakulam Dec, 14 M 8 NA 300 NA NA 417.65 NA NA NA NA
W 8 NA 135 149 143.5 300 NA NA NA NA
Tripura State Average March, M 8 238 201 203 209 207 199 253 235 240
12 W 8 NA 154 152 154 154 149 NA NA NA
Meerut Ganeshpur Apr, 14 M 8 250 231 231 NA 234 NA 365 NA NA
W 8 NA 181 196 181 191 NA NA NA NA
Uttar Pradesh Meerut Ganeshpur Apr, 14 M 8 250 231 231 NA 234 NA 365 NA NA
W 8 NA 181 196 181 191 NA NA NA NA
Aurraiya Aurriya Apr, 18 M 8 NA NA NA NA 150 NA 250 NA NA
W 8 NA NA NA 150 150 NA 250 NA NA
Chandauli Chandauli Apr, 14 M 8 NA NA 200 200 200 NA 350 NA NA
W 8 NA NA 200 200 200 NA NA NA NA
M-ManW-WomanNA-Not Available
*States reported district average daily wages
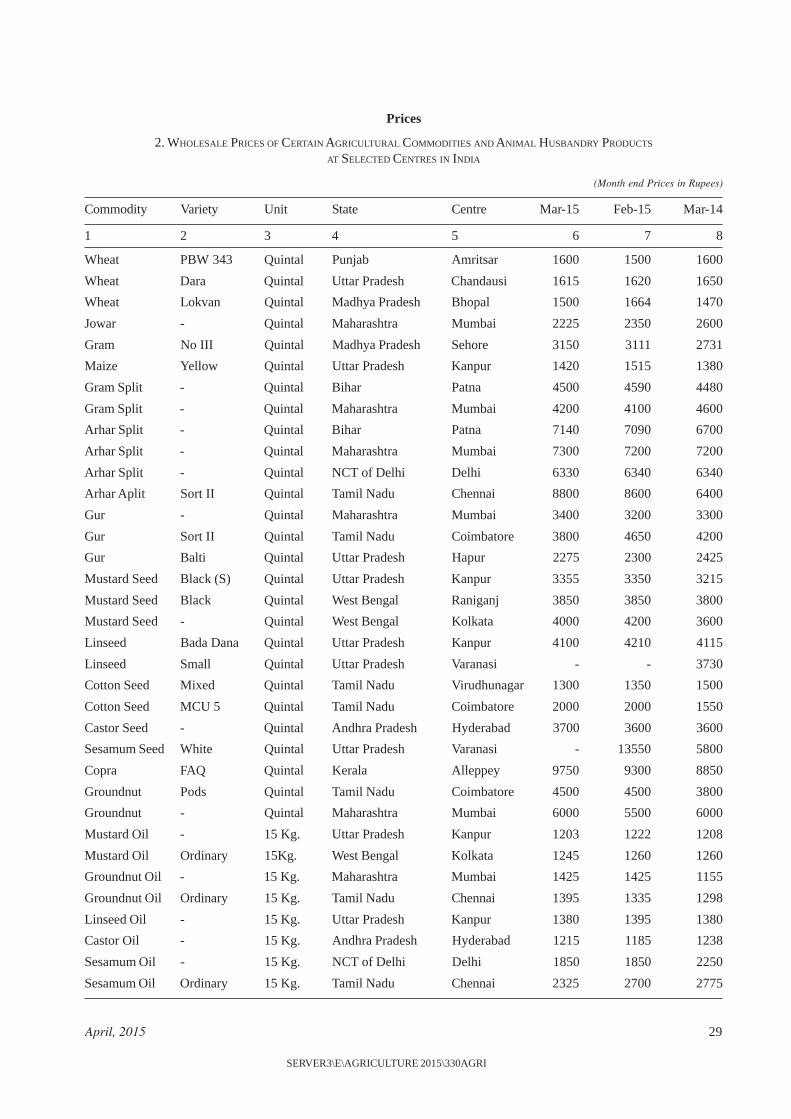
April, 2015 29
SERVER3\E\AGRICULTURE 2015\330AGRI
Prices
2. WHOLESALE PRICES OF CERTAIN AGRICULTURAL COMMODITIES AND ANIMAL HUSBANDRY PRODUCTS
AT SELECTED CENTRES IN INDIA
(Month end Prices in Rupees)
Commodity Variety Unit State Centre Mar-15 Feb-15 Mar-14
1 2 3 4 5 6 7 8
Wheat PBW 343 Quintal Punjab Amritsar 1600 1500 1600
Wheat Dara Quintal Uttar Pradesh Chandausi 1615 1620 1650
Wheat Lokvan Quintal Madhya Pradesh Bhopal 1500 1664 1470
Jowar - Quintal Maharashtra Mumbai 2225 2350 2600
Gram No III Quintal Madhya Pradesh Sehore 3150 3111 2731
Maize Yellow Quintal Uttar Pradesh Kanpur 1420 1515 1380
Gram Split - Quintal Bihar Patna 4500 4590 4480
Gram Split - Quintal Maharashtra Mumbai 4200 4100 4600
Arhar Split - Quintal Bihar Patna 7140 7090 6700
Arhar Split - Quintal Maharashtra Mumbai 7300 7200 7200
Arhar Split - Quintal NCT of Delhi Delhi 6330 6340 6340
Arhar Aplit Sort II Quintal Tamil Nadu Chennai 8800 8600 6400
Gur - Quintal Maharashtra Mumbai 3400 3200 3300
Gur Sort II Quintal Tamil Nadu Coimbatore 3800 4650 4200
Gur Balti Quintal Uttar Pradesh Hapur 2275 2300 2425
Mustard Seed Black (S) Quintal Uttar Pradesh Kanpur 3355 3350 3215
Mustard Seed Black Quintal West Bengal Raniganj 3850 3850 3800
Mustard Seed - Quintal West Bengal Kolkata 4000 4200 3600
Linseed Bada Dana Quintal Uttar Pradesh Kanpur 4100 4210 4115
Linseed Small Quintal Uttar Pradesh Varanasi - - 3730
Cotton Seed Mixed Quintal Tamil Nadu Virudhunagar 1300 1350 1500
Cotton Seed MCU 5 Quintal Tamil Nadu Coimbatore 2000 2000 1550
Castor Seed - Quintal Andhra Pradesh Hyderabad 3700 3600 3600
Sesamum Seed White Quintal Uttar Pradesh Varanasi - 13550 5800
Copra FAQ Quintal Kerala Alleppey 9750 9300 8850
Groundnut Pods Quintal Tamil Nadu Coimbatore 4500 4500 3800
Groundnut - Quintal Maharashtra Mumbai 6000 5500 6000
Mustard Oil - 15 Kg. Uttar Pradesh Kanpur 1203 1222 1208
Mustard Oil Ordinary 15Kg. West Bengal Kolkata 1245 1260 1260
Groundnut Oil - 15 Kg. Maharashtra Mumbai 1425 1425 1155
Groundnut Oil Ordinary 15 Kg. Tamil Nadu Chennai 1395 1335 1298
Linseed Oil - 15 Kg. Uttar Pradesh Kanpur 1380 1395 1380
Castor Oil - 15 Kg. Andhra Pradesh Hyderabad 1215 1185 1238
Sesamum Oil - 15 Kg. NCT of Delhi Delhi 1850 1850 2250
Sesamum Oil Ordinary 15 Kg. Tamil Nadu Chennai 2325 2700 2775
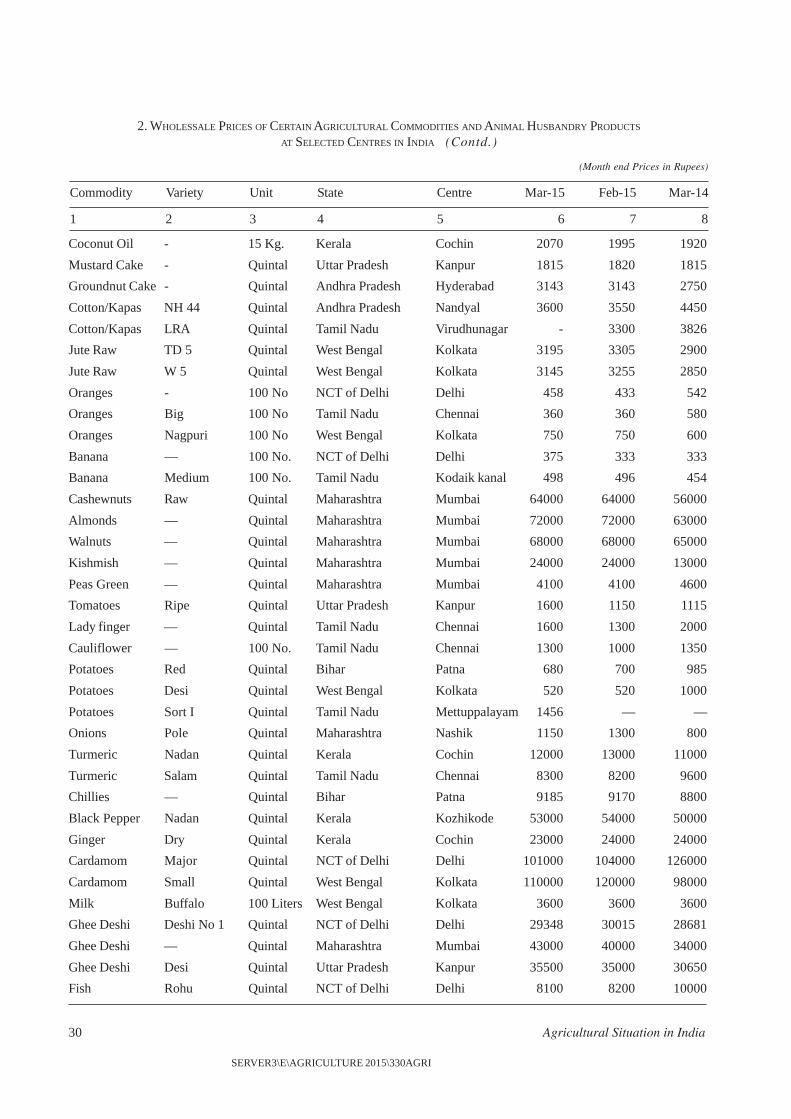
30 Agricultural Situation in India
SERVER3\E\AGRICULTURE 2015\330AGRI
Coconut Oil - 15 Kg. Kerala Cochin 2070 1995 1920
Mustard Cake - Quintal Uttar Pradesh Kanpur 1815 1820 1815
Groundnut Cake - Quintal Andhra Pradesh Hyderabad 3143 3143 2750
Cotton/Kapas NH 44 Quintal Andhra Pradesh Nandyal 3600 3550 4450
Cotton/Kapas LRA Quintal Tamil Nadu Virudhunagar - 3300 3826
Jute Raw TD 5 Quintal West Bengal Kolkata 3195 3305 2900
Jute Raw W 5 Quintal West Bengal Kolkata 3145 3255 2850
Oranges - 100 No NCT of Delhi Delhi 458 433 542
Oranges Big 100 No Tamil Nadu Chennai 360 360 580
Oranges Nagpuri 100 No West Bengal Kolkata 750 750 600
Banana — 100 No. NCT of Delhi Delhi 375 333 333
Banana Medium 100 No. Tamil Nadu Kodaik kanal 498 496 454
Cashewnuts Raw Quintal Maharashtra Mumbai 64000 64000 56000
Almonds — Quintal Maharashtra Mumbai 72000 72000 63000
Walnuts — Quintal Maharashtra Mumbai 68000 68000 65000
Kishmish — Quintal Maharashtra Mumbai 24000 24000 13000
Peas Green — Quintal Maharashtra Mumbai 4100 4100 4600
Tomatoes Ripe Quintal Uttar Pradesh Kanpur 1600 1150 1115
Lady finger — Quintal Tamil Nadu Chennai 1600 1300 2000
Cauliflower — 100 No. Tamil Nadu Chennai 1300 1000 1350
Potatoes Red Quintal Bihar Patna 680 700 985
Potatoes Desi Quintal West Bengal Kolkata 520 520 1000
Potatoes Sort I Quintal Tamil Nadu Mettuppalayam 1456 — —
Onions Pole Quintal Maharashtra Nashik 1150 1300 800
Turmeric Nadan Quintal Kerala Cochin 12000 13000 11000
Turmeric Salam Quintal Tamil Nadu Chennai 8300 8200 9600
Chillies — Quintal Bihar Patna 9185 9170 8800
Black Pepper Nadan Quintal Kerala Kozhikode 53000 54000 50000
Ginger Dry Quintal Kerala Cochin 23000 24000 24000
Cardamom Major Quintal NCT of Delhi Delhi 101000 104000 126000
Cardamom Small Quintal West Bengal Kolkata 110000 120000 98000
Milk Buffalo 100 Liters West Bengal Kolkata 3600 3600 3600
Ghee Deshi Deshi No 1 Quintal NCT of Delhi Delhi 29348 30015 28681
Ghee Deshi — Quintal Maharashtra Mumbai 43000 40000 34000
Ghee Deshi Desi Quintal Uttar Pradesh Kanpur 35500 35000 30650
Fish Rohu Quintal NCT of Delhi Delhi 8100 8200 10000
2. WHOLESSALE PRICES OF CERTAIN AGRICULTURAL COMMODITIES AND ANIMAL HUSBANDRY PRODUCTS
AT SELECTED CENTRES IN INDIA — (Contd.)
(Month end Prices in Rupees)
Commodity Variety Unit State Centre Mar-15 Feb-15 Mar-14
1 2 3 4 5 6 7 8
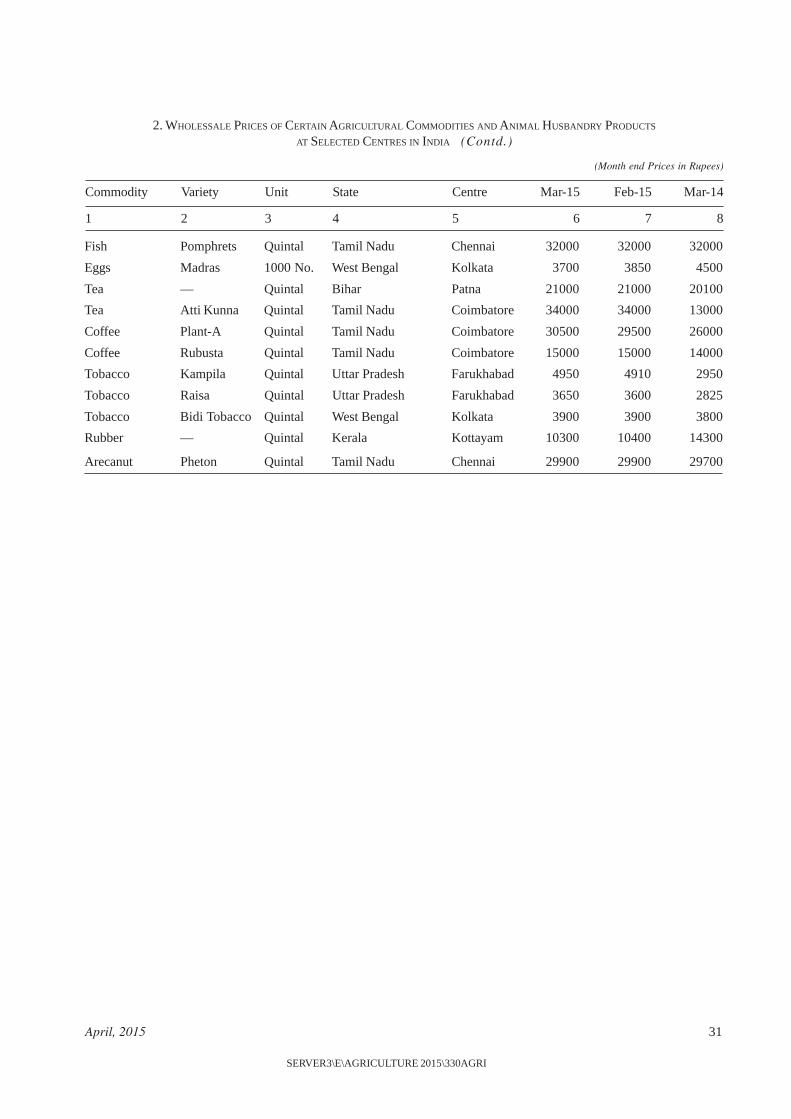
April, 2015 31
SERVER3\E\AGRICULTURE 2015\330AGRI
2. WHOLESSALE PRICES OF CERTAIN AGRICULTURAL COMMODITIES AND ANIMAL HUSBANDRY PRODUCTS
AT SELECTED CENTRES IN INDIA — (Contd.)
(Month end Prices in Rupees)
Commodity Variety Unit State Centre Mar-15 Feb-15 Mar-14
1 2 3 4 5 6 7 8
Fish Pomphrets Quintal Tamil Nadu Chennai 32000 32000 32000
Eggs Madras 1000 No. West Bengal Kolkata 3700 3850 4500
Tea — Quintal Bihar Patna 21000 21000 20100
Tea Atti Kunna Quintal Tamil Nadu Coimbatore 34000 34000 13000
Coffee Plant-A Quintal Tamil Nadu Coimbatore 30500 29500 26000
Coffee Rubusta Quintal Tamil Nadu Coimbatore 15000 15000 14000
Tobacco Kampila Quintal Uttar Pradesh Farukhabad 4950 4910 2950
Tobacco Raisa Quintal Uttar Pradesh Farukhabad 3650 3600 2825
Tobacco Bidi Tobacco Quintal West Bengal Kolkata 3900 3900 3800
Rubber — Quintal Kerala Kottayam 10300 10400 14300
Arecanut Pheton Quintal Tamil Nadu Chennai 29900 29900 29700
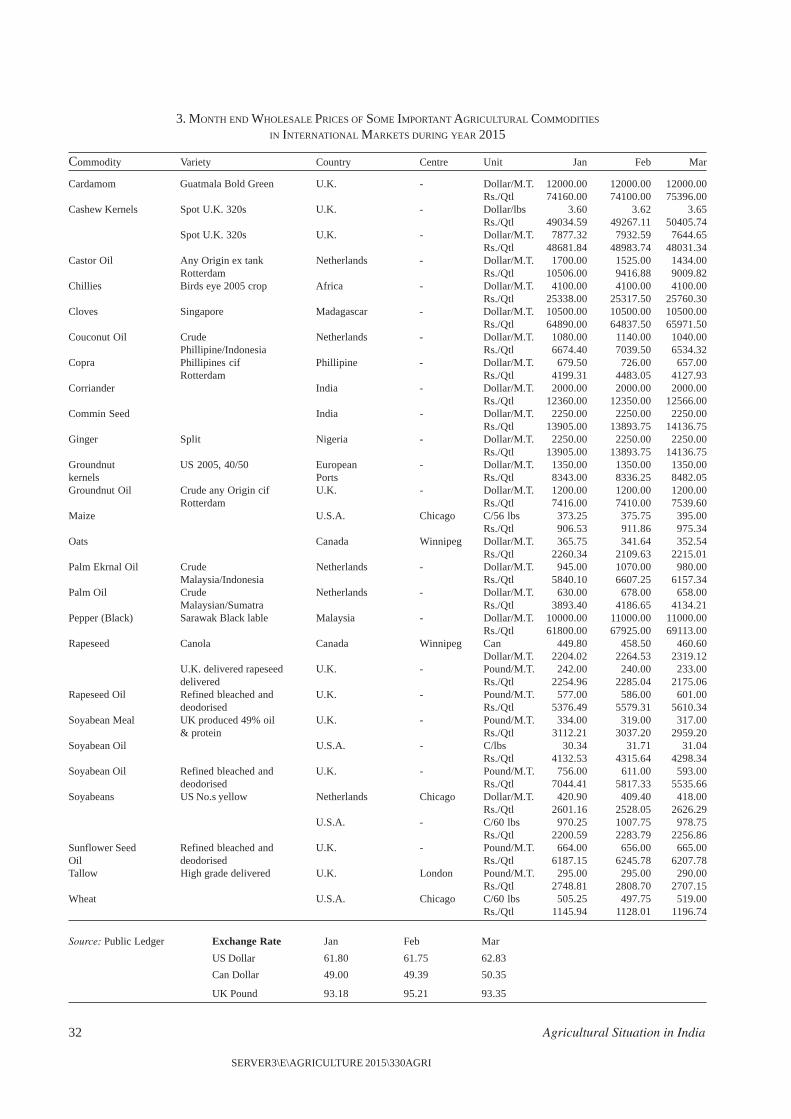
32 Agricultural Situation in India
SERVER3\E\AGRICULTURE 2015\330AGRI
3. MONTH END WHOLESALE PRICES OF SOME IMPORTANT AGRICULTURAL COMMODITIES
IN INTERNATIONAL MARKETS DURING YEAR 2015
Commodity Variety Country Centre Unit Jan Feb Mar
Cardamom Guatmala Bold Green U.K. - Dollar/M.T. 12000.00 12000.00 12000.00Rs./Qtl 74160.00 74100.00 75396.00
Cashew Kernels Spot U.K. 320s U.K. - Dollar/lbs 3.60 3.62 3.65Rs./Qtl 49034.59 49267.11 50405.74
Spot U.K. 320s U.K. - Dollar/M.T. 7877.32 7932.59 7644.65Rs./Qtl 48681.84 48983.74 48031.34
Castor Oil Any Origin ex tank Netherlands - Dollar/M.T. 1700.00 1525.00 1434.00Rotterdam Rs./Qtl 10506.00 9416.88 9009.82
Chillies Birds eye 2005 crop Africa - Dollar/M.T. 4100.00 4100.00 4100.00Rs./Qtl 25338.00 25317.50 25760.30
Cloves Singapore Madagascar - Dollar/M.T. 10500.00 10500.00 10500.00Rs./Qtl 64890.00 64837.50 65971.50
Couconut Oil Crude Netherlands - Dollar/M.T. 1080.00 1140.00 1040.00Phillipine/Indonesia Rs./Qtl 6674.40 7039.50 6534.32
Copra Phillipines cif Phillipine - Dollar/M.T. 679.50 726.00 657.00Rotterdam Rs./Qtl 4199.31 4483.05 4127.93
Corriander India - Dollar/M.T. 2000.00 2000.00 2000.00Rs./Qtl 12360.00 12350.00 12566.00
Commin Seed India - Dollar/M.T. 2250.00 2250.00 2250.00Rs./Qtl 13905.00 13893.75 14136.75
Ginger Split Nigeria - Dollar/M.T. 2250.00 2250.00 2250.00Rs./Qtl 13905.00 13893.75 14136.75
Groundnut US 2005, 40/50 European - Dollar/M.T. 1350.00 1350.00 1350.00kernels Ports Rs./Qtl 8343.00 8336.25 8482.05Groundnut Oil Crude any Origin cif U.K. - Dollar/M.T. 1200.00 1200.00 1200.00
Rotterdam Rs./Qtl 7416.00 7410.00 7539.60Maize U.S.A. Chicago C/56 lbs 373.25 375.75 395.00
Rs./Qtl 906.53 911.86 975.34Oats Canada Winnipeg Dollar/M.T. 365.75 341.64 352.54
Rs./Qtl 2260.34 2109.63 2215.01Palm Ekrnal Oil Crude Netherlands - Dollar/M.T. 945.00 1070.00 980.00
Malaysia/Indonesia Rs./Qtl 5840.10 6607.25 6157.34Palm Oil Crude Netherlands - Dollar/M.T. 630.00 678.00 658.00
Malaysian/Sumatra Rs./Qtl 3893.40 4186.65 4134.21Pepper (Black) Sarawak Black lable Malaysia - Dollar/M.T. 10000.00 11000.00 11000.00
Rs./Qtl 61800.00 67925.00 69113.00Rapeseed Canola Canada Winnipeg Can 449.80 458.50 460.60
Dollar/M.T. 2204.02 2264.53 2319.12U.K. delivered rapeseed U.K. - Pound/M.T. 242.00 240.00 233.00delivered Rs./Qtl 2254.96 2285.04 2175.06
Rapeseed Oil Refined bleached and U.K. - Pound/M.T. 577.00 586.00 601.00deodorised Rs./Qtl 5376.49 5579.31 5610.34
Soyabean Meal UK produced 49% oil U.K. - Pound/M.T. 334.00 319.00 317.00& protein Rs./Qtl 3112.21 3037.20 2959.20
Soyabean Oil U.S.A. - C/lbs 30.34 31.71 31.04Rs./Qtl 4132.53 4315.64 4298.34
Soyabean Oil Refined bleached and U.K. - Pound/M.T. 756.00 611.00 593.00deodorised Rs./Qtl 7044.41 5817.33 5535.66
Soyabeans US No.s yellow Netherlands Chicago Dollar/M.T. 420.90 409.40 418.00Rs./Qtl 2601.16 2528.05 2626.29
U.S.A. - C/60 lbs 970.25 1007.75 978.75Rs./Qtl 2200.59 2283.79 2256.86
Sunflower Seed Refined bleached and U.K. - Pound/M.T. 664.00 656.00 665.00Oil deodorised Rs./Qtl 6187.15 6245.78 6207.78Tallow High grade delivered U.K. London Pound/M.T. 295.00 295.00 290.00
Rs./Qtl 2748.81 2808.70 2707.15Wheat U.S.A. Chicago C/60 lbs 505.25 497.75 519.00
Rs./Qtl 1145.94 1128.01 1196.74
Source: Public Ledger Exchange Rate Jan Feb Mar
US Dollar 61.80 61.75 62.83
Can Dollar 49.00 49.39 50.35
UK Pound 93.18 95.21 93.35
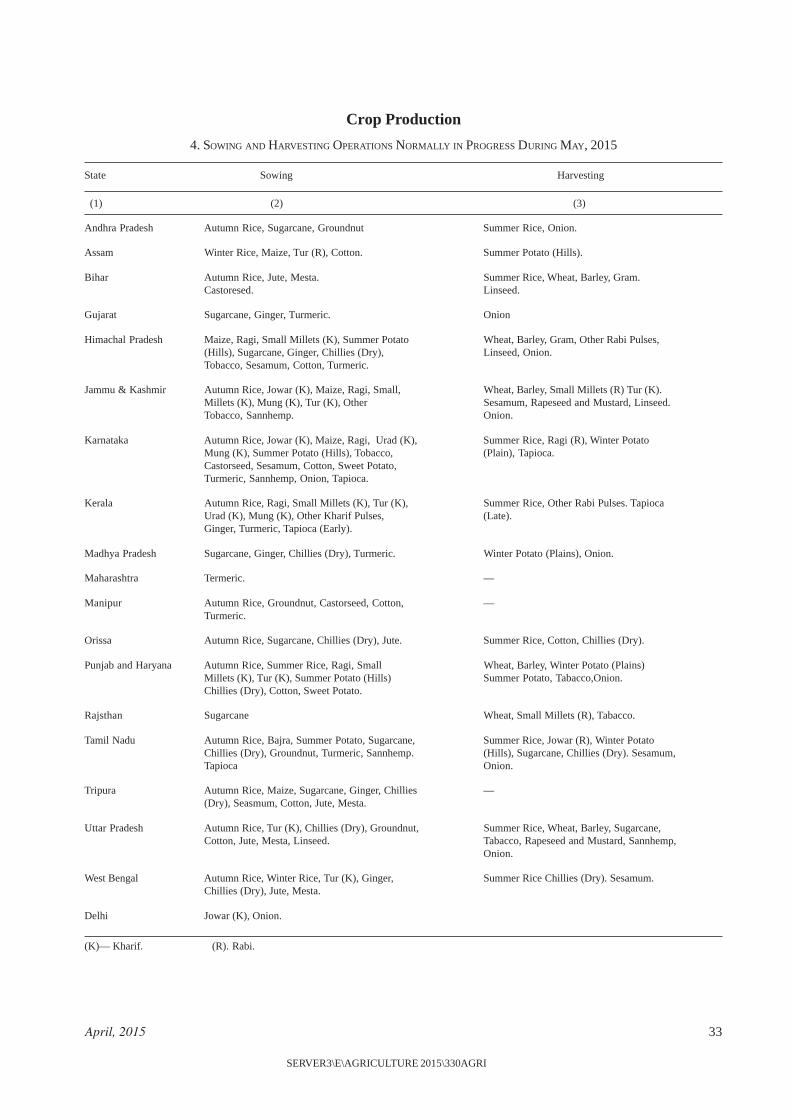
April, 2015 33
SERVER3\E\AGRICULTURE 2015\330AGRI
Crop Production
4. SOWING AND HARVESTING OPERATIONS NORMALLY IN PROGRESS DURING MAY, 2015
State Sowing Harvesting
(1) (2) (3)
Andhra Pradesh Autumn Rice, Sugarcane, Groundnut Summer Rice, Onion.
Assam Winter Rice, Maize, Tur (R), Cotton. Summer Potato (Hills).
Bihar Autumn Rice, Jute, Mesta. Summer Rice, Wheat, Barley, Gram.Castoresed. Linseed.
Gujarat Sugarcane, Ginger, Turmeric. Onion
Himachal Pradesh Maize, Ragi, Small Millets (K), Summer Potato Wheat, Barley, Gram, Other Rabi Pulses,(Hills), Sugarcane, Ginger, Chillies (Dry), Linseed, Onion.Tobacco, Sesamum, Cotton, Turmeric.
Jammu & Kashmir Autumn Rice, Jowar (K), Maize, Ragi, Small, Wheat, Barley, Small Millets (R) Tur (K).Millets (K), Mung (K), Tur (K), Other Sesamum, Rapeseed and Mustard, Linseed.Tobacco, Sannhemp. Onion.
Karnataka Autumn Rice, Jowar (K), Maize, Ragi, Urad (K), Summer Rice, Ragi (R), Winter PotatoMung (K), Summer Potato (Hills), Tobacco, (Plain), Tapioca.Castorseed, Sesamum, Cotton, Sweet Potato,Turmeric, Sannhemp, Onion, Tapioca.
Kerala Autumn Rice, Ragi, Small Millets (K), Tur (K), Summer Rice, Other Rabi Pulses. TapiocaUrad (K), Mung (K), Other Kharif Pulses, (Late).Ginger, Turmeric, Tapioca (Early).
Madhya Pradesh Sugarcane, Ginger, Chillies (Dry), Turmeric. Winter Potato (Plains), Onion.
Maharashtra Termeric. —
Manipur Autumn Rice, Groundnut, Castorseed, Cotton, —Turmeric.
Orissa Autumn Rice, Sugarcane, Chillies (Dry), Jute. Summer Rice, Cotton, Chillies (Dry).
Punjab and Haryana Autumn Rice, Summer Rice, Ragi, Small Wheat, Barley, Winter Potato (Plains)Millets (K), Tur (K), Summer Potato (Hills) Summer Potato, Tabacco,Onion.Chillies (Dry), Cotton, Sweet Potato.
Rajsthan Sugarcane Wheat, Small Millets (R), Tabacco.
Tamil Nadu Autumn Rice, Bajra, Summer Potato, Sugarcane, Summer Rice, Jowar (R), Winter PotatoChillies (Dry), Groundnut, Turmeric, Sannhemp. (Hills), Sugarcane, Chillies (Dry). Sesamum,Tapioca Onion.
Tripura Autumn Rice, Maize, Sugarcane, Ginger, Chillies —(Dry), Seasmum, Cotton, Jute, Mesta.
Uttar Pradesh Autumn Rice, Tur (K), Chillies (Dry), Groundnut, Summer Rice, Wheat, Barley, Sugarcane,Cotton, Jute, Mesta, Linseed. Tabacco, Rapeseed and Mustard, Sannhemp,
Onion.
West Bengal Autumn Rice, Winter Rice, Tur (K), Ginger, Summer Rice Chillies (Dry). Sesamum.Chillies (Dry), Jute, Mesta.
Delhi Jowar (K), Onion.
(K)— Kharif. (R). Rabi.
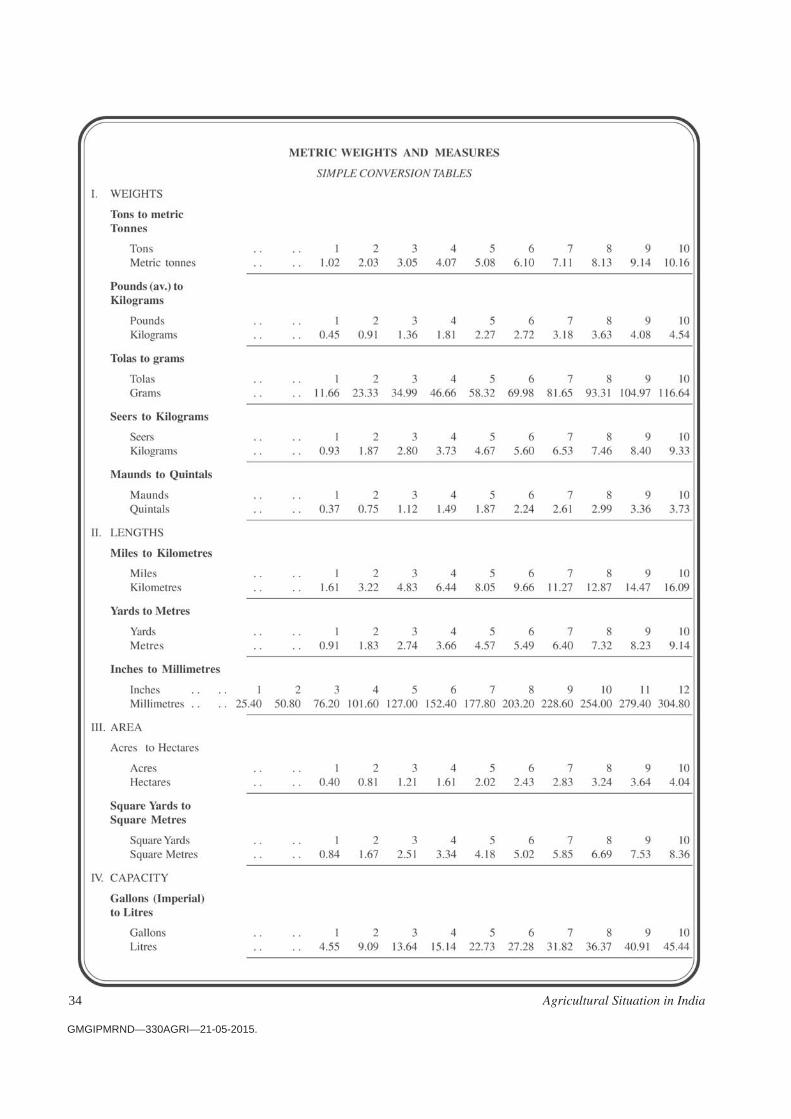
34 Agricultural Situation in India
GMGIPMRND—330AGRI—21-05-2015.
AGRICULTURAL SITUATION IN INDIA
APRIL, 2015
AGRICULTURAL SITUATION IN INDIA
GENERAL SURVEY OF AGRICULTURE
FARM SECTOR NEWS RELEASES
ARTICLES
Repayment Performance of Borrower andOverdues of Short Term Agricultural Creditin Bikaner Region of Rajasthan
Trends in Arrivals and Prices of Chickpea in Western Maharashtra
AGRO ECONOMIC RESEARCHProblems and Prospects of Oilseeds Production in India
COMMODITY REVIEWSFoodgrainsCommercial Crops
TRENDS IN AGRICULTURE : WAGES & PRICES
S2\d\330AGRI.cdr
Copies are available at:The Controller of Publications, Civil Lines, Delhi-110054
P. Agri. 21-04-2015600
PRINTED BY THE GENERAL MANAGER GOVERNMENT OF INDIA PRESS, MINTO ROAD, NEW DELHI-110002 AND PUBLISHED BY THE CONTROLLER OF PUBLICATIONS, DELHI-110054-2015
List of other Publications of the Directorate
ISSN 0002-167Regn. No. : 840
Periodicals
Agricultural Prices in India
Agricultural Wages in India
Cost of Cultivation of Principal Crops
District-wise Area and Production of Principal Crops in India
Year Book of Agro-Economic Research Studies
Land Use Statistics at a Glance
Farm Harvest Prices of Principal Crops in India
Agricultural Statistics at a Glance