Embed Size (px)
Citation preview
Proceedings: Second International Conference on Case Histories in Geotechnical Engineering, June 1-5,1988, St. Louis, Mo., Paper No. 6.105
ILLICON Analysis of Ellingsrud Test Fill G. Mesri Professor, University of Illinois at Urbana-Champaign, Urbana, Illinois, USA
D.O.K. Lo Research Assistant, University of Illinois at Urbana-Champaign, Urbana, Illinois, USA
K. Karlsrud Head, Foundations, Norwegian Geotechnical Institute, Oslo, Norway
Synopsis: The 50-m diameter test fill at Ellingsrud, Norway was constructed by NGI to determine preconsolidation pressure of a soft clay, mobilized under field conditions. The height of the fill was increased in four increments during 1972 to 1978. Settlement observations as well as pore water pressure measurements over a period of eleven years are used to evaluate predictions made by the 1l11CON computer program. ll..llCON analysis requires vertical profiles of compressibility and permeability parameters.
The computed surface settlements are within 2 em of the measured values during the first three loading stages. After the fourth loading, there is a larger range in the measured settlements, however, the computed values lie within the measured range. The computed pore water pressures are also in reasonable agreement with the observations. However, compressibility and permeability data for major depth intervals of the 24m soil profile are not available. Therefore, in spite of good agreement between prediction and field observation one can not be completely certain whether the input parameters in fact represent the true condition of the soil.
Introduction
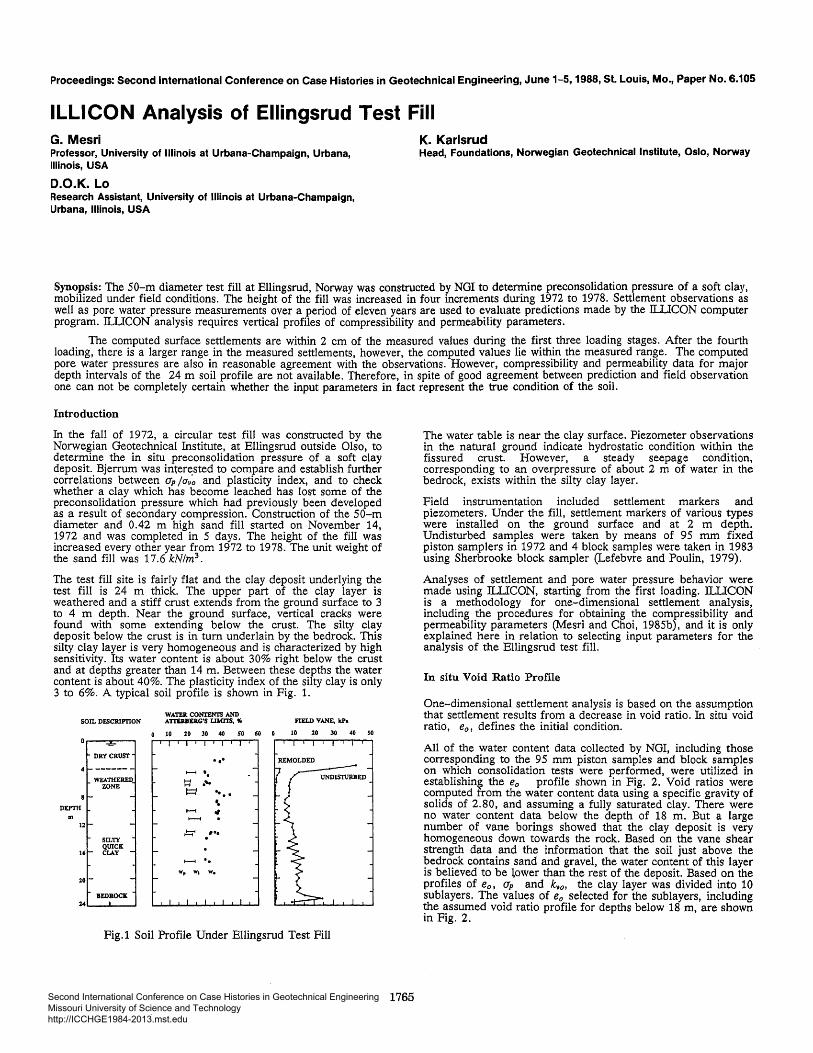
In the fall of 1972, a circular test fill was constructed by the Norwegian Geotechnical Institute, at Ellingsrud outside Olso, to determine the in situ preconsolidation pressure of a soft clay deposit. Bjerrum was interested to compare and establish further correlations between ap ja..,~ and plasticity index, and to check whether a clay which has become leached has lost some of the preconsolidation pressure which had previously been developed as a result of secondary compression. Construction of the 50-m diameter and 0.42 m high sand fill started on November 14, 1972 and was completed in 5 days. The height of the fill was increased every other year from 1972 to 1978. The unit weight of the sand fill was 17.6 kN!m3
•
The test fill site is fairly flat and the clay deposit underlying the test fill is 24 m thick. The upper part of the clay layer is weathered and a stiff crust extends from the ground surface to 3 to 4 m depth. Near the ground surface, vertical cracks were found with some extending below the crust. The silty clay deposit below the crust is in turn underlain by the bedrock. This silty clay layer is very homogeneous and is characterized by high sensitivity. Its water content is about 30% right below the crust and at depths greater than 14 m. Between these depths the water content is about 40%. The plasticity index of the silty clay is only 3 to 6%. A typical soil profile is shown in Fig. 1.
SOIL DESCRIPnON
...,.,.. DRY CRUST
4--------WEATHERED
ZONE
8- -DEYm
12,.. -SIL'IY QUICK
11> i- CLAY -
lO i- -BEDII.OCJC
24 t_
WATEJl CONTENTS AND ATI'ERBEJlG'S LIMITS, "
... 1--t . .
H .... H
t::::1 .... .. 1-i ., ~ .
.t:i'i •.. . 1--4 ..
w, w, w.
FIELD VANE, lcPa
REMOLDED
Fig.1 Soil Profile Under Ellingsrud Test Fill
1765
The water table is near the clay surface. Piezometer observations in the natural ground indicate hydrostatic condition within the fissured crust. However, a steady seepage condition, corresponding to an overpressure of about 2 m of water in the bedrock, exists within the silty clay layer.
Field instrumentation included settlement markers and piezometers. Under the fill, settlement markers of various types were installed on the ground surface and at 2 m depth. Undisturbed samples were taken by means of 95 mm fixed piston samplers in 1972 and 4 block samples were taken in 1983 using Sherbrooke block sampler (Lefebvre and Poulin, 1979).
Analyses of settlement and pore water pressure behavior were made using ll.ilCON, starting from the first loading. ll.LICON is a methodology for one-dimensional settlement analysis, including the procedures for obtaining the compressibility and permeability parameters (Mesri and Choi, 1985b), and it is only explained here in relation to selecting input parameters for the analysis of the Ellingsrud test fill.
In situ Void Ratio Prorlle
One-dimensional settlement analysis is based on the assumption that settlement results from a decrease in void ratio. In situ void ratio, e0 , defines the initial condition .
All of the water content data collected by NGI, including those corresponding to the 95 mm piston samples and block samples on which consolidation tests were performed, were utilized in establishing the e0 profile shown in Fig. 2. Void ratios were computed from the water content data using a specific gravity of solids of 2.80, and assuming a fully saturated clay. There were no water content data below the depth of 18 m. But a large number of vane borings showed that the clay deposit is very homogeneous down towards the rock. Based on the vane shear strength data and the information that the soil just above the bedrock contains sand and gravel, the water content of this layer is believed to be ~ower than the rest of the deposit. Based on the profiles of eo, (Jp and k..,0 , the clay layer was divided into 10 sublayers. The values of e0 selected for the sublayers, including the assumed void ratio profile for depths below 18m, are shown in Fig. 2.
Second International Conference on Case Histories in Geotechnical Engineering Missouri University of Science and Technology http://ICCHGE1984-2013.mst.edu
INITIAL VOID RATIO, e,
g.6r---,--o.,..s-..,--~·,...o -y-,---IT.2--r---,1.4
<!! WATER CONTENT PROFILE
e CONSOUDATION TFSIS
Fig. 2 Initial Void Ratio Profile
Initial Effective Vertical Stress
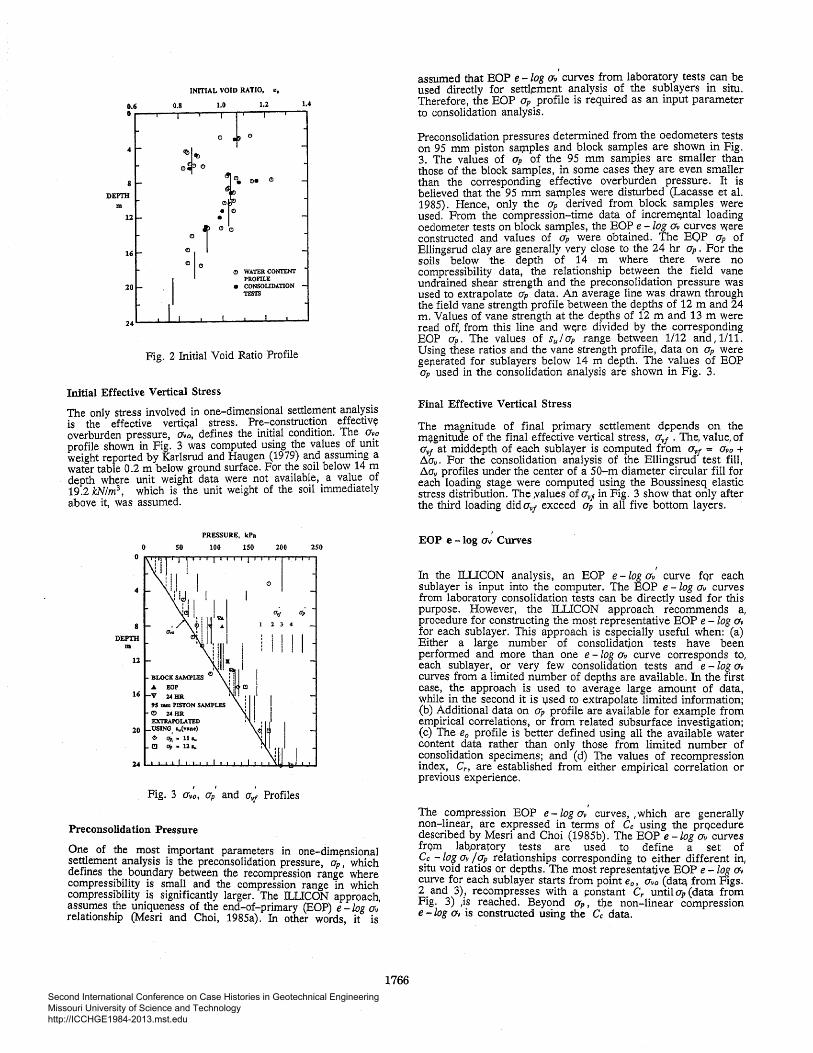
The only stress involved in one-dimensional settle~ent analy_sis is the effective vertic;al stress. Pre-constructiOn effect1v~ overburden pressure, a11o, defines the init~al condition. The a~o profile shown in Fig. 3 was computed usmg the values of. umt weight reported by Karlsrud and Haugen (1979) and assummg a water table 0.2 m below ground surface. For the soil below 14m depth where unit weight dat~ we~e not availab~e,. a vall;le of 19.2 kN!m3 , which is the umt we1ght of the sml 1mmed1ately above it, was assumed.
4
DEPIH m
20
so PRESSURE, kPa
lOG 150 200
Fig. 3 a~~. ap' and a~~ Profiles
Preconsolidation Pressure
250
One of the most important parameters in one-dim~nsional settJ.ement analysis is the preconsolidation pressure, ap , which defmes ti:te. ?oll!ldary between the recompr_ession range where compresstbtltty 1s small and the compression range in which compressibility is significantly larger. The IT.UCON approach assu~es t?e uniqu7ness of th7 end-of-primary (EOP) e -log a .. / relatiOnship (Mesn and Choi, 1985a). In other words, it is
1766
assumed that EOP e - log u../ curves from laboratory tests can be used directly for settlement analysis of the sublayers in situ. Therefore, the BOP Up profile is required as an input parameter to consolidation analysis.
Preconsolidation pressures determined from the oedometers tests on 95 mm piston sa!Jlples and block samples are shown in Fig. 3. The values of ap of the 95 mm samples are smaller than those of the block samples, in some cases they are even smaller than the corresponding effective overburden pressure. It is believed that the 95 mm samples were disturbed (Lacasse et al. 1985). Hence, only the ap derived from block samples were used. From the compression-time data of increm~ntal loading oedometer tests on block samples, the BOP e -log av curves were constructed and values of Up were obtained. The BOP Clp of Ellingsrud clay are generally very close to the 24 hr ap. For the soils below the depth of 14 m where there were no compressibility data, the relationship between the field vane undrained shear strength and the preconsolidation pressure was used to extrapolate ap data. An average line was drawn through the field vane strength profile between the depths of 12 m and 24 m. Values of vane strength at the depths of 12m and 13 m were read off, from this line and w<1re divided by the corresponding BOP CJp. The values of sui ap range between 1/12 and, 1/11. Using these ratios and the vane strength profile, data on ap were geperated for sublayers below 14 m depth. The values of BOP ap used in the consolidation analysis are shown in Fig. 3.
Final Effective Vertical Stress
The magnitude of final primary settlement d~pends on the mq.gnitude of the final effective vertical stress, C/111 • The, value, of a111 at middepth of each sublayer is computed from Clvf = avo + D..a11 • For the consolidation analysis of the Ellingsrud test fill, D..a~ profiles under the center of a 50-m diameter circular fill for each loading stage were computeq using the Boussinesq elastic stress distribution. The ~alues of a111 in Fig. 3 show that only after the third loading did CJ111 exceed CJp in all five bottom layers.
I
EOP e -log av Curves
In the lll.JCON analysis, an BOP e - log ov' curve fqr each sublayer is input into the computer. The BOP e -log av curves from laboratory consolidation tests can be directly used for this purpose. However, the IT..,UCON approach recommends a, procedure for constructing the most representative BOP e -log Clv for each sublayer. This approach is especially useful when: (a) Either a large number of consolidatjon tests have been performed and more than one e - log av curve corresponds to, each sub layer, or very few consolidation tests and e - log Clv curves from a limited number of depths are available. In the first case, the approach is used to average large amount of data, while in the second it is vsed to extrapolate limited information; (b) Additional data on Clp profile are available for example from empirical correlations, or from related subsurface investigation; (c) The eo profile is better defined using all the available water content data rather than only those from limited number of consolidation specimens; and (d) The values of recompression index, Cr, are established from either empirical correlation or previous experience.
The compression BOP e -log ov' curves, , which are generally non-linear, are expressed in terms of Cc using the procedure described by Mesri and Choi (1985b). The EOP e-log av curves frQm labpratory tests are used to define a set of C:c - lo¥ av / 9'P relationships corresponding to either different in, Situ v01d rattos or depths. The most representat,ive BOP e -log u~ curve for each sublayer starts from point e0, avo (dat<:l from Figs. 2. and 3)! recompresses with a ~onstant Cr until ap (data from Ftg. 3) ,IS reached. Beyond ap, t}J.e non-linear compression e -log o~ is constructed using the Cc data.
Second International Conference on Case Histories in Geotechnical Engineering Missouri University of Science and Technology http://ICCHGE1984-2013.mst.edu
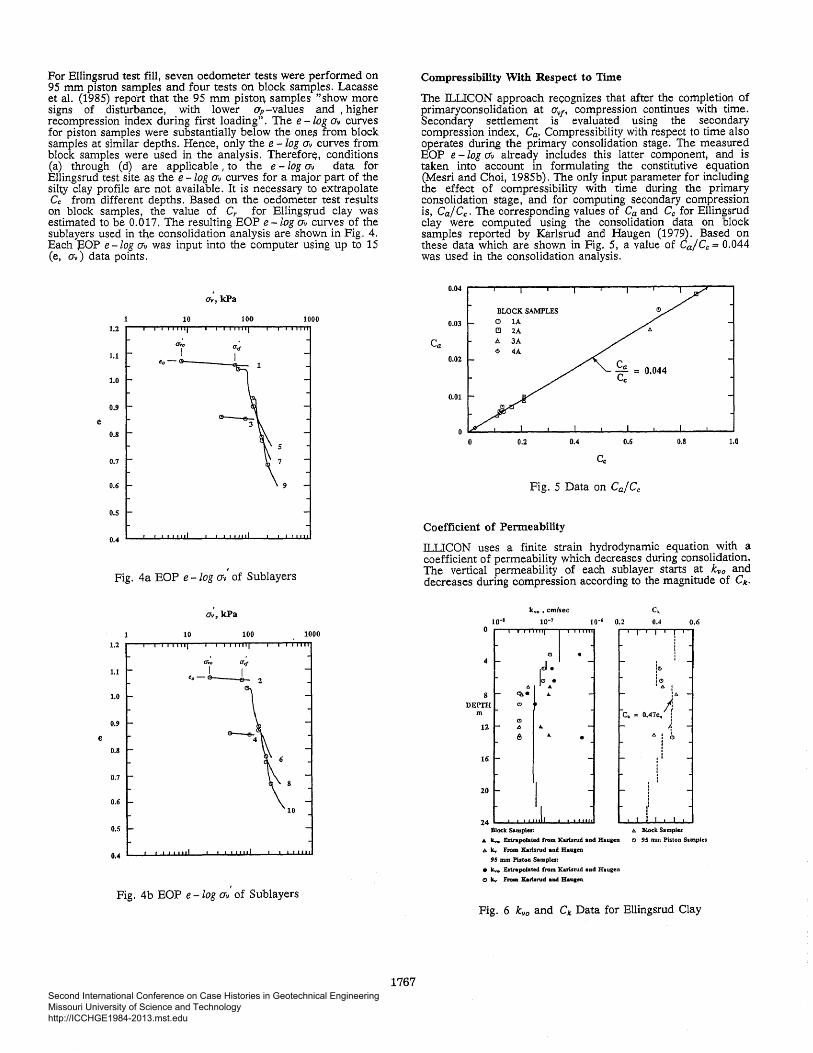
For Ellingsrud test fill, seven oedometer tests were performed on 95 mm piston samples and four tests on block samples. Lacasse et al. (1985) repo"rt that the 95 mm piston, samples ''show more signs of disturbance, with lower ap -values and , higher recompression index during first loading". The e -log a" curves for piston samples were substantially below the one,s from block samples at similar depths. Hence, only thee -log av curves from block samples were used in the analysis. Therefor~. conditions (a) through (d) are applicable, to the e -log av data for Ellingsrud test site as the e - log av curves for a major part of the silW clay profile are not available. It is necessary to extrapolate Cc from different depths. Based on the oedometer test results on block samples, the value of C, for Ellings;rud clay was estimated to be 0.017. The resulting BOP e -log a" curves of the sublayers used in th,e consolidation analysis are shown in Fig. 4. Each }30P e -log a" was input into the computer using up to 15 (e, av) data points.
a:, kPa
10 100 1000
e
Fig. 4a EOP e -log a"' of Sublayers
a:, kPa
10 100 1000
e
Fig. 4b BOP e -log av' of Sublayers
1767
Compressibility With Respect to Time
The ILUCON approach recognizes that after the completion of primaryconsolidation at avf• compression continues with time. Secondary settlement is evaluated using the secondary compression index, Ca. Compressibility with respect to time also operates durin,g the primary consolidation stage. The measured BOP e -log av already includes this latter component, and is taken into account in formulating the constitutive equation (Mesri and Choi, 1985b). The only input parameter for including the effect of compressibility with time during the primary consolidation stage, and for computing secondary compression is, Ca/ Cc . The corresponding values of Ca and Cc for Ellingsrud clay were computed using the consolidation data on block samples reported by Karlsrud and Haugen (1979). Based on these data which are shown in Fig. 5, a value of Ca/Cc = 0.044 was used in the consolidation analysis.
0.2 0.4 0.6 0.8 1.0
Fig. 5 Data on Ca/Cc
Coefficient of Permeability
ILUCON uses a finite strain hydrodynamic equation with a coefficient of permeability which decreases during consolidation. The vertical permeability of each sublayer starts at kvo and decreases during compression according to the magnitude of Ck.
k..,, em/sec
10-7
24~~~~~~~=
Block Sa~~~ples:
i~ le> t 6 :
16.
Jj ck = 0.47e. :
1 6 ! ~ I.
6. lllock Samples
0.6
& I<.., Extrapolated from Karlsnad and Haucen 0 ll5 mm Piston Samples
6 k. From Karlsrud and Haucen
95 mm Piston Samples:
• I<.., Extrapolated from Kamnad and Haugen
o 1<. Froat Karl.tnad aDd Haucen
Fig. 6 k"o and C1c Data for Ellingsrud Clay
Second International Conference on Case Histories in Geotechnical Engineering Missouri University of Science and Technology http://ICCHGE1984-2013.mst.edu
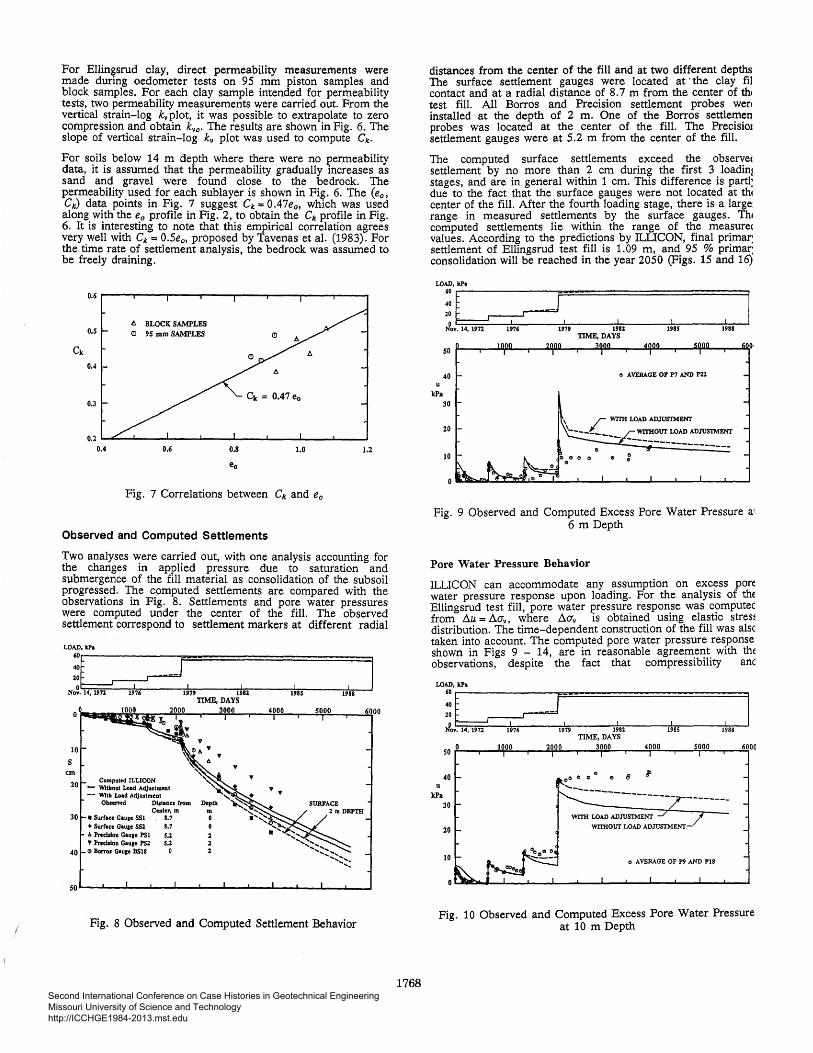
For Ellingsrud clay, direct permeability measurements were made during oedometer tests on 9 5 mm piston samples and block samples. For each clay sample intended for permeability tests, two permeability measurements were carried out. From the vertical strain-log kv plot, it was possible to extrapolate to zero compression and obtain kvo· The results are shown in Fig. 6. The slope of vertical strain-log kv plot was used to compute C~c.
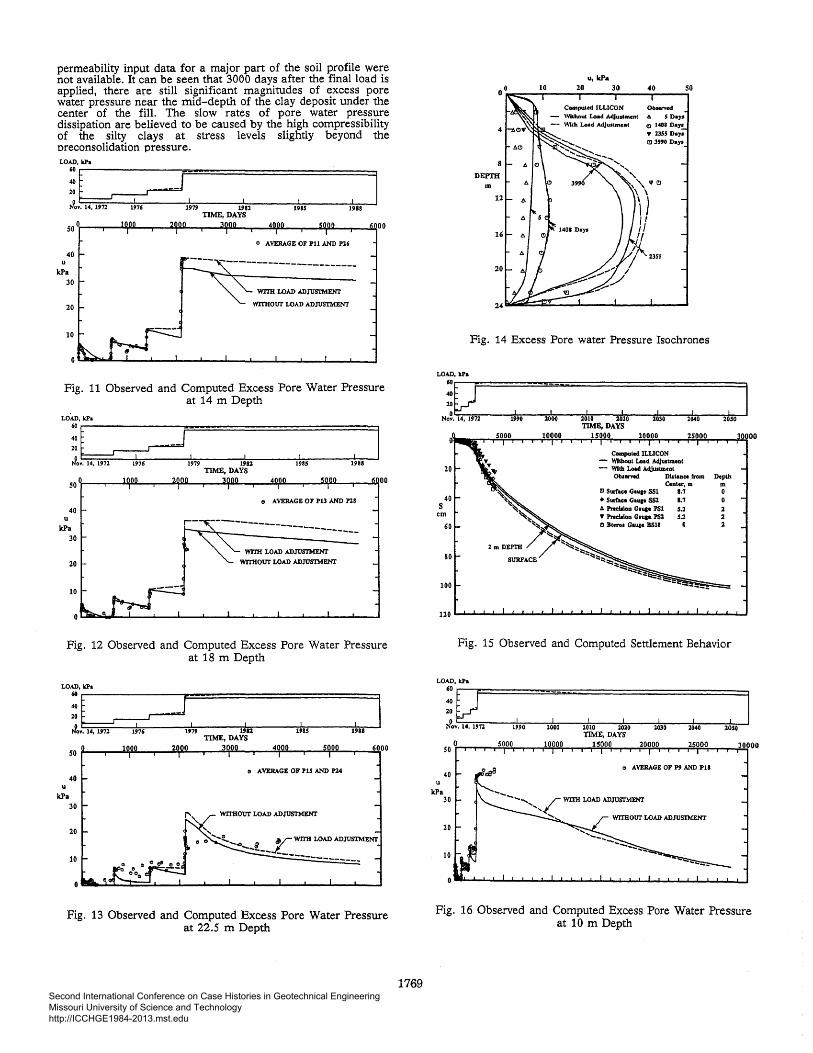
For soils below 14 m depth where there were no permeability data, it is assumed that the permeability gradually increases as sand and gravel were found close to the bedrock. The permeability used for each sublayer is shown in Fig. 6. The (e0 ,
C~c) data points in Fig. 7 suggest C~c = 0.47e~, which was used along with the e0 profile in Fig. 2, to obtain the C~c profile in Fig. 6. It is interesting to note that this empirical correlation agrees very well with C" == 0.5e0 , proposed by Tavenas et al. (1983). For the time rate of settlement analysis, the bedrock was assumed to be freely draining.
0.6
0.5
ck 0.4
0.3
0.2 0.4
0. BLOCK SAMPLES C!J 95 mm SAMPLES
0.6 0.8 1.0
Fig. 7 Correlations between C~c and eo
Observed and Computed Settlements
1.2
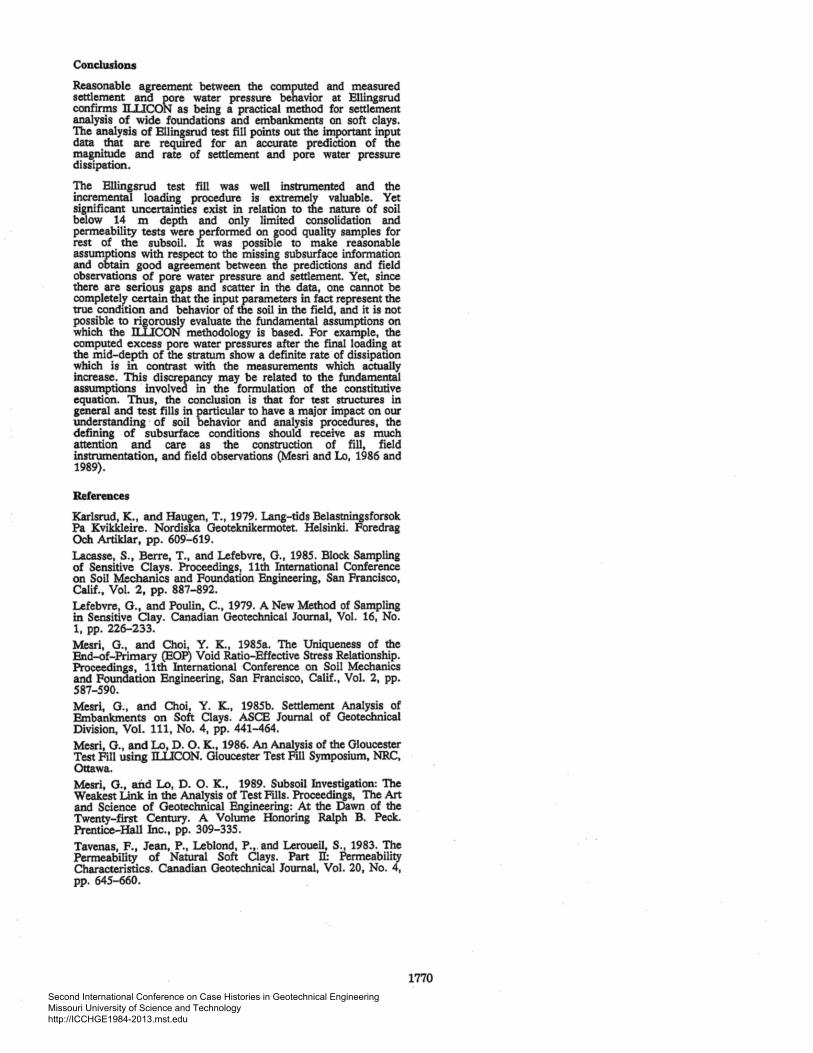
Two analyses were carried out, with one analysis accounting for the changes in applied pressure due to saturation and submergence of the fill material as consolidation of the subsoil progressed. The computed settlements are compared with the observations in Fig. 8. Settlements and pore water pressures were computed under the center of the fill. The observed settlement correspond to settlement markers at different radial
LOAD, kh
;~r--------_F•:~===,=====,=====,~ Nov. 14, 1971 1g76 1979 1981 1985 1988
c:m Computed ILLICON
- Without Load Acl)ustment -· With Load Acijustme~~t
Obse~ Dillllnce Crom
• Surface Gauae SSl • Surface Gauae SS1 b. l'rtcUioo Gauae PS 1 ' PrtcUion Gauce PS:l
Center, m 8.7 8.7 5.l 5.1
4 0 1!1 Borros Gauce BS18 0
TIME, DAYS 3000
Fig. 8 Observed and Computed Settlement Behavior
6000
1768
distances from the center of the fill and at two different depths The surface settlement gauges were located at ·the clay fil contact and at a radial distance of 8. 7 m from the center of th~ test fill. All Barros and Precision settlement probes wen installed at the depth of 2 m. One of the Borras settlemen probes was located at the center of the fill. The Precisiot settlement gauges were at 5.2 m from the center of the fill.
The computed surface settlements exceed the observe< settlement by no more than 2 em during the first 3 loadinl stages, and are in general within 1 em. This difference is partl: due to the fact that the surface gauges were not located at the center of the fill. After the fourth loading stage, there is a large: range in measured settlements by the surface gauges. Th~ computed settlements lie within the range of the measure< values. According to the predictions by ll.LICON, final primar: settlement of Ellingsrud test fill is 1. 09 m, and 9 5 % primar: consolidation will be reached in the year 2050 (Figs. 15 and 16)
LOAD, kh
;:~r--_~-: ======!
rPov. 14, 1972 1976 1979 1~8% 19ss t9ss
40
kPa 30
20
10
TIME, DAYS
" AVERAGE OF P7 AND 1'11
Fig. 9 Observed and Computed Excess Pore Water Pressure a1 6 m Depth
Pore Water Pressure Behavior
ILLICON can accommodate any assumption on excess pon water pressure response upon loading. For the analysis of the Ellingsrud test fill, pore water pressure response was computec from flu = /lay where /lay is obtained using elastic stres! distribution. Th~ time-dependent construction of the fill was alsc taken into account. The computed pore water pressure response shown in Figs 9 - 14, are in reasonable agreement with the observations, despite the fact that compressibility anc
LOAD, kl'a
::c~---------------~F-~~~======================~
rPo~1979 19ss 1~88
50 ° 40
u kPa
30
20
10
6000
Fig. 10 Observed and Computed Excess Pore Water Pressure at 10m Depth
Second International Conference on Case Histories in Geotechnical Engineering Missouri University of Science and Technology http://ICCHGE1984-2013.mst.edu
permeability input data for a major part of the soil profile were not available. It can be seen that 3000 days after the final load is applied, there are still significant magnitudes of excess pore water pressure near the mid-depth of the clay deposit under the center of the fill. The slow rates of pore water pressure dissipation are believed to be caused by the high compressibility of the silty clays at stress levels slightly beyond the oreconsolidation pressure. LOAD, kPa
=~r--~_ ... :::::=:-==== ;o •. 14. 197l 1976 t979 1Js2 t9ss 19ss
TIME, DAYS
Fig. 11 Observed and Computed Excess Pore Water Pressure at 14m Depth
LOAD, kPa
=~r----------------_i-~-~,~============================~
r-fov. 14, 197l 1976 1979 1J8l 1~BS t9ss
40 u
kPa 30
20
10
TIME, DAYS
Fig. 12 Observed and Computed Excess Pore Water Pressure at 18m Depth
LOAD, kPa
~M~~-~4-,l-97-l----1-9-76-------~~9~:~======~=,8l=========l=~~=5========1~=~8==~ TIME, DAYS
50 ~--~_.~--~--~~~--~3~0~--r-~~~~--~~~--~000
40
kPa 30
20
10
~ AVERAGE OF 1'15 AND Pl4
Fig. 13 Observed and Computed Excess Pore Water Pressure at 22.5 m Depth
1769
10
4
DEPTH m
u, kPa 20 30 40 50
A 5 Days 0 1408 Daya y l3SS Days I!J 3990 Days
Fig. 14 Excess Pore water Pressure Isochrones
LOAD, kPa
~~r--1~~===,====~,~~===============,======,======,==~
Nov. 14, 197l 1990 lOOO lOJO 2040 l050
Ceoter, 111 Ill 1!1 Surface Gaqe SSl 8.7 0
40 • Surface Gaqe SSl 8.7 0 s A Predlloo Gaqe PSl S.l ern ., PrK!aloo Gauce PS:l S.l
C!'l BoJTOI Ga111e BS18 0
80
1()0
Fig. 15 Observed and Computed Settlement Behavior
LOAD, kPa
:[TJJ~--le~========~~~==============================~
;a ... 14, 1m 199o 10oo W3o 2J.w zOso
40 u
kPa 30
20
10
~ AVERAGE OF P9 AND Pl8
...... _ ... ...._ / wrrH LOAD ADJUSTMENT ............... ._£
..._ WITHOur LOAD ADJUSTMEI'n'
Fig. 16 Observed and Computed Excess Pore Water Pressure at 10m Depth
Second International Conference on Case Histories in Geotechnical Engineering Missouri University of Science and Technology http://ICCHGE1984-2013.mst.edu
Conclusions
Reasonable agreement between the computed and measured settlement and pore water pressure behavior at Bllingsrud confirms RliCON as being a practical method for settlement analysis of wide foundations and embankments on soft clays. The analysis. of Bllingsrud test fill points out the important input data that are required for an accurate prediction of the magnitude and rate of settlement and pore water pressure dissipation.
The Bllingsrud test fill was well instrumented and the incremental loading procedure is extremely valuable. Yet significant uncertainties exist in relation to the nature of soil below 14 m depth and only limited consolidation and permeability tests were performed on good quality samples for rest of the subsoil. It was ~ssible to make reasonable assumptions with respect to the missing subsurface information and obtain good agreement between the predictions and field observations of pore water pressure and settlement. Yet, since there are serious gaps and scatter in the data, one cannot be completelr certain that the input parameters in fact represent the true cond1tion and behavior of the soil in the field, and it is not possible to rigorously evaluate the fundamental assumptions on which the nllCON methodology is based. For example, the computed excess pore water pressures after the final loading at the mid-depth of the stratum show a defmite rate· of dissipation which is in contrast with. the measurements which actually increase. This discrepancy may be related to the fundamental assumptions · involved in the formulation of the constitutive equation. Thus, the conclusion is that for test structures in general and test fills in particular to have a major impact on our understanding · of soil behavior and analysis procedures, the defining of subsurface conditions should receive as much attention and care as the construction of fill, field instrumentation, and field observations (Mesri and Lo, 1986 and 1989).
References
Karlsrud, K., and Haugen, T., 1979. Lang-tids Belastningsforsok Pa Kvikkleire. Nordiska Geoteknikermotet. Helsinki. Foredrag Och Artiklar, pp. 609:..619. Lacasse, S., Berre, T., and Lefebvre, G., 1985. Block Sampling of Sensitive Clays. Proceedings, 11th International Conference on Soil Mechanics and Foundation Engineering, San Francisco, Calif., Vol. 2, pp. 887-892. Lefebvre, G., and Poulin, C., 1979. A New Method of Sampling in Sensitive Clay. C&l)adian Geotechnical Journal, Vol. 16, No. 1, pp. 226-233. Mesri, G., and Choi, Y. K., 1985a. The Uniqueness of the End-of-Primary (BOP) Void Ratio-Effective Stress Relationship. Proceedings, 11th International ·Conference on Soil Mechanics and Foundation Engineering, San Francisco, Calif., Vol. 2, pp. 581-590. Mesri, G., and Choi, Y. K., 1985b. Settlement Analysis of Embankments on Soft Clays. ASCB Journal of Geotechnical Division, Vol. 111, No. 4, pp. 441-464. Mesri, G., and Lo, D. 0. K., 1986. An Analysis of the Gloucester Test Fill using n.llCON. Gloucester Test Fill Symposium, NRC, Ottawa. Mesri, G., aild Lo, D. 0. X., 1989. Subsoil Investigation: The Weakest Link in the Analysis of Test Fills. Proceedings, The Art and Science of Geotechnical Engineering: At the Dawn of the Twenty-first Century. A Volume Honoring Ralph B. Peck. Prentice-Hall Inc., pp. 309-335. Tavenas, F., Jean, P., Leblond, P.,. and Leroueil, S., 1983. The Permeability of Natural Soft Clays. Part n: Permeability Characteristics. Canadian Geotechnical Journal, Vol. 20, No. 4, pp. 645-660.
1770 Second International Conference on Case Histories in Geotechnical Engineering Missouri University of Science and Technology http://ICCHGE1984-2013.mst.edu

![फॉर्म भ ने पूर्मjncu.in/Attachment/ENTRANCE HOW TO FILL.pdf · NSS Certificate Holder Rover Ranger/ Scout Sports Player ( C] InternationalÛNationalCJ StateODistricUUmversity](https://img.pdfslide.us/doc/110x75/5ff457bb051ba0254a6b3502/aaaaa-a-aa-aaaaajncuinattachmententrance-how-to-fillpdf.jpg)


![Mutus Liber Latomorum [1765]](https://img.pdfslide.us/doc/110x75/55cf9a90550346d033a25c2b/mutus-liber-latomorum-1765.jpg)