Embed Size (px)
Citation preview
OZONE-HEALTH EFFECTS FIELD STUDY OF
CHILDREN AND COUNSELORS AT TWO DAY CAMPS IN
NEW JERSEY, JULY 1988
JULY 1990
Frances J.Dunston, M.D., M.P.H.
State Commissioner of Health
New Jersey Department of Health
Division of Occupational and Environmental Health
Environmental Health Service
MIL '/s. JERSEY
DEPARTMENT OF
HEALTH
A BCT1U SIATt Or HIAMH
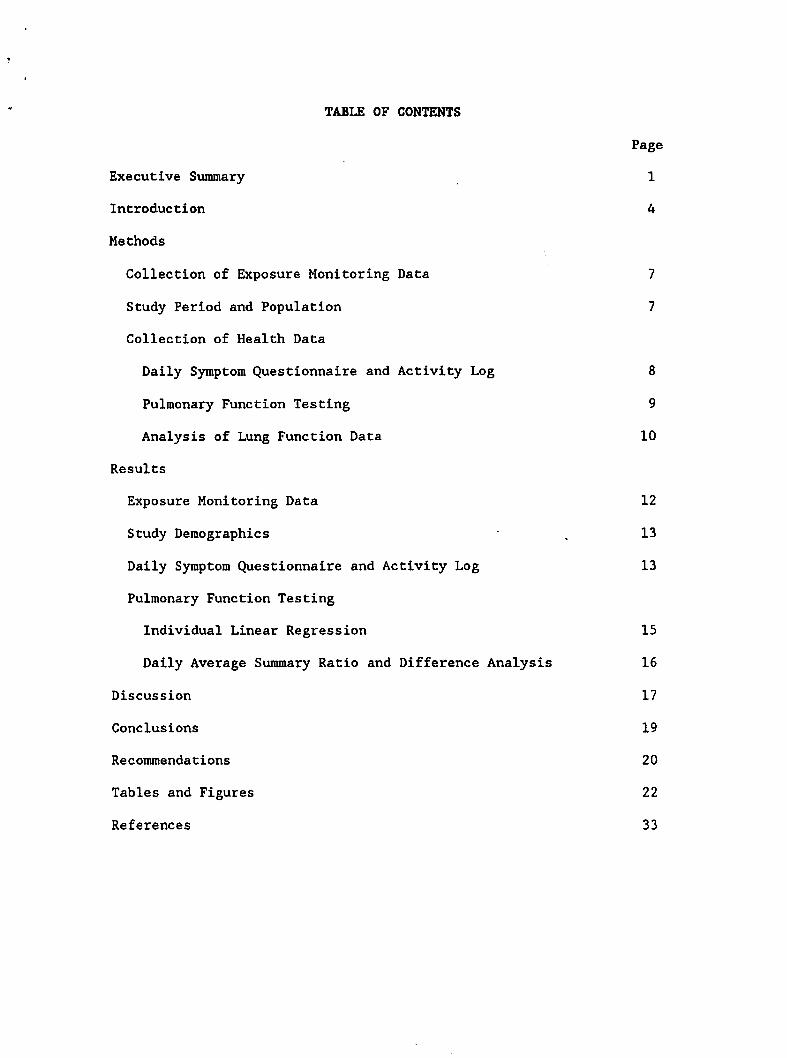
TABLE OF CONTENTS
Page
Executive Summary 1
Introduction 4
Methods
Collection of Exposure Monitoring Data 7
Study Period and Population 7
Collection of Health Data
Daily Symptom Questionnaire and Activity Log 8
Pulmonary Function Testing 9
Analysis of Lung Function Data 10
Results
Exposure Monitoring Data 12
Study Demographics ■ , 13
Daily Symptom Questionnaire and Activity Log 13
Pulmonary Function Testing
Individual Linear Regression 15
Daily Average Summary Ratio and Difference Analysis 16
Discussion 17
Conclusions 19
Recommendations 20
Tables and Figures 22
References 33
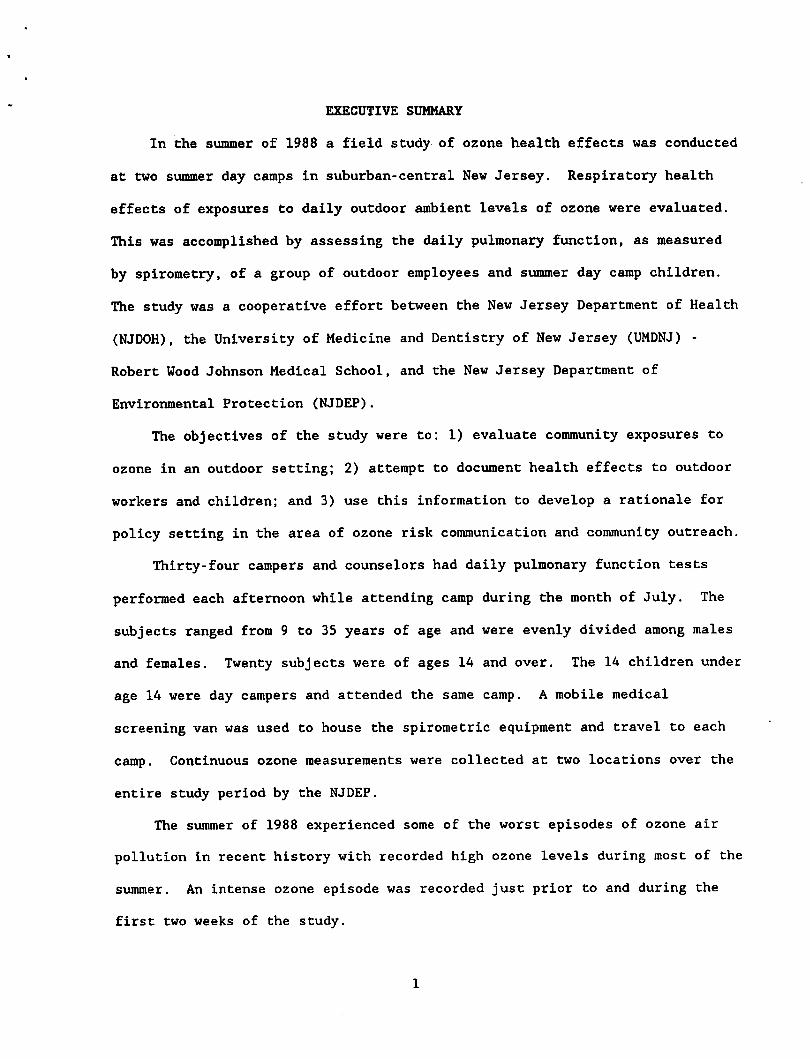
EXECUTIVE SUMMARY
In the summer of 1988 a field study of ozone health effects was conducted
at two summer day camps in suburban-central New Jersey. Respiratory health
effects of exposures to daily outdoor ambient levels of ozone were evaluated.
This was accomplished by assessing the daily pulmonary function, as measured
by spirometry, of a group of outdoor employees and summer day camp children.
The study was a cooperative effort between the New Jersey Department of Health
(NJDOH), the University of Medicine and Dentistry of New Jersey (UMDNJ) -
Robert Wood Johnson Medical School, and the New Jersey Department of
Environmental Protection (NJDEP).
The objectives of the study were to: 1) evaluate community exposures to
ozone in an outdoor setting; 2) attempt to document health effects to outdoor
workers and children; and 3) use this information to develop a rationale for
policy setting in the area of ozone risk communication and community outreach.
Thirty-four campers and counselors had daily pulmonary function tests
performed each afternoon while attending camp during the month of July. The
subjects ranged from 9 to 35 years of age and were evenly divided among males
and females. Twenty subjects were of ages 14 and over. The 14 children under
age 14 were day campers and attended the same camp. A mobile medical
screening van was used to house the spirometric equipment and travel to each
camp. Continuous ozone measurements were collected at two locations over the
entire study period by the NJDEP.
The summer of 1988 experienced some of the worst episodes of ozone air
pollution in recent history with recorded high ozone levels during most of the
summer. An intense ozone episode was recorded just prior to and during the
first two weeks of the study.
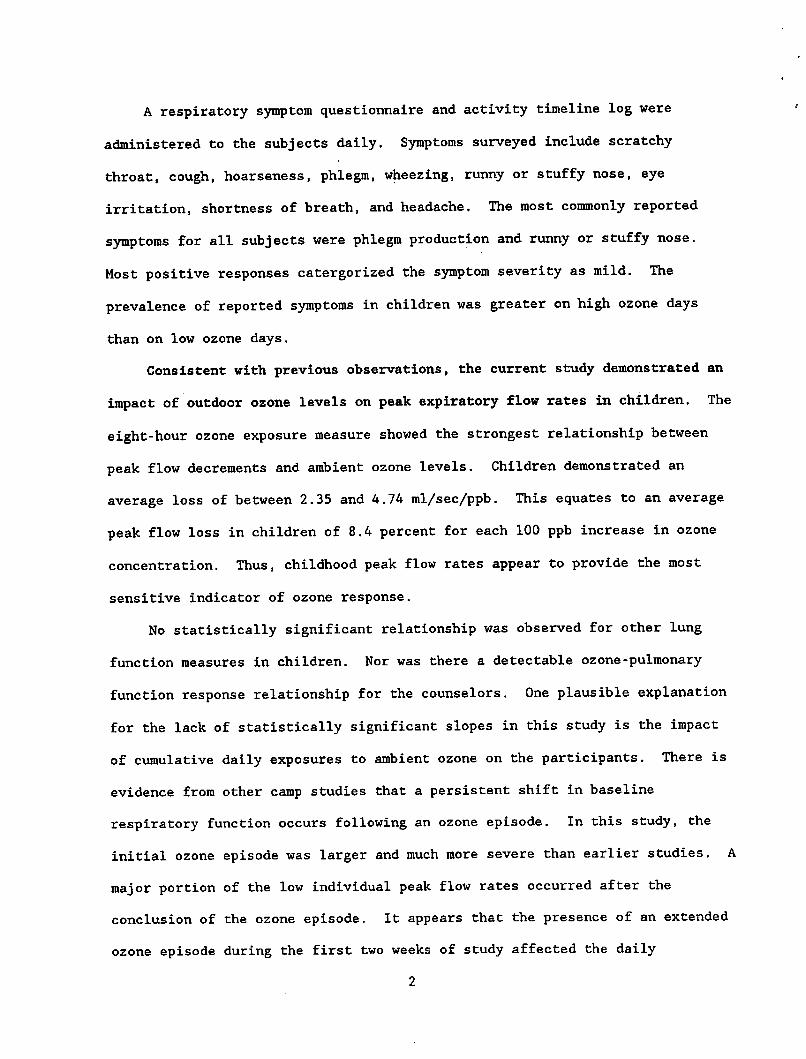
A respiratory symptom questionnaire and activity timeline log were
administered to the subjects daily. Symptoms surveyed include scratchy
throat, cough, hoarseness, phlegm, wheezing, runny or stuffy nose, eye
irritation, shortness of breath, and headache. The most commonly reported
symptoms for all subjects were phlegm production and runny or stuffy nose.
Most positive responses catergorized the symptom severity as mild. The
prevalence of reported symptoms in children was greater on high ozone days
than on low ozone days.
Consistent with previous observations, the current study demonstrated an
impact of outdoor ozone levels on peak expiratory flow rates in children. The
eight-hour ozone exposure measure showed the strongest relationship between
peak flow decrements and ambient ozone levels. Children demonstrated an
average loss of between 2.35 and 4.74 ml/sec/ppb. This equates to an average
peak flow loss in children of 8.4 percent for each 100 ppb increase in ozone
concentration. Thus, childhood peak flow rates appear to provide the most
sensitive indicator of ozone response.
No statistically significant relationship was observed for other lung
function measures in children. Nor was there a detectable ozone-pulmonary
function response relationship for the counselors. One plausible explanation
for the lack of statistically significant slopes in this study is the impact
of cumulative daily exposures to ambient ozone on the participants. There is
evidence from other camp studies that a persistent shift in baseline
respiratory function occurs following an ozone episode. In this study, the
initial ozone episode was larger and much more severe than earlier studies. A
major portion of the low individual peak flow rates occurred after the
conclusion of the ozone episode. It appears that the presence of an extended
ozone episode during the first two weeks of study affected the daily
2

dose-response relationship.
Primary prevention to ozone exposure through decreased ambient levels is
the best method for protecting public health. However, it is likely that
summer-time ozone levels will remain high for the foreseeable future due to
the enormous complexity of the problem. Given this, the only visible public
health alternative is to increase the public's awareness (i.e., secondary
prevention) of the potential ozone-related health hazards and what can be done
on a personal level to reduce those hazards through changing individual
behaviors, such as modification of activity levels during ozone episodes.
For the past few years, NJDOH and NJDEP have been actively working
together to inform the public about ozone episodes, the hazards of ozone
exposure and how to reduce overall individual risks. Activities such as the
NJDEP Ozone Advisory System (Episode Watch), the NJDOH identification and
dissemination of information to high risk groups, and active deparmental
participation with environmental and educational organizations need to be
continued. New Jersey must continue its commitment and efforts to reduce
ozone formation as well as to address other significant outdoor air pollution
issues that affect public health.

INTRODUCTION
Ozone is a persistent summertime air pollutant in New Jersey (USEPA,
1990; Berry and Klotz, 1987). Frequent violations of the National Ambient Air
Quality Standard occur each year with numerous multiple day episodes and
multiple hour daily elevations. The purpose of the present study was to
evaluate the respiratory health effects of outdoor occupational and community
exposures to ambient ozone. This was accomplished by assessing the daily
pulmonary function, as measured by spirometry, of a group of outdoor employees
at two day camps during the summer. For comparison, a subset of children (day
campers) participating in one of the day camps was included in the overall
study design. The findings presented here have important implications for
state governmental policy concerning the control of occupational and community
exposures to ambient ozone and risk communication policy targeted to high risk
groups. The study was a joint cooperative effort between the New Jersey
Department of Health (NJDOH), the University of Medicine and Dentistry of New
Jersey (UMDNJ) - Robert Wood Johnson Medical School, and the New Jersey
Department of Environmental Protection (NJDEP).
A number of controlled human exposure chamber studies have reported
significant decrements in pulmonary function, and the presence of respiratory
symptoms, associated with ozone exposure. The majority of the controlled
chamber studies have focused on the effects of ozone alone among exercising
adults. As the ozone-health effects literature grows, there is strong
evidence that lung function decrements can occur at relatively low ozone
concentrations. Laboratory and field studies of adults who exercise heavily
for short periods of time have provided evidence for the existence of
short-term, reversible decrements in pulmonary function to ozone
concentrations at or near the National Ambient Air Quality Standard of 0.12
U

parts per million (ppm) (McDonnell et al., 1983; Adams and Schelegle, 1983;
Kulle et al., 1985; Spektor et al., 1988a; Avol et al., 1984, 1985). A
controlled chamber study of children exposed to low levels of ozone while
vigorously exercising also demonstrated significant decreases in pulmonary
function (McDonnell et al., 1985).
The duration of ozone exposure in many chamber studies has been one to
two hours. As noted, lung function decrements have been reported following
short-term exposures to relatively low concentrations of ozone. Lung function
decrements are also a function of exposure duration. Since elevated ambient
ozone episodes frequently last many hours, prolonged exposure to ozone levels
above the national health standard are of significant public health concern.
One chamber study (Folinsbee et al., 1988) recently reported on adults who
were exercising moderately while being exposed to 0.12 ppm ozone for 6.6
hours. The authors concluded that prolonged exposure resulted in progressive
and significant changes in respiratory function and symptoms.
Epidemiological evaluation of children playing outdoors has offered a
unique opportunity to explore the human responses to ambient levels of ozone
in a natural setting. During the summer, children typically spend much of
their time outdoors engaged in supervised or unsupervised recreational
activities, which are frequently very active. The long hours children spend
outdoors generally occur at a time of day when ambient ozone concentrations
are typically at their highest. Furthermore, children have a higher
respiratory rate than adults. All of these factors would increase children's
effective ozone dose to the lungs.
Field health studies of children attending summer camps in California,
Pennsylvania and New Jersey have detected inverse associations between lung
function and maximum hourly ozone concentrations measured outdoors (Lippmann
5
et al., 1983; Bock et al., 1985; Lioy et al., 1985; Spektor et al.t 1988a;
Higgins et al., 1990). In two of these studies, all maximum hourly ozone
concentrations were below the current National Ambient Air Quality Standard
(NAAQS). Another study of children in Tennessee (Kinney et al., 1989)
detected decreases in pulmonary function with a maximum hourly ozone
concentration of 0.078 ppm, well below the NAAQS.
A study of adults engaged in a regular daily program of outdoor exercise
in New York State found significant decrements in pulmonary function (Spektor
et al., 1988b). The decrements were similar in magnitude to those seen in
children in summer camp and about twice as large as those reported for chamber
studies. The authors concluded that ambient cofactors can increase ozone
responsiveness and that the results from chamber studies may substantially
underestimate the ozone associated effects that can occur among populations
engaged in normal outdoor recreational activity.
Of further concern is the fact that two studies (Lioy et al., 1985;
Raizenne et al., 1989) have shown that baseline shifts in pulmonary function
parameters can occur after pollution episodes. This produces complications in
interpreting ozone exposure-pulmonary response data from day to day, and
indicates additional biological responses can occur in the lung.
Pulmonary responses resulting from exposure to levels of ozone below the
health standard have been documented in healthy active children and adults.
The ozone levels at which these effects have occurred are commonly found in
New Jersey during the summer months. The objectives of this study were to: 1)
evaluate community exposures to ozone in an outdoor suburban setting; 2)
attempt to document pulmonary responses and symptom expression in outdoor
workers and children; and 3) use this information to develop a rationale for
policy setting in the area of ozone risk communication and community outreach.
6

METHODS
Collection of Exposure Monitoring Data:
Two ambient air pollution monitoring sites were used for the study. One
was an existing regional monitoring station operated by NJDEP and located at
Rider College in Lawrence Township, Mercer County, within eight miles of the
participating camps. The other monitoring site was a mobile trailer located
on site at the Hamilton YMCA, one of the two day camps in the study. The
mobile trailer monitor was installed and operated specifically for this study
by NJDEP. Ozone was continuously monitored using a chemiluminescent analyzer
and hourly ozone concentrations were entered into an exposure data base by
UMDNJ. Quality assurance for the ozone data was performed by the NJDEP.
An exposure data base was developed from the data collected at each
monitoring location. Ozone measures of interest included the one-hour average
ozone value just prior to the daily spirometric test and the eight-hour
average ozone level for the day of the test, 9 A.M. to A P.M. In order to
take into account cumulative ozone exposures over multiple days, two
additional ozone metrics were calculated. These include two- and three-day
running averages using the daytime eight-hour average ozone level (9 A.M. to 4
P.M.) for the test day, the day prior to the test, and two days prior to the
spirometry test.
Ambient temperature, relative humidity, wind rose, precipitation, and UV
radiation were provided by Princeton University Center for Energy and
Environmental Studies.
Study Period and Population:
In New Jersey, the month of July consistently has the highest magnitude
and frequency of ozone episodes (Berry and Klotz, 1987). For this reason, the
month of July was selected as the study period. Data were collected Monday
7
through Sunday for the month of July 1988, beginning on Tuesday, July 5th.
Since the participants only attended day camps, each subject could have up to
19 test days.
Two central suburban New Jersey summer day camps were chosen for study.
Both camps were located in Mercer County. They were approximately two miles
apart. The day camps included a private camp, the Hamilton YMCA (Y-camp), and
a camp run by a municipal recreation department, the Hamilton Recreation Day
Camp (Rec-camp). A total of thirty-four subjects were enrolled in the study:
20 counselors and 14 campers. The camps were visited at the same time of day
throughout the study period by a NJDOH mobile medical van.
A pre-questionnaire was administered to all subjects in May or June to
ascertain their baseline health status and to provide a basis for evaluation
for eligibility into the study. The questionnaire was adapted from the
Harvard health questionnaire for the pre-health status evaluation (Speizer,
1988). Individuals with pre-existing respiratory disease (eg., asthma) were
excluded from the study.
Collection of Health Data:
Daily Symptom Questionnaire and Activity Log
A daily symptom questionnaire and a brief daily activity log were
developed for use during the testing program. The daily questionnaire was
administered by a trained nursing staff and was based on self-reporting of
symptoms and activity for the previous 24-hour period. Symptoms surveyed
include scratchy throat, cough, hoarseness, phlegm, wheezing, runny or stuffy
nose, eye irritation, shortness of breath, and headache. Symptom severity was
specified to be absent, mild, moderate, or severe. Subjects were also asked
about bronchodilator or inhalant use, daily smoking history, and exposure to
secondary smoke.
8

In order to consider the effect of physical exertion on the effects of
ozone upon the respiratory tract, a daily activity time log was developed to
ascertain activity, location of activity, and the level of exertion of the
activity for each subject. Level of exertion was self-reported as mild,
moderate, strenuous, or maximal.
Preliminary information collected on each subject during the first day of
testing included age, race, sex, weight, height, residential address, and camp
attended. Standing height was measured without shoes.
Pulmonary Function Testing
The pulmonary function tests were administered at the Y-camp on 19 days
and, due to scheduling differences, only on 12 days at the Rec-camp. None of
the participants were available for testing on the weekend. The testing was
done by trained technicians using a calibrated Collins water seal spirometer
equipped with an Eagle I microprocessor which provided an immediate printout
of pre-selected spirometric indices. The spirometer volume was calibrated
daily using a standard three-liter syringe to insure that an accuracy of +/-
three percent of the reading was maintained. The spirometer was transported
between the camps in an air conditioned, mobile medical van. Ambient
temperature was measured at each test site.
Three measures of lung function were used: forced vital capacity (FVC),
forced expiratory volume in the first second (FEV1), and peak expiratory flow
rate (PEFR). The FVC is defined as the largest volume of air that can be
forcefully exhaled after a maximal inspiration. The FEV1 is the largest
volume of air that can be forcefully exhaled during the first second of the
FVC. The highest flow of air that can be exhaled during a forced expiration
starting from full inflation of the lungs (i.e., total lung capacity) is
called the PEFR.
9

Each subject performed spirometric maneuvers in a standing position.
Subjects wore noseclips. For the days available at both camps, each subject
was tested and three acceptable forced maximal expiratory curves were obtained
by time-volume tracings. Tracings were considered acceptable if: 1) the rise
time of the curve was smooth and free from evidence of variable effort or
coughs, displaying no bumps or deflections in the tracings; 2) no early
terminations occurred (failure to reach a plateau); and 3) the difference
between the two best curves was less than five percent or 100 milliliter (ml),
whichever is greater. A random sample of ten percent of all spirometric curve
tracings were evaluated by a certified respiratory technician to determine the
presence of quality assurance criteria as defined by the American Thoracic
Society (ATS) standards (ATS, 1987).
The NJDOH medical van visited each camp between the hours of noon and 5
P.M. The Rec-camp was visited first each day and respiratory testing occurred
between 12:00 noon and 1:30 P.M. The Y-camp lung function testing occurred
between 3:30 P.M. and 4:30 P.M. on each day of the study.
Analysis of Lung Function Data:
From the three best tracings made by each subject each day, lung function
(FVC, FEV1, and PEFR) values were calculated using criteria established by the
ATS Snowbird Workshop (Gardner et al., 1979). Two different sets of analyses
were performed on the data: individual linear regression for each subject and
daily average measures for all subjects and particular sub-groups.
The first set of analyses included all subjects who underwent spirometric
testing during the four-week study. Individual linear regression slopes were
computed for each subject's lung function versus ozone exposure in the
one-hour and four- or eight-hour period preceding the lung function
measurement. A four-hour average ozone exposure metric was used for the
10
Rec-camp and an eight-hour average for the Y-camp since testing was completed
earlier in the day for the Rec-camp and later for the Y-camp. Linear
regression slopes for the lung function values versus ambient temperature were
also computed.
The individual regression slopes were averaged together and tested for
statistical significance using T-tests. The average regression slopes were
then expressed in terms of milliliters per parts per billion (ml/ppb) ozone
for FVC and FEV1 and milliliters per second per parts per billion (ml/sec/ppb)
ozone for PEFR. The data set was examined for statistical outliers, defined
as individual data points lying at least three standard deviations from the
ozone versus function regression lines for each subject.
The data were analyzed further by comparing the observed peak expiratory
flow rates for each subject with the expected peak flow rates based on each
subject's age, sex, and height. Expected peak flows were calculated from
Knudson's predicted equations (Knudson et al., 1976). Two daily summary
measures were calculated for peak flows. The first measure was the average
daily difference between the individual's observed minus expected peak flow.
The average difference regression line slopes were determined and expressed in
terms of ml/sec/ppb. The second measure was the average daily ratio of each
subject's observed to the expected function level. The average ratio
regression line slopes were expressed in terms of percent change per ppb.
Linear regression slopes were calculated for each daily summary measure and
the ozone exposure in the one-hour and eight-hour period preceding the
spirometric test. Additionally, two- and three-day running ozone averages
using the daily eight-hour average from the day of the lung function exam and
up to two days prior to the examination were used as exposure metrics.
11
RESULTS
Exposure Monitoring Data:
The summer of 1988 experienced some of the worst episodes of ozone
pollution in recent history (Lioy et al., 1989), and New Jersey recorded high
ozone levels during most of the summer. The camp locations experienced two
distinct ozone episodes during the study. The first episode began two days
prior to the start of the study and was marked by a persistent elevated peak
ozone level near or above the NAAQS for approximately two weeks. High ozone
levels persisted until the beginning of the third week of the study. Ozone
levels were relatively low to moderate for the third week due to rainy and/or
cloudy weather. The second ozone episode occurred during the last week of the
study. These sharp differences in ozone levels provided an opportunity to
examine the effects of persistent versus daily ozone exposure on lung
function; however, it precluded obtaining the baseline lung function data on
each participant, which was obtained in the previous studies by Lippmann et
al. (1983) and Spektor et al. (1988). Further, since the testing ended on
July 29th, there were an inadequate number of days available after the episode
periods to establish the baseline as reported by Lioy et al. (1985).
The Rider College monitoring site recorded eight days in July (25.8%)
with at least one daily one-hour peak ozone concentration above the ambient
air quality standard of 0.12 ppm. The Rider College maximum one-hour peak
ozone level reached 0.204 ppm during one of the days of the study period.
Due to electrical problems during the installation and early operation of
the Hamilton ozone monitoring equipment at the Y-camp, ozone data were not
available from that location until the last week of the study. The Y-camp
ozone monitor was left in operation for one month after the completion of the
pulmonary testing. Correlation of ambient ozone measurement was made between
12
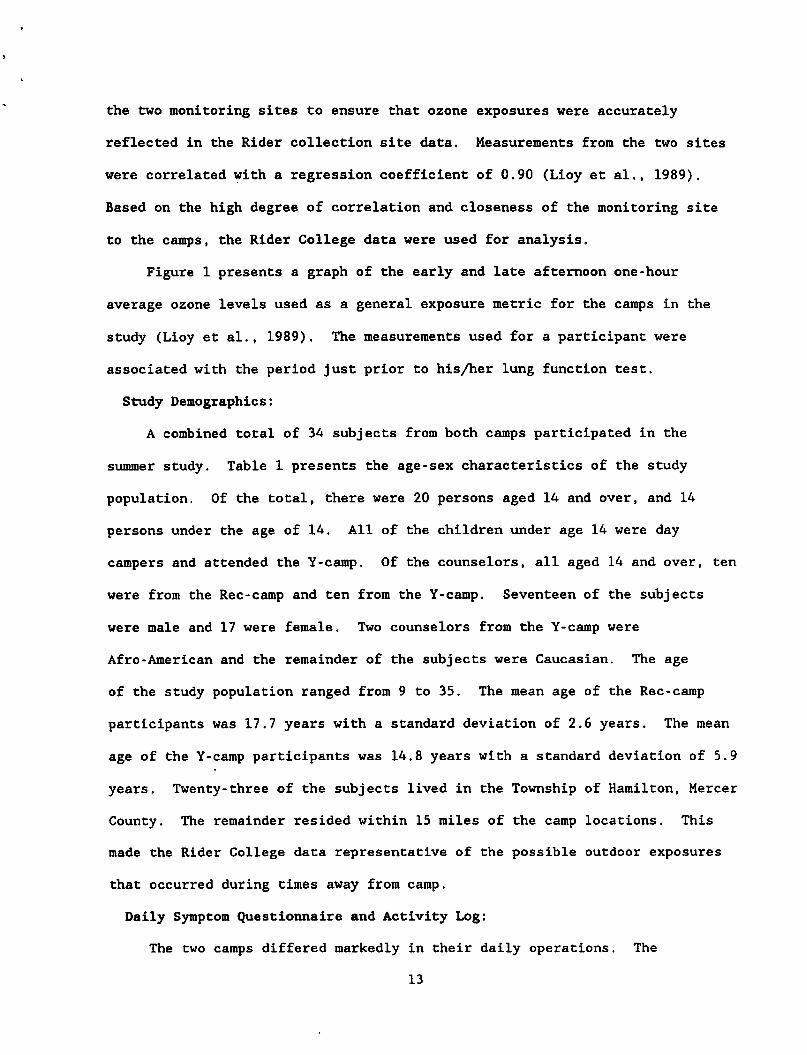
the two monitoring sites to ensure that ozone exposures were accurately
reflected in the Rider collection site data. Measurements from the two sites
were correlated with a regression coefficient of 0.90 (Lioy et al., 1989).
Based on the high degree of correlation and closeness of the monitoring site
to the camps, the Rider College data were used for analysis.
Figure 1 presents a graph of the early and late afternoon one-hour
average ozone levels used as a general exposure metric for the camps in the
study (Lioy et al., 1989). The measurements used for a participant were
associated with the period just prior to his/her lung function test.
Study Demographics:
A combined total of 34 subjects from both camps participated in the
summer study. Table 1 presents the age-sex characteristics of the study
population. Of the total, there were 20 persons aged 14 and over, and 14
persons under the age of 14. All of the children under age 14 were day
campers and attended the Y-camp. Of the counselors, all aged 14 and over, ten
were from the Rec-camp and ten from the Y-camp. Seventeen of the subjects
were male and 17 were female. Two counselors from the Y-camp were
Afro-American and the remainder of the subjects were Caucasian. The age
of the study population ranged from 9 to 35. The mean age of the Rec-camp
participants was 17.7 years with a standard deviation of 2.6 years. The mean
age of the Y-camp participants was 14.8 years with a standard deviation of 5.9
years. Twenty-three of the subjects lived in the Township of Hamilton, Mercer
County. The remainder resided within 15 miles of the camp locations. This
made the Rider College data representative of the possible outdoor exposures
that occurred during times away from camp.
Daily Symptom Questionnaire and Activity Log:
The two camps differed markedly in their daily operations. The
13

Rec-camp's hours of operation were 9 A.M. until 2:30 P.M., whereas the Y-camp
operated from 8 A.M. until 4:30 P.M. Observation of the two camps' daily
activities revealed that counselors and campers at the Y-camp were much more
active than the other group. Y-camp subjects reported physical activity more
often and for longer periods of time. The measure of physical activity
developed for this study is the action level which is based on a person's
degree of physical effort and the duration of activities for a given day. The
higher action levels of the Y-camp participants are described in Tables 2 and
3.
The pulmonary function tests were administered in the late afternoon at
the Y-camp, when ozone levels were generally high. Testing was done at the
Rec-camp in the early afternoon. Because of this and the longer duration of
exposure and increased activity of the Y-camp, the Y-camp subjects received a
larger dose of ozone than those at the Rec-camp (Lioy et al., 1989). Because
of this apparent exposure difference between counselors at the two camps,
subsequent analyses stratified the counselors by camp attended.
A wide range of responses were evident among the symptom questions. The
most commonly reported symptoms for all subjects by person-day were phlegm
production (24.6%) and runny or stuffy nose (37.2%). The least reported
symptoms included wheezing (2.6%), shortness of breath (4.4%), and chest pains
(3.2%). Most positive responses categorized the symptom severity as mild.
Few severe responses were reported.
Figure 2 presents the proportion of positive responses on any of the
study days by symptom and subject group. The prevalence of reported symptoms
was greater for every symptom category among the two Y-camp groups, counselors
and campers, than for the Rec-camp group. Runny or stuffy nose occurred in
over 50 percent of the person-days for campers at the Y-camp, 72 percent
14

higher than the Y-camp counselors and over two and one-half times more
prevalent than the Rec-camp group. The positive response to cough and phlegm
was about the same for both Y-camp groups and was approximately three times
more frequent than the Rec-camp group. Counselors at the Y-camp reported a
substantially higher proportion of hoarseness than either of the other groups.
Figures 3 and 4 represent the proportion of positive responses by symptom
and by each Y-camp group for three exposure categories of ozone.
Categorization of the exposure variable was done using the hourly ozone
concentration just prior to lung function testing. The exposure categories
are low (less than 80 parts per billion (ppb)), moderate (80 to 120 ppb), and
high (over 120 ppb) ozone. No difference could be detected between the rate
of positive symptoms and the ozone level for the Y-camp counselors. For the
Y-camp campers, cough and runny or stuffy nose symptoms were related to ozone
level. In addition, all camper symptom rates were higher for the highest
ozone category than for the lowest category. Since no Rec-camp ozone
concentration was over 120 ppb as measured just prior to lung testing, the
Rec-camp group was not evaluated for symptoms versus to ozone level.
Pulmonary Function Testing:
Individual Linear Regression
For FEV1, FVC, and PEFR, linear regressions using temperature, the
one-hour, or eight-hour ambient ozone concentrations at time of test were
calculated for each subject. Negative regression slopes indicate an inverse
relationship between lung function and ozone concentration (i.e., decreased
pulmonary function with increasing ozone level). The proportion of
individuals with negative slopes was greatest among the Y-camp campers for
each lung funtion test (Table 4). This relationship was most pronounced for
PEFR, with 64% of Y-camp campers demonstrating an inverse relationship between
15

ozone level and peak flow.
The average regression slopes for the three groups and the ambient
temperature are presented in Table 5. Three of these regression slopes are
negative with only minor decrements. Table 6 shows the average regression
slopes for the three groups and the two ozone averages. Four of the
regression slopes were negative. The only negative average slope for the
one-hour ozone measure was for the Y-camp children: PEFR had an average
decrement of 1.01 ml/sec/ppb of ozone. The PEFR decrements in Y-camp children
for the eight-hour ozone average concentration displayed the strongest
relationship to exposure with an average loss of peak flow per child of 2.35
ml/sec/ppb of ozone.
Daily Average Summary Ratio and Difference Analysis
The regression slopes are presented in Table 7 by study group for the
daily average difference of the observed and expected PEFR and four ozone
exposure measures: one-hour average, test day eight-hour average, two-day
eight-hour average, and the three-day eight-hour average. Very little pattern
can be observed in either worker group. A slight decrease in peak flow rates
was noticable for the Y-camp counselors for the two- and three-day ozone
averages. However, the peak flow slopes were negative for all ozone exposure
measures for the Y-camp children. The largest decrement for the average
difference of the observed and expected PEFR in children was 4.74 ml/sec/ppb
of ozone (p-value = 0.05) for the eight-hour ozone average on the day of the
lung test.
Similar results were found for the regression slopes by study group for
the daily average ratio of the observed to the expected peak flow, Table 8.
The Y-camp children's slopes again were all negative with the largest
decrement (0.084% per ppb, p-value ■= 0.06) found for the eight-hour test day
16

ozone average. This represents an average decrease in children's peak flow
rates of 8.4% for each 100 ppb ozone concentration increase.
DISCUSSION
The effects of ozone on lung volumes and flow rates are influenced by the
effective dose of ozone to the lungs. Ozone exposure is determined by ambient
ozone levels, the duration of exposure, and the level of the subject's
physical activity. The latter influences the minute ventilation (i.e., the
amount of air brought into the lungs in one minute). These variables
determine the effective dose that reaches the exposed individual's lungs.
However, a wide range of respiratory responsiveness to ozone has been found in
healthy subjects (McDonnell et al., 1985).
The month of July 1988 had multiple days with elevated ozone levels.
High ozone levels frequently extended through much of the day camps' operating
hours. Ozone levels during the study period displayed a wide range of daily
maximum one-hour averages, 56 to 204 ppb. The one-hour average ozone
concentrations used as indices in the study also showed a broad range from
high to low: 124 ppb difference for the Y-camp and 94 ppb difference for the
Rec-camp. Furthermore, six days during the study period had eight-hour
average ozone concentrations over 100 ppb. The maximum eight-hour average
was 131 ppb. The documented exposure values were used to evaluate the
relationship between respiratory function and ambient ozone in a group of
moderately active outdoor employees and day campers with two similtaneously
distinct exposure values.
The present study, unlike other similar studies (Lippmann et al., 1983;
Bock et al., 1985; Lioy et al., 1985; Spektor et al., 1988a, 1988b; Kinney et
al., 1989; Higgins et al., 1990), did not detect a statistically significant
17
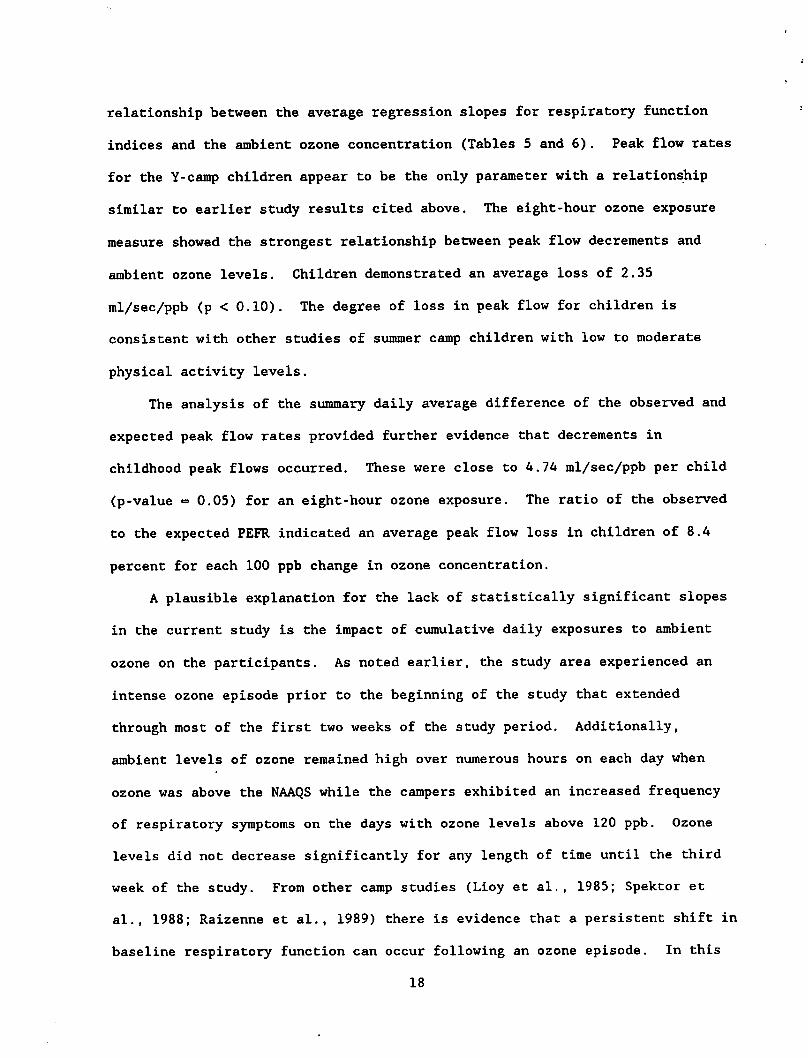
relationship between the average regression slopes for respiratory function
indices and the ambient ozone concentration (Tables 5 and 6). Peak flow rates
for the Y-camp children appear to be the only parameter with a relationship
similar to earlier study results cited above. The eight-hour ozone exposure
measure showed the strongest relationship between peak flow decrements and
ambient ozone levels. Children demonstrated an average loss of 2.35
ral/sec/ppb (p < 0.10). The degree of loss in peak flow for children is
consistent with other studies of summer camp children with low to moderate
physical activity levels.
The analysis of the summary daily average difference of the observed and
expected peak flow rates provided further evidence that decrements in
childhood peak flows occurred. These were close to 4.74 ml/sec/ppb per child
(p-value ■= 0.05) for an eight-hour ozone exposure. The ratio of the observed
to the expected PEFR indicated an average peak flow loss in children of 8.4
percent for each 100 ppb change in ozone concentration.
A plausible explanation for the lack of statistically significant slopes
in the current study is the impact of cumulative daily exposures to ambient
ozone on the participants. As noted earlier, the study area experienced an
intense ozone episode prior to the beginning of the study that extended
through most of the first two weeks of the study period. Additionally,
ambient levels of ozone remained high over numerous hours on each day when
ozone was above the NAAQS while the campers exhibited an increased frequency
of respiratory symptoms on the days with ozone levels above 120 ppb. Ozone
levels did not decrease significantly for any length of time until the third
week of the study. From other camp studies (Lioy et al., 1985; Spektor et
al., 1988; Raizenne et al., 1989) there is evidence that a persistent shift in
baseline respiratory function can occur following an ozone episode. In this
18
study the first episode was larger and much more severe than those observed in
the previous studies. The baseline shift was observed as a persistent
decrease in function that could last up to a week after the end of a period of
elevated ozone. The lowest and second lowest PEFR for the Y-camp children and
counselors for the entire study is presented in Figure 5 (i.e., two values per
subject). Approximately 43 percent of the lowest and second lowest observed
peak flow rates for all Y-camp subjects occurred during the third week of the
study, suggesting a baseline shift in pulmonary function occurred in the
population. In addition, since there were no pre-episode test days and not
enough post-episode test days available to establish a baseline function for
an individual, the linear relationship of ozone with pulmonary function that
has been seen in other studies was obscured by the persistent decrease in lung
function for low ozone days that occurred after this intense ozone episode.
Even with the episode, childhood peak flow rates appear to provide a
sensitive indicator of ozone response. The average PEFR loss of 4.74
ml/sec/ppb for children in this study is consistent with earlier observations
of children attending summer camps with peak flow decrements of 3.0 to 6.7
ml/sec/ppb (Bock et al., 1985; Lioy et al., 1985; Spektor et al., 1988). The
daily eight-hour ozone average showed the strongest relationship to peak flow
decrements in children and is likely to be a better estimate of daily
effective dose for ambient exposures than the shorter one-hour average.
CONCLUSIONS
Consistent with previous observations, the current study did demonstrate
a community impact of ozone exposure on the pulmonary function variable, Peak
Expiratory Flow Rate, in the children (campers). No statistical relationship
was observed for FVC or FEV1. There was no detectable ozone-pulmonary
19

function response relationship for the counselors that participated at either
camp. The temperature did not have any association with function parameters
measured in both populations. It appears that the presence of an extended
ozone episode during the first two weeks of study produced a baseline shift in
the lung function of the stuey population, and affected the daily
dose-response relationship.
The result for the children did indicate that the PEFR was affected by
the potential accumulated dose of ozone for at least eight hours prior to a
lung function measurement. Further, the largest lung function decrement for a
number of the participants occurred on the days just after the episode which
suggests a transient baseline shift in the lung function of members within the
population, and is a plausible reason why the daily exposure-response
relationship was not as strong as that obtained in other investigations.
Increases in specific respiratory symptoms were reported with increasing
ozone concentration in both the children and the counselors. This was
especially apparent for children on the days with ozone above 120 ppb, which
occurred primarily during the major episode.
RECOMMENDATIONS
Primary prevention to ozone exposure through decreased ambient levels is
the best method for protecting public health. However, it is likely that
summer-time ozone levels will remain high for the foreseeable future due to
the enormous complexity of the regional generation and transport of ozone
precursors. Given this, the only visible public health alternative will be
increasing the public's awareness of ozone-related health hazards and of what
can be done on a personal level to reduce those hazards through changing
individual behaviors.
20

For the past few years, NJDOH and NJDEP have been actively working
together to inform the public about ozone episodes, the hazards of ozone
exposure, and how to reduce overall individual risks. These activities need
to be continued and expanded where necessary and should include:
1. The NJDEP Ozone Advisory System (Episode Watch), initiated in 1987,
has been an effective mechanism for the timely dissemination of information on
ozone episodes to the general public (Edelstein, 1988). The Episode Watch
program should be continued with increased efforts to educate the media, such
as pre-ozone season press releases and ozone press packages, to encourage more
media coverage and transmission of advisory and health information.
2. The NJDOH should continue to develop informational/educational
materials for the general public, health educators, and health care
professionals. Increasing the public's and professionals' knowledge
concerning the environmental hazards of ozone will empower everyone to make
educated decisions concerning their health.
3. The NJDOH should increase efforts to identify high risk groups for
targeted delivery of health information to those individuals at greatest risk
of ozone exposure and/or consequent health effects.
4. NJDOH and NJDEP should continue working with environmental and
educational organizations, such as the Northeast States for Coordinated Air
Use Management, UMDNJ, Project: Clean Air, and the Interstate Sanatation
Commission, in efforts to reduce ozone formation and to address other outdoor
air pollution issues in a coordinated and systematic fashion.
21

Ozone, parts per million
o a a o p a p a a
b a a b b b b b b
o o
3
X
01
t?a>

TABLE 1
AGE AND SEX OF SUBJECTS AND PERSON-DAY
TESTS BY SUMMER CAMP ATTENDED
NEW JERSEY DEPARTMENT OF HEALTH OZONE HEALTH EFFECTS STUDY
HAMILTON, NEW JERSEY; JULY 1988
AGE
GROUP SEX
14 AND OVER:
MALE
FEMALE
TOTAL
NO. SUBJECTS |
REC-CAMP Y-CAMP
--NO. PERSON DAYS---|
REC-CAMP Y-CAMP
UNDER 14:
MALE
FEMALE
TOTAL
0
0
0
9
5
14
ALL AGES:
MALE
FEMALE
TOTAL
4
6
10
13
11
24
45
71
116
200
184
384
23
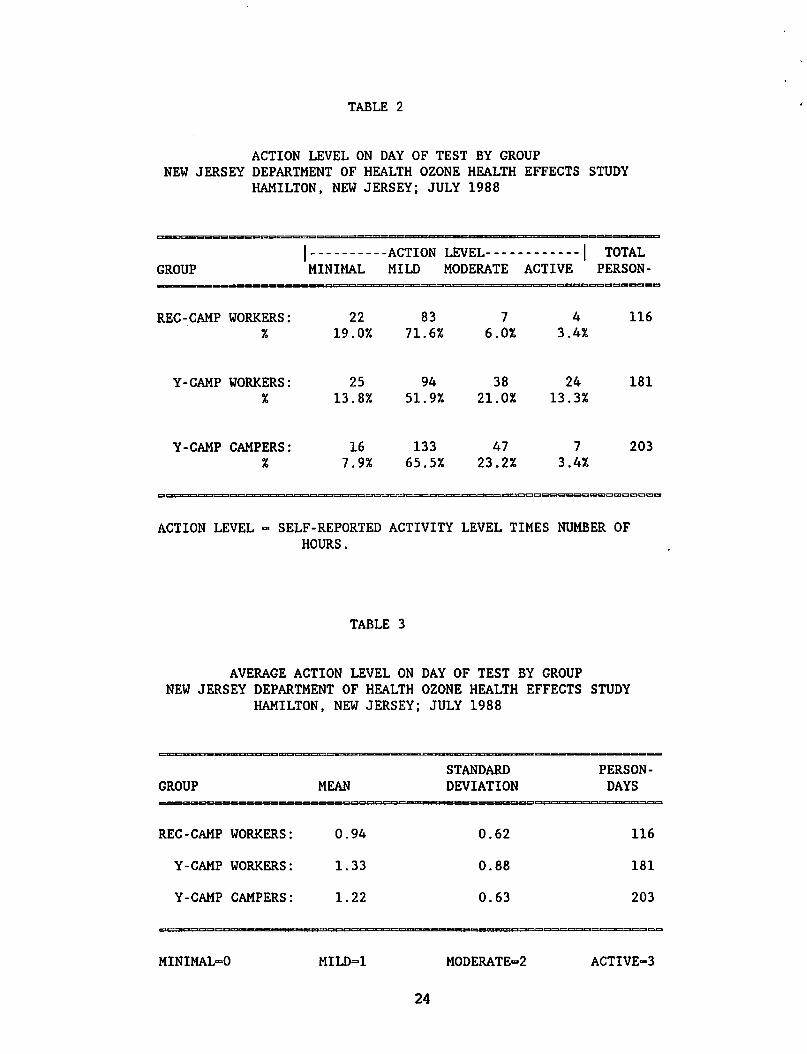
TABLE 2
ACTION LEVEL ON DAY OF TEST BY GROUP
NEW JERSEY DEPARTMENT OF HEALTH OZONE HEALTH EFFECTS STUDY
HAMILTON, NEW JERSEY; JULY 1988
GROUP
| ACTION LEVEL | TOTAL MINIMAL MILD MODERATE ACTIVE PERSON-
REC-CAMP WORKERS:
Y-CAMP WORKERS:
Y-CAMP CAMPERS:
ACTION LEVEL - SELF-REPORTED ACTIVITY LEVEL TIMES NUMBER OF
HOURS.
TABLE 3
AVERAGE ACTION LEVEL ON DAY OF TEST BY GROUP
NEW JERSEY DEPARTMENT OF HEALTH OZONE HEALTH EFFECTS STUDY
HAMILTON, NEW JERSEY; JULY 1988
MINIMAL-0 MILD=1 MODERATED ACTIVE=3
24
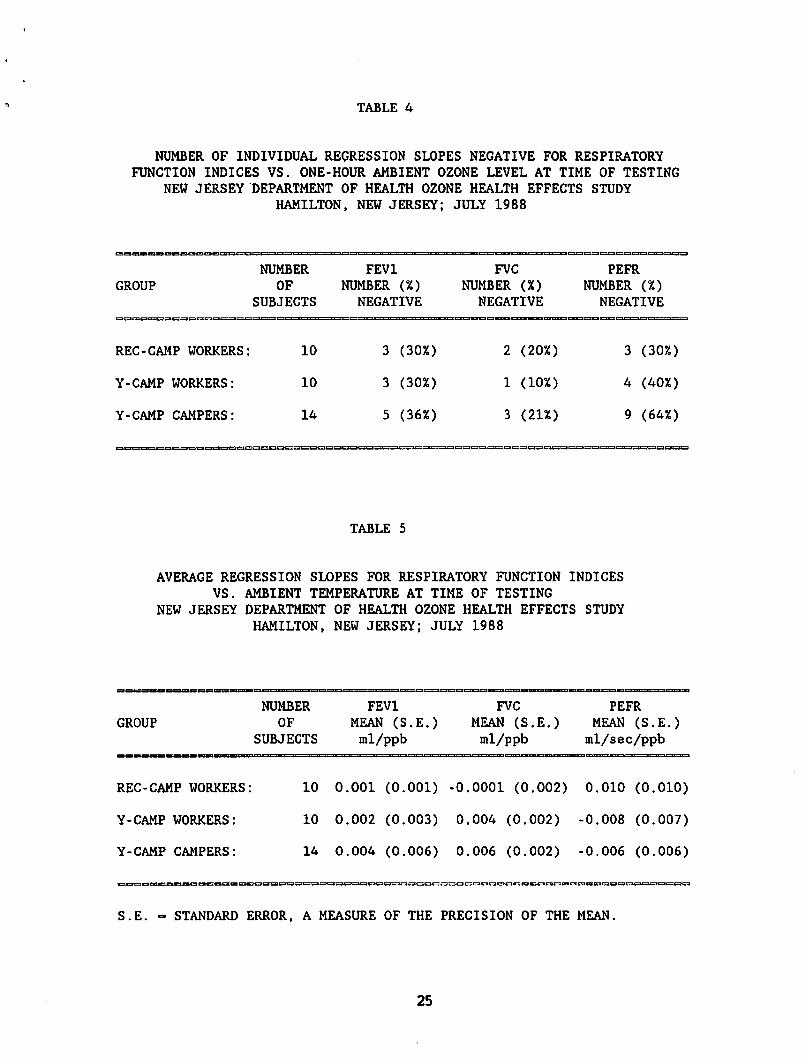
TABLE 4
NUMBER OF INDIVIDUAL REGRESSION SLOPES NEGATIVE FOR RESPIRATORY
FUNCTION INDICES VS. ONE-HOUR AMBIENT OZONE LEVEL AT TIME OF TESTING
NEW JERSEY DEPARTMENT OF HEALTH OZONE HEALTH EFFECTS STUDY
HAMILTON, NEW JERSEY; JULY 1988
TABLE 5
AVERAGE REGRESSION SLOPES FOR RESPIRATORY FUNCTION INDICES
VS. AMBIENT TEMPERATURE AT TIME OF TESTING
NEW JERSEY DEPARTMENT OF HEALTH OZONE HEALTH EFFECTS STUDY
HAMILTON, NEW JERSEY; JULY 1988
GROUP
NUMBER
OF
SUBJECTS
FEV1
MEAN (S.E.)
ml/ppb
FVC
MEAN (S.E.)
ml/ppb
PEFR
MEAN (S.E.)
ml/sec/ppb
REC-CAMP WORKERS: 10 0.001 (0.001) -0.0001 (0.002) 0.010 (0.010)
Y-CAMP WORKERS: 10 0.002 (0.003) 0.004 (0.002) -0.008 (0.007)
Y-CAMP CAMPERS: 14 0.004 (0.006) 0.006 (0.002) -0.006 (0.006)
S.E. - STANDARD ERROR, A MEASURE OF THE PRECISION OF THE MEAN.
25

FIGURE 2
c
o
0.6
0.5 -
0.4 -
0.3 -
0.2 -
0.1 -
T
ANY POSITIVE SYMPTOMS BY PERSON-DAYS
NEW JERSEY DEPARTMENT OF HEALTH OZONE HEALTH EFFECTS STUDY
HAMILTON, NEW JERSEY; JULY 1988
X X
1
^8 ^x ^x sx
#8 ^8 ^x
SCRATCHY COUGH
THROAT
I I III I i
HOARSE PHLEGM CHEST WHEEZE RUNNY OR EYE SHORT
PAINS STUFFY NOSE IRRITATION BREATH
X7F7X Rec Workers Y Workers IXXI Y Campers
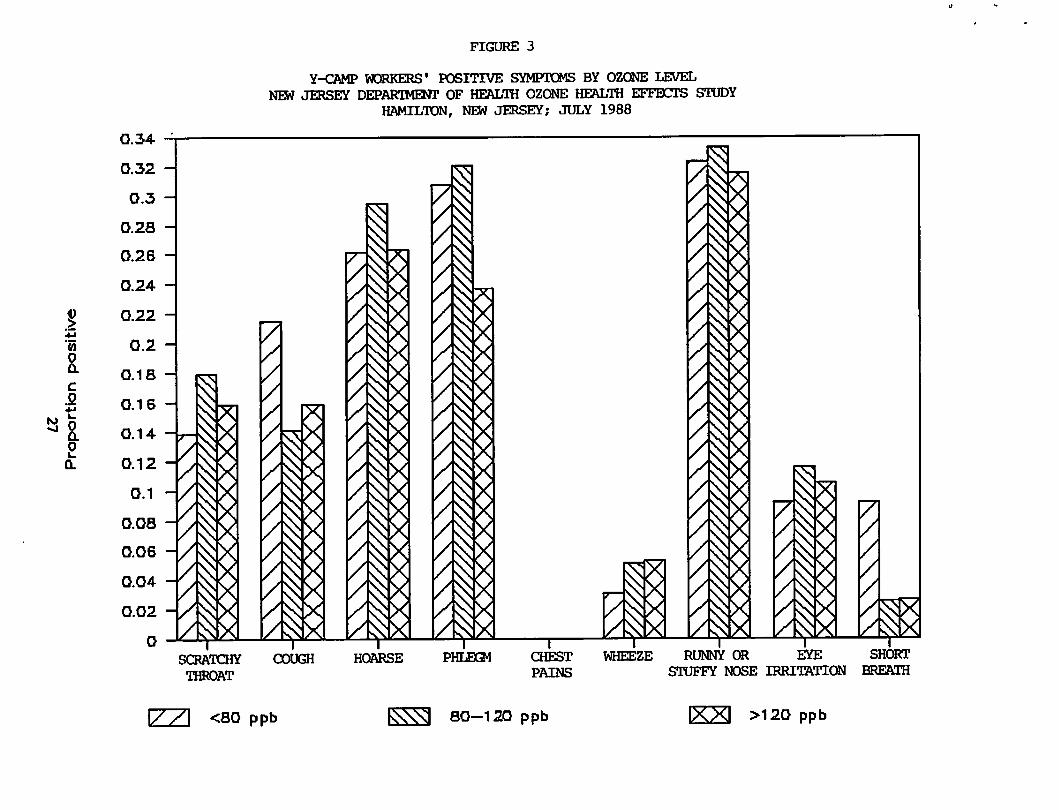
FIGURE 3
I
o a
o
0.34
0.32
0.3
0.28
0.26
0.24
0.22
0.2
0.1 S
0.16
0.14
0.12
0.1
0.08
0.06
0.04
0.02
0
Y-CAMP WORKERS' POSITIVE SYMPTOMS BY OZONE LEVEL
NEW JERSEY DEPARTMENT OF HEALTH OZONE HEALTH EFFECTS STUDY
HAMILTON, NEW JERSEY; JULY 1988
',
SCRATCHY COUGH
THROAT
HOARSE PHLEQ4 CHEST WHEEZE RUNNY OR EYE SHORT
PAINS STUFFY NOSE IRRITATION BREATH
<S0 ppb 80—120 ppb >120 ppb

FIGURE 4
I
o a
c
0
2 Q.
0.2
0.19 -
0.18 -
0.17 -
0.16 -
0.15 -
0.14 -
0.13 -
0.12 -
0.11 -
0.1 -
0.09 -
0.08 -
0.07 -
0.06 -
0.05 -
0.04
0.03 -
0.02 -
0.01 -
0
x
SCRflTOBf
• 1HR0AT
Y-CAMP CAMPERS' POSITIVE SYMPTOMS BY OZONE LEVEL
NEW JERSEY DEPARTMENT OF HEALTH OZONE HEALTH EFFECTS STUDY
HAMILTON, NEW JERSEY; JULY 1988
X
COUGH HOARSE PHLEGM
1
CHEST
PAINS
X
WHEEZE RUNNY OR EYE SHORT
STUFFY NOSE IRRITATION BREATH
X7~7\ <80 ppb 80-120 ppb >120 ppb
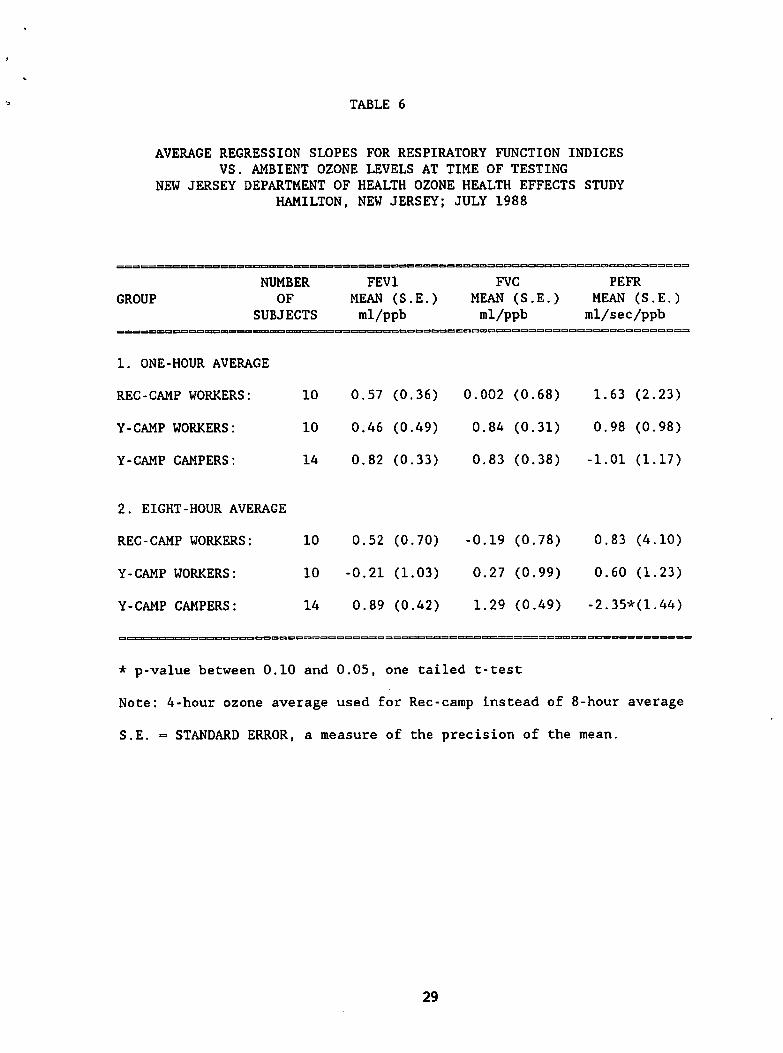
TABLE 6
AVERAGE REGRESSION SLOPES FOR RESPIRATORY FUNCTION INDICES
VS. AMBIENT OZONE LEVELS AT TIME OF TESTING
NEW JERSEY DEPARTMENT OF HEALTH OZONE HEALTH EFFECTS STUDY
HAMILTON, NEW JERSEY; JULY 1988
GROUP
NUMBER
OF
SUBJECTS
1. ONE-HOUR AVERAGE
REC-CAMP WORKERS:
Y-CAMP WORKERS:
Y-CAMP CAMPERS:
FEV1
MEAN (S.E.)
ml/ppb
FVC
MEAN (S.E.)
ml/ppb
aeigincatoc
10 0.57 (0.36) 0.002 (0.68)
10 0.46 (0.49) 0.84 (0.31)
14 0.82 (0.33) 0.83 (0.38)
PEFR
MEAN (S.E.)
ral/sec/ppb
1.63 (2.23)
0.98 (0.98)
-1.01 (1.17)
2. EIGHT-HOUR AVERAGE
REC-CAMP WORKERS: 10
Y-CAMP WORKERS: 10
Y-CAMP CAMPERS: 14
0.52 (0.70)
-0.21 (1.03)
0.89 (0.42)
-0.19 (0.78) 0.83 (4.10)
0.27 (0.99) 0.60 (1.23)
1.29 (0.49) -2.35*(1.44)
* p-value between 0.10 and 0.05, one tailed t-test
Note: 4-hour ozone average used for Rec-carap instead of 8-hour average
S.E. = STANDARD ERROR, a measure of the precision of the mean.
29
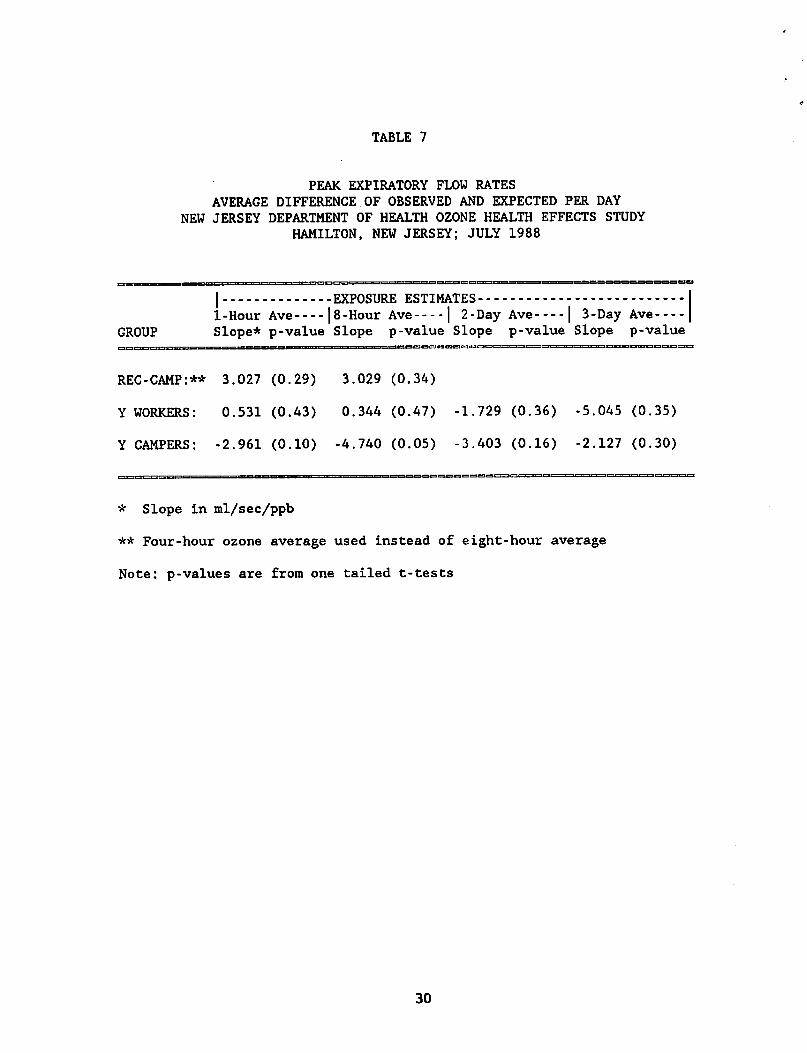
TABLE 7
PEAK EXPIRATORY FLOW RATES
AVERAGE DIFFERENCE OF OBSERVED AND EXPECTED PER DAY
NEW JERSEY DEPARTMENT OF HEALTH OZONE HEALTH EFFECTS STUDY
HAMILTON, NEW JERSEY; JULY 1988
I EXPOSURE ESTIMATES
1-Hour Ave |8-HourAve | 2-Day Ave | 3-Day Ave GROUP Slope* p-value Slope p-value Slope p-value Slope p-value
REC-CAMP:** 3.027 (0.29) 3.029 (0.34)
Y WORKERS: 0.531 (0.43) 0.344 (0.47) -1.729 (0.36) -5.045 (0.35)
Y CAMPERS: -2.961 (0.10) -4.740 (0.05) -3.403 (0.16) -2.127 (0.30)
* Slope in ml/sec/ppb
** Four-hour ozone average used instead of eight-hour average
Note: p-values are from one tailed t-tests
30

TABLE 8
PEAK EXPIRATORY FLOW RATES
AVERAGE RATIO OF OBSERVED TO EXPECTED PER DAY
NEW JERSEY DEPARTMENT OF HEALTH OZONE HEALTH EFFECTS STUDY
HAMILTON, NEW JERSEY; JULY 1988
| EXPOSURE ESTIMATES
GROUP 1-Hour Ave |8-HourAve | 2-Day Ave | 3-Day Ave Slope* p-value Slope p-value Slope p-value Slope p-value
REC-CAMP:** 0.041% (0.28) 0.044% (0.33)
Y WORKERS: 0.007% (0.43) 0.005% (0.46) -0.020% (0.37) -0.068% (0.35)
Y CAMPERS: -0.049% (0.13) -0.084% (0.06) -0.064% (0.16) -0.038% (0.30)
* Slope in percent change per ppb
** Four-hour ozone average used instead of eight-hour average
Note: p-values are from one tailed t-tests
31

FIGURE 5
Y-CAMP SUBJECTS1 LOWEST AND SECOND LOWEST PEER
NEW JERSEY DEPARTMENT OF HEALTH OZONE HEALTH EFFECTS STUDY
HAMILTON, NEW JERSEY; JULY 1988
DC U. UJ
s
o
z CM
O
6 -
5 -
4 -
2 -
0
1 / I
I
6
/
i 7 8
VA ?
/
/
/
/
i
f
! I
I 11 12 13 14 15
JULY
18 19 20 21 22
1 i t
25
I 26 27 28 29
[771 Y CAMPERS Y COUNSELORS
REFERENCES
Adams, W.C. and Schelegle, E.S. (1983). Ozone and high ventilation effects on
pulmonary function and endurance performances. J. Appl. Physiol. 55,
805-812.
American Thoracic Society (1987). Standardization of spirometry: 1987 Update.
Am. Rev. Resp. Dis. 136, 1285-1298.
Avol, E.L., Linn, W.S., Shamoo, S.A., Valencia, L.M., Anzer, U.T., Venet,
T.G., and Hackney, J.D. (1985). Respiratory effects of photochemical
oxidant air pollution in exercising adolescents. Am. Rev. Respir. Dis. 132,
619-622.
Avol, E.L., Linn, W.S., Venet, T.G., Shamoo, D.A., and Hackney, J.D. (1984).
Comparative respiratory effects of ozone and ambient oxidant pollution
exposure during heavy exercise. J. Air. Pollut. Control. Assoc. 34,
804-809.
Berry, M. and Klotz, J. (1987). Atmospheric ozone and health effects in New
Jersey: Assessment and recommendations for health advisories. New Jersey
Department of Health, Trenton, New Jersey.
Bock, N., Lippmann, M., Lioy, P.J., Munoz, A., and Speizer, F.E. (1985). The
effects of ozone on the pulmonary function of children. In: Lee SD, ed.
Evaluation of the scientific basis for ozone/oxidant standards. Pittsburgh:
Air Pollution Control Association 297-308.
Edelstein, M.R. (1988). New Jersey ozone notification program evaluation.
Ramapo College of New Jersey, Mahwah, New Jersey.
Folinsbee, L.J., McDonnell, W.F., and Horstman, D.H. (1988). Pulmonary
function and symptom responses after 6.6-hour exposure to 0.12 ppm ozone
with moderate exercise. J. Air Pollut. Control Assoc. 38, 28-35.
Gardner, R.M., Baker, CD., and Broennle, A.M. (1979). ATS statement-Snowbird
workshop on standardization of spirometry. Am. Rev. Resp. Dis. 119,
831-838.
Higgins, I.T., D'Arcy, J.B., Gibbons, D.I., Avol, E.L., and Gross, K.B.
(1990). Effects of exposures to ambient ozone on ventilatory lung function
in children. Am. Rev. Resp. Dis. 141, 1136-1146.
Knudson, R.J., Slatin, R.C., Lebowitz, M.D., and Burrows, B. (1976). The
maximal expiratory flow-volume curve: Normal standards, variability, and
effects of age. Am. Rev. Resp. Dis. 113, 587-600.
Kinney, P.L., Ware, J.H., Spengler, J.D., Dockery, D.W., Speizer, F.E., and
Ferris, B.G. (1989). Short-term pulmonary function change in association
with ozone levels. Am. Rev. Resp. Dis. 139, 56-61.
33

Kulle, T.J., Sauder, L.R., Hebel, J.R., and Chatham, M.D. (1985). Ozone
response relationship in healthy nonsmokers. Am. Rev. Respir. Dis. 132,
36-41.
Lioy, P.J., Berry, M., Pietarinen, C, Kitsa, V., Gelperin, K., Waldman, J.M.,
and Klotz, J. (1989). Exposure assessment and study design considerations
for the NJDOH and UMDNJ ozone-health effects field study on counselors and
children at day camps in New Jersey. UMDNJ research report, Piscataway,
New Jersey.
Lioy, P.J., Vollmuth, T.A., Lippmann, M. (1985). Persistence of peak flow
decrement in children following ozone exposures exceeding the National
Ambient Air Quality Standard. J. Air Pollut. Contol Assoc. 35, 1068-71.
Lippmann, M., Lioy, P.J., Leikauf, G., Green, K.B., Baxter, D., Morandi, M.,
and Pastemack, B.S. (1983). Effects of ozone on the pulmonary function of
children. Adv. Environ. Toxicol. 5, 423-546.
McDonnell, W.F., Horstman, D.H., Hazucha, M.J., Seal, E., Haak, E.D., Salaam,
S.S., and House, D.E. (1983). Pulmonary effects of ozone exposure during
exercise: dose-response characteristics. J. Appl. Physiol. Respir. Environ.
Exercise Physiol. 54(5), 1345-1352.
McDonnell, W.F., Chapman, R.S., Leigh, M.W., Strope, G.L., and Colloer, A.M.
(1985). Respiratory responses of vigorously exercising children to 0.12 ppm
ozone exposure. Am. Rev. Resp. Dis. 132, 875-879.
McDonnell, W.F., Horstman, D.H., Abdul-Salaam, S., and House, D.E. (1985).
Reproducibility of individual responses to ozone exposure. Am. Rev. Resp.
Dis. 131, 36-40.
Raizenne, M.E., Burnett, R.T., Stren, B., Franklin, C.A., and Spengler, J.D.
(1989). Acute lung function responses to ambient acid aerosol exposures in
children. Environ. Health Perspec. 79, 179-185.
Speizer, F. (1988). Personal communication.
Spektor, D.M., Lippmann, M., Thurston, G.D., Lioy, P.J., Stecko, J., O'Connor,
G., Garshick, E., Speizer, F.E., and Hayes, C. (1988). Effects of ambient
ozone on respiratory function in healthy adults exercising outdoors. Am.
Rev. Resp. Dis. 138, 821-828.
Spektor, D.M., Lippmann, M., Lioy, P.J., Thurston, G.D., Citak, K., Bock, N.,
Speizer, F.E., and Hayes, C. (1988). Effects of ambient ozone on
respiratory function in active normal children. Am. Rev. Resp. Dis. 137,
313-320.
U.S. Environmental Protection Agency (1990). National air quality emissions
trends report, 1988. Research Triangle Park, N.C. EPA Report No.
450/4-90-002.
34
G193S

OZONE-HEALTH EFFECTS FIELD STUDY OF
CHILDREN AND COUNSELORS AT TWO DAY CAMPS IN
NEW JERSEY, JULY 1988
JULY 1990
Frances J.Dunston, M.D., M.P.H.
State Commissioner of Health
New Jersey Department of Health
Division of Occupational and Environmental Health
Environmental Health Service
MIL '/s. JERSEY
DEPARTMENT OF
HEALTH
A BCT1U SIATt Or HIAMH