Embed Size (px)
Citation preview

Final Report
OYSTER RESTORATION PRE-CONSTRUCTION SITE
ASSESSMENT OF BENTHIC HABITATS IN ST. MARY’S
RIVER SANCTUARY, MARYLAND
Prepared for:
Maryland Department of Natural Resources
Prepared by:
Oyster Recovery Partnership, Inc.
1805A Virginia St
Annapolis, Maryland 21401
MOU #605P7400192
August 2019

Page | 2

Page | 3
Table of Contents
Figures ........................................................................................................................... 4
Tables .................................................................................................................... 4
1.0 Introduction ........................................................................................................... 5
2.0 Methods ................................................................................................................. 6
2.1 Sampling Design ............................................................................................. 6
2.2 Sampling Methods ........................................................................................... 7
2.3 Data Management ................................................................................................. 10
2.4 Habitat Assessment Data Analysis........................................................................... 11
3.0 Results ................................................................................................................. 13
5.0 References ............................................................................................................ 22
APPENDIX 1 –St. Mary’s Sample Datasheet .................................................................. 23

Page | 4
Figures Figure 1. Location of the St. Mary’s River Sanctuary (shaded blue). ............................................................... 5
Figure 2. Picture of patent-tongs used to collect oysters and substrate. ............................................................. 8 Figure 3. Picture of representative patent tong sample. Numbers and arrows correspond to substrate characteristics
documented before the sample was brought on board for processing. Bubble 1 – represents the portion of the sample
that is observed to document the patent tong fullness index. Bubble 2 – represents the portion of the sample that is
observed to document exposed shell. Bubble 3 – represents the portion of the sample that is observed to document
surface sediment depth. Colors of each bubble correspond to descriptions of each measurement in Table 2. ........... 9 Figure 4. Graphical interpretation of exposed shell, surface sediment, and surface shell volume variables for each
patent tong sample. Base oyster graphics from Tracy Saxby, Integrations and Application Network, University of
Maryland Center for Environmental Science (ian.umces.edu/imagelibrary/). .................................................. 11 Figure 5. A-priori classification of habitat types in St. May’s River Sanctuary that were sampled by patent tongs in
2018. .................................................................................................................................................. 6 Figure 6. Ranks from the patent tong survey to determine habitat suitability. (Figure adapted from upper St. Mary’s
Blueprint Report). ............................................................................................................................... 18 Figure 7. Resulting restoration treatment on reefs determined from the patent tong analysis. (Figure adapted from
upper St. Mary’s Blueprint Report). ........................................................................................................ 21
Tables Table 1. Strata sampled based on pre-classification using GIS data and earlier survey work in the St. Mary's River
Sanctuary. ........................................................................................................................................... 7
Table 2. List of substrate characteristics and substrate composition descriptors documented for each sample
collected. ........................................................................................................................................... 10
Table 3. Five benthic habitat components used to develop the index of habitat quality and the criteria used to rank
each component (for determination of seed-only suitability). ....................................................................... 13
Table 4. Sampling dates and details for patent tong survey conducted in St. Mary's River.................................. 14
Table 5. Resulting area of each habitat classification after 2018 patent tong survey. ......................................... 14
Table 6. Final reef sites and restoration types for tributary blueprint. ............................................................. 15
Table 7. Reef-level characteristics for each site surveyed in late 2018 in the St. Mary's River. ............................ 16

Page | 5
1.0 Introduction
The upper St. Mary’s River is one of five Maryland tributaries targeted for large-scale
restoration under the 2014 Chesapeake Watershed Agreement. The river is located in southern
Maryland and an upstream portion was designated as an oyster sanctuary in 2010. The sanctuary
encompasses 1,304 surface acres in a mesohaline region (Figure 1). Selection as a large-scale
restoration tributary was based in part on a history of strong oyster recruitment, ongoing
restoration and replenishment activities, and support from the local community.
Figure 1. Location of the St. Mary’s River Sanctuary (shaded blue).
To identify benthic habitat suitable for oyster growth in the St. Mary’s River Sanctuary,
the Maryland Interagency Work-group (hereafter, Workgroup) determined that a pre-
construction site assessment survey was needed. The survey was conducted in late 2018. Benthic
habitat in the St. Mary’s River Sanctuary was stratified based on upon a-priori assumptions of
benthic condition classified using the Coastal and Marine Ecological Classification Standards
(CMECS). Results from the 2010 Maryland Geological Survey sonar survey were updated with
information from 2012 and 2015 patent tong surveys. The workgroup considered the following
bottom types as restorable: anthropogenic oyster rubble, sand with shell, biogenic oyster rubble,
and muddy sand with shell. Additionally, GIS analysis was used to eliminate areas overlapping
submerged aquatic vegetation beds, areas within 150 feet of aquaculture leases, and areas within
250 feet of US Coast Guard navigational aids.

Page | 6
2.0 Methods
2.1 Sampling Design
Sampling sites were generated from systematic sampling grids developed in ArcMap
(ESRI, Version 10.5) and draped over GIS layers (Figure 2). Individual habitat layers were
created for each major restoration category (substrate and seed, seed only, control, and premet)
contained in the tributary blueprint (MIORW 2019). The nature of the application of grids to
irregularly shaped GIS layers creates partial grid cells within some of the habitat stratum. Some
partial grids were removed from the sampling frame because they were either too small or too
narrow to be sampled effectively.
Figure 2. A-priori classification of habitat types in St. Mary’s River Sanctuary that were sampled
by patent tongs in 2018.

Page | 7
2.2 Sampling Methods
Oyster Recovery Partnership (ORP) pre-construction assessment protocols require fine-
scale resolution information to determine whether benthic habitats are suitable for oyster growth.
Therefore, all strata were sampled using a 25 x 25m systematic grid cell with sampling locations
in the center of each grid. The area of each habitat stratum and the number of samples is
presented in Table 1.
Table 1. Strata sampled based on pre-classification using GIS data and earlier survey work in the
St. Mary's River Sanctuary.
Pre-classified restoration type Area
(acres)
Sampling points
Substrate and seed 10.81 110
Seed only 23.85 216
Premet 27.38 236
Control 2.01 17
SMRWA Restoration Site 6.59 0
Sample planning was coordinated by ORP and sample collection was managed by
Versar, Inc. A chief scientist from Versar, Inc. guided the vessel crew and scheduled each daily
sampling event. Sampling was conducted during daylight hours and generally required 6 to 8
hours to complete. Navigation to sampling sites was done using a differential global positioning
system (DGPS) attached to a laptop with ArcMap (ESRI, Version 10.1) running as a navigational
program.
The benthic condition of oyster reef habitat was assessed using patent tongs deployed
from the F/V Hooker. Patent-tongs are a specialized commercial fishing gear used to harvest
oysters in Chesapeake Bay (Figure 3). Patent tongs function much like a benthic grab and are
well suited to quantify the condition of benthic habitat through the retrieval of the sediment
surface layer which could include oysters, shell, or other sediment features. The patent tong is
lowered to the bottom in an open position and oysters and other surface sediment features are
collected when the grab is closed. The patent tong has 55mm long teeth that help to penetrate
the substrate when lowered to the bottom. The teeth allow the patent-tong to scrape the surface
layer of an oyster reef to ensure that the surface layer is effectively sampled. The teeth are less
effective and not necessarily needed in softer substrates such as mud dominated substrates. The
patent tongs used were 1.16m by 1.27m, which sampled a 1.47m2 area of the bottom. The
coordinates of each patent-tong sample were collected when the patent tongs reached the
sediment surface. A DGPS antenna was positioned adjacent to the location where the patent-
tongs were deployed so no position offset was required.
Samples were processed to provide a combination of qualitative and quantitative
measurements required to meet the overall project objectives. All measurements were listed on a
field datasheet (Appendix 1) which combined two sample processing protocols (Rapid
Assessment and Three Year Check-In) previously used to evaluate habitats in the Little
Choptank River (ORP 2019). Once the grab was brought to the surface, several qualitative
measurements to document the depth of sediment covering shell (Surface Sediment), the percent

Page | 8
of shell not covered by sediment (Exposed Shell), and the amount of material in the sample
(Patent Tong Fullness) and the substrate composition were made from observations of the
sample before the sample was brought onboard for processing (Figure 3 and 4; Table 2).
Figure 3. Picture of patent-tongs used to collect oysters and substrate.
The sample was placed onto the processing table and thoroughly rinsed to remove excess
substrate. In each sample, all oysters were counted, identified as live or dead, and a minimum of
30 live oysters were measured for each sample. Oyster clumps and the number of oysters
associated with a clump were recorded to serve as a measure of structural complexity on the reef.
In addition to the minimum of 30 live oyster heights measured, the shell height and total count of

Page | 9
dead (box) and recently dead (gapers) oysters was also documented from each sample. The
percent of the sample covered by fouling organisms and specifically percent fouling by tunicates
and mussels was documented for each sample as well. The volume of oyster and the volume of
shell were measured for each sample. Percentage of gray shell and shell hash was assessed.
Figure 4. Picture of representative patent tong sample. Numbers and arrows correspond to
substrate characteristics documented before the sample was brought on board for processing.
Bubble 1 – represents the portion of the sample that is observed to document the patent tong
fullness index. Bubble 2 – represents the portion of the sample that is observed to document
exposed shell. Bubble 3 – represents the portion of the sample that is observed to document
surface sediment depth. Colors of each bubble correspond to descriptions of each measurement
in Table 2.
Surface and bottom water temperature, dissolved oxygen, pH, and salinity were measured
during each sampling event at representative locations over each oyster reef using a 6600
multiparameter water quality sonde (YSI Corporation, Yellow Springs, Ohio). Other
environmental and station specific variables collected at each site included sample number, date
and time, depth of water, vessel name, and staff present.
2
3
1

Page | 10
Table 2. List of substrate characteristics and substrate composition descriptors documented for
each sample collected.
Substrate Characteristics
Patent Tong Fullness
Index
Estimate of the amount of substrate in a patent tong grab before tongs were
rinsed.
0= No substrate, grab empty; 5= Patent tong full of substrate.
Exposed Shell Estimate in quarter % increments of the percent of the substrate surface that is
covered with shell. 100% exposed shell will have shell visible over the entire
sample surface.
Surface Sediment Estimate of the centimeter depth of surface sediment observed in the patent tong
grab.
0 surface sediment would indicate no surface sediment present.
Substrate Composition
Primary Substrate Dominant substrate observed in the entire sample. Substrate types include mud,
sand, sandy mud, oysters, clumped shell, loose shell, shell hash, and gravel.
Secondary Substrate Secondary substrate observed in the entire sample. Substrate types include mud,
sand, sandy mud, oysters, clumped shell, loose shell, shell hash, and gravel.
Tertiary Substrate Tertiary substrate observed in the entire sample. Substrate types include mud,
sand, sandy mud, oysters, clumped shell, loose shell, shell hash, and gravel.
Percent Gray Shell Percent of the total shell that is estimated to be buried based on black
colorization.
% Shell Hash Description of the shell quality. Percentage of the sample that is composed of
shell hash.
Total Volume Total volume of loose shell and oyster in the tong sample.
Oyster Volume Volume of live, gaper, and box oysters in the tong sample.
Number of Live Oysters Number of live oysters in the sample.
2.3 Data Management
All data were compiled and entered into the ORP Oyster Restoration Monitoring and
Assessment relational database. Quality control and assurance was performed on all survey data
and included comparisons of randomly selected digital data to the field data sheets, summarizing
data to review for outliers or out of range values, and plotting sample coordinates to ensure
samples were collected within site boundaries.

Page | 11
Figure 5. Graphical interpretation of exposed shell, surface sediment, and surface shell volume
variables for each patent tong sample. Base oyster graphics from Tracy Saxby, Integrations and
Application Network, University of Maryland Center for Environmental Science
(ian.umces.edu/imagelibrary/).
2.4 Habitat Assessment Data Analysis
Two analytical approaches were used to determine if reefs needed restoration and the
type of restoration activity that was required. The first approach used oyster density and biomass
as metrics to evaluate whether reefs required restoration. The second approach used an index of
habitat quality to characterize reefs habitats and determine the type of restoration treatment
suitable for each reef that required restoration activity.
Entire shell volume sampled by patent tongs with surface
shell depicted on top and the darker shells underneath is
buried shell.
Top down view of patent-tong grab. This
example shows the amount of exposed
shell on the right as 75% of the sample
exposed.
Buried shell with sediment on
top. The surface sediment
depth score is based on the
depth of the sediment on top of
the oysters depicted in the blue
area.

Page | 12
In the first approach, oyster density estimates were standardized to number per m2 from
the area sampled by patent tong. Total counts of live oysters or other variables (e.g., oyster size
class, shell volume) were averaged over all samples collected at the individual site. Oyster
biomass estimates were calculated for individual oysters using the equation W =0.000423 *
L1.7475 where W = dry tissue weight in g and L = shell height in mm (Mann and Evans 1998).
Biomass was then summed for the entire sample and standardized using the same method as
density estimates. Average biomass was calculated across all samples collected at the site.
Reefs with oyster density and biomass greater than 50 oysters and grams per m2 over
30% of the reef area were determined to be premet and initial restoration is not needed.
In the second approach, an index of habitat quality was developed to determine whether
sites were suitable for Seed Only restoration or whether they required substrate addition. Five
benthic habitat components observed from samples were used to develop the index:
1. Exposed Shell
2. Primary Substrate
3. Surface Sediment
4. Number of Live Oysters
5. Surface Shell
a. Total sampled shell and surface shell volume was estimated for each individual
sample. Field measurements of shell resources included total shell volume and the
percent of black (buried) shell estimated in a sample for patent tong samples.
Total shell volume was standardized by the area sampled by patent tongs. Surface
shell estimates were calculated as the percent of the total sampled shell volume
that was not considered black shell.
The numerical value of each of the five benthic components was binary and was expressed as a 1
or 0, with a result of 1 assumed to be suitable for Seed Only restoration and 0 being unsuitable.
The index was developed using best professional judgement by members of the Maryland
Interagency Workgroup. Each of the benthic components were continuous variables with a
range of observations or values that could be observed in the field. The condition of each
variable was considered to have an influence on the distribution of oysters, but only a portion of
all observations for each benthic component was considered suitable for oyster population
growth. For example, the number of live oysters ranged from zero to over 100 at some sites, but
only oyster densities greater than 5 individuals/m2 was considered suitable oyster habitat. A set
of criteria for each variable was developed to construct the final index of habitat quality (Table
3).
A final habitat suitability score for each grid cell was derived as the sum of each benthic
component score at the individual grid cell using the equation:
𝐻𝑎𝑏𝑖𝑡𝑎𝑡 𝑆𝑢𝑖𝑡𝑎𝑏𝑖𝑙𝑖𝑡𝑦 𝑆𝑐𝑜𝑟𝑒
= 𝐸𝑥𝑝𝑜𝑠𝑒𝑑 𝑆ℎ𝑒𝑙𝑙 𝑆𝑐𝑜𝑟𝑒 + 𝐵𝑜𝑡𝑡𝑜𝑚 𝑇𝑦𝑝𝑒 𝑆𝑐𝑜𝑟𝑒 + 𝑆𝑢𝑟𝑓𝑎𝑐𝑒 𝑆𝑒𝑑𝑖𝑚𝑒𝑛𝑡 𝑆𝑐𝑜𝑟𝑒 + 𝑁𝑢𝑚𝑏𝑒𝑟 𝑜𝑓 𝐿𝑖𝑣𝑒 𝑂𝑦𝑠𝑡𝑒𝑟 𝑆𝑐𝑜𝑟𝑒+ 𝑆𝑢𝑟𝑓𝑎𝑐𝑒 𝑆ℎ𝑒𝑙𝑙 𝑉𝑜𝑙𝑢𝑚𝑒 𝑆𝑐𝑜𝑟𝑒

Page | 13
The result of habitat suitability score determined whether a sampling grid cell was
suitable for Seed Only deployment based on a ranking between zero and five. Ranks between 0
to 2 were unsuitable for Seed Only restoration and were only considered for substrate addition.
Reef with a rank of 3 were considered marginal and requiring further review of all variables at
the site level to determine suitability, and ranks of 4 and 5 were suitable for Seed Only
restoration.
Table 3. Five benthic habitat components used to develop the index of habitat quality and the
criteria used to rank each component.
Benthic Component Suitable for Oysters
Exposed Shell 50% exposed or greater
Bottom Type Oyster, loose shell, or shell hash. Sand or sandy mud and the
secondary bottom type is either oyster, loose shell, or shell hash.
Sand or sandy mud and the surface sediment = 0.
Surface Sediment Less than 5 cm
Number of Live Oysters Greater than 5 oysters per square meter
Surface Shell Volume Greater than 10 liters per square meter.
The final habitat suitability index was programed in ArcMap (ESRI, Version 10.5) and
the sampling grids and the habitat ranks for each grid cell were projected to create a spatially
explicit map of habitat suitability at the site level. The quantity and distribution of site rankings
was visually inspected to determine whether a site was a candidate for Seed Only deployment.
The goal of the review was to determine whether a site was suitable for Seed Only or substrate
addition based on the combination of habitat ranks represented at the site. Sites dominated by 4
and 5 habitat ranks were considered suitable for Seed Only. Sites dominated by 0 to 2 habitat
ranks were considered unsuitable and were only considered for substrate addition restoration
activity. Due to the patchy nature of oyster reefs many of the reef sites had a combination of
ranked cells throughout the site and in some instances sites considered to be dominated by ranks
of 4 and 5 also exhibited lower scoring ranks. In those cases a site was still considered
dominated by ranks of 4 and 5 when there were no large areas of contiguous lower ranked cells
and over 90% of the grid cells exhibited ranks of 4 or 5. In addition, the cell level resolution
allowed for modifications to the dimensions of the site if areas of the site were considered
unsuitable and could be removed. Areas that were considered unsuitable were removed through
GIS processing techniques and the remaining habitat was considered suitable for Seed Only
restoration (Figure 6).
3.0 Results
Between late October and early December 2018, ORP and Versar collected and
processed over 500 patent tong grabs in the St. Mary’s River Sanctuary (Table 4). The size and
distribution of a-priori classified habitats was similar to the benthic conditions quantified by the

Page | 14
habitat suitability index with some marginal differences observed (Table 5). Five sites a-priori
classified as Seed Only habitat were reclassified by the suitability index as premet, and Site
SO_4 was split into two sites, one reclassified as premet and one reclassified as Substrate and
Seed. In addition, reclassification of other habitat types to Seed Only produced a total of 15.88
acres finalized as Seed Only restoration. The majority of Substrate and Seed habitat was
accurately delineated based on the a-priori classification, with just under 2 acres reclassified to
Seed Only and 0.34 acre reclassified to premet based on the habitat suitability index. A total of
7.47 acres were added to the premet acres.
All habitats were adjusted based on the habitat suitability results. The distribution of all
classified habitats are depicted in Figures 6 to 11. The final number of individual sites by habitat
type included one control, eight Substrate and seed, twelve premet, and ten Seed Only sites
(Table 6). Reef-level characteristics for each site are presented in Table 7.
In conclusion, the results of this survey suggest the process of a-priori habitat
classification in combination with subsequent baseline surveys provides information needed to
delineate benthic conditions with the accuracy needed to plan future restoration activities.
Table 4. Sampling dates and details for patent tong survey conducted in St. Mary's River.
Date Sites Sampled Samples Collected
10/29/2018 ExG_3, SO_1 43
11/6/2018 Cont_1, SO_1 37
11/7/2018 ExG_2, ExG_5, SS_05 72
11/8/2018 ExG_2, SO_4 47
11/14/2018 SO_3, SO_4, SS_06, SS_09x 56
11/19/2018 ExG_1 49
11/20/2018 ExG_1, ExG_3, SS_10x 40
11/27/2018 ExG_5, ExG_6, SS_03 51
11/28/2018 SS_01, SS_14 25
11/29/2018 ExG_1, ExG_3, SS_13, SO_5, SO_6 51
12/3/2018 ExG_4, SS_11x, SO_7, SO_9 45
12/4/2018 SS_12, ExG_7, SO_2, SO_8, SO_10 49
12/5/2018 SO_2 18
Table 5. Resulting area of each habitat classification after 2018 patent tong survey.
Restoration Type a-priori Habitat
Classification (Acres)
Post-Survey Habitat
Classification (Acres)
Change (Acres)
Seed Only 23.85 15.88 -7.97
Substrate and seed 10.81 9.74 -1.07
Control 2.01 2.01 0
Premet 27.38 34.85 +7.47
SMRWA and College
Restoration Site 6.59 6.59 0
Total 70.64 69.07 -1.57

Page | 15
Table 6. Final reef sites and restoration types for tributary blueprint. Site_ID Restoration Type Area (acres) Yates Bar
Cont_01 Control Site 2.01 Pagan
SMRWA_01 SMRWA Restoration Site 6.59 None
SO_02 Seed only 0.26 Short Point
SO_03 Seed only 0.40 None
SO_04 Seed only 0.70 Biscoe
SO_09 Seed only 0.56 Bryan
SO_07 Seed only 2.88 Horseshoe Bend
SO_01 Seed only 8.07 Horseshoe Bend
SO_05 Seed only 1.27 Horseshoe Bend
SO_08 Seed only 0.39 Pagan
SO_06 Seed only 0.49 Short Point
SO_10 Seed only 0.87 None
SS_08 Substrate and seed 0.92 Seminary
SS_01 Substrate and seed 1.21 None
SS_03 Substrate and seed 1.69 Biscoe
SS_07 Substrate and seed 0.75 Horseshoe Bend
SS_06 Substrate and seed 0.53 Horseshoe Bend
SS_05 Substrate and seed 2.36 None
SS_04 Substrate and seed 1.26 None
SS_02 Substrate and seed 1.02 None
ExG_03 Exceeds Goal 3.07 Short Point
ExG_04 Exceeds Goal 2.25 None
ExG_06 Exceeds Goal 1.11 None
ExG_05 Exceeds Goal 1.77 None
ExG_01 Premet 10.24 None
ExG_08 Premet 0.35 Horseshoe
ExG_09 Premet 0.58 Horseshoe
ExG_10 Premet 0.48 None
ExG_07 Premet 0.67 None
ExG_02 Premet 7.73 None
ExG_11 Premet 2.17 Horseshoe Bend
ExG_12 Premet 4.44 Seminary
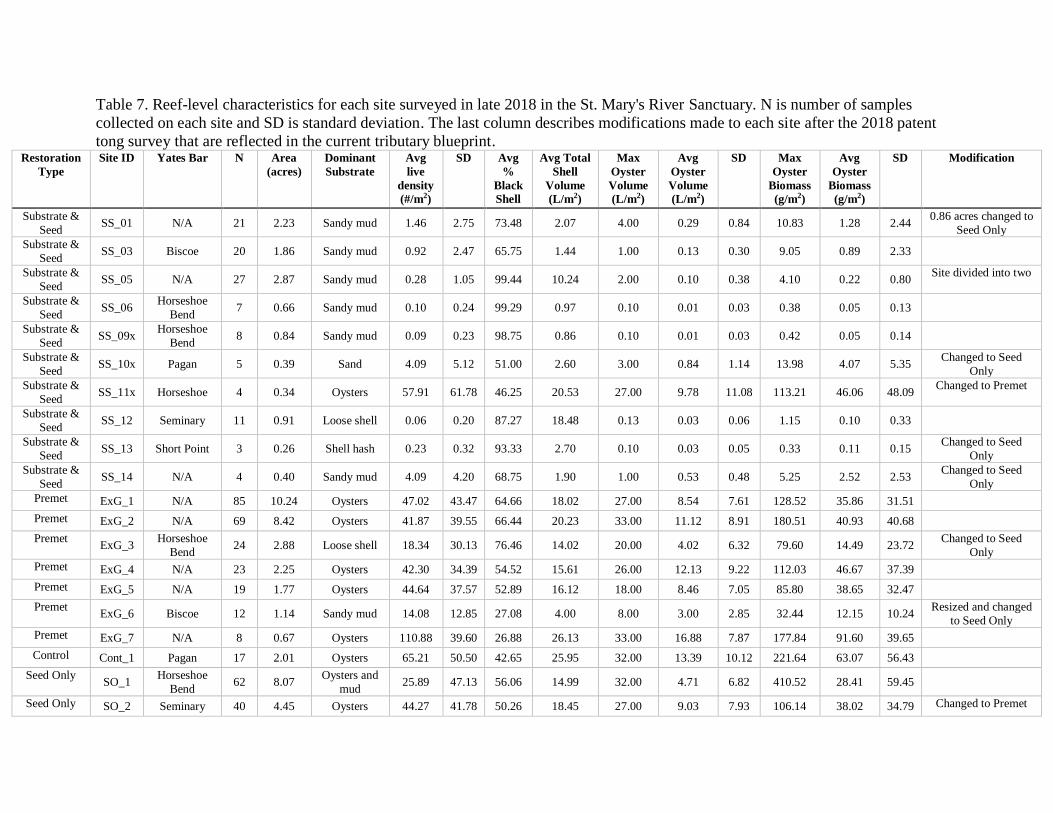
Table 7. Reef-level characteristics for each site surveyed in late 2018 in the St. Mary's River Sanctuary. N is number of samples
collected on each site and SD is standard deviation. The last column describes modifications made to each site after the 2018 patent
tong survey that are reflected in the current tributary blueprint. Restoration
Type
Site ID Yates Bar N Area
(acres)
Dominant
Substrate
Avg
live
density
(#/m2)
SD Avg
%
Black
Shell
Avg Total
Shell
Volume
(L/m2)
Max
Oyster
Volume
(L/m2)
Avg
Oyster
Volume
(L/m2)
SD Max
Oyster
Biomass
(g/m2)
Avg
Oyster
Biomass
(g/m2)
SD Modification
Substrate &
Seed SS_01 N/A 21 2.23 Sandy mud 1.46 2.75 73.48 2.07 4.00 0.29 0.84 10.83 1.28 2.44
0.86 acres changed to
Seed Only
Substrate &
Seed SS_03 Biscoe 20 1.86 Sandy mud 0.92 2.47 65.75 1.44 1.00 0.13 0.30 9.05 0.89 2.33
Substrate &
Seed SS_05 N/A 27 2.87 Sandy mud 0.28 1.05 99.44 10.24 2.00 0.10 0.38 4.10 0.22 0.80
Site divided into two
Substrate &
Seed SS_06
Horseshoe
Bend 7 0.66 Sandy mud 0.10 0.24 99.29 0.97 0.10 0.01 0.03 0.38 0.05 0.13
Substrate &
Seed SS_09x
Horseshoe
Bend 8 0.84 Sandy mud 0.09 0.23 98.75 0.86 0.10 0.01 0.03 0.42 0.05 0.14
Substrate &
Seed SS_10x Pagan 5 0.39 Sand 4.09 5.12 51.00 2.60 3.00 0.84 1.14 13.98 4.07 5.35
Changed to Seed
Only
Substrate &
Seed SS_11x Horseshoe 4 0.34 Oysters 57.91 61.78 46.25 20.53 27.00 9.78 11.08 113.21 46.06 48.09
Changed to Premet
Substrate &
Seed SS_12 Seminary 11 0.91 Loose shell 0.06 0.20 87.27 18.48 0.13 0.03 0.06 1.15 0.10 0.33
Substrate &
Seed SS_13 Short Point 3 0.26 Shell hash 0.23 0.32 93.33 2.70 0.10 0.03 0.05 0.33 0.11 0.15
Changed to Seed
Only
Substrate &
Seed SS_14 N/A 4 0.40 Sandy mud 4.09 4.20 68.75 1.90 1.00 0.53 0.48 5.25 2.52 2.53
Changed to Seed
Only
Premet ExG_1 N/A 85 10.24 Oysters 47.02 43.47 64.66 18.02 27.00 8.54 7.61 128.52 35.86 31.51
Premet ExG_2 N/A 69 8.42 Oysters 41.87 39.55 66.44 20.23 33.00 11.12 8.91 180.51 40.93 40.68
Premet ExG_3
Horseshoe
Bend 24 2.88 Loose shell 18.34 30.13 76.46 14.02 20.00 4.02 6.32 79.60 14.49 23.72
Changed to Seed
Only
Premet ExG_4 N/A 23 2.25 Oysters 42.30 34.39 54.52 15.61 26.00 12.13 9.22 112.03 46.67 37.39
Premet ExG_5 N/A 19 1.77 Oysters 44.64 37.57 52.89 16.12 18.00 8.46 7.05 85.80 38.65 32.47
Premet ExG_6 Biscoe 12 1.14 Sandy mud 14.08 12.85 27.08 4.00 8.00 3.00 2.85 32.44 12.15 10.24
Resized and changed
to Seed Only
Premet ExG_7 N/A 8 0.67 Oysters 110.88 39.60 26.88 26.13 33.00 16.88 7.87 177.84 91.60 39.65
Control Cont_1 Pagan 17 2.01 Oysters 65.21 50.50 42.65 25.95 32.00 13.39 10.12 221.64 63.07 56.43
Seed Only SO_1
Horseshoe
Bend 62 8.07
Oysters and
mud 25.89 47.13 56.06 14.99 32.00 4.71 6.82 410.52 28.41 59.45
Seed Only SO_2 Seminary 40 4.45 Oysters 44.27 41.78 50.26 18.45 27.00 9.03 7.93 106.14 38.02 34.79 Changed to Premet

Page | 17
Seed Only SO_3 N/A 34 3.07 Sandy mud 31.50 35.48 60.38 11.95 22.00 6.33 6.65 99.77 25.77 28.78 Changed to Premet
Seed Only
SO_4 Horseshoe
Bend 28 3.20 Sandy mud 27.35 30.59 82.00 13.80 21.00 6.84 6.91 105.40 27.02 29.92
Portion changed to Premet, portion
changed to Substrate
& Seed
Seed Only SO_5
Horseshoe
Bend 13 1.27 Loose shell 38.94 41.59 60.77 16.35 30.00 8.96 9.01 83.99 30.34 30.55
Seed Only SO_6 Short Point 12 1.09 Sandy mud 7.84 13.39 59.58 4.92 11.00 2.19 3.68 37.57 6.46 11.13
Area reduced to 0.49
acres
Seed Only SO_7 N/A 11 1.11 Oysters 45.90 38.20 48.09 15.98 28.00 12.21 10.04 124.22 49.68 42.94 Changed to Premet
Seed Only SO_8 Horseshoe 5 0.58 Loose shell 63.50 52.24 48.00 15.80 20.00 11.60 8.69 130.85 58.78 46.58 Changed to Premet
Seed Only SO_9 Bryan 7 0.56
Oysters and
mud 28.91 16.98 48.43 13.24 20.00 9.17 5.47 66.57 29.60 18.07
Seed Only SO_10 N/A 4 0.48 Oysters 66.09 44.03 42.50 16.00 16.00 9.50 5.89 92.15 51.98 33.14 Changed to Premet

Figure 6. Ranks from the patent tong survey to determine habitat suitability. (Figure adapted from upper St.
Mary’s Blueprint Report).

Page | 19
Figure 7. Ranking scores of Substrate and Seed sites sampled by patent-tong in fall 2018. Note that scale bar is
different in each plate.

Page | 20
Figure 8. Ranking scores of Premet sites sampled by patent-tong in fall 2018. Note that scale bar is different in
each plate.
Figure 9. Ranking scores of Seed Only sites sampled by patent-tong in fall 2018. Note that scale bar is different
in each plate.

Page | 21
Figure 10. Ranking scores of Control site sampled by patent-tong in fall 2018.
Figure 11. Resulting restoration treatment on reefs determined from the patent tong analysis. (Figure adapted
from upper St. Mary’s Blueprint Report).
Page | 22
5.0 References
Mann, R. and D.A. Evans. 1998. Estimation of oyster, Crassostrea virginica, standing stock,
larval production, and advective loss in relation to observed recruitment in the James River, Virginia.
Journal of Shellfish Research 17(1): 239-253.
Maryland Interagency Oyster Restoration Workgroup. 2019. DRAFT Upper St. Mary’s River Oyster
Restoration Tributary Plan: A Blueprint for Restoring Oyster Populations in the Upper St. Mary’s River
per the Chesapeake Bay Watershed Agreement. Report to the Sustainable Fisheries Goal
Implementation Team of the Chesapeake Bay Program.
Oyster Recovery Partnership. 2019. OYSTER RESTORATION PRE-CONSTRUCTION SITE
ASSESSMENT OF OYSTER SHELL DOMINATED BENTHIC HABITATS IN LITTLE
CHOPTANK RIVER, CHESAPEAKE BAY. Submitted in partial fulfillment of MOU #605P7400192.

Page | 23
APPENDIX 1 –
St. Mary’s Sample Datasheet

Page | 24

Page | 25