Embed Size (px)
Citation preview
Oyster Management Review:
2010-2015
A Report Prepared by
Maryland Department of Natural Resources
Draft Report
July 2016
Larry Hogan, Governor
Mark Belton, Secretary
Oyster Management Review:
2010-2015
DRAFT REPORT - July 2016
Maryland Department of Natural Resources
Fisheries Service 580 Taylor Avenue, B2
Annapolis, Maryland 21401
410-260-8254 TTY users call via the MD Relay
dnr.maryland.gov/fisheries
The facilities and services of the Maryland Department of Natural Resources are available to all without regard to race, color, religion, sex, sexual orientation, age, national origin or physical or mental disability.
This document is available in alternative format upon request from a qualified individual with disability.
Table of Contents
Chapter 1: Executive Summary ...................................................................................................... i Chapter 2: Background ................................................................................................................... 1
Section 2.1: Purpose of Report ................................................................................................... 1
Section 2.2: Creation of the Three Types of Oyster Management Areas ................................... 6
Chapter 3: Description of the Three Types of Management Areas .............................................. 20
Section 3.1: Sanctuaries ............................................................................................................ 23
Section 3.2: Public Shellfish Fishery Management Areas ....................................................... 31
Section 3.3: Aquaculture Areas ................................................................................................ 32
Chapter 4: Effectiveness of Management Areas and Importance of Location ............................. 37
Section 4.1: Assessment of Each Objective by Management Area .......................................... 39
Section 4.2: Sanctuaries ............................................................................................................ 40
Section 4.2.1: Sanctuary Objective #1 .................................................................................. 43
Section 4.2.2: Sanctuary Objective #2 .................................................................................. 48
Section 4.2.3: Sanctuary Objective #3 .................................................................................. 52
Section 4.2.4: Sanctuary Objective #4 .................................................................................. 65
Section 4.2.5: Sanctuary Objective #5 .................................................................................. 70
Section 4.2.6: Sanctuary Objective #6 ................................................................................. 72
Section 4.3: Public Shellfish Fishery Areas .............................................................................. 73
Section 4.3.1: Public Shellfish Fishery Area Objective #1 ................................................... 80
Section 4.3.2: Public Shellfish Fishery Area Objective #2 ................................................... 80
Section 4.3.3: Public Shellfish Fishery Area Objective #3 ................................................... 81
Section 4.4: Aquaculture Areas ................................................................................................ 82
Section 4.4.1: Aquaculture Objective #1 .............................................................................. 84
Section 4.4.2: Aquaculture Objective #2 .............................................................................. 85
Section 4.4.3: Aquaculture Objective #3 .............................................................................. 85
Chapter 5: Conclusions and Recommended Management Alternatives ....................................... 87
Section 5.1: Defining Effectiveness Tiers ................................................................................ 88
Section 5.2: Management Alternatives by Effectiveness Tier .................................................. 94
Section 5.3: Research Recommendations ............................................................................... 108
Chapter 6: Glossary..................................................................................................................... 109
Appendix A: Characterization of Individual Sanctuaries Appendix B: Characterization of Individual NOAA Codes

i
DRAFT REPORT – JULY 2016
Chapter 1: Executive Summary
Oyster Management Review
2010-2015
Maryland Department of Natural Resources
Background
In 2010, the Maryland Department of Natural Resources (DNR) overhauled its regulations for managing oysters in Maryland’s portion of Chesapeake Bay. The regulations expanded the scale of oyster sanctuaries, created new opportunities for oyster aquaculture, and designated areas to be maintained for the public fishery. The preamble of the 2010 proposed oyster regulation states:
“The department has committed to reviewing the effectiveness of the locations
of sanctuaries, public shellfish fishery areas, and aquaculture areas every 5
years and to propose changes where needed." This report uses available information to describe the current status of oyster sanctuaries, Public Shellfish Fishery Areas (PSFAs), and Maryland’s aquaculture industry five years after the management plan was adopted in 2010. Their effectiveness is measured against the objectives of the 2010 proposal: to restore the ecological function of oysters and to enhance the commercial fishery for its economic and cultural benefits. The management plan adopted in 2010 sought to resolve the dual goals of ecological and economic restoration by creating distinct management areas each with its own objectives – Sanctuaries, Public Shellfish Fishery Areas, and Aquaculture Areas.
ii
DRAFT REPORT – JULY 2016
Objectives for sanctuaries, as stated in regulation:
1) Protect half of the Bay’s most productive oyster grounds that remain [in Maryland (Jones and Rothschild 2009)1] and allow investigation of the reasons why these remain most productive;
2) Facilitate development of natural disease resistance;
3) Provide essential natural ecological functions that cannot be obtained on a harvest bar;
4) Serve as a reservoir of reproductive capacity;
5) Provide a broad geographic distribution across all salinity zones; and
6) Increase our [DNR] ability to protect these important areas from poaching..2
Objectives for Public Shellfish Fishery Areas:
1) Retain 168,000 acres of natural oyster bars including 76% (27,000 acres) of the remaining 36,000 acres of remaining productive oyster habitat identified in the Programmatic Environmental Impact Statement (PEIS);
2) Protect half of the bars identified by Jones and Rothschild (2009) as “consistently most productive” for the benefit of licensed oystermen; 3 and
3) Implement a more targeted and scientifically managed wild oyster fishery [hereafter referred to as public fishery].4
1 Jones, P.W. and Rothschild, B.J. 2009. Maryland’s Oyster Redevelopment Program – Sanctuaries and Harvest Reserves. Final Report to the Maryland Department of Natural Resources. http://dnr.maryland.gov/fisheries/Documents/Best_Bar_Report_summary.pdf 2 Maryland Register, Vol 37, Issue 14, Friday July 2, 2010 http://dnr.maryland.gov/fisheries/Documents/Oyster%20Packages%20September%202010.pdf
3 Jones, P.W. and Rothschild, B.J. 2009. Maryland’s Oyster Redevelopment Program – Sanctuaries and Harvest Reserves. Final Report to the Maryland Department of Natural Resources. http://dnr.maryland.gov/fisheries/Documents/Best_Bar_Report_summary.pdf
4 Maryland DNR Oyster Open House 2009. slides 13 and 57. http://dnr.maryland.gov/fisheries/Pages/oysters/5-Year-Oyster-Review-Report.aspx
iii
DRAFT REPORT – JULY 2016
Objectives for Aquaculture Areas:
1) Streamline the regulatory process for aquaculture;
2) Open new areas to leasing to promote shellfish aquaculture industry growth; and
3) Provide alternative economic opportunities for watermen.5
Overview of Management Areas
The total acres of bottom within the three types of distinct management areas are as follows: 5,660 acres of active lease aquaculture area; 253,411 acres of sanctuary, of which 31% (78,520 acres) is historic oyster bottom; and 179,943 acres of PSFA, of which 79% (142,006 acres) is historic oyster bottom. There is an additional 109,676 acres of historic oyster bottom that is neither in sanctuaries nor in a PSFA, but is open to the public oyster fishery. Historic oyster bottom is defined as the area charted in the Yates Oyster Survey from 1906 to 1912 plus its amendments6, and does not necessarily represent the productive oyster bottom in 2016, nor at the time of the Yates survey itself. An analysis conducted as part of the PEIS estimated that there are approximately 36,000 acres of productive oyster bottom remaining in Maryland’s portion of Chesapeake Bay.7 This was based primarily on results of the Yates Oyster Survey (1906 to 1912)8 and the Maryland Bay Bottom Survey (MBBS) conducted by DNR (1974 to 1983). To account for the fact that oyster bottom has degraded substantially over time, the area and habitat quality of each oyster bar identified in the Maryland Bay Bottom Survey was adjusted downward using the habitat loss determined by a 1999 – 2000 survey. Of the estimated 36,000 acres, 76 percent (approximately 27,000 acres) remained open to the public shellfish fishery and 24 percent (9,000 acres) was placed in sanctuary. The 36,000 acres does not account for bottom with poor oyster habitat that could potentially be restored with financial investment in substrate and seed oysters.
5 Maryland Register, Vol 37, Issue 14, Friday July 2, 2010 http://dnr.maryland.gov/fisheries/Documents/Oyster%20Packages%20September%202010.pdf
6 Maryland Department of Natural Resources. 1997. Maryland’s Historic Oyster Bottom: A Geographic representation of the traditional named oyster bars. http://dnr.maryland.gov/fisheries/Documents/maryland_historic_oyster_bottom.pdf
7 U.S. Army Corps of Engineers, Norfolk District. 2009. Programmatic Environmental Impact Statement for Oyster Restoration in Chesapeake Bay Including the Use of a Native and/or Nonnative Oyster. http://dnr.maryland.gov/fisheries/Pages/eis.aspx
8 Yates, Charles. 1913. Survey of Oyster Bars of Maryland 1906 to 1912. http://www.biodiversitylibrary.org/item/96740
iv
DRAFT REPORT – JULY 2016
Effectiveness of Management Areas and Importance of Location
Two data sets were used to assess the effectiveness of sanctuaries and PSFAs - the DNR Annual Fall Oyster Dredge Survey (Fall Survey) and the DNR Patent Tong Population Survey. Harvest data were also used to evaluate PSFAs. Location is a critical factor when considering oyster management areas, due to the wide range of environmental and habitat conditions found on regional and smaller scales down to differences within individual bars. Each management area has its own unique history and future potential based on the attributes of its location. The prevailing salinity of a location is a primary environmental determinant of oyster population dynamics, given its influence on reproduction, growth, and mortality. Oyster habitat (shell and hard substrate) is another key element, providing necessary substrate to which the young oysters can attach. In Maryland, habitat can be extremely patchy, changing greatly within a small distance even on an individual bar. The management areas may have productive oyster bars that are interspersed with patches of sand, mud or other substrate that is unsuitable for oysters. Degradation of oyster habitat is a problem throughout Maryland’s portion of Chesapeake Bay, with some remnant bars having little if any remaining substrate on which young oysters can settle. By some estimates, oyster habitat has diminished by 90% since the Yates Survey of 1912.9 Other factors can be important in accounting for differences in oyster populations among locations but are less well understood or documented for specific management areas, and so are not included in this evaluation. For example, water currents can carry oyster larvae away from a spawning area (“source area”) or can concentrate them in a distant area (“sink area”). Land use may impact management areas in a variety of ways ranging from sedimentation and nutrient enrichment to pesticide use and presence of endocrine disruptors. Likely there are other localized factors affecting oyster populations that are presently unknown. Sanctuaries - Status of 2010 Objectives
Objective #1: Protect half of the Bay’s most productive oyster grounds that remain [in Maryland
(Jones and Rothschild 2009)] and allow investigation of the reasons why these remain most
productive.
Although more than half of the Jones and Rothschild ‘best bars’ have some portion of their area within a sanctuary boundary, only 26% (2,063 acres of historic oyster bottom as charted by the Yates Oyster Survey from 1906 to 1912 and its amendments) of ‘best bar’ area is within sanctuaries. The remaining 74% of ‘best bar’ area is located outside sanctuary boundaries and is open to harvest. Thus, based on the number of ‘best bars’ located in sanctuaries, this objective has been met although the total area of ‘best bars’ within sanctuaries is less than 50%.
9 Yates, Charles. 1913. Survey of Oyster Bars of Maryland 1906 to 1912. http://www.biodiversitylibrary.org/item/96740
v
DRAFT REPORT – JULY 2016
Objective #2: Facilitate development of natural disease resistance.
This objective remains under evaluation. It is too early to know whether the absence of harvest can result in a significant population of oysters that is resistant or tolerant to MSX (Haplosporidium nelsoni) and dermo (Perkinsus marinus) diseases. Oyster populations protected from harvest generally have older, larger oysters than harvested populations. Studying the disease prevalence, intensity, and mortality of sanctuary populations over time will indicate if there is development of disease resistance or tolerance.
Objective #3: Provide essential natural ecological functions that cannot be obtained on a
harvest bar.
It is too early to know whether sanctuary oyster bars are providing more ecological services than harvest bars. However, the proxy indicators for ecological services (survival, abundance, biomass, and size structure) have generally shown stable or increasing trends in sanctuaries.
Increasing biomass, which is more common in sanctuaries than in PSFAs, in many cases reflects the survival of older, larger oysters that have a greater reproductive capacity. Changes in mortality, abundance, biomass and typical oyster size after an area is placed in sanctuary can indicate increased ecological services. Research is beginning to show how a complex, three-dimensional structure benefits the oyster reef and the whole ecosystem.
Objective #4: Serve as a reservoir of reproductive capacity.
The reproductive potential in sanctuaries has increased in recent years with 2015 being the highest value in the 26-year time series. While reproductive potential has increased, it is not beneficial unless there is a sufficiently high density of oysters in an area for successful fertilization. Even if fertilization is successful, the fate of the larvae and spat is not guaranteed due to survival, substrate availability, and other factors.
Objective #5: Provide a broad geographic distribution across all salinity zones.
This objective has been met. Oyster sanctuaries are distributed across all salinity zones in Maryland’s portion of Chesapeake Bay. Approximately 70% of sanctuary acreage is located in low salinity, 20% in medium salinity, and 10% in high salinity areas.
Objective #6: Increase our [DNR] ability to protect these important areas from poaching..
This objective has been met. Larger sanctuaries that were developed in 2010 include the area between bars are easier to enforce than small sanctuaries that are located in isolated areas or close to harvest areas. This design makes it more difficult for poachers to quickly enter the sanctuary and return to a harvest area. The ability to protect sanctuaries from poaching also has increased implementation of Maritime Law Enforcement Information Network (MLEIN) and DNR’s ability to suspend licenses administratively with the points system for multiple sanctuary violations.
vi
DRAFT REPORT – JULY 2016
Public Shellfish Fishery Areas - Status of 2010 Objectives
Objective #1: Retain 168,000 acres of natural oyster bars including 76% (27,000 acres) of the
remaining 36,000 acres of remaining productive oyster habitat identified in the Programmatic
Environmental Impact Statement (PEIS).
This objective has been met. In 2010, 179,943 acres were classified as PSFAs where aquaculture is prohibited. A total of 27,439 acres, or 76% of the remaining 36,000 acres of productive oyster habitat identified in the PEIS, is currently within PSFAs. Since 2010, 24 acres of PSFA have been declassified in order to allow leasing.
Objective #2: Protect half of the bars identified by Jones and Rothschild (2009) as “consistently
most productive” for the benefit of licensed oystermen.
This objective has been met. Half of the Jones and Rothschild ‘best bars’ have some portion of their area available to the public fishery for harvest. 74% of the area (as defined by the Yates Oyster Survey from 1906 to 1912 and its amendments) encompassed by ‘best bars’ is located outside sanctuary boundaries and is open to the public fishery for harvest.
Objective #3: Implement a more targeted and scientifically managed public oyster fishery.
This objective is incomplete. DNR will conduct a stock assessment by December 2018 that will provide guidance for the development of biological reference points for the management of the oyster population.10
Aquaculture – Status of 2010 Objectives
Objective #1: Simplify the aquaculture regulatory process.
This objective is met. Legislation passed in 2009 has streamlined the regulatory process for aquaculture by removing many impediments to shellfish aquaculture in Maryland by lifting county moratoria on bottom leasing for oyster aquaculture, removing size limitations on leases, providing that leases could be issued to corporations, and requiring that leases be actively used for commercial shellfish aquaculture purposes. In 2011, additional legislation consolidated the state authority for shellfish aquaculture permitting within DNR. Finally, DNR worked with the U.S. Army Corps of Engineers (USACE), Baltimore District to negotiate and establish a Regional General Permit-1 (RGP-1) for commercial shellfish aquaculture activities which will streamline and facilitate the federal review process for qualifying shellfish aquaculture projects. Objective #2: Open new areas to leasing to promote shellfish aquaculture industry growth.
This objective is met. The 2009 law opened thousands of acres for shellfish aquaculture leasing.11
10 SB 937, Chapter Number 703, 2016 http://mgaleg.maryland.gov/webmga/frmMain.aspx?id=sb0937&stab=01&pid=billpage&tab=subject3&ys=2016RS
11 SB 271, Chapter Number 173, 2009 http://mgaleg.maryland.gov/webmga/frmMain.aspx?tab=subject3&ys=2009rs/billfile/sb0271.htm
vii
DRAFT REPORT – JULY 2016
Objective #3: Provide alternative economic opportunities for watermen.
This objective is met. Maryland watermen are benefitting from economic opportunities provided by aquaculture. Approximately 50% of leaseholders are commercial licensed watermen in Maryland’s public fishery who are now investing in shellfish aquaculture. Furthermore, harvest from aquaculture is highest in the months of April and May, which provides income outside of the public oyster fishery season which is October 1st to March 31st. Conclusions and Potential Future Management Alternatives
In recent years, oyster populations throughout Maryland, whether in fished or sanctuary areas, have benefited from low disease mortality and from two good years of reproduction (spatfall) in 2010 and 2012. Oyster biomass has generally increased in Maryland over the last decade. However, whereas biomass continued to increase in 2014 and 2015 in sanctuaries, biomass began to decline in these years within the PSFAs. This is probably because the fished areas are beginning another downward cycle as the 2010 and 2012 year classes are harvested. Because these large, older oysters are not harvested in sanctuaries, the biomass continues to rise each year. As these older, larger oysters produce the most eggs, reproductive potential in sanctuary areas also continues to rise. Given the complexity of the Chesapeake Bay ecosystem, five years has not been long enough to show how oyster populations respond to the absence of harvest. Many sanctuaries show positive signs such as increased biomass and reproductive capacity while others have not shown any changes. This is reasonable, since restoration activities have been taking place over a shorter period of time and are still on-going in some sanctuaries. The overall, long-term behavior of sanctuaries will depend on many factors including changes in weather, water movement patterns, disease, and predator/prey abundance. Although five years is not enough time to fully understand the biological consequences of sanctuary management, there is justification to consider adjustments to the boundaries of the current management areas. The over-arching objectives of oyster management in Maryland remains to restore the ecological function of oysters and to enhance the commercial fishery for its economic and cultural benefits. To achieve ecological restoration, the scale of sanctuaries remains important and should be maintained within the range of 20-30% of the remaining productive bottom. However, there are sanctuaries (and PSFAs) that are known to have poor habitat and/or very low densities of oysters. These areas cannot be restored either for ecological or fishery purposes without substantial financial investment either by government or by private entities. If the ultimate goal is to have more oysters in the water, then some areas that are currently sanctuaries could contribute to this goal and provide economic and cultural benefits to fishing communities, particularly if these areas are managed in a way that balances harvest with continuous investment to maintain oyster populations in the area.
viii
DRAFT REPORT – JULY 2016
Description of Effectiveness Tiers Both sanctuaries and PSFAs were placed into ranked groups called tiers. The tiers are based on data that reflect relative oyster productivity of the areas. Ranking these tiers can be used to ensure a fair distribution of the most productive oyster areas, even if individual areas are reclassified. By trading sanctuary and PSFAs within equivalent tiers, “conservation equivalency” is maintained. The 176 PSFA were grouped into the 39 large NOAA Code harvest reporting areas. It is important to note that each NOAA Code may contain multiple PSFAs and some PSFAs do not reside entirely within a single NOAA Code. As with sanctuaries, there is a wide range of productivity of NOAA Code areas; some consistently produce relatively high harvest with minimal investment, and others are not viable for harvesting, and are not likely to ever be so without substantial investment in habitat and oyster population restoration. Tier 0 sanctuaries have received significant financial investment through restoration projects and will contribute to the achievement of Maryland’s commitment to the Chesapeake Bay Watershed Agreement “to restore oyster habitat and populations in five tributaries by 2025 and to ensure
their protection.” In 2014 both the Maryland and Virginia governors signed the Chesapeake Bay Watershed Agreement. The Chesapeake Bay Watershed Agreement oyster outcome aims to restore and protect oyster reefs in 10 tributaries by 2025 - five tributaries in Maryland and five in Virginia. Sanctuaries in Tier 0 include Harris Creek, Little Choptank River, and Tred Avon River sanctuaries. They were chosen as targeted restoration areas based on consideration of salinity levels, available restorable bottom, historical spat set, and other factors. There are no Tier 0 PSFAs.
Tier 1 sanctuaries are data-rich and have not had significant restoration activities since 2010. Therefore, these sanctuaries are demonstrating how oyster populations respond to environmental stressors in the absence of harvest. Some Tier 1 sanctuaries have potential to achieve the Chesapeake Bay Watershed Agreement goals without substantial additional investment. There are nine Tier 1 sanctuaries: Hooper Straight, Kitts Creek, Lower Choptank River, Manokin River, Nanticoke River, Point Lookout, Somerset, St. Mary’s River, and Wye River. Tier 1 PSFAs are data-rich and highly productive harvest areas. The PSFAs in Tier 1 were located in fifteen NOAA Codes: Broad Creek, Chesapeake Bay (lower, middle), Chesapeake Bay (lower, west), Lower Choptank River, Fishing Bay, Harris Creek, Honga River, Little Choptank River, Mouth of Eastern Bay, Upper Patuxent River, Pocomoke Sound, Smith Creek, St. Mary’s River, Tangier Sound SE, and Tangier Sound SW. Tier 1A sanctuaries contain oyster restoration or research projects conducted by the USACE, although some of these projects are quite old and are no longer active. In many cases, these Tier 1A sanctuaries were created prior to 2010. There are fourteen Tier 1A sanctuaries: Chester Oyster Reserve Area (ORA), Choptank ORA, Cook Point, Howell Point, Lower Chester River,
ix
DRAFT REPORT – JULY 2016
Lower Mainstem, Magothy River, Mill Hill, Neal Addition, Sandy Hill, Severn River, Upper Chester River, Upper Choptank River, and Upper Patuxent River There are no Tier 1A PSFAs. Tier 2 sanctuaries either have incomplete data sets or have shown mixed signals over time. These areas would benefit from more time to understand how oyster populations respond in the absence of harvest. There are nine Tier 2 sanctuaries: Breton Bay, Calvert Shore, Cox Creek, Eastern Bay, Lower Patuxent River, Miles River, Prospect Bay, Ringgold, and South River. Tier 2 PSFAs are moderately productive harvest areas. The PSFAs in Tier 2 were located in fourteen NOAA Codes: Chesapeake Bay (upper), Chesapeake Bay (upper-middle), Lower Chester River, Middle Chester River, Middle Choptank River, Eastern Bay, Miles River, Lower Patuxent River, South River, St. Clements and Breton Bay, Tangier Sound North, Tred Avon River, Wicomico River (East), Wicomico River (West) Tier 3 sanctuaries have poor habitat and few or no oysters, depending on the level of effort applied in these areas. These sanctuaries may also have incomplete or no information. There are sixteen Tier 3 sanctuaries: Big Annemessex, Cedar Point, Fort Carroll, Herring Bay, Man O’ War Gales Lump, La Trappe Creek, Oxford Lab, Piney Point, Plum Point, Poplar Island, Roaring Point, Solomons Creeks, Tilghman Island, Webster, and Wicomico West Tier 3 PSFAs are those with little information, low or no harvest, or are known to have poor habitat and few or no oysters. The PSFAs in Tier 3 were located in twelve NOAA Codes: Big Annemessex River, Chesapeake Bay (lower east), Magothy River, Manokin River, Middle Patuxent River, Monie Bay, Nanticoke River, Severn River, West and Rhode River, Wye River, Upper Chester River, and Upper Choptank River. In the Manokin River, Severn River, Upper Chester River, Upper Choptank River, and Wye River NOAA Codes, data was not collected because of the small area within each NOAA Code that was not in a sanctuary. Possible Future Management Alternatives for Individual Areas by Tier
Tier 0 Sanctuaries 1) Maintain current strategy - Remain as a sanctuary and continue with investment (reef
construction and/or oyster seeding) until restoration criteria are met.
2) Remain as sanctuary, but with no continued investment
Tier 1 Sanctuaries
The data presented in this report indicate that Tier 1 sanctuaries are generally responding well in the absence of harvest which supports the conclusion that these areas should be maintained as sanctuaries. The Manokin River and St. Mary’s River sanctuaries show potential to achieve Bay Agreement restoration goals without significant additional financial investment. Investment
x
DRAFT REPORT – JULY 2016
refers to habitat creation and the planting of seed oysters. Incorporating investment may allow restoration goals to be achieved more quickly. We have included separate alternatives for Somerset Sanctuary, which is a small area located in Tangier Sound surrounded by a harvest area, hence enforcement of the sanctuary is difficult and this area does not meet the objective to facilitate enforcement. The Somerset Sanctuary was created in 1999 to compensate for expanded power dredging in the area, so it was not created with the 2010 management objectives in mind.
1) Maintain current strategy - Remain in sanctuary without additional investment such as habitat construction and/or planting seed oysters.
2) Remain as a sanctuary, but with additional investment (reef construction and/or oyster seeding) until restoration criteria are met.
Somerset Sanctuary:
1s) Convert to an area for public harvest under a specific management structure for the area (e.g. Somerset-specific seasons, times, bushel limits, rotational closures, etc.).
2s) Declassify as a sanctuary.
Tier 1A Sanctuaries
Recognizing the importance of maintaining 20 – 30% of oyster bottom in sanctuary, future alternative 3 provides opportunity to adjust sanctuary boundaries in those areas that the data indicate have performed poorly with no investment in the maintenance and/or restoration of oyster populations. Some areas could potentially be adjusted so that they can provide economic and cultural benefits to fishing communities and result in a greater abundance of oysters if these areas are managed in a way that balances harvest with continuous investment to maintain oyster populations in the area. In the near term, alternative 3 will not support restoration for ecological purposes.
1) Maintain current strategy - Remain in sanctuary without additional investment such as habitat construction and/or planting seed oysters.
2) Remain as a sanctuary, but with additional investment (reef construction and/or oyster seeding) until restoration criteria are met.
3) Work with DNR and the USACE to develop area-specific management plans. No harvest could occur on USACE reefs or projects without USACE permission. In other areas, investment would be a condition to allow harvest, and funds could be generated by sources such as license surcharge funds, oyster bushel taxes, leasing, and private-public partnerships.
xi
DRAFT REPORT – JULY 2016
Tier 2 Sanctuaries
Recognizing the importance of maintaining 20 – 30% of oyster bottom in sanctuary, future alternative 3 provides opportunity to adjust sanctuary boundaries in those areas that the data indicate have performed poorly with no investment in the maintenance and/or restoration of oyster populations. Some areas could potentially be adjusted so that they can provide economic and cultural benefits to fishing communities and result in a greater abundance of oysters if these areas are managed in a way that balances harvest with continuous investment to maintain oyster populations in the area. In the near term, alternative 3 will not support restoration for ecological purposes.
1) Maintain current strategy - keep in sanctuary without additional investment.
2) Maintain as sanctuary with additional investment in reef construction and oyster monitoring until restoration criteria met.
3) Declassify some portion of the area as a sanctuary and begin process to develop an area-specific management plan. Investment would be a condition to allow harvest, and funds could be generated by sources including but not limited to: license surcharge funds, oyster bushel taxes, leasing, private-public partnerships.
Tier 3 Sanctuaries Recognizing the importance of maintaining 20 – 30% of oyster bottom in sanctuary, future alternative 3 provides opportunity to adjust sanctuary boundaries in those areas that the data indicate have performed poorly with no investment in the maintenance and/or restoration of oyster populations. Some areas could potentially be adjusted so that they can provide economic and cultural benefits to fishing communities and result in an increased population of oysters if these areas are managed in a way that balances harvest with continuous investment to maintain oyster populations in the area. Future alternative 4 is least likely to provide economic and cultural benefits to fishing communities because it does not require investment for harvest, but by allowing leasing in the area it could result in a larger number of oysters in the area.
1) Maintain current strategy - keep in sanctuary without additional investment.
2) Maintain as sanctuary with additional investment in reef construction and oyster monitoring until restoration criteria met.
3) Declassify some portion of the area as a sanctuary and begin process to develop an area-specific management plan. Investment would be a condition to allow harvest, and funds could be generated by sources including but not limited to: license surcharge funds, oyster bushel taxes, leasing, private-public partnerships.
4) Remove some portion of the area from sanctuary and manage under current public fishery rules as they evolve, allowing leasing in the area.
xii
DRAFT REPORT – JULY 2016
Tier 1, 2, and 3 PSFAs
1) Maintain current strategy - no change to PSFA. Management will continue under public fishery rules as they evolve.
2) County Oyster Committees petition DNR to develop an area-specific management plan for a PSFA that focuses on maintaining oysters in the area by balancing harvest with investment in the form of planting seed oysters and maintaining habitat. This may require regulatory or statutory change.
3) Conservational equivalent trade – convert some portion of the area to sanctuary in trade
for some sanctuary area in the equivalent tier.
1
DRAFT REPORT – JULY 2016
Chapter 2: Background
Section 2.1: Purpose of Report In 2010, the Maryland Department of Natural Resources (DNR) overhauled its regulations for the management of oysters in the Maryland portion of Chesapeake Bay. The new regulations expanded oyster sanctuaries, created new opportunities for oyster aquaculture, and designated areas to be maintained for the public fishery. There were two documents summarizing the current scientific knowledge of oysters and extensive public input regarding oyster restoration which guided the development of the 2010 regulatory action: Maryland’s Oyster Advisory Commission’s 2008
Report Concerning Maryland’s Chesapeake Bay Oyster Management Program (January 2009)12, and the state/federal Final Programmatic Environmental Impact Statement for Oyster
Restoration in Chesapeake Bay.13 These documents represent the synthesis of years of collaborative work among managers, scientists and stakeholders, provide updated science and reaffirm the dual goals of restoring oysters for their ecological services and enhancing a commercial fishery for its economic and cultural benefits to the Chesapeake Bay region.14,15 In 2009, DNR carried forward recommendations from these reports including the expansion of sanctuary areas, expansion of aquaculture, and the creation of a scientifically based management framework for the public oyster fishery to create a regulatory proposal for public review and comment. The final regulation was promulgated in 2010.
12Maryland Oyster Advisory Commission 2008 Report. Implementation of House Bill 133 Natural Resources – Chesapeake Bay – Oyster Restoration. Concerning Maryland’s Chesapeake Bay Oyster Management Program. Submitted to the Governor and General Assembly January 30, 2009. http://dnr.maryland.gov/fisheries/Documents/oac_report_final.pdf
13 U.S. Army Corps of Engineers, Norfolk District. 2009. Programmatic Environmental Impact Statement for Oyster Restoration in Chesapeake Bay Including the Use of a Native and/or Nonnative Oyster. http://dnr.maryland.gov/fisheries/Pages/eis.aspx
14 Maryland Oyster Roundtable Action Plan, December 1993 http://www.oysterrecovery.org/wp-content/uploads/2012/03/1993-Oyster-Round-Table.pdf
15 2004 Chesapeake Bay Oyster Management Plan (adopted 2005), http://www.dnr.state.md.us/irc/docs/2004ChesapeakeBayOysterManagementPlanDecember2005.pdf
Purpose of the Five Year Oyster
Review Report:
“The department [of Natural
Resources] has committed to
reviewing the effectiveness of the
locations of sanctuaries, public
shellfish fishery areas, and
aquaculture areas every 5 years and
to propose changes where needed."
2
DRAFT REPORT – JULY 2016
The preamble of the 2010 proposed oyster regulation states: “The department has committed to
reviewing the effectiveness of the locations of sanctuaries, public shellfish fishery areas, and
aquaculture areas every 5 years and to propose changes where needed."16 The three types of management areas identified in the preamble are defined as follows:
Sanctuaries – Areas permanently closed to oyster harvest. Some sanctuaries have been targeted for extensive oyster restoration projects to potentially accelerate the recovery of oyster populations within the sanctuary, increase their environmental benefits, and contribute to enhancement of populations outside the sanctuary.
Public Shellfish Fishery Areas (PSFAs) – Areas where shellfish are harvested for commercial purposes. Oyster aquaculture leases are not allowed in these areas unless a petition to declassify is approved which may occur if a biological survey indicates that the area does not have enough oysters to support commercial harvest by the public fishery.17
Aquaculture – Areas where aquaculture leases are issued by the state to individuals for private aquaculture. Aquaculture Enterprise Zones (AEZ’s) refer to two specific areas created, by regulation, within the Patuxent River where an individual or a group of people can begin leasing without obtaining an individual permit. The AEZ concept has not been implemented and therefore these will not be further discussed in this report.
16 Maryland Register, Vol 37, Issue 14, p. 943. Friday July 2, 2010 http://dnr.maryland.gov/fisheries/Documents/Oyster%20Packages%20September%202010.pdf
17 (COMAR 08.02.23.03) http://www.dsd.state.md.us/COMAR/ComarHome.html
3
DRAFT REPORT – JULY 2016
Defining ‘Effectiveness’
Effectiveness is defined relative to the original management objectives of the 2010 proposal: to restore the ecological function of oysters and to enhance the commercial fishery for its economic and cultural benefits. The management plan adopted in 2010 sought to resolve the dual goals of ecological and fishery restoration by creating distinct management areas each with their own objectives – sanctuaries, PSFAs, and oyster aquaculture areas where leasing can occur. Objectives for sanctuaries, as stated in regulation:
1) Protect half of the Bay’s most productive oyster grounds that remain [in Maryland (Jones and Rothschild 2009)18] and allow investigation of the reasons why these remain most productive;
2) Facilitate development of natural disease resistance;
3) Provide essential natural ecological functions that cannot be obtained on a harvest bar;
4) Serve as a reservoir of reproductive capacity;
5) Provide a broad geographic distribution across all salinity zones; and
6) Increase our [DNR] ability to protect these important areas from poaching.19
Objectives for Public Shellfish Fishery Areas:
1) Retain 168,000 acres of natural oyster bars including 76% (27,000 acres) of the remaining 36,000 acres of remaining productive oyster bottom identified in the Programmatic Environmental Impact Statement (PEIS);
18 Jones, P.W. and Rothschild, B.J. 2009. Maryland’s Oyster Redevelopment Program – Sanctuaries and Harvest Reserves. Final Report to the Maryland Department of Natural Resources. http://dnr.maryland.gov/fisheries/Documents/Best_Bar_Report_summary.pdf
19 Maryland Register, Vol 37, Issue 14, Friday July 2, 2010 http://dnr.maryland.gov/fisheries/Documents/Oyster%20Packages%20September%202010.pdf
Effectiveness should be defined relative to
the original management objectives of the
2010 proposal: to restore the ecological
function of oysters and to enhance the
commercial fishery for its economic and
cultural benefits. The management plan
adopted in 2010 sought to resolve the
dual goals of ecological and fishery
restoration by creating distinct
management areas with their own
objectives – sanctuaries, public shellfish
fishery areas and aquaculture areas.
4
DRAFT REPORT – JULY 2016
2) Protect half of the ‘best bars’ identified by Jones and Rothschild (2009) as “consistently most productive” for the benefit of licensed oystermen; 20 and
3) Implement a more targeted and scientifically managed wild oyster fishery [hereafter referred to as public fishery].21
Objectives for Aquaculture:
1) Streamline the regulatory process for aquaculture;
2) Open new areas to leasing to promote shellfish aquaculture industry growth; and
3) Provide alternative economic opportunities for watermen.22
This report provides information on oyster populations within the 51 individual sanctuaries and PSFAs before and after their creation. The status of the aquaculture industry is also examined.. Even though future trends may change, a comparison of oyster populations before and after 2010 is a useful first indicator of the effectiveness of the locations of sanctuaries and PSFAs. In particular, ecological services such as a water filtration and creation of habitat for other species can be linked to oyster survival, abundance, biomass, and size structure.23,24 Any assessment of effectiveness must be considered in the context of the five years since the new oyster management plan was implemented. Five years is not sufficient time to determine if fundamental and durable changes to the oyster population have occurred, given the relatively long life (15-20 years25) of the oyster and the variable nature of the estuarine environment. For example, wet years and dry years have significant impacts on oyster reproduction, growth,
20 Jones, P.W. and Rothschild, B.J. 2009. Maryland’s Oyster Redevelopment Program – Sanctuaries and Harvest Reserves. Final Report to the Maryland Department of Natural Resources. http://dnr.maryland.gov/fisheries/Documents/Best_Bar_Report_summary.pdf
21 Maryland DNR Oyster Open House 2009. slides 13 and 57. http://dnr.maryland.gov/fisheries/Pages/oysters/5-Year-Oyster-Review-Report.aspx
22 Maryland Register, Vol 37, Issue 14, Friday July 2, 2010 http://dnr.maryland.gov/fisheries/Documents/Oyster%20Packages%20September%202010.pdf
23 Grabowski, J.H., Peterson, C.H. 2007. Restoring Oyster Reefs to Recover Ecosystem Services in Ecosystem Engineers: Plants to Protists. Academic Press.
24 Luckenbach, M.W., Coen, L.D., Ross, P.G. Jr., Stephan, J.A. 2005. Oyster reef Habitat Restoration: Relationships Between Oyster Abundance and Community Development based on Two Studies in Virginia and South Carolina. Journal of Coastal Research. SI. 40:64-78.
25 Buroker NE. 1983. Population genetics of the American oyster Crassostrea virginica along the Atlantic coast and Gulf of Mexico. Marine Biology 75:99-112.
5
DRAFT REPORT – JULY 2016
disease pressure and mortality, and historically the climate shifts multiple times between these two conditions over periods of several years.26,27 Additionally, this report does not directly compare sanctuary and public fishery areas as an indicator of effectiveness. Given available data, such comparisons are inappropriate due to the spatial variability of the environment which can result in large differences in spatfall, growth, and mortality. Therefore, this report evaluates effectiveness separately for the three management areas, focusing on measurements taken before and after implementation of the 2010 regulations.
26 Tarnowski, 2010. Maryland Oyster Population Status Report, 2009 Fall Survey. http://dnr.maryland.gov/fisheries/Documents/2009FSreport.pdf
27 Tarnowski, 2012. Maryland Oyster Population Status Report, 2011 Fall Survey. http://dnr.maryland.gov/fisheries/Documents/2011FSreport.pdf
6
DRAFT REPORT – JULY 2016
Section 2.2: Creation of the Three Types of Oyster Management Areas
Commercial landings of oysters in Maryland plummeted in the last part of the 19th century, with annual harvests decreasing by more than half between the late 1800s and the 1930s. Over the following 50 years, harvests remained fairly stable, fluctuating around 2 million bushels annually until another decline occurred in the late 1980s. This was partially due to the oyster diseases MSX (Haplosporidium nelsoni) and dermo (Perkinsus marinus).28 Since that time, commercial yields have remained at less than 400,000 bushels with a low of 26,000 bushels occurring in the 2003-2004 oyster season. The low harvest of 2003-2004 was mainly due to four years of drought conditions that increased salinity which in return increased disease related mortality of oysters. The decline in oyster populations and oyster harvest (largely due to the presence of the oyster diseases MSX and dermo29) indicated that traditional management, repletion, and restoration programs were not able to reverse the overall baywide decline in the oyster population, and would not lead to successful restoration of oyster populations for both fishery and ecological purposes. Further, it was becoming evident that restoration efforts intended to support fishery harvests are incompatible with restoration efforts intended to renew ecological functionality. Similarly, restoration efforts focused on ecological objectives are unlikely to ensure economic viability of the fishery. However, in the long term, restoration of ecological functionality could provide harvestable surplus sufficient to meet fishery needs.30 In the search for a new approach to oyster restoration, Maryland and Virginia began investigating the possibility of introducing a nonnative oyster that was resistant to these diseases. In 2000, positive results from limited experimental trials with triploid Suminoe oysters (Asian Crassostrea airiakensis, also known as the Asian Suminoe oyster) showed promising growth rates and low mortalities at all salinity regimes tested in Chesapeake Bay. These positive results prompted Maryland and Virginia to consider introduction of this species into the bay. To assess the risks involved with introduction of a non-native species, the Chesapeake Bay Commission, the Chesapeake Bay Foundation, the U.S. Environmental Protection Agency, and
28 Maryland Department of Natural Resources Tidewater Administration. 1987. Status & Trends 1987. Maryland’s Oyster Resources.
29 U.S. Army Corps of Engineers, Norfolk District. 2009. Programmatic Environmental Impact Statement for Oyster Restoration in Chesapeake Bay Including the Use of a Native and/or Nonnative Oyster. http://dnr.maryland.gov/fisheries/Pages/eis.aspx 30 National Research Council. 2004. Nonnative Oysters in the Chesapeake Bay. The National Academies Press. Washington, D.C.
“In the near term, restoration efforts intended
to support fishery harvests are incompatible
with restoration efforts intended to renew
ecological functionality. Similarly, restoration
efforts focused on ecological objectives are
unlikely to ensure economic viability of the
fishery. In the long term, restoration of
ecological functionality could provide
harvestable surplus sufficient to meet fishery
needs.” (Coen and Luckenbach in NRC 2004)
7
DRAFT REPORT – JULY 2016
the U.S. Senate Committee on Appropriations asked the National Research Council (NRC) of the National Academy of Sciences to describe the state of knowledge about the Suminoe oyster and begin assessing the risks (Figure 2-1). The resulting report, Nonnative Oysters in Chesapeake
Bay, was published in 2004 and highlighted the need for, and the complexity of, oyster restoration in Chesapeake Bay.31 Growing interest in the possible introduction of the Suminoe oyster to Chesapeake Bay prompted the U.S. Army Corps of Engineers (USACE), DNR, and the Virginia Marine Resources Commission to develop the PEIS for oyster restoration in Chesapeake Bay. The PEIS carried forward many of the findings of the NRC report, Nonnative Oysters in Chesapeake Bay, and provided [to the public] in depth analyses of eight potential alternatives for restoring oysters in the bay:
1) No action.
2) Enhance efforts to restore the native oyster.
3) Harvest moratorium.
4) Cultivate native oysters (aquaculture).
5) Cultivate nonnative (Suminoe) oysters (aquaculture).
6) Introduce a nonnative oyster other than the Suminoe oyster (eliminated from analysis).
7) Introduce the Suminoe oyster and discontinue efforts to restore the Eastern oyster (eliminated from analysis).
8) A combination of above alternatives.32
31 National Research Council. 2004. Nonnative Oysters in the Chesapeake Bay. The National Academies Press. Washington, D.C.
32 U.S. Army Corps of Engineers, Norfolk District. 2009. Programmatic Environmental Impact Statement for Oyster Restoration in Chesapeake Bay Including the Use of a Native and/or Nonnative Oyster. http://dnr.maryland.gov/fisheries/Pages/eis.aspx
8
DRAFT REPORT – JULY 2016
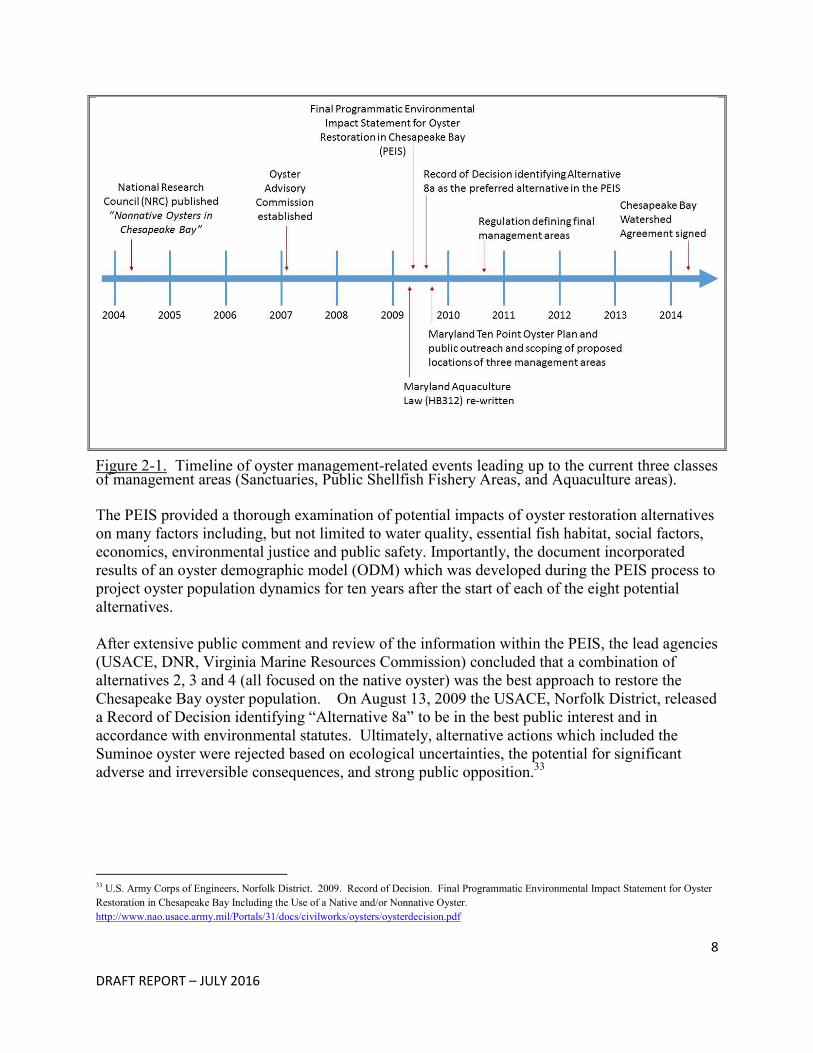
Figure 2-1. Timeline of oyster management-related events leading up to the current three classes of management areas (Sanctuaries, Public Shellfish Fishery Areas, and Aquaculture areas). The PEIS provided a thorough examination of potential impacts of oyster restoration alternatives on many factors including, but not limited to water quality, essential fish habitat, social factors, economics, environmental justice and public safety. Importantly, the document incorporated results of an oyster demographic model (ODM) which was developed during the PEIS process to project oyster population dynamics for ten years after the start of each of the eight potential alternatives. After extensive public comment and review of the information within the PEIS, the lead agencies (USACE, DNR, Virginia Marine Resources Commission) concluded that a combination of alternatives 2, 3 and 4 (all focused on the native oyster) was the best approach to restore the Chesapeake Bay oyster population. On August 13, 2009 the USACE, Norfolk District, released a Record of Decision identifying “Alternative 8a” to be in the best public interest and in accordance with environmental statutes. Ultimately, alternative actions which included the Suminoe oyster were rejected based on ecological uncertainties, the potential for significant adverse and irreversible consequences, and strong public opposition.33
33 U.S. Army Corps of Engineers, Norfolk District. 2009. Record of Decision. Final Programmatic Environmental Impact Statement for Oyster Restoration in Chesapeake Bay Including the Use of a Native and/or Nonnative Oyster. http://www.nao.usace.army.mil/Portals/31/docs/civilworks/oysters/oysterdecision.pdf
9
DRAFT REPORT – JULY 2016
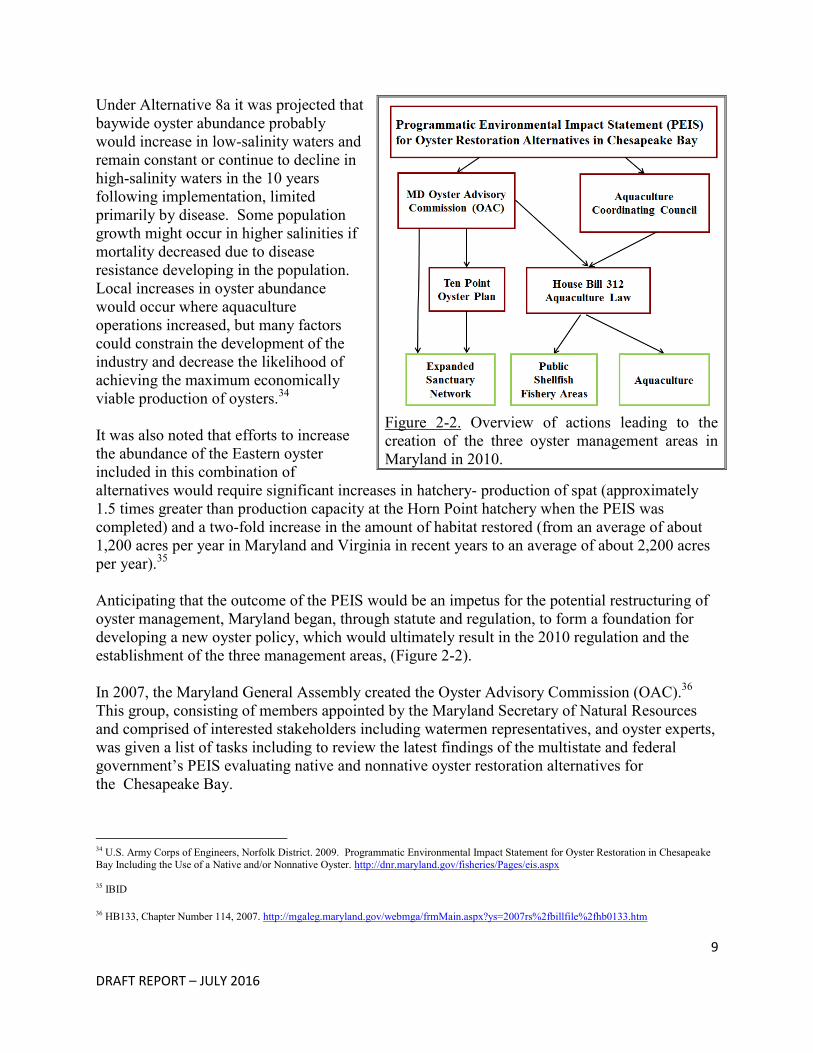
Under Alternative 8a it was projected that baywide oyster abundance probably would increase in low-salinity waters and remain constant or continue to decline in high-salinity waters in the 10 years following implementation, limited primarily by disease. Some population growth might occur in higher salinities if mortality decreased due to disease resistance developing in the population. Local increases in oyster abundance would occur where aquaculture operations increased, but many factors could constrain the development of the industry and decrease the likelihood of achieving the maximum economically viable production of oysters.34 It was also noted that efforts to increase the abundance of the Eastern oyster included in this combination of alternatives would require significant increases in hatchery- production of spat (approximately 1.5 times greater than production capacity at the Horn Point hatchery when the PEIS was completed) and a two-fold increase in the amount of habitat restored (from an average of about 1,200 acres per year in Maryland and Virginia in recent years to an average of about 2,200 acres per year).35 Anticipating that the outcome of the PEIS would be an impetus for the potential restructuring of oyster management, Maryland began, through statute and regulation, to form a foundation for developing a new oyster policy, which would ultimately result in the 2010 regulation and the establishment of the three management areas, (Figure 2-2). In 2007, the Maryland General Assembly created the Oyster Advisory Commission (OAC).36 This group, consisting of members appointed by the Maryland Secretary of Natural Resources and comprised of interested stakeholders including watermen representatives, and oyster experts, was given a list of tasks including to review the latest findings of the multistate and federal government’s PEIS evaluating native and nonnative oyster restoration alternatives for the Chesapeake Bay.
34 U.S. Army Corps of Engineers, Norfolk District. 2009. Programmatic Environmental Impact Statement for Oyster Restoration in Chesapeake Bay Including the Use of a Native and/or Nonnative Oyster. http://dnr.maryland.gov/fisheries/Pages/eis.aspx 35 IBID
36 HB133, Chapter Number 114, 2007. http://mgaleg.maryland.gov/webmga/frmMain.aspx?ys=2007rs%2fbillfile%2fhb0133.htm
Figure 2-2. Overview of actions leading to the creation of the three oyster management areas in Maryland in 2010.
10
DRAFT REPORT – JULY 2016
In its 2008 report submitted to the Maryland General Assembly and to the Governor, the Oyster Advisory Commission presented six recommendations to achieve oyster restoration including
1) Establish separate ecological restoration and industry revitalization goals and management strategies;
2) Focus ecological restoration efforts in a large-scale, interconnected fashion to allow large oyster populations to persist in the face of disease and other stressors;
3) Implement a new oyster fisheries management plan, based on biological reference points including threshold levels of sustainable fishing, improved annual surveys, and more accurate harvest reporting;
4) Address and resolve illegal oyster harvesting from all bay areas;
5) Develop a balanced transition strategy for growing Maryland’s oyster industry, based primarily on aquaculture, that includes education, training and startup funding; and
6) Reverse habitat degradation and loss.37
In September 2008, the Aquaculture Coordinating Council worked with the Maryland departments of Natural Resources and Agriculture to produce the Maryland Shellfish Aquaculture Plan. The plan was submitted to the governor as a means to foster growth in Maryland’s aquaculture industry. The plan recommended streamlining the permit process for bay bottom leasing in Maryland’s waters of Chesapeake Bay, providing incentives for private investment in leasing operations, and encouraging commercial watermen to transition into aquaculture production. This plan also recommended that lease laws be changed to increase available bottom for leasing. Finally, the plan recommended development of a program and process that would encourage shellfish aquaculture. The following year, with extensive input from the Aquaculture Coordinating Council, Maryland Aquaculture Law was re-written to expand opportunities for leasing while preserving public shellfish areas for the public fishery.38 In December of 2009, DNR developed a proposed oyster restoration and aquaculture development plan, which built upon the outcomes of the PEIS and the recommendations of the Oyster Advisory Commission legislative report; and increased authority for managing shellfish aquaculture. The plan, called Maryland’s 10 Point Plan, included the following elements:
1) Focus on targeted restoration strategies to achieve ecological and economic goals;
37 Maryland Oyster Advisory Commission 2008 Report. Implementation of House Bill 133 Natural Resources – Chesapeake Bay – Oyster Restoration. Concerning Maryland’s Chesapeake Bay Oyster Management Program. Submitted to the Governor and General Assembly. January 30, 2009. http://dnr.maryland.gov/fisheries/Documents/oac_report_final.pdf
38 SB 271, Chapter 173, 2009. http://mlis.state.md.us/2009rs/billfile/sb0271.htm
11
DRAFT REPORT – JULY 2016
2) Expand the sanctuary program;
3) Support a more targeted, scientifically managed and sustainable public oyster fishery;
4) Shift commercial production to aquaculture;
5) Rehabilitate oyster bar habitat;
6) Manage against oyster disease and facilitate natural disease resistance;
7) Increase hatchery production;
8) Enhance law enforcement;
9) Increase citizen involvement; and
10) Integrate inmate labor.
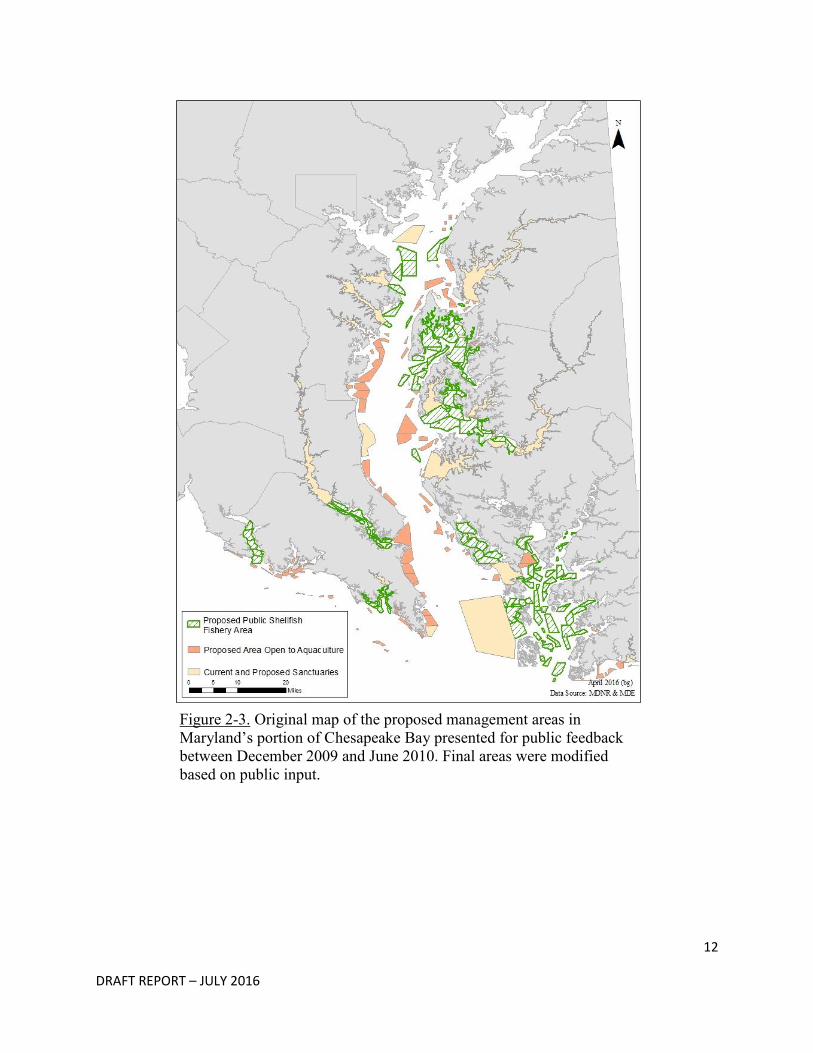
To implement this plan, the establishment of three types of management areas would be required: sanctuaries - to achieve ecological goals; PSFAs - to maintain a public fishery; and aquaculture areas - to support an aquaculture industry and thereby contribute to the goal of economic benefit (Figure 2-3).
12
DRAFT REPORT – JULY 2016
Figure 2-3. Original map of the proposed management areas in Maryland’s portion of Chesapeake Bay presented for public feedback between December 2009 and June 2010. Final areas were modified based on public input.
13
DRAFT REPORT – JULY 2016
Defining Sanctuaries
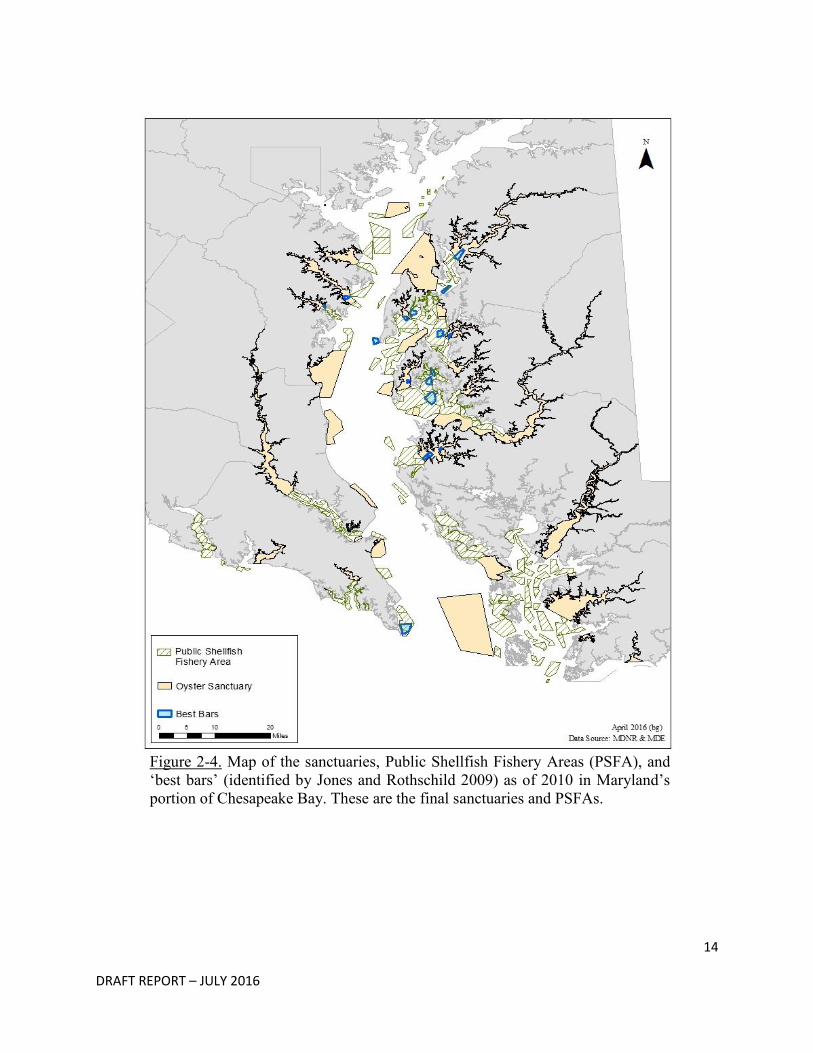
At the start of the regulatory process, the amount of productive oyster bottom in Maryland’s portion of Chesapeake Bay was estimated to be approximately 36,000 acres, based primarily on results of the Maryland Bay Bottom Survey (MBBS) conducted by DNR (1974 to 1983). To account for the fact that oyster habitat has degraded substantially over time, the area and habitat quality of each oyster bar identified in the MBBS was adjusted downward using the habitat loss determined by a 1999 – 2000 survey.39 The details of this analysis and the data employed are presented in the PEIS, Appendix A, Attachment 1.40 DNR identified specific requirements when beginning the public process of establishing sanctuary sites in Maryland waters. The first was to include 50 percent of Maryland’s best oyster bars or ‘best bars’ (Jones and Rothschild 2009) in sanctuary areas (the remaining 50 percent of these ‘best bars’ were reserved for designation as PSFAs) and the second was to set aside, in sanctuary, between 20-30 percent of the estimated 36,000 acres of remaining viable oyster bottom (Figure 2-4). A third was to create sanctuaries of sufficient size to facilitate enforcement. The ‘best bars’ were defined by Jones and Rothschild (2009) as highly productive bars that consistently ranked within the top 10 percent of harvestable oyster production – each yielding greater than 70 market-sized oysters per bushel in annual Fall Survey. 41 These bars were ranked ‘best’ out of 282 bars sampled annually (Maryland fall survey Citation). The requirement to set aside in sanctuary 20 to 30 percent of the remaining viable oyster bottom was based on emerging global consensus that the protection of 20-30 percent of marine ecosystems was a reasonable goal to ensure protection of biodiversity.42 Enhanced enforcement of oyster regulations and statutes would be assisted by the utilization of the Maryland Law Enforcement Information Network (MLEIN) which is a monitoring system that uses radar, day cameras, and infrared detectors to identify and monitor potentially illegal oyster harvest activity. The sanctuaries would be closed to commercial oyster harvest and aquaculture leasing43, but would be open to crabbing, fishing and clamming. Restrictions to clamming included a 150 foot buffer around any natural oyster bar within a sanctuary.
39 Smith, G.F., Bruce, D.G., Roach, E.B., Hansen, A., Newell, R.I.E., McManus, A.M. 2005. Assessment of Recent Habitat Conditions of Eastern Oyster Crassostrea virginica Bars in Mesohaline Chesapeake Bay. North American Journal of Fisheries Management 25:1569-1590.
40 U.S. Army Corps of Engineers, Norfolk District. 2009. Programmatic Environmental Impact Statement for Oyster Restoration in Chesapeake Bay Including the Use of a Native and/or Nonnative Oyster. http://dnr.maryland.gov/fisheries/Pages/eis.aspx 41 Jones, P.W. and Rothschild, B.J. 2009. Maryland’s Oyster Redevelopment Program – Sanctuaries and Harvest Reserves. Final Report to the Maryland Department of Natural Resources. http://dnr.maryland.gov/fisheries/Documents/Best_Bar_Report_summary.pdf
42 World Conservation Union (IUCN) 2004. The Durban Action Plan March 2004. (https://cmsdata.iucn.org/downloads/durbanactionen.pdf) 43 In 2011, Maryland House Bill 208, Chapter 579, allowed aquaculture leasing to occur within sanctuaries provided that specific criteria established by the Department were met.
14
DRAFT REPORT – JULY 2016
Figure 2-4. Map of the sanctuaries, Public Shellfish Fishery Areas (PSFA), and ‘best bars’ (identified by Jones and Rothschild 2009) as of 2010 in Maryland’s portion of Chesapeake Bay. These are the final sanctuaries and PSFAs.
15
DRAFT REPORT – JULY 2016
Defining Public Shellfish Fishery Areas
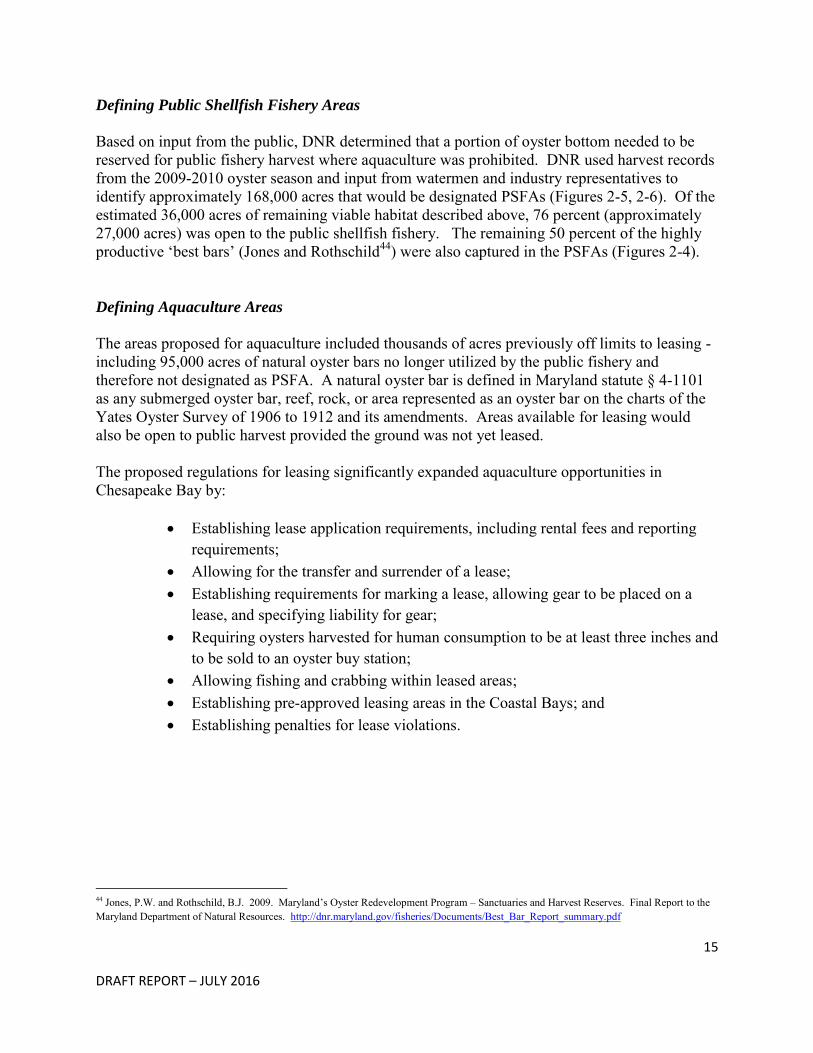
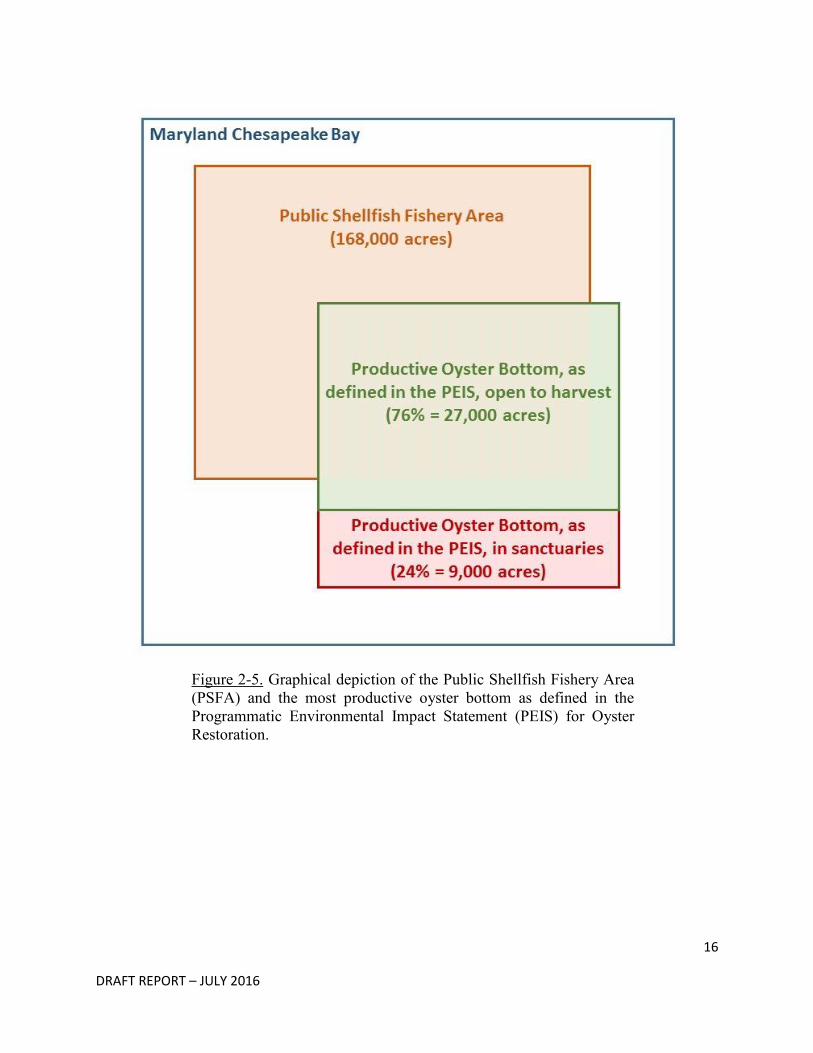
Based on input from the public, DNR determined that a portion of oyster bottom needed to be reserved for public fishery harvest where aquaculture was prohibited. DNR used harvest records from the 2009-2010 oyster season and input from watermen and industry representatives to identify approximately 168,000 acres that would be designated PSFAs (Figures 2-5, 2-6). Of the estimated 36,000 acres of remaining viable habitat described above, 76 percent (approximately 27,000 acres) was open to the public shellfish fishery. The remaining 50 percent of the highly productive ‘best bars’ (Jones and Rothschild44) were also captured in the PSFAs (Figures 2-4). Defining Aquaculture Areas
The areas proposed for aquaculture included thousands of acres previously off limits to leasing - including 95,000 acres of natural oyster bars no longer utilized by the public fishery and therefore not designated as PSFA. A natural oyster bar is defined in Maryland statute § 4-1101 as any submerged oyster bar, reef, rock, or area represented as an oyster bar on the charts of the Yates Oyster Survey of 1906 to 1912 and its amendments. Areas available for leasing would also be open to public harvest provided the ground was not yet leased. The proposed regulations for leasing significantly expanded aquaculture opportunities in Chesapeake Bay by:
Establishing lease application requirements, including rental fees and reporting requirements;
Allowing for the transfer and surrender of a lease; Establishing requirements for marking a lease, allowing gear to be placed on a
lease, and specifying liability for gear; Requiring oysters harvested for human consumption to be at least three inches and
to be sold to an oyster buy station; Allowing fishing and crabbing within leased areas; Establishing pre-approved leasing areas in the Coastal Bays; and Establishing penalties for lease violations.
44 Jones, P.W. and Rothschild, B.J. 2009. Maryland’s Oyster Redevelopment Program – Sanctuaries and Harvest Reserves. Final Report to the Maryland Department of Natural Resources. http://dnr.maryland.gov/fisheries/Documents/Best_Bar_Report_summary.pdf
16
DRAFT REPORT – JULY 2016
Figure 2-5. Graphical depiction of the Public Shellfish Fishery Area (PSFA) and the most productive oyster bottom as defined in the Programmatic Environmental Impact Statement (PEIS) for Oyster Restoration.
17
DRAFT REPORT – JULY 2016
Figure 2-6. Map of the oyster harvest in the 2009-2010 season and the Public Shellfish Fishery Areas (PSFA) established in 2010.
18
DRAFT REPORT – JULY 2016
The Public Process
Between December of 2009 and June of 2010, DNR conducted extensive public outreach to obtain comments on the proposed regulations and management areas. Venues included four 8-hour open houses located across the state where the public could learn about the proposed management areas, ask questions, and provide comment. In addition, comment input was also obtained through meetings with the Tidal Fisheries Advisory Commission, the Oyster Advisory Commission, the Sport Fisheries Advisory Commission, the Aquaculture Coordinating Council, Maryland’s Watermen’s Association, Chesapeake Bay Commercial Fisherman’s Association, Maryland Oystermen’s Association, other various representatives of the state’s fishing industries, County Oyster Committees, Sport Fishing Organizations, state Aquaculture Agencies, and members of the environmental community, fishing industry and scientists. There were additional extensive deliberations with legislators and the public during the 2010 session of the General Assembly. There were over 120 meetings (via in-person and over the phone) resulting in over 150 hours spent receiving public input on the proposed management areas. Through this public input process, the original proposed management areas were modified.45 The final management areas went into effect on September 6, 2010 (Figure 2-7).
45 See the Maryland Register Volume 37, Issue 14, Page 946 for list of modifications per county. http://msa.maryland.gov/megafile/msa/speccol/sc5300/sc5339/000113/012000/012998/unrestricted/20100875e.pdf
19
DRAFT REPORT – JULY 2016
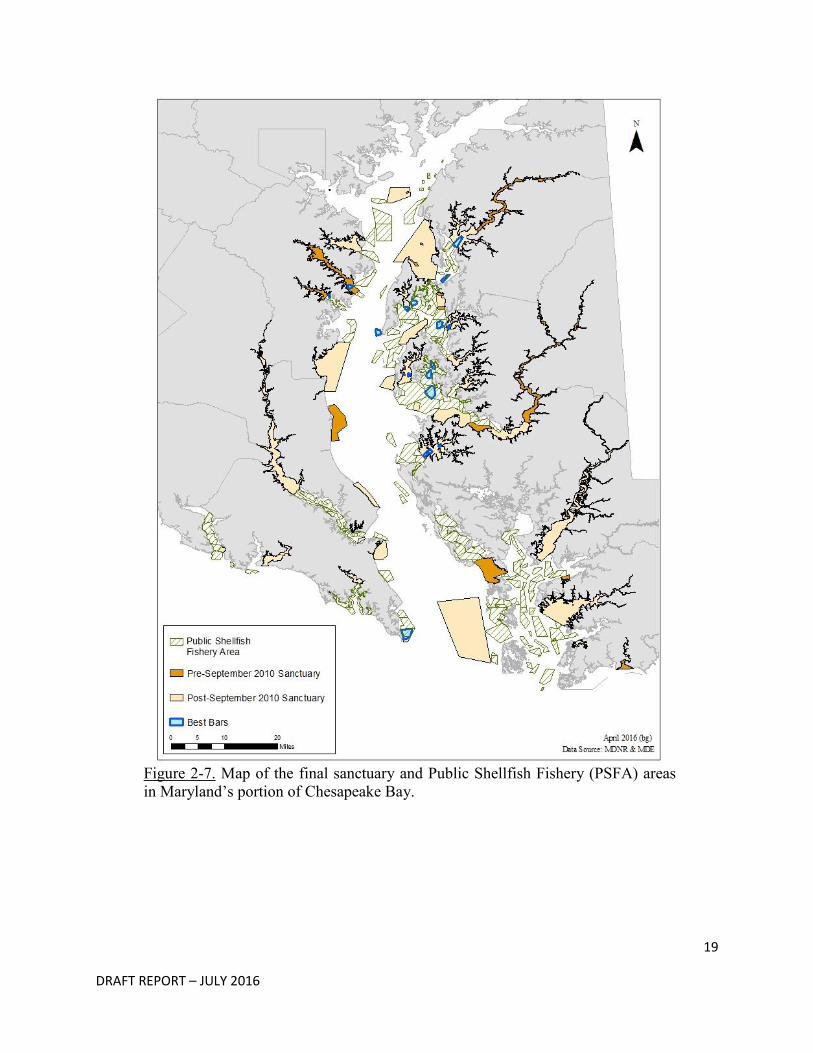
Figure 2-7. Map of the final sanctuary and Public Shellfish Fishery (PSFA) areas in Maryland’s portion of Chesapeake Bay.
20
DRAFT REPORT – JULY 2016
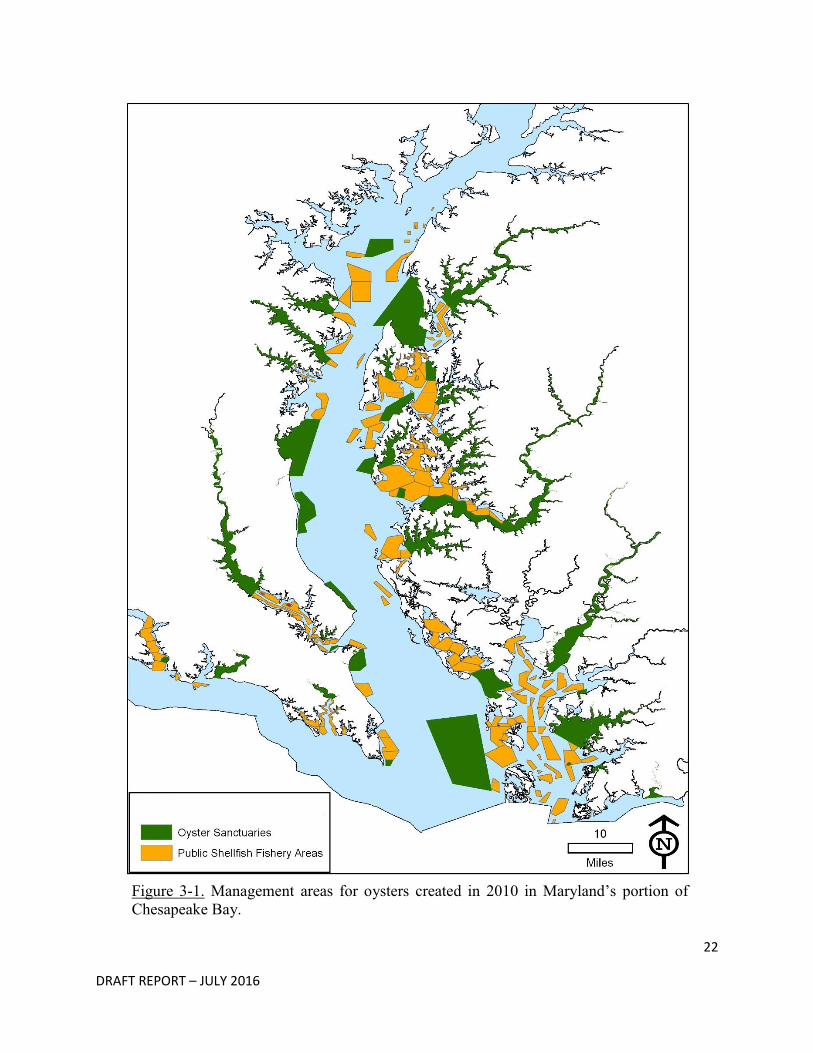
Chapter 3: Description of the Three Types of Management Areas In 2010, three types of oyster management areas were created in Maryland’s portion of Chesapeake Bay (Figure 3-1). These are:
Sanctuaries – Areas permanently closed to oyster harvest. Some sanctuaries have been targeted for extensive oyster restoration projects to potentially accelerate the recovery of oyster populations within the sanctuary, increase their environmental benefits, and contribute to enhancement of populations outside the sanctuary.
Public Shellfish Fishery Areas (PSFA) – Areas where shellfish are harvested for commercial purposes. Oyster aquaculture leases are not allowed in these areas unless a petition to declassify a specific area is approved which may occur if a biological survey indicates that the area does not have enough oysters to support commercial harvest by the public fishery.46
Aquaculture – Areas where aquaculture leases are issued by the state to individuals for private aquaculture.
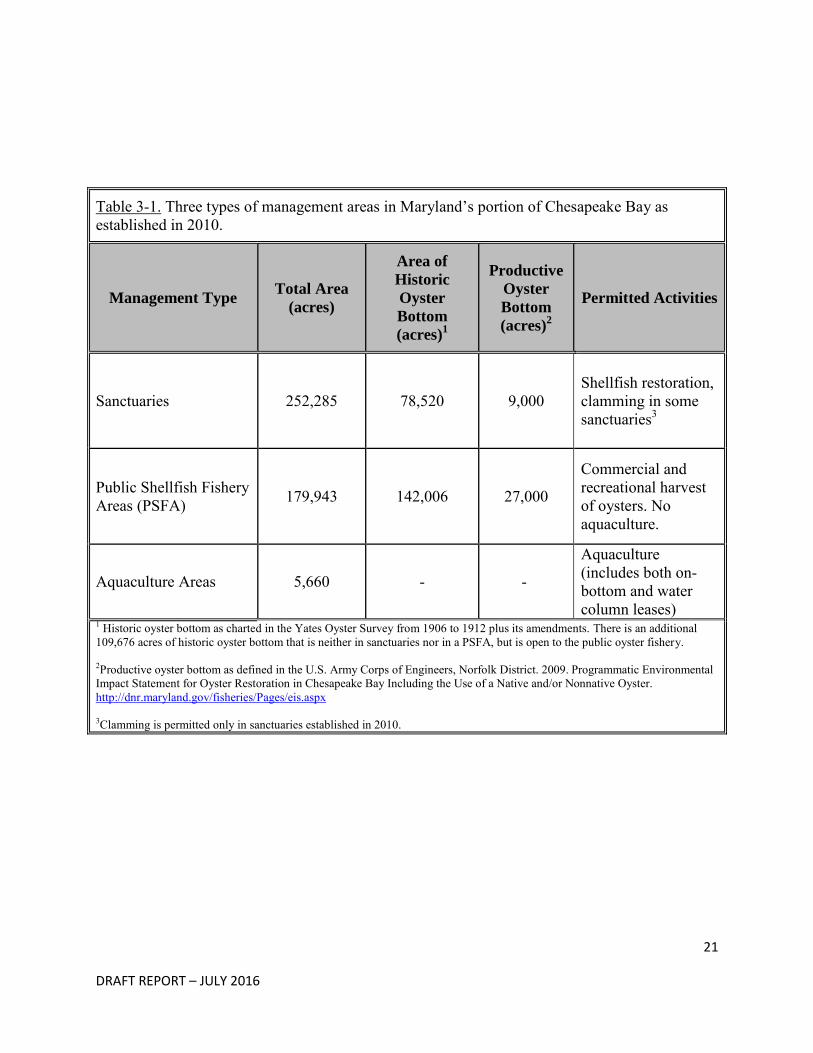
Sanctuaries encompass 253,411 acres of which 31% is historic oyster bottom (as charted in the Yates Oyster Survey from 1906 to 1912 plus its amendments) (Table 3-1). 47,48 Areas without oysters are included in the sanctuaries and connect the historic oyster bottom. The PSFA totals 179,943 acres of which 79% is historic oyster bottom. There is an additional 109,676 acres of historic oyster bottom that is neither in sanctuaries nor in a PSFA, but is open to the public oyster fishery. Historic oyster bottom is defined as the area charted in the Yates Oyster Survey from 1906 to 1912 plus its amendments49, and does not necessarily represent the productive oyster bottom in 2016. Currently there are 5,660 acres of active leased aquaculture area.
46 (COMAR 08.02.23.03) http://www.dsd.state.md.us/COMAR/ComarHome.html
47 Yates, Charles. 1913. Survey of Oyster Bars of Maryland 1906 to 1912. http://www.biodiversitylibrary.org/item/96740
48 Maryland Department of Natural Resources. 1997. Maryland’s Historic Oyster Bottom: A Geographic representation of the traditional named oyster bars. http://dnr.maryland.gov/fisheries/Documents/maryland_historic_oyster_bottom.pdf
49 Maryland Department of Natural Resources. 1997. Maryland’s Historic Oyster Bottom: A Geographic representation of the traditional named oyster bars. http://dnr.maryland.gov/fisheries/Documents/maryland_historic_oyster_bottom.pdf
21
DRAFT REPORT – JULY 2016
Table 3-1. Three types of management areas in Maryland’s portion of Chesapeake Bay as established in 2010.
Management Type Total Area
(acres)
Area of
Historic
Oyster
Bottom
(acres)1
Productive
Oyster
Bottom
(acres)2
Permitted Activities
Sanctuaries 252,285 78,520 9,000 Shellfish restoration, clamming in some sanctuaries3
Public Shellfish Fishery Areas (PSFA) 179,943 142,006 27,000
Commercial and recreational harvest of oysters. No aquaculture.
Aquaculture Areas 5,660 - -
Aquaculture (includes both on-bottom and water column leases)
1 Historic oyster bottom as charted in the Yates Oyster Survey from 1906 to 1912 plus its amendments. There is an additional 109,676 acres of historic oyster bottom that is neither in sanctuaries nor in a PSFA, but is open to the public oyster fishery. 2Productive oyster bottom as defined in the U.S. Army Corps of Engineers, Norfolk District. 2009. Programmatic Environmental Impact Statement for Oyster Restoration in Chesapeake Bay Including the Use of a Native and/or Nonnative Oyster. http://dnr.maryland.gov/fisheries/Pages/eis.aspx 3Clamming is permitted only in sanctuaries established in 2010.
22
DRAFT REPORT – JULY 2016
Figure 3-1. Management areas for oysters created in 2010 in Maryland’s portion of Chesapeake Bay.
23
DRAFT REPORT – JULY 2016
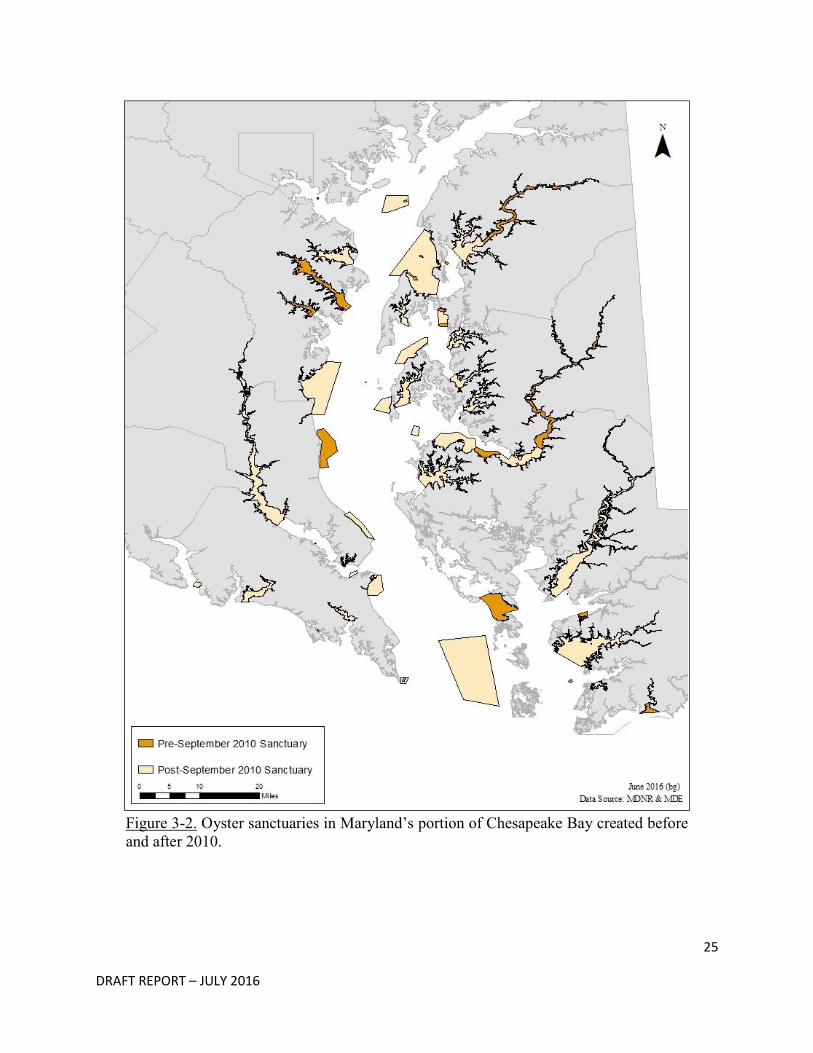
Section 3.1: Sanctuaries Maryland had established 29 sanctuaries between 1961 and 2009. The majority of these sanctuaries were small (less than 500 acres) and located in eleven tributaries and the bay’s mainstem. In 2010, 30 new sanctuaries were created. Eight of the original sanctuaries were included in the 2010 sanctuaries, resulting in a total of 51 sanctuaries (Table 3-2). The sanctuaries are distributed throughout the range of oysters in Maryland’s portion of Chesapeake Bay. The current 2010 sanctuaries are located in 16 tributaries and in the mainstem encompassing 253,441 acres (Fig 3-2). Detailed descriptions of each of the sanctuaries are presented in Appendix A. A Timeline of Pre-2010 Sanctuaries
Maryland’s first oyster sanctuary was established in 1961 in the Tred Avon River at the Cooperative Oxford Laboratory. This sanctuary was created to support the laboratory’s oyster research needs. Additional research sanctuaries were created in 1986 at the Piney Point Aquaculture Center and University of Maryland’s Horn Point oyster hatchery. A small sanctuary was established at Fort Carroll in 1995 for educational programs run by the Living Classrooms Foundation. Two larger sanctuaries, Chester Oyster Restoration Area (ORA) Zone A and Choptank ORA Zone A, were established in 1996 as recommended in 1993 by the Maryland Oyster Roundtable to evaluate methods for oyster restoration, culture, and production. Zone A sanctuaries were located in areas with the lowest suitable salinities. In 1997, the Webster Sanctuary was established from an old aquaculture lease that is located adjacent to the Monie Bay National Estuarine Research Reserve and the Deal Island facility Wildlife Management Area. The Chinks Point sanctuary was established at the mouth of the Severn River in 1998 for a restoration project, and was incorporated into the larger Severn River sanctuary in 2010. Four sanctuaries totaling 6,428 acres (Plum Point, Point Lookout, Northwest Middleground, and Somerset) were established in 1999 as part of legislation to open up more oyster bottom to power dredging. Point Lookout and Northwest Middleground sanctuaries were expanded in 2010 and Northwest Middleground was renamed Lower Mainstem Bay sanctuary at the same time. The South River and Mill Hill sanctuaries were established in 2000. The South River sanctuary was established when Maryland Department of the Environment closed of the upper part of that tributary to oyster harvesting due to water quality issues. The sanctuary was expanded in 2010. Mill Hill sanctuary was established for an U.S. Environmental Protection Agency (EPA) project examining mounded habitat and alternative materials for oysters. In 2001, the sanctuary network was expanded to include Cook Point, Howell Point, Kitts Creek, and Neal Addition sanctuaries. Cook Point accommodated another EPA project examining three-
24
DRAFT REPORT – JULY 2016
dimensional habitat. Howell Point and Neal Addition were established for similar habitat projects by the U.S. Army Corps of Engineers (USACE). Kitts Creek Sanctuary was established due to local legislators’ interest in oyster restoration with the intention of population enhancement through natural spat set. Another sanctuary, Ringgold, was also established in 2001. Ringgold is located the upper Chester River and was created to restore the oyster population and enhance the ecology of the area. In 2002, the Gales Lump sanctuary was created in exchange for potential habitat loss for dredging for shell on Man O’ War Shoal. La Trappe Creek sanctuary was created the same year in response to local interest in oyster conservation. Three sanctuaries were established in 2003. Poplar Island Sanctuary located in Poplar Island Narrows was created to restore the oyster population and enhance the ecology in that area. Strong Bay Sanctuary in the Chester River was established for a three dimensional oyster habitat research project. Trent Hall Sanctuary in the Patuxent River was created in response to the interest in oyster conservation by the state’s Secretary of Agriculture. Herring Bay Sanctuary was created in 2004 to accommodate restoration projects of a community conservation organization. Roaring Point Sanctuary located in the Nanticoke River was created the same year from an old oyster lease for oyster restoration work by the Chesapeake Bay Foundation. Two sanctuaries were established in 2005. The Prospect Bay-Cabin Creek Sanctuary located in Eastern Bay accommodated restoration work by the Chesapeake Bay Environmental Center. States Bank Sanctuary in the Choptank River was created for an USACE restoration project. In 2007, three sanctuaries were created. Two sanctuaries in the Corsica River, Possum Point and Emory Wharf, were established for oyster restoration projects by the Corsica River Conservancy. East Neck Bay Sanctuary was established in 2007. Both of these sanctuaries became included in the Lower Chester River Sanctuary in 2010. In 2009, Sandy Hill Sanctuary was established in the middle Choptank River. This sanctuary was created based on recommendations from the Oyster Advisory Commission to establish larger oyster sanctuaries across a range of salinities.
25
DRAFT REPORT – JULY 2016
Figure 3-2. Oyster sanctuaries in Maryland’s portion of Chesapeake Bay created before and after 2010.
26
DRAFT REPORT – JULY 2016
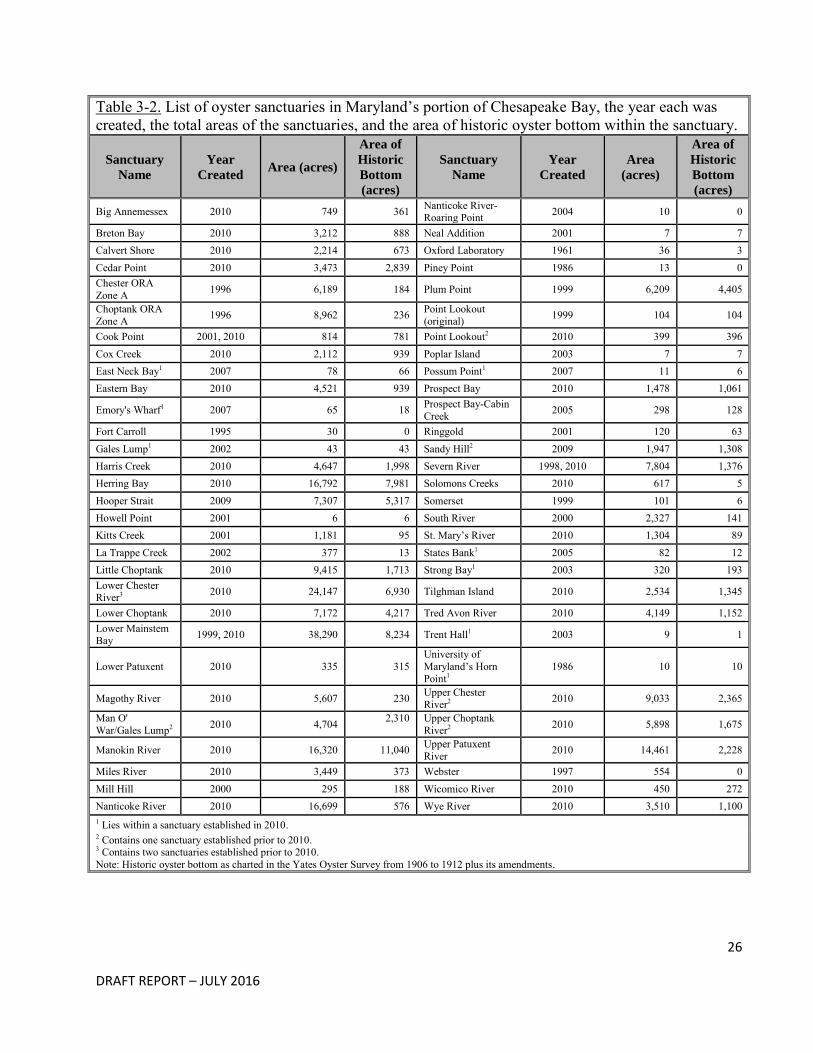
Table 3-2. List of oyster sanctuaries in Maryland’s portion of Chesapeake Bay, the year each was created, the total areas of the sanctuaries, and the area of historic oyster bottom within the sanctuary.
Sanctuary
Name
Year
Created Area (acres)
Area of
Historic
Bottom
(acres)
Sanctuary
Name
Year
Created
Area
(acres)
Area of
Historic
Bottom
(acres)
Big Annemessex 2010 749 361 Nanticoke River-Roaring Point 2004 10 0
Breton Bay 2010 3,212 888 Neal Addition 2001 7 7 Calvert Shore 2010 2,214 673 Oxford Laboratory 1961 36 3 Cedar Point 2010 3,473 2,839 Piney Point 1986 13 0 Chester ORA Zone A 1996 6,189 184 Plum Point 1999 6,209 4,405
Choptank ORA Zone A 1996 8,962 236 Point Lookout
(original) 1999 104 104
Cook Point 2001, 2010 814 781 Point Lookout2 2010 399 396 Cox Creek 2010 2,112 939 Poplar Island 2003 7 7 East Neck Bay1 2007 78 66 Possum Point1 2007 11 6 Eastern Bay 2010 4,521 939 Prospect Bay 2010 1,478 1,061
Emory's Wharf1 2007 65 18 Prospect Bay-Cabin Creek 2005 298 128
Fort Carroll 1995 30 0 Ringgold 2001 120 63 Gales Lump1 2002 43 43 Sandy Hill2 2009 1,947 1,308 Harris Creek 2010 4,647 1,998 Severn River 1998, 2010 7,804 1,376 Herring Bay 2010 16,792 7,981 Solomons Creeks 2010 617 5 Hooper Strait 2009 7,307 5,317 Somerset 1999 101 6 Howell Point 2001 6 6 South River 2000 2,327 141 Kitts Creek 2001 1,181 95 St. Mary’s River 2010 1,304 89 La Trappe Creek 2002 377 13 States Bank1 2005 82 12 Little Choptank 2010 9,415 1,713 Strong Bay1 2003 320 193 Lower Chester River3 2010 24,147 6,930 Tilghman Island 2010 2,534 1,345
Lower Choptank 2010 7,172 4,217 Tred Avon River 2010 4,149 1,152 Lower Mainstem Bay 1999, 2010 38,290 8,234 Trent Hall1 2003 9 1
Lower Patuxent 2010 335 315 University of Maryland’s Horn Point1
1986 10 10
Magothy River 2010 5,607 230 Upper Chester River2 2010 9,033 2,365
Man O' War/Gales Lump2 2010 4,704 2,310
Upper Choptank River2 2010 5,898 1,675
Manokin River 2010 16,320 11,040 Upper Patuxent River 2010 14,461 2,228
Miles River 2010 3,449 373 Webster 1997 554 0 Mill Hill 2000 295 188 Wicomico River 2010 450 272 Nanticoke River 2010 16,699 576 Wye River 2010 3,510 1,100 1 Lies within a sanctuary established in 2010. 2 Contains one sanctuary established prior to 2010. 3 Contains two sanctuaries established prior to 2010. Note: Historic oyster bottom as charted in the Yates Oyster Survey from 1906 to 1912 plus its amendments.
27
DRAFT REPORT – JULY 2016
2010 Changes to the Sanctuaries
Although the pre-2010 sanctuaries were located in all areas of Maryland’s portion of Chesapeake Bay, they were small and isolated, resulting in enforcement difficulties. Furthermore, the small sanctuaries did not provide large-scale ecosystem benefits even if most of their oyster population were restored. A Programmatic Environmental Impact Statement (PEIS) on oyster restoration in Chesapeake Bay50 and the 2008 report by the Maryland Oyster Advisory Commission (OAC)51 recommended an expanded sanctuary program to enhance the baywide oyster population. In response to these recommendations, the Maryland Department of Natural Resources (DNR) created new oyster sanctuaries in 2010 with the objectives to increase the oyster population and enhance the ecological benefits of oysters. The current 51 sanctuaries include a number of pre-2010 sanctuaries (some of which were expanded in size) and new sanctuaries created in 2010. The 2010 sanctuaries were designed to protect 24% of remaining 36,000 acres of productive oyster bottom as well as half of the most productive oyster bars (Jones and Rothschild’s ‘best bars’) as determined by a report examining data from the DNR’s Annual Fall Oyster Dredge Survey (Fall Survey) from 1996-2007.52 The new sanctuaries are located throughout the bay in order to ensure that protected areas are located in different salinity regimes as suggested by the Chesapeake Bay Oyster Management Plan53 and have different goals depending on salinity. All oyster bars in Maryland are located in mesohaline salinities (5-18 ppt). Within this salinity range, Maryland oyster bars are further classified into three zones: Zone 1 has an average salinity between 5 and 11 ppt; Zone 2 has an average salinity between 12 and 14 ppt; and Zone 3 has salinities greater than 14 ppt (Figure 3-3). Sanctuaries within Zone 1 (35 sanctuaries and 172,408 acres) were chosen to increase oyster biomass through stocking and long-term survival. Oysters within Zone 1 are characterized by having lower levels of disease and better survival but low reproductive capability.54 However, oysters in this zone are also subject to intermittent freshets that can result in substantial mortality. Sanctuaries within Zone 2 (10 sanctuaries and 54,229 acres) represent transition areas and may reflex incorporating fluctuating environmental characteristics based on the climatic variation between wet and dry years.55 Spat settlement can range from low to moderate to high on an annual 50 U.S. Army Corps of Engineers, Norfolk District. 2009. Programmatic Environmental Impact Statement for Oyster Restoration in Chesapeake Bay Including the Use of a Native and/or Nonnative Oyster. http://dnr.maryland.gov/fisheries/Pages/eis.aspx
51 Maryland Oyster Advisory Commission 2008 Report. Implementation of House Bill 133 Natural Resources – Chesapeake Bay – Oyster Restoration. Concerning Maryland’s Chesapeake Bay Oyster Management Program. Submitted to the Governor and General Assembly January 30, 2009. http://dnr.maryland.gov/fisheries/Documents/oac_report_final.pdf
52 Jones, P.W. and Rothschild, B.J. 2009. Maryland’s Oyster Redevelopment Program – Sanctuaries and Harvest Reserves. Final Report to the Maryland Department of Natural Resources. http://dnr.maryland.gov/fisheries/Documents/Best_Bar_Report_summary.pdf
53 http://www.chesapeakebay.net/content/publications/cbp_12889.pdf
54 http://www.chesapeakebay.net/content/publications/cbp_12889.pdf
55 http://www.chesapeakebay.net/content/publications/cbp_12889.pdf
28
DRAFT REPORT – JULY 2016
basis based on salinity. Disease related mortality can also fluctuate from year to year. In years with low disease mortality, the oyster populations can recover if there is reproduction. Sanctuaries within Zone 3 (6 sanctuaries and 25,648 acres) were chosen to support disease resistance and enhance reproduction. Heavy disease pressure in these high salinity waters result in mortality.56 Those oysters that survive past four years are thought to have some disease tolerance or resistance since they did not die from disease.57,58,59 In Zone 3, there is high reproduction that provides a fairly constant influx of new oysters.
56 http://www.chesapeakebay.net/content/publications/cbp_12889.pdf
57 Carnegie, R.B., Burreson, E.M. 2011. Declining impact of an introduced pathogen: Haplosporidium nelsoni in the oyster Crassostrea virginica in Chesapeake Bay. Marine Ecology Progress Series 432: 1-15.
58 Carnegie, R.B., Burreson, E.M. 2009. Status of the major oyster diseases in Virginia 2006-2008: A summary of the annual oyster disease monitoring program. Virginia Institute of Marine Science, Gloucester Point, VA http://www.vims.edu/research/departments/eaah/programs/molluscan_health/_documents/monitoring_rpt_2009.pdf
59 Ford, S.E., Bushek, D. 2012. Development of resistance to an introduced marine pathogen by a native host. Journal of Marine Research 70: 205-223.
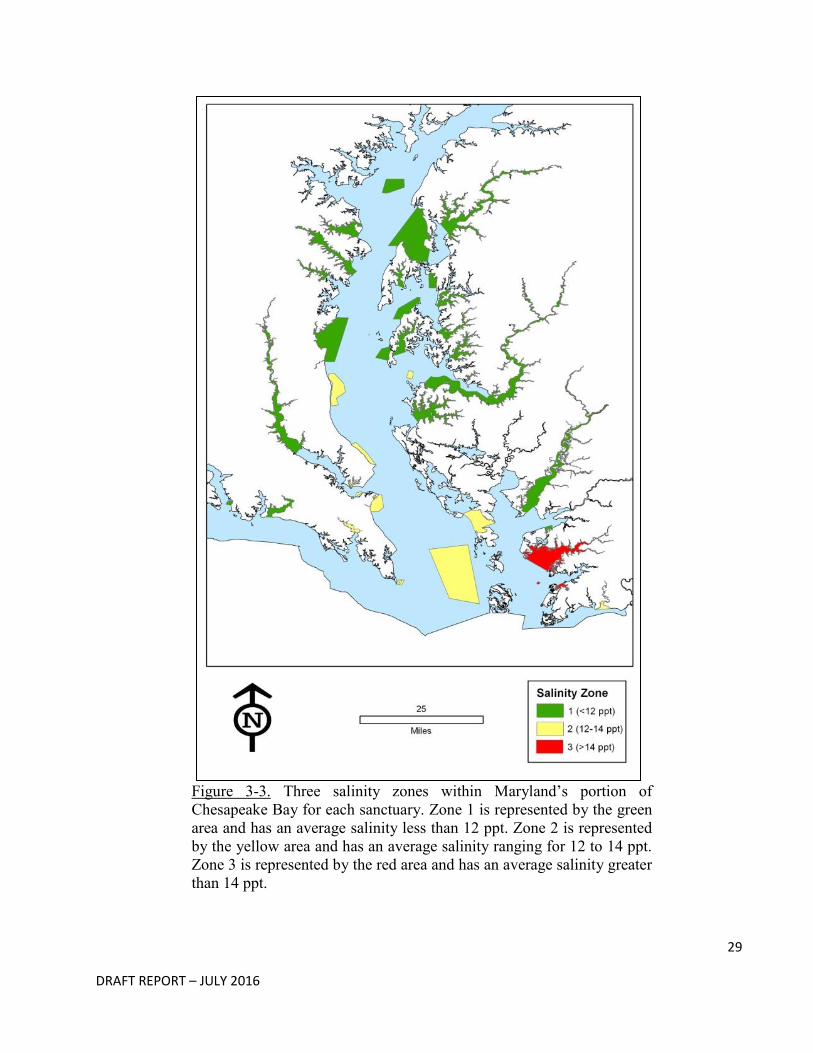
29
DRAFT REPORT – JULY 2016
Figure 3-3. Three salinity zones within Maryland’s portion of Chesapeake Bay for each sanctuary. Zone 1 is represented by the green area and has an average salinity less than 12 ppt. Zone 2 is represented by the yellow area and has an average salinity ranging for 12 to 14 ppt. Zone 3 is represented by the red area and has an average salinity greater than 14 ppt.
30
DRAFT REPORT – JULY 2016
Post-2010 Large-Scale Restoration of Sanctuaries
In 2014, Maryland and Virginia governors signed the Chesapeake Bay Watershed Agreement. The objective of the Chesapeake Bay Watershed Agreement is to restore and protect oyster reefs in ten tributaries by 2025 - five tributaries in Maryland and five in Virginia. To date, three tributaries in Maryland (Harris Creek, Little Choptank River, and Tred Avon River) have been targeted for active restoration and substantial investment has been made to achieve restoration goals.60 These three tributaries are located in what is known as the “Choptank Complex”, and all were included in the expanded sanctuary network created by the 2010 regulatory action. They were chosen as targeted restoration areas based on salinity levels, available restorable bottom, historical spat set, feasibility of protection from harvest, and other factors.61, 62 Work to restore 350 acres in Harris Creek was completed in September 2015 while work is still ongoing in the Little Choptank and Tred Avon.. Appendix A of this report provides more detail on the restoration activities in Harris Creek, Little Choptank, and Tred Avon River Sanctuaries. Multiple organizations have been collaboratively working with DNR on restoration in these three tributaries, including federal agencies, academic institutions, non-profit organizations, and private sector participants (Figure 3-4). Additionally, the National Fish and Wildlife Foundation coordinated with CSX Corporation to transport restoration materials at substantially reduced cost.
60 Oyster Metrics Workgroup. 2011. Restoration Goals, Quantitative Metrics and Assessment Protocols for Evaluating Success on Restored Oyster Reef Sanctuaries. http://chesapeakebay.noaa.gov/images/stories/fisheries/keyFishSpecies/oystermetricsreportfinal.pdf
61 Maryland Interagency Oyster Restoration Workgroup of the Sustainable Fisheries Goal Implementation Team. 2013. Harris Creek Oyster Restoration Tributary Plan. http://chesapeakebay.noaa.gov/images/stories/habitats/harriscreekblueprint1.13.pdf
62 Maryland Interagency Oyster Restoration Workgroup of the Sustainable Fisheries Goal Implementation Team. 2015. Little Choptank River Oyster Restoration Tributary Plan. http://chesapeakebay.noaa.gov/images/stories/pdf/oystertribplanlittlechoptank.pdf
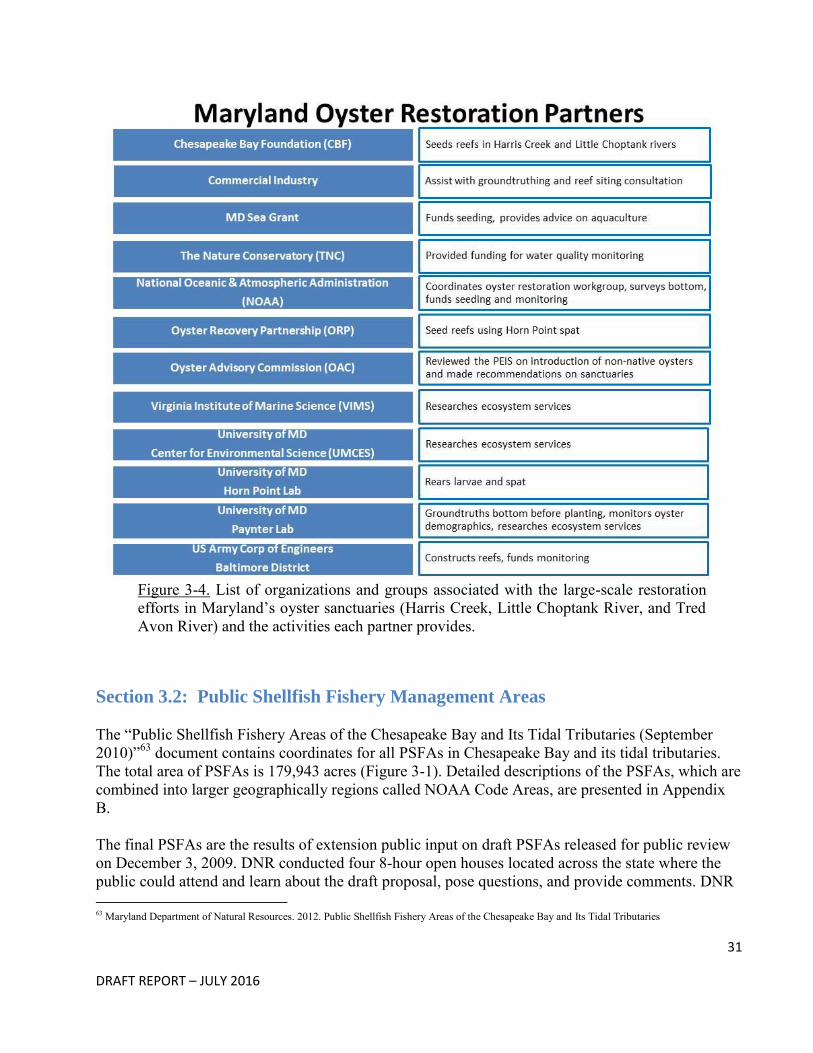
31
DRAFT REPORT – JULY 2016
Figure 3-4. List of organizations and groups associated with the large-scale restoration efforts in Maryland’s oyster sanctuaries (Harris Creek, Little Choptank River, and Tred Avon River) and the activities each partner provides.
Section 3.2: Public Shellfish Fishery Management Areas The “Public Shellfish Fishery Areas of the Chesapeake Bay and Its Tidal Tributaries (September 2010)”63 document contains coordinates for all PSFAs in Chesapeake Bay and its tidal tributaries. The total area of PSFAs is 179,943 acres (Figure 3-1). Detailed descriptions of the PSFAs, which are combined into larger geographically regions called NOAA Code Areas, are presented in Appendix B. The final PSFAs are the results of extension public input on draft PSFAs released for public review on December 3, 2009. DNR conducted four 8-hour open houses located across the state where the public could attend and learn about the draft proposal, pose questions, and provide comments. DNR 63 Maryland Department of Natural Resources. 2012. Public Shellfish Fishery Areas of the Chesapeake Bay and Its Tidal Tributaries
32
DRAFT REPORT – JULY 2016
also obtained public input through meetings of its Oyster Advisory Commission, Sport and Tidal Fisheries Advisory commissions, Aquaculture Coordinating Council, and over one hundred meetings with representatives of the state's fishing industry organizations (Maryland Watermen's Association, Chesapeake Bay Commercial Fishermen's Association, and Maryland Oystermen's Association), county oyster committees, sport fishing organizations, state aquaculture agencies, scientific community and environmental advocacy organizations, as well as individual citizens. In addition, there were also extensive public deliberations on this issue with legislators and the public during the 2010 Session of the General Assembly. The 2010 regulations included a process by which a person could petition DNR to partially or completely declassify a PSFA so that the area could include aquaculture. A petition for declassification may be approved if a biological survey indicated that the area does not have enough oysters to support commercial harvest by the public fishery. DNR takes into consideration oyster harvest reports and other information, including public comment, to make decisions about declassification. Since September 9, 2010, DNR’s Aquaculture Division has received nine applications for leases that fell wholly or partially within a PSFA. Five of these applications have either been withdrawn by the applicant or terminated by DNR. In order to process the remaining four applications, DNR’s Fisheries Service has conducted oyster density surveys within the proposed lease areas (one application required two surveys due to a site revision). All surveyed areas met the PSFA declassification criteria for oyster density (one met after a reduction of the proposed lease area). Two of these four lease application have been issued. The remaining two leases that have been surveyed were determined to be unleaseable due to a conflict with submerged aquatic vegetation. One lease application is currently being revised to address the submerged aquatic vegetation conflict. The other lease application is continuing through DNR’s review process currently. To date, 24 acres of PSFAs have been declassified to allow leasing for shellfish aquaculture (19.4 and 4.6 acres for the two leases issued, respectively). This is 0.014% of the total PSFA acreage.
Section 3.3: Aquaculture Areas There has been aquaculture in Maryland since the 19th century. In 1830, the Maryland General Assembly first provided a method through which individuals could acquire certain exclusive property rights in submerged tidelands.64 Maryland citizens were given authority to appropriate and exclusively use an area for the purpose of "depositing, bedding or sowing any oysters, or other shellfish”. Originally, the leased area was to be no more than one acre (One Acre Law of 1820), but then was increased to five acres (Five Acre Law of 1865). The Maryland General Assembly added a condition to the existing aquaculture laws in 1867 stating that no natural bar or bed of oysters shall be appropriated. This in turn started the discussion of making the distinction between "barren" beds (upon which individuals could acquire oyster leases) and "natural" beds (areas available only to the public commercial fishery and not aquaculture). 64 Power, Garrett. 1970. More About Oysters Than You Wanted to Know, 30 Md. L. Rev. 199. Volume 30. Issue 3. Article 3. http://digitalcommons.law.umaryland.edu/cgi/viewcontent.cgi?article=2147&context=mlr
33
DRAFT REPORT – JULY 2016
In response to the confusion between barren and natural oyster beds locations, the Haman Law was passed in 1906, which required a survey of the bay bottom to determine the location of oyster bars and barren bottom. This survey, Yates Oyster Survey of 1906 to 1912, originally classified 216,000 acres of natural oyster bars, 44,000 acres for crabbing and clamming, and the rest of the bay as barren. The Haman Law also created the Board of Shellfish Commissioners and directed it to lease barren bottom to Maryland residents for the purpose of oyster culture as well as stating that leases could be rented for twenty years. This law was met with some opposition from the public however, and in 1914 the Maryland General Assembly amended the Haman Act. The amendments in 1914 to the Haman Act reclassified 54,000 barren acres as natural oyster bottom based on public opinion, thus, excluding them from aquaculture. Also, in the 1914 amendments, a lease application could be challenged in court. During the 1960’s new laws emerged prohibiting leases in all counties of the eastern shore of Maryland with the exception of Worcester.65 The western shore also passed some laws enacting prohibitions against aquaculture. In the 1970’s and early 1980’s, there was a moratorium on new leases until after the completion of the 1974 to 1983 Maryland Bay Bottom Survey.66 As the new survey resulted in reclassification of the bay bottom into various bottom types, new techniques in aquaculture were being developed. However, major oyster disease events in the 1980’s have caused high mortality of oysters within both the public fishery and aquaculture which reduced interest in aquaculture. In 2005, the Maryland General Assembly passed legislation establishing the Aquaculture Coordinating Council.67 The purpose of the council is to guide statewide aquaculture policy and formulate and make proposals that support Maryland aquaculture. The council’s early accomplishments included developing aquaculture best management practices and evaluating potential Aquaculture Enterprise Zone (AEZ) sites. In 2008, the council worked with the Maryland departments of Agriculture and Natural Resources to produce the Maryland Shellfish Aquaculture Plan.68 In this plan, nine recommendations were proposed:
1) Restructure current leasing laws to provide for increased access to bottom statewide by repealing Natural Resources Article 4-11A and developing a leasing program that encourages shellfish aquaculture.
65 Webster, Donald. Maryland Oyster Culture: A Brief History. University of Maryland https://extension.umd.edu/sites/default/files/_docs/programs/aquaculture/1_Historical%20Background3.pdf
66 Webster, Donald. Maryland Oyster Culture: A Brief History. University of Maryland https://extension.umd.edu/sites/default/files/_docs/programs/aquaculture/1_Historical%20Background3.pdf
67 Webster, Donald. Maryland Oyster Culture: A Brief History. University of Maryland https://extension.umd.edu/sites/default/files/_docs/programs/aquaculture/1_Historical%20Background3.pdf
68 Maryland Department of Agriculture. 2008. Maryland Shellfish Aquaculture Plan: Enhancing the Environment Through Private Sector Investment
34
DRAFT REPORT – JULY 2016
2) Grant departments the authority to promulgate regulations for compliance with the National Shellfish Sanitation Program (NSSP) and permit conditions established through the departments.
3) Streamline the process for obtaining permits necessary to engage in shellfish production.
4) Establish Aquaculture Enterprise Zones providing designated areas that are pre-permitted for shellfish aquaculture where applicants can obtain bottom and off-bottom sites for production and avoid user group conflicts while minimizing delays.
5) Request the U.S. Army Corps of Engineers, Baltimore District, to develop a General
Permit for shellfish aquaculture that allows structures to be used on bottom and in the water column.
6) Provide funding to the Natural Resources Police in order to increase resources needed
for patrol and enforcement activities that will be required by the growing industry.
7) Provide funding to the University of Maryland to develop educational programs for
the transfer of technology leading to the development of private hatcheries, remote setting sites, and nurseries that produce native, triploid, and/or disease resistant oyster seed.
8) Develop training and cost-share programs to help transition watermen into the
industry and provide incentive to those willing to invest in production.
9) Provide legislative authority for the Potomac River Fisheries Commission to develop
a bottom leasing program for the river.
The Shellfish Aquaculture Plan led to a major restructuring of Maryland’s lease law during the 2009 legislative session and the new lease law was passed unanimously by the House of Delegates and Senate. The new law removed many of the impediments to shellfish aquaculture development and lifted county moratoriums on leasing, removed lease size limitations, provided that leases could be issued to corporations, and established a requirement for leases to be actively used for commercial shellfish aquaculture purposes. The law’s active use provision requires leaseholders to use their leases or return them to the state so this acreage could then be made available for leasing to new shellfish aquaculture businesses. In response to this requirement, many inactive leases reverted back to the state.
35
DRAFT REPORT – JULY 2016
In September 2010, DNR began accepting shellfish aquaculture lease applications under a new leasing program. In addition, Aquaculture Enterprise Zone (AEZ) areas were developed in the Patuxent River with the intent to eliminate regulatory hurdles and streamline the timeframe for lease approvals. However, the 2011 lease law provided the same benefits to potential lease holders so Aquaculture Enterprise Zones (AEZ) are not being utilized. In July 2011, the General Assembly passed legislation consolidating the state’s authority for shellfish aquaculture permitting at DNR and streamlining the aquaculture permitting process. As a result, DNR established the Fisheries Service Aquaculture Division to process lease applications, screen proposed projects for impacts to existing resources and other uses of state waters, and to manage this growing industry. Lease application processing includes legal and resource reviews to evaluate potential impacts to submerged aquatic vegetation, fishery resources and commercial fishing activities, waterfowl concentration areas, navigation and adjacent properties. The review also includes an opportunity for public input on project proposals as projects are placed on public notice once a week for two consecutive weeks followed by a thirty-day comment period. In addition, DNR advertises proposed projects on its website and sends direct notification to adjacent property owners and the Chair of the County Oyster Committee69 where the project is located. During the public process, any person who has a specific right, duty, privilege or interest that is different from that held by the general public, and may be adversely affected by the proposed lease, may file a petition with DNR protesting the issuance of the lease. Number of Aquaculture Leases
Inconsistent record keeping prevents any discussion on trend assessment prior to 2009. The number of leases prior to 1974 is unknown. Since 1974, the number of leases and acres of leased land in Maryland appears to be declining (Table 3-3). For example, the number of leases was 1,158 in 1974 to 778 in 2009. In 2010, the number of leases was 401 equaling 3,531 acres. This was due to the implementation and enforcement of a strict active use provision in the lease law requiring leaseholders to actively use their leases or return them to the state. It is estimated that prior to 2009, very few shellfish leases were actively being worked. Many of these pre-2010 leases reverted back to the state and this acreage can now be leased to other prospective oyster growers. As of the end of 2015, there are 370 leases on 5,660 acres. Table 3-3. The number of aquaculture leases and leased acreage in Maryland through 2010.
69 A committee of licensed waterman using all gear types to harvest oysters is elected by all watermen to create County Oyster Committees for each tidewater county. These committees advise DNR on oyster-related issues such as seed and shell planting locations and amounts.
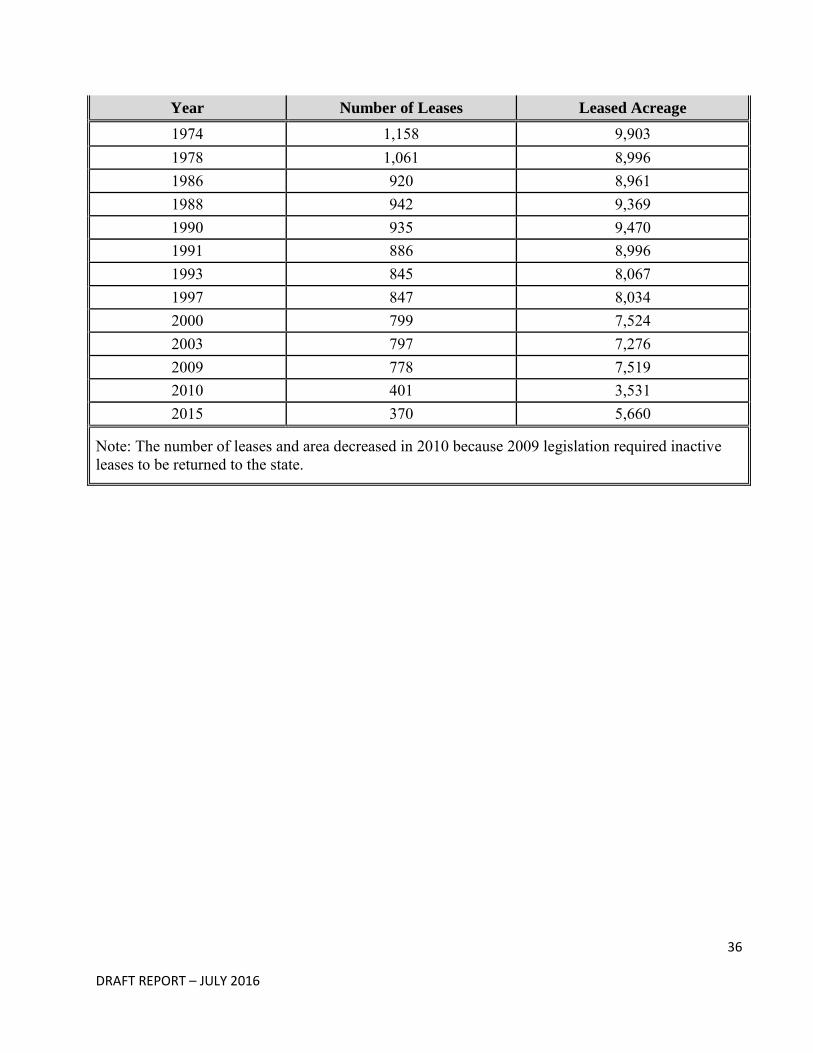
36
DRAFT REPORT – JULY 2016
Year Number of Leases Leased Acreage
1974 1,158 9,903 1978 1,061 8,996 1986 920 8,961 1988 942 9,369 1990 935 9,470 1991 886 8,996 1993 845 8,067 1997 847 8,034 2000 799 7,524 2003 797 7,276 2009 778 7,519 2010 401 3,531 2015 370 5,660
Note: The number of leases and area decreased in 2010 because 2009 legislation required inactive leases to be returned to the state.
37
DRAFT REPORT – JULY 2016
Chapter 4: Effectiveness of Management Areas and Importance of
Location In this chapter, we examine a synthesis of data presented in Appendix A (sanctuaries) and B (Public Shellfish Fishery Areas) to make determinations about the status of the management objectives of the 2010 proposal - to restore the ecological function of oysters and to enhance the commercial fishery for its economic and cultural benefits. The management plan adopted in 2010 sought to resolve the dual goals of ecological and economic restoration by creating distinct management areas each with its own objectives – Sanctuaries, Public Shellfish Fishery Area (PSFA), and Aquaculture. For sanctuaries, objectives as stated in regulation:
1) Protect half of the Bay’s most productive oyster grounds that remain [in Maryland (Jones and Rothschild 2009)70] and allow investigation of the reasons why these remain most productive;
2) Facilitate development of natural disease resistance;
3) Provide essential natural ecological functions that cannot be obtained on a harvest bar;
4) Serve as a reservoir of reproductive capacity;
5) Provide a broad geographic distribution across all salinity zones; and
6) Increase our [Maryland Department of Natural Resources (DNR)] ability to protect these important areas from poaching.71
For Public Shellfish Fishery Areas (PSFAs), objectives include:
1) Retain 168,000 acres of natural oyster bars including 76% (27,000 acres) of the remaining 36,000 acres of remaining productive oyster habitat identified in the Programmatic Environmental Impact Statement (PEIS);
2) Protect half of the ‘best bars’ identified by Jones and Rothschild (2009) as “consistently most productive” for the benefit of licensed oystermen; 72 and
70
Jones, P.W. and Rothschild, B.J. 2009. Maryland’s Oyster Redevelopment Program – Sanctuaries and Harvest Reserves. Final Report to the Maryland Department of Natural Resources. http://dnr.maryland.gov/fisheries/Documents/Best_Bar_Report_summary.pdf
71 Maryland Register, Vol 37, Issue 14, Friday July 2, 2010 http://dnr.maryland.gov/fisheries/Documents/Oyster%20Packages%20September%202010.pdf
38
DRAFT REPORT – JULY 2016
3) Implement a more targeted and scientifically managed wild oyster fishery [hereafter referred
to as public fishery].73
For aquaculture, objectives include:
1) Streamline the regulatory process for aquaculture;
2) Open new areas to leasing to promote shellfish aquaculture industry growth; and
3) Provide alternative economic opportunities for watermen.74
Location is a critical factor when considering oyster management areas, due to the wide range of environmental and habitat conditions found on regional and smaller scales down to differences within individual bars. Each management area has its own unique history and future potential based on the attributes of its location. The prevailing salinity of a location is a primary environmental determinant of oyster population dynamics, given its influence on reproduction, growth, and mortality. Oyster habitat is another key element, providing necessary substrate to which the young oysters can attach. In Maryland, habitat can be extremely patchy, changing greatly within a small distance even on an individual bar. The management areas may have productive oyster bars that are interspersed with patches of sand, mud or other substrate that is unsuitable for oysters. Degradation of oyster habitat is a problem throughout Maryland’s portion of Chesapeake Bay, with some remnant bars having little if any remaining substrate on which young oysters can settle. By some estimates shell substrate has diminished by 90% since the Yates Oyster Survey of 1906 to 1912.75 Other factors can be important in accounting for differences in oyster populations among locations but are less well understood or documented for specific management areas, and so are not included in this evaluation. For example, water currents can carry oyster larvae away from a spawning area (“source area”) or can concentrate them in a distant area (“sink area”). Land use may impact management areas in a variety of ways ranging from sedimentation and nutrient enrichment to pesticide use and presence of endocrine disruptors. Likely there are other localized factors affecting oyster populations that are presently unknown.
72 Jones, P.W. and Rothschild, B.J. 2009. Maryland’s Oyster Redevelopment Program – Sanctuaries and Harvest Reserves. Final Report to the Maryland Department of Natural Resources. http://dnr.maryland.gov/fisheries/Documents/Best_Bar_Report_summary.pdf
73 Maryland DNR Oyster Open House 2009, slides 13 and 57. http://dnr.maryland.gov/fisheries/Pages/oysters/5-Year-Oyster-Review-Report.aspx
74 Maryland Register, Vol 37, Issue 14, Friday July 2, 2010 http://dnr.maryland.gov/fisheries/Documents/Oyster%20Packages%20September%202010.pdf
75 Yates, Charles. 1913. Survey of Oyster Bars of Maryland 1906 to 1912. http://www.biodiversitylibrary.org/item/96740
39
DRAFT REPORT – JULY 2016
Section 4.1: Assessment of Each Objective by Management Area We use two primary data sets to assess the effectiveness of individual sanctuaries and PSFAs against the cited objectives - the DNR’s Annual Fall Oyster Dredge Survey and the Patent Tong Oyster Population Survey (hereafter referred to as the Fall Survey and the Patent Tong Survey). Harvest data were also used to evaluate PSFAs. The Fall Survey provides baseline data back to at least 1990, when disease monitoring sites and sampling protocols were standardized. Because the Fall Survey was designed and implemented years before the 2010 management areas were identified, the number of areas sampled is not evenly distributed among sanctuaries and PSFAs - more sampling sites fall within PSFAs. However, the Fall Survey has recorded information over periods of changing weather and climate that have significantly impacted oyster populations. Oyster numbers declined dramatically in the early 2000’s as the result of an extended period of drought and high temperatures that increased disease mortality but favorable environmental conditions in the last decade have decreased disease mortality and oyster numbers are beginning to increase in many areas. The 2015 oyster biomass index is the highest in the 26-year time series.76 A benefit of the 2010 management program is that it has allowed us to observe oyster populations in distinct areas, some of which continue to be harvested and others which have no harvest. Three sanctuaries within the “Choptank River Complex” have received substantial investment in the form of reef substrate and planted oyster spat: Harris Creek, Tred Avon River, and Little Choptank River. Oyster bars located in these sanctuaries have been sampled annually during the Fall Survey and by patent tong surveys conducted by DNR in the latter two sanctuaries. Both Harris Creek and Little Choptank sanctuaries have also been monitored by federal and academic partners so that in the future it can be determined if the restoration criteria has been met.77 Data generated from this more intensive monitoring by federal and academic partners are not analyzed here. When data are available and where appropriate, these results are referenced and provided in Appendices A and B. For this analysis PSFAs are grouped into harvest reporting area called NOAA Code areas because Fall Survey data provide excellent resolution for the 39 NOAA Codes, but not for the 176 individual PSFAs. Also, harvest information has historically been collected by NOAA Code, not by PSFA. Biological data used to characterize the NOAA Code areas, and therefore the PSFAs within those areas, are derived only from sites sampled within the PSFAs and not from sites within sanctuaries. In other words, if a NOAA Code encompasses both sanctuaries and PSFAs, the productivity of the NOAA Code is characterized only by the PSFAs.
76 Tarnowski, M. (ed.) 2016. Maryland Oyster Population Status Report: 2015 Fall Survey. Maryland Department of Natural Resources, Annapolis, MD, # 17-5232016-823. 55 pp. http://dnr.maryland.gov/fisheries/Pages/shellfish-monitoring/reports.aspx
77 Oyster Metrics Workgroup. 2011. Restoration goals, quantitative metrics and assessment protocols for evaluating success on restored oyster reef sanctuaries. Report to the Sustainable Fisheries Goal Implementation Team of the Chesapeake Bay Program. 32pp.. http://chesapeakebay.noaa.gov/images/stories/fisheries/keyFishSpecies/oystermetricsreportfinal.pdf
40
DRAFT REPORT – JULY 2016
Section 4.2: Sanctuaries
There are 51 sanctuaries with a range of available data. Twenty-eight of the current sanctuaries have been regularly monitored by the Fall Survey since at least 1990 so that trends in oyster populations can be examined before and after sanctuary creation. Some sanctuaries have had patent tong surveys conducted since 2010, which provide additional information about oyster density, size structure and habitat condition. Although a time series of data is presented for each sanctuary in Appendix A, drawing firm conclusions about the consequences of sanctuary establishment is difficult in the absence of control areas or reference sites, and also given the relatively short time period of five years since establishment. When examining differences between sanctuary and harvest areas, true control sites would be harvest bars which are identical to the sanctuary bars in every way except for the experimental change (prohibition of harvest). Since it is not possible to match any individual sanctuary to an identical PSFA, it is highly difficult to screen out effects of salinity, hydrodynamics (water flow), bathymetric (water depth) characteristics, and water quality that would confound comparisons. In complex, time-variant systems where no two study areas are alike, long time-series of data become a critical tool for separating signals from noise within the system and show the impacts of management changes such as harvest prohibition and/or restoration.78 Some sanctuaries were created before 2010 for restoration and research projects to be done by the U.S. Army Corps of Engineers (USACE) (Table 4-1). Also, there are a number of sanctuaries that have some portion of their area designated by the Maryland Department of Environment as conditional or restricted waters due to the presence of bacteria which render shellfish unsuitable for human consumption, including St. Mary’s River, South River, Solomons Creeks, La Trappe Creek, the Chester Oyster Reserve Area (ORA), the Choptank ORA, and the Severn River. Data for each sanctuary are summarized in Table 4-1, which also places sanctuaries into tier groups. The methods used to determine tiers are described in Chapter 5.
78 D.M Karl. 2010. Oceanic Ecosystems Time-Series Programs, Ten Lessons Learned. Oceanography Vol. 23, No. 3.
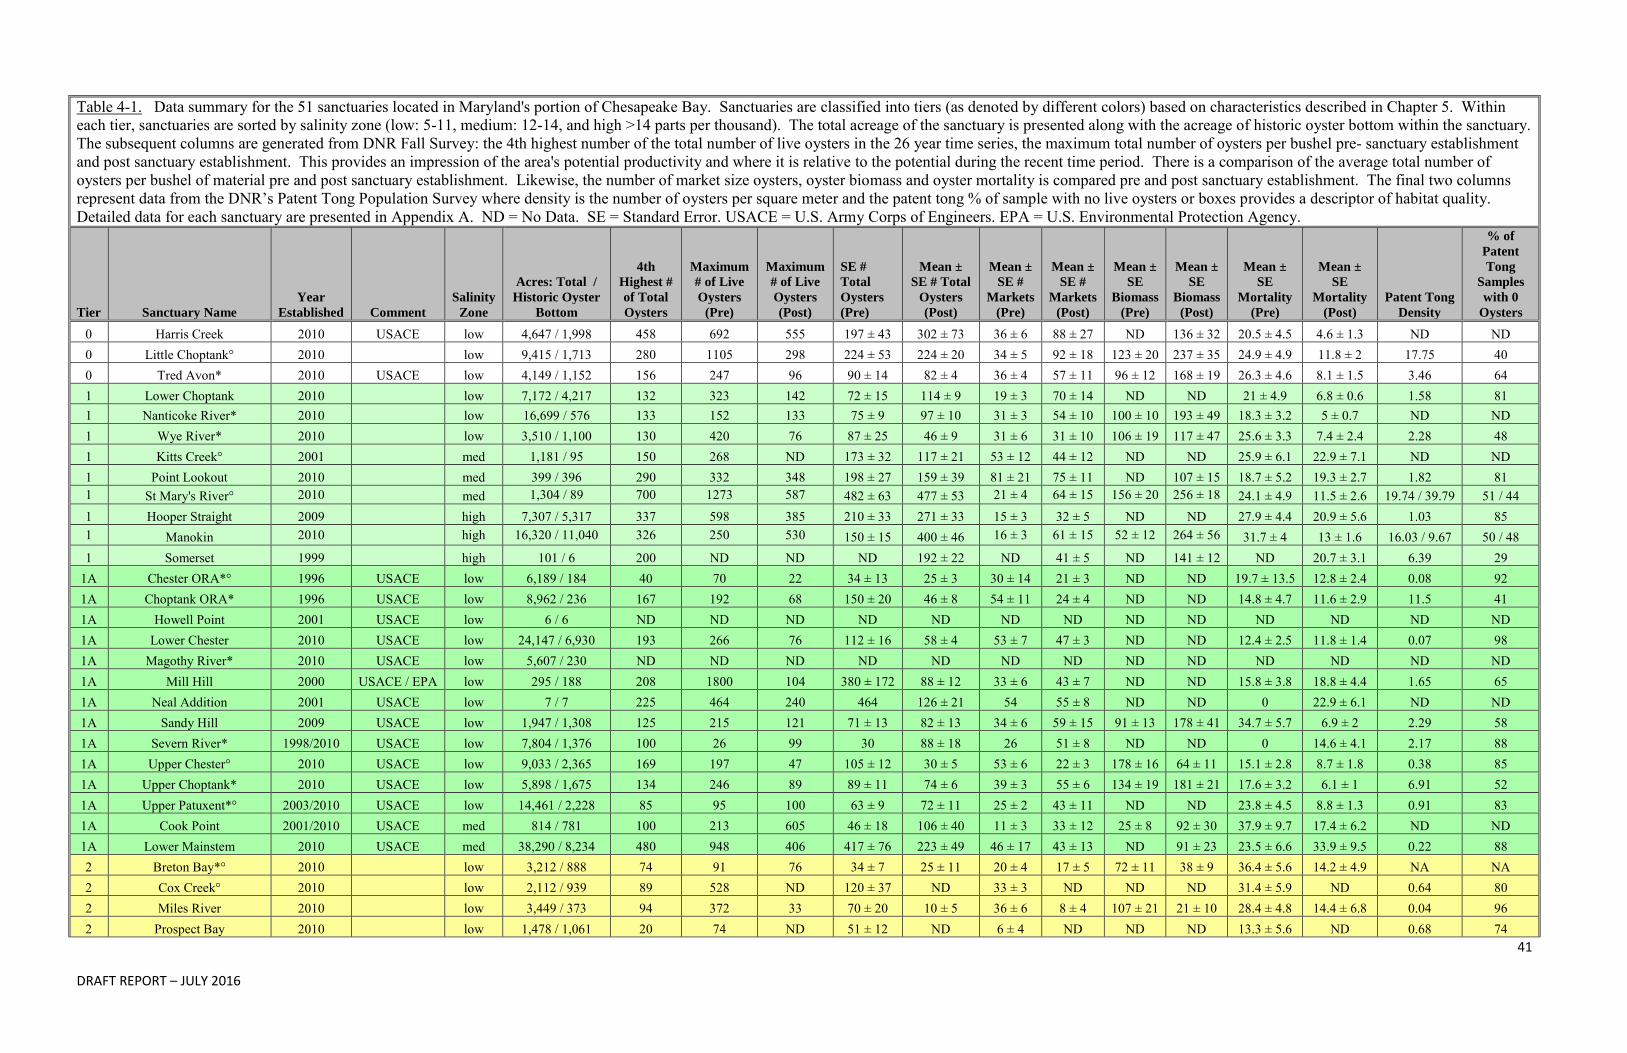
41
DRAFT REPORT – JULY 2016
Table 4-1. Data summary for the 51 sanctuaries located in Maryland's portion of Chesapeake Bay. Sanctuaries are classified into tiers (as denoted by different colors) based on characteristics described in Chapter 5. Within each tier, sanctuaries are sorted by salinity zone (low: 5-11, medium: 12-14, and high >14 parts per thousand). The total acreage of the sanctuary is presented along with the acreage of historic oyster bottom within the sanctuary. The subsequent columns are generated from DNR Fall Survey: the 4th highest number of the total number of live oysters in the 26 year time series, the maximum total number of oysters per bushel pre- sanctuary establishment and post sanctuary establishment. This provides an impression of the area's potential productivity and where it is relative to the potential during the recent time period. There is a comparison of the average total number of oysters per bushel of material pre and post sanctuary establishment. Likewise, the number of market size oysters, oyster biomass and oyster mortality is compared pre and post sanctuary establishment. The final two columns represent data from the DNR’s Patent Tong Population Survey where density is the number of oysters per square meter and the patent tong % of sample with no live oysters or boxes provides a descriptor of habitat quality. Detailed data for each sanctuary are presented in Appendix A. ND = No Data. SE = Standard Error. USACE = U.S. Army Corps of Engineers. EPA = U.S. Environmental Protection Agency.
Tier Sanctuary Name
Year
Established Comment
Salinity
Zone
Acres: Total /
Historic Oyster
Bottom
4th
Highest #
of Total
Oysters
Maximum
# of Live
Oysters
(Pre)
Maximum
# of Live
Oysters
(Post)
SE #
Total
Oysters
(Pre)
Mean ±
SE # Total
Oysters
(Post)
Mean ±
SE #
Markets
(Pre)
Mean ±
SE #
Markets
(Post)
Mean ±
SE
Biomass
(Pre)
Mean ±
SE
Biomass
(Post)
Mean ±
SE
Mortality
(Pre)
Mean ±
SE
Mortality
(Post)
Patent Tong
Density
% of
Patent
Tong
Samples
with 0
Oysters
0 Harris Creek 2010 USACE low 4,647 / 1,998 458 692 555 197 ± 43 302 ± 73 36 ± 6 88 ± 27 ND 136 ± 32 20.5 ± 4.5 4.6 ± 1.3 ND ND 0 Little Choptank° 2010 low 9,415 / 1,713 280 1105 298 224 ± 53 224 ± 20 34 ± 5 92 ± 18 123 ± 20 237 ± 35 24.9 ± 4.9 11.8 ± 2 17.75 40 0 Tred Avon* 2010 USACE low 4,149 / 1,152 156 247 96 90 ± 14 82 ± 4 36 ± 4 57 ± 11 96 ± 12 168 ± 19 26.3 ± 4.6 8.1 ± 1.5 3.46 64 1 Lower Choptank 2010 low 7,172 / 4,217 132 323 142 72 ± 15 114 ± 9 19 ± 3 70 ± 14 ND ND 21 ± 4.9 6.8 ± 0.6 1.58 81 1 Nanticoke River* 2010 low 16,699 / 576 133 152 133 75 ± 9 97 ± 10 31 ± 3 54 ± 10 100 ± 10 193 ± 49 18.3 ± 3.2 5 ± 0.7 ND ND 1 Wye River* 2010 low 3,510 / 1,100 130 420 76 87 ± 25 46 ± 9 31 ± 6 31 ± 10 106 ± 19 117 ± 47 25.6 ± 3.3 7.4 ± 2.4 2.28 48 1 Kitts Creek° 2001 med 1,181 / 95 150 268 ND 173 ± 32 117 ± 21 53 ± 12 44 ± 12 ND ND 25.9 ± 6.1 22.9 ± 7.1 ND ND 1 Point Lookout 2010 med 399 / 396 290 332 348 198 ± 27 159 ± 39 81 ± 21 75 ± 11 ND 107 ± 15 18.7 ± 5.2 19.3 ± 2.7 1.82 81 1 St Mary's River° 2010 med 1,304 / 89 700 1273 587 482 ± 63 477 ± 53 21 ± 4 64 ± 15 156 ± 20 256 ± 18 24.1 ± 4.9 11.5 ± 2.6 19.74 / 39.79 51 / 44 1 Hooper Straight 2009 high 7,307 / 5,317 337 598 385 210 ± 33 271 ± 33 15 ± 3 32 ± 5 ND ND 27.9 ± 4.4 20.9 ± 5.6 1.03 85 1 Manokin 2010 high 16,320 / 11,040 326 250 530 150 ± 15 400 ± 46 16 ± 3 61 ± 15 52 ± 12 264 ± 56 31.7 ± 4 13 ± 1.6 16.03 / 9.67 50 / 48 1 Somerset 1999 high 101 / 6 200 ND ND ND 192 ± 22 ND 41 ± 5 ND 141 ± 12 ND 20.7 ± 3.1 6.39 29
1A Chester ORA*° 1996 USACE low 6,189 / 184 40 70 22 34 ± 13 25 ± 3 30 ± 14 21 ± 3 ND ND 19.7 ± 13.5 12.8 ± 2.4 0.08 92 1A Choptank ORA* 1996 USACE low 8,962 / 236 167 192 68 150 ± 20 46 ± 8 54 ± 11 24 ± 4 ND ND 14.8 ± 4.7 11.6 ± 2.9 11.5 41 1A Howell Point 2001 USACE low 6 / 6 ND ND ND ND ND ND ND ND ND ND ND ND ND 1A Lower Chester 2010 USACE low 24,147 / 6,930 193 266 76 112 ± 16 58 ± 4 53 ± 7 47 ± 3 ND ND 12.4 ± 2.5 11.8 ± 1.4 0.07 98 1A Magothy River* 2010 USACE low 5,607 / 230 ND ND ND ND ND ND ND ND ND ND ND ND ND 1A Mill Hill 2000 USACE / EPA low 295 / 188 208 1800 104 380 ± 172 88 ± 12 33 ± 6 43 ± 7 ND ND 15.8 ± 3.8 18.8 ± 4.4 1.65 65 1A Neal Addition 2001 USACE low 7 / 7 225 464 240 464 126 ± 21 54 55 ± 8 ND ND 0 22.9 ± 6.1 ND ND 1A Sandy Hill 2009 USACE low 1,947 / 1,308 125 215 121 71 ± 13 82 ± 13 34 ± 6 59 ± 15 91 ± 13 178 ± 41 34.7 ± 5.7 6.9 ± 2 2.29 58 1A Severn River* 1998/2010 USACE low 7,804 / 1,376 100 26 99 30 88 ± 18 26 51 ± 8 ND ND 0 14.6 ± 4.1 2.17 88 1A Upper Chester° 2010 USACE low 9,033 / 2,365 169 197 47 105 ± 12 30 ± 5 53 ± 6 22 ± 3 178 ± 16 64 ± 11 15.1 ± 2.8 8.7 ± 1.8 0.38 85 1A Upper Choptank* 2010 USACE low 5,898 / 1,675 134 246 89 89 ± 11 74 ± 6 39 ± 3 55 ± 6 134 ± 19 181 ± 21 17.6 ± 3.2 6.1 ± 1 6.91 52 1A Upper Patuxent*° 2003/2010 USACE low 14,461 / 2,228 85 95 100 63 ± 9 72 ± 11 25 ± 2 43 ± 11 ND ND 23.8 ± 4.5 8.8 ± 1.3 0.91 83 1A Cook Point 2001/2010 USACE med 814 / 781 100 213 605 46 ± 18 106 ± 40 11 ± 3 33 ± 12 25 ± 8 92 ± 30 37.9 ± 9.7 17.4 ± 6.2 ND ND 1A Lower Mainstem 2010 USACE med 38,290 / 8,234 480 948 406 417 ± 76 223 ± 49 46 ± 17 43 ± 13 ND 91 ± 23 23.5 ± 6.6 33.9 ± 9.5 0.22 88 2 Breton Bay*° 2010 low 3,212 / 888 74 91 76 34 ± 7 25 ± 11 20 ± 4 17 ± 5 72 ± 11 38 ± 9 36.4 ± 5.6 14.2 ± 4.9 NA NA 2 Cox Creek° 2010 low 2,112 / 939 89 528 ND 120 ± 37 ND 33 ± 3 ND ND ND 31.4 ± 5.9 ND 0.64 80 2 Miles River 2010 low 3,449 / 373 94 372 33 70 ± 20 10 ± 5 36 ± 6 8 ± 4 107 ± 21 21 ± 10 28.4 ± 4.8 14.4 ± 6.8 0.04 96 2 Prospect Bay 2010 low 1,478 / 1,061 20 74 ND 51 ± 12 ND 6 ± 4 ND ND ND 13.3 ± 5.6 ND 0.68 74
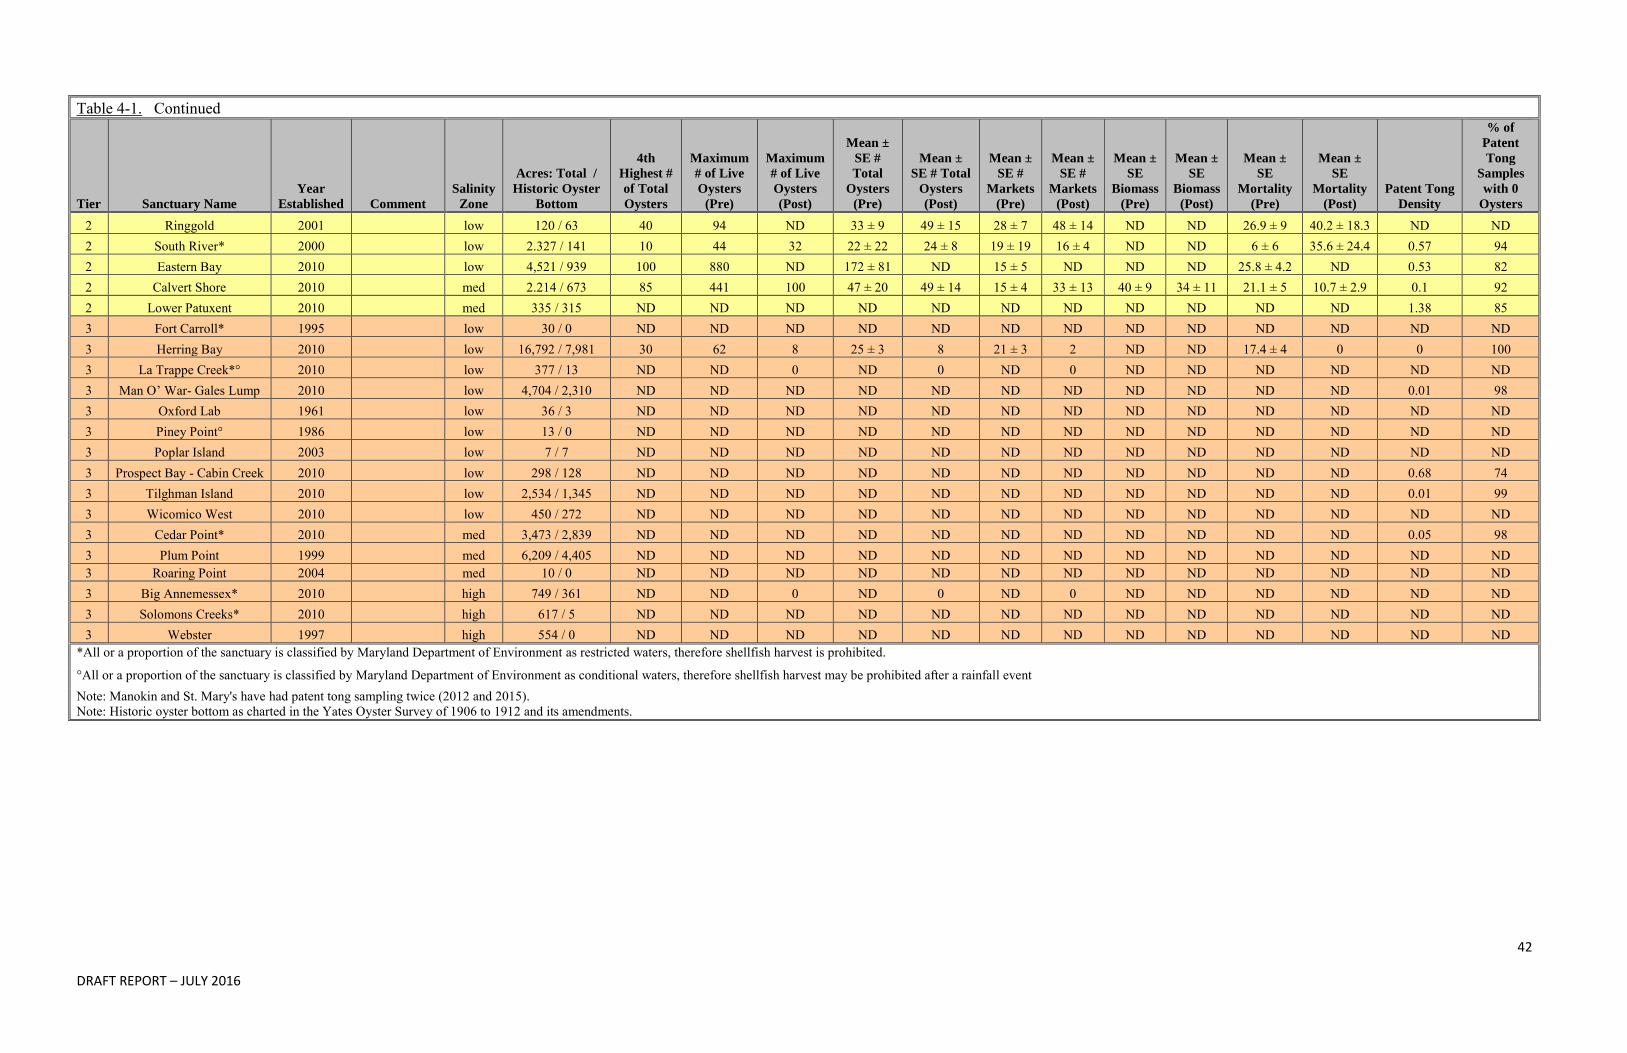
42
DRAFT REPORT – JULY 2016
Table 4-1. Continued
Tier Sanctuary Name
Year
Established Comment
Salinity
Zone
Acres: Total /
Historic Oyster
Bottom
4th
Highest #
of Total
Oysters
Maximum
# of Live
Oysters
(Pre)
Maximum
# of Live
Oysters
(Post)
Mean ±
SE #
Total
Oysters
(Pre)
Mean ±
SE # Total
Oysters
(Post)
Mean ±
SE #
Markets
(Pre)
Mean ±
SE #
Markets
(Post)
Mean ±
SE
Biomass
(Pre)
Mean ±
SE
Biomass
(Post)
Mean ±
SE
Mortality
(Pre)
Mean ±
SE
Mortality
(Post)
Patent Tong
Density
% of
Patent
Tong
Samples
with 0
Oysters
2 Ringgold 2001 low 120 / 63 40 94 ND 33 ± 9 49 ± 15 28 ± 7 48 ± 14 ND ND 26.9 ± 9 40.2 ± 18.3 ND ND 2 South River* 2000 low 2.327 / 141 10 44 32 22 ± 22 24 ± 8 19 ± 19 16 ± 4 ND ND 6 ± 6 35.6 ± 24.4 0.57 94 2 Eastern Bay 2010 low 4,521 / 939 100 880 ND 172 ± 81 ND 15 ± 5 ND ND ND 25.8 ± 4.2 ND 0.53 82 2 Calvert Shore 2010 med 2.214 / 673 85 441 100 47 ± 20 49 ± 14 15 ± 4 33 ± 13 40 ± 9 34 ± 11 21.1 ± 5 10.7 ± 2.9 0.1 92 2 Lower Patuxent 2010 med 335 / 315 ND ND ND ND ND ND ND ND ND ND ND 1.38 85 3 Fort Carroll* 1995 low 30 / 0 ND ND ND ND ND ND ND ND ND ND ND ND ND 3 Herring Bay 2010 low 16,792 / 7,981 30 62 8 25 ± 3 8 21 ± 3 2 ND ND 17.4 ± 4 0 0 100 3 La Trappe Creek*° 2010 low 377 / 13 ND ND 0 ND 0 ND 0 ND ND ND ND ND ND 3 Man O’ War- Gales Lump 2010 low 4,704 / 2,310 ND ND ND ND ND ND ND ND ND ND ND 0.01 98 3 Oxford Lab 1961 low 36 / 3 ND ND ND ND ND ND ND ND ND ND ND ND ND 3 Piney Point° 1986 low 13 / 0 ND ND ND ND ND ND ND ND ND ND ND ND ND 3 Poplar Island 2003 low 7 / 7 ND ND ND ND ND ND ND ND ND ND ND ND ND 3 Prospect Bay - Cabin Creek 2010 low 298 / 128 ND ND ND ND ND ND ND ND ND ND ND 0.68 74 3 Tilghman Island 2010 low 2,534 / 1,345 ND ND ND ND ND ND ND ND ND ND ND 0.01 99 3 Wicomico West 2010 low 450 / 272 ND ND ND ND ND ND ND ND ND ND ND ND ND 3 Cedar Point* 2010 med 3,473 / 2,839 ND ND ND ND ND ND ND ND ND ND ND 0.05 98 3 Plum Point 1999 med 6,209 / 4,405 ND ND ND ND ND ND ND ND ND ND ND ND ND 3 Roaring Point 2004 med 10 / 0 ND ND ND ND ND ND ND ND ND ND ND ND ND 3 Big Annemessex* 2010 high 749 / 361 ND ND 0 ND 0 ND 0 ND ND ND ND ND ND 3 Solomons Creeks* 2010 high 617 / 5 ND ND ND ND ND ND ND ND ND ND ND ND ND 3 Webster 1997 high 554 / 0 ND ND ND ND ND ND ND ND ND ND ND ND ND
*All or a proportion of the sanctuary is classified by Maryland Department of Environment as restricted waters, therefore shellfish harvest is prohibited.
°All or a proportion of the sanctuary is classified by Maryland Department of Environment as conditional waters, therefore shellfish harvest may be prohibited after a rainfall event Note: Manokin and St. Mary's have had patent tong sampling twice (2012 and 2015). Note: Historic oyster bottom as charted in the Yates Oyster Survey of 1906 to 1912 and its amendments.
43
DRAFT REPORT – JULY 2016
Section 4.2.1: Sanctuary Objective #1 - Protect half of the Bay’s most productive oyster
grounds that remain [in Maryland (Jones and Rothschild 2009)] and
allow investigation of the reasons why these remain most productive
We assessed the first half of this objective (protecting half of Maryland’s ‘best bars’ as determined by Jones and Rothschild)79 by examining the locations of these bars relative to sanctuary boundaries.
The classification of ‘best bars’ was based on the relative abundance of market-sized oysters at sites sampled in the Fall Survey from 1996 to 2007. ‘Best bars’ were those where the abundance of market-sized oysters ranked in the top 10% of all bars surveyed, with greater than 70 per bushel in four or more years over the study period. Jones and Rothschild80 identified 17 ‘best bars’ covering approximately 7,826 acres of historic oyster bottom (as charted by the Yates Oyster Survey from 1906 to 191281 and its amendments). Of the 17 ‘best bars’, nine have between 20 and 100 percent of their historic oyster bottom within a currently established sanctuary. Historic oyster bottom refers to oyster bars charted by the Yates
Oyster Survey (1906 to 1912)82 and its amendments. Although more than half of the bars have some portion of their historic oyster bottom within a sanctuary, only 26% (2,063 acres) of ‘best bar’ is within sanctuaries. The remaining 74% of the total ‘best bar’ acreage is located outside sanctuaries and is open to harvest (Table 4-2). Thus, based on the number of ‘best bars’ located in sanctuaries, this objective has been met although the total area based on historic oyster bottom of ‘best bars’ within sanctuaries is less than 50%. It should be noted, however, that the historic oyster bottom does not necessarily represent current viable oyster reefs with oysters and substrate. As estimated in the PEIS, only 36,000 acres of the historic oyster bottom is viable today.83 79 Jones, P.W. and Rothschild, B.J. 2009. Maryland’s Oyster Redevelopment Program – Sanctuaries and Harvest Reserves. Final Report to the Maryland Department of Natural Resources. http://dnr.maryland.gov/fisheries/Documents/Best_Bar_Report_summary.pdf
80 IBID
81 Yates, Charles. 1913. Survey of Oyster Bars of Maryland 1906 to 1912. http://www.biodiversitylibrary.org/item/96740
82 IBID
83 U.S. Army Corps of Engineers, Norfolk District. 2009. Programmatic Environmental Impact Statement for Oyster Restoration in Chesapeake Bay Including the Use of a Native and/or Nonnative Oyster. http://dnr.maryland.gov/fisheries/Pages/eis.aspx
Sanctuary Objective # 1 Status: Although more than half of the ‘best
bars’ have some portion of their area
within a sanctuary boundary, only 26%
(2,063 acres) of ‘best bar’ is within
sanctuaries. The remaining 74% of the
total ‘best bar’ acreage is located outside
sanctuary boundaries and is open to
harvest. Thus, based on the number of
‘best bars’ located in sanctuaries, this
objective has been met although the total
area based on historic oyster bottom of
‘best bars’ within sanctuaries is less than
50%.
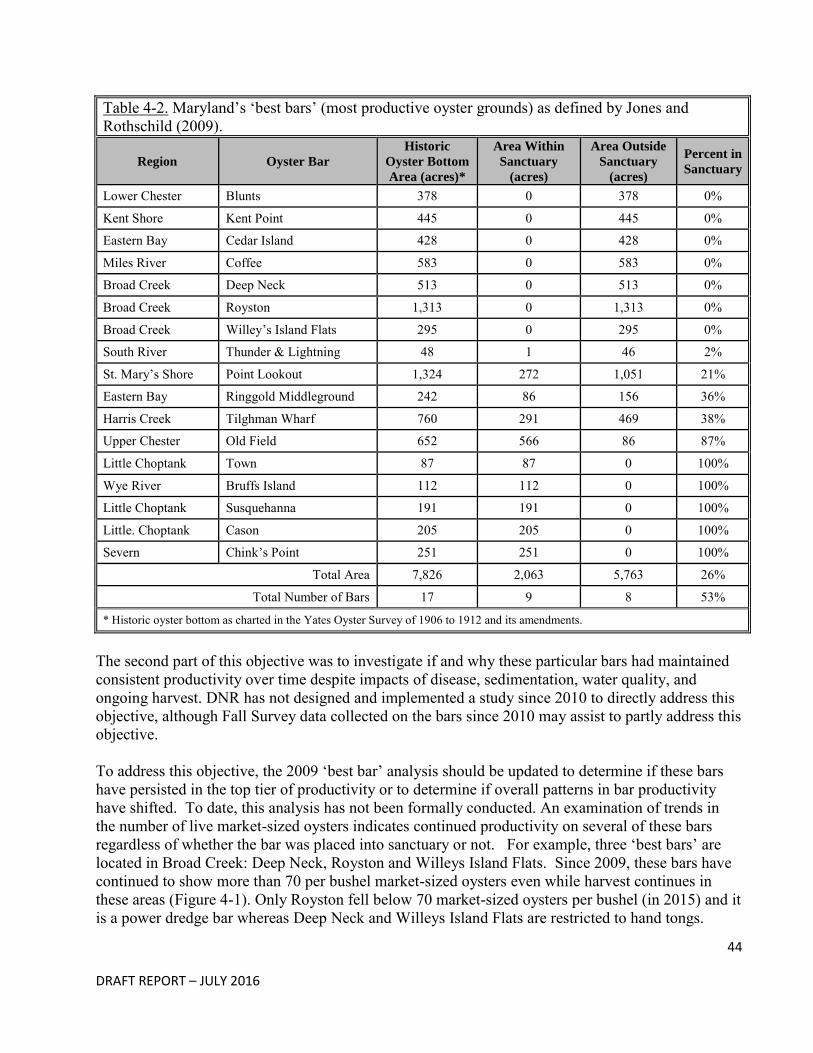
44
DRAFT REPORT – JULY 2016
Table 4-2. Maryland’s ‘best bars’ (most productive oyster grounds) as defined by Jones and Rothschild (2009).
Region Oyster Bar
Historic
Oyster Bottom
Area (acres)*
Area Within
Sanctuary
(acres)
Area Outside
Sanctuary
(acres)
Percent in
Sanctuary
Lower Chester Blunts 378 0 378 0%
Kent Shore Kent Point 445 0 445 0%
Eastern Bay Cedar Island 428 0 428 0%
Miles River Coffee 583 0 583 0%
Broad Creek Deep Neck 513 0 513 0%
Broad Creek Royston 1,313 0 1,313 0%
Broad Creek Willey’s Island Flats 295 0 295 0%
South River Thunder & Lightning 48 1 46 2%
St. Mary’s Shore Point Lookout 1,324 272 1,051 21%
Eastern Bay Ringgold Middleground 242 86 156 36%
Harris Creek Tilghman Wharf 760 291 469 38%
Upper Chester Old Field 652 566 86 87%
Little Choptank Town 87 87 0 100%
Wye River Bruffs Island 112 112 0 100%
Little Choptank Susquehanna 191 191 0 100%
Little. Choptank Cason 205 205 0 100%
Severn Chink’s Point 251 251 0 100%
Total Area 7,826 2,063 5,763 26%
Total Number of Bars 17 9 8 53%
* Historic oyster bottom as charted in the Yates Oyster Survey of 1906 to 1912 and its amendments.
The second part of this objective was to investigate if and why these particular bars had maintained consistent productivity over time despite impacts of disease, sedimentation, water quality, and ongoing harvest. DNR has not designed and implemented a study since 2010 to directly address this objective, although Fall Survey data collected on the bars since 2010 may assist to partly address this objective. To address this objective, the 2009 ‘best bar’ analysis should be updated to determine if these bars have persisted in the top tier of productivity or to determine if overall patterns in bar productivity have shifted. To date, this analysis has not been formally conducted. An examination of trends in the number of live market-sized oysters indicates continued productivity on several of these bars regardless of whether the bar was placed into sanctuary or not. For example, three ‘best bars’ are located in Broad Creek: Deep Neck, Royston and Willeys Island Flats. Since 2009, these bars have continued to show more than 70 per bushel market-sized oysters even while harvest continues in these areas (Figure 4-1). Only Royston fell below 70 market-sized oysters per bushel (in 2015) and it is a power dredge bar whereas Deep Neck and Willeys Island Flats are restricted to hand tongs.
45
DRAFT REPORT – JULY 2016
Two additional ‘best bars’ (Cason and Town) are located in the Little Choptank River Sanctuary and have been consistently sampled over time by the Fall Survey. Since 2012, Cason and Town have continued to show abundances of market-sized oysters that are well above 70 per bushel (Figure 4-1). Broad Creek and the Little Choptank are both located in low salinity areas within the Choptank River complex on Maryland’s central eastern shore. To date, the two locations show similar patterns over time in the abundance of market-sized oysters. Observing how these ‘best bars’ perform through time will show whether there are differences between fished and unfished ‘best bars’ that are located relatively close to one another. Shell height data are available for Cason in the Little Choptank Sanctuary and for Deep Neck, Royston and Willeys Island Flats in Broad Creek. Although both areas had relatively high numbers of market-sized oysters in 2015, the size distribution in 2015 includes a higher proportion of large oysters on the sanctuary bar than on the fished bars (Figure 4-2). The oyster populations on these particular bars in Broad Creek and in the Little Choptank benefit from spatfall levels that are both consistent over time and relatively high compared to other areas of the bay.84 However, precisely determining how specific physical processes affect high spat settlement and low mortality generally requires long term, scientifically designed studies. Studies of this nature have not been completed over the past five years, but DNR and its partners continue to collect data in these areas that may support studies in the future.
84 Tarnowski, M. (ed.) 2015. Maryland Oyster Population Status Report: 2014 Fall Survey. Maryland Department of Natural Resources, Annapolis, MD, # 17-782015-769, 68 pp. http://dnr.maryland.gov/fisheries/Pages/shellfish-monitoring/reports.aspx
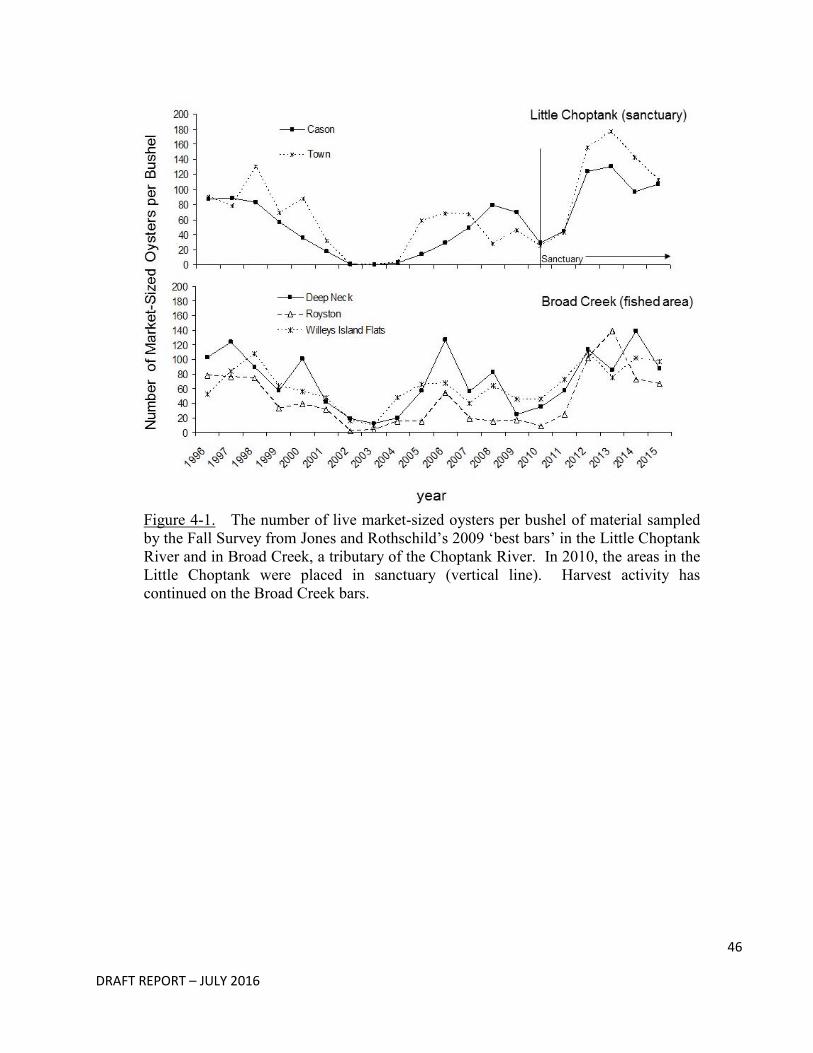
46
DRAFT REPORT – JULY 2016
Figure 4-1. The number of live market-sized oysters per bushel of material sampled by the Fall Survey from Jones and Rothschild’s 2009 ‘best bars’ in the Little Choptank River and in Broad Creek, a tributary of the Choptank River. In 2010, the areas in the Little Choptank were placed in sanctuary (vertical line). Harvest activity has continued on the Broad Creek bars.
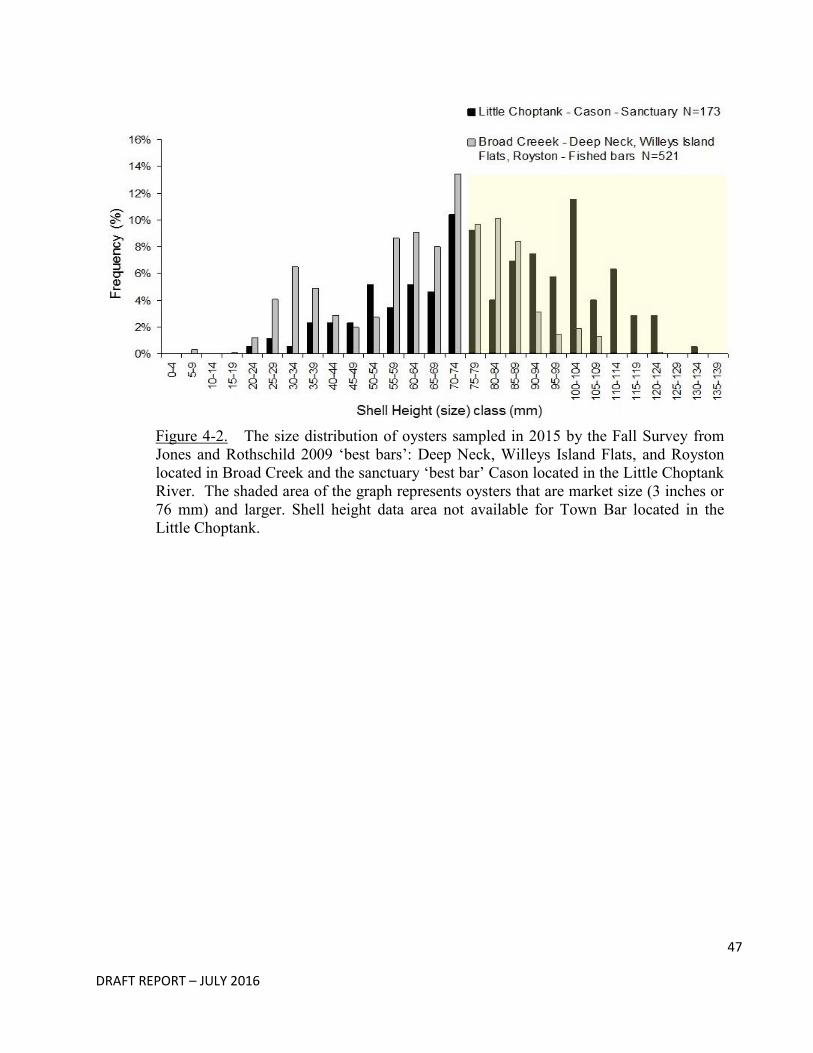
47
DRAFT REPORT – JULY 2016
Figure 4-2. The size distribution of oysters sampled in 2015 by the Fall Survey from Jones and Rothschild 2009 ‘best bars’: Deep Neck, Willeys Island Flats, and Royston located in Broad Creek and the sanctuary ‘best bar’ Cason located in the Little Choptank River. The shaded area of the graph represents oysters that are market size (3 inches or 76 mm) and larger. Shell height data area not available for Town Bar located in the Little Choptank.
48
DRAFT REPORT – JULY 2016
Section 4.2.2: Sanctuary Objective #2 - Facilitate development of natural disease
resistance This objective remains under evaluation as we observe over time whether the absence of harvest can facilitate the development of a significant population of oysters that is resistant or tolerant to MSX (Haplosporidium nelsoni) and dermo (Perkinsus marinus) diseases, which would increase survival, growth, and reproduction of Maryland oysters. Disease resistance is defined as the ability of the oyster to prevent infection. Disease tolerance is the maintenance of relatively normal function (growth, reproduction, survival) despite the presence of disease in the animal. Both conditions may develop through natural selection with the same outcome - increased survival. For the purpose of this report, we use the term “resistance”, recognizing that tolerance could also develop. MSX and dermo diseases are caused by pathogenic parasites that can result in potentially devastating oyster mortalities. Dermo disease was first detected in Chesapeake Bay in 1949 and MSX disease in 1959. A management tool to foster the development of disease resistance is to protect older and larger oysters that may have survived exposure to disease. One option is to close an area to harvest. Studying how these populations respond to disease pressure over time will show if there is development of disease resistance. Also, larger oysters represent important contributors to future generations, since oysters become more fecund (produce more eggs) as they grow larger. Sanctuary protection of these large, surviving oysters is one strategy to conserve potentially disease resistant genes for future generations. There is an additional benefit to protection of the older, larger oysters. Although an objective of sanctuaries is to observe whether disease resistance can be developed over time, it is clear that oysters in any area (sanctuary or harvest area) can die from disease, old age, predation and adverse environmental conditions such as freshets. However, if large oysters are not removed by harvest, shells of deceased oysters will remain in place as substrate for the potential recruitment of future generations of oyster larvae. These shells will provide three-dimensional habitats for a diverse assemblage of associated animals and plants and may contribute to reefs growing over time.85,86 85 Kellogg, M.L., Ross, P.G., Luckenbach, M.W., Dreyer, J.C., Pant, M., Birch, A., Fate, S., Smith, E,, Paynter, K. 2016. Integrated assessment of oyster reef ecosystem services: Fish and crustacean utilization and trophic linkages. Report to NOAA Chesapeake Bay Office, 19 pp. http://hdl.handle.net/10288/22190 86 Kellogg, M.L., Cornwell, J.C., Owens, M.S., Paynter, K.T. 2013. Denitrification and nutrient assimilation on a restored oyster reef. Marine Ecology Progress Series 480: 1-19.
Sanctuary Objective #2 Status: This objective
remains under evaluation as we observe over
time whether the absence of harvest can
facilitate the development of a significant
population of oysters that is resistant or tolerant
to MSX (Haplosporidium nelsoni) and dermo
(Perkinsus marinus) diseases.
49
DRAFT REPORT – JULY 2016
Current State of Knowledge - Oyster Disease Resistance While it is too early to state that sanctuaries have supported the development of resistance to MSX and dermo diseases, it has been demonstrated that oyster resistance to both MSX and dermo diseases are heritable, genetic characteristics that can be strengthened by planned, selective breeding.87,88 Following at least 55 years of natural selection through disease events caused by dermo and MSX, there is some evidence of increasing resistance to MSX disease for oysters in Chesapeake and Delaware bays.89,90,91 Recent data on dermo disease among different size classes of public oysters in Chesapeake Bay waters in Virginia indicate that the intensities of dermo infections are frequently lower in the largest (oldest) oysters. These results suggest that large, older oysters represent survivors of longstanding disease pressures. The survival and lower infection intensities of these larger, older oysters collectively reflect their ability to resist and survive dermo disease. The decline in observed mortality in recent years among Maryland oysters may indicate the possibility of increasing disease tolerance, although controlled studies that separate the effects of disease pathogens and salinity would be necessary to validate this result. Data collected by the Fall Survey indicate that the infection rates (prevalence) of both dermo disease and MSX and dermo disease intensity has been generally below the time-series average since 2003, but when it has increased, there has been no or only slight corresponding increase in mortality (Figure 4-3, Appendices A and B). Aside from increasing disease resistance, the lower mortalities may be due to favorable and timely freshwater stream flows into the bay or a decline in the virulence of the pathogens.
87 Ford, S.E., Haskin, H.H. 1987. Infection and mortality patterns in strains of oysters Crassostrea virginica selected for resistance to the parasite Haplosporidium nelsoni (MSX). Journal of Parasitology 73: 368-376. 88 Ragone Calvo, L.M., Calvo G.W., Burreson, E.M. 2003. Dual disease resistance in a selectively bred eastern oyster, Crassostrea virginica, strain tested in Chesapeake Bay. Aquaculture 220: 69-87.
89 Carnegie, R.B., Burreson, E.M. 2011. Declining impact of an introduced pathogen: Haplosporidium nelsoni in the oyster Crassostrea virginica in Chesapeake Bay. Marine Ecology Progress Series 432: 1-15. 90 Carnegie, R.B., Burreson, E.M. 2009. Status of the major oyster diseases in Virginia 2006-2008: A summary of the annual oyster disease monitoring program. Virginia Institute of Marine Science, Gloucester Point, VA http://www.vims.edu/research/departments/eaah/programs/molluscan_health/_documents/monitoring_rpt_2009.pdf
91 Ford, S.E., Bushek, D. 2012. Development of resistance to an introduced marine pathogen by a native host. Journal of Marine Research 70: 205-223. http://hsrl.rutgers.edu/abstracts.articles/JMR%20EID%20volume/FordBushek_2012_Development_of_resistance_to_an_introduced_marine_pathogen_by_a_native_host.pdf
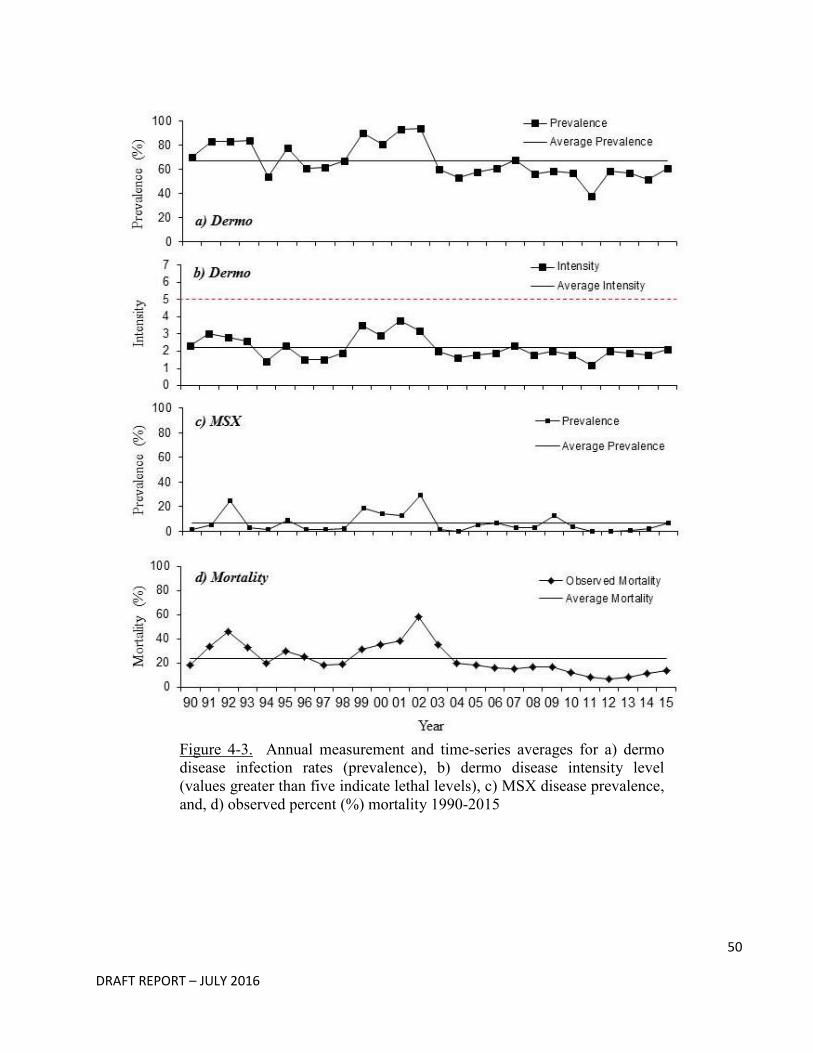
50
DRAFT REPORT – JULY 2016
Figure 4-3. Annual measurement and time-series averages for a) dermo disease infection rates (prevalence), b) dermo disease intensity level (values greater than five indicate lethal levels), c) MSX disease prevalence, and, d) observed percent (%) mortality 1990-2015
51
DRAFT REPORT – JULY 2016
Measuring Disease Resistance At this time, it is impractical to directly and objectively evaluate whether oysters within sanctuaries develop resistance faster than oysters in harvested populations. More needs to be known about the genetic basis for resistance in order to develop objective genetic or biochemical markers to identify disease resistant animals. Beyond the issue of developing genetic markers, estimating and comparing disease resistance of oysters in different populations or locations would be an expensive proposition, but it could be accomplished with adequate resources and time. Although relative resistance of oysters in differing locations could be tested, the impacts of those differences on oyster populations outside of the sanctuaries could be difficult to determine. This is because oyster larvae grow and disperse under influences of variable tidal and wind-driven water currents during 2-3 weeks of their early lives, before attaching to an available hard substrate. Local oyster populations receive larvae from neighboring populations, and also export their own larvae to join neighboring populations. In consequence, contributions by sanctuary oysters to disease resistance will be difficult to evaluate except over broad geographic areas and over long periods of time. Currently this remains a conceptual expectation for Maryland oyster sanctuaries.
52
DRAFT REPORT – JULY 2016
Section 4.2.3: Sanctuary Objective #3 - Provide essential natural ecological functions
that cannot be obtained on a harvest bar This is one of the most difficult objectives to assess because of the complexity of measuring ecological functions, the short time frame of the evaluation period, and the complex forces controlling oyster growth, reproduction and survival. It is widely recognized that oysters and the reefs they create are a vital component of a healthy Chesapeake Bay ecosystem. Oyster reefs that are undisturbed by harvest gear provide complex three-dimensional habitat which provides habitat for many other species. 92,93 Perhaps more importantly, research is beginning to show how three-dimensional structure impacts the food web to benefit the oyster reef and the ecosystem as a whole. Grabowski stated in 2004 demonstrated that substituting vertically oriented living oysters for the flat shells of dead oysters increases survival of young oysters.94 Increasing habitat complexity and oyster abundance also increases the exchange of nutrients and energy between the bottom and the water column, a process called benthic-pelagic coupling. Oysters filter large volumes of water and can reduce the local concentration of suspended particulates (including phytoplankton), thereby increasing water clarity. This process plays a major role in the production and biological structure of the system.95,96 Although the ecological value of undisturbed oyster reef is becoming more evident within the scientific literature, there has not been sufficient time since 2010 to design, conduct and complete studies to measure changes such as fish production, species diversity, trophic linkages, nutrient sequestration, and water quality. In many cases, we will not be able to measure changes to ecological services until there is a large, stable oyster population.97 This is particularly true of
92 Tolley, S.G., Volety, A.K. 2005. The role of oysters in habitat use of oyster reefs by resident fishes and decapod crustaceans. Journal of Shellfish
Research 24:1007-1012
93 Lenhihan, H.S., Peterson, C.H., Byers, J.E., Grabowski, J.H., Thayer, G.W., Colby, D.R. 2001. Cascading of habitat degradation: oyster reefs invaded by refugee fishes escaping stress. Ecological Applications 11(3), pp 764-782.
94 Grabowski, J.H. 2004. Habitat Complexity disrupts predator-prey interactions but not the trophic cascade on oyster reefs. Ecology 85(4), pp 995-1004.
95 Marcus, N.H., Boero, F. 1998. Minireview: The importance of benthic-pelagic coupling and the forgotten role of life cycles in coastal aquatic systems. Limnology and Oceanography 43(5), pp763-768.
96 Mann, R., Powell, E.N. 2007. Why oyster restoration goals in the Chesapeake Bay are not and probably cannot be achieved. Journal of Shellfish
Research 26(4), pp 905-917.
97 IBID
Sanctuary Objective #3 Status: Research
is beginning to show how a complex, three-
dimensional structure impacts the food web
to benefit the oyster reef and the ecosystem
as a whole. Changes in mortality,
abundance, biomass and size structure
after an area is placed in sanctuary can
indicate increased ecological services.
53
DRAFT REPORT – JULY 2016
Oyster Survival: In all 16 of these new
sanctuary areas, survival remained the
same or increased since sanctuary
creation in 2010. This is not surprising
in that climatic conditions since 2010
have been favorable for disease
mitigation and oyster survival.
oyster-generated improvements to water.98 There are numerous studies underway in Harris Creek and the Tred Avon and Little Choptank rivers by federal and academic groups that should help evaluate the ecological performance of the restored oyster reefs.99 Changes in survival, abundance, biomass, size structure and environmental conditions before and after an area is placed in sanctuary can be viewed as ‘proxy indicators’ of a sanctuary’s ecological functions. Positive trends are indicators of increased ecological services. Therefore, sanctuary data from Table 4-1 have been compiled into a ‘stop light’ table which shows patterns and gaps in data (Table 4-3).
Oyster Survival
Survival is the reciprocal of mortality and is calculated by subtracting the mortality levels presented in Appendix A from 100%. For example, if mortality of oysters in an area is 40% then survival is 60%. The average annual survival before and after sanctuary creation is presented in Table 4-3. The Fall Survey has consistently monitored 28 of the 51 sanctuaries since 1990 and 16 of these were created as part of the 2010 regulation. In all 16 of these new sanctuary areas, survival has remained the same or increased since sanctuary creation in 2010. This is not surprising in that climatic conditions since 2010 have been favorable for reducing disease pressure and increasing oyster survival. Twelve of the 28 sanctuaries were created prior to 2010. In nine of these sanctuaries, average survival remained unchanged or increased after the area was placed in sanctuary. Oyster survival decreased since sanctuary creation in three areas: the Severn River (created 1998), South River (created 2000) and Neal Addition in the Patuxent River (created 2001). These sanctuaries were all created prior to or during the 1999-2003 period of high disease mortality. Therefore, while the average survival in these areas decreased after the area was made into a sanctuary, survival has increased since 2010 in the Neal Addition and Severn River sanctuaries. No Fall Survey data have been collected since 2010 in the South River sanctuary although a baseline patent tong survey was conducted in 2014.
98 Mann, R., Powell, E.N. 2007. Why oyster restoration goals in the Chesapeake Bay are not and probably cannot be achieved. Journal of Shellfish
Research 26(4), pp 905-917.
99 National Oceanographic and Atmospheric Administration, US Army Corps of Engineers, Maryland Department of Natural Resources, Oyster Recovery Partnership. 2016. 2015 Oyster Restoration Implementation Update. Progress in the Choptank Complex (Harris Creek, Little Choptank River, and Tred Avon River Oyster Sanctuaries). http://dnr.maryland.gov/fisheries/Documents/2015_Choptank_Oyster_Implementation_Update_FINAL.pdf
54
DRAFT REPORT – JULY 2016
Oyster Abundance
Abundance is calculated as the total number of live oysters per bushel of material sampled by the Fall Survey. This calculation includes spat so it can be influenced by the planting of spat conducted over the course of the time series. Average annual oyster abundance before the sanctuary was established is compared to the annual average after sanctuary creation in Table 4-3. In seven of the 28 (25%) sanctuaries regularly monitored by the Fall Survey, the average total live oysters per bushel has increased since the area was placed in sanctuary. Abundance remained unchanged in 12 of the 28 (43%) areas (Table 4-3). Abundance declined in the remaining nine (32%) of the areas. The abundance of live market-size oysters per bushel of material increased in 14 or 50% of the monitored sanctuaries (Table 4-1). Simply comparing average values before and after sanctuary creation can be misleading because it does not provide a complete picture of population changes and of the many factors that may have influenced abundance over time. Four of the sanctuaries where total abundance declined were created prior to 2002, so the average annual abundance after sanctuary creation includes the period of high oyster disease mortality that decimated populations in many areas around Maryland’s portion of Chesapeake Bay. For example, in the Wye River sanctuary, the average total abundance has decreased. The pre-sanctuary abundance was very high between 1997 and 1999, after which the number of oysters decreased dramatically due to disease. Since the area was placed in sanctuary, oyster numbers have been rising each year, but they have not yet attained pre-2000 levels (see Appendix A). The Wye River sanctuary is an example of an oyster population responding to the combined effects of low disease pressure, low recruitment, and no harvest. Whereas the Wye River is an example of a low-salinity sanctuary where the oyster population has shown gains in the absence of harvest, not all low-salinity sanctuaries have responded similarly - primarily due to inconsistent spat sets in the area. The Upper Chester River is an example of a low salinity sanctuary area that appears to be declining since 2010 when both harvest and replenishment activities in the area ceased. The Upper Chester River was planted with oyster seed nearly annually between 1990 and 2008. Although the area still suffered from effects of disease, oyster replenishment activities in the area maintained some level of population and harvest. However, spat settlement is highly intermittent. Spat were encountered by the Fall Survey in just 11 out of the past 26 years it has been sampled and with an annual average less than 1 spat per bushel have not maintained the population. Overall, the abundance of oysters as indexed by the Fall Survey has remained stable or increased during the post-sanctuary time period in 68% of sanctuaries across all salinity zones. If conditions remain unfavorable for disease, the increasing number of oysters will contribute to the spawning potential in these areas and to the reef structure. Should conditions favoring high disease mortality return, the sanctuary areas will benefit from the shells left behind by the dead oysters. The ability of
Oyster Abundance: The Fall Survey
indicates that the overall abundance of
oysters has remained stable or increased
during the post-sanctuary time period in
68% of sanctuaries across all salinity
zones.
55
DRAFT REPORT – JULY 2016
these shells to support incoming spat will depend upon the frequency and intensity of spat settlement in the area. Understanding the changes in oyster populations in sanctuary areas will take at least decades. Biomass
Biomass is a measure that reflects both the total number and total weight of a group of animals. For example, when examining two groups of oysters with the same abundance, the group with the greater number of larger oysters would have the larger biomass. An index of oyster biomass is calculated for each of the 43 designated “disease bars” sampled in the Fall Survey.100 This biomass index is determined by measuring the shell height from all oysters collected in a bushel of material and calculating the dry weight in grams of the sample. Biomass indices for the 26 year time series beginning in 1990 are available for 13 oyster bars located in 13 of the 51 sanctuaries. The remaining 30 bars are in PSFAs and non-sanctuary areas. Biomass indices for most sanctuary bars have increased steadily since 2010 (Figure 4-4). Within the last two years, most areas within low salinity areas have achieved the highest biomass levels in the 26-year time series (Figure 4-5). However, the low salinity sanctuaries Miles and Upper Chester rivers have not shown any appreciable change in biomass since 2002, mostly due to consistently low spat settlement in these areas. The medium and high salinity sanctuaries St. Mary’s, Cook Point and Manokin River also show increasing biomass indices since sanctuary creation in 2010 (Figure 4-6). As with the low salinity areas, these three sanctuaries have approached time-series high levels of biomass within the last three years.
100 Tarnowski, M. (ed.) 2015. Maryland Oyster Population Status Report: 2014 Fall Survey. Maryland Department of Natural Resources, Annapolis, MD, # 17-782015-769, 68 pp. http://dnr.maryland.gov/fisheries/Pages/shellfish-monitoring/reports.aspx
Oyster Biomass: Biomass in
sanctuaries has increased steadily since
2010. Within the last two years, most
areas have achieved the highest biomass
levels in the 26 year time series.
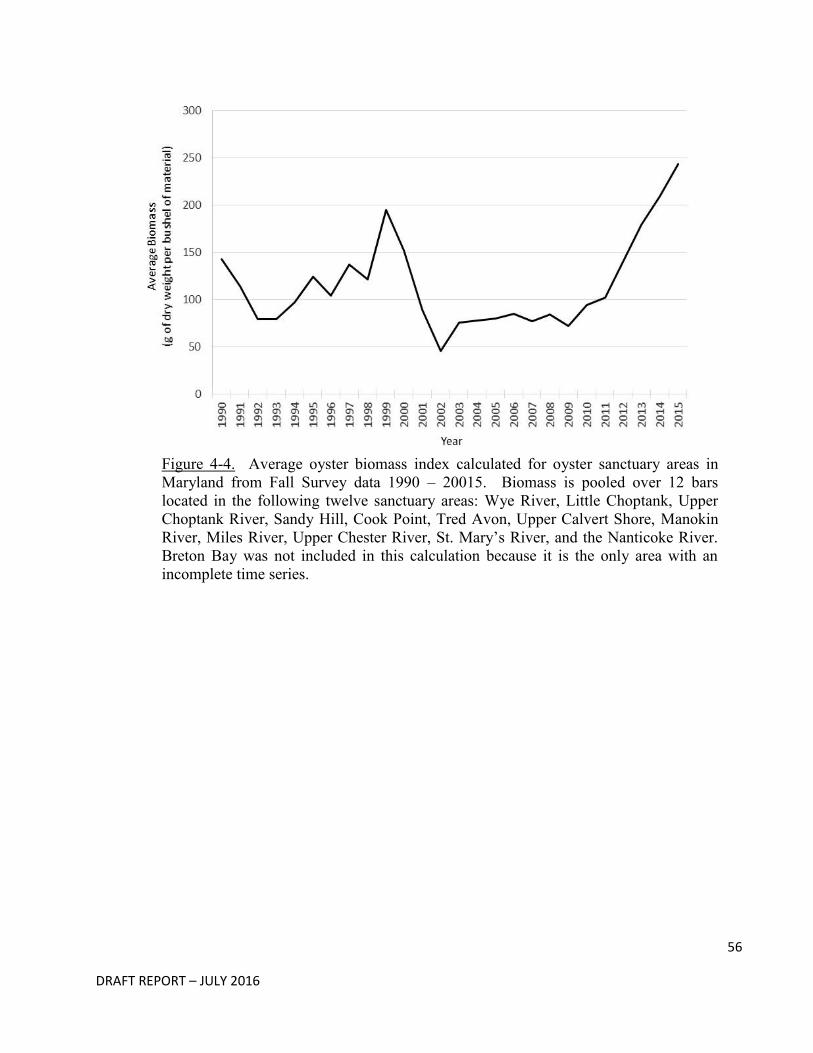
56
DRAFT REPORT – JULY 2016
Figure 4-4. Average oyster biomass index calculated for oyster sanctuary areas in Maryland from Fall Survey data 1990 – 20015. Biomass is pooled over 12 bars located in the following twelve sanctuary areas: Wye River, Little Choptank, Upper Choptank River, Sandy Hill, Cook Point, Tred Avon, Upper Calvert Shore, Manokin River, Miles River, Upper Chester River, St. Mary’s River, and the Nanticoke River. Breton Bay was not included in this calculation because it is the only area with an incomplete time series.
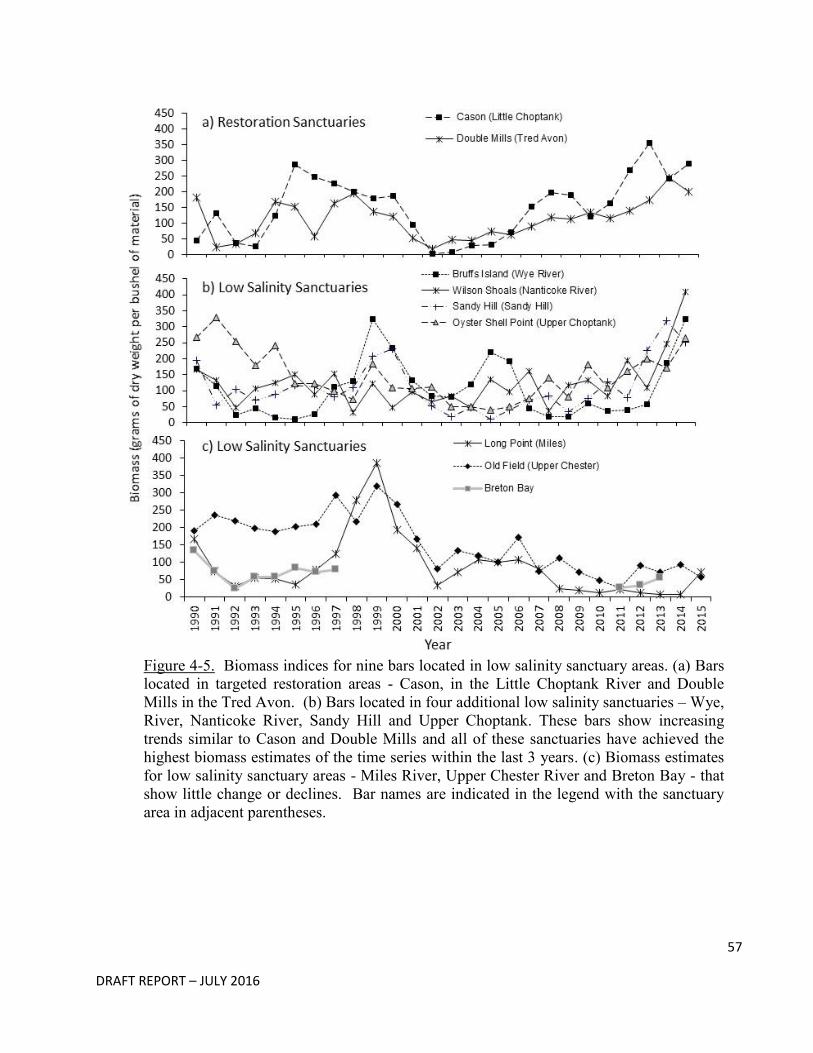
57
DRAFT REPORT – JULY 2016
Figure 4-5. Biomass indices for nine bars located in low salinity sanctuary areas. (a) Bars located in targeted restoration areas - Cason, in the Little Choptank River and Double Mills in the Tred Avon. (b) Bars located in four additional low salinity sanctuaries – Wye, River, Nanticoke River, Sandy Hill and Upper Choptank. These bars show increasing trends similar to Cason and Double Mills and all of these sanctuaries have achieved the highest biomass estimates of the time series within the last 3 years. (c) Biomass estimates for low salinity sanctuary areas - Miles River, Upper Chester River and Breton Bay - that show little change or declines. Bar names are indicated in the legend with the sanctuary area in adjacent parentheses.
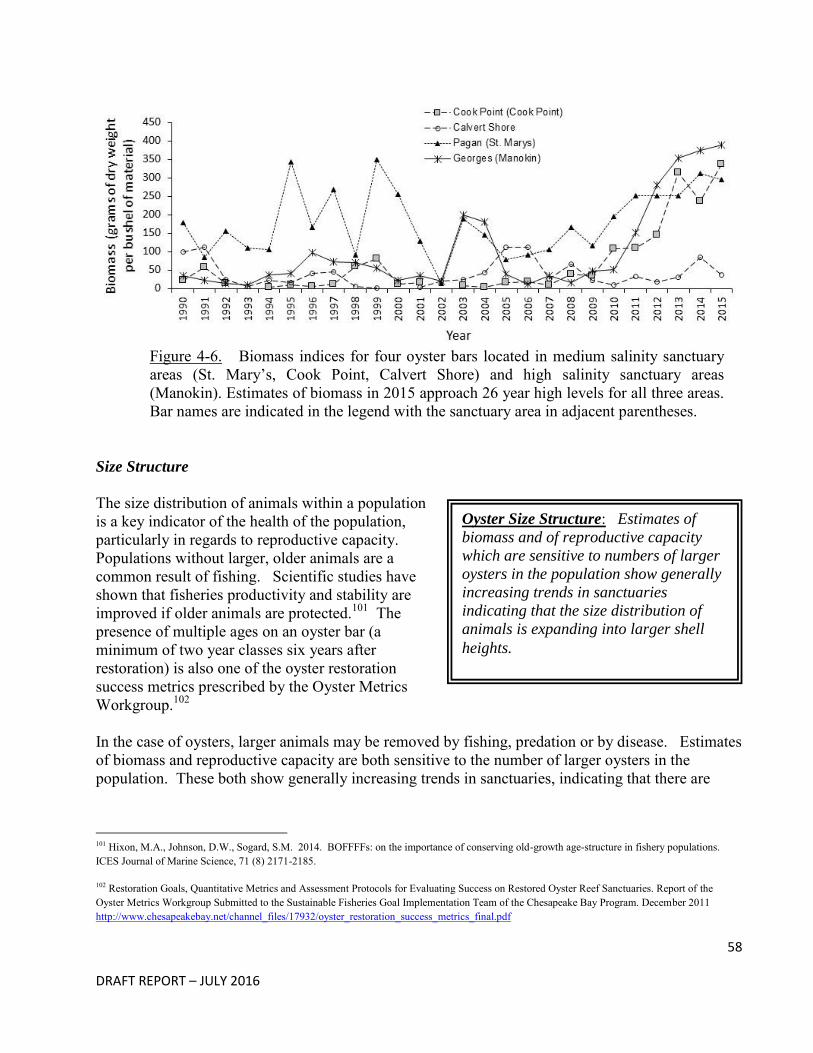
58
DRAFT REPORT – JULY 2016
Figure 4-6. Biomass indices for four oyster bars located in medium salinity sanctuary areas (St. Mary’s, Cook Point, Calvert Shore) and high salinity sanctuary areas (Manokin). Estimates of biomass in 2015 approach 26 year high levels for all three areas. Bar names are indicated in the legend with the sanctuary area in adjacent parentheses.
Size Structure
The size distribution of animals within a population is a key indicator of the health of the population, particularly in regards to reproductive capacity. Populations without larger, older animals are a common result of fishing. Scientific studies have shown that fisheries productivity and stability are improved if older animals are protected.101 The presence of multiple ages on an oyster bar (a minimum of two year classes six years after restoration) is also one of the oyster restoration success metrics prescribed by the Oyster Metrics Workgroup.102 In the case of oysters, larger animals may be removed by fishing, predation or by disease. Estimates of biomass and reproductive capacity are both sensitive to the number of larger oysters in the population. These both show generally increasing trends in sanctuaries, indicating that there are
101 Hixon, M.A., Johnson, D.W., Sogard, S.M. 2014. BOFFFFs: on the importance of conserving old-growth age-structure in fishery populations. ICES Journal of Marine Science, 71 (8) 2171-2185.
102 Restoration Goals, Quantitative Metrics and Assessment Protocols for Evaluating Success on Restored Oyster Reef Sanctuaries. Report of the Oyster Metrics Workgroup Submitted to the Sustainable Fisheries Goal Implementation Team of the Chesapeake Bay Program. December 2011 http://www.chesapeakebay.net/channel_files/17932/oyster_restoration_success_metrics_final.pdf
Oyster Size Structure: Estimates of
biomass and of reproductive capacity
which are sensitive to numbers of larger
oysters in the population show generally
increasing trends in sanctuaries
indicating that the size distribution of
animals is expanding into larger shell
heights.
59
DRAFT REPORT – JULY 2016
older, larger oysters in sanctuary populations. Time series of shell heights for individual sanctuary areas are provided in Appendix A.
Environmental Conditions
Maryland’s Eyes on the Bay program has collected information on water quality since 1990 using fixed buoys throughout Maryland’s portion of Chesapeake Bay. The information includes measurements of salinity, water temperature, secchi depth (a measure of water clarity), total nitrogen, chlorophyll a, and total suspended solids (Table 4-3). Buoys are located within the following sanctuaries: Nanticoke River, Severn River, South River, Upper Chester River, Upper Choptank River, Manokin River, Magothy River and Plum Point. In all areas, water quality has been variable over time. Complex analyses requiring many years of data would be required to connect any positive trends in water quality to commensurate changes in nearby oyster populations. There are numerous studies underway in Harris Creek, Tred Avon, and Little Choptank rivers by federal and academic groups that should help evaluate the water quality impacts from restored oyster reefs.103 In addition, an Oyster BMP (Best Management Practices) Expert Panel has been established to review scientific research demonstrating removal of nutrients (e.g. total nitrogen) from the water column by oysters. This panel will also identify oyster practices for BMP consideration, develop a pollutant removal crediting framework, and determine pollutant removal effectiveness estimates for nutrients (nitrogen and phosphorus) where there is sufficient science.
103 National Oceanographic and Atmospheric Administration, US Army Corps of Engineers, Maryland Department of Natural Resources, Oyster Recovery Partnership. 2016. 2015 Oyster Restoration Implementation Update. Progress in the Choptank Complex (Harris Creek, Little Choptank River, and Tred Avon River Oyster Sanctuaries). http://dnr.maryland.gov/fisheries/Documents/2015_Choptank_Oyster_Implementation_Update_FINAL.pdf
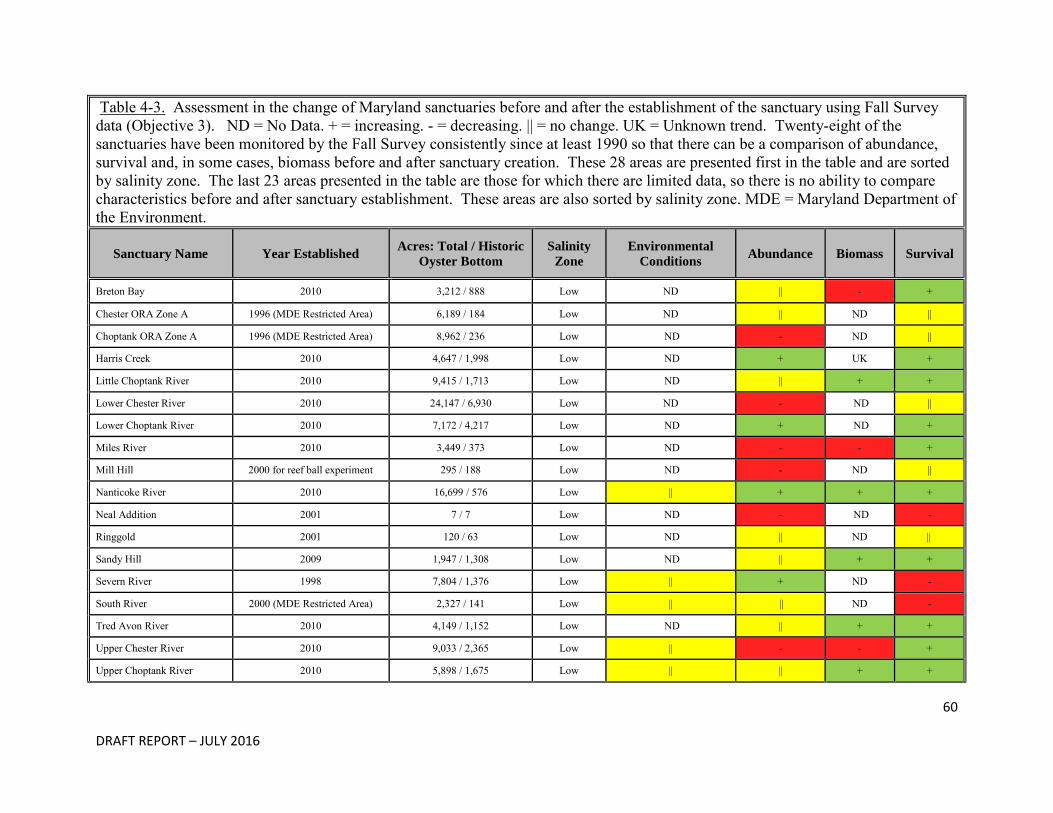
60
DRAFT REPORT – JULY 2016
Table 4-3. Assessment in the change of Maryland sanctuaries before and after the establishment of the sanctuary using Fall Survey data (Objective 3). ND = No Data. + = increasing. - = decreasing. || = no change. UK = Unknown trend. Twenty-eight of the sanctuaries have been monitored by the Fall Survey consistently since at least 1990 so that there can be a comparison of abundance, survival and, in some cases, biomass before and after sanctuary creation. These 28 areas are presented first in the table and are sorted by salinity zone. The last 23 areas presented in the table are those for which there are limited data, so there is no ability to compare characteristics before and after sanctuary establishment. These areas are also sorted by salinity zone. MDE = Maryland Department of the Environment.
Sanctuary Name Year Established Acres: Total / Historic
Oyster Bottom
Salinity
Zone
Environmental
Conditions Abundance Biomass Survival
Breton Bay 2010 3,212 / 888 Low ND || - +
Chester ORA Zone A 1996 (MDE Restricted Area) 6,189 / 184 Low ND || ND ||
Choptank ORA Zone A 1996 (MDE Restricted Area) 8,962 / 236 Low ND - ND ||
Harris Creek 2010 4,647 / 1,998 Low ND + UK +
Little Choptank River 2010 9,415 / 1,713 Low ND || + +
Lower Chester River 2010 24,147 / 6,930 Low ND - ND ||
Lower Choptank River 2010 7,172 / 4,217 Low ND + ND +
Miles River 2010 3,449 / 373 Low ND - - +
Mill Hill 2000 for reef ball experiment 295 / 188 Low ND - ND ||
Nanticoke River 2010 16,699 / 576 Low || + + +
Neal Addition 2001 7 / 7 Low ND - ND -
Ringgold 2001 120 / 63 Low ND || ND ||
Sandy Hill 2009 1,947 / 1,308 Low ND || + +
Severn River 1998 7,804 / 1,376 Low || + ND -
South River 2000 (MDE Restricted Area) 2,327 / 141 Low || || ND -
Tred Avon River 2010 4,149 / 1,152 Low ND || + +
Upper Chester River 2010 9,033 / 2,365 Low || - - +
Upper Choptank River 2010 5,898 / 1,675 Low || || + +
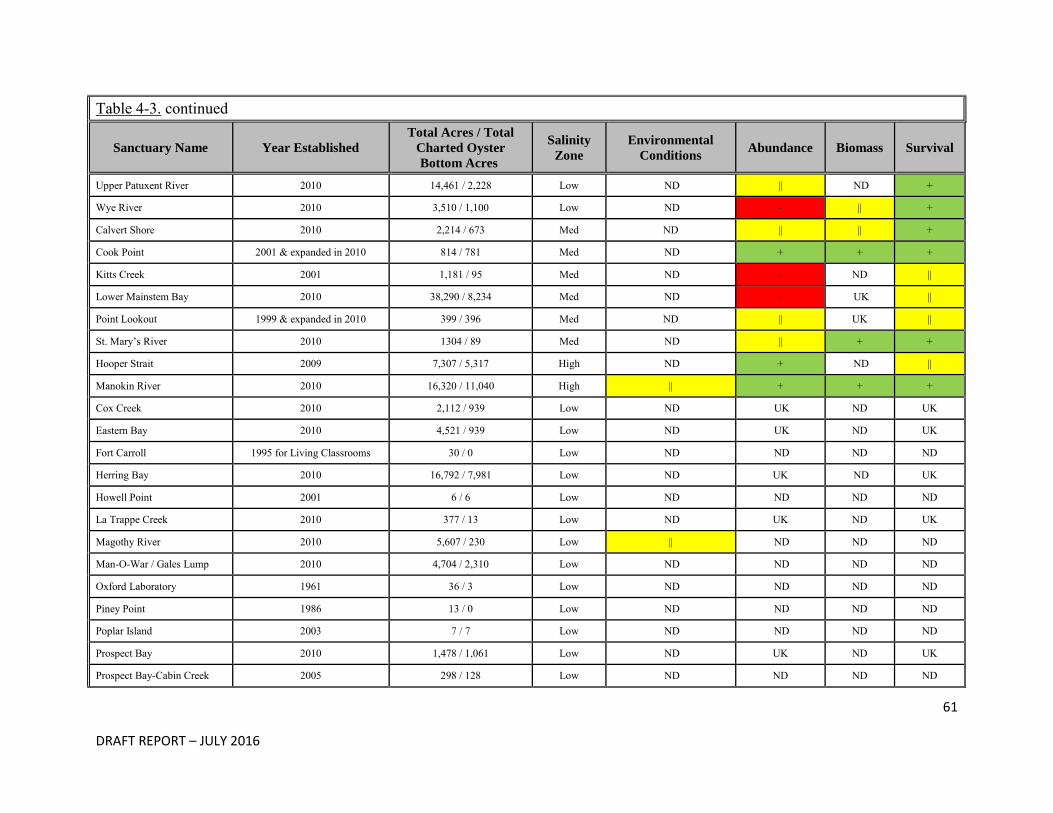
61
DRAFT REPORT – JULY 2016
Table 4-3. continued
Sanctuary Name Year Established
Total Acres / Total
Charted Oyster
Bottom Acres
Salinity
Zone
Environmental
Conditions Abundance Biomass Survival
Upper Patuxent River 2010 14,461 / 2,228 Low ND || ND +
Wye River 2010 3,510 / 1,100 Low ND - || +
Calvert Shore 2010 2,214 / 673 Med ND || || +
Cook Point 2001 & expanded in 2010 814 / 781 Med ND + + +
Kitts Creek 2001 1,181 / 95 Med ND - ND ||
Lower Mainstem Bay 2010 38,290 / 8,234 Med ND - UK ||
Point Lookout 1999 & expanded in 2010 399 / 396 Med ND || UK ||
St. Mary’s River 2010 1304 / 89 Med ND || + +
Hooper Strait 2009 7,307 / 5,317 High ND + ND ||
Manokin River 2010 16,320 / 11,040 High || + + +
Cox Creek 2010 2,112 / 939 Low ND UK ND UK
Eastern Bay 2010 4,521 / 939 Low ND UK ND UK
Fort Carroll 1995 for Living Classrooms 30 / 0 Low ND ND ND ND
Herring Bay 2010 16,792 / 7,981 Low ND UK ND UK
Howell Point 2001 6 / 6 Low ND ND ND ND
La Trappe Creek 2010 377 / 13 Low ND UK ND UK
Magothy River 2010 5,607 / 230 Low || ND ND ND
Man-O-War / Gales Lump 2010 4,704 / 2,310 Low ND ND ND ND
Oxford Laboratory 1961 36 / 3 Low ND ND ND ND
Piney Point 1986 13 / 0 Low ND ND ND ND
Poplar Island 2003 7 / 7 Low ND ND ND ND
Prospect Bay 2010 1,478 / 1,061 Low ND UK ND UK
Prospect Bay-Cabin Creek 2005 298 / 128 Low ND ND ND ND
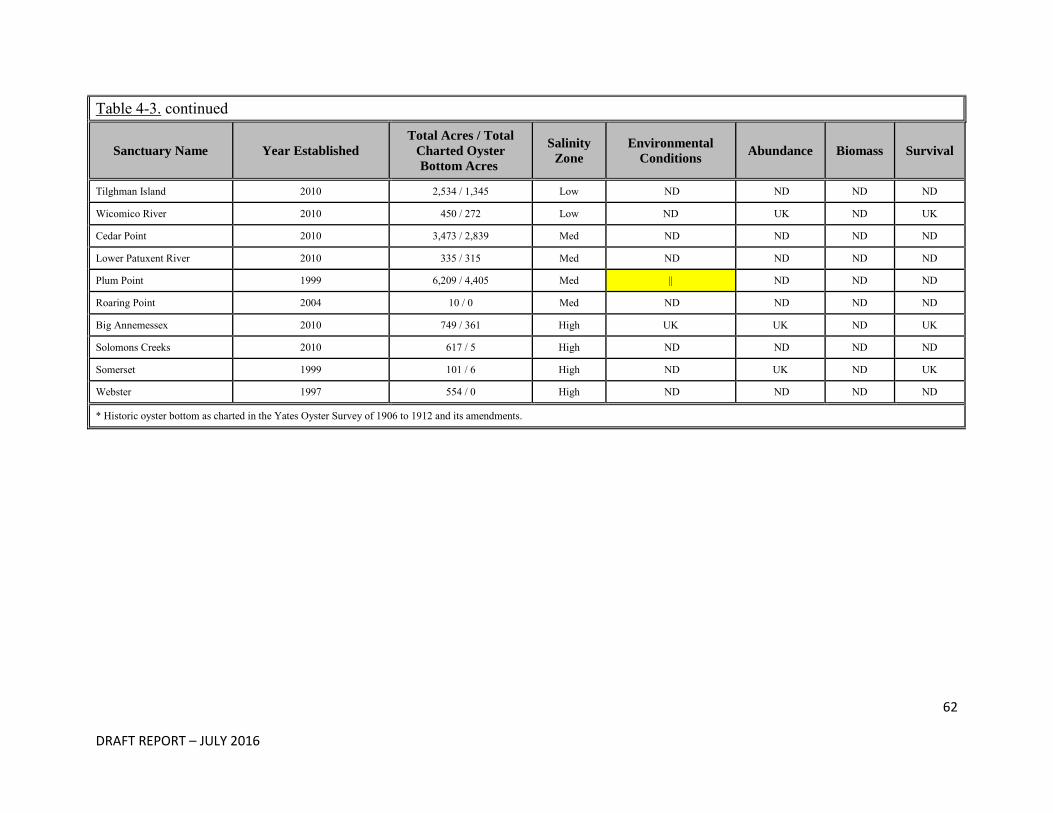
62
DRAFT REPORT – JULY 2016
Table 4-3. continued
Sanctuary Name Year Established
Total Acres / Total
Charted Oyster
Bottom Acres
Salinity
Zone
Environmental
Conditions Abundance Biomass Survival
Tilghman Island 2010 2,534 / 1,345 Low ND ND ND ND
Wicomico River 2010 450 / 272 Low ND UK ND UK
Cedar Point 2010 3,473 / 2,839 Med ND ND ND ND
Lower Patuxent River 2010 335 / 315 Med ND ND ND ND
Plum Point 1999 6,209 / 4,405 Med || ND ND ND
Roaring Point 2004 10 / 0 Med ND ND ND ND
Big Annemessex 2010 749 / 361 High UK UK ND UK
Solomons Creeks 2010 617 / 5 High ND ND ND ND
Somerset 1999 101 / 6 High ND UK ND UK
Webster 1997 554 / 0 High ND ND ND ND
* Historic oyster bottom as charted in the Yates Oyster Survey of 1906 to 1912 and its amendments.
63
DRAFT REPORT – JULY 2016
Sanctuary Objective #3 status: It is too
early to conclude that sanctuary oyster bars
are providing more ecological services than
harvest bars. However, the proxy indicators
survival, abundance and biomass have
generally shown stable or increasing trends
in sanctuaries. Rising biomass in many
cases reflects the expansion of the size
distribution of oysters into larger shell
heights which increases reproductive
capacity. The expansion of age-structure is
more common in non-harvest areas.
Summary Sanctuary Objective – Ecological Services
It is too early to conclude that sanctuary oyster bars are providing more ecological services than harvest bars. However, the proxy indicators survival, abundance and biomass have generally shown stable or increasing trends in sanctuaries. Rising biomass is often due to more older, larger oysters, which increases reproductive capacity and also fulfills the restoration metric of multiple ages present on an oyster bar.104 The expansion of age-structure is more common in non-harvest areas. Favorable climatic conditions over the last five years (absence of drought conditions) most likely have reduced disease mortality so that oyster bars located across salinity zones have shown similar increases in biomass, although other disease-related factors mentioned in section 4.2.2 should not be ruled out. Future trends of oyster populations on these bars will be dependent on climatic conditions in the coming years. The salinity zone in which these bars are located will become important if and when climatic conditions shift to favor high disease mortality. In low salinity areas where oysters have a refuge from disease mortality there will be a reservoir of older oysters, although the reproductive potential of these oysters will be lessened because of lower salinities. In medium and high salinity areas, a disease event would likely cause a decline in biomass, but the substrate (shells) left by the relatively high abundance of large oysters will provide substrate for larval attachment. Those oysters that survive the disease challenge will have high reproductive potential. Significant projects have been implemented to restore both oyster habitat and oyster populations in three sanctuaries: Harris Creek, Tred Avon River, and Little Choptank River. So far, results are positive, and studies to measure ecological services are underway.105 In Harris Creek, monitoring conducted in late 2015 by academic and federal partners indicated that 100% of the oyster reefs seeded in 2012 currently meet the threshold success criterion (15 oysters per square meter over 30% of the bottom), and 50% meet the higher target criterion of 50 oysters per square meter.106,107 One
104 Oyster Metrics Workgroup. 2011. Restoration Goals, Quantitative Metrics and Assessment Protocols for Evaluating Success on Restored Oyster Reef Sanctuaries. Prepared for the Sustainable Fisheries Goal Implementation Team of the Chesapeake Bay Program. http://www.chesapeakebay.net/channel_files/17932/oyster_restoration_success_metrics_final.pdf
105 http://chesapeakebay.noaa.gov/images/stories/habitats/choptankoysterupdate2014.pdf
106 National Oceanographic and Atmospheric Administration, US Army Corps of Engineers, Maryland Department of Natural Resources, Oyster Recovery Partnership. 2016. 2015 Oyster Restoration Implementation Update. Progress in the Choptank Complex (Harris Creek, Little Choptank River, and Tred Avon River Oyster Sanctuaries). http://dnr.maryland.gov/fisheries/Documents/2015_Choptank_Oyster_Implementation_Update_FINAL.pdf
64
DRAFT REPORT – JULY 2016
Harris Creek stone reef planted in 2013 was sampled in 2015 and the data show that oyster density on this reef is more than three times that of any other reef site monitored in Harris Creek.108 Numerous studies are underway that will help quantify the effectiveness of various restoration techniques. These are described in detail in the 2015 Oyster Implementation Update.109 Quantifying the provision of ecological services by oyster sanctuary reefs will take decades, and must account for climate, spat settlement, disease, mortality, salinity, shell accumulation and sedimentation. Oyster reefs present in Chesapeake Bay grew over centuries so that by the late 1880’s the Chesapeake Bay was the greatest oyster-producing region in the world.110 The degradation of the oyster resource occurred over at least 150 years. Hence it is unrealistic to expect a reversal within a decade.111
107 Oyster Metrics Workgroup. 2011. Restoration Goals, Quantitative Metrics and Assessment Protocols for Evaluating Success on Restored Oyster Reef Sanctuaries. Prepared for the Sustainable Fisheries Goal Implementation Team of the Chesapeake Bay Program. http://www.chesapeakebay.net/channel_files/17932/oyster_restoration_success_metrics_final.pdf
108National Oceanographic and Atmospheric Administration, US Army Corps of Engineers, Maryland Department of Natural Resources, Oyster Recovery Partnership. 2016. 2015 Oyster Restoration Implementation Update. Progress in the Choptank Complex (Harris Creek, Little Choptank River, and Tred Avon River Oyster Sanctuaries). http://dnr.maryland.gov/fisheries/Documents/2015_Choptank_Oyster_Implementation_Update_FINAL.pdf
109 http://www.chesapeakebay.noaa.gov/images/stories/hottopics/2015choptankoysterrestorationupdate.pdf
110National Research Council. 2004. Non native Oysters in the Chesapeake Bay. 344 pages
111 IBID
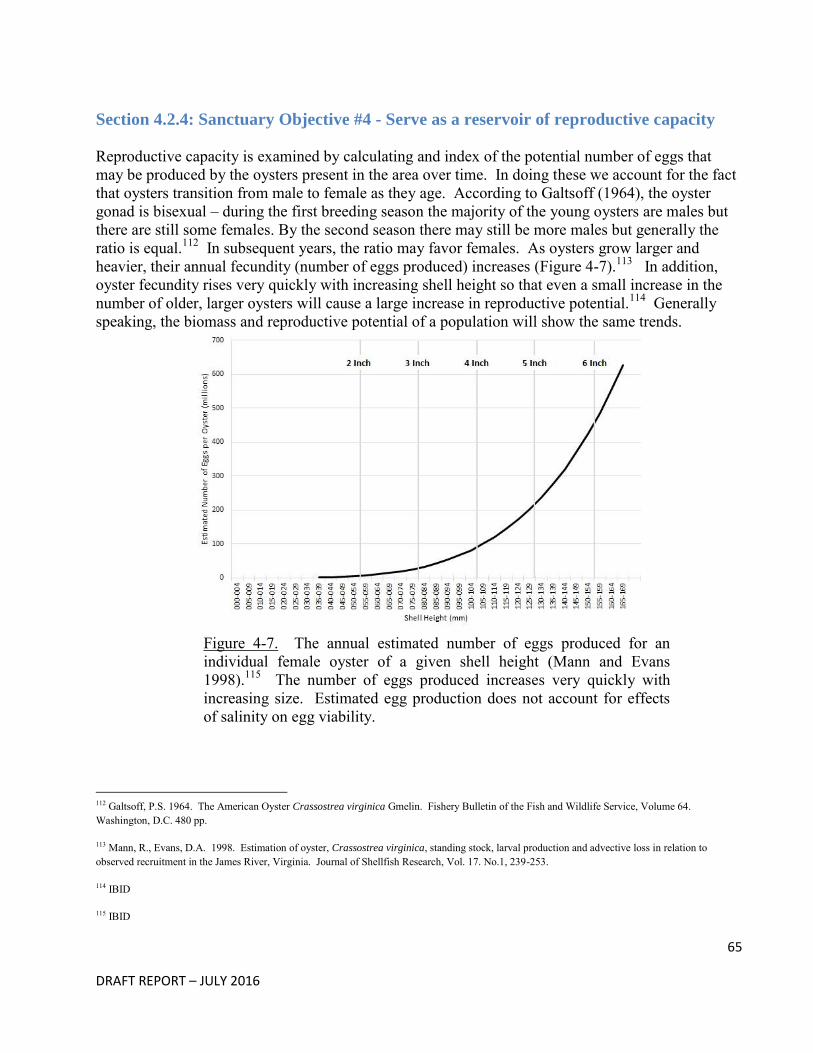
65
DRAFT REPORT – JULY 2016
Section 4.2.4: Sanctuary Objective #4 - Serve as a reservoir of reproductive capacity Reproductive capacity is examined by calculating and index of the potential number of eggs that may be produced by the oysters present in the area over time. In doing these we account for the fact that oysters transition from male to female as they age. According to Galtsoff (1964), the oyster gonad is bisexual – during the first breeding season the majority of the young oysters are males but there are still some females. By the second season there may still be more males but generally the ratio is equal.112 In subsequent years, the ratio may favor females. As oysters grow larger and heavier, their annual fecundity (number of eggs produced) increases (Figure 4-7).113 In addition, oyster fecundity rises very quickly with increasing shell height so that even a small increase in the number of older, larger oysters will cause a large increase in reproductive potential.114 Generally speaking, the biomass and reproductive potential of a population will show the same trends.
Figure 4-7. The annual estimated number of eggs produced for an individual female oyster of a given shell height (Mann and Evans 1998).115 The number of eggs produced increases very quickly with increasing size. Estimated egg production does not account for effects of salinity on egg viability.
112 Galtsoff, P.S. 1964. The American Oyster Crassostrea virginica Gmelin. Fishery Bulletin of the Fish and Wildlife Service, Volume 64. Washington, D.C. 480 pp.
113 Mann, R., Evans, D.A. 1998. Estimation of oyster, Crassostrea virginica, standing stock, larval production and advective loss in relation to observed recruitment in the James River, Virginia. Journal of Shellfish Research, Vol. 17. No.1, 239-253.
114 IBID
115 IBID
66
DRAFT REPORT – JULY 2016
Sanctuary Objective #4 Status: The
overall reproductive potential in
sanctuaries has increased in recent years
with 2015 being the highest value in the
26-year time series. While reproductive
potential has increased, it is not beneficial
unless there are enough oysters in an area
for successful fertilization. Even if
fertilization is successful, the fate of the
larvae is not guaranteed.
Following the Mann and Evans model to calculate egg production116, we added a factor that decreases oyster egg viability in lower salinity zones. There is some evidence that oysters that are habituated to low salinity do not experience diminished egg viability.117 However, including this factor provides a lower-end estimate of egg production. Following Galtsoff (1964)118, we assume that the sex ratio of oysters is 50% male, 50% female. An index of reproductive potential can be calculated for the 43 “disease bars” sampled in the Fall Survey, the same areas for which we calculated indices of biomass.119 Estimates of reproductive potential are available for 12 of the 51 sanctuaries. The overall reproductive potential in sanctuaries has increased in recent years with 2015 being the highest value in the 26-year time series (Figure 4-8). While reproductive potential has increased, it is not beneficial unless there are enough oysters in an area for successful fertilization. Even if fertilization is successful, the fate of the larvae is not guaranteed. Efforts are currently underway to determine how much sanctuary area has enough oysters for successful fertilization. Sanctuary location appears to affect reproductive potential. Low salinity sanctuaries located in the Nanticoke, Wye, Middle Choptank, Little Choptank and Tred Avon rivers show rapidly increasing reproductive potential since 2010, and reproductive potential in each of these sanctuaries reached the highest level in 26 years in one of the last three years (Figure 4-9). Low salinity sanctuaries in the Upper Chester, Upper Choptank and Miles Rivers show less promising results. In the Upper Chester and the Upper Choptank Rivers, reproductive potential has changed little throughout the time series, although the Upper Choptank did see a rise in recent years and in 2015 achieved the highest value of the time series. Reproductive potential in the Miles River was higher and variable during the early part of the time series, but remained flat at very low levels between 2008 and 2014. A rise occurred in 2015, although this value is well below earlier values in the time series (Figure 4-9)
116 Mann, R., Evans, D.A. 1998. Estimation of oyster, Crassostrea virginica, standing stock, larval production and advective loss in relation to observed recruitment in the James River, Virginia. Journal of Shellfish Research, Vol. 17. No.1, 239-253.
117 Davis, H.C. 1958. Survival and growth of clam and oyster larvae at different salinities. Biological Bulletin. 114:296-301.
118 Galtsoff, P.S. 1964. The American Oyster Crassostrea virginica Gmelin. Fishery Bulletin of the Fish and Wildlife Service, Volume 64. Washington, D.C. 480 pp.
119 Tarnowski, M. (ed.) 2015. Maryland Oyster Population Status Report: 2014 Fall Survey. Maryland Department of Natural Resources, Annapolis, MD, # 17-782015-769, 68 pp.
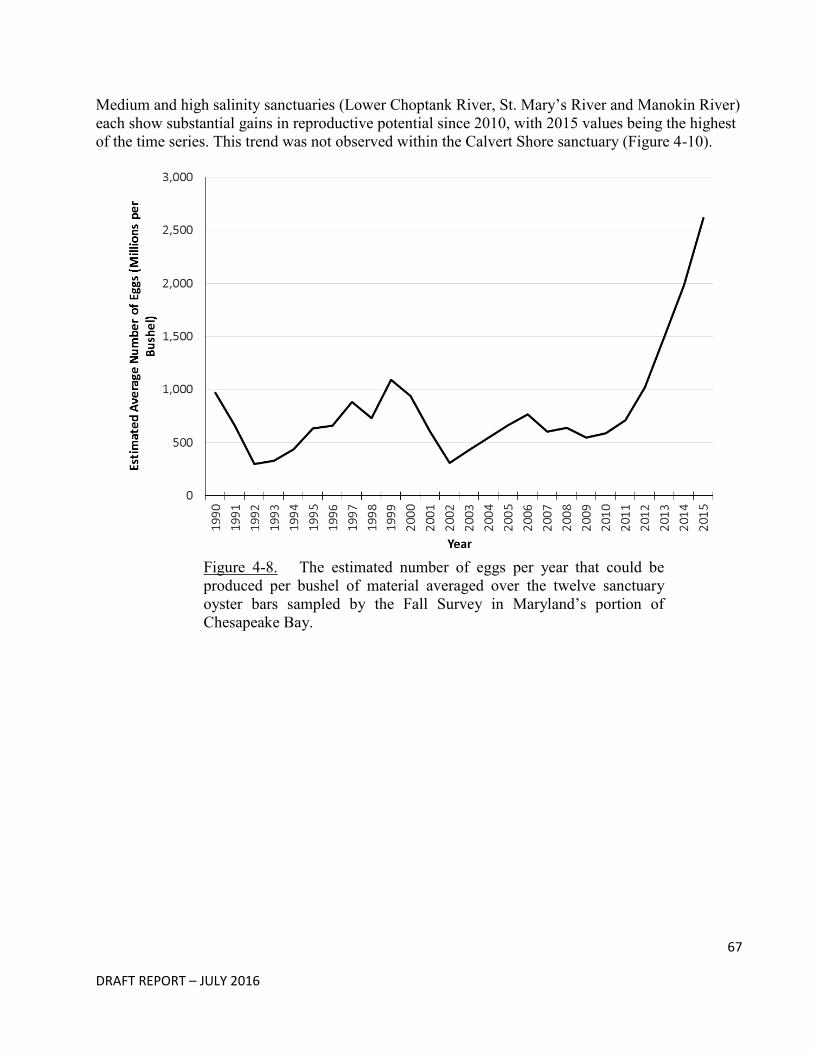
67
DRAFT REPORT – JULY 2016
Medium and high salinity sanctuaries (Lower Choptank River, St. Mary’s River and Manokin River) each show substantial gains in reproductive potential since 2010, with 2015 values being the highest of the time series. This trend was not observed within the Calvert Shore sanctuary (Figure 4-10).
Figure 4-8. The estimated number of eggs per year that could be produced per bushel of material averaged over the twelve sanctuary oyster bars sampled by the Fall Survey in Maryland’s portion of Chesapeake Bay.
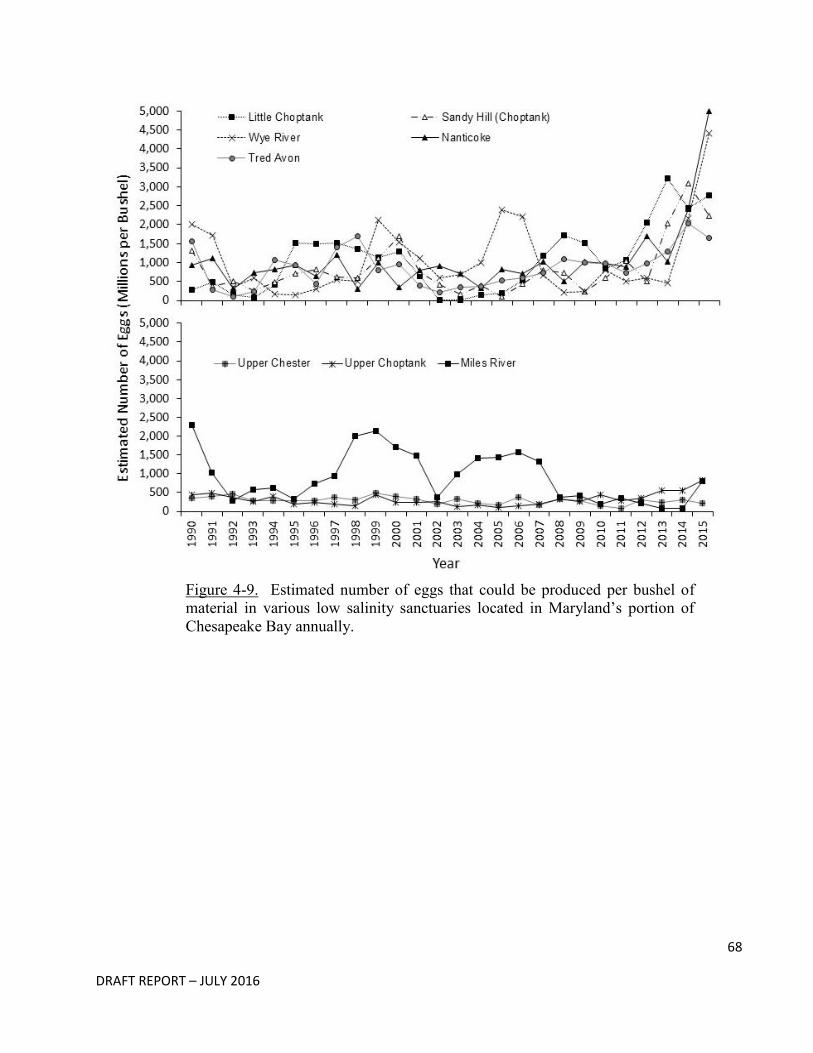
68
DRAFT REPORT – JULY 2016
Figure 4-9. Estimated number of eggs that could be produced per bushel of material in various low salinity sanctuaries located in Maryland’s portion of Chesapeake Bay annually.
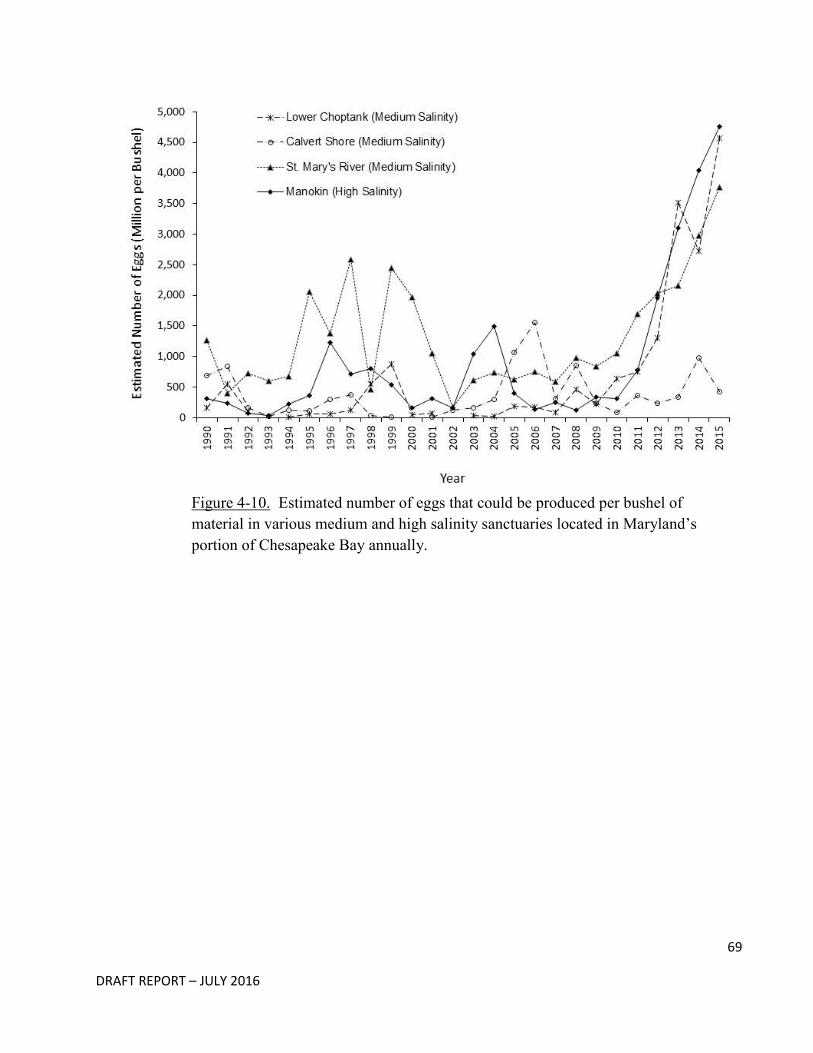
69
DRAFT REPORT – JULY 2016
Figure 4-10. Estimated number of eggs that could be produced per bushel of material in various medium and high salinity sanctuaries located in Maryland’s portion of Chesapeake Bay annually.
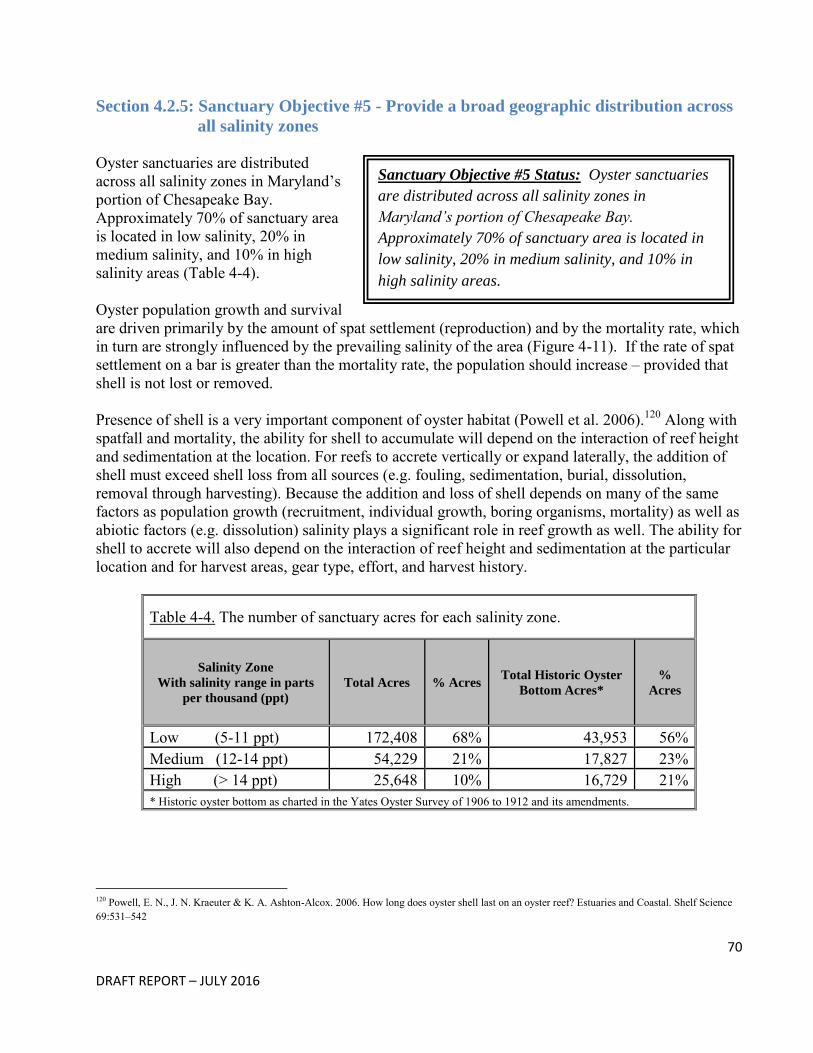
70
DRAFT REPORT – JULY 2016
Section 4.2.5: Sanctuary Objective #5 - Provide a broad geographic distribution across
all salinity zones Oyster sanctuaries are distributed across all salinity zones in Maryland’s portion of Chesapeake Bay. Approximately 70% of sanctuary area is located in low salinity, 20% in medium salinity, and 10% in high salinity areas (Table 4-4). Oyster population growth and survival are driven primarily by the amount of spat settlement (reproduction) and by the mortality rate, which in turn are strongly influenced by the prevailing salinity of the area (Figure 4-11). If the rate of spat settlement on a bar is greater than the mortality rate, the population should increase – provided that shell is not lost or removed. Presence of shell is a very important component of oyster habitat (Powell et al. 2006).120 Along with spatfall and mortality, the ability for shell to accumulate will depend on the interaction of reef height and sedimentation at the location. For reefs to accrete vertically or expand laterally, the addition of shell must exceed shell loss from all sources (e.g. fouling, sedimentation, burial, dissolution, removal through harvesting). Because the addition and loss of shell depends on many of the same factors as population growth (recruitment, individual growth, boring organisms, mortality) as well as abiotic factors (e.g. dissolution) salinity plays a significant role in reef growth as well. The ability for shell to accrete will also depend on the interaction of reef height and sedimentation at the particular location and for harvest areas, gear type, effort, and harvest history.
Table 4-4. The number of sanctuary acres for each salinity zone.
Salinity Zone
With salinity range in parts
per thousand (ppt) Total Acres % Acres Total Historic Oyster
Bottom Acres* %
Acres
Low (5-11 ppt) 172,408 68% 43,953 56% Medium (12-14 ppt) 54,229 21% 17,827 23% High (> 14 ppt) 25,648 10% 16,729 21% * Historic oyster bottom as charted in the Yates Oyster Survey of 1906 to 1912 and its amendments.
120 Powell, E. N., J. N. Kraeuter & K. A. Ashton-Alcox. 2006. How long does oyster shell last on an oyster reef? Estuaries and Coastal. Shelf Science 69:531–542
Sanctuary Objective #5 Status: Oyster sanctuaries
are distributed across all salinity zones in
Maryland’s portion of Chesapeake Bay.
Approximately 70% of sanctuary area is located in
low salinity, 20% in medium salinity, and 10% in
high salinity areas.
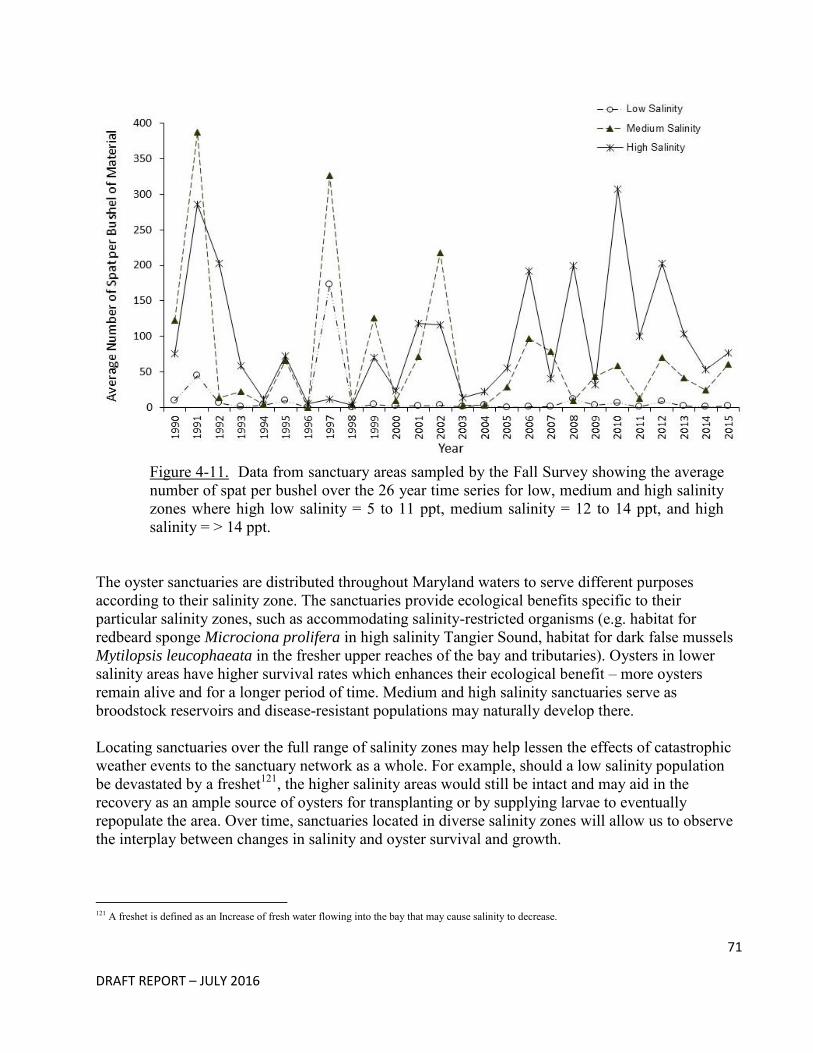
71
DRAFT REPORT – JULY 2016
Figure 4-11. Data from sanctuary areas sampled by the Fall Survey showing the average number of spat per bushel over the 26 year time series for low, medium and high salinity zones where high low salinity = 5 to 11 ppt, medium salinity = 12 to 14 ppt, and high salinity = > 14 ppt.
The oyster sanctuaries are distributed throughout Maryland waters to serve different purposes according to their salinity zone. The sanctuaries provide ecological benefits specific to their particular salinity zones, such as accommodating salinity-restricted organisms (e.g. habitat for redbeard sponge Microciona prolifera in high salinity Tangier Sound, habitat for dark false mussels Mytilopsis leucophaeata in the fresher upper reaches of the bay and tributaries). Oysters in lower salinity areas have higher survival rates which enhances their ecological benefit – more oysters remain alive and for a longer period of time. Medium and high salinity sanctuaries serve as broodstock reservoirs and disease-resistant populations may naturally develop there. Locating sanctuaries over the full range of salinity zones may help lessen the effects of catastrophic weather events to the sanctuary network as a whole. For example, should a low salinity population be devastated by a freshet121, the higher salinity areas would still be intact and may aid in the recovery as an ample source of oysters for transplanting or by supplying larvae to eventually repopulate the area. Over time, sanctuaries located in diverse salinity zones will allow us to observe the interplay between changes in salinity and oyster survival and growth.
121 A freshet is defined as an Increase of fresh water flowing into the bay that may cause salinity to decrease.
72
DRAFT REPORT – JULY 2016
Sanctuary Objective #6 Status: The ability
to protect sanctuaries from poaching has
increased with the establishment of larger
sanctuary areas, implementation of MLEIN,
and the DNR’s ability to suspend licenses
administratively with the points system for
multiple sanctuary violations.
Section 4.2.6: Sanctuary Objective #6 - Increase our [DNR] ability to protect these
important areas from poaching A small sanctuary that is in an isolated area or located within or in close proximity to a harvest area is more difficult to enforce than a larger sanctuary that includes the interconnecting non-oyster habitat bottom between oyster bars. This design makes it more difficult for poachers to quickly enter the sanctuary and return to a harvest area. In 2010, many of the new sanctuaries followed this design, and by encompassing the entire or large parts of tributaries. Furthermore, the implementation of MLEIN (Maritime Law Enforcement Information Network) was created in 2010. MLEIN consist of radar monitoring, video surveillance, and advanced software that allows the Natural Resource Police to improve enforcement of sanctuaries. Another factor that may have decreased poaching was DNR 's ability to suspend or revoke licenses administratively. In 2010, DNR revised its penalty system to assign points to a licensee's licensing record based on being convicted of certain individual offenses, with more points resulting in more significant suspensions and ultimately permanent revocation from the commercial fishery. Also, in 2011 DNR was given the ability to revoke an oyster authorization on issuance of a citation for certain oyster violations, including being inside of an oyster sanctuary by more than 200 feet. This authority allowed DNR to take certain egregious offenders off the water more quickly than the points system, which requires a conviction in criminal court and may be delayed by months after the offense. The current suspension and revocation system is designed to act as a deterrent to criminal activities such as poaching in sanctuaries.
73
DRAFT REPORT – JULY 2016
Section 4.3: Public Shellfish Fishery Areas
There are 39 distinct areas where oyster harvest is reported from PSFAs. These areas, referred to as NOAA Codes, represent the spatial units used by DNR and the oyster industry to report harvest (Table 4-5). Each NOAA Code area may contain multiple PSFAs. Of the 39 NOAA Code areas, 30 encompass PSFAs that been consistently monitored by the Fall Survey since at least 1990 (Table 4-5). Fall Survey data used to characterize the productivity of NOAA Codes were collected only in non-sanctuary areas within the NOAA Code. Data collected in sanctuary areas within the NOAA Codes were not included.
As in sanctuary areas, survival generally increased in the NOAA Codes. Only one area, the Upper Chesapeake Bay, had decreased survival since 2010. Total oyster abundance increased in 12 out of 30 (40%) in the NOAA Codes. Biomass estimates for the 26-year time series beginning in 1990 are available for 24 of the 39 in the NOAA Codes. Some NOAA Codes have multiple bars that were sampled for biomass. Overall biomass increased from 2010 to 2013 and then decreased in 2014 and 2015 (Figure 4-12). This is a somewhat different result than was observed in sanctuaries where biomass has continued to increase through 2015. The pattern for these fished areas probably shows the growth and harvest of the large 2010 and 2012 spat sets. There can be annual variation in biomass within the fished areas. For example, some of the bars on the eastern shore (Eastern Bay and Choptank River) show slightly different changes in biomass over time (Figure 4-13).
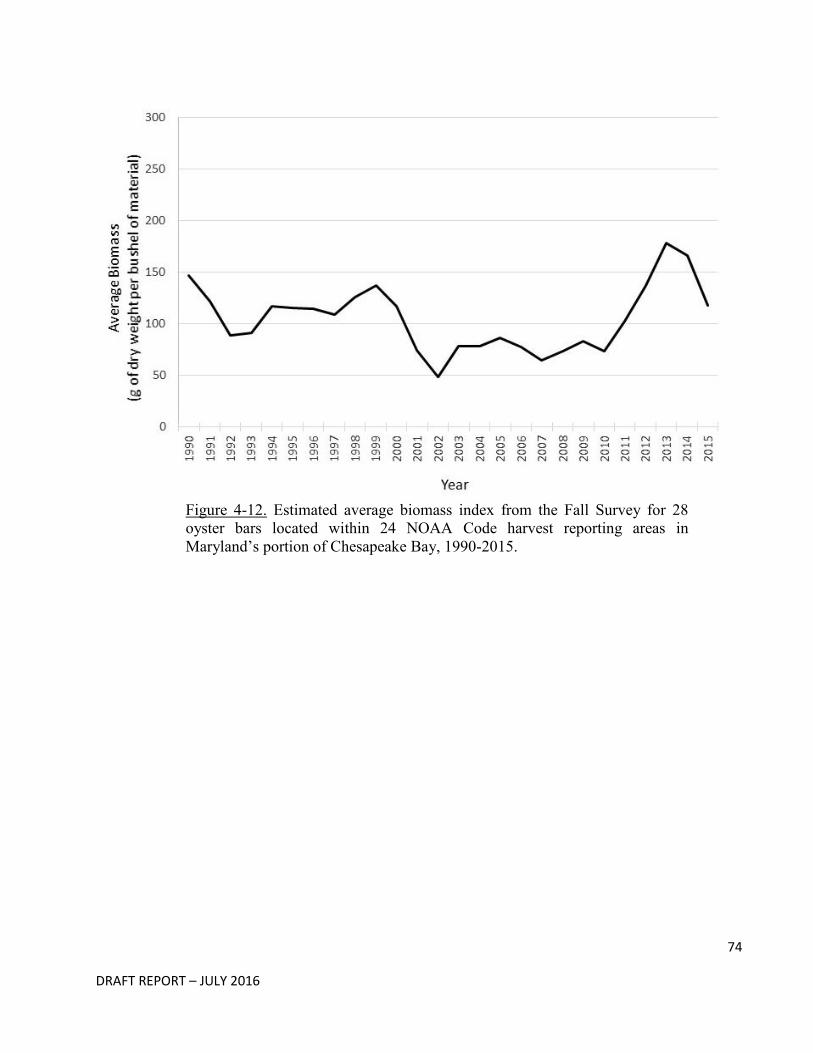
74
DRAFT REPORT – JULY 2016
Figure 4-12. Estimated average biomass index from the Fall Survey for 28 oyster bars located within 24 NOAA Code harvest reporting areas in Maryland’s portion of Chesapeake Bay, 1990-2015.
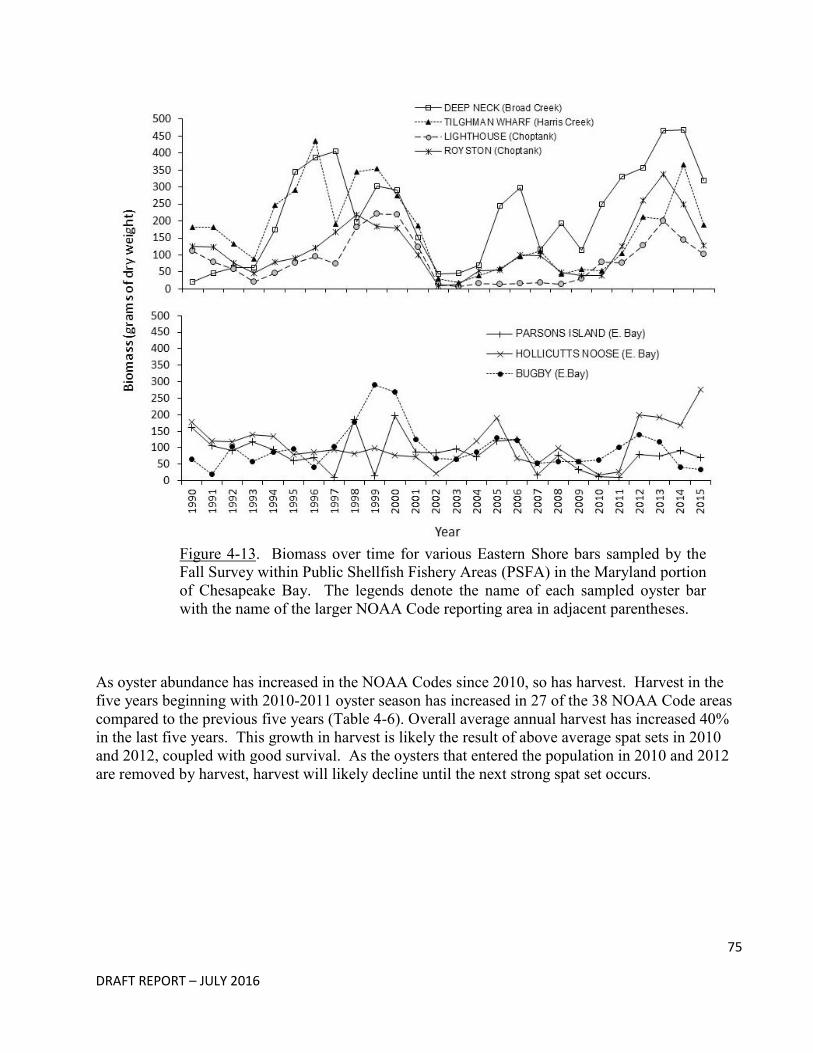
75
DRAFT REPORT – JULY 2016
Figure 4-13. Biomass over time for various Eastern Shore bars sampled by the Fall Survey within Public Shellfish Fishery Areas (PSFA) in the Maryland portion of Chesapeake Bay. The legends denote the name of each sampled oyster bar with the name of the larger NOAA Code reporting area in adjacent parentheses.
As oyster abundance has increased in the NOAA Codes since 2010, so has harvest. Harvest in the five years beginning with 2010-2011 oyster season has increased in 27 of the 38 NOAA Code areas compared to the previous five years (Table 4-6). Overall average annual harvest has increased 40% in the last five years. This growth in harvest is likely the result of above average spat sets in 2010 and 2012, coupled with good survival. As the oysters that entered the population in 2010 and 2012 are removed by harvest, harvest will likely decline until the next strong spat set occurs.
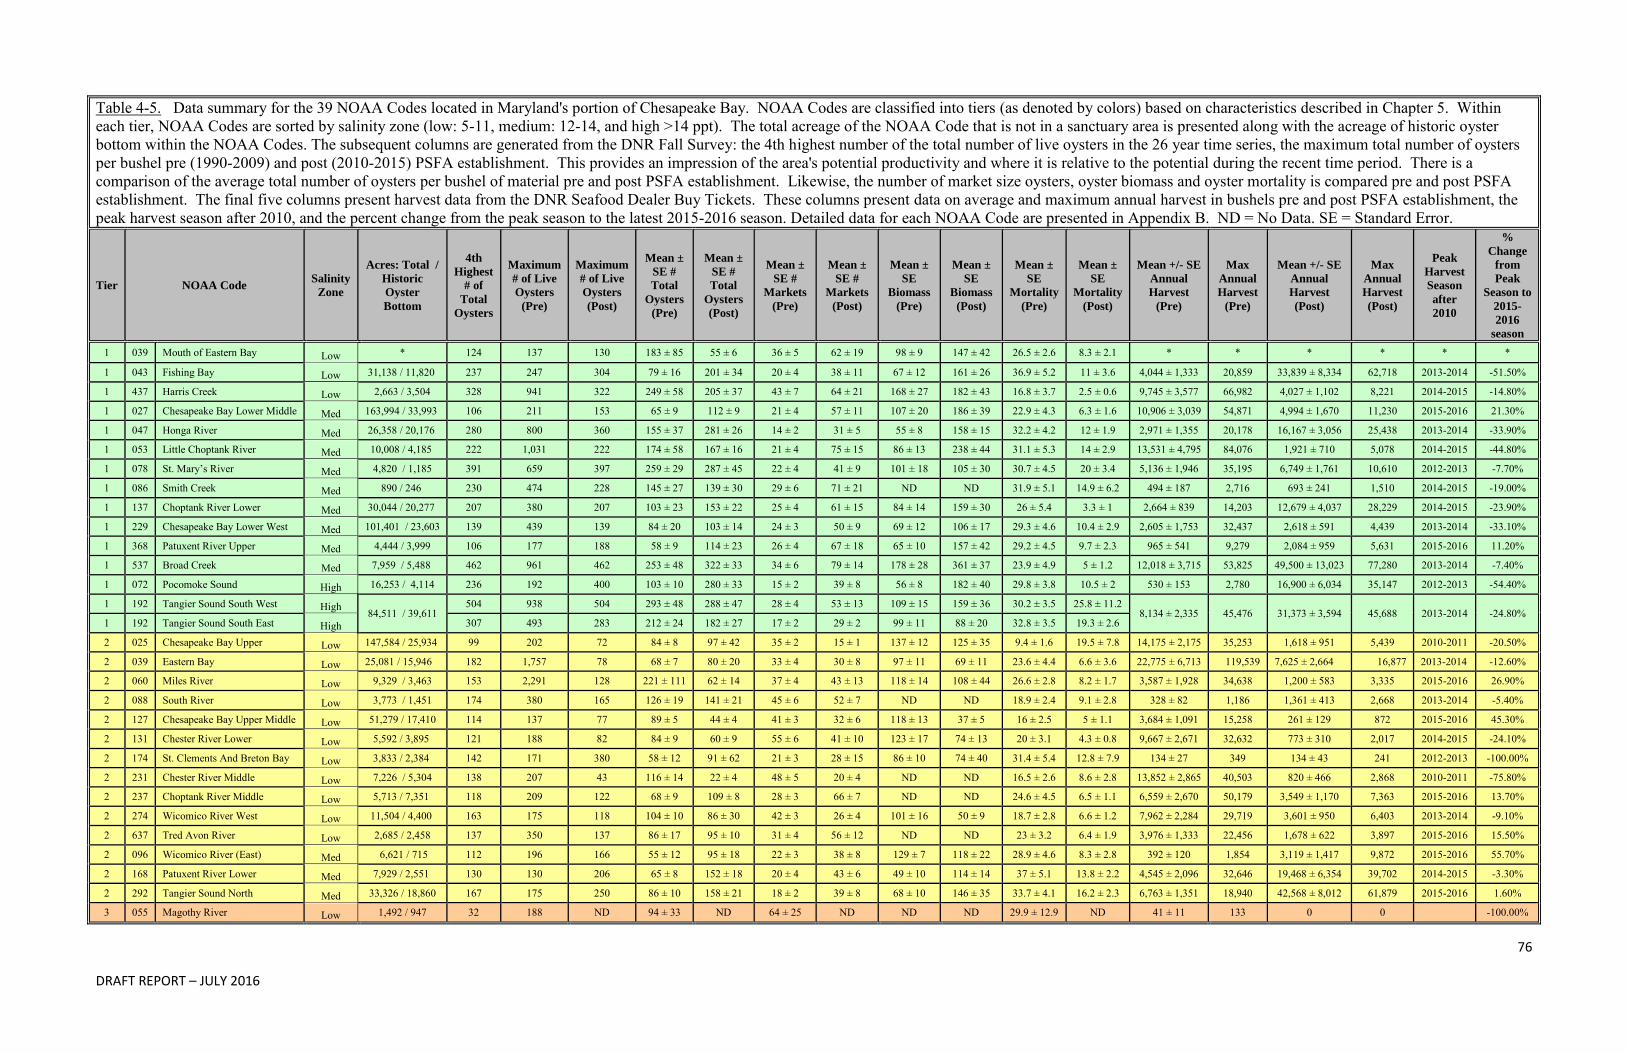
76
DRAFT REPORT – JULY 2016
Table 4-5. Data summary for the 39 NOAA Codes located in Maryland's portion of Chesapeake Bay. NOAA Codes are classified into tiers (as denoted by colors) based on characteristics described in Chapter 5. Within each tier, NOAA Codes are sorted by salinity zone (low: 5-11, medium: 12-14, and high >14 ppt). The total acreage of the NOAA Code that is not in a sanctuary area is presented along with the acreage of historic oyster bottom within the NOAA Codes. The subsequent columns are generated from the DNR Fall Survey: the 4th highest number of the total number of live oysters in the 26 year time series, the maximum total number of oysters per bushel pre (1990-2009) and post (2010-2015) PSFA establishment. This provides an impression of the area's potential productivity and where it is relative to the potential during the recent time period. There is a comparison of the average total number of oysters per bushel of material pre and post PSFA establishment. Likewise, the number of market size oysters, oyster biomass and oyster mortality is compared pre and post PSFA establishment. The final five columns present harvest data from the DNR Seafood Dealer Buy Tickets. These columns present data on average and maximum annual harvest in bushels pre and post PSFA establishment, the peak harvest season after 2010, and the percent change from the peak season to the latest 2015-2016 season. Detailed data for each NOAA Code are presented in Appendix B. ND = No Data. SE = Standard Error.
Tier NOAA Code Salinity
Zone
Acres: Total /
Historic
Oyster
Bottom
4th
Highest
# of
Total
Oysters
Maximum
# of Live
Oysters
(Pre)
Maximum
# of Live
Oysters
(Post)
Mean ±
SE #
Total
Oysters
(Pre)
Mean ±
SE #
Total
Oysters
(Post)
Mean ±
SE #
Markets
(Pre)
Mean ±
SE #
Markets
(Post)
Mean ±
SE
Biomass
(Pre)
Mean ±
SE
Biomass
(Post)
Mean ±
SE
Mortality
(Pre)
Mean ±
SE
Mortality
(Post)
Mean +/- SE
Annual
Harvest
(Pre)
Max
Annual
Harvest
(Pre)
Mean +/- SE
Annual
Harvest
(Post)
Max
Annual
Harvest
(Post)
Peak
Harvest
Season
after
2010
%
Change
from
Peak
Season to
2015-
2016
season
1 039 Mouth of Eastern Bay Low * 124 137 130 183 ± 85 55 ± 6 36 ± 5 62 ± 19 98 ± 9 147 ± 42 26.5 ± 2.6 8.3 ± 2.1 * * * * * *
1 043 Fishing Bay Low 31,138 / 11,820 237 247 304 79 ± 16 201 ± 34 20 ± 4 38 ± 11 67 ± 12 161 ± 26 36.9 ± 5.2 11 ± 3.6 4,044 ± 1,333 20,859 33,839 ± 8,334 62,718 2013-2014 -51.50%
1 437 Harris Creek Low 2,663 / 3,504 328 941 322 249 ± 58 205 ± 37 43 ± 7 64 ± 21 168 ± 27 182 ± 43 16.8 ± 3.7 2.5 ± 0.6 9,745 ± 3,577 66,982 4,027 ± 1,102 8,221 2014-2015 -14.80%
1 027 Chesapeake Bay Lower Middle Med 163,994 / 33,993 106 211 153 65 ± 9 112 ± 9 21 ± 4 57 ± 11 107 ± 20 186 ± 39 22.9 ± 4.3 6.3 ± 1.6 10,906 ± 3,039 54,871 4,994 ± 1,670 11,230 2015-2016 21.30%
1 047 Honga River Med 26,358 / 20,176 280 800 360 155 ± 37 281 ± 26 14 ± 2 31 ± 5 55 ± 8 158 ± 15 32.2 ± 4.2 12 ± 1.9 2,971 ± 1,355 20,178 16,167 ± 3,056 25,438 2013-2014 -33.90%
1 053 Little Choptank River Med 10,008 / 4,185 222 1,031 222 174 ± 58 167 ± 16 21 ± 4 75 ± 15 86 ± 13 238 ± 44 31.1 ± 5.3 14 ± 2.9 13,531 ± 4,795 84,076 1,921 ± 710 5,078 2014-2015 -44.80%
1 078 St. Mary’s River Med 4,820 / 1,185 391 659 397 259 ± 29 287 ± 45 22 ± 4 41 ± 9 101 ± 18 105 ± 30 30.7 ± 4.5 20 ± 3.4 5,136 ± 1,946 35,195 6,749 ± 1,761 10,610 2012-2013 -7.70%
1 086 Smith Creek Med 890 / 246 230 474 228 145 ± 27 139 ± 30 29 ± 6 71 ± 21 ND ND 31.9 ± 5.1 14.9 ± 6.2 494 ± 187 2,716 693 ± 241 1,510 2014-2015 -19.00%
1 137 Choptank River Lower Med 30,044 / 20,277 207 380 207 103 ± 23 153 ± 22 25 ± 4 61 ± 15 84 ± 14 159 ± 30 26 ± 5.4 3.3 ± 1 2,664 ± 839 14,203 12,679 ± 4,037 28,229 2014-2015 -23.90%
1 229 Chesapeake Bay Lower West Med 101,401 / 23,603 139 439 139 84 ± 20 103 ± 14 24 ± 3 50 ± 9 69 ± 12 106 ± 17 29.3 ± 4.6 10.4 ± 2.9 2,605 ± 1,753 32,437 2,618 ± 591 4,439 2013-2014 -33.10%
1 368 Patuxent River Upper Med 4,444 / 3,999 106 177 188 58 ± 9 114 ± 23 26 ± 4 67 ± 18 65 ± 10 157 ± 42 29.2 ± 4.5 9.7 ± 2.3 965 ± 541 9,279 2,084 ± 959 5,631 2015-2016 11.20%
1 537 Broad Creek Med 7,959 / 5,488 462 961 462 253 ± 48 322 ± 33 34 ± 6 79 ± 14 178 ± 28 361 ± 37 23.9 ± 4.9 5 ± 1.2 12,018 ± 3,715 53,825 49,500 ± 13,023 77,280 2013-2014 -7.40%
1 072 Pocomoke Sound High 16,253 / 4,114 236 192 400 103 ± 10 280 ± 33 15 ± 2 39 ± 8 56 ± 8 182 ± 40 29.8 ± 3.8 10.5 ± 2 530 ± 153 2,780 16,900 ± 6,034 35,147 2012-2013 -54.40%
1 192 Tangier Sound South West High 84,511 / 39,611 504 938 504 293 ± 48 288 ± 47 28 ± 4 53 ± 13 109 ± 15 159 ± 36 30.2 ± 3.5 25.8 ± 11.2
8,134 ± 2,335 45,476 31,373 ± 3,594 45,688 2013-2014 -24.80% 1 192 Tangier Sound South East High 307 493 283 212 ± 24 182 ± 27 17 ± 2 29 ± 2 99 ± 11 88 ± 20 32.8 ± 3.5 19.3 ± 2.6
2 025 Chesapeake Bay Upper Low 147,584 / 25,934 99 202 72 84 ± 8 97 ± 42 35 ± 2 15 ± 1 137 ± 12 125 ± 35 9.4 ± 1.6 19.5 ± 7.8 14,175 ± 2,175 35,253 1,618 ± 951 5,439 2010-2011 -20.50%
2 039 Eastern Bay Low 25,081 / 15,946 182 1,757 78 68 ± 7 80 ± 20 33 ± 4 30 ± 8 97 ± 11 69 ± 11 23.6 ± 4.4 6.6 ± 3.6 22,775 ± 6,713 119,539 7,625 ± 2,664 16,877 2013-2014 -12.60%
2 060 Miles River Low 9,329 / 3,463 153 2,291 128 221 ± 111 62 ± 14 37 ± 4 43 ± 13 118 ± 14 108 ± 44 26.6 ± 2.8 8.2 ± 1.7 3,587 ± 1,928 34,638 1,200 ± 583 3,335 2015-2016 26.90%
2 088 South River Low 3,773 / 1,451 174 380 165 126 ± 19 141 ± 21 45 ± 6 52 ± 7 ND ND 18.9 ± 2.4 9.1 ± 2.8 328 ± 82 1,186 1,361 ± 413 2,668 2013-2014 -5.40%
2 127 Chesapeake Bay Upper Middle Low 51,279 / 17,410 114 137 77 89 ± 5 44 ± 4 41 ± 3 32 ± 6 118 ± 13 37 ± 5 16 ± 2.5 5 ± 1.1 3,684 ± 1,091 15,258 261 ± 129 872 2015-2016 45.30%
2 131 Chester River Lower Low 5,592 / 3,895 121 188 82 84 ± 9 60 ± 9 55 ± 6 41 ± 10 123 ± 17 74 ± 13 20 ± 3.1 4.3 ± 0.8 9,667 ± 2,671 32,632 773 ± 310 2,017 2014-2015 -24.10%
2 174 St. Clements And Breton Bay Low 3,833 / 2,384 142 171 380 58 ± 12 91 ± 62 21 ± 3 28 ± 15 86 ± 10 74 ± 40 31.4 ± 5.4 12.8 ± 7.9 134 ± 27 349 134 ± 43 241 2012-2013 -100.00%
2 231 Chester River Middle Low 7,226 / 5,304 138 207 43 116 ± 14 22 ± 4 48 ± 5 20 ± 4 ND ND 16.5 ± 2.6 8.6 ± 2.8 13,852 ± 2,865 40,503 820 ± 466 2,868 2010-2011 -75.80%
2 237 Choptank River Middle Low 5,713 / 7,351 118 209 122 68 ± 9 109 ± 8 28 ± 3 66 ± 7 ND ND 24.6 ± 4.5 6.5 ± 1.1 6,559 ± 2,670 50,179 3,549 ± 1,170 7,363 2015-2016 13.70%
2 274 Wicomico River West Low 11,504 / 4,400 163 175 118 104 ± 10 86 ± 30 42 ± 3 26 ± 4 101 ± 16 50 ± 9 18.7 ± 2.8 6.6 ± 1.2 7,962 ± 2,284 29,719 3,601 ± 950 6,403 2013-2014 -9.10%
2 637 Tred Avon River Low 2,685 / 2,458 137 350 137 86 ± 17 95 ± 10 31 ± 4 56 ± 12 ND ND 23 ± 3.2 6.4 ± 1.9 3,976 ± 1,333 22,456 1,678 ± 622 3,897 2015-2016 15.50%
2 096 Wicomico River (East) Med 6,621 / 715 112 196 166 55 ± 12 95 ± 18 22 ± 3 38 ± 8 129 ± 7 118 ± 22 28.9 ± 4.6 8.3 ± 2.8 392 ± 120 1,854 3,119 ± 1,417 9,872 2015-2016 55.70%
2 168 Patuxent River Lower Med 7,929 / 2,551 130 130 206 65 ± 8 152 ± 18 20 ± 4 43 ± 6 49 ± 10 114 ± 14 37 ± 5.1 13.8 ± 2.2 4,545 ± 2,096 32,646 19,468 ± 6,354 39,702 2014-2015 -3.30%
2 292 Tangier Sound North Med 33,326 / 18,860 167 175 250 86 ± 10 158 ± 21 18 ± 2 39 ± 8 68 ± 10 146 ± 35 33.7 ± 4.1 16.2 ± 2.3 6,763 ± 1,351 18,940 42,568 ± 8,012 61,879 2015-2016 1.60%
3 055 Magothy River Low 1,492 / 947 32 188 ND 94 ± 33 ND 64 ± 25 ND ND ND 29.9 ± 12.9 ND 41 ± 11 133 0 0 -100.00%
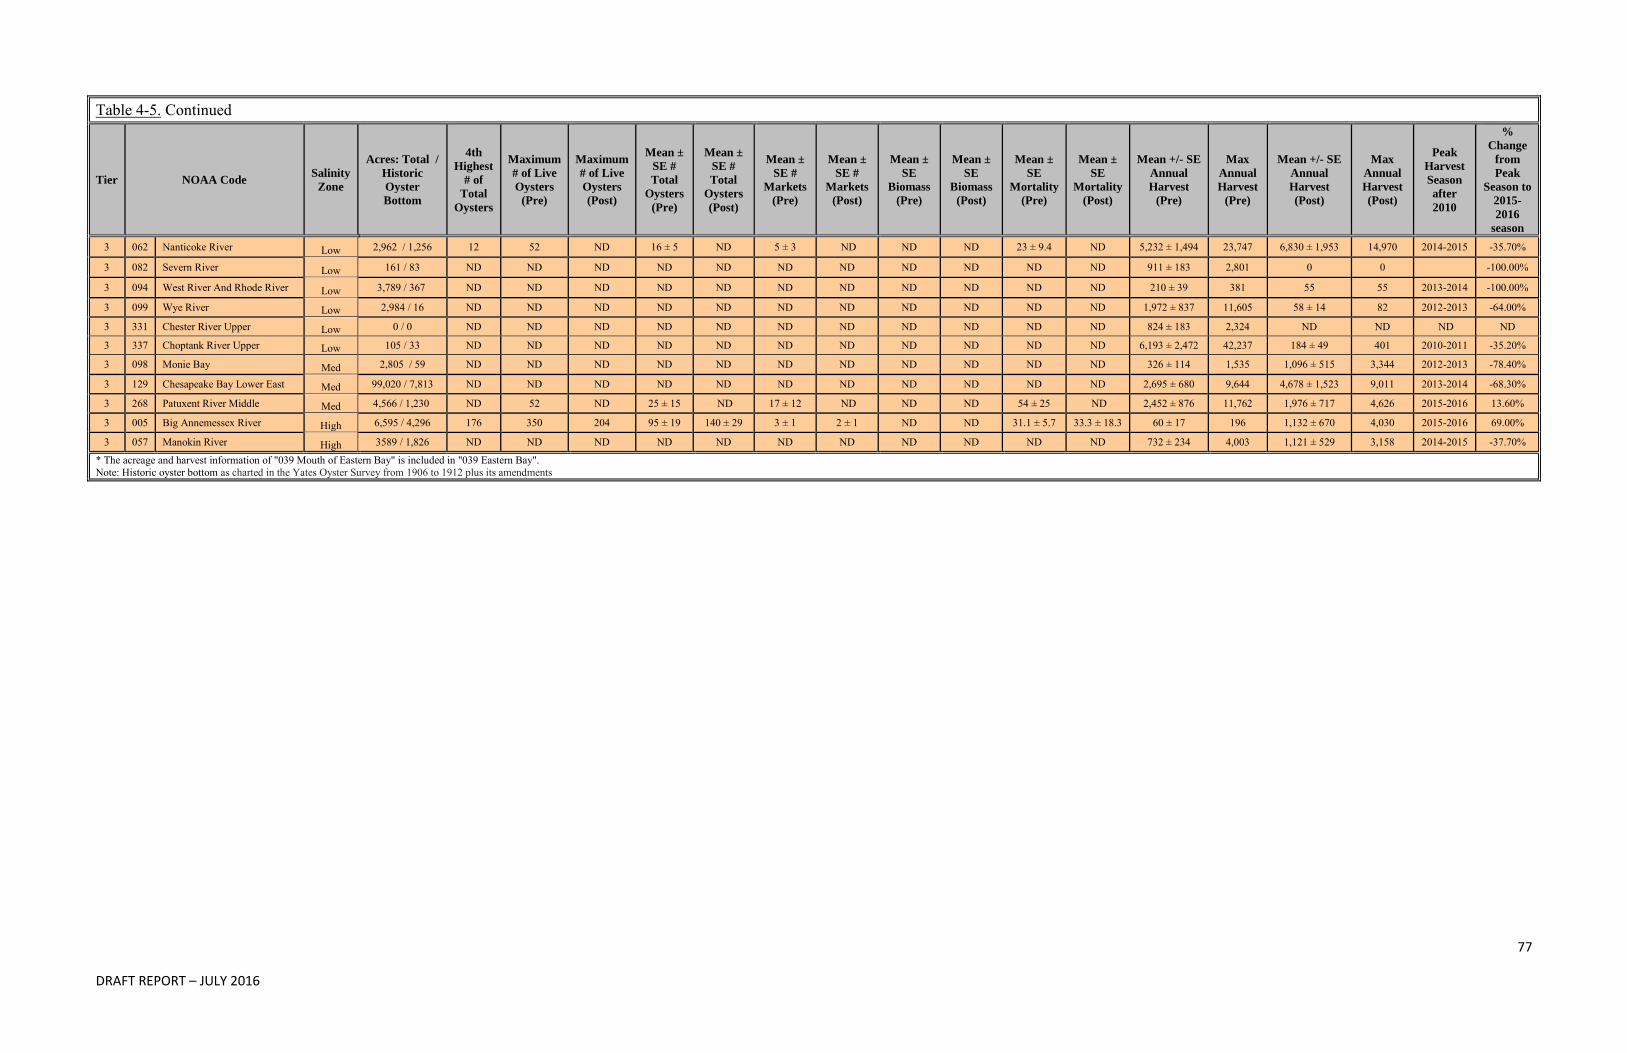
77
DRAFT REPORT – JULY 2016
Table 4-5. Continued
Tier NOAA Code Salinity
Zone
Acres: Total /
Historic
Oyster
Bottom
4th
Highest
# of
Total
Oysters
Maximum
# of Live
Oysters
(Pre)
Maximum
# of Live
Oysters
(Post)
Mean ±
SE #
Total
Oysters
(Pre)
Mean ±
SE #
Total
Oysters
(Post)
Mean ±
SE #
Markets
(Pre)
Mean ±
SE #
Markets
(Post)
Mean ±
SE
Biomass
(Pre)
Mean ±
SE
Biomass
(Post)
Mean ±
SE
Mortality
(Pre)
Mean ±
SE
Mortality
(Post)
Mean +/- SE
Annual
Harvest
(Pre)
Max
Annual
Harvest
(Pre)
Mean +/- SE
Annual
Harvest
(Post)
Max
Annual
Harvest
(Post)
Peak
Harvest
Season
after
2010
%
Change
from
Peak
Season to
2015-
2016
season
3 062 Nanticoke River Low 2,962 / 1,256 12 52 ND 16 ± 5 ND 5 ± 3 ND ND ND 23 ± 9.4 ND 5,232 ± 1,494 23,747 6,830 ± 1,953 14,970 2014-2015 -35.70%
3 082 Severn River Low 161 / 83 ND ND ND ND ND ND ND ND ND ND ND 911 ± 183 2,801 0 0 -100.00%
3 094 West River And Rhode River Low 3,789 / 367 ND ND ND ND ND ND ND ND ND ND ND 210 ± 39 381 55 55 2013-2014 -100.00%
3 099 Wye River Low 2,984 / 16 ND ND ND ND ND ND ND ND ND ND ND 1,972 ± 837 11,605 58 ± 14 82 2012-2013 -64.00%
3 331 Chester River Upper Low 0 / 0 ND ND ND ND ND ND ND ND ND ND ND 824 ± 183 2,324 ND ND ND ND
3 337 Choptank River Upper Low 105 / 33 ND ND ND ND ND ND ND ND ND ND ND 6,193 ± 2,472 42,237 184 ± 49 401 2010-2011 -35.20%
3 098 Monie Bay Med 2,805 / 59 ND ND ND ND ND ND ND ND ND ND ND 326 ± 114 1,535 1,096 ± 515 3,344 2012-2013 -78.40%
3 129 Chesapeake Bay Lower East Med 99,020 / 7,813 ND ND ND ND ND ND ND ND ND ND ND 2,695 ± 680 9,644 4,678 ± 1,523 9,011 2013-2014 -68.30%
3 268 Patuxent River Middle Med 4,566 / 1,230 ND 52 ND 25 ± 15 ND 17 ± 12 ND ND ND 54 ± 25 ND 2,452 ± 876 11,762 1,976 ± 717 4,626 2015-2016 13.60%
3 005 Big Annemessex River High 6,595 / 4,296 176 350 204 95 ± 19 140 ± 29 3 ± 1 2 ± 1 ND ND 31.1 ± 5.7 33.3 ± 18.3 60 ± 17 196 1,132 ± 670 4,030 2015-2016 69.00%
3 057 Manokin River High 3589 / 1,826 ND ND ND ND ND ND ND ND ND ND ND 732 ± 234 4,003 1,121 ± 529 3,158 2014-2015 -37.70%
* The acreage and harvest information of "039 Mouth of Eastern Bay" is included in "039 Eastern Bay". Note: Historic oyster bottom as charted in the Yates Oyster Survey from 1906 to 1912 plus its amendments
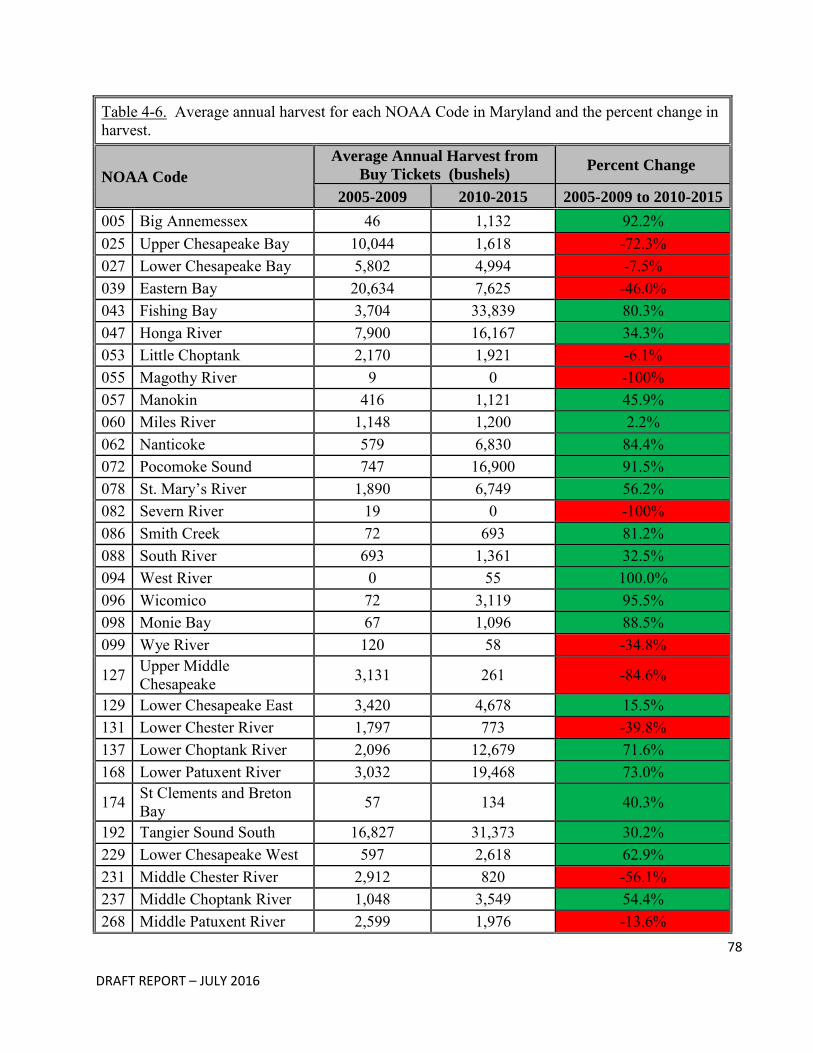
78
DRAFT REPORT – JULY 2016
Table 4-6. Average annual harvest for each NOAA Code in Maryland and the percent change in harvest.
NOAA Code
Average Annual Harvest from
Buy Tickets (bushels) Percent Change
2005-2009 2010-2015 2005-2009 to 2010-2015
005 Big Annemessex 46 1,132 92.2% 025 Upper Chesapeake Bay 10,044 1,618 -72.3% 027 Lower Chesapeake Bay 5,802 4,994 -7.5% 039 Eastern Bay 20,634 7,625 -46.0% 043 Fishing Bay 3,704 33,839 80.3% 047 Honga River 7,900 16,167 34.3% 053 Little Choptank 2,170 1,921 -6.1% 055 Magothy River 9 0 -100% 057 Manokin 416 1,121 45.9% 060 Miles River 1,148 1,200 2.2% 062 Nanticoke 579 6,830 84.4% 072 Pocomoke Sound 747 16,900 91.5% 078 St. Mary’s River 1,890 6,749 56.2% 082 Severn River 19 0 -100% 086 Smith Creek 72 693 81.2% 088 South River 693 1,361 32.5% 094 West River 0 55 100.0% 096 Wicomico 72 3,119 95.5% 098 Monie Bay 67 1,096 88.5% 099 Wye River 120 58 -34.8%
127 Upper Middle Chesapeake 3,131 261 -84.6%
129 Lower Chesapeake East 3,420 4,678 15.5% 131 Lower Chester River 1,797 773 -39.8% 137 Lower Choptank River 2,096 12,679 71.6% 168 Lower Patuxent River 3,032 19,468 73.0%
174 St Clements and Breton Bay 57 134 40.3%
192 Tangier Sound South 16,827 31,373 30.2% 229 Lower Chesapeake West 597 2,618 62.9% 231 Middle Chester River 2,912 820 -56.1% 237 Middle Choptank River 1,048 3,549 54.4% 268 Middle Patuxent River 2,599 1,976 -13.6%
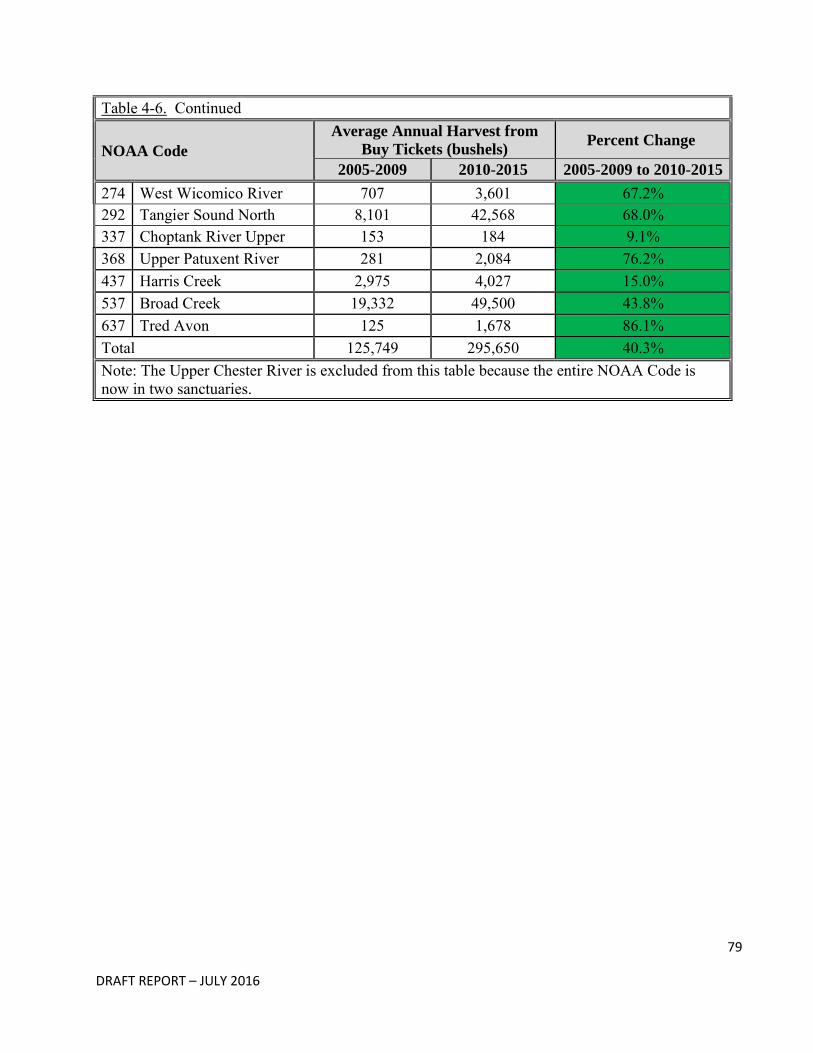
79
DRAFT REPORT – JULY 2016
Table 4-6. Continued
NOAA Code Average Annual Harvest from
Buy Tickets (bushels) Percent Change
2005-2009 2010-2015 2005-2009 to 2010-2015
274 West Wicomico River 707 3,601 67.2% 292 Tangier Sound North 8,101 42,568 68.0% 337 Choptank River Upper 153 184 9.1% 368 Upper Patuxent River 281 2,084 76.2% 437 Harris Creek 2,975 4,027 15.0% 537 Broad Creek 19,332 49,500 43.8% 637 Tred Avon 125 1,678 86.1% Total 125,749 295,650 40.3% Note: The Upper Chester River is excluded from this table because the entire NOAA Code is now in two sanctuaries.
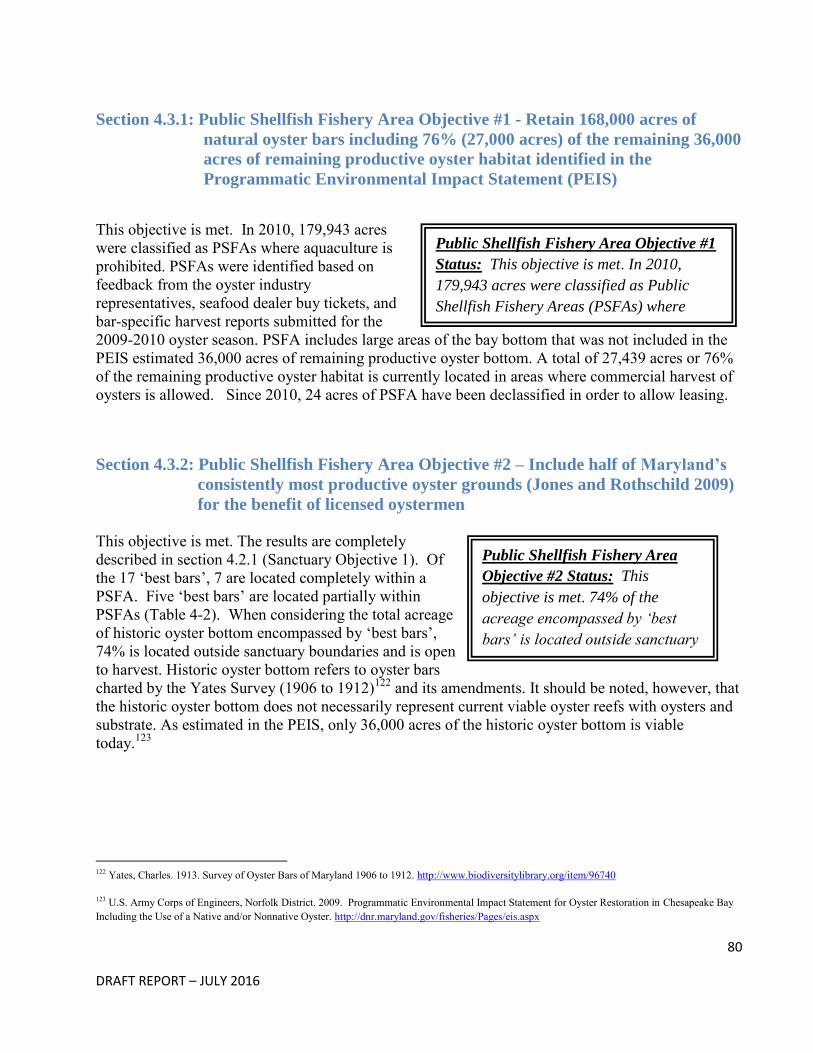
80
DRAFT REPORT – JULY 2016
Public Shellfish Fishery Area Objective #1
Status: This objective is met. In 2010,
179,943 acres were classified as Public
Shellfish Fishery Areas (PSFAs) where
aquaculture is prohibited.
Public Shellfish Fishery Area
Objective #2 Status: This
objective is met. 74% of the
acreage encompassed by ‘best
bars’ is located outside sanctuary
boundaries and is open to harvest.
Section 4.3.1: Public Shellfish Fishery Area Objective #1 - Retain 168,000 acres of
natural oyster bars including 76% (27,000 acres) of the remaining 36,000
acres of remaining productive oyster habitat identified in the
Programmatic Environmental Impact Statement (PEIS)
This objective is met. In 2010, 179,943 acres were classified as PSFAs where aquaculture is prohibited. PSFAs were identified based on feedback from the oyster industry representatives, seafood dealer buy tickets, and bar-specific harvest reports submitted for the 2009-2010 oyster season. PSFA includes large areas of the bay bottom that was not included in the PEIS estimated 36,000 acres of remaining productive oyster bottom. A total of 27,439 acres or 76% of the remaining productive oyster habitat is currently located in areas where commercial harvest of oysters is allowed. Since 2010, 24 acres of PSFA have been declassified in order to allow leasing.
Section 4.3.2: Public Shellfish Fishery Area Objective #2 – Include half of Maryland’s
consistently most productive oyster grounds (Jones and Rothschild 2009)
for the benefit of licensed oystermen This objective is met. The results are completely described in section 4.2.1 (Sanctuary Objective 1). Of the 17 ‘best bars’, 7 are located completely within a PSFA. Five ‘best bars’ are located partially within PSFAs (Table 4-2). When considering the total acreage of historic oyster bottom encompassed by ‘best bars’, 74% is located outside sanctuary boundaries and is open to harvest. Historic oyster bottom refers to oyster bars charted by the Yates Survey (1906 to 1912)122 and its amendments. It should be noted, however, that the historic oyster bottom does not necessarily represent current viable oyster reefs with oysters and substrate. As estimated in the PEIS, only 36,000 acres of the historic oyster bottom is viable today.123
122 Yates, Charles. 1913. Survey of Oyster Bars of Maryland 1906 to 1912. http://www.biodiversitylibrary.org/item/96740
123 U.S. Army Corps of Engineers, Norfolk District. 2009. Programmatic Environmental Impact Statement for Oyster Restoration in Chesapeake Bay Including the Use of a Native and/or Nonnative Oyster. http://dnr.maryland.gov/fisheries/Pages/eis.aspx
81
DRAFT REPORT – JULY 2016
Public Shellfish Fishery Area Objective #3 Status: This objective is incomplete. DNR will conduct a
stock assessment by December 2018 that will
provide guidance for the development of biological
reference points for the management of the oyster
population.1
Section 4.3.3: Public Shellfish Fishery Area Objective #3 - Maintain a more targeted
and scientifically managed public oyster fishery This objective is incomplete. Traditionally, the oyster fishery has been managed using seasons, size limits, daily catch limits and spatial gear restrictions. The commercial fishery is not managed by a system of biological reference points which allow management to maximize economic return for the fishery within biological guardrails developed for the species. DNR will conduct a stock assessment by December 2018 that will provide guidance for the development of biological reference points for the management of the oyster population.124
124 SB 937, Chapter Number 703, 2016 http://mgaleg.maryland.gov/webmga/frmMain.aspx?id=sb0937&stab=01&pid=billpage&tab=subject3&ys=2016RS
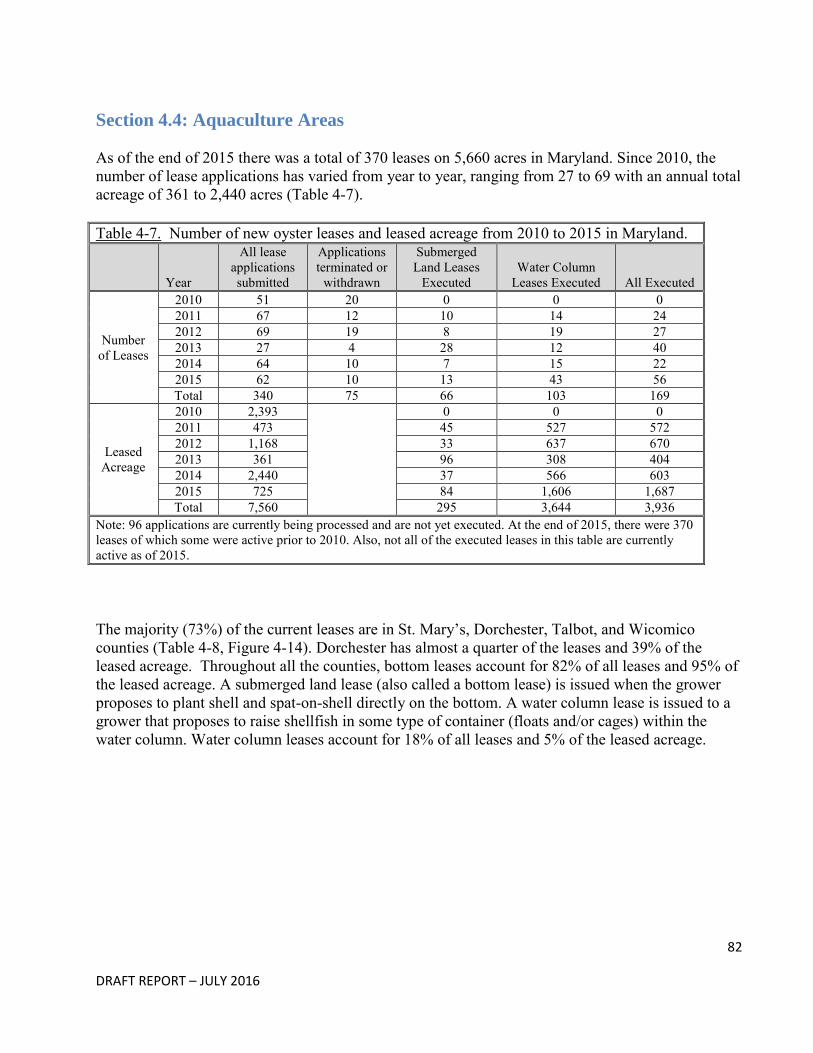
82
DRAFT REPORT – JULY 2016
Section 4.4: Aquaculture Areas As of the end of 2015 there was a total of 370 leases on 5,660 acres in Maryland. Since 2010, the number of lease applications has varied from year to year, ranging from 27 to 69 with an annual total acreage of 361 to 2,440 acres (Table 4-7). Table 4-7. Number of new oyster leases and leased acreage from 2010 to 2015 in Maryland.
Year
All lease applications submitted
Applications terminated or
withdrawn
Submerged Land Leases
Executed Water Column
Leases Executed All Executed
Number of Leases
2010 51 20 0 0 0 2011 67 12 10 14 24 2012 69 19 8 19 27 2013 27 4 28 12 40 2014 64 10 7 15 22 2015 62 10 13 43 56 Total 340 75 66 103 169
Leased Acreage
2010 2,393
0 0 0 2011 473 45 527 572 2012 1,168 33 637 670 2013 361 96 308 404 2014 2,440 37 566 603 2015 725 84 1,606 1,687 Total 7,560 295 3,644 3,936
Note: 96 applications are currently being processed and are not yet executed. At the end of 2015, there were 370 leases of which some were active prior to 2010. Also, not all of the executed leases in this table are currently active as of 2015. The majority (73%) of the current leases are in St. Mary’s, Dorchester, Talbot, and Wicomico counties (Table 4-8, Figure 4-14). Dorchester has almost a quarter of the leases and 39% of the leased acreage. Throughout all the counties, bottom leases account for 82% of all leases and 95% of the leased acreage. A submerged land lease (also called a bottom lease) is issued when the grower proposes to plant shell and spat-on-shell directly on the bottom. A water column lease is issued to a grower that proposes to raise shellfish in some type of container (floats and/or cages) within the water column. Water column leases account for 18% of all leases and 5% of the leased acreage.
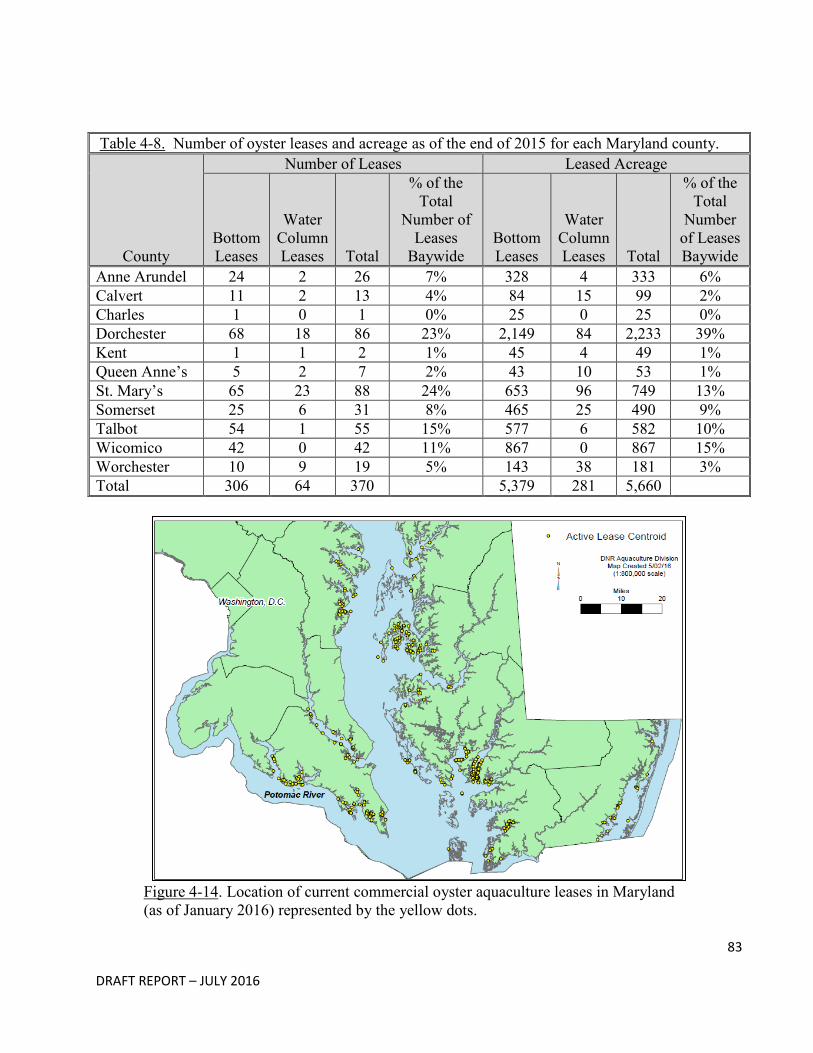
83
DRAFT REPORT – JULY 2016
Table 4-8. Number of oyster leases and acreage as of the end of 2015 for each Maryland county.
County
Number of Leases Leased Acreage
Bottom Leases
Water Column Leases Total
% of the Total
Number of Leases
Baywide Bottom Leases
Water Column Leases Total
% of the Total
Number of Leases Baywide
Anne Arundel 24 2 26 7% 328 4 333 6% Calvert 11 2 13 4% 84 15 99 2% Charles 1 0 1 0% 25 0 25 0% Dorchester 68 18 86 23% 2,149 84 2,233 39% Kent 1 1 2 1% 45 4 49 1% Queen Anne’s 5 2 7 2% 43 10 53 1% St. Mary’s 65 23 88 24% 653 96 749 13% Somerset 25 6 31 8% 465 25 490 9% Talbot 54 1 55 15% 577 6 582 10% Wicomico 42 0 42 11% 867 0 867 15% Worchester 10 9 19 5% 143 38 181 3% Total 306 64 370 5,379 281 5,660
Figure 4-14. Location of current commercial oyster aquaculture leases in Maryland (as of January 2016) represented by the yellow dots.
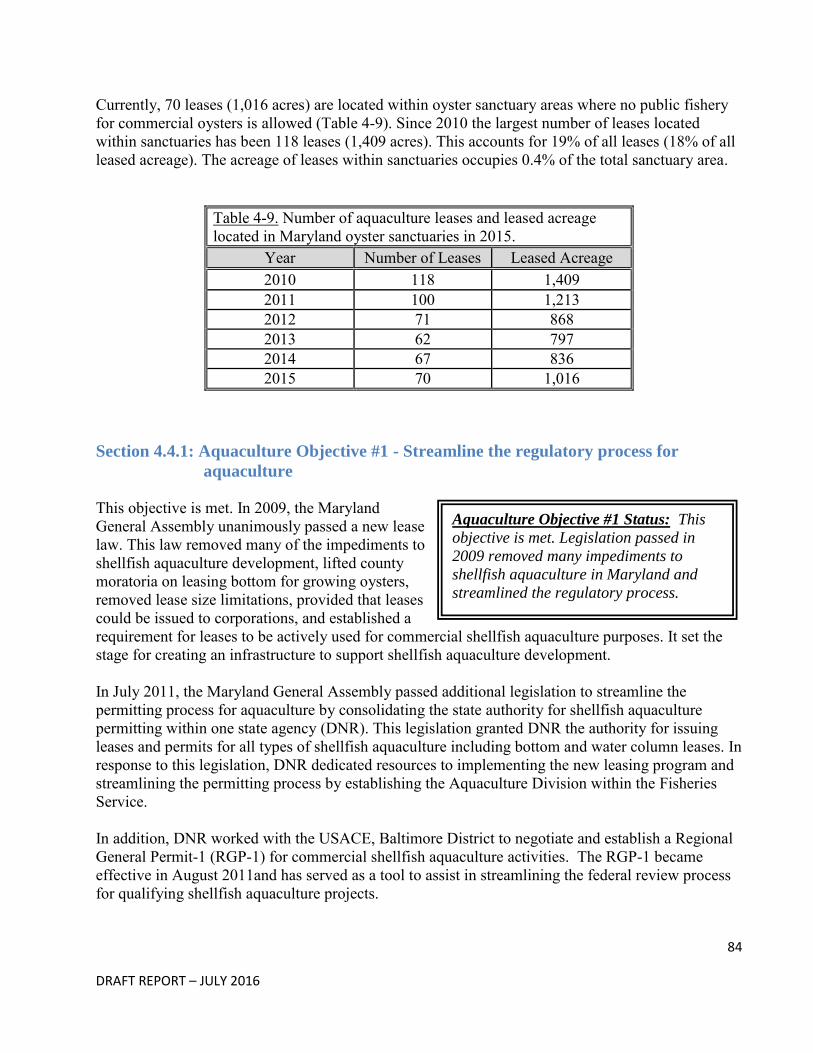
84
DRAFT REPORT – JULY 2016
Aquaculture Objective #1 Status: This
objective is met. Legislation passed in
2009 removed many impediments to
shellfish aquaculture in Maryland and
streamlined the regulatory process.
Currently, 70 leases (1,016 acres) are located within oyster sanctuary areas where no public fishery for commercial oysters is allowed (Table 4-9). Since 2010 the largest number of leases located within sanctuaries has been 118 leases (1,409 acres). This accounts for 19% of all leases (18% of all leased acreage). The acreage of leases within sanctuaries occupies 0.4% of the total sanctuary area.
Table 4-9. Number of aquaculture leases and leased acreage located in Maryland oyster sanctuaries in 2015.
Year Number of Leases Leased Acreage 2010 118 1,409 2011 100 1,213 2012 71 868 2013 62 797 2014 67 836 2015 70 1,016
Section 4.4.1: Aquaculture Objective #1 - Streamline the regulatory process for
aquaculture This objective is met. In 2009, the Maryland General Assembly unanimously passed a new lease law. This law removed many of the impediments to shellfish aquaculture development, lifted county moratoria on leasing bottom for growing oysters, removed lease size limitations, provided that leases could be issued to corporations, and established a requirement for leases to be actively used for commercial shellfish aquaculture purposes. It set the stage for creating an infrastructure to support shellfish aquaculture development. In July 2011, the Maryland General Assembly passed additional legislation to streamline the permitting process for aquaculture by consolidating the state authority for shellfish aquaculture permitting within one state agency (DNR). This legislation granted DNR the authority for issuing leases and permits for all types of shellfish aquaculture including bottom and water column leases. In response to this legislation, DNR dedicated resources to implementing the new leasing program and streamlining the permitting process by establishing the Aquaculture Division within the Fisheries Service. In addition, DNR worked with the USACE, Baltimore District to negotiate and establish a Regional General Permit-1 (RGP-1) for commercial shellfish aquaculture activities. The RGP-1 became effective in August 2011and has served as a tool to assist in streamlining the federal review process for qualifying shellfish aquaculture projects.
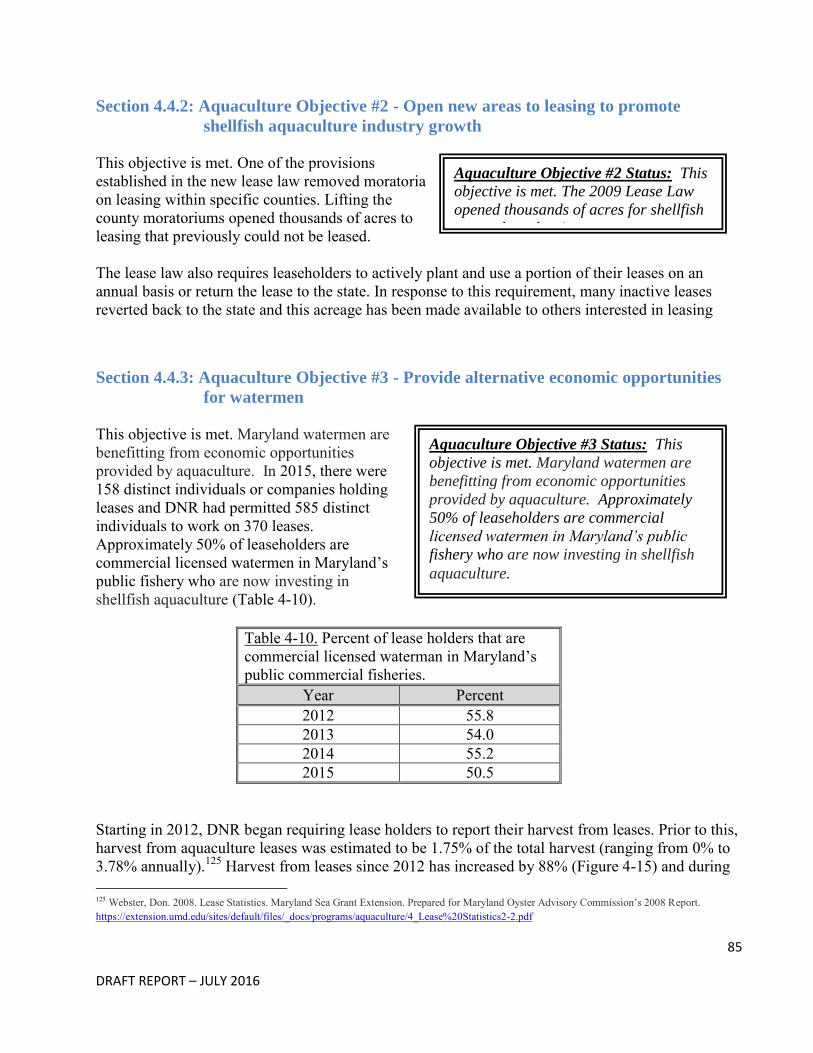
85
DRAFT REPORT – JULY 2016
Aquaculture Objective #2 Status: This
objective is met. The 2009 Lease Law
opened thousands of acres for shellfish
aquaculture leasing.
Aquaculture Objective #3 Status: This
objective is met. Maryland watermen are
benefitting from economic opportunities
provided by aquaculture. Approximately
50% of leaseholders are commercial
licensed watermen in Maryland’s public
fishery who are now investing in shellfish
aquaculture.
Section 4.4.2: Aquaculture Objective #2 - Open new areas to leasing to promote
shellfish aquaculture industry growth This objective is met. One of the provisions established in the new lease law removed moratoria on leasing within specific counties. Lifting the county moratoriums opened thousands of acres to leasing that previously could not be leased. The lease law also requires leaseholders to actively plant and use a portion of their leases on an annual basis or return the lease to the state. In response to this requirement, many inactive leases reverted back to the state and this acreage has been made available to others interested in leasing
Section 4.4.3: Aquaculture Objective #3 - Provide alternative economic opportunities
for watermen This objective is met. Maryland watermen are benefitting from economic opportunities provided by aquaculture. In 2015, there were 158 distinct individuals or companies holding leases and DNR had permitted 585 distinct individuals to work on 370 leases. Approximately 50% of leaseholders are commercial licensed watermen in Maryland’s public fishery who are now investing in shellfish aquaculture (Table 4-10).
Table 4-10. Percent of lease holders that are commercial licensed waterman in Maryland’s public commercial fisheries.
Year Percent 2012 55.8 2013 54.0 2014 55.2 2015 50.5
Starting in 2012, DNR began requiring lease holders to report their harvest from leases. Prior to this, harvest from aquaculture leases was estimated to be 1.75% of the total harvest (ranging from 0% to 3.78% annually).125 Harvest from leases since 2012 has increased by 88% (Figure 4-15) and during 125 Webster, Don. 2008. Lease Statistics. Maryland Sea Grant Extension. Prepared for Maryland Oyster Advisory Commission’s 2008 Report. https://extension.umd.edu/sites/default/files/_docs/programs/aquaculture/4_Lease%20Statistics2-2.pdf
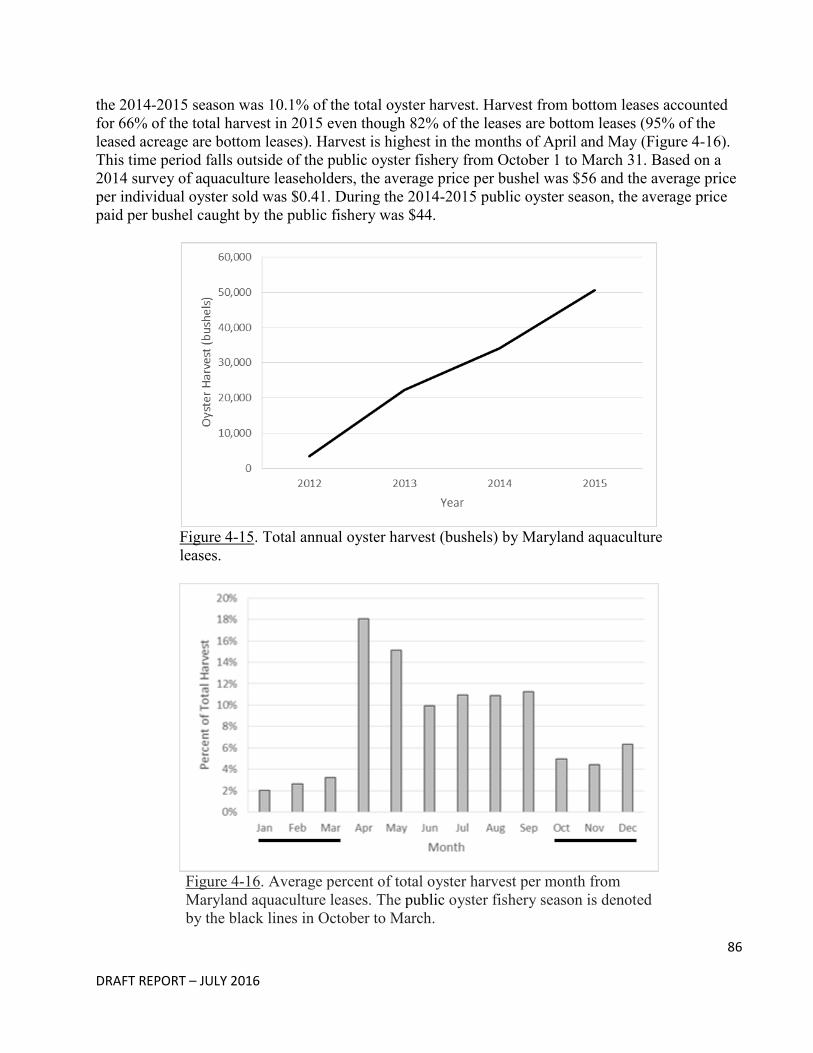
86
DRAFT REPORT – JULY 2016
the 2014-2015 season was 10.1% of the total oyster harvest. Harvest from bottom leases accounted for 66% of the total harvest in 2015 even though 82% of the leases are bottom leases (95% of the leased acreage are bottom leases). Harvest is highest in the months of April and May (Figure 4-16). This time period falls outside of the public oyster fishery from October 1 to March 31. Based on a 2014 survey of aquaculture leaseholders, the average price per bushel was $56 and the average price per individual oyster sold was $0.41. During the 2014-2015 public oyster season, the average price paid per bushel caught by the public fishery was $44.
Figure 4-15. Total annual oyster harvest (bushels) by Maryland aquaculture leases.
Figure 4-16. Average percent of total oyster harvest per month from Maryland aquaculture leases. The public oyster fishery season is denoted by the black lines in October to March.
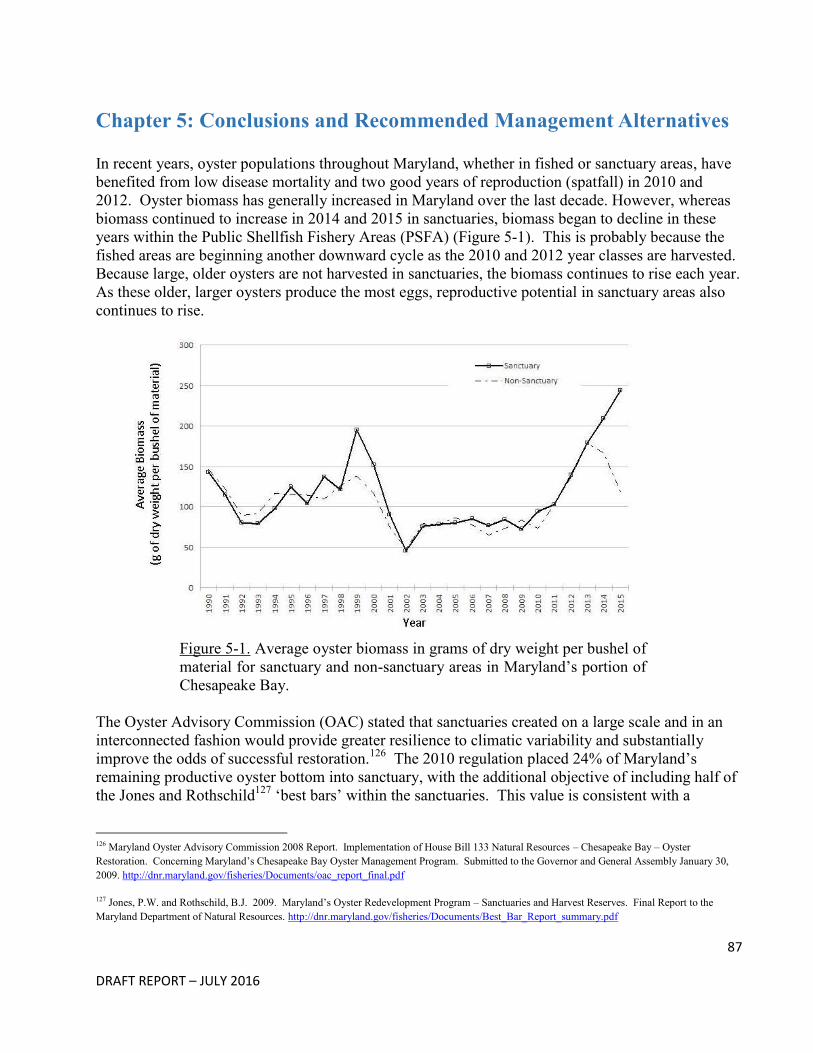
87
DRAFT REPORT – JULY 2016
Chapter 5: Conclusions and Recommended Management Alternatives In recent years, oyster populations throughout Maryland, whether in fished or sanctuary areas, have benefited from low disease mortality and two good years of reproduction (spatfall) in 2010 and 2012. Oyster biomass has generally increased in Maryland over the last decade. However, whereas biomass continued to increase in 2014 and 2015 in sanctuaries, biomass began to decline in these years within the Public Shellfish Fishery Areas (PSFA) (Figure 5-1). This is probably because the fished areas are beginning another downward cycle as the 2010 and 2012 year classes are harvested. Because large, older oysters are not harvested in sanctuaries, the biomass continues to rise each year. As these older, larger oysters produce the most eggs, reproductive potential in sanctuary areas also continues to rise.
Figure 5-1. Average oyster biomass in grams of dry weight per bushel of material for sanctuary and non-sanctuary areas in Maryland’s portion of Chesapeake Bay.
The Oyster Advisory Commission (OAC) stated that sanctuaries created on a large scale and in an interconnected fashion would provide greater resilience to climatic variability and substantially improve the odds of successful restoration.126 The 2010 regulation placed 24% of Maryland’s remaining productive oyster bottom into sanctuary, with the additional objective of including half of the Jones and Rothschild127 ‘best bars’ within the sanctuaries. This value is consistent with a
126 Maryland Oyster Advisory Commission 2008 Report. Implementation of House Bill 133 Natural Resources – Chesapeake Bay – Oyster Restoration. Concerning Maryland’s Chesapeake Bay Oyster Management Program. Submitted to the Governor and General Assembly January 30, 2009. http://dnr.maryland.gov/fisheries/Documents/oac_report_final.pdf
127 Jones, P.W. and Rothschild, B.J. 2009. Maryland’s Oyster Redevelopment Program – Sanctuaries and Harvest Reserves. Final Report to the Maryland Department of Natural Resources. http://dnr.maryland.gov/fisheries/Documents/Best_Bar_Report_summary.pdf
88
DRAFT REPORT – JULY 2016
growing body of scientific literature and global consensus that protection of 20-30% of marine ecosystems is a reasonable goal to ensure protection of biodiversity (see Chapter 2). Given the complexity and interannual variability of the Chesapeake Bay ecosystem, five years has not been long enough to demonstrate how oyster populations respond to the absence of harvest. Many sanctuaries show positive signs such as increased biomass and reproductive capacity while others have not shown any changes. This is reasonable, since restoration activities have been taking place over a short period of time and are still on-going in some sanctuaries. The overall, long-term behavior of sanctuaries will depend on many factors including changes in weather, water movement patterns, disease, and predator/prey abundance. Although five years is not enough time to fully understand the biological consequences of sanctuary management, there is justification to consider adjustments to the boundaries of the current management areas. The over-arching objectives of oyster management in Maryland remains to restore the ecological function of oysters and to enhance the commercial fishery for its economic and cultural benefits. To achieve ecological restoration, the scale of sanctuaries remains important and should be maintained within the range of 20-30% of the remaining productive bottom. However, there are sanctuaries (and areas open to harvest by the public fishery) that are known to have poor habitat and/or very low densities of oysters. These areas cannot be restored either for ecological or fishery purposes without substantial financial investment either by government or by private entities. If the ultimate goal is to have more oysters in the water, then some areas that are currently sanctuaries could contribute to this goal and provide economic and cultural benefits to fishing communities, particularly if these areas are managed in a way that balances harvest with continuous investment to maintain oyster populations in the area.
Section 5.1: Defining Effectiveness Tiers Looking forward to possible adjustments, we have classified sanctuaries and PSFAs into ranked groups called tiers (Table 5-1 and Table 5-2). The groupings are based on data that reflect relative oyster productivity of the areas. These ranked groupings can be used to ensure a fair distribution of the most productive oyster areas, even if individual areas are reclassified. By trading sanctuary and PSFAs within equivalent tiers, “conservation equivalency” is maintained. Sanctuaries and PSFAs were placed into tiers by examining the relative oyster productivity based on data from the Maryland Department of Natural Resources’s (DNR) Annual Fall Oyster Dredge Survey (Fall Survey), the DNR’s Patent Tong Population Survey and, for NOAA Codes, based on harvest. We used available data to identify natural ‘breaks’ in the data that appeared to indicate differing levels of productivity using the following characteristics: 1) The average number of market-size oysters per bushel of material before and after 2010; 2) The total number of live oysters per bushel of material over the 26-year time series; 3) For sanctuaries only, oyster density based on the Patent Tong Population Survey (data not available for NOAA Codes); 4) For NOAA Codes only – average biomass before and after 2010 (insufficient data were available to use this for sanctuaries); and 5) For NOAA Codes only - harvest before and after 2010.
89
DRAFT REPORT – JULY 2016
The 176 PSFAs were grouped into the 39 large NOAA Code harvest reporting areas. It is important to note that each NOAA Code may contain multiple PSFAs and some PSFAs do not reside entirely within a single NOAA Code. As with sanctuaries, there is a wide range of productivity of NOAA Code areas; some consistently produce relatively high harvest with minimal investment, and others are not viable for harvesting, and are not likely to ever be so without substantial investment in habitat and oyster population restoration. Tier 0 Sanctuaries
There are three Tier 0 sanctuaries covering 18,211 acres: Harris Creek, Little Choptank River, and Tred Avon River. This is the only tier that was not characterized based on data-driven criteria presented in tables 5.1 and 5.2. These areas are grouped as Tier 0 because they have each received significant financial investment in targeted restoration projects, and will contribute to the achievement of Maryland’s commitment to the Chesapeake Bay Watershed Agreement “to restore
oyster habitat and populations in five tributaries by 2025 and to ensure their protection.”128 Continued observation through time will substantially increase our understanding of the ecological services of restored oyster reefs and the response of oyster populations to environmental stressors (including disease pressure) in the absence of harvest. There is extensive, ongoing research occurring in these sanctuaries by academic and federal partners that includes such objectives as: tracking each area’s progress toward restoration goals which were developed by a multi-agency workgroup in 2011, quantifying ecological services of oyster reefs, and better understanding vital components of oyster biology such as larval dispersal.129,130 There are no Tier 0 NOAA Codes.
Tier 1 Sanctuaries and NOAA Codes
Tier 1 areas show two or more of the following characteristics: 1) Average number of market-size oysters: the average number of market-size oysters per bushel of
material exceeds 50 either before or after sanctuary creation (or since 2010 in the case of NOAA Codes), and this number is stable or increasing during the latter time period. If the standard error of the estimates in the two time periods overlaps, the value is considered stable. In examining the data for all sanctuaries and NOAA Codes, 50 market-size oysters represented a break point in the data above which, areas tended to have higher abundance of oysters (Figure 5-2 to 5-6).
128 http://www.chesapeakebay.net/chesapeakebaywatershedagreement/goal/sustainable_fisheries
129 National Oceanographic and Atmospheric Administration, US Army Corps of Engineers, Maryland Department of Natural Resources, Oyster Recovery Partnership. 2016. 2015 Oyster Restoration Implementation Update. Progress in the Choptank Complex (Harris Creek, Little Choptank River, and Tred Avon River Oyster Sanctuaries). http://dnr.maryland.gov/fisheries/Documents/2015_Choptank_Oyster_Implementation_Update_FINAL.pdf
130 http://chesapeakebay.noaa.gov/images/stories/fisheries/keyFishSpecies/oystermetricsreportfinal.pdf
90
DRAFT REPORT – JULY 2016
2) Total number of live oysters per bushel of material: The total number of live oysters per bushel exceeds 130 at least four times during the 26-year time series. When considering all of the sampling events in sanctuaries over the 26 years, the value of 130 oysters per bushel represents the top 30% for this value of all sampling events. For NOAA Codes, the data were distributed differently and breaks in the data reflecting categories of productivity were more difficult to discern. Twenty-three of the 30 areas for which data are available exceeded 130 total live oysters per bushel in at least four years. The characteristics for NOAA Codes was set at 200, which is the top 20% of all sampling events for this value. For sanctuaries and NOAA Codes we used the 4th highest value of the time series. This was selected following the methods of Jones and Rothschild131 best bar analysis and because it ensured that more years than just those with the highest spat set would be included.
3) Oyster density: sanctuaries only - density greater than or equal to two oysters per square meter based on the Patent Tong Population Survey.
4) Biomass: NOAA Codes only - biomass increased or remained stable since 2010. If the standard error of the estimates in the two time periods overlaps, the value is considered stable.
5) Harvest: NOAA Codes only - average annual harvest in Tier 1 NOAA Codes increased in the years since 2010. It is important to recognize that this considers only the time period average (1990-2009 and 2010-2015) – the average harvest in many of the Tier 1 NOAA Codes has areas has increased in the latter time period, but has begun to decline in the most recent years (Table 5-2).
Tier 1A or ‘Additional’ Tier 1 Sanctuaries These areas are grouped together because they all contain oyster restoration or research projects conducted by the USACE, although some of these projects are quite old and are no longer active. In many cases, these Tier 1A sanctuaries were created prior to 2010. There are no Tier 1A NOAA Codes. Tier 2 Sanctuaries and NOAA Codes These areas could not achieve two or more of the characteristics set for Tier 1 areas. Tier 2 sanctuaries often have incomplete data sets that have shown mixed signals over time. Some of these sanctuaries would benefit from more time to understand how oyster populations will continue to respond in the absence of harvest. Tier 2 open harvest areas are less productive than Tier 1 areas. The number of market-size oysters exceeded 50 during one of the time periods (pre or post PSFA establishment) in four of the fourteen
131 Jones, P.W. and Rothschild, B.J. 2009. Maryland’s Oyster Redevelopment Program – Sanctuaries and Harvest Reserves. Final Report to the Maryland Department of Natural Resources. http://dnr.maryland.gov/fisheries/Documents/Best_Bar_Report_summary.pdf
91
DRAFT REPORT – JULY 2016
areas. The total number of live oysters per bushel of material was never in the top 20% of all NOAA Codes within the 26-years so that the 4th highest number of oysters is always less than 200. Tier 3 Sanctuaries and NOAA Codes
These are areas which are often known to have low densities of oyster or poor habitat. Often these areas area data poor and in the case of NOAA Codes, have poor harvest.
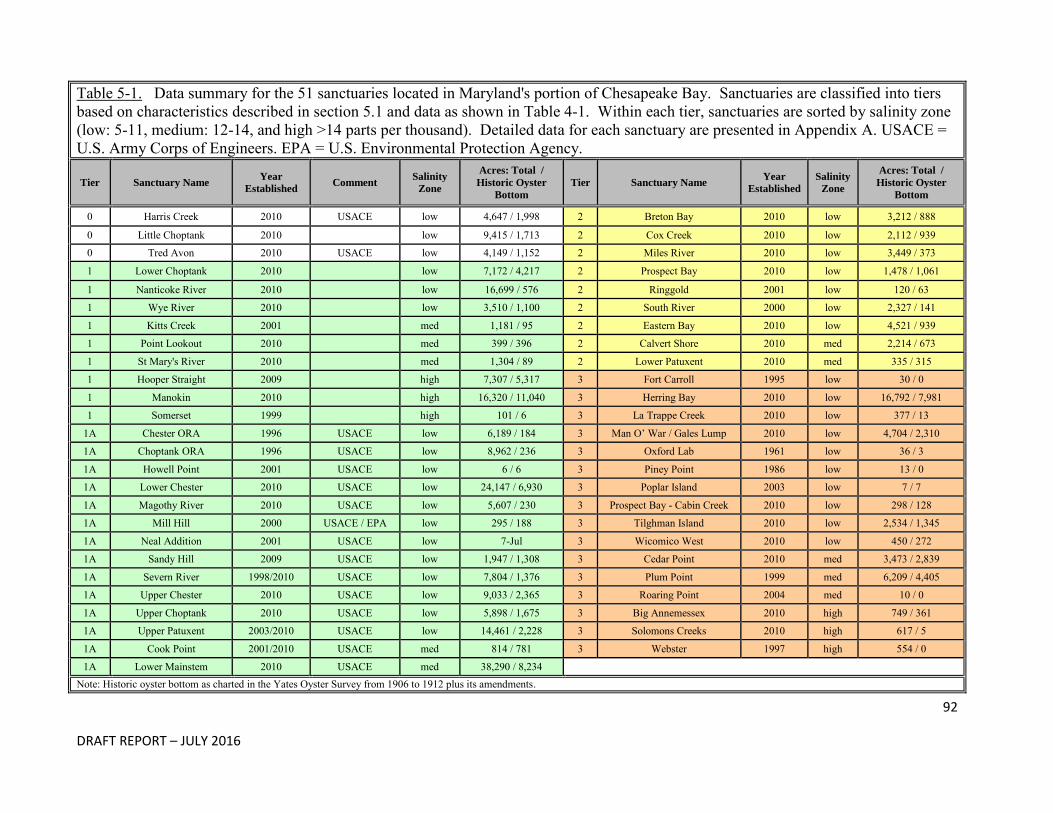
92
DRAFT REPORT – JULY 2016
Table 5-1. Data summary for the 51 sanctuaries located in Maryland's portion of Chesapeake Bay. Sanctuaries are classified into tiers based on characteristics described in section 5.1 and data as shown in Table 4-1. Within each tier, sanctuaries are sorted by salinity zone (low: 5-11, medium: 12-14, and high >14 parts per thousand). Detailed data for each sanctuary are presented in Appendix A. USACE = U.S. Army Corps of Engineers. EPA = U.S. Environmental Protection Agency.
Tier Sanctuary Name Year
Established Comment
Salinity
Zone
Acres: Total /
Historic Oyster
Bottom
Tier Sanctuary Name Year
Established
Salinity
Zone
Acres: Total /
Historic Oyster
Bottom
0 Harris Creek 2010 USACE low 4,647 / 1,998 2 Breton Bay 2010 low 3,212 / 888
0 Little Choptank 2010 low 9,415 / 1,713 2 Cox Creek 2010 low 2,112 / 939
0 Tred Avon 2010 USACE low 4,149 / 1,152 2 Miles River 2010 low 3,449 / 373
1 Lower Choptank 2010 low 7,172 / 4,217 2 Prospect Bay 2010 low 1,478 / 1,061
1 Nanticoke River 2010 low 16,699 / 576 2 Ringgold 2001 low 120 / 63
1 Wye River 2010 low 3,510 / 1,100 2 South River 2000 low 2,327 / 141
1 Kitts Creek 2001 med 1,181 / 95 2 Eastern Bay 2010 low 4,521 / 939
1 Point Lookout 2010 med 399 / 396 2 Calvert Shore 2010 med 2,214 / 673
1 St Mary's River 2010 med 1,304 / 89 2 Lower Patuxent 2010 med 335 / 315
1 Hooper Straight 2009 high 7,307 / 5,317 3 Fort Carroll 1995 low 30 / 0
1 Manokin 2010 high 16,320 / 11,040 3 Herring Bay 2010 low 16,792 / 7,981
1 Somerset 1999 high 101 / 6 3 La Trappe Creek 2010 low 377 / 13
1A Chester ORA 1996 USACE low 6,189 / 184 3 Man O’ War / Gales Lump 2010 low 4,704 / 2,310
1A Choptank ORA 1996 USACE low 8,962 / 236 3 Oxford Lab 1961 low 36 / 3
1A Howell Point 2001 USACE low 6 / 6 3 Piney Point 1986 low 13 / 0
1A Lower Chester 2010 USACE low 24,147 / 6,930 3 Poplar Island 2003 low 7 / 7
1A Magothy River 2010 USACE low 5,607 / 230 3 Prospect Bay - Cabin Creek 2010 low 298 / 128
1A Mill Hill 2000 USACE / EPA low 295 / 188 3 Tilghman Island 2010 low 2,534 / 1,345
1A Neal Addition 2001 USACE low 7-Jul 3 Wicomico West 2010 low 450 / 272
1A Sandy Hill 2009 USACE low 1,947 / 1,308 3 Cedar Point 2010 med 3,473 / 2,839
1A Severn River 1998/2010 USACE low 7,804 / 1,376 3 Plum Point 1999 med 6,209 / 4,405
1A Upper Chester 2010 USACE low 9,033 / 2,365 3 Roaring Point 2004 med 10 / 0
1A Upper Choptank 2010 USACE low 5,898 / 1,675 3 Big Annemessex 2010 high 749 / 361
1A Upper Patuxent 2003/2010 USACE low 14,461 / 2,228 3 Solomons Creeks 2010 high 617 / 5
1A Cook Point 2001/2010 USACE med 814 / 781 3 Webster 1997 high 554 / 0
1A Lower Mainstem 2010 USACE med 38,290 / 8,234 Note: Historic oyster bottom as charted in the Yates Oyster Survey from 1906 to 1912 plus its amendments.
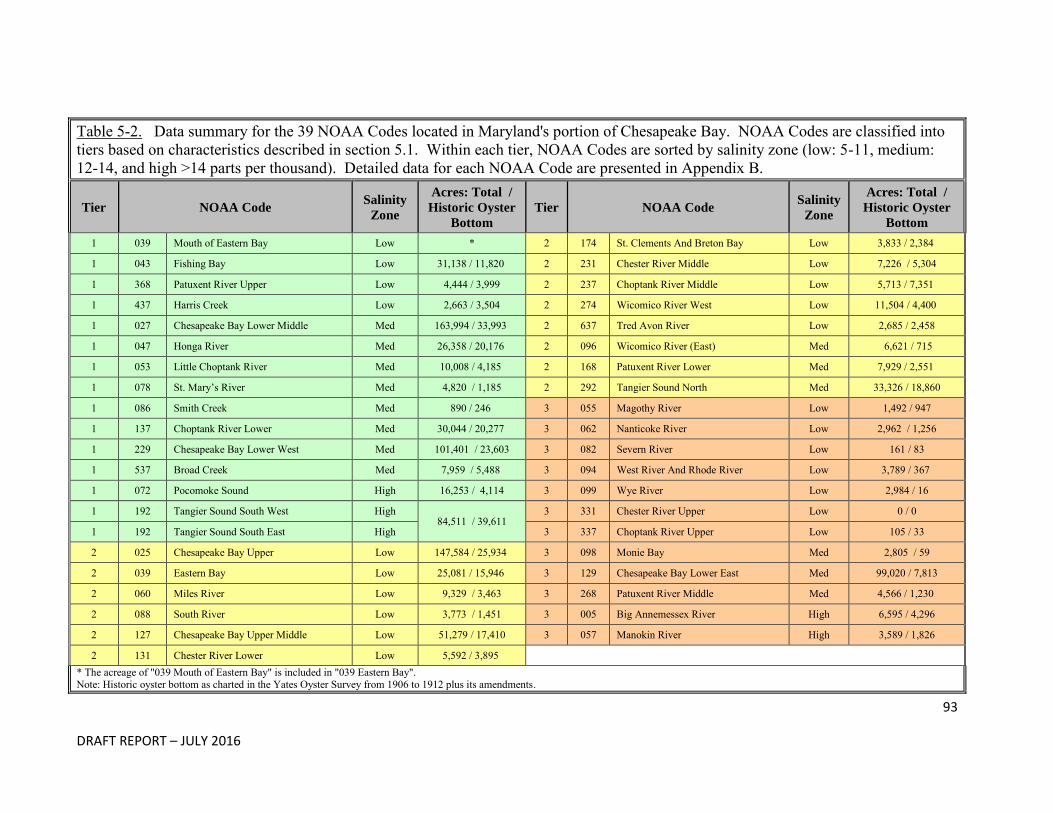
93
DRAFT REPORT – JULY 2016
Table 5-2. Data summary for the 39 NOAA Codes located in Maryland's portion of Chesapeake Bay. NOAA Codes are classified into tiers based on characteristics described in section 5.1. Within each tier, NOAA Codes are sorted by salinity zone (low: 5-11, medium: 12-14, and high >14 parts per thousand). Detailed data for each NOAA Code are presented in Appendix B.
Tier NOAA Code Salinity
Zone
Acres: Total /
Historic Oyster
Bottom
Tier NOAA Code Salinity
Zone
Acres: Total /
Historic Oyster
Bottom
1 039 Mouth of Eastern Bay Low * 2 174 St. Clements And Breton Bay Low 3,833 / 2,384
1 043 Fishing Bay Low 31,138 / 11,820 2 231 Chester River Middle Low 7,226 / 5,304
1 368 Patuxent River Upper Low 4,444 / 3,999 2 237 Choptank River Middle Low 5,713 / 7,351
1 437 Harris Creek Low 2,663 / 3,504 2 274 Wicomico River West Low 11,504 / 4,400
1 027 Chesapeake Bay Lower Middle Med 163,994 / 33,993 2 637 Tred Avon River Low 2,685 / 2,458
1 047 Honga River Med 26,358 / 20,176 2 096 Wicomico River (East) Med 6,621 / 715
1 053 Little Choptank River Med 10,008 / 4,185 2 168 Patuxent River Lower Med 7,929 / 2,551
1 078 St. Mary’s River Med 4,820 / 1,185 2 292 Tangier Sound North Med 33,326 / 18,860
1 086 Smith Creek Med 890 / 246 3 055 Magothy River Low 1,492 / 947
1 137 Choptank River Lower Med 30,044 / 20,277 3 062 Nanticoke River Low 2,962 / 1,256
1 229 Chesapeake Bay Lower West Med 101,401 / 23,603 3 082 Severn River Low 161 / 83
1 537 Broad Creek Med 7,959 / 5,488 3 094 West River And Rhode River Low 3,789 / 367
1 072 Pocomoke Sound High 16,253 / 4,114 3 099 Wye River Low 2,984 / 16
1 192 Tangier Sound South West High 84,511 / 39,611
3 331 Chester River Upper Low 0 / 0
1 192 Tangier Sound South East High 3 337 Choptank River Upper Low 105 / 33
2 025 Chesapeake Bay Upper Low 147,584 / 25,934 3 098 Monie Bay Med 2,805 / 59
2 039 Eastern Bay Low 25,081 / 15,946 3 129 Chesapeake Bay Lower East Med 99,020 / 7,813
2 060 Miles River Low 9,329 / 3,463 3 268 Patuxent River Middle Med 4,566 / 1,230
2 088 South River Low 3,773 / 1,451 3 005 Big Annemessex River High 6,595 / 4,296
2 127 Chesapeake Bay Upper Middle Low 51,279 / 17,410 3 057 Manokin River High 3,589 / 1,826
2 131 Chester River Lower Low 5,592 / 3,895 * The acreage of "039 Mouth of Eastern Bay" is included in "039 Eastern Bay". Note: Historic oyster bottom as charted in the Yates Oyster Survey from 1906 to 1912 plus its amendments.
94
DRAFT REPORT – JULY 2016
Section 5.2: Management Alternatives by Effectiveness Tier We have developed a series of management alternatives for each effectiveness tier for both sanctuaries and NOAA Codes. Currently, financial investment is a clear need for oyster restoration – whether for sanctuaries or for PSFAs. When we refer to investment within the management alternatives, we are not prescriptive in its source: state, federal, private, or a combination of sources is possible. Investment would generally be in the form of reef construction and/or the planting of seed oysters. In the case of large-scale restoration, investment could also include monitoring of oyster population to determine if restoration criteria are met. Under Maryland state law, funds generated from the purchase of oyster surcharges (required for watermen to commercially harvest oysters- §4-701) and from oyster bushel taxes (§4-1020) are returned to the state and used only for the repletion of the natural oyster bars of the state. Also established in state law are County Oyster Committees (§4-1106). DNR works closely with the committees to develop plans for replenishing oyster bars for the public fishery. This combination of income and industry involvement will facilitate consideration of innovative management alternatives that balance harvest with continuous investment to maintain oyster populations in the area. Some of these approaches are mentioned in the management alternatives such as rotational harvest which involves sequentially closing and opening harvest areas and public-private partnerships. Management Alternatives for Tier 0 Sanctuaries There are three Tier 0 sanctuaries covering 18,211 total acres: Harris Creek, Little Choptank River, and Tred Avon River. The data presented in this report indicate that Tier 0 sanctuaries are generally responding well in the absence of harvest which supports the conclusion that these areas should be maintained as sanctuaries. Additionally, these areas are providing a research platform that will enrich our understanding of the ecological services of restored oyster reefs and have high potential to contribute to achievement of the Chesapeake Bay Watershed agreement goals. Under alternative 2, restoration goals may be achieved more slowly. Tier 0 Sanctuary Possible Management Alternatives
Future alternatives for each Tier 0 sanctuary could include:
1) Maintain current strategy - Remain as a sanctuary and continue with investment (reef construction and/or oyster seeding) until restoration criteria are met.
2) Remain as sanctuary, but with no continued investment.
95
DRAFT REPORT – JULY 2016
Management Alternatives for Tier 1 Sanctuaries
The data presented in this report indicate that Tier 1 sanctuaries are generally responding well in the absence of harvest which supports the conclusion that these areas should be maintained as sanctuaries. The Manokin River and St. Mary’s River sanctuaries show potential to achieve Bay Agreement restoration goals without significant additional financial investment. Investment refers to habitat creation, the planting of seed oysters, and oyster population monitoring. Incorporating investment may allow restoration goals to be achieved more quickly. We have included separate alternatives for Somerset Sanctuary, which is a small area located in Tangier Sound surrounded by a harvest area, hence enforcement of the sanctuary is difficult and this area does not meet the objective to facilitate enforcement. The Somerset Sanctuary was created in 1999 to compensate for expanded power dredging in the area, so it was not created with the 2010 management objectives in mind. Tier 1 Sanctuary Possible Management Alternatives
Future alternatives for each Tier 1 sanctuary could include:
1) Maintain current strategy - Remain as sanctuary, but with no continued investment.
2) Remain as a sanctuary with investment (reef construction and/or oyster seeding) until restoration criteria are met.
Somerset Sanctuary possible management alternatives:
1s) Re-classify as a harvest area with specific management rules (e.g. Somerset-specific seasons, times, bushel limits, rotational closures, etc.).
2s) Convert to a harvest area.
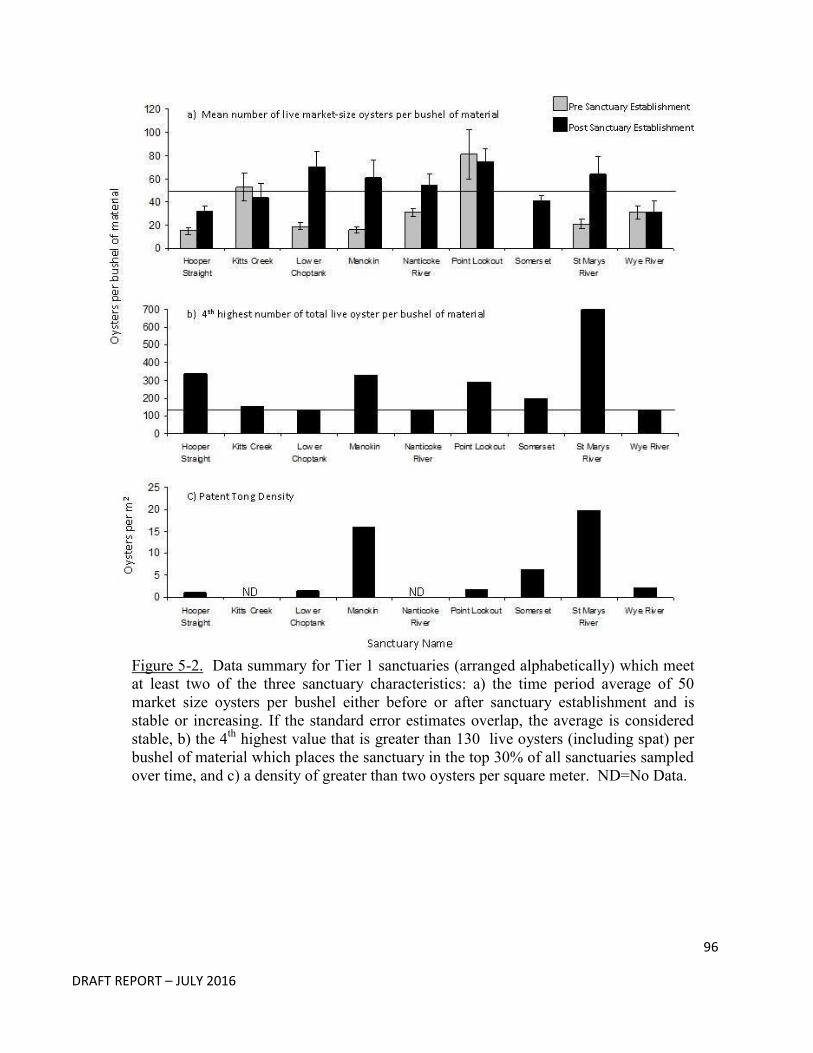
96
DRAFT REPORT – JULY 2016
Figure 5-2. Data summary for Tier 1 sanctuaries (arranged alphabetically) which meet at least two of the three sanctuary characteristics: a) the time period average of 50 market size oysters per bushel either before or after sanctuary establishment and is stable or increasing. If the standard error estimates overlap, the average is considered stable, b) the 4th highest value that is greater than 130 live oysters (including spat) per bushel of material which places the sanctuary in the top 30% of all sanctuaries sampled over time, and c) a density of greater than two oysters per square meter. ND=No Data.
97
DRAFT REPORT – JULY 2016
Management Alternatives for Tier 1 NOAA Codes
There are 15 Tier 1 NOAA Codes encompassing 484,483 acres: Broad Creek, Chesapeake Bay (lower, middle), Chesapeake Bay (lower, west), Lower Choptank River, Fishing Bay, Harris Creek, Honga River, Little Choptank River, Mouth of Eastern Bay, Upper Patuxent River, Pocomoke Sound, Smith Creek, St. Mary’s River, Tangier Sound SE, and Tangier Sound SW (Figure 5-3).
Tier 1 PSFA Possible Management Alternatives
Future alternatives for PSFAs within each Tier 1 NOAA Code could include:
1) Maintain current strategy - no change to PSFA. Management will continue under public fishery rules as they evolve.
2) County Oyster Committees would petition Department to develop an area-specific management plan for a PSFA that focuses on maintaining oysters in the area by balancing harvest with investment in the form of planting seed oysters and maintaining habitat. This may require regulatory or statutory change.
3) Conservational equivalent trade – convert some portion of the area to sanctuary in trade for some Tier 1 sanctuary area.
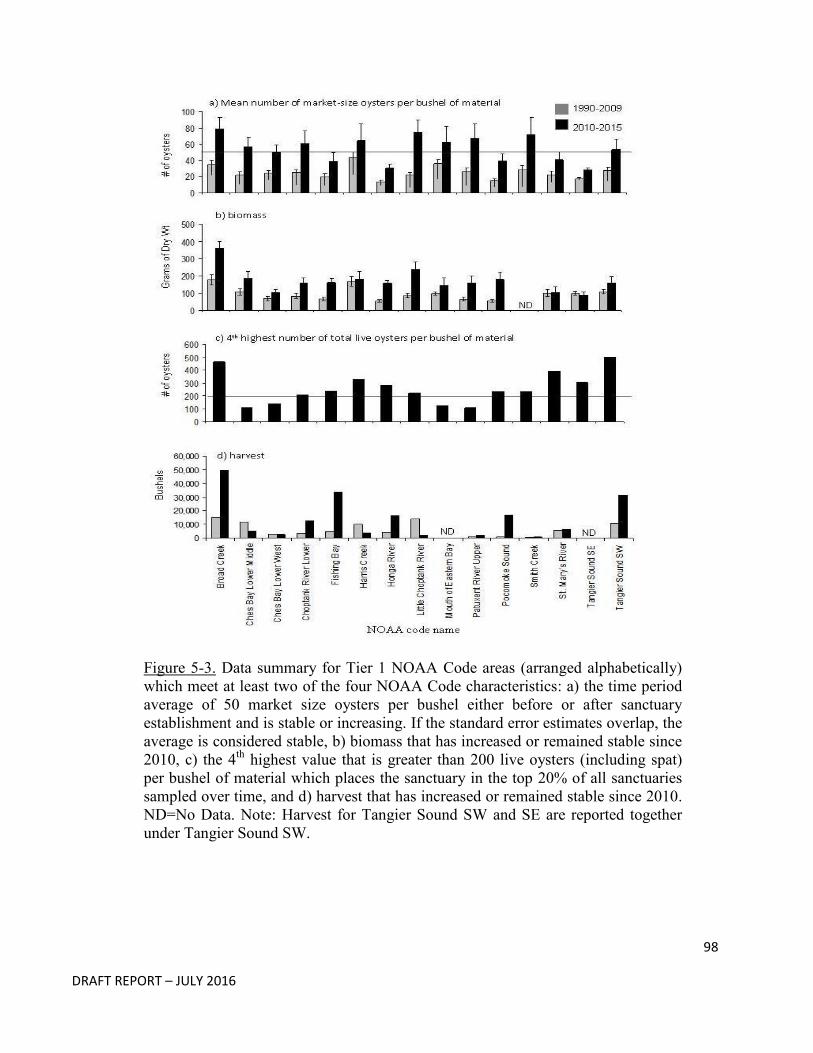
98
DRAFT REPORT – JULY 2016
Figure 5-3. Data summary for Tier 1 NOAA Code areas (arranged alphabetically) which meet at least two of the four NOAA Code characteristics: a) the time period average of 50 market size oysters per bushel either before or after sanctuary establishment and is stable or increasing. If the standard error estimates overlap, the average is considered stable, b) biomass that has increased or remained stable since 2010, c) the 4th highest value that is greater than 200 live oysters (including spat) per bushel of material which places the sanctuary in the top 20% of all sanctuaries sampled over time, and d) harvest that has increased or remained stable since 2010. ND=No Data. Note: Harvest for Tangier Sound SW and SE are reported together under Tangier Sound SW.
99
DRAFT REPORT – JULY 2016
Management Alternatives for Tier 1A Sanctuaries
There are fourteen (14) Tier 1A sanctuaries covering 123,460 acres: Chester ORA, Choptank ORA, Cook Point, Howell Point, Lower Chester River, Lower Mainstem, Magothy River, Mill Hill, Neal Addition, Sandy Hill, Severn River, Upper Chester River, Upper Choptank River, and Upper Patuxent River (Figure 5-4). Data are not available for Magothy River Sanctuary. Howell Point Sanctuary was only sampled one time in 2015, therefore this is no pre- versus post- information.
Many of the Tier 1A sanctuaries are large relative to the size of the USACE projects and were expanded in 2010 with the objective to facilitate enforcement and to provide connected sanctuary corridors for the benefit of larval dispersal. For example, in the Choptank River the Choptank ORA, Upper Choptank, and Sandy Hill sanctuaries form a continuous sanctuary area that is connected to the Lower Choptank Sanctuary along the southern shore of the river. Seven of the twelve Tier 1A sanctuaries for which there are data, meet the requirements of Tier 1 sanctuaries (Figure 5-3). Although they meet the criteria of tier 1 sanctuaries, Upper Chester River and Choptank ORA sanctuaries have shown substantial declines in the number of live market-size oysters per bushel during the post sanctuary time period and may provide more ecological and economic under a new management approach that could include harvest. Recognizing the importance of maintaining 20 – 30% of oyster bottom in sanctuary, future alternative 3 provides opportunity to adjust sanctuary boundaries in those areas that the data indicate have performed poorly with no investment in the maintenance and/or restoration of oyster populations. Some areas could potentially be adjusted so that they can provide economic and cultural benefits to fishing communities and result in an increased population of oysters if these areas are managed in a way that balances harvest with continuous investment to maintain oyster populations in the area. The DNR program Marylanders Grows Oysters (MGO) is active in three of the Tier 1A sanctuaries and has been planting oysters over the past few years. These sanctuaries include Lower Chester River, Upper Chester River, and Severn River. Tier 1A Sanctuary Possible Management Alternatives
Future alternatives for each Tier 1A sanctuary could include:
1) Maintain current strategy - Remain in sanctuary without additional investment such as habitat construction and/or planting seed oysters.
2) Remain as a sanctuary, but with additional investment (reef construction and/or oyster seeding) until restoration criteria are met.
3) Work with DNR and the USACE to develop area-specific management plans. No harvest could occur on USACE reefs or projects without USACE permission. In other areas, investment would be a condition to allow harvest, and funds could be generated by sources such as license surcharge funds, leasing, and private-public partnerships.
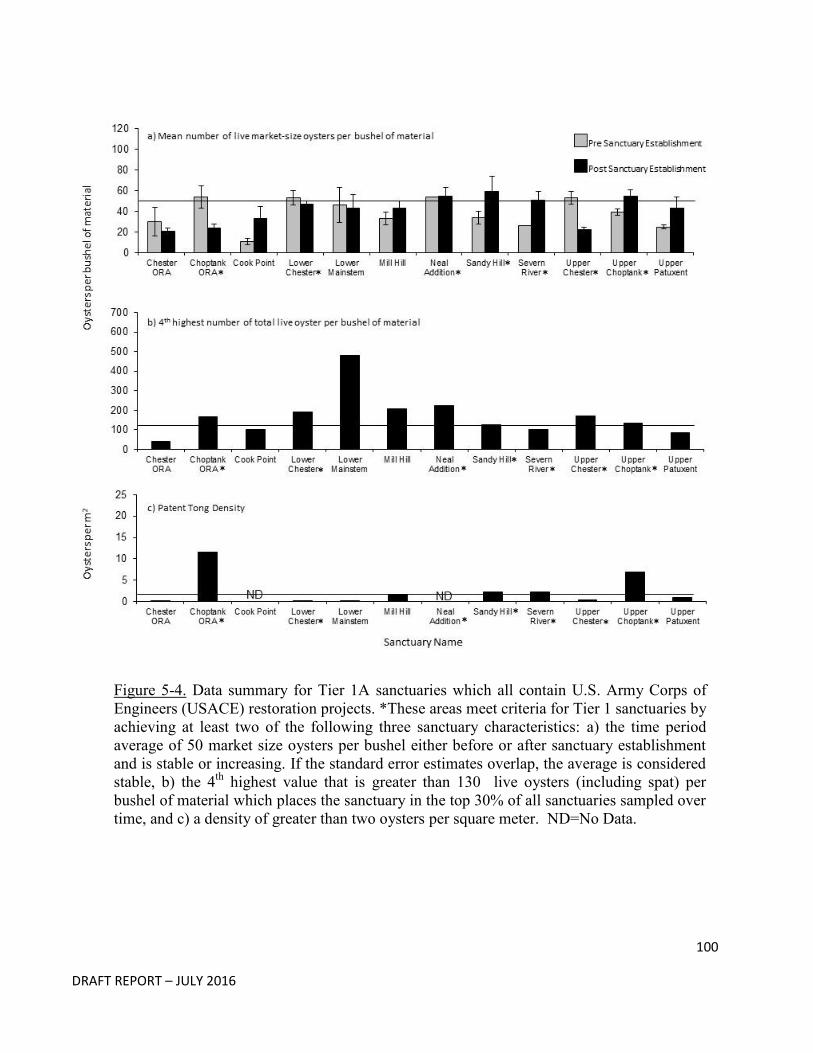
100
DRAFT REPORT – JULY 2016
Figure 5-4. Data summary for Tier 1A sanctuaries which all contain U.S. Army Corps of Engineers (USACE) restoration projects. *These areas meet criteria for Tier 1 sanctuaries by achieving at least two of the following three sanctuary characteristics: a) the time period average of 50 market size oysters per bushel either before or after sanctuary establishment and is stable or increasing. If the standard error estimates overlap, the average is considered stable, b) the 4th highest value that is greater than 130 live oysters (including spat) per bushel of material which places the sanctuary in the top 30% of all sanctuaries sampled over time, and c) a density of greater than two oysters per square meter. ND=No Data.
101
DRAFT REPORT – JULY 2016
Management Alternatives for Tier 2 Sanctuaries
There are nine Tier 2 Sanctuaries covering 197,768 acres: Breton Bay, Calvert Shore, Cox Creek, Eastern Bay, Lower Patuxent River, Miles River, Prospect Bay, Ringgold, and South River. The DNR program Marylanders Grows Oysters is active in three of the Tier 2 sanctuaries and has been planting oysters over the past few years. These sanctuaries include Miles River, Cox Creek, and South River. Recognizing the importance of maintaining 20 – 30% of oyster bottom in sanctuary, future alternative 3 provides opportunity to adjust sanctuary boundaries in those areas that the data indicate have performed poorly with no investment in the maintenance and/or restoration of oyster populations. Some areas could potentially be adjusted so that they can provide economic and cultural benefits to fishing communities and result in an increased population of oysters if these areas are managed in a way that balances harvest with continuous investment to maintain oyster populations in the area.
Tier 2 Sanctuary possible management alternatives
(some may require statutory or regulatory change)
Future alternatives for each Tier 2 sanctuary could include:
1) Maintain current strategy - remain in sanctuary without additional investment such as habitat construction and/or planting seed oysters.
2) Remain in sanctuary with additional investment 3) Declassify some portion of the area as a sanctuary and begin process to develop an area-
specific management plan. Investment would be a condition to allow harvest, and funds could be generated by sources such as license surcharge funds, oyster bushel taxes, leasing, and private-public partnerships.
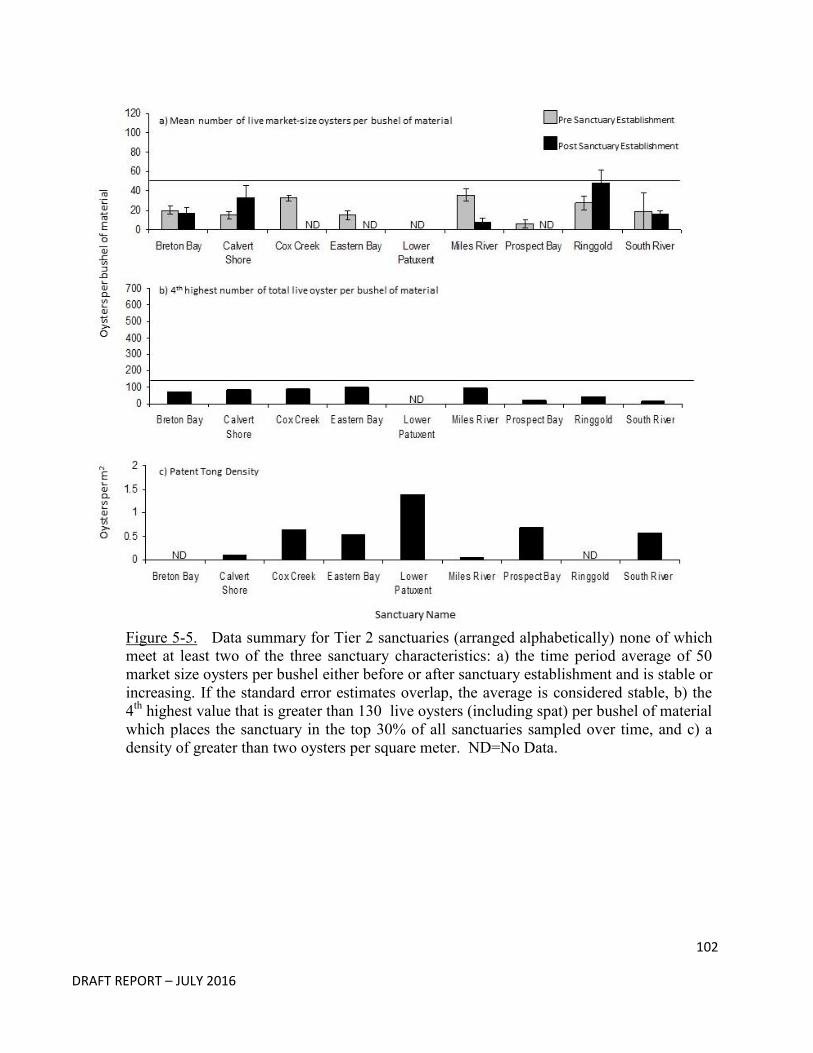
102
DRAFT REPORT – JULY 2016
Figure 5-5. Data summary for Tier 2 sanctuaries (arranged alphabetically) none of which meet at least two of the three sanctuary characteristics: a) the time period average of 50 market size oysters per bushel either before or after sanctuary establishment and is stable or increasing. If the standard error estimates overlap, the average is considered stable, b) the 4th highest value that is greater than 130 live oysters (including spat) per bushel of material which places the sanctuary in the top 30% of all sanctuaries sampled over time, and c) a density of greater than two oysters per square meter. ND=No Data.
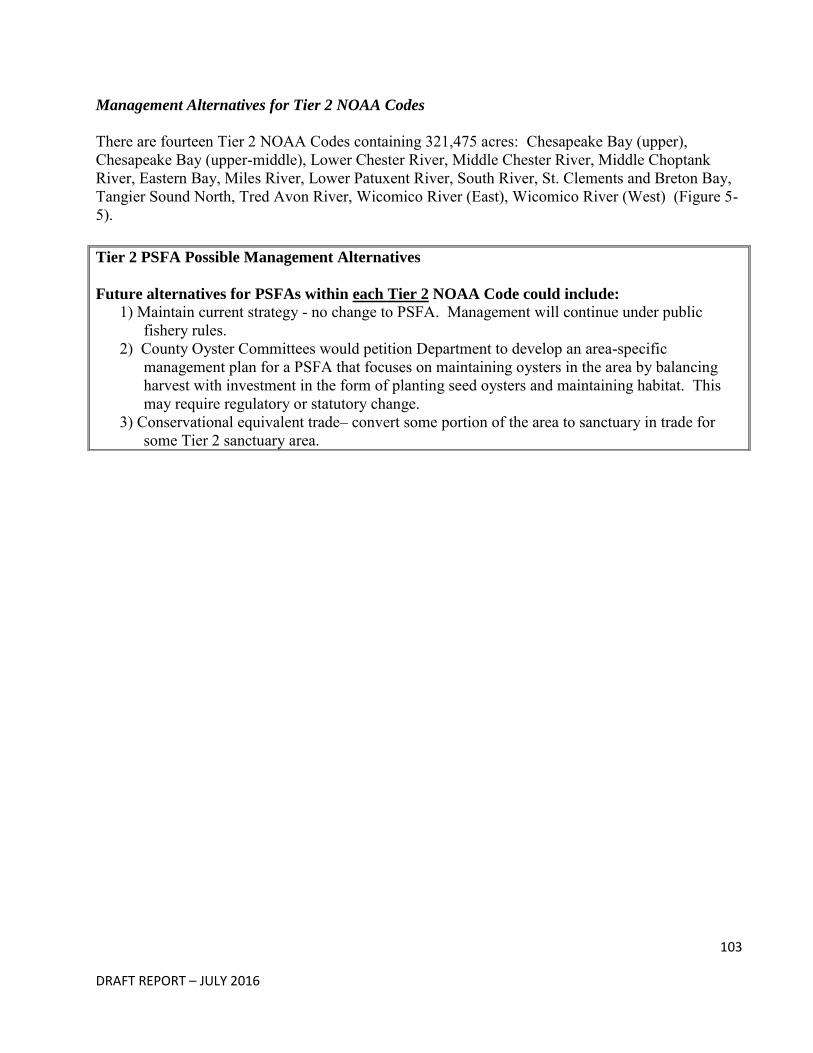
103
DRAFT REPORT – JULY 2016
Management Alternatives for Tier 2 NOAA Codes
There are fourteen Tier 2 NOAA Codes containing 321,475 acres: Chesapeake Bay (upper), Chesapeake Bay (upper-middle), Lower Chester River, Middle Chester River, Middle Choptank River, Eastern Bay, Miles River, Lower Patuxent River, South River, St. Clements and Breton Bay, Tangier Sound North, Tred Avon River, Wicomico River (East), Wicomico River (West) (Figure 5-5).
Tier 2 PSFA Possible Management Alternatives
Future alternatives for PSFAs within each Tier 2 NOAA Code could include:
1) Maintain current strategy - no change to PSFA. Management will continue under public fishery rules.
2) County Oyster Committees would petition Department to develop an area-specific management plan for a PSFA that focuses on maintaining oysters in the area by balancing harvest with investment in the form of planting seed oysters and maintaining habitat. This may require regulatory or statutory change.
3) Conservational equivalent trade– convert some portion of the area to sanctuary in trade for some Tier 2 sanctuary area.
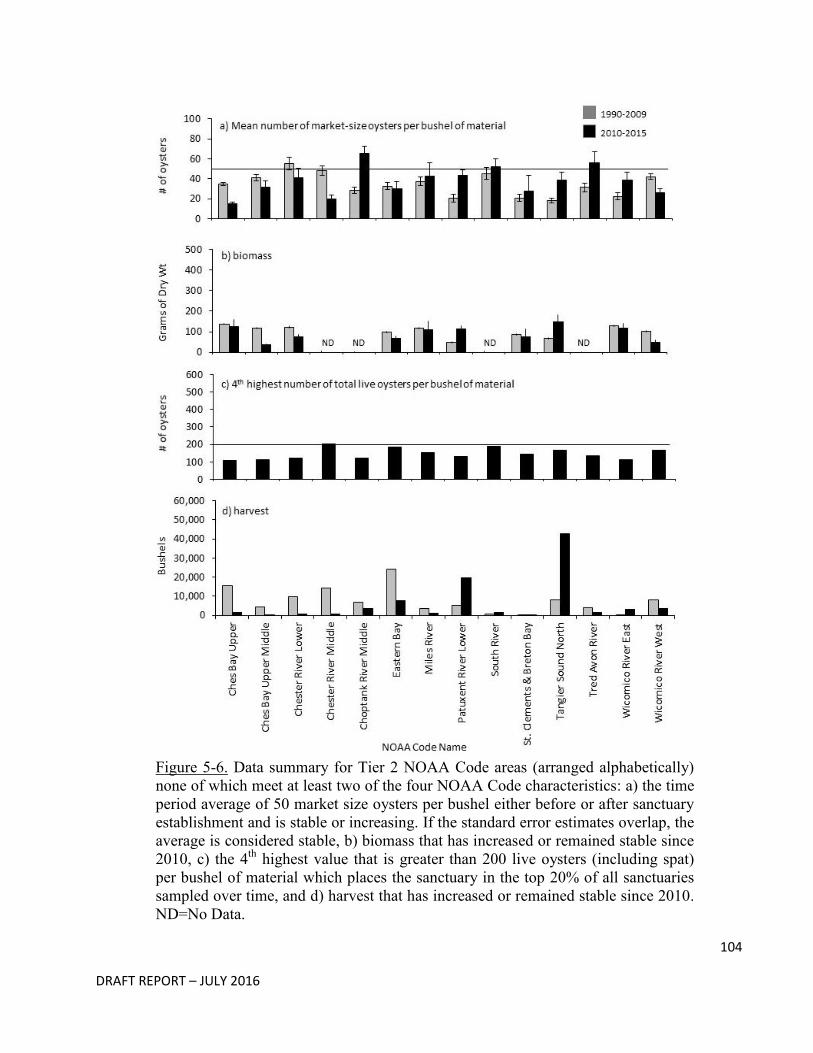
104
DRAFT REPORT – JULY 2016
Figure 5-6. Data summary for Tier 2 NOAA Code areas (arranged alphabetically) none of which meet at least two of the four NOAA Code characteristics: a) the time period average of 50 market size oysters per bushel either before or after sanctuary establishment and is stable or increasing. If the standard error estimates overlap, the average is considered stable, b) biomass that has increased or remained stable since 2010, c) the 4th highest value that is greater than 200 live oysters (including spat) per bushel of material which places the sanctuary in the top 20% of all sanctuaries sampled over time, and d) harvest that has increased or remained stable since 2010. ND=No Data.
105
DRAFT REPORT – JULY 2016
Management Alternatives for Tier 3 Sanctuaries
These are areas which are often known to have low densities of oyster or poor habitat. Most of these areas are data poor. There are sixteen Tier 3 sanctuaries covering 36,853 acres: Big Annemessex, Cedar Point, Fort Carroll, Herring Bay, Man O’ War Gales Lump, La Trappe Creek, Oxford Lab, Piney Point, Plum Point, Poplar Island, Roaring Point, Solomons Creeks, Tilghman Island, Webster, and Wicomico West. Each of these areas is unique and they should be carefully examined on an individual basis when considering future management alternatives. A summary of relevant characteristics for some of the sanctuaries is provided below.
Fort Carroll – This 30 acre sanctuary created in 1995 is in a restricted Maryland Department of the Environment shellfish harvest area due to the potential presence of fecal coliforms and other bacteria in the shellfish. It is also a sanctuary that is not located on any historic oyster bottom (as charted in the Yates Oyster Survey from 1906 to 1912 plus its amendments) in the Patapsco River. Currently the Living Classrooms organization uses this sanctuary to for various educational programs.
La Trappe – A portion of this 377 acre sanctuary created in 2010 is in a restricted Maryland Department of the Environment shellfish harvest area due to the potential presence of fecal coliforms and other bacteria in the shellfish. The rest of the sanctuary is classified as conditionally closed by Maryland Department of the Environment, meaning that shellfish cannot be harvested for three days following a rainfall event of one inch or greater over 24 hours. DNR conducted surveys in 2010 and 2015 and did not any shell of live oysters. Oxford Lab – This 36 acre sanctuary was created in 1961 to support the University of Maryland’s research needs. It has been a Marylanders Grow Oyster planting site since 2011. Only 7% of the sanctuary is historic oyster bottom (as charted in the Yates Oyster Survey from 1906 to 1912 plus its amendments).
Piney Point – This 13 acre sanctuary was created in 1986 to support DNR’s Piney Point Laboratory’s research needs. The entire area is classified as conditionally closed by the Maryland Department of Environment, meaning that shellfish cannot be harvested for three days following a rainfall event of one inch or greater over 24 hours. There is no historic oyster bottom in this sanctuary (as charted in the Yates Oyster Survey from 1906 to 1912 plus its amendments).
Poplar Island – This 7 acre sanctuary was created in 2003 by the USACE to support rebuilding Poplar Island.
Plum Point – This 6,209 acre sanctuary was created in 1999 when legislation opened up new areas for power dredging of oysters for harvest. This sanctuary contains the Plum Point Reef which is 2,575 acres and is the largest artificial fish reef in the bay. The artificial reef consists of miscellaneous material including concrete blocks and a sunken fiberglass sailboat.
106
DRAFT REPORT – JULY 2016
Roaring Point – This 10 acre sanctuary was created in 2004 from an old oyster aquaculture lease. Chesapeake Bay Foundation has used this sanctuary to conduct oyster restoration research. There is no historic oyster bottom in this sanctuary (as charted in the Yates Oyster Survey from 1906 to 1912 plus its amendments).
Solomon's Creeks – This 617 acre sanctuary created in 2010 is in a restricted Maryland Department of Environment shellfish harvest area due to the potential presence of fecal coliforms and other bacteria in the shellfish. There are multiple Marylanders Grow Oysters planting sites within this sanctuary. Only 0.8% of the sanctuary is historic oyster bottom (as charted in the Yates Oyster Survey from 1906 to 1912 plus its amendments).
Webster – This 554 acre sanctuary was created in 1997. The sanctuary was an old aquaculture lease that is located adjacent to the Monie Bay National Estuarine Research Reserve and the Deal Island facility Wildlife Management Area. There is no historic oyster bottom located in this sanctuary (as charted in the Yates Oyster Survey from 1906 to 1912 plus its amendments).
The remaining Tier 3 sanctuaries (Big Annemessex, Cedar Point, Herring Bay, Man O’ War – Gales Lump, Tilghman Island, and Wicomico West) are known to have poor habitat and extremely low densities or zero presence of oysters. The Baltimore County Oyster Committee has been planting hatchery reared spat-on-shell on an area of the Man O’ War oyster bar that is not located within the sanctuary. Also, the DNR program Marylanders Grows Oysters has restoration plantings areas in several of these sanctuaries including Fort Carroll, La Trappe, Roaring Point, and Wicomico West. Recognizing the importance of maintaining 20 – 30% of oyster bottom in sanctuary, future alternative 3 provides opportunity to adjust sanctuary boundaries in those areas that the data indicate have performed poorly with no investment in the maintenance and/or restoration of oyster populations. Some areas could potentially be adjusted so that they can provide economic and cultural benefits to fishing communities and result in an increased population of oysters if these areas are managed in a way that balances harvest with continuous investment to maintain oyster populations in the area. Future alternative 4 is least likely to provide economic and cultural benefits to fishing communities because it does not require investment for harvest, but by allowing leasing in the area it could result in a larger number of oysters in the area.
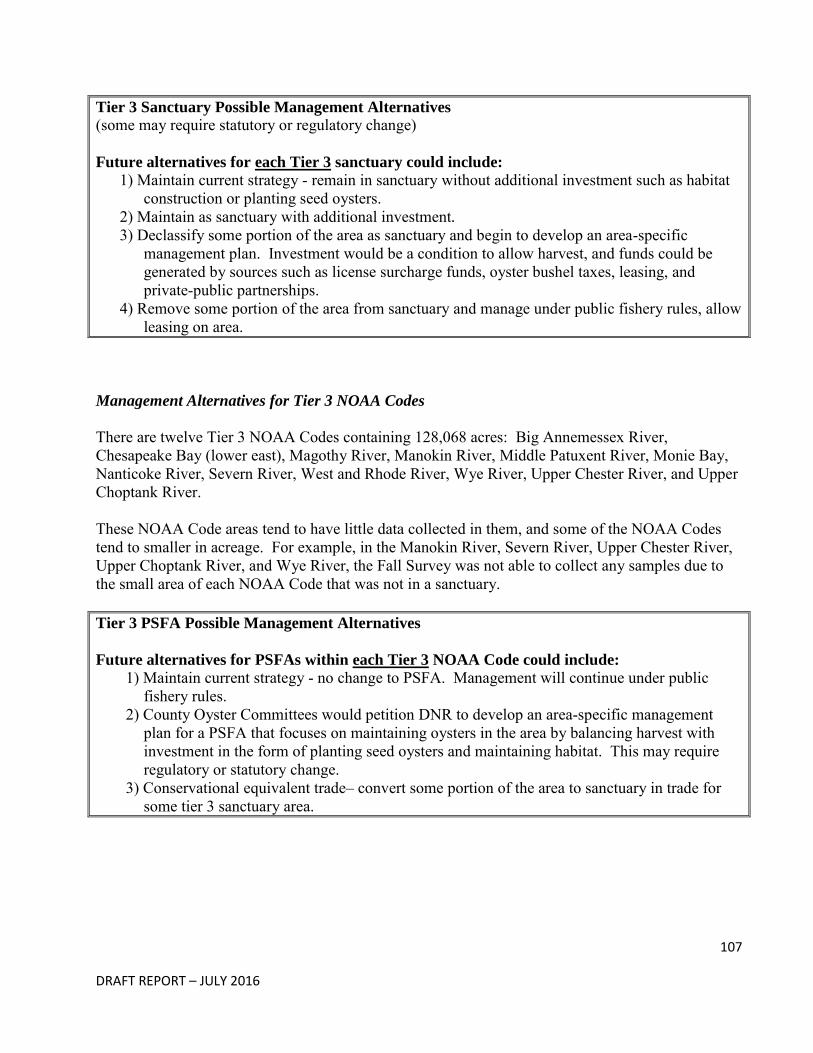
107
DRAFT REPORT – JULY 2016
Tier 3 Sanctuary Possible Management Alternatives
(some may require statutory or regulatory change)
Future alternatives for each Tier 3 sanctuary could include:
1) Maintain current strategy - remain in sanctuary without additional investment such as habitat construction or planting seed oysters.
2) Maintain as sanctuary with additional investment. 3) Declassify some portion of the area as sanctuary and begin to develop an area-specific
management plan. Investment would be a condition to allow harvest, and funds could be generated by sources such as license surcharge funds, oyster bushel taxes, leasing, and private-public partnerships.
4) Remove some portion of the area from sanctuary and manage under public fishery rules, allow leasing on area.
Management Alternatives for Tier 3 NOAA Codes
There are twelve Tier 3 NOAA Codes containing 128,068 acres: Big Annemessex River, Chesapeake Bay (lower east), Magothy River, Manokin River, Middle Patuxent River, Monie Bay, Nanticoke River, Severn River, West and Rhode River, Wye River, Upper Chester River, and Upper Choptank River. These NOAA Code areas tend to have little data collected in them, and some of the NOAA Codes tend to smaller in acreage. For example, in the Manokin River, Severn River, Upper Chester River, Upper Choptank River, and Wye River, the Fall Survey was not able to collect any samples due to the small area of each NOAA Code that was not in a sanctuary. Tier 3 PSFA Possible Management Alternatives
Future alternatives for PSFAs within each Tier 3 NOAA Code could include:
1) Maintain current strategy - no change to PSFA. Management will continue under public fishery rules.
2) County Oyster Committees would petition DNR to develop an area-specific management plan for a PSFA that focuses on maintaining oysters in the area by balancing harvest with investment in the form of planting seed oysters and maintaining habitat. This may require regulatory or statutory change.
3) Conservational equivalent trade– convert some portion of the area to sanctuary in trade for some tier 3 sanctuary area.
108
DRAFT REPORT – JULY 2016
Section 5.3: Research Recommendations Several research items are recommended in order to assess the future effectiveness of the management areas. These include:
Conduct an updated bottom survey of the entire bay (Maryland’s proportion) with current technology to determine the extent of oyster bottom and update the boundaries of oyster bars as reported in Maryland statue for management of oysters and other natural resources.
Conduct updated ‘best bar’ analysis to determine if there has been a spatial shift in oyster productivity of the ‘best bars’.
Expand research and current monitoring programs to provide robust answers to emerging disease questions. This may include determination of a genetic marker from disease resistance and monitoring for this marker.
Design and implement a comprehensive, statistically rigorous monitoring program that, if possible, includes control areas and encompasses a greater number of oyster bars within sanctuary areas not receiving large scale restoration efforts to assess oyster populations.
Continue studies by the state, federal and academic partners that investigate factors leading to increased oyster productivity in particular areas.
Continue ongoing studies on ecological services including fish and crab production, nutrient cycling and water quality parameters in targeted restoration areas.
Design and implement a comprehensive, statistically rigorous monitoring program that assesses ecological services including fish and crab production, nutrient cycling and water quality parameters in control areas (non-sanctuary oyster bottom) and sanctuaries not receiving large scale restoration efforts.
Continue monitoring oyster indices through the DNR’s Fall Survey.
Continue recording bar specific oyster harvest so productive areas can be determined.
Design and implement monitoring program to determine if sanctuaries are acting as a reservoir for reproduction capacity.
109
DRAFT REPORT – JULY 2016
Chapter 6: Glossary Aquaculture - the farming of aquatic organisms for human consumption. Biomass - the dry weight of living matter, including stored food, comprising the population of a particular species and expressed in terms of a given area or volume of the habitat. Bottom Ground-Truthing – a method for verifying the bottom type classified by side sonar using either patent tong sampling or diving and visually verifying the bottom. Box oyster - pairs of empty shells joined together by their hinge ligaments. These remain articulated for months after the death of an oyster, providing a durable estimator of recent oyster mortality. Bushel - unit of volume used to measure oyster catches. The official Maryland bushel is equal to 2,800.9 cu. in., or 1.0194 times the U.S. standard bushel (heaped) and 1.3025 times the U.S. standard bushel (level). Conditional Shellfish Harvest Area – an area designated by Maryland Department of the Environment that may be conditionally closed to shellfish harvest based on rainfall and impacts of bacteria and fecal coliform in shellfish that may be potentially harmful for human consumption. The area will be closed to shellfish harvest for three days after a rainfall event of one inch or greater over 24 hours. Cultch - material that larval oysters use as substrate for settlement. The best cultch for oysters is natural oyster shell. Dermo Disease - the oyster disease caused by the protozoan pathogen, Perkinsus marinus.
Dredge - a method of collecting oysters by lowering a chain/mesh type bag on to the oyster bar. It is then dragged over the bar by the boat, collecting oysters into the bag, and raised up onto the boat using hydraulics.
Dredged Shell - oyster shell dredged from buried ancient (3000+ years old) shell deposits. Ecology - the scientific study of the distribution and abundance of life and the interactions between organisms and their environment. Ecosystem - a functional system that includes the organisms of a natural community, together with their environment. Fresh Shell - oyster shells from shucked oysters and usually stored on land and less than a few years old.
110
DRAFT REPORT – JULY 2016
Freshet - a rush of fresh water flowing into Chesapeake Bay causing salinity to decrease suddenly. Hatchery - a facility that spawns and fertilizes oysters to produce oyster larvae and spat. Hatchery Spat-on-Shell – spat settled on shell within a hatchery laboratory using larvae spawned by a hatchery operation. Haplosporidium nelsoni - The protozoan oyster parasite that causes MSX disease. Harvest Reserve – area that is closed to commercial oyster harvest until biological criteria are met and the area is opened (for a short while) to harvest. Historic Oyster Bottom – an oyster bar as charted by the Yates Oyster Survey as charted in the Yates Oyster Survey of 1906 to 1912 and its amendments. Intensity (of disease) - a measure of the concentration of disease-causing parasites within an oyster; high disease intensity generally results in mortality. Key Bar – a subset of fixed sampling locations in the Annual Fall Oyster Dredge Survey that collects information on oyster counts by size class, disease, and shell height. Larvae - a free-swimming and sometimes feeding stage in the early development of certain animals. Oysters have several larval stages including: trochophore, veliger, and pediveliger. Oyster larvae (plural form of larva) are planktonic. Market (sized oyster) – oysters that are 76 millimeters (3 inches) or greater and can be harvested. Mesohaline - moderately brackish, estuarine water with salinity ranging from 5 to 18 ppt. Oyster Reef Habitat – in reference to bay bottom type mapping surveys, bottom types suitable for larvae settlement. Patent Tong – a mechanical method of collecting oysters by using two hinged rake heads tethered by a hydraulic cable, which opens and closes the tongs. Prevalence (of disease) - a measure of the frequency of occurrence of infection (i.e., the percent of examined oysters that contain at least one disease causing parasite). Recruitment - additions to a population, either through birth or immigration. When oyster larvae settle and attach in the vicinity of other oysters, they are 'recruits' into that population. Reef Ball – a round ball-like, hollow and vented form made of concrete that is set with wild, natural or hatchery seed and placed on the bottom of the bay with the purpose of oyster restoration and ecological benefits.
111
DRAFT REPORT – JULY 2016
Replenishment (of habitat) - any of a range of approaches for attempting to increase the amount of suitable habitat for oyster settlement to benefit the public oyster fishery; “standard” habitat method involves placing relatively thin layers of clean shell on existing hard bottom. Replenishment (of population) - any of a range of approaches for attempting to increase the amount of oyster for harvest by the public oyster fishery; “standard” method involves placing hatchery oyster spat or transferring wild, natural oyster spat. Restricted Shellfish Harvest Area - an area designated by Maryland Department of the Environment that is permanently closed to shellfish harvest based on rainfall and impacts of bacteria and fecal coliform bacteria in shellfish that may be potentially harmful for human consumption. Restoration (of population) - any of a range of approaches for attempting to increase the population of oysters in Chesapeake Bay to a level at which it provides desired ecosystem services (e.g., habitat rehabilitation, planting seed oysters). Small (sized oyster) – oysters normally ranging between 40 to 75 millimeters and are older than one year. Secchi Disk - a device for measuring water clarity. A Secchi disk (named after its inventor) is a white circle (usually eight inches in diameter) with a black pattern and attached to a rope. The Secchi disk is lowered into water until the pattern is no longer visible. The depth at which this occurs is called the Secchi depth and is a measure of water clarity. Water clarity decreases as turbidity increases. Setting; Settlement - the metamorphosis from the planktonic (free-swimming) larval form to the benthic adult form. When oysters set or settle, they permanently attach to a hard substrate. Shell Height – the length of an oyster shell. Spat (seed) – early juvenile oysters that have settled by attaching to a hard substrate. These oysters are less than one year old and usually smaller than 40 millimeters. Spawning - producing and releasing gametes (eggs or sperm). Oysters normally spawn from May to September. Males often spawn first and the presence of sperm in the water is a stimulant to the females. Gametes are released into the water where fertilization occurs. Spatfall - the settling and attachment of larvae to substrate. Substrate - substance, base, nutrient, or medium in which an organism lives and grows, or surface to which a fixed organism is attached. Oysters attach to hard substrates, preferably oyster shell.
112
DRAFT REPORT – JULY 2016
Turbidity – a measure of suspended matter or particles in water that block light penetration; cloudy or muddy in physical appearance. Turbidity reduces water clarity. Water Quality Sondes – a device used to collect water quality information (i.e. salinity, water temperature, etc.) underwater and sometime continuous. Wild Seed – natural, wild oysters from natural recruitment collected from an area and the bay and transported to another area of the bay on an oyster bar. These oysters tend to be spat and small-sized oysters. Yates Bar Survey – a survey conducted from 1906 to 1912 to designate the boundaries of all oyster bars within Maryland’s portion of Chesapeake Bay.